Epidemiology: the Good, the Bad and the Truly...
39
Epidemiology: the Good, the Bad and the Truly Ugly David M. Gute, Ph.D., M.P.H. WSSS Seminar October 12, 2007
Transcript of Epidemiology: the Good, the Bad and the Truly...

Epidemiology: the Good, the Bad and the Truly UglyDavid M. Gute, Ph.D., M.P.H.
WSSS SeminarOctober 12, 2007
Today’s Agenda• “The Good, the Bad and the Truly Ugly” . Apologies to
Clint.• Selected examples from my career.• Defining environmental epidemiology within a context of
all epidemiology.• Review of appropriate methods for conducting
environmental epidemiology studies.• Importance of surveillance ( as a cross-cutting theme)
and monitoring.• Review of methods for ascertaining complex exposures
and the controversies which can emerge (diet and water as examples)
• Questions and Discussion

Sorry Clint

Host
Agent Environment
Vector
Epidemiological/Public Health Triad

My Wonderful Adventure: Selected Epi Applications (1)
• MPH thesis (1975-1976)examined the distribution of chronic obstructive lung disease in Maine. Finding: elevated rates in rural areas contrary to the usual elevations in urban areas.
• 1st public health position (1979-1983) in Rhode Island. Finding: resources skewed heavily towards curative medicine, geographic and specialty mal-distribution also present. $ for health care are sufficient-remedy = cap and re-allocate. Action: political defeat, grudgingly learned the wisdom of “incremental change”.

My Wonderful Adventure: Selected Epi Applications (2)
• Ph.D. Thesis (1978-1981)-With NIOSH funding evaluated the distribution of occupational mortality of RI decedents. Finding: Some elevations were anticipated (respiratory mortality and textile workers) while others were new and unanticipated (stomach cancer and female jewelry workers). Action: NIOSH, heartened by the surveillance potential of vital records, presses ahead with a national program.
My Wonderful Adventure: Selected Epi Applications (3)
• Assistant Commissioner in Massachusetts: (1983-1988) administered investigations which spanned the study of PCBs in New Bedford harbor and the cluster of childhood leukemia in Woburn.
• Life on the Hill (1988-present) Together with Richard Enander, Ph.D. characterize the autobody refinishing industry in RI. Finding: identify lead as a principal component in top selling body filler compounds. Action: lead removed from product line.

The Nature of EnvironmentalExposure
• Population less well defined:Why?
• Variable susceptibilities of population
• Database integrity and accuracy?
• Develop additional items through discussion
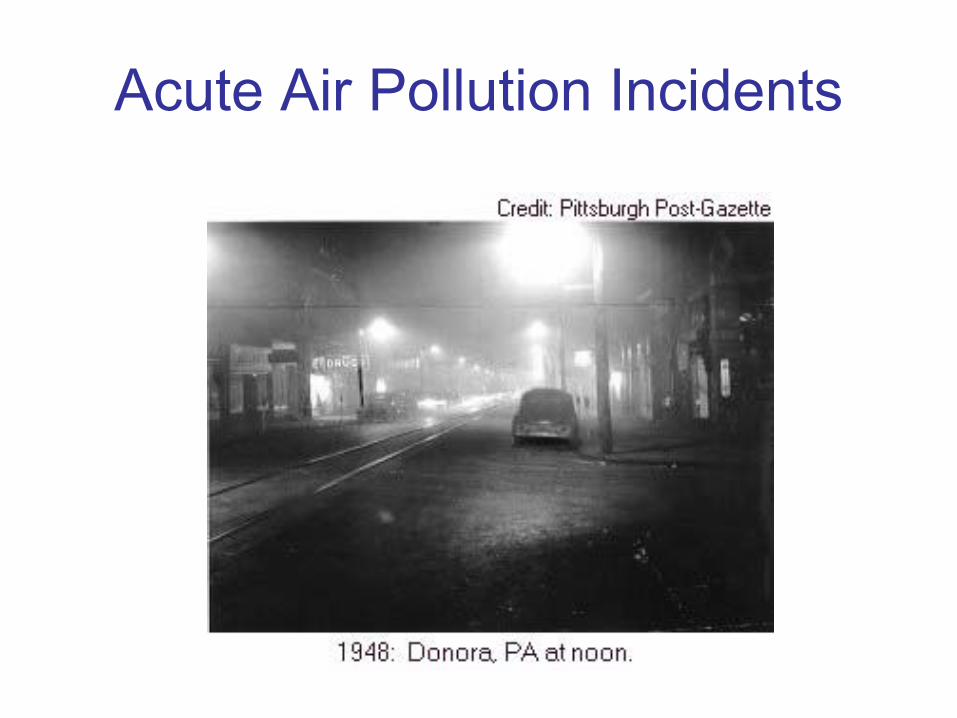
Acute Air Pollution Incidents

Smog: Not Just a Left Coast Problem
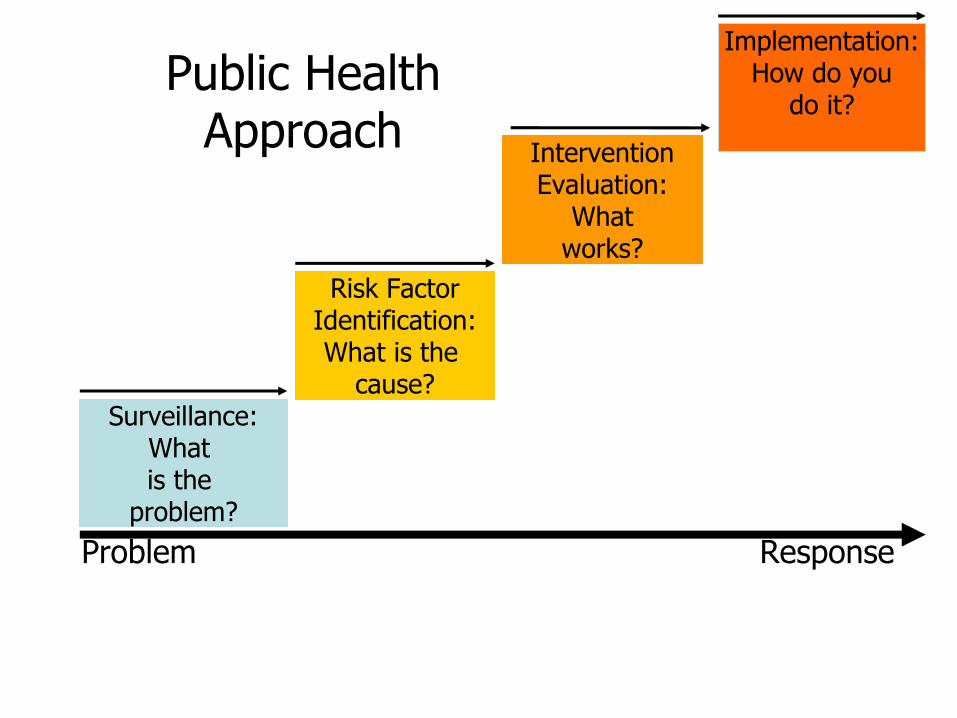
Public Health Approach
Problem Response
Surveillance:What is the
problem?
Risk FactorIdentification:What is the
cause?
InterventionEvaluation:
Whatworks?
Implementation:How do you
do it?
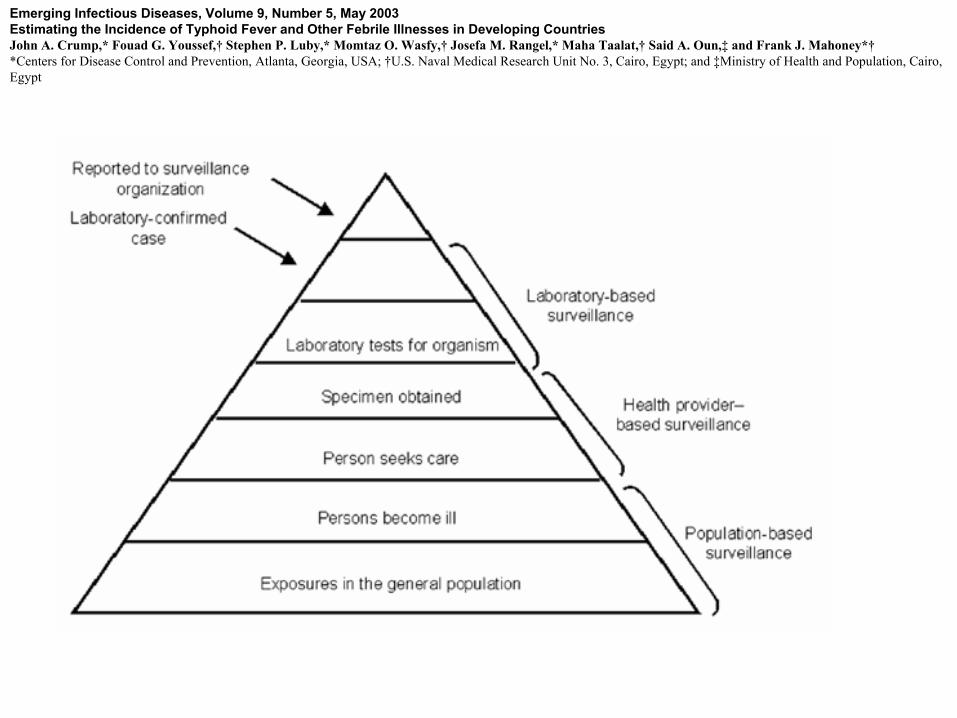
Emerging Infectious Diseases, Volume 9, Number 5, May 2003Estimating the Incidence of Typhoid Fever and Other Febrile Illnesses in Developing CountriesJohn A. Crump,* Fouad G. Youssef,† Stephen P. Luby,* Momtaz O. Wasfy,† Josefa M. Rangel,* Maha Taalat,† Said A. Oun,‡ and Frank J. Mahoney*†*Centers for Disease Control and Prevention, Atlanta, Georgia, USA; †U.S. Naval Medical Research Unit No. 3, Cairo, Egypt; and ‡Ministry of Health and Population, Cairo, Egypt

Methodological Features of Environmental Epidemiology
• Ecologic studies“Homogeneity of exposure within groups is in
general desirable in ecologic studies, as is heterogeneity of exposure between groups, because these conditions make it easier to detect effects of exposure”.
• Clusters“The first problem is determining whether the
cluster really represents a high occurrence of disease”.
Methodological Features of Environmental Epidemiology (2)A second ….”problem that arises is defining the
boundaries of the area or time frame for the cluster to be used in calculating rates”.
Rothman’s negative critique of cluster investigation- what are these attributes?
“Useful scientific data on environmental risks, on the other hand, is more likely to be found by determining good studies to investigate specific etiologic hypotheses, in populations in which no clusters has been noted.”

Methodological Features of Environmental Epidemiology (3)• Errors in measuring exposure:“In many epidemiologic studies, it is very difficult or
even impossible to measure the true exposure exactly. Hence the observed exposure is measured with error (for continuous variables) or misclassified (for categorical variables).
• The general presumption of nondifferential exposure measurement error or misclassification leading to bias towards the null may not hold.
Two Common Scenarios in High Income Nations
• Relatively high concentration of pollutants, plausible if not actual routes of exposure to human populations, chronic exposure. Examples: Superfund sites such as the two sites in Woburn, MA, Department of Energy sites and military bases in the US.
• Relatively low concentration of pollutants, less likelihood of exposure pathways to human populations, chronic exposure. Examples: Brownfield sites in the US.

Risk Assessment
• Risk assessment addresses:– Does the weight of the evidence indicate that
exposure causes disease? Hazard Identification
– If so, what is the quantitative dose-response relationship?Dose-Response Assessment
– What does the relationship imply for regulation? Estimates of the prevalence of exposure taken together with risk
• Inputs include animal and human data.
Dose-Response Assessment Using Published Data
• Inputs:– Linear regression of SMRs (thus we need access to
cohorts)– Cumulative exposure estimates (emphasis on
retrospective exposure)• Output:
– Unit risk estimate (URE) ug/m3 for inhalation and is defined as an estimate of the increased cancer risk from a lifetime exposure to a concentration of one unit exposure.

Epidemic Curves (1)
020406080
100120140160
Cases per 10,000
Jan Mar May Jul Sep Nov JanMonth
Epidemic Curve (non-propagating)
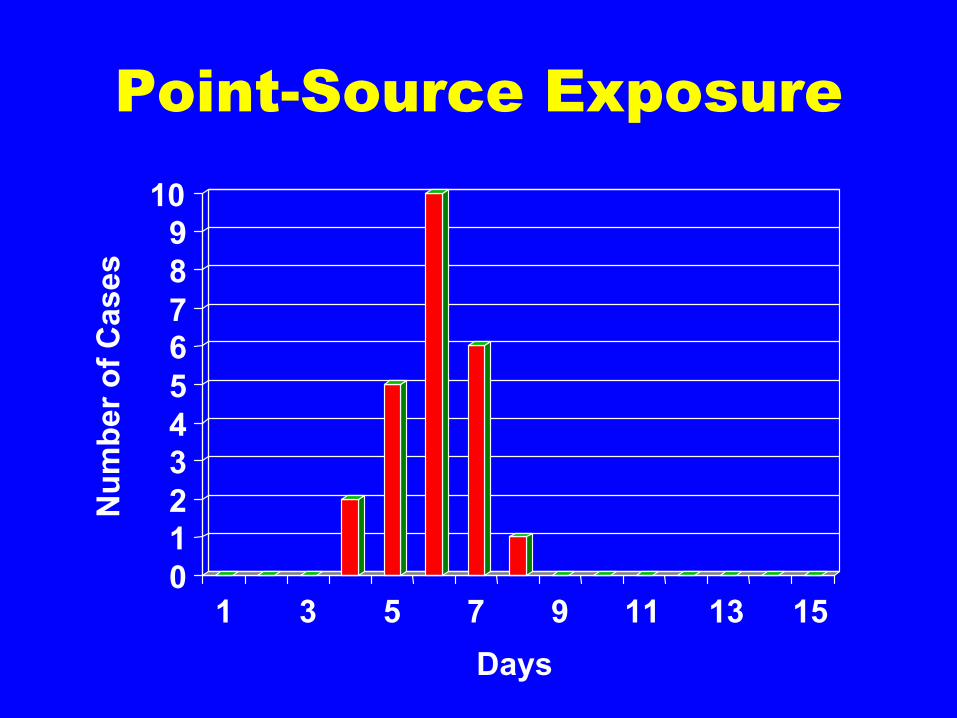
Point-Source Exposure
0123456789
10
Num
ber o
f Cas
es
1 3 5 7 9 11 13 15Days
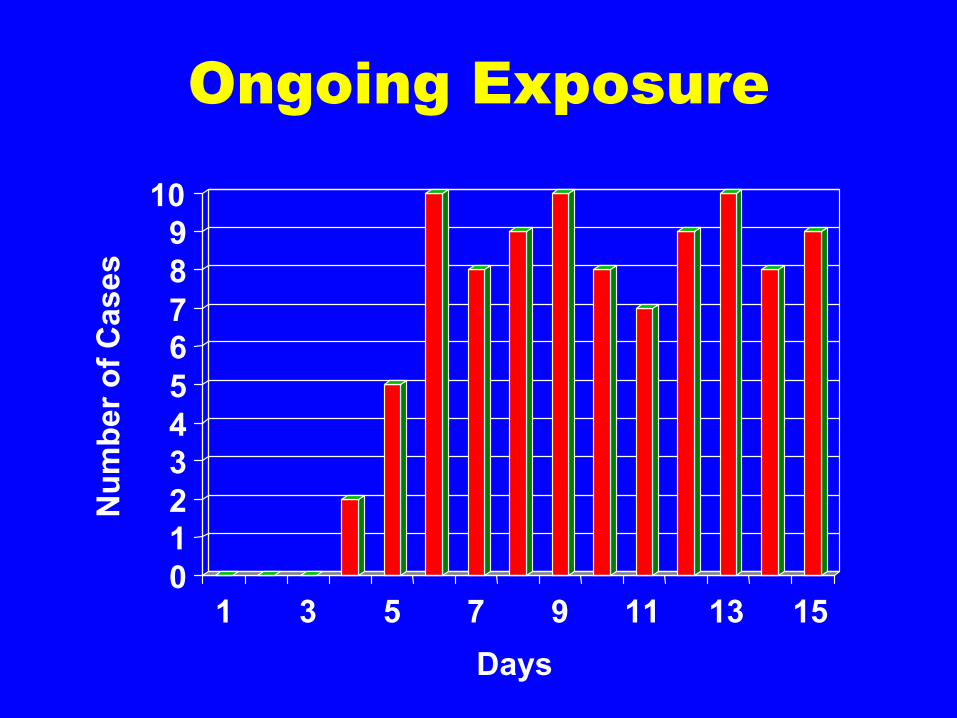
Ongoing Exposure
0123456789
10
Num
ber o
f Cas
es
1 3 5 7 9 11 13 15Days

Natural History of a Disease
• The progression of signs and symptoms of the disease under study.
• Often these stages offer opportunities for prevention and or detection.
• Knowledge of natural history also informs prognosis both in the individual and for the population.

Meta-Analysis: Another Important Component of Environmental Epidemiology
• Width of the confidence intervals are more evident.
• Application of homogeneity and heterogeneity demonstrated.

Basic Epidemiologic Study Designs
• Cluster or case reports• Ecologic• Cross-sectional• Cohort Studies (prospective and retrospective)• Case-Control Studies (Nested + Pop. Based)• Longitudinal• Random Control Trial (how would we mount
these for asbestos exposure and stay out of jail?)

Epidemiological Study Designs
Unit of Study Study Design Observational studies
Also Called Descriptive and analyticalstudies
Populations
Individuals
Ecological
Cross-sectional
Correlational
Prevalence
Individuals
Individuals
Case-Control
Cohort
Case-reference
Longitudinal, Follow-up
PatientsExperimental studies Randomised control trialsField trials, communityIntervention studies
Intervention studies
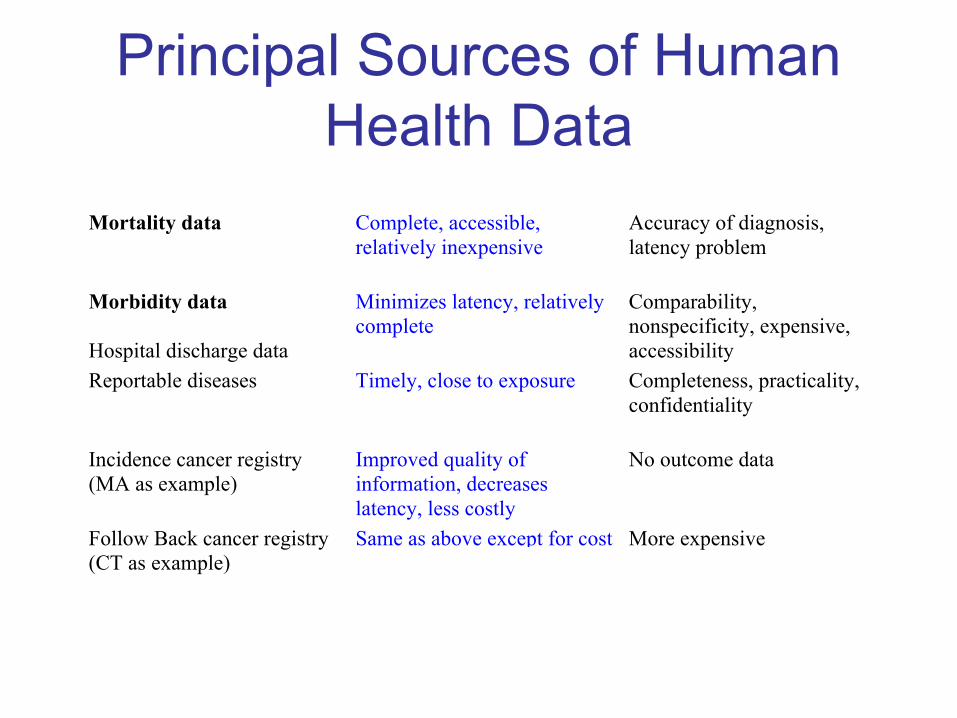
Principal Sources of Human Health Data
Mortality data Complete, accessible,relatively inexpensive
Accuracy of diagnosis,latency problem
Morbidity data
Hospital discharge data
Minimizes latency, relativelycomplete
Comparability,nonspecificity, expensive,accessibility
Reportable diseases Timely, close to exposure Completeness, practicality,confidentiality
Incidence cancer registry(MA as example)
Improved quality ofinformation, decreaseslatency, less costly
No outcome data
Follow Back cancer registry(CT as example)
Same as above except for cost More expensive
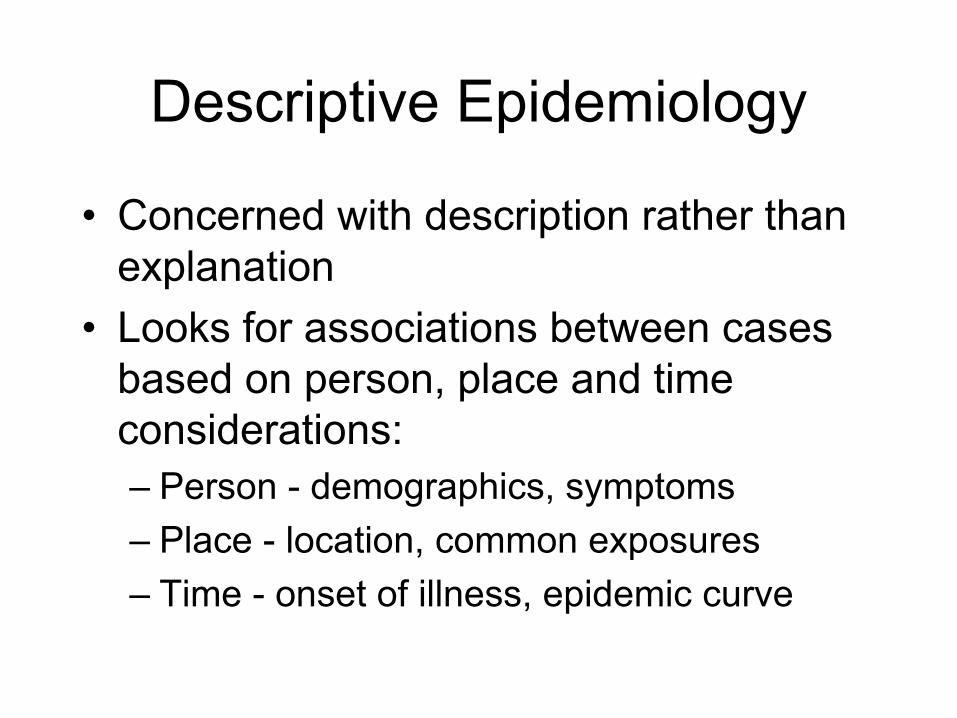
Descriptive Epidemiology
• Concerned with description rather than explanation
• Looks for associations between cases based on person, place and time considerations:– Person - demographics, symptoms– Place - location, common exposures– Time - onset of illness, epidemic curve

Distribution of age among all respondents AGE | Freq Percent Cum. ------+----------------------- 21 | 1 2.9% 2.9% 22 | 2 5.7% 8.6% 23 | 4 11.4% 20.0% 24 | 3 8.6% 28.6% 25 | 3 8.6% 37.1% 26 | 2 5.7% 42.9% 27 | 3 8.6% 51.4% 28 | 2 5.7% 57.1% 29 | 1 2.9% 60.0% 30 | 1 2.9% 62.9% 33 | 1 2.9% 65.7% 34 | 3 8.6% 74.3% 35 | 5 14.3% 88.6% 36 | 1 2.9% 91.4% 37 | 2 5.7% 97.1% 39 | 1 2.9% 100.0% ------+----------------------- Total| 35 100.0%
Person: Frequency Tables

Place: Spot Maps
Dr. John Snow, September 1854

Place: Common Exposure Location
• Examples– Case 1 – rest. A, B, C, D
– Case 2 – rest. B, E, F
– Case 3 – rest. A, B, G, H, I
– Case 4 – rest. B, D, J, K
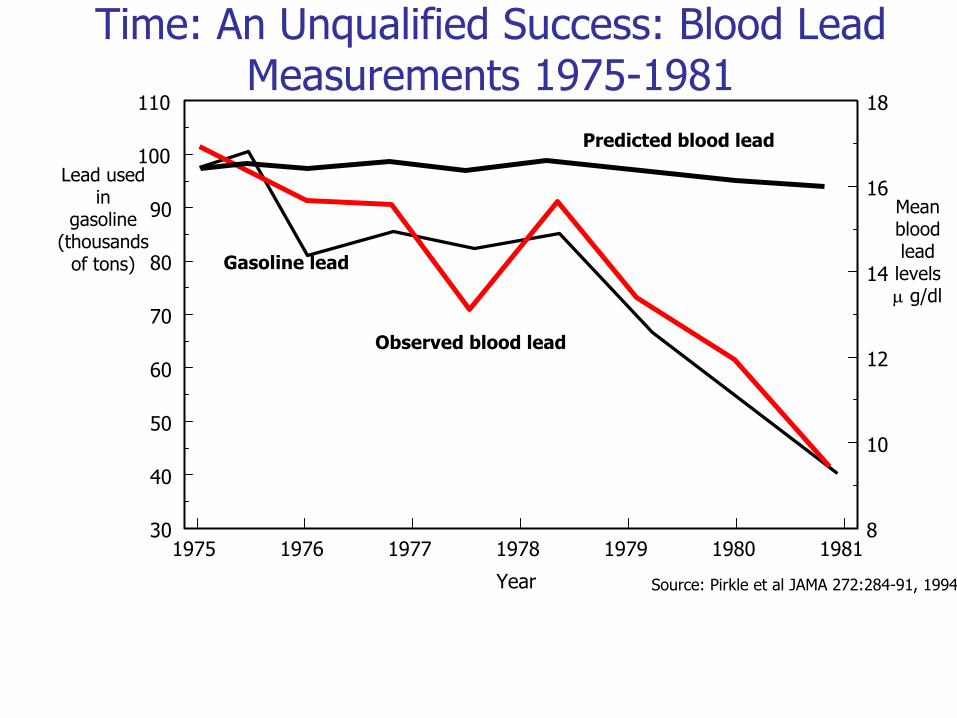
Time: An Unqualified Success: Blood Lead Measurements 1975-1981
1975 1976 1977 1978 1979 1980 198130
40
50
60
70
80
90
100
110
8
10
12
14
16
18
Year
Predicted blood lead
Gasoline lead
Observed blood lead
Source: Pirkle et al JAMA 272:284-91, 1994
Lead used in
gasoline(thousands
of tons)
Mean bloodlead
levelsµ g/dl
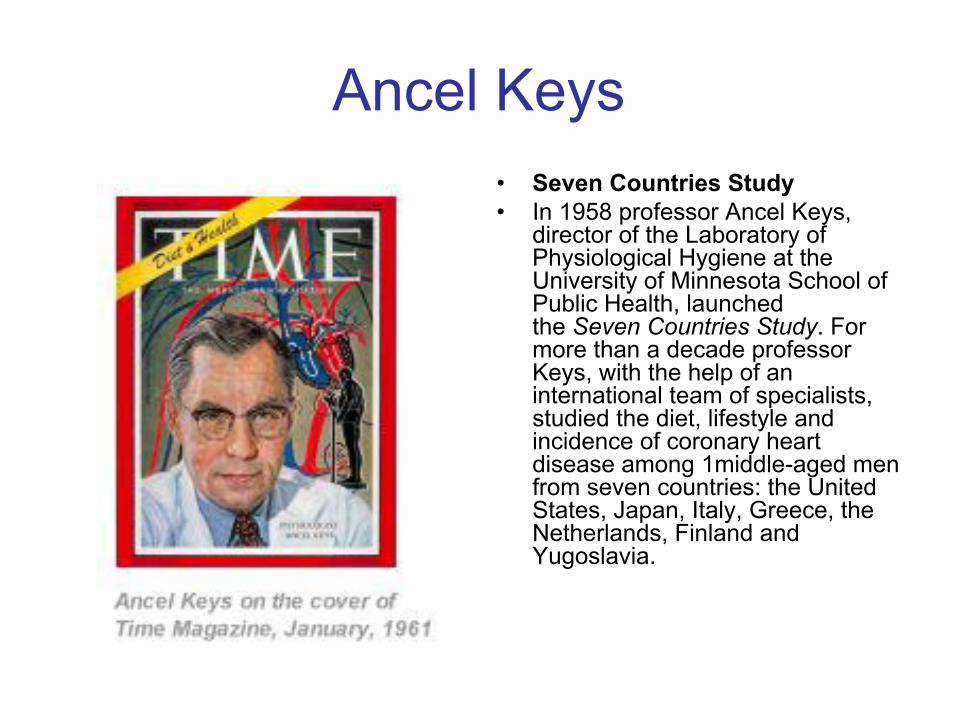
Ancel Keys• Seven Countries Study• In 1958 professor Ancel Keys,
director of the Laboratory of Physiological Hygiene at the University of Minnesota School of Public Health, launched the Seven Countries Study. For more than a decade professor Keys, with the help of an international team of specialists, studied the diet, lifestyle and incidence of coronary heart disease among 1middle-aged men from seven countries: the United States, Japan, Italy, Greece, the Netherlands, Finland and Yugoslavia.

Macro Results
Source:www.mediterrasian.com/ graphics/q&a/ancel.jpg

Water: Another Complex Exposure Variable- What Has Changed?
• John Snow, London, England 1854.
• Eastern Region, Ghana 2007.

Assessment of Cause (a life-long exercise!)
• Strength of Association
• Consistency with the existing literature
• Temporal Sequence• Dose-response
present?
• Biological plausibility• Specificity of the
association• A CAVEAT: this is an
art as much as a science

A User Guide for the Epidemiology Literature
• Description of the evidence• Exposure or intervention• Outcome• Study design• Study population• Main result• Non-causal explanations• Observation bias• Confounding• Chance• Positive features• Time relationship• Strength• Dose-response
• Consistency• Specificity• Generalizability• Eligible population• Source population• Other populations• Comparison with other evidence• Consistency• Specificity• Plausibility• Coherence

The Good, the Bad, and the Truly Ugly
• The Good:– The strengths of epidemiology lie in describing
relationships between selected exposures and disease outcomes through the establishment of causality. Also strong for the identification of risk factors.
• The Bad:– Complex exposures pose vexing problems.
• The Ugly:– Establishing the population-based preventative value
of selected interventions (as highlighted by Taubes).

Questions?