Epidemiology of Clostridium difficile infection in Belgium · 3.1.5 Further descriptive...
54
Epidemiology of Clostridium difficile infection in Belgium | 2015 © Scientific Institute of Public Health, WIV-ISP, Brussels 2015 1/54 3 Fiona Neely, Marie-Laurence Lambert Section : Public Health and Surveillance Contact : [email protected] Rue Juliette Wytsman 14 1050 Bruxelles | Belgique www.wiv-isp.be For the National Reference Laboratory: M. Delmée, V. Avesani, E. Ngyuvula, L. Muytjens, J. Van Broeck. Cliniques Universitaires Saint Luc 1200 Bruxelles | Belgique Epidemiology of Clostridium difficile infection in Belgium Report 2015 Hospital surveillance data 2007 - 2014 Hospital stay and CDI testing data 1999 - 2012 Death registrations 1998 - 2012
Transcript of Epidemiology of Clostridium difficile infection in Belgium · 3.1.5 Further descriptive...
Epidemiology of Clostridium difficile infection in Belgium | 2015
© Scientific Institute of Public Health, WIV-ISP, Brussels 2015 1/54
3
Fiona Neely, Marie-Laurence Lambert
Section : Public Health and Surveillance
Contact : [email protected]
Rue Juliette Wytsman 14
1050 Bruxelles | Belgique
www.wiv-isp.be
For the National Reference Laboratory:
M. Delmée, V. Avesani, E. Ngyuvula, L. Muytjens, J. Van Broeck.
Cliniques Universitaires Saint Luc
1200 Bruxelles | Belgique
Epidemiology of Clostridium difficile infection in Belgium
Report 2015
Hospital surveillance data 2007 - 2014
Hospital stay and CDI testing data 1999 - 2012
Death registrations 1998 - 2012
Epidemiology of Clostridium difficile infection in Belgium | 2015
© Scientific Institute of Public Health, WIV-ISP, Brussels 2015 2/54
Date of report: June 2015
Edited by: Boudewijn Catry
Public Health & Surveillance | Brussels | Belgium
Internal reference number: PHS-2015-028
Depot number: D/2015/2505/42
N° ISSN –online version : 2034-4562
Epidemiology of Clostridium difficile infection in Belgium | 2015
© Scientific Institute of Public Health, WIV-ISP, Brussels 2015 3/54
Executive Summary
Clostridium difficile infection (CDI) is a major cause of diarrhoea and pseudomembranous colitis in both acute and chronic healthcare institutions. An increase in incidence has been reported in many countries across the world over the last decade. This increase has been attributed to a number of factors: the rising use of certain antibiotics, an increase in the population at risk (older people) and the emergence of hypervirulent strains of CDI.
This report summarizes the different sources of available data concerning the epidemiology of CDI in Belgium: national hospital surveillance (mandatory until 2014), including reference laboratory data (2008-2014), hospital stay (RHM/MZG 1999-2012) and billing data for CDI testing (INAMI/RIZIG) (2000-2012) and death registration data (1998-2011).
Surveillance data
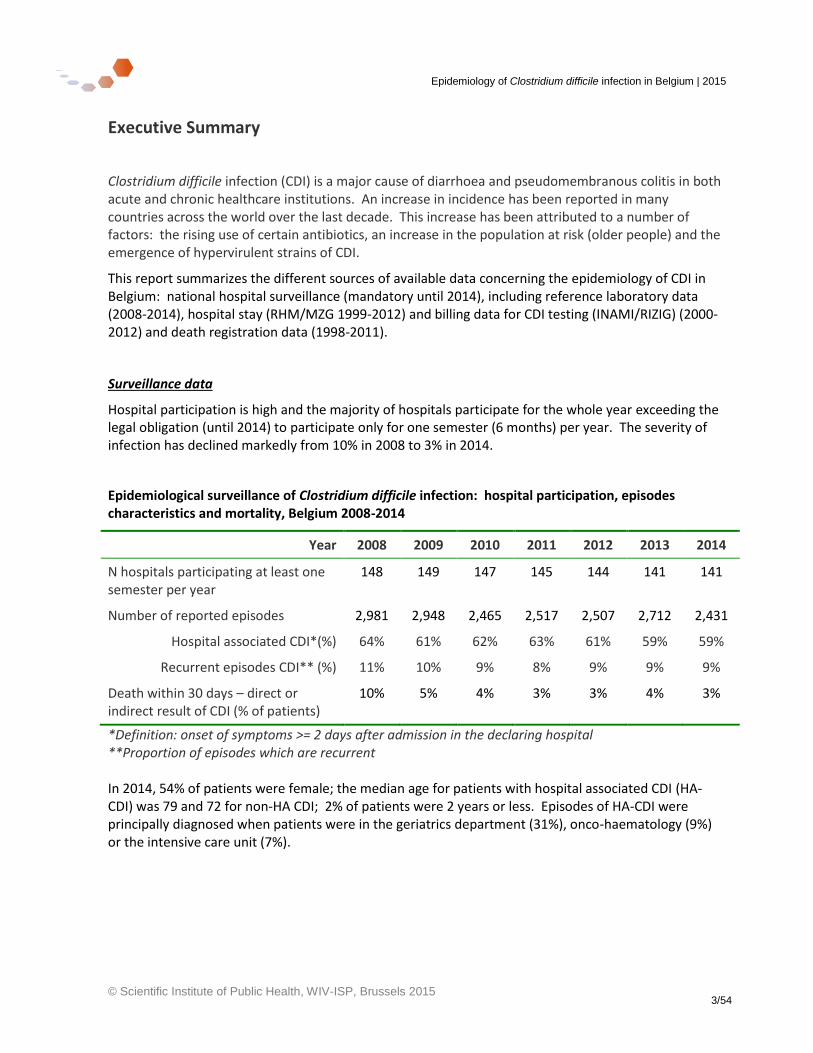
Hospital participation is high and the majority of hospitals participate for the whole year exceeding the legal obligation (until 2014) to participate only for one semester (6 months) per year. The severity of infection has declined markedly from 10% in 2008 to 3% in 2014.
Epidemiological surveillance of Clostridium difficile infection: hospital participation, episodes characteristics and mortality, Belgium 2008-2014
Year 2008 2009 2010 2011 2012 2013 2014
N hospitals participating at least one semester per year
148 149 147 145 144 141 141
Number of reported episodes 2,981 2,948 2,465 2,517 2,507 2,712 2,431
Hospital associated CDI*(%) 64% 61% 62% 63% 61% 59% 59%
Recurrent episodes CDI** (%) 11% 10% 9% 8% 9% 9% 9%
Death within 30 days – direct or indirect result of CDI (% of patients)
10% 5% 4% 3% 3% 4% 3%
*Definition: onset of symptoms >= 2 days after admission in the declaring hospital **Proportion of episodes which are recurrent In 2014, 54% of patients were female; the median age for patients with hospital associated CDI (HA-CDI) was 79 and 72 for non-HA CDI; 2% of patients were 2 years or less. Episodes of HA-CDI were principally diagnosed when patients were in the geriatrics department (31%), onco-haematology (9%) or the intensive care unit (7%).
Epidemiology of Clostridium difficile infection in Belgium | 2015
© Scientific Institute of Public Health, WIV-ISP, Brussels 2015 4/54
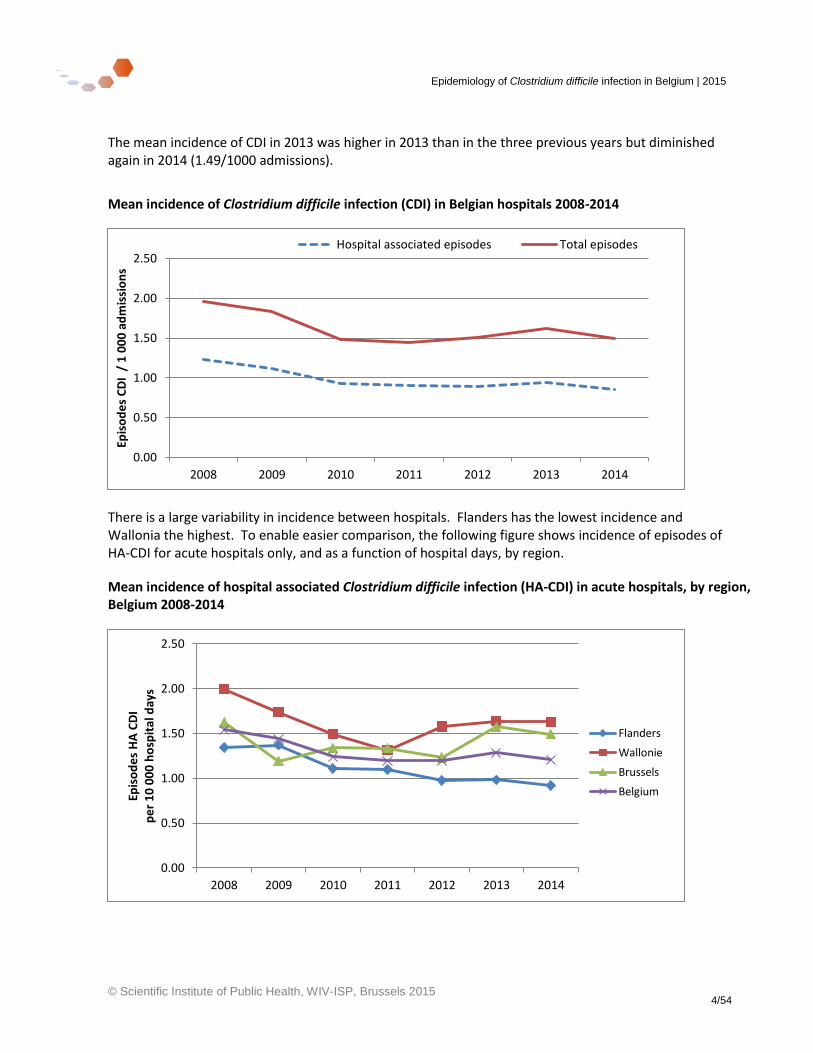
The mean incidence of CDI in 2013 was higher in 2013 than in the three previous years but diminished again in 2014 (1.49/1000 admissions).
Mean incidence of Clostridium difficile infection (CDI) in Belgian hospitals 2008-2014
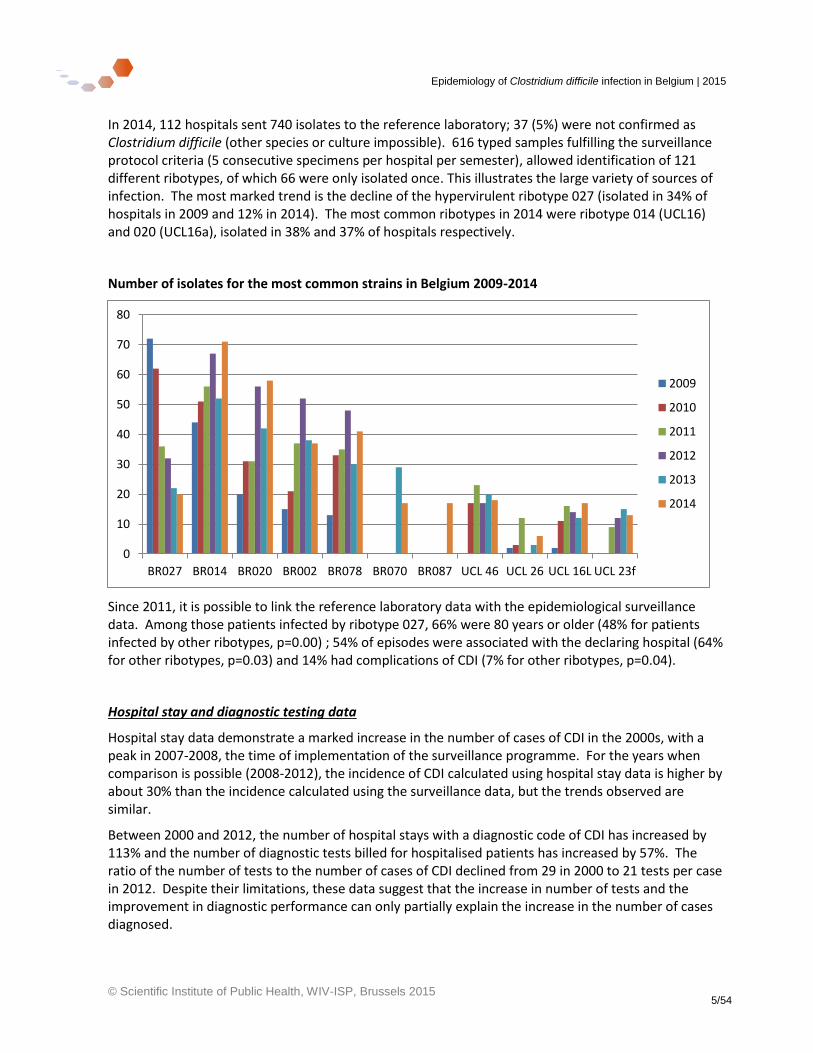
There is a large variability in incidence between hospitals. Flanders has the lowest incidence and Wallonia the highest. To enable easier comparison, the following figure shows incidence of episodes of HA-CDI for acute hospitals only, and as a function of hospital days, by region.
Mean incidence of hospital associated Clostridium difficile infection (HA-CDI) in acute hospitals, by region, Belgium 2008-2014
0.00
0.50
1.00
1.50
2.00
2.50
2008 2009 2010 2011 2012 2013 2014
Epis
od
es
CD
I /
1 0
00
ad
mis
sio
ns
Hospital associated episodes Total episodes
0.00
0.50
1.00
1.50
2.00
2.50
2008 2009 2010 2011 2012 2013 2014
Epis
od
es
HA
CD
I p
er
10
00
0 h
osp
ital
day
s
Flanders
Wallonie
Brussels
Belgium
Epidemiology of Clostridium difficile infection in Belgium | 2015
© Scientific Institute of Public Health, WIV-ISP, Brussels 2015 5/54
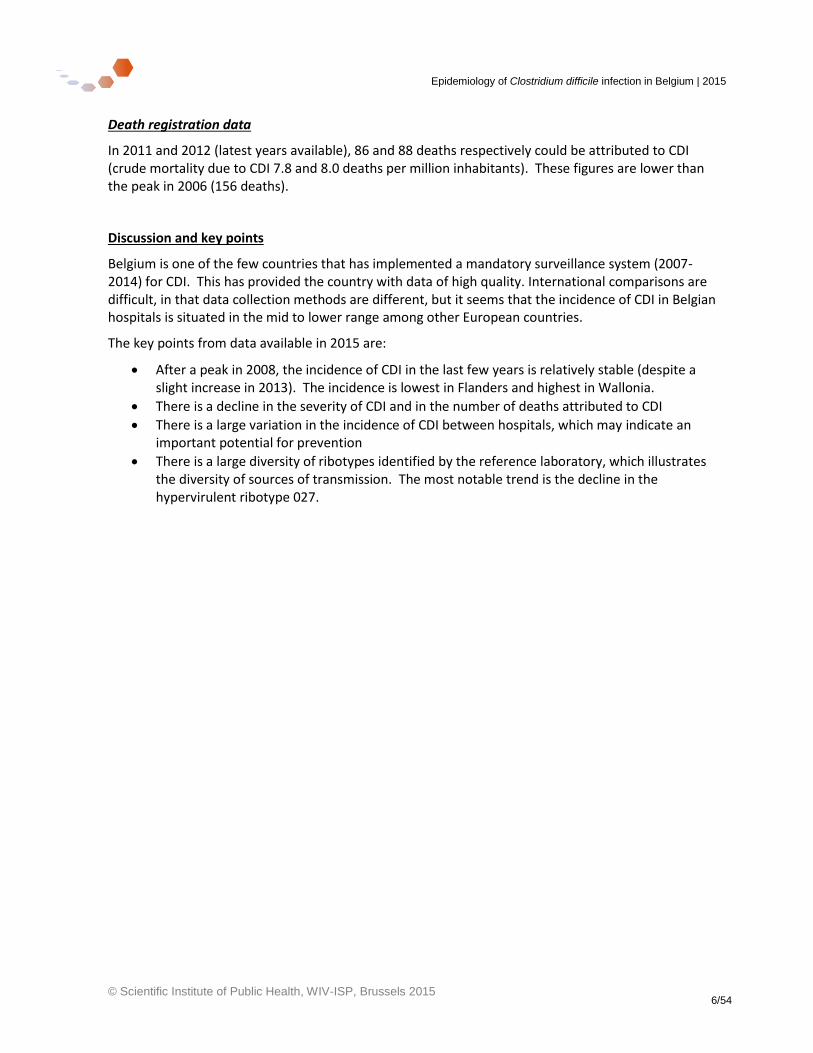
In 2014, 112 hospitals sent 740 isolates to the reference laboratory; 37 (5%) were not confirmed as Clostridium difficile (other species or culture impossible). 616 typed samples fulfilling the surveillance protocol criteria (5 consecutive specimens per hospital per semester), allowed identification of 121 different ribotypes, of which 66 were only isolated once. This illustrates the large variety of sources of infection. The most marked trend is the decline of the hypervirulent ribotype 027 (isolated in 34% of hospitals in 2009 and 12% in 2014). The most common ribotypes in 2014 were ribotype 014 (UCL16) and 020 (UCL16a), isolated in 38% and 37% of hospitals respectively.
Number of isolates for the most common strains in Belgium 2009-2014
Since 2011, it is possible to link the reference laboratory data with the epidemiological surveillance data. Among those patients infected by ribotype 027, 66% were 80 years or older (48% for patients infected by other ribotypes, p=0.00) ; 54% of episodes were associated with the declaring hospital (64% for other ribotypes, p=0.03) and 14% had complications of CDI (7% for other ribotypes, p=0.04).
Hospital stay and diagnostic testing data
Hospital stay data demonstrate a marked increase in the number of cases of CDI in the 2000s, with a peak in 2007-2008, the time of implementation of the surveillance programme. For the years when comparison is possible (2008-2012), the incidence of CDI calculated using hospital stay data is higher by about 30% than the incidence calculated using the surveillance data, but the trends observed are similar.
Between 2000 and 2012, the number of hospital stays with a diagnostic code of CDI has increased by 113% and the number of diagnostic tests billed for hospitalised patients has increased by 57%. The ratio of the number of tests to the number of cases of CDI declined from 29 in 2000 to 21 tests per case in 2012. Despite their limitations, these data suggest that the increase in number of tests and the improvement in diagnostic performance can only partially explain the increase in the number of cases diagnosed.
0
10
20
30
40
50
60
70
80
BR027 BR014 BR020 BR002 BR078 BR070 BR087 UCL 46 UCL 26 UCL 16L UCL 23f
2009
2010
2011
2012
2013
2014
Epidemiology of Clostridium difficile infection in Belgium | 2015
© Scientific Institute of Public Health, WIV-ISP, Brussels 2015 6/54
Death registration data
In 2011 and 2012 (latest years available), 86 and 88 deaths respectively could be attributed to CDI (crude mortality due to CDI 7.8 and 8.0 deaths per million inhabitants). These figures are lower than the peak in 2006 (156 deaths).
Discussion and key points
Belgium is one of the few countries that has implemented a mandatory surveillance system (2007-2014) for CDI. This has provided the country with data of high quality. International comparisons are difficult, in that data collection methods are different, but it seems that the incidence of CDI in Belgian hospitals is situated in the mid to lower range among other European countries.
The key points from data available in 2015 are:
After a peak in 2008, the incidence of CDI in the last few years is relatively stable (despite a slight increase in 2013). The incidence is lowest in Flanders and highest in Wallonia.
There is a decline in the severity of CDI and in the number of deaths attributed to CDI
There is a large variation in the incidence of CDI between hospitals, which may indicate an important potential for prevention
There is a large diversity of ribotypes identified by the reference laboratory, which illustrates the diversity of sources of transmission. The most notable trend is the decline in the hypervirulent ribotype 027.
Epidemiology of Clostridium difficile infection in Belgium | 2015
© Scientific Institute of Public Health, WIV-ISP, Brussels 2015 7/54
Glossary
CDI Clostridium difficile infection
CI Confidence interval
HA-CDI Hospital-associated Clostridium difficile infection (onset of diarrhoea 2 days or more after admission in declaring hospital)
CA-CDI Community associated Clostridium difficile infection (onset of diarrhoea less than two days after admission to hospital with no previous admission to any hospital or long term care facility in previous 12 weeks)
LTCF Long term care facility
ICD-10 International Classification of Diseases, 10th Revision
ICD-9-CM International Classification of Diseases, 9th Revision, Clinical Modification
ICU Intensive care unit
INAMI/RIZIV Institut national d’assurance maladie-invalidité / Rijksinstituut voor ziekte- en invaliditeitsverzekering
LoS Length of stay
LTCF Long term care facility
MRSA Methicillin resistant Staphylococcus aureus
MLVA Multi Locus Variable number tandem repeat Analysis
N or n Number
NRC-CD National reference centre (laboratory) – Clostridium difficile
PCR Polymerase chain reaction
Popn Population
Pts Patients
RHM/MZG Résumés hospitaliers minima/ Minimale ziekenhuis gegevens (minimum hospital data set)
RNA Ribonucleic acid
RR Relative risk or risk ratio
UE European Union
UK United Kingdom
US United States
Epidemiology of Clostridium difficile infection in Belgium | 2015
© Scientific Institute of Public Health, WIV-ISP, Brussels 2015 8/54
Executive Summary 3-6
Glossary 7
1 Introduction 11
1.1 General background 11
1.2 Objectives of this report 12
2 Methodology 13
2.1 Hospital epidemiological surveillance programme co-ordinated by the Scientific Institute of Public Health (WIV-ISP) 13
2.2 Hospital stay data and CDI testing data 14
2.3 Death Registration Data 14
2.4 Reference Laboratory data 15
2.5 Linkage of patient episode information and ribotyping data 15
3 Results 16
3.1 Hospital surveillance data 16 3.1.1 Hospital participation, characteristics of episodes and patients 16 3.1.2 Complications 18 3.1.3 Annual incidence 19 3.1.4 Seasonal variation 24 3.1.5 Further descriptive epidemiology of cases 2014 25
3.3 Hospital stay and Clostridium difficile infection (CDI) testing data 26
3.4 Death registration data 29
3.5 Microbiological surveillance – National Laboratory Reference Centre (NRC-CD) data 31 3.5.1 Participation 31 3.5.1 Ribotype distribution 32 3.5.1 Trends in ribotype prevalence 33
3.6 Linkage between laboratory and epidemiological surveillance data 37
3.7 International comparisons 42
4 Discussion and conclusions 45
4.1 Discussion 45
4.2 Conclusions and key points 47
5 ANNEX 48
5.1 Comparison of incidence of Clostridium difficile infection between acute and chronic hospitals 48
5.2 Reference laboratory (NRC-CD) methods 50 5.2.1 Ribotyping 50 5.2.2 MLVA 50
6 Reference List 52
Epidemiology of Clostridium difficile infection in Belgium | 2015
© Scientific Institute of Public Health, WIV-ISP, Brussels 2015 9/54
Tables
Table 1 : Epidemiological surveillance of Clostridium difficile infection (CDI): hospital participation and episodes reported, Belgium 2008-2014 .................................................................................................................................... 16 Table 2 : Epidemiological surveillance of Clostridium difficile infection (CDI): characteristics of cases in Belgian hospitals 2008-2014 ................................................................................................................................................... 17 Table 3 : Complications in patients with Clostridium difficile infection (CDI) in Belgian hospitals, 2008-2014 ......... 18 Table 4 : Incidence of infection with Clostridium difficile (CDI) in Belgian hospitals, 2008-2014: surveillance data . 20 Table 5 : Hospital associated Clostridium difficile infections (CDI) per 10 000 hospital days in acute hospitals, by region - Belgium, 2008-2014 ...................................................................................................................................... 22 Table 6 : Department of diagnosis for all hospital associated episodes of Clostridium difficile infection (CDI), 2014 ................................................................................................................................................................................... 25 Table 7 : Age distribution of all patients, 2014 .......................................................................................................... 25 Table 8 : Hospital stays with an intestinal infection due to Clostridium difficile (CDI), Belgium 2000-2012 ............. 26 Table 9 : incidence of Clostridium difficile infection (CDI) per 100 000 Belgian population using hospital stay data, 2000-2012 .................................................................................................................................................................. 27 Table 10 : Relationship between number of tests
a carried out in hospitalised patients for Clostridium difficile
infection (CDI) and the number of cases dischargedb, 2000-2012 ............................................................................. 27
Table 11 : Mean incidence of Clostridium difficile infections (CDI) per 1000 hospital stays, Belgium, 2008-2012, according to data source............................................................................................................................................ 28 Table 12 : Deaths attributed to enterocolitis due to Clostridium difficile* by region, Belgium 1998-2012 ............... 29 Table 13 : Number of samples sent to NRC-CD by local laboratories in 2014 ............................................................ 31 Table 14 : Number of the most common Clostridium difficile ribotypes (BR) isolated in 2014 by province, Belgium 32 Table 15 : Number of Clostridium difficile isolates included in the surveillance programme and description of the most common ribotypes, Belgium 2009-2014 ........................................................................................................... 33 Table 16 : Participation in the surveillance programme (by hospital site) and evolution of the most common Clostridium difficile ribotypes, Belgium 2009-2014 ................................................................................................... 34 Table 17 : Matching reference laboratory ribotyping with epidemiology surveillance data from Belgian hospitals, 2011-2014 .................................................................................................................................................................. 37 Table 18 : Comparison of characteristics for ribotyped matched Clostridium difficile episodes and un-matched episodes in Belgian hospitals, 2011-2015 .................................................................................................................. 38 Table 19 : Clostridium difficile ribotype characteristics with respect to patient age, episodes in hospitalised Belgian patients 2011-2015 .................................................................................................................................................... 39 Table 20 : Clostridium difficile ribotype characteristics with respect to origin of infection, episodes in hospitalised Belgian patients 2011-2015 ....................................................................................................................................... 40 Table 21 : Clostridium difficile ribotype characteristics with respect to complications, episodes in hospitalised Belgian patients 2011-2015 ....................................................................................................................................... 41 Table 22: International comparison of incidence of Clostridium difficile infection – for hospital patients only ........ 42 Table 23: International comparison of incidence of Clostridium difficile infection – for hospital and community patients ...................................................................................................................................................................... 43 Table 24 : Incidence of infection with Clostridium difficile (CDI), acute
$ hospitals, Belgium 2008-2014 ................... 48
Table 25 : Incidence of infection with Clostridium difficile (CDI), chronic$ hospitals, Belgium 2008-14 .................... 49
Table 26 : Equivalent European (Brazier- BR) and Belgian (UCL) classification of Clostridium difficile ribotypes ..... 51
Epidemiology of Clostridium difficile infection in Belgium | 2015
© Scientific Institute of Public Health, WIV-ISP, Brussels 2015 10/54
Figures
Figure 1 : Mean annual incidence of infection with Clostridium difficile (CDI) – total cases and hospital associated cases /1000 admissions, Belgian hospitals, 2008-2014 ............................................................................................. 19 Figure 2 : Distribution of incidence of hospital associated Clostridium difficile infections (CDI) in Belgium, per 10 000 hospital days – comparison of acute and chronic hospitals, 2008-2014 ............................................................. 21 Figure 3 : Hospital associated Clostridium difficile infections (CDI) per 10 000 hospital days in acute hospitals, by region - Belgium, 2008-2014 ...................................................................................................................................... 22 Figure 4 : Distribution of incidence of hospital associated Clostridium difficile infections (CDI) per 10 000 hospital days in acute hospitals, by region. Belgium, 2008-2014 ............................................................................................ 23 Figure 5 : Monthly incidence (moving average*) of Clostridium difficile infections (CDI) in Belgian hospitals per 1000 admissions 2008-2014 ...................................................................................................................................... 24 Figure 6 : Hospital stays with an intestinal infection due to Clostridium difficile* (CDI) Belgium 1999-2012 ........... 28 Figure 7 : Clostridium difficile infections (CDI): age-standardised mortality rate, by region Belgium 1998-2012 .... 30 Figure 8 : Evolution of number of isolates belonging to the most common ribotypes in Belgian hospitals 2009-2014 ................................................................................................................................................................................... 35 Figure 9 : Evolution of the percentage of ribotypes belonging to the most common ribotypes in Belgian hospitals 2009-2014 .................................................................................................................................................................. 35 Figure 10 : Evolution of the frequency of the most commonly identified ribotypes in Belgian hospitals, 2010 - 2014 ................................................................................................................................................................................... 36 Figure 11 : Example of trace obtained by capillary electrophoresis for ribotyping .................................................... 50
Epidemiology of Clostridium difficile infection in Belgium | 2015
© Scientific Institute of Public Health, WIV-ISP, Brussels 2015 11/54
1 Introduction
1.1 General background
Clostridium difficile infection (CDI) is one of the top 10 healthcare-associated infections in European hospitals, including Belgium1 and has surpassed methicillin resistant Staphylococcus aureus (MRSA) as a leading cause of healthcare-associated infection in some European countries2,3. Patients with CDI are likely to spend an extra 1-3 weeks in hospital when compared to those without CDI, at an estimated additional cost of 14 000 euros4.
In Europe as a whole, infection rates increased substantially between 2008-2013 from 4.1 to 7.9 cases per 10, 000 hospital bed days4. An event hosted by the European Parliament in December 2014 highlighted that urgent action was needed to address current issues relating to CDI.5
A multicentre point prevalence survey of CDI in hospitalised patients with diarrhoea (EUCLID)6 found that both under-diagnosis and mis-diagnosis were commonplace in Europe between 2011-2013. Overall, 23% of 641 diarrhoea samples from 20 countries were found positive for Clostridium difficile as determined by the national laboratory but were not diagnosed by participating hospitals because of an absence of clinical suspicion. There was a 40 fold variation in testing frequency for CDI between countries. A previous European point prevalence survey suggested that testing rate might be associated with incidence rate between countries7. However this latest study could only find a correlation between testing rate and incidence of ribotype 027,4 but not overall incidence of CDI.6 In addition, not even 50% of hospitals reported using the currently optimal methods for testing (a two stage laboratory diagnosis including a sensitive C.difficile screening test followed by a C.difficile toxin assay). Encouragingly though, out of the 10 participating Belgian hospitals, no under-diagnosis was detected among the 156 submitted samples (i.e. sample not tested locally but tested positive at the national laboratory) and only 3% of total samples collected were false positives (positive detection of toxin at local laboratory but negative at national laboratory) and 1% were false negatives at the participating hospitals. Six of the ten Belgian hospitals used optimised diagnostic tests in the sampling periods of September 2012 & August 2013.
It is therefore pertinent that, Belgium is currently updating its own national recommendations for the prevention and control of C. difficile in acute hospitals and long term care facilities,8 and ECDC has just published new recommendations for surveillance of CDI across Europe9.
Looking at ribotypes, the 2011-13 EUCLID study6 demonstrated a more diverse range of ribotypes across Europe when compared to a previous European study in 20087, and with no single strain dominating in any one country. In the EUCLID study, ribotype 027 was the most prevalent amongst typed isolates (18% of total), although around 88% of occurrences of this ribotype were recorded in only four countries – Germany, Hungary, Poland and Romania. Although ribotype 027 is not the most prevalent in the Netherlands, there have been an increasing number of outbreaks with this ribotype since 2013, regularly involving nursing homes as well as hospitals10. The second most prevalent ribotypes across Europe were 001/072 (11%), 014 (7%) and 002 (4%).
As typing techniques have become more sophisticated and more readily available, interest has developed in monitoring transmission patterns between hospital patients. It has been demonstrated by whole genome sequencing that nearly half of all cases in a hospital setting with good infection
Epidemiology of Clostridium difficile infection in Belgium | 2015
© Scientific Institute of Public Health, WIV-ISP, Brussels 2015 12/54
control procedures are genetically distinct i.e. not resulting from in-hospital transmission.11 This has sparked interest in other possible sources of infection, including animal reservoirs such as pigs and / or cattle in whom ribotypes 078 and 014/020 are prevalent.12
1.2 Objectives of this report
The objective of this report is to describe the epidemiology of Clostridium difficile infection in Belgium. For this 2015 report, we have analysed the latest data available:
Hospital surveillance data (including reference laboratory data) for the years 2008 – 2014
Hospital stay and CDI testing data for the years 1999 à 2012
Death registration data for the years 1998 à 2012
Epidemiology of Clostridium difficile infection in Belgium | 2015
© Scientific Institute of Public Health, WIV-ISP, Brussels 2015 13/54
2 Methodology
2.1 Hospital epidemiological surveillance programme co-ordinated by the Scientific Institute of Public Health (WIV-ISP)
Between July 2007 and 30 June 2014, it was obligatory for all acute hospitals to participate in this surveillance programme for at least one semester (6 months – Jan-June or Jul-Dec) each year (Arrêté Royal du 26-06-2007).
Since 1 July 2014, participation in the surveillance programme for C.difficile is no longer obligatory (Arrêté Royal du 08-01-201513). However, there is an obligation for hospitals to participate in at least one of four of the following surveillance programmes:
i) Infections with Clostridium difficile ii) Infections with vancomycin resistant enterococci iii) Pneumoniae and septicaemiae in intensive care units or iv) Surgical site infections
An electronic information portal collects the surveillance data for cases of C. difficile (NSIH Web 1).
The methods are described in detail in the protocol, available online in French and Dutch: https://www.wiv-isp.be/nsih/surv_cdif/download_fr.asp https://www.wiv-isp.be/nsih/surv_cdif/download_nl.asp
The data analysed for this report are for the period 1st January 2008 - 31 December 2014
An episode of Clostridium difficile infection (CDI) is defined a case which fulfils one or more of the following criteria:
1. Diarrhoea* or toxic megacolon, and a laboratory confirmed C. difficile toxin A and/or B in the stool or a strain producing toxins identified in the stools, by culture or another method
2. Pseudomembranous colitis observed by proctocolonoscopy of the lower gastro-intestinal tract
3. Histopathology characteristic of C. difficile in the colon (with or without diarrhoea) obtained by biopsy during endoscopy, colectomy or autopsy
*At least three liquid or non-formed stools (the stools take the form of the container) during 24 hours or less.
Hospital-associated CDI (HA-CDI) is defined in this report as CDI with an onset of diarrhoea 2 days or more after admission in the declaring hospital (onset date – admission date >2). Because of information collection issues, it does not include those cases which arise after but within 4 weeks of discharge from hospital and that would be included in the definition of “healthcare-associated infection” according to the surveillance protocol.
Those episodes that do not fulfil the report definition of hospital associated CDI have been categorised into the following groups by the clinician entering the data into NSIHweb1 according to the probable origin of infection: 1) home/community, 2) declaring hospital, 3) other hospital, 4) long term care facility or 5) unknown. The surveillance protocol gives the definition of community associated infection
Epidemiology of Clostridium difficile infection in Belgium | 2015
© Scientific Institute of Public Health, WIV-ISP, Brussels 2015 14/54
(onset of diarrhoea less than two days after admission to hospital with no previous admission to hospital or long term care facility in previous 12 weeks), which should be used in allocating a case to “home/community”. The category “declaring hospital” should pick up those infections with onset after but within four weeks of discharge from the declaring hospital, but undoubtedly also picks up some cases which are subjectively thought to be associated with the declaring hospital but do not fulfil the report definition given above.
2.2 Hospital stay data and CDI testing data
In Belgium, each hospital stay gives rise to a registration (RHM/MZG – minimum hospital data set). Diagnoses are coded using ICD-9-CM (International Classification of Diseases, 9th Revision, Clinical Modification).14 We have analysed the hospital stays with a code 008.45 (Intestinal infections due to C.difficile) from 1999 to 2012 (latest available year). The diagnoses are classified as “primary diagnosis” – the pathology considered to explain the majority of the hospital stay (most commonly, but not necessarily, the reason for admission), and “secondary diagnosis”.
The data provided in this report are provided by the Federal Public Health Service (Service Fédéral Santé Publique / Federale Overheidsdienst) and cover all hospital stays in Belgium, with the exception of psychiatric stays, and day cases. In previous reports, day cases have been included in the calculations. From last year’s report in 2014, the analyses have been re-run for all years excluding day cases to allow better comparison with the mandatory hospital surveillance data.
The CDI testing data come from hospital billing information INAMI (Institut national d’assurance maladie-invalidité) / RIZIV (Rijksinstituut voor ziekte- en invaliditeitsverzekering). All tests for CDI on hospitalised patients (code 549861: tests for C. difficile toxin in the stools) were counted.
2.3 Death Registration Data
Death certificates in Belgium are coded according to ICD-1014 system. We counted deaths with code A04.7 as underlying cause of death : “death due to a Clostridium difficile related enterocolitis” for the years 1998 – 2012 (latest available data). The underlying cause of death is the original disease causing the chain of events immediately leading to death.
Death registrations data have been extracted from the database of causes of death in Belgium, provided by DGSIE (“Statistics Belgium”).15
The age standardised mortality rate is based on direct standardisation using the mid-year population figures for 2005,16 divided into three age groups: 0-64, 65-79, > 80 years.
Deaths are counted according to region of death, not according to region of residence of the deceased. The denominator for each region remains as the resident population of the region.
Epidemiology of Clostridium difficile infection in Belgium | 2015
© Scientific Institute of Public Health, WIV-ISP, Brussels 2015 15/54
2.4 Reference Laboratory data
The C. difficile National laboratory Reference Centre for Clostridium difficile (NRC-CD) was officially established in 2011 but has been actively involved in the national surveillance since 2006. It is hosted at the Catholic University of Louvain on the site of Woluwe-St-Lambert, Brussels.
Since 2007, the surveillance program has included a mandatory bacteriological component for every participating Belgian hospital clinical laboratory. It requires each hospital laboratory to send five C. difficile strains isolated consecutively during one semester of the year, with additional accompanying information as listed on the website of the WIV-ISP (available in French and Dutch) https://www.wiv-isp.be/nsih/surv_cdif/download_fr.asp and https://www.wiv-isp.be/nsih/surv_cdif/download_nl.asp
In addition, a hospital may send locally isolated strains to the reference laboratory for typing in order to support the investigation of local increases in the number of cases or suspected outbreaks.
Each received sample is confirmed and typed. The currently applied method of ribotyping is that which is used in the majority of European reference centres. The details of the typing techniques are presented in the Annex.
2.5 Linkage of patient episode information and ribotyping data
Linkage is established between the epidemiological data from the hospital surveillance programme (NISHweb1 case based reporting) and the reference laboratory ribotyping data through the automatic code generated on printing the encoded case from NSIHweb1. This code is then sent (as part of the patient information) by the hospital laboratory, together with the patient sample to the NRC-CD for ribotyping.
Epidemiology of Clostridium difficile infection in Belgium | 2015
© Scientific Institute of Public Health, WIV-ISP, Brussels 2015 16/54
3 Results
3.1 Hospital surveillance data
3.1.1 Hospital participation, characteristics of episodes and patients
The data analysed was last updated on 4 May 2015.
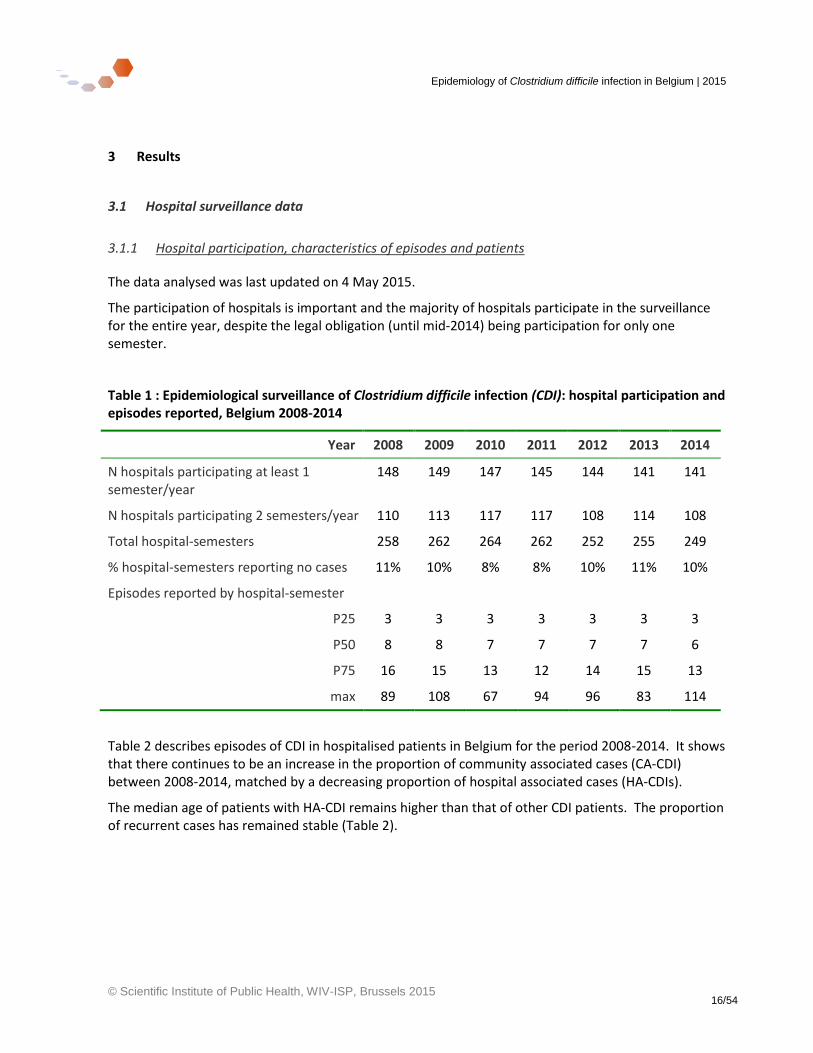
The participation of hospitals is important and the majority of hospitals participate in the surveillance for the entire year, despite the legal obligation (until mid-2014) being participation for only one semester.
Table 1 : Epidemiological surveillance of Clostridium difficile infection (CDI): hospital participation and episodes reported, Belgium 2008-2014
Year 2008 2009 2010 2011 2012 2013 2014
N hospitals participating at least 1 semester/year
148 149 147 145 144 141 141
N hospitals participating 2 semesters/year 110 113 117 117 108 114 108
Total hospital-semesters 258 262 264 262 252 255 249
% hospital-semesters reporting no cases 11% 10% 8% 8% 10% 11% 10%
Episodes reported by hospital-semester
P25 3 3 3 3 3 3 3
P50 8 8 7 7 7 7 6
P75 16 15 13 12 14 15 13
max 89 108 67 94 96 83 114
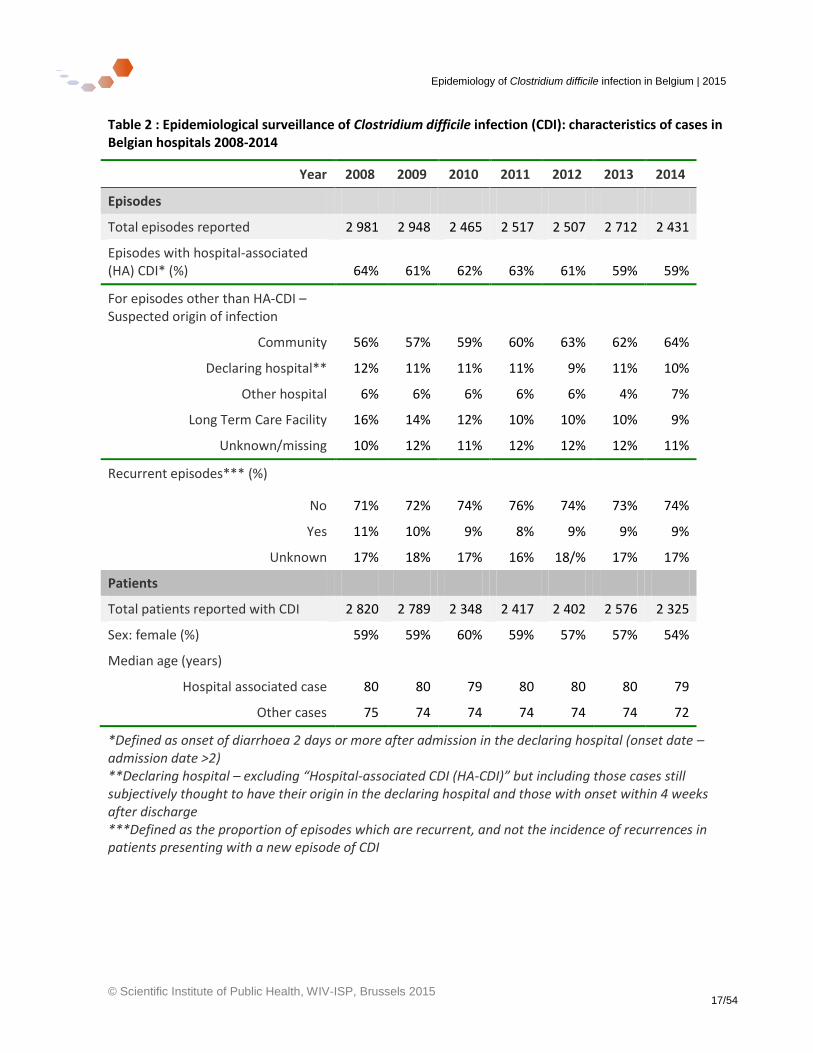
Table 2 describes episodes of CDI in hospitalised patients in Belgium for the period 2008-2014. It shows that there continues to be an increase in the proportion of community associated cases (CA-CDI) between 2008-2014, matched by a decreasing proportion of hospital associated cases (HA-CDIs).
The median age of patients with HA-CDI remains higher than that of other CDI patients. The proportion of recurrent cases has remained stable (Table 2).
Epidemiology of Clostridium difficile infection in Belgium | 2015
© Scientific Institute of Public Health, WIV-ISP, Brussels 2015 17/54
Table 2 : Epidemiological surveillance of Clostridium difficile infection (CDI): characteristics of cases in Belgian hospitals 2008-2014
Year 2008 2009 2010 2011 2012 2013 2014
Episodes
Total episodes reported 2 981 2 948 2 465 2 517 2 507 2 712 2 431
Episodes with hospital-associated (HA) CDI* (%) 64% 61% 62% 63% 61% 59% 59%
For episodes other than HA-CDI – Suspected origin of infection
Community 56% 57% 59% 60% 63% 62% 64%
Declaring hospital** 12% 11% 11% 11% 9% 11% 10%
Other hospital 6% 6% 6% 6% 6% 4% 7%
Long Term Care Facility 16% 14% 12% 10% 10% 10% 9%
Unknown/missing 10% 12% 11% 12% 12% 12% 11%
Recurrent episodes*** (%)
No 71% 72% 74% 76% 74% 73% 74%
Yes 11% 10% 9% 8% 9% 9% 9%
Unknown 17% 18% 17% 16% 18/% 17% 17%
Patients
Total patients reported with CDI 2 820 2 789 2 348 2 417 2 402 2 576 2 325
Sex: female (%) 59% 59% 60% 59% 57% 57% 54%
Median age (years)
Hospital associated case 80 80 79 80 80 80 79
Other cases 75 74 74 74 74 74 72
*Defined as onset of diarrhoea 2 days or more after admission in the declaring hospital (onset date – admission date >2) **Declaring hospital – excluding “Hospital-associated CDI (HA-CDI)” but including those cases still subjectively thought to have their origin in the declaring hospital and those with onset within 4 weeks after discharge ***Defined as the proportion of episodes which are recurrent, and not the incidence of recurrences in patients presenting with a new episode of CDI
Epidemiology of Clostridium difficile infection in Belgium | 2015
© Scientific Institute of Public Health, WIV-ISP, Brussels 2015 18/54
3.1.2 Complications
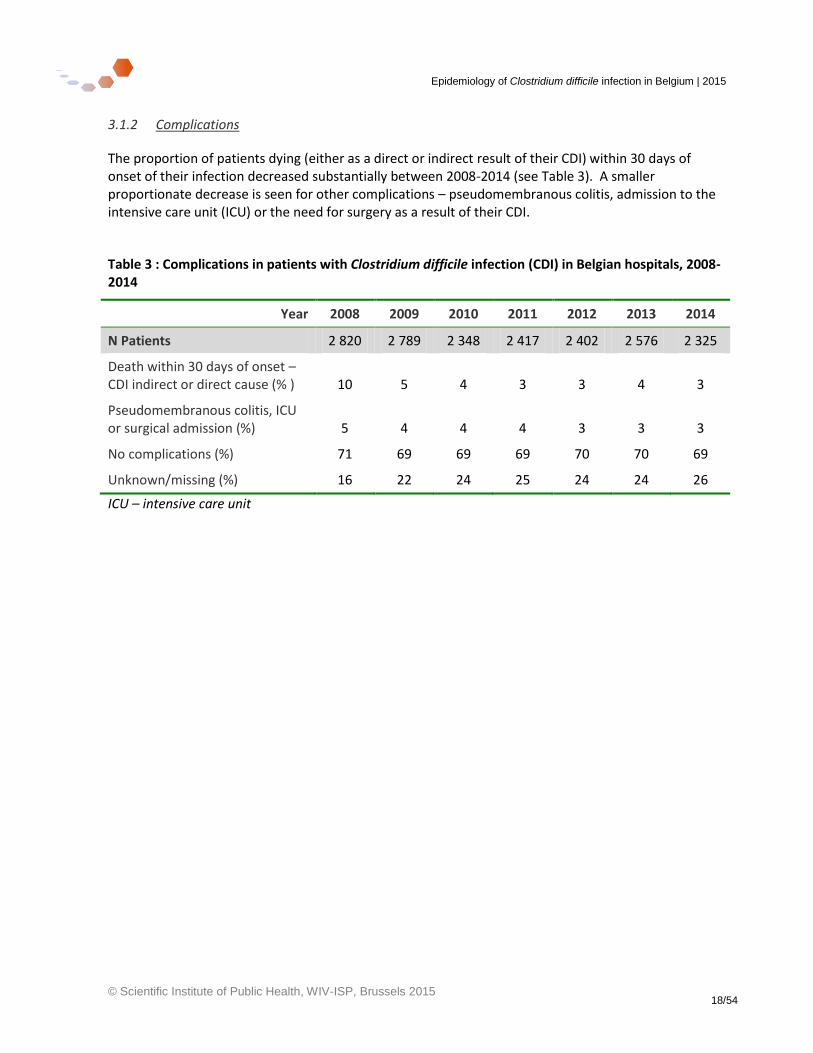
The proportion of patients dying (either as a direct or indirect result of their CDI) within 30 days of onset of their infection decreased substantially between 2008-2014 (see Table 3). A smaller proportionate decrease is seen for other complications – pseudomembranous colitis, admission to the intensive care unit (ICU) or the need for surgery as a result of their CDI.
Table 3 : Complications in patients with Clostridium difficile infection (CDI) in Belgian hospitals, 2008-2014
Year 2008 2009 2010 2011 2012 2013 2014
N Patients 2 820 2 789 2 348 2 417 2 402 2 576 2 325
Death within 30 days of onset – CDI indirect or direct cause (% ) 10 5 4 3 3 4 3
Pseudomembranous colitis, ICU or surgical admission (%) 5 4 4 4 3 3 3
No complications (%) 71 69 69 69 70 70 69
Unknown/missing (%) 16 22 24 25 24 24 26
ICU – intensive care unit
Epidemiology of Clostridium difficile infection in Belgium | 2015
© Scientific Institute of Public Health, WIV-ISP, Brussels 2015 19/54
3.1.3 Annual incidence
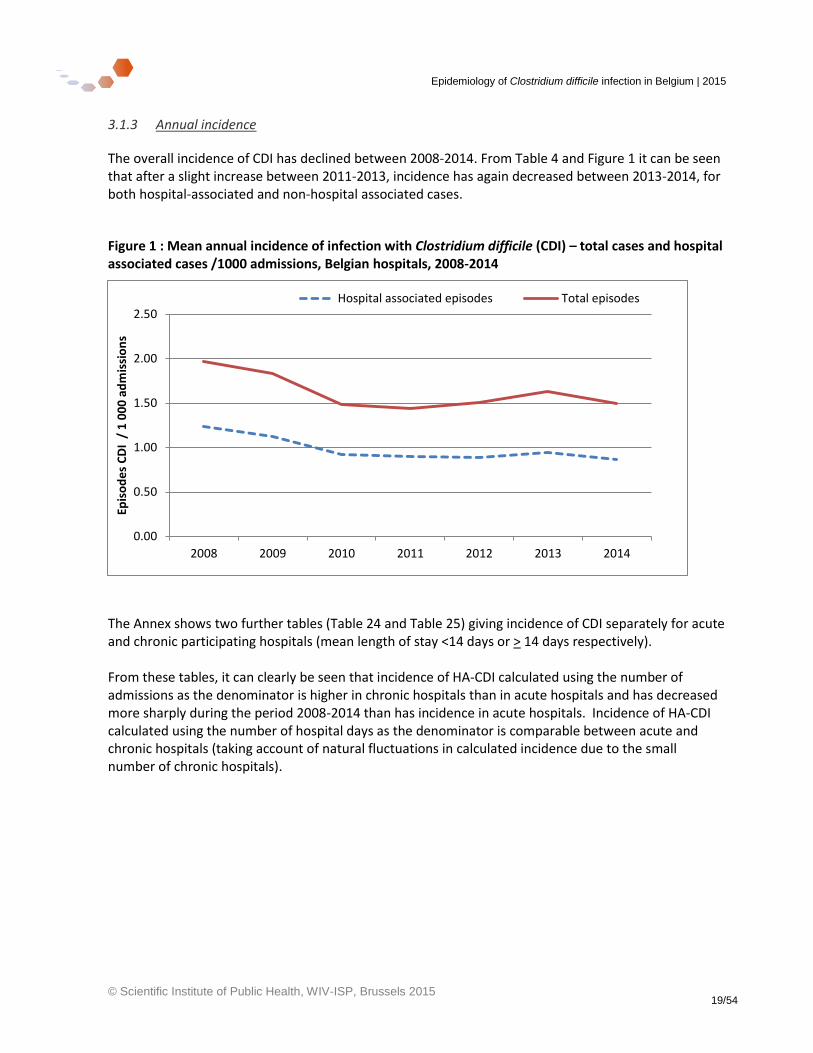
The overall incidence of CDI has declined between 2008-2014. From Table 4 and Figure 1 it can be seen that after a slight increase between 2011-2013, incidence has again decreased between 2013-2014, for both hospital-associated and non-hospital associated cases.
Figure 1 : Mean annual incidence of infection with Clostridium difficile (CDI) – total cases and hospital associated cases /1000 admissions, Belgian hospitals, 2008-2014
The Annex shows two further tables (Table 24 and Table 25) giving incidence of CDI separately for acute and chronic participating hospitals (mean length of stay <14 days or > 14 days respectively). From these tables, it can clearly be seen that incidence of HA-CDI calculated using the number of admissions as the denominator is higher in chronic hospitals than in acute hospitals and has decreased more sharply during the period 2008-2014 than has incidence in acute hospitals. Incidence of HA-CDI calculated using the number of hospital days as the denominator is comparable between acute and chronic hospitals (taking account of natural fluctuations in calculated incidence due to the small number of chronic hospitals).
0.00
0.50
1.00
1.50
2.00
2.50
2008 2009 2010 2011 2012 2013 2014
Epis
od
es
CD
I /
1 0
00
ad
mis
sio
ns
Hospital associated episodes Total episodes
Epidemiology of Clostridium difficile infection in Belgium | 2015
© Scientific Institute of Public Health, WIV-ISP, Brussels 2015 20/54
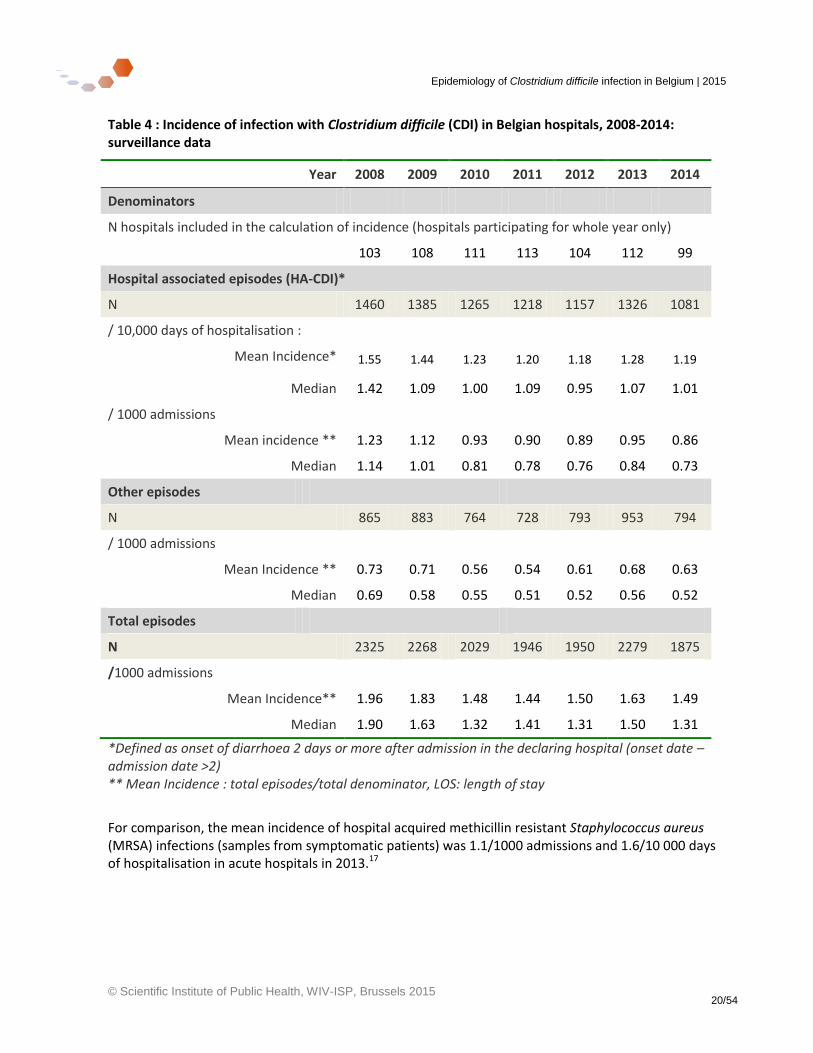
Table 4 : Incidence of infection with Clostridium difficile (CDI) in Belgian hospitals, 2008-2014: surveillance data
Year 2008 2009 2010 2011 2012 2013 2014
Denominators
N hospitals included in the calculation of incidence (hospitals participating for whole year only)
103 108 111 113 104 112 99
Hospital associated episodes (HA-CDI)*
N 1460 1385 1265 1218 1157 1326 1081
/ 10,000 days of hospitalisation :
Mean Incidence* 1.55 1.44 1.23 1.20 1.18 1.28 1.19
Median 1.42 1.09 1.00 1.09 0.95 1.07 1.01
/ 1000 admissions
Mean incidence ** 1.23 1.12 0.93 0.90 0.89 0.95 0.86
Median 1.14 1.01 0.81 0.78 0.76 0.84 0.73
Other episodes
N 865 883 764 728 793 953 794
/ 1000 admissions
Mean Incidence ** 0.73 0.71 0.56 0.54 0.61 0.68 0.63
Median 0.69 0.58 0.55 0.51 0.52 0.56 0.52
Total episodes
N 2325 2268 2029 1946 1950 2279 1875
/1000 admissions
Mean Incidence** 1.96 1.83 1.48 1.44 1.50 1.63 1.49
Median 1.90 1.63 1.32 1.41 1.31 1.50 1.31
*Defined as onset of diarrhoea 2 days or more after admission in the declaring hospital (onset date – admission date >2) ** Mean Incidence : total episodes/total denominator, LOS: length of stay
For comparison, the mean incidence of hospital acquired methicillin resistant Staphylococcus aureus (MRSA) infections (samples from symptomatic patients) was 1.1/1000 admissions and 1.6/10 000 days of hospitalisation in acute hospitals in 2013.17
Epidemiology of Clostridium difficile infection in Belgium | 2015
© Scientific Institute of Public Health, WIV-ISP, Brussels 2015 21/54
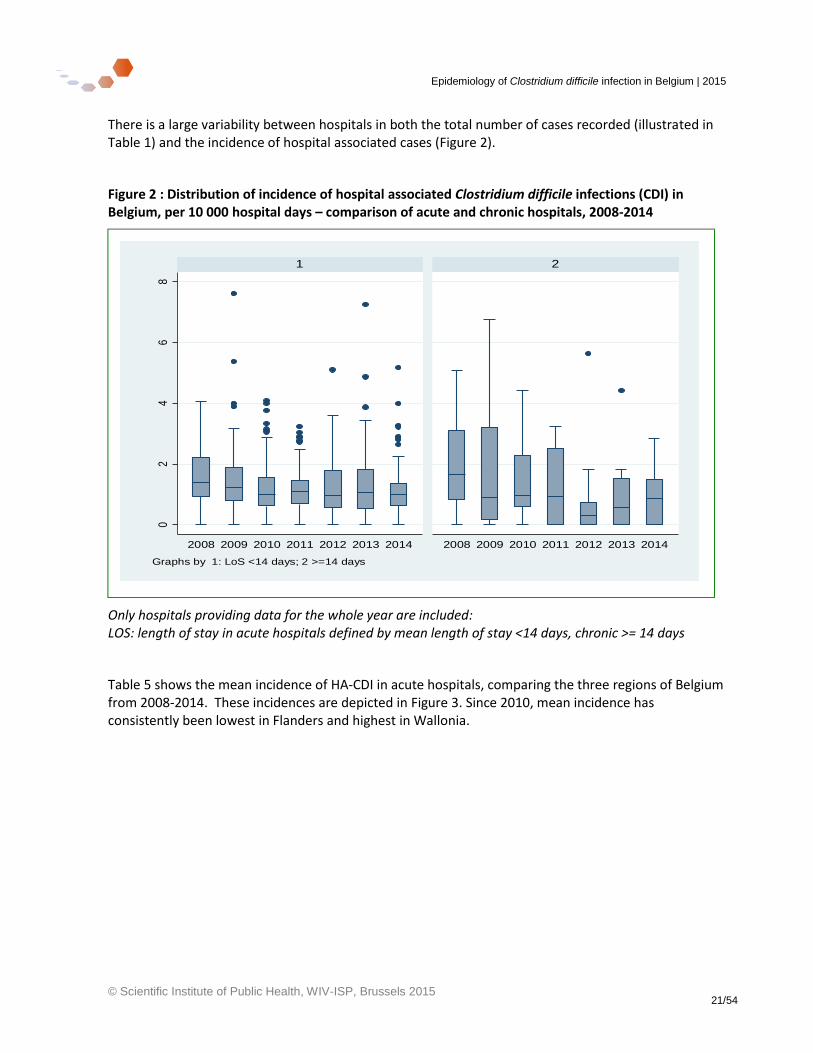
There is a large variability between hospitals in both the total number of cases recorded (illustrated in Table 1) and the incidence of hospital associated cases (Figure 2).
Figure 2 : Distribution of incidence of hospital associated Clostridium difficile infections (CDI) in Belgium, per 10 000 hospital days – comparison of acute and chronic hospitals, 2008-2014
Only hospitals providing data for the whole year are included: LOS: length of stay in acute hospitals defined by mean length of stay <14 days, chronic >= 14 days
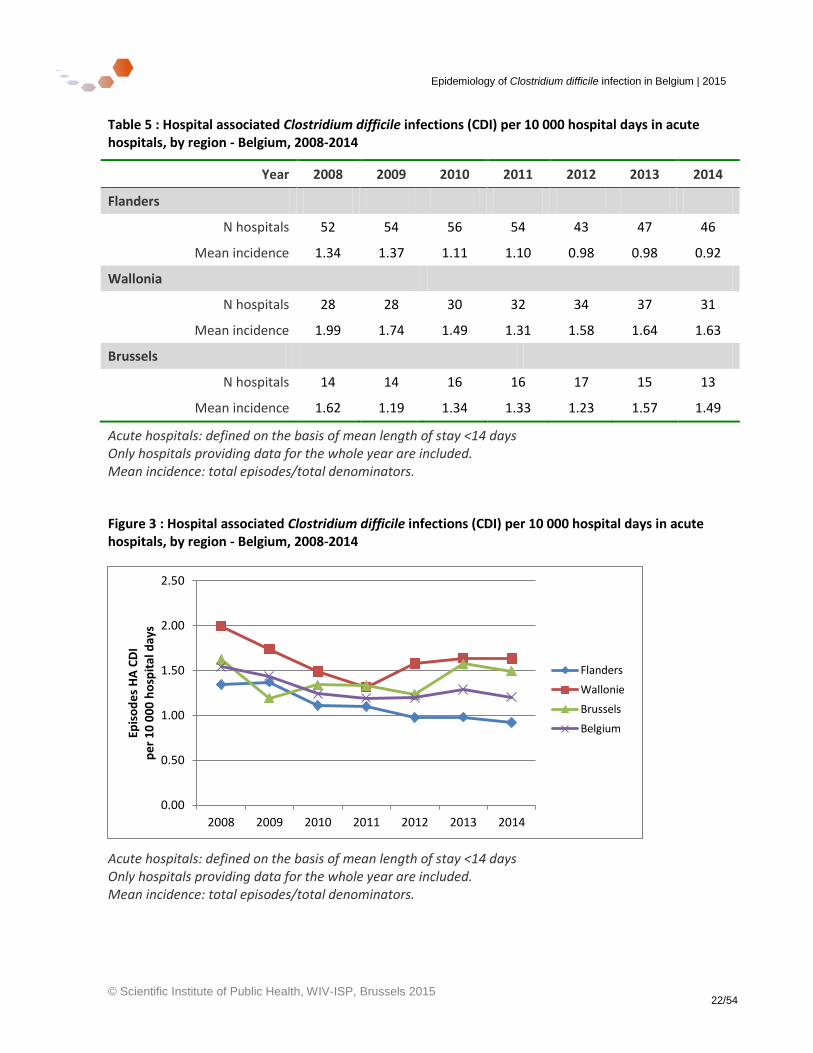
Table 5 shows the mean incidence of HA-CDI in acute hospitals, comparing the three regions of Belgium from 2008-2014. These incidences are depicted in Figure 3. Since 2010, mean incidence has consistently been lowest in Flanders and highest in Wallonia.
02
46
8
2008 2009 2010 2011 2012 2013 2014 2008 2009 2010 2011 2012 2013 2014
1 2
Hos
pita
l-ass
ocia
ted
CD
I per
10.
000
hosp
_day
s
Graphs by 1: LoS <14 days; 2 >=14 days
Epidemiology of Clostridium difficile infection in Belgium | 2015
© Scientific Institute of Public Health, WIV-ISP, Brussels 2015 22/54
Table 5 : Hospital associated Clostridium difficile infections (CDI) per 10 000 hospital days in acute hospitals, by region - Belgium, 2008-2014
Year 2008 2009 2010 2011 2012 2013 2014
Flanders
N hospitals 52 54 56 54 43 47 46
Mean incidence 1.34 1.37 1.11 1.10 0.98 0.98 0.92
Wallonia
N hospitals 28 28 30 32 34 37 31
Mean incidence 1.99 1.74 1.49 1.31 1.58 1.64 1.63
Brussels
N hospitals 14 14 16 16 17 15 13
Mean incidence 1.62 1.19 1.34 1.33 1.23 1.57 1.49
Acute hospitals: defined on the basis of mean length of stay <14 days Only hospitals providing data for the whole year are included. Mean incidence: total episodes/total denominators.
Figure 3 : Hospital associated Clostridium difficile infections (CDI) per 10 000 hospital days in acute hospitals, by region - Belgium, 2008-2014
Acute hospitals: defined on the basis of mean length of stay <14 days Only hospitals providing data for the whole year are included. Mean incidence: total episodes/total denominators.
0.00
0.50
1.00
1.50
2.00
2.50
2008 2009 2010 2011 2012 2013 2014
Epis
od
es
HA
CD
I p
er
10
00
0 h
osp
ital
day
s
Flanders
Wallonie
Brussels
Belgium
Epidemiology of Clostridium difficile infection in Belgium | 2015
© Scientific Institute of Public Health, WIV-ISP, Brussels 2015 23/54
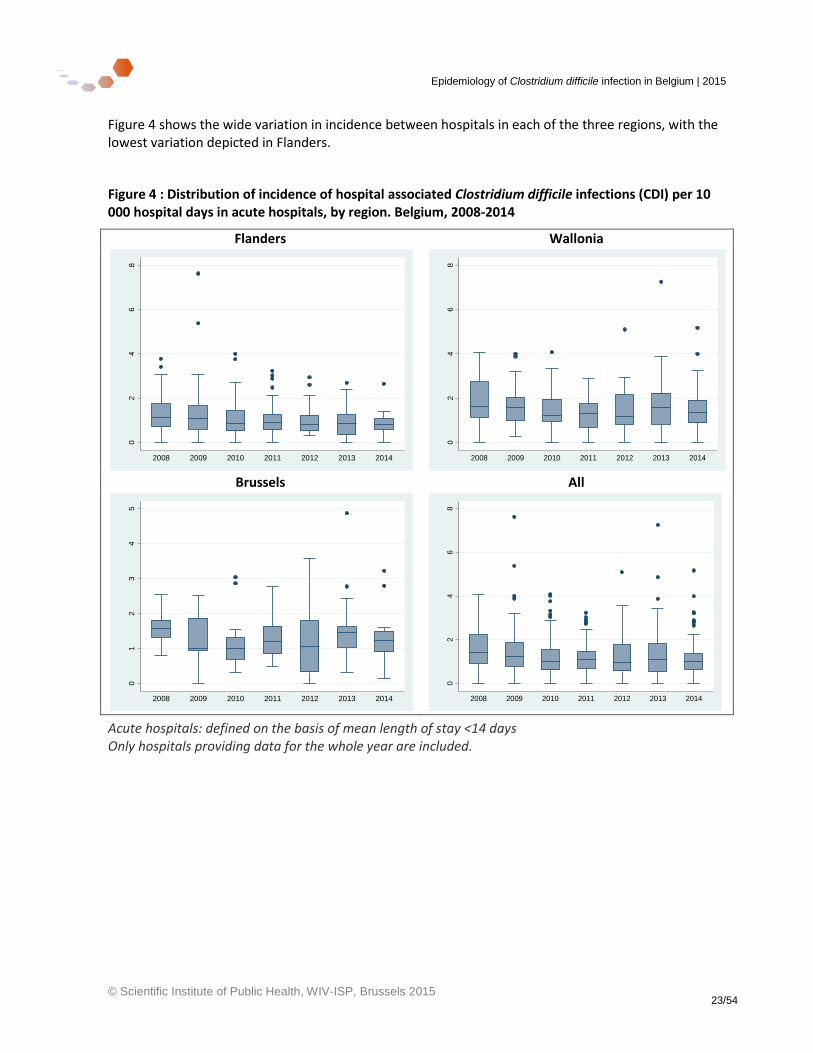
Figure 4 shows the wide variation in incidence between hospitals in each of the three regions, with the lowest variation depicted in Flanders.
Figure 4 : Distribution of incidence of hospital associated Clostridium difficile infections (CDI) per 10 000 hospital days in acute hospitals, by region. Belgium, 2008-2014
Flanders Wallonia
Brussels All
Acute hospitals: defined on the basis of mean length of stay <14 days Only hospitals providing data for the whole year are included.
02
46
8
Ho
spita
l-a
cqu
ire
d C
DI p
er
10
.000
hosp
_d
ays
2008 2009 2010 2011 2012 2013 20140
24
68
Ho
spita
l-a
cqu
ire
d C
DI p
er
10
.000
hosp
_d
ays
2008 2009 2010 2011 2012 2013 2014
01
23
45
Ho
spita
l-a
cqu
ire
d C
DI p
er
10
.000
hosp
_d
ays
2008 2009 2010 2011 2012 2013 2014
02
46
8
Ho
spita
l-a
cqu
ire
d C
DI p
er
10
.000
hosp
_d
ays
2008 2009 2010 2011 2012 2013 2014
Epidemiology of Clostridium difficile infection in Belgium | 2015
© Scientific Institute of Public Health, WIV-ISP, Brussels 2015 24/54
3.1.4 Seasonal variation
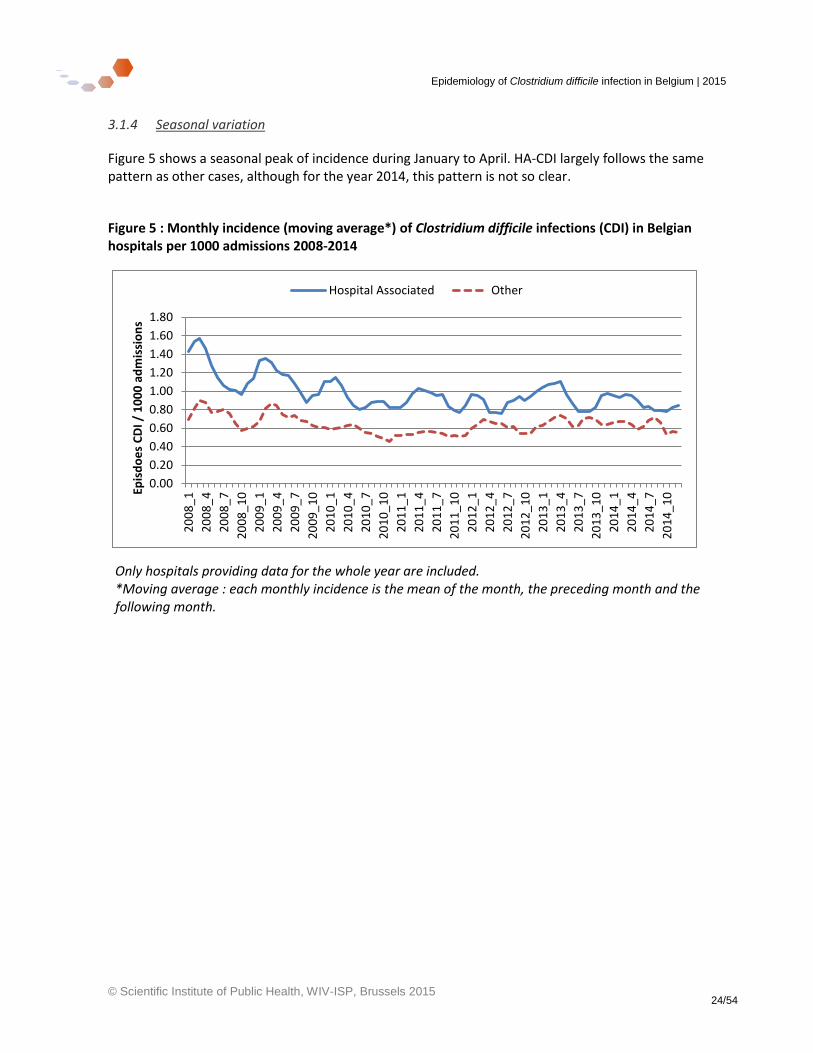
Figure 5 shows a seasonal peak of incidence during January to April. HA-CDI largely follows the same pattern as other cases, although for the year 2014, this pattern is not so clear.
Figure 5 : Monthly incidence (moving average*) of Clostridium difficile infections (CDI) in Belgian hospitals per 1000 admissions 2008-2014
Only hospitals providing data for the whole year are included. *Moving average : each monthly incidence is the mean of the month, the preceding month and the following month.
0.00
0.20
0.40
0.60
0.80
1.00
1.20
1.40
1.60
1.80
20
08
_1
20
08
_4
20
08
_7
20
08
_1
0
20
09
_1
20
09
_4
20
09
_7
20
09
_1
0
20
10
_1
20
10
_4
20
10
_7
20
10
_1
0
20
11
_1
20
11
_4
20
11
_7
20
11
_1
0
20
12
_1
20
12
_4
20
12
_7
20
12
_1
0
20
13
_1
20
13
_4
20
13
_7
20
13
_1
0
20
14
_1
20
14
_4
20
14
_7
20
14
_1
0Epis
do
es
CD
I / 1
00
0 a
dm
issi
on
s
Hospital Associated Other
Epidemiology of Clostridium difficile infection in Belgium | 2015
© Scientific Institute of Public Health, WIV-ISP, Brussels 2015 25/54
3.1.5 Further descriptive epidemiology of cases 2014
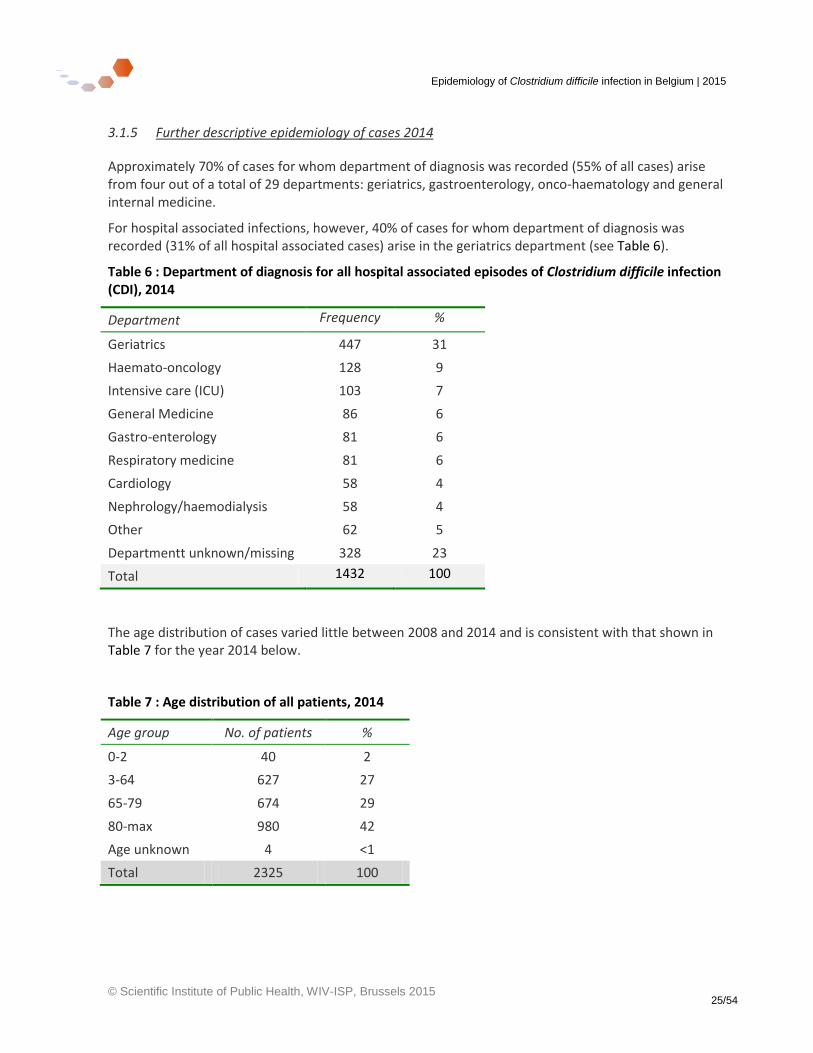
Approximately 70% of cases for whom department of diagnosis was recorded (55% of all cases) arise from four out of a total of 29 departments: geriatrics, gastroenterology, onco-haematology and general internal medicine.
For hospital associated infections, however, 40% of cases for whom department of diagnosis was recorded (31% of all hospital associated cases) arise in the geriatrics department (see Table 6).
Table 6 : Department of diagnosis for all hospital associated episodes of Clostridium difficile infection (CDI), 2014
Department Frequency %
Geriatrics 447 31
Haemato-oncology 128 9
Intensive care (ICU) 103 7
General Medicine 86 6
Gastro-enterology 81 6
Respiratory medicine 81 6
Cardiology 58 4
Nephrology/haemodialysis 58 4
Other 62 5
Departmentt unknown/missing 328 23
Total 1432 100
The age distribution of cases varied little between 2008 and 2014 and is consistent with that shown in Table 7 for the year 2014 below.
Table 7 : Age distribution of all patients, 2014
Age group No. of patients %
0-2 40 2
3-64 627 27
65-79 674 29
80-max 980 42
Age unknown 4 <1
Total 2325 100
Epidemiology of Clostridium difficile infection in Belgium | 2015
© Scientific Institute of Public Health, WIV-ISP, Brussels 2015 26/54
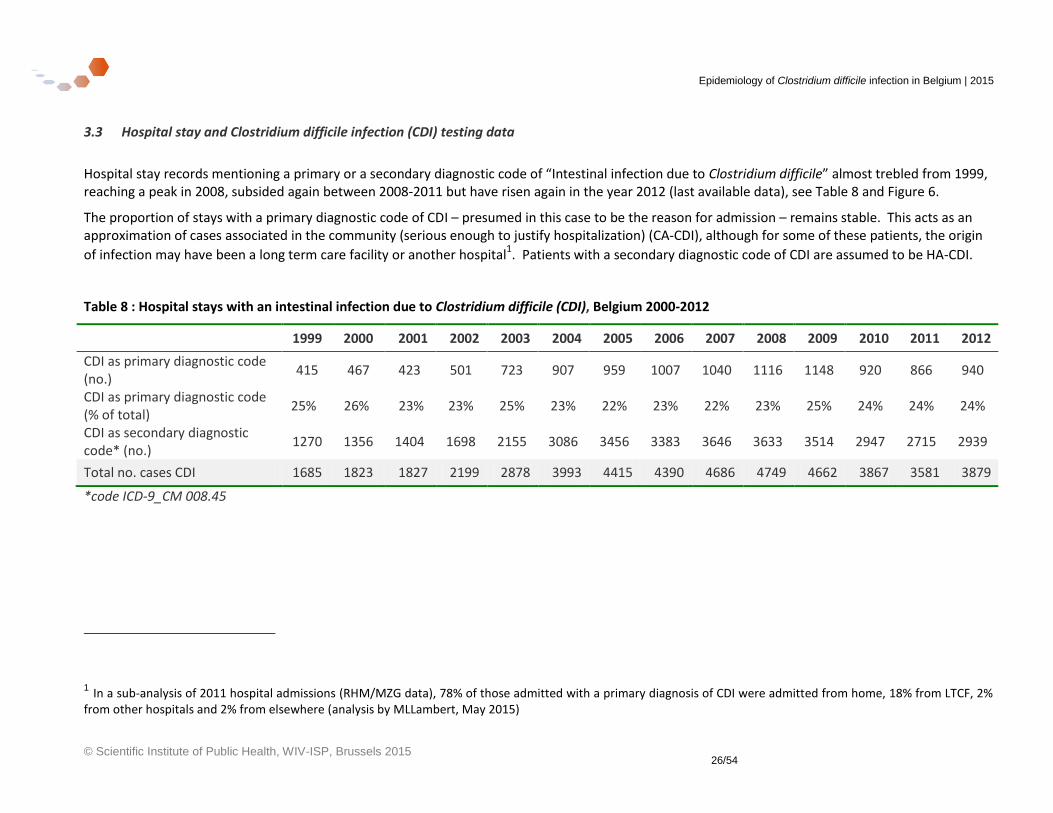
3.3 Hospital stay and Clostridium difficile infection (CDI) testing data
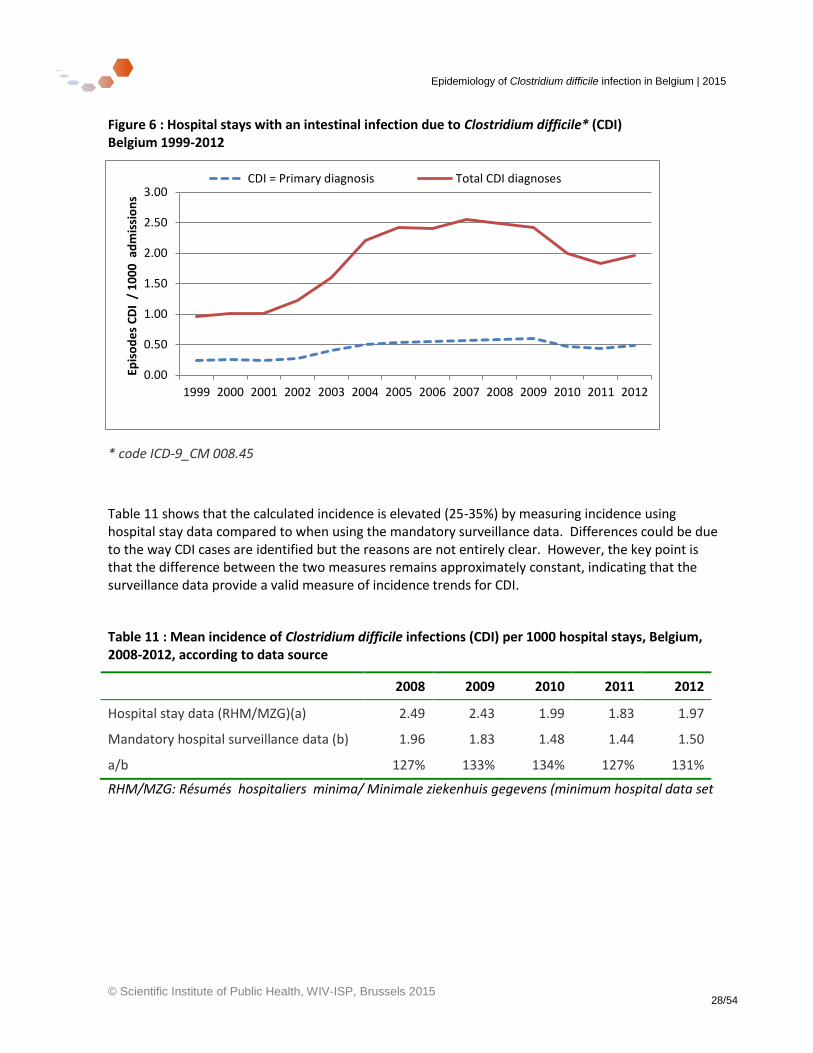
Hospital stay records mentioning a primary or a secondary diagnostic code of “Intestinal infection due to Clostridium difficile” almost trebled from 1999, reaching a peak in 2008, subsided again between 2008-2011 but have risen again in the year 2012 (last available data), see Table 8 and Figure 6.
The proportion of stays with a primary diagnostic code of CDI – presumed in this case to be the reason for admission – remains stable. This acts as an approximation of cases associated in the community (serious enough to justify hospitalization) (CA-CDI), although for some of these patients, the origin
of infection may have been a long term care facility or another hospital1. Patients with a secondary diagnostic code of CDI are assumed to be HA-CDI.
Table 8 : Hospital stays with an intestinal infection due to Clostridium difficile (CDI), Belgium 2000-2012
1999 2000 2001 2002 2003 2004 2005 2006 2007 2008 2009 2010 2011 2012
CDI as primary diagnostic code (no.)
415 467 423 501 723 907 959 1007 1040 1116 1148 920 866 940
CDI as primary diagnostic code (% of total)
25% 26% 23% 23% 25% 23% 22% 23% 22% 23% 25% 24% 24% 24%
CDI as secondary diagnostic code* (no.)
1270 1356 1404 1698 2155 3086 3456 3383 3646 3633 3514 2947 2715 2939
Total no. cases CDI 1685 1823 1827 2199 2878 3993 4415 4390 4686 4749 4662 3867 3581 3879
*code ICD-9_CM 008.45
1 In a sub-analysis of 2011 hospital admissions (RHM/MZG data), 78% of those admitted with a primary diagnosis of CDI were admitted from home, 18% from LTCF, 2% from other hospitals and 2% from elsewhere (analysis by MLLambert, May 2015)
Epidemiology of Clostridium difficile infection in Belgium | 2015
© Scientific Institute of Public Health, WIV-ISP, Brussels 2015 27/54
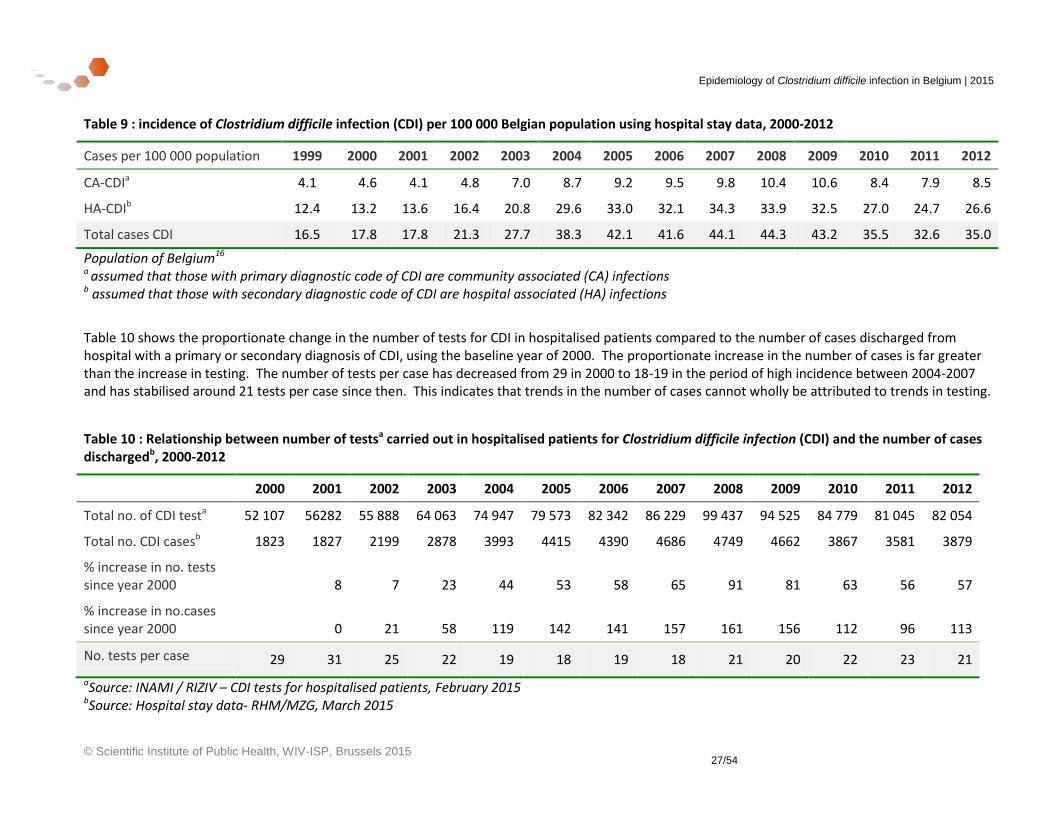
Table 9 : incidence of Clostridium difficile infection (CDI) per 100 000 Belgian population using hospital stay data, 2000-2012
Cases per 100 000 population 1999 2000 2001 2002 2003 2004 2005 2006 2007 2008 2009 2010 2011 2012
CA-CDIa 4.1 4.6 4.1 4.8 7.0 8.7 9.2 9.5 9.8 10.4 10.6 8.4 7.9 8.5
HA-CDIb 12.4 13.2 13.6 16.4 20.8 29.6 33.0 32.1 34.3 33.9 32.5 27.0 24.7 26.6
Total cases CDI 16.5 17.8 17.8 21.3 27.7 38.3 42.1 41.6 44.1 44.3 43.2 35.5 32.6 35.0
Population of Belgium16 a assumed that those with primary diagnostic code of CDI are community associated (CA) infections b assumed that those with secondary diagnostic code of CDI are hospital associated (HA) infections
Table 10 shows the proportionate change in the number of tests for CDI in hospitalised patients compared to the number of cases discharged from hospital with a primary or secondary diagnosis of CDI, using the baseline year of 2000. The proportionate increase in the number of cases is far greater than the increase in testing. The number of tests per case has decreased from 29 in 2000 to 18-19 in the period of high incidence between 2004-2007 and has stabilised around 21 tests per case since then. This indicates that trends in the number of cases cannot wholly be attributed to trends in testing.
Table 10 : Relationship between number of testsa carried out in hospitalised patients for Clostridium difficile infection (CDI) and the number of cases dischargedb, 2000-2012
2000 2001 2002 2003 2004 2005 2006 2007 2008 2009 2010 2011 2012
Total no. of CDI testa 52 107 56282 55 888 64 063 74 947 79 573 82 342 86 229 99 437 94 525 84 779 81 045 82 054
Total no. CDI casesb 1823 1827 2199 2878 3993 4415 4390 4686 4749 4662 3867 3581 3879
% increase in no. tests since year 2000 8 7 23 44 53 58 65 91 81 63 56 57
% increase in no.cases since year 2000 0 21 58 119 142 141 157 161 156 112 96 113
No. tests per case 29 31 25 22 19 18 19 18 21 20 22 23 21
aSource: INAMI / RIZIV – CDI tests for hospitalised patients, February 2015 bSource: Hospital stay data- RHM/MZG, March 2015
Epidemiology of Clostridium difficile infection in Belgium | 2015
© Scientific Institute of Public Health, WIV-ISP, Brussels 2015 28/54
Figure 6 : Hospital stays with an intestinal infection due to Clostridium difficile* (CDI) Belgium 1999-2012
* code ICD-9_CM 008.45
Table 11 shows that the calculated incidence is elevated (25-35%) by measuring incidence using hospital stay data compared to when using the mandatory surveillance data. Differences could be due to the way CDI cases are identified but the reasons are not entirely clear. However, the key point is that the difference between the two measures remains approximately constant, indicating that the surveillance data provide a valid measure of incidence trends for CDI.
Table 11 : Mean incidence of Clostridium difficile infections (CDI) per 1000 hospital stays, Belgium, 2008-2012, according to data source
2008 2009 2010 2011 2012
Hospital stay data (RHM/MZG)(a) 2.49 2.43 1.99 1.83 1.97
Mandatory hospital surveillance data (b) 1.96 1.83 1.48 1.44 1.50
a/b 127% 133% 134% 127% 131%
RHM/MZG: Résumés hospitaliers minima/ Minimale ziekenhuis gegevens (minimum hospital data set
0.00
0.50
1.00
1.50
2.00
2.50
3.00
1999 2000 2001 2002 2003 2004 2005 2006 2007 2008 2009 2010 2011 2012
Epis
od
es
CD
I /
10
00
ad
mis
sio
ns
CDI = Primary diagnosis Total CDI diagnoses
Epidemiology of Clostridium difficile infection in Belgium | 2015
© Scientific Institute of Public Health, WIV-ISP, Brussels 2015 29/54
3.4 Death registration data
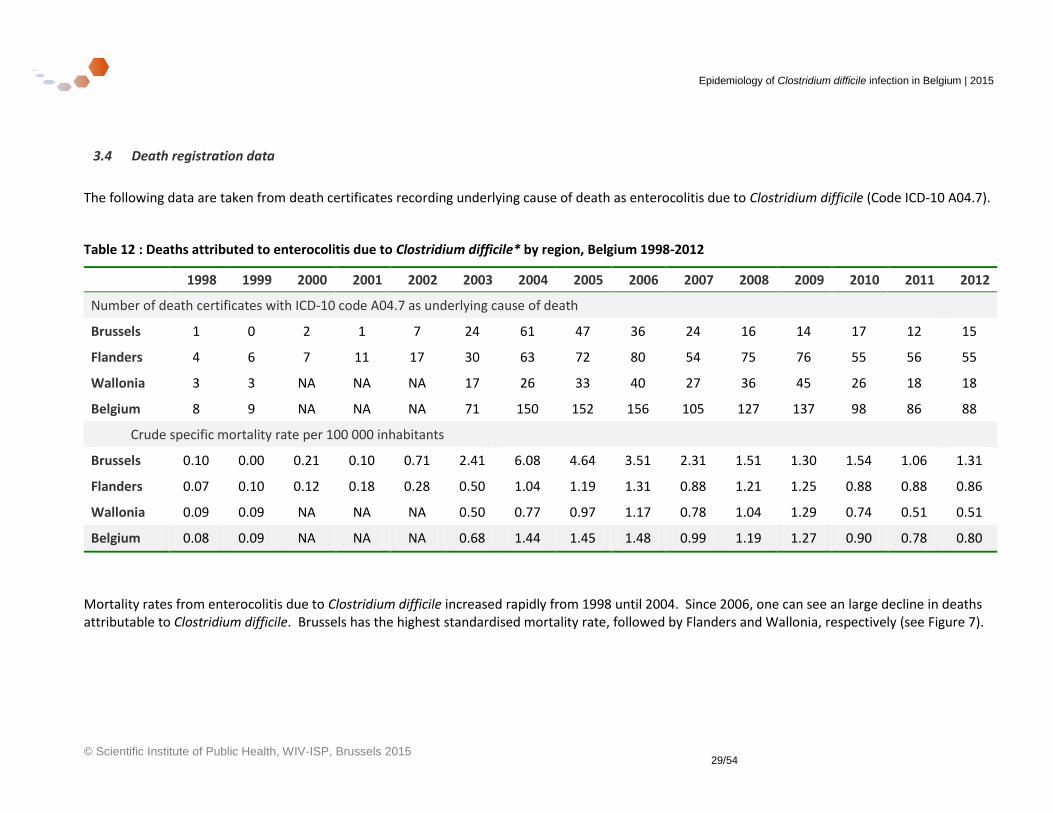
The following data are taken from death certificates recording underlying cause of death as enterocolitis due to Clostridium difficile (Code ICD-10 A04.7).
Table 12 : Deaths attributed to enterocolitis due to Clostridium difficile* by region, Belgium 1998-2012
1998 1999 2000 2001 2002 2003 2004 2005 2006 2007 2008 2009 2010 2011 2012
Number of death certificates with ICD-10 code A04.7 as underlying cause of death
Brussels 1 0 2 1 7 24 61 47 36 24 16 14 17 12 15
Flanders 4 6 7 11 17 30 63 72 80 54 75 76 55 56 55
Wallonia 3 3 NA NA NA 17 26 33 40 27 36 45 26 18 18
Belgium 8 9 NA NA NA 71 150 152 156 105 127 137 98 86 88
Crude specific mortality rate per 100 000 inhabitants
Brussels 0.10 0.00 0.21 0.10 0.71 2.41 6.08 4.64 3.51 2.31 1.51 1.30 1.54 1.06 1.31
Flanders 0.07 0.10 0.12 0.18 0.28 0.50 1.04 1.19 1.31 0.88 1.21 1.25 0.88 0.88 0.86
Wallonia 0.09 0.09 NA NA NA 0.50 0.77 0.97 1.17 0.78 1.04 1.29 0.74 0.51 0.51
Belgium 0.08 0.09 NA NA NA 0.68 1.44 1.45 1.48 0.99 1.19 1.27 0.90 0.78 0.80
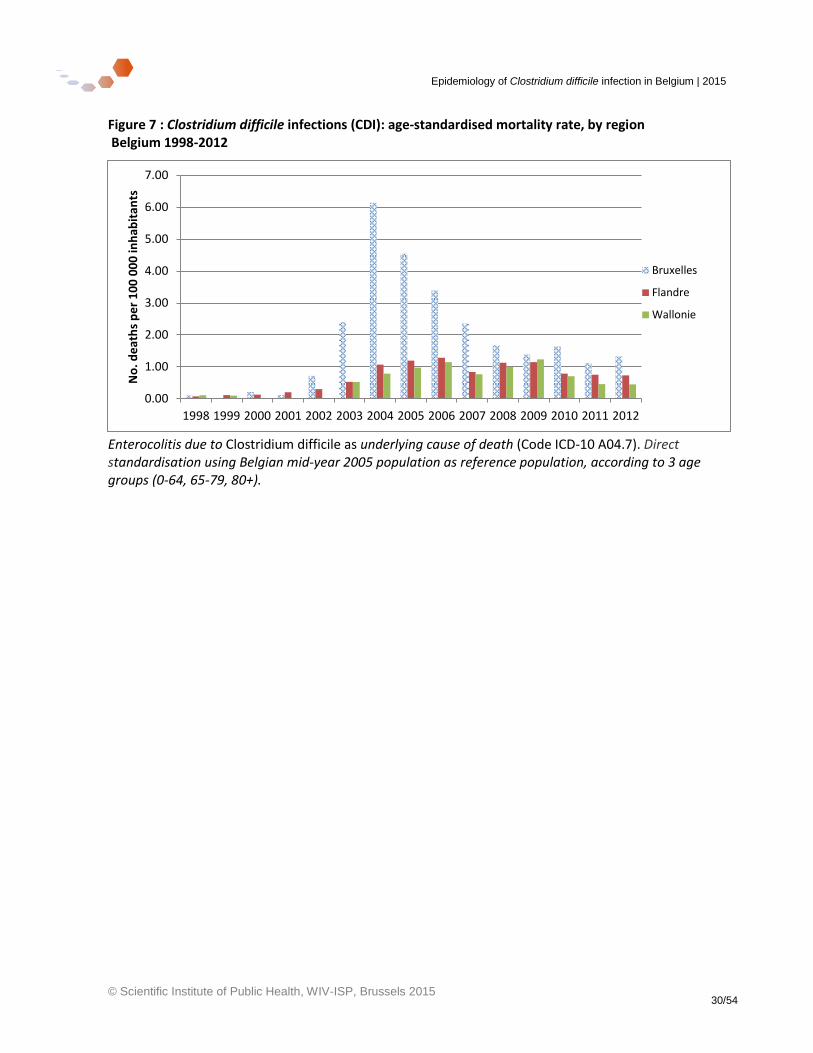
Mortality rates from enterocolitis due to Clostridium difficile increased rapidly from 1998 until 2004. Since 2006, one can see an large decline in deaths attributable to Clostridium difficile. Brussels has the highest standardised mortality rate, followed by Flanders and Wallonia, respectively (see Figure 7).
Epidemiology of Clostridium difficile infection in Belgium | 2015
© Scientific Institute of Public Health, WIV-ISP, Brussels 2015 30/54
Figure 7 : Clostridium difficile infections (CDI): age-standardised mortality rate, by region Belgium 1998-2012
Enterocolitis due to Clostridium difficile as underlying cause of death (Code ICD-10 A04.7). Direct standardisation using Belgian mid-year 2005 population as reference population, according to 3 age groups (0-64, 65-79, 80+).
0.00
1.00
2.00
3.00
4.00
5.00
6.00
7.00
1998 1999 2000 2001 2002 2003 2004 2005 2006 2007 2008 2009 2010 2011 2012
No
. de
ath
s p
er
10
0 0
00
inh
abit
ants
Bruxelles
Flandre
Wallonie
Epidemiology of Clostridium difficile infection in Belgium | 2015
© Scientific Institute of Public Health, WIV-ISP, Brussels 2015 31/54
3.5 Microbiological surveillance – National Laboratory Reference Centre (NRC-CD) data
3.5.1 Participation
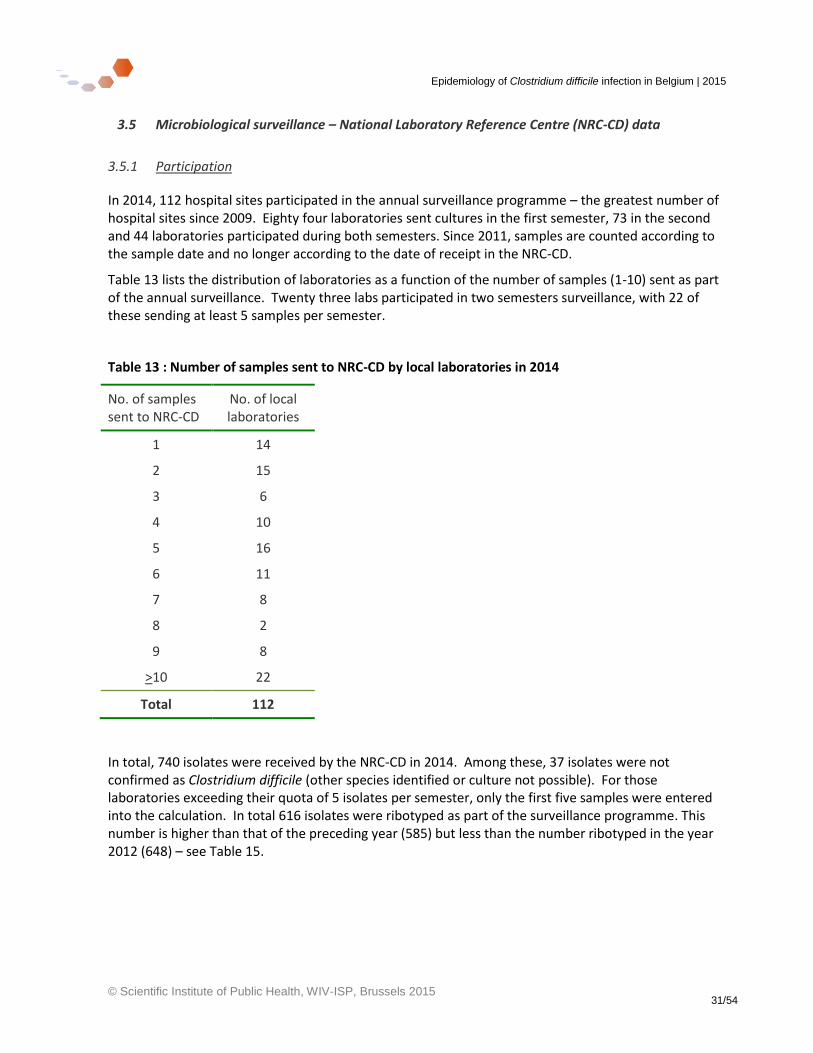
In 2014, 112 hospital sites participated in the annual surveillance programme – the greatest number of hospital sites since 2009. Eighty four laboratories sent cultures in the first semester, 73 in the second and 44 laboratories participated during both semesters. Since 2011, samples are counted according to the sample date and no longer according to the date of receipt in the NRC-CD.
Table 13 lists the distribution of laboratories as a function of the number of samples (1-10) sent as part of the annual surveillance. Twenty three labs participated in two semesters surveillance, with 22 of these sending at least 5 samples per semester.
Table 13 : Number of samples sent to NRC-CD by local laboratories in 2014
No. of samples sent to NRC-CD
No. of local laboratories
1 14
2 15
3 6
4 10
5 16
6 11
7 8
8 2
9 8
>10 22
Total 112
In total, 740 isolates were received by the NRC-CD in 2014. Among these, 37 isolates were not confirmed as Clostridium difficile (other species identified or culture not possible). For those laboratories exceeding their quota of 5 isolates per semester, only the first five samples were entered into the calculation. In total 616 isolates were ribotyped as part of the surveillance programme. This number is higher than that of the preceding year (585) but less than the number ribotyped in the year 2012 (648) – see Table 15.
Epidemiology of Clostridium difficile infection in Belgium | 2015
© Scientific Institute of Public Health, WIV-ISP, Brussels 2015 32/54
3.5.1 Ribotype distribution
Ribotyping of these 616 isolates in 2014 resulted in the identification of 121 different ribotypes of which 66 were only encountered a single time, 14 twice and 10 three times.
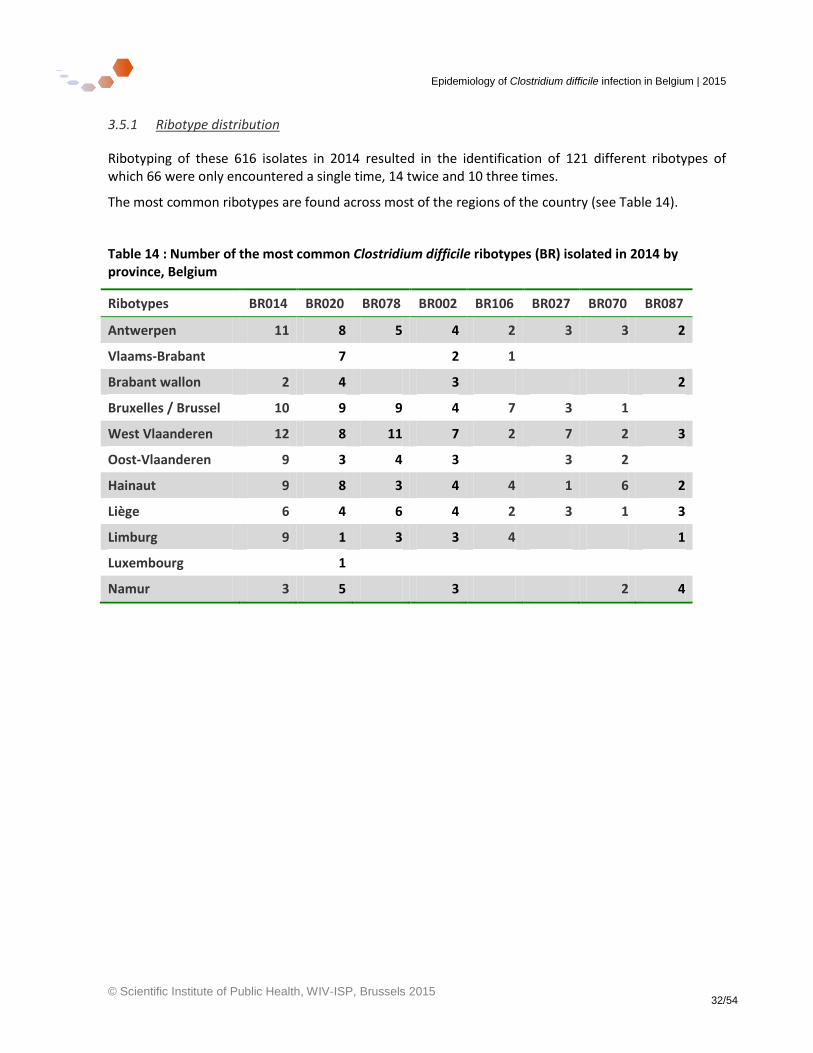
The most common ribotypes are found across most of the regions of the country (see Table 14).
Table 14 : Number of the most common Clostridium difficile ribotypes (BR) isolated in 2014 by province, Belgium
Ribotypes BR014 BR020 BR078 BR002 BR106 BR027 BR070 BR087
Antwerpen 11 8 5 4 2 3 3 2
Vlaams-Brabant 7 2 1
Brabant wallon 2 4 3 2
Bruxelles / Brussel 10 9 9 4 7 3 1
West Vlaanderen 12 8 11 7 2 7 2 3
Oost-Vlaanderen 9 3 4 3 3 2
Hainaut 9 8 3 4 4 1 6 2
Liège 6 4 6 4 2 3 1 3
Limburg 9 1 3 3 4 1
Luxembourg 1
Namur 3 5 3 2 4
Epidemiology of Clostridium difficile infection in Belgium | 2015
© Scientific Institute of Public Health, WIV-ISP, Brussels 2015 33/54
3.5.1 Trends in ribotype prevalence
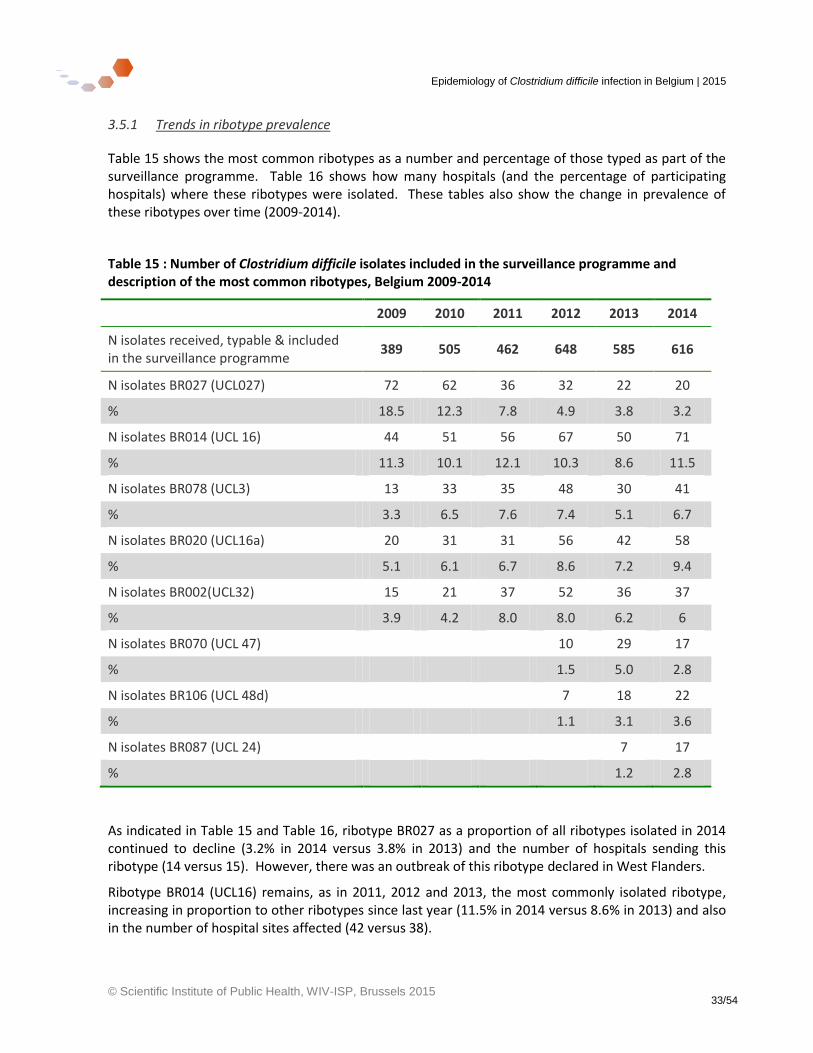
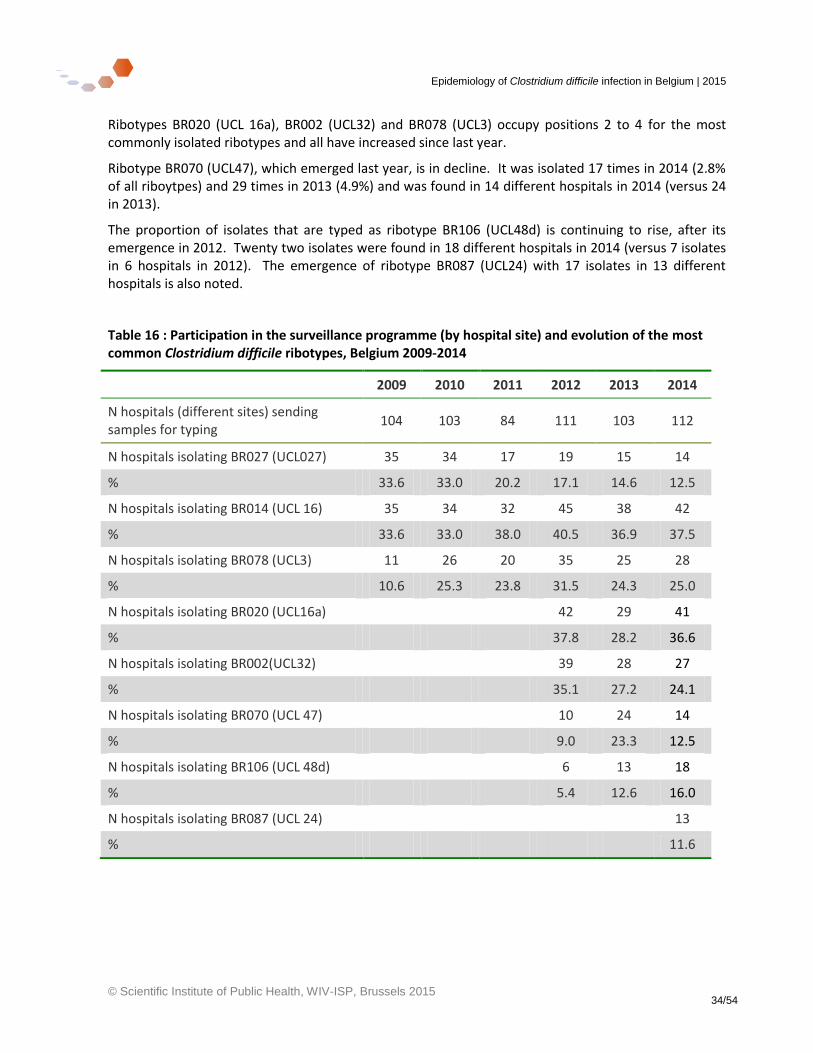
Table 15 shows the most common ribotypes as a number and percentage of those typed as part of the surveillance programme. Table 16 shows how many hospitals (and the percentage of participating hospitals) where these ribotypes were isolated. These tables also show the change in prevalence of these ribotypes over time (2009-2014).
Table 15 : Number of Clostridium difficile isolates included in the surveillance programme and description of the most common ribotypes, Belgium 2009-2014
2009 2010 2011 2012 2013 2014
N isolates received, typable & included in the surveillance programme
389 505 462 648 585 616
N isolates BR027 (UCL027) 72 62 36 32 22 20
% 18.5 12.3 7.8 4.9 3.8 3.2
N isolates BR014 (UCL 16) 44 51 56 67 50 71
% 11.3 10.1 12.1 10.3 8.6 11.5
N isolates BR078 (UCL3) 13 33 35 48 30 41
% 3.3 6.5 7.6 7.4 5.1 6.7
N isolates BR020 (UCL16a) 20 31 31 56 42 58
% 5.1 6.1 6.7 8.6 7.2 9.4
N isolates BR002(UCL32) 15 21 37 52 36 37
% 3.9 4.2 8.0 8.0 6.2 6
N isolates BR070 (UCL 47) 10 29 17
% 1.5 5.0 2.8
N isolates BR106 (UCL 48d) 7 18 22
% 1.1 3.1 3.6
N isolates BR087 (UCL 24) 7 17
% 1.2 2.8
As indicated in Table 15 and Table 16, ribotype BR027 as a proportion of all ribotypes isolated in 2014 continued to decline (3.2% in 2014 versus 3.8% in 2013) and the number of hospitals sending this ribotype (14 versus 15). However, there was an outbreak of this ribotype declared in West Flanders.
Ribotype BR014 (UCL16) remains, as in 2011, 2012 and 2013, the most commonly isolated ribotype, increasing in proportion to other ribotypes since last year (11.5% in 2014 versus 8.6% in 2013) and also in the number of hospital sites affected (42 versus 38).
Epidemiology of Clostridium difficile infection in Belgium | 2015
© Scientific Institute of Public Health, WIV-ISP, Brussels 2015 34/54
Ribotypes BR020 (UCL 16a), BR002 (UCL32) and BR078 (UCL3) occupy positions 2 to 4 for the most commonly isolated ribotypes and all have increased since last year.
Ribotype BR070 (UCL47), which emerged last year, is in decline. It was isolated 17 times in 2014 (2.8% of all riboytpes) and 29 times in 2013 (4.9%) and was found in 14 different hospitals in 2014 (versus 24 in 2013).
The proportion of isolates that are typed as ribotype BR106 (UCL48d) is continuing to rise, after its emergence in 2012. Twenty two isolates were found in 18 different hospitals in 2014 (versus 7 isolates in 6 hospitals in 2012). The emergence of ribotype BR087 (UCL24) with 17 isolates in 13 different hospitals is also noted.
Table 16 : Participation in the surveillance programme (by hospital site) and evolution of the most common Clostridium difficile ribotypes, Belgium 2009-2014
2009 2010 2011 2012 2013 2014
N hospitals (different sites) sending samples for typing
104 103 84 111 103 112
N hospitals isolating BR027 (UCL027) 35 34 17 19 15 14
% 33.6 33.0 20.2 17.1 14.6 12.5
N hospitals isolating BR014 (UCL 16) 35 34 32 45 38 42
% 33.6 33.0 38.0 40.5 36.9 37.5
N hospitals isolating BR078 (UCL3) 11 26 20 35 25 28
% 10.6 25.3 23.8 31.5 24.3 25.0
N hospitals isolating BR020 (UCL16a) 42 29 41
% 37.8 28.2 36.6
N hospitals isolating BR002(UCL32) 39 28 27
% 35.1 27.2 24.1
N hospitals isolating BR070 (UCL 47) 10 24 14
% 9.0 23.3 12.5
N hospitals isolating BR106 (UCL 48d) 6 13 18
% 5.4 12.6 16.0
N hospitals isolating BR087 (UCL 24) 13
% 11.6
Epidemiology of Clostridium difficile infection in Belgium | 2015
© Scientific Institute of Public Health, WIV-ISP, Brussels 2015 35/54
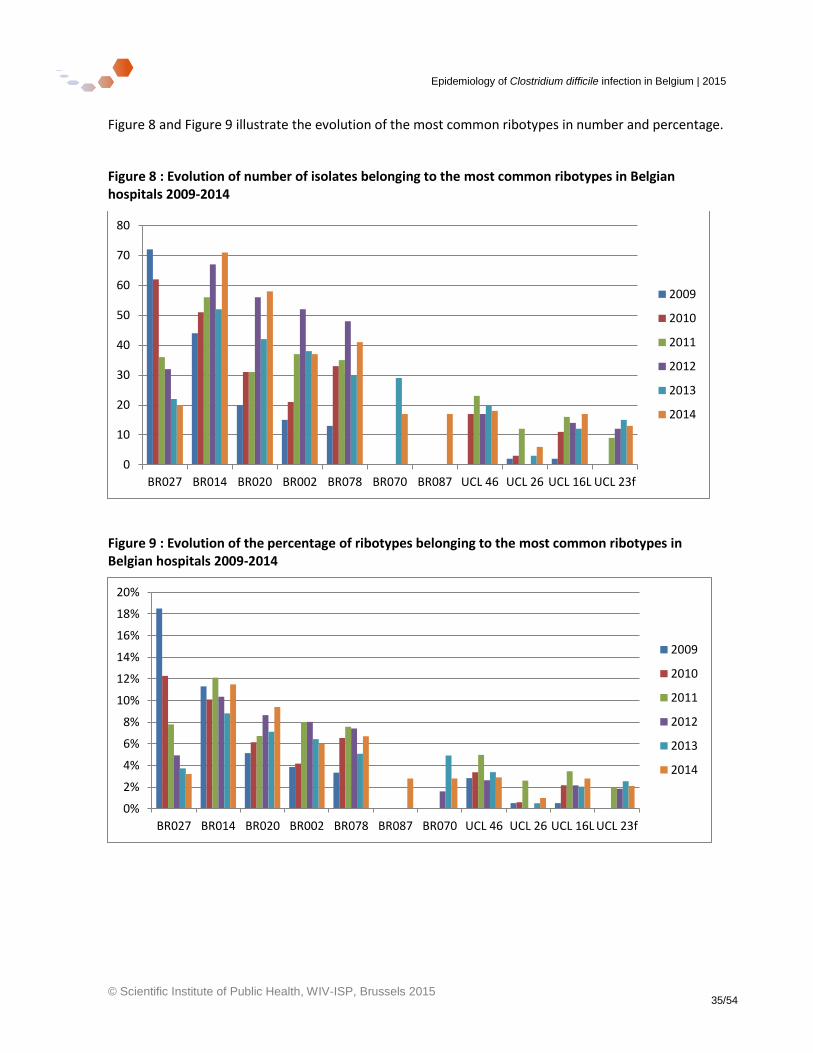
Figure 8 and Figure 9 illustrate the evolution of the most common ribotypes in number and percentage.
Figure 8 : Evolution of number of isolates belonging to the most common ribotypes in Belgian hospitals 2009-2014
Figure 9 : Evolution of the percentage of ribotypes belonging to the most common ribotypes in Belgian hospitals 2009-2014
0
10
20
30
40
50
60
70
80
BR027 BR014 BR020 BR002 BR078 BR070 BR087 UCL 46 UCL 26 UCL 16L UCL 23f
2009
2010
2011
2012
2013
2014
0%
2%
4%
6%
8%
10%
12%
14%
16%
18%
20%
BR027 BR014 BR020 BR002 BR078 BR087 BR070 UCL 46 UCL 26 UCL 16L UCL 23f
2009
2010
2011
2012
2013
2014
Epidemiology of Clostridium difficile infection in Belgium | 2015
© Scientific Institute of Public Health, WIV-ISP, Brussels 2015 36/54
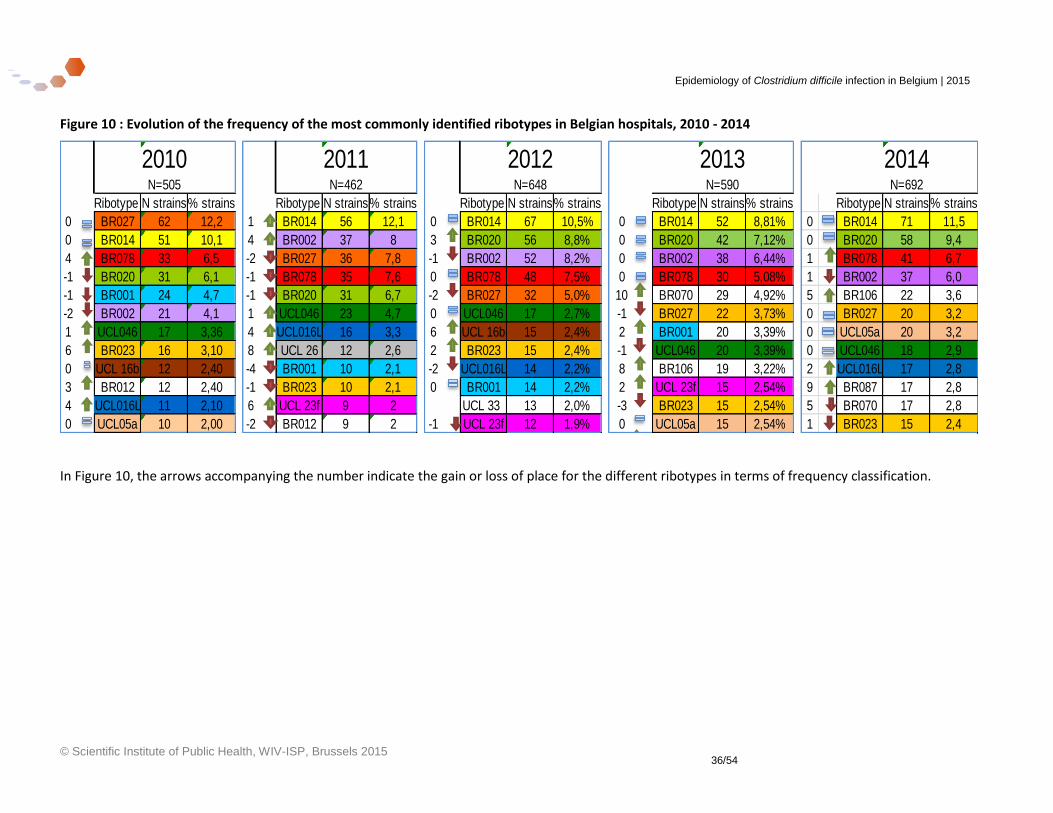
Figure 10 : Evolution of the frequency of the most commonly identified ribotypes in Belgian hospitals, 2010 - 2014
In Figure 10, the arrows accompanying the number indicate the gain or loss of place for the different ribotypes in terms of frequency classification.
2010 2011 2012 2013 2014 N=505 N=462 N=648 N=590 N=692
Ribotype N strains% strains Ribotype N strains% strains Ribotype N strains% strains Ribotype N strains% strains Ribotype N strains% strains
0 BR027 62 12,2 1 BR014 56 12,1 0 BR014 67 10,5% 0 BR014 52 8,81% 0 BR014 71 11,5
0 BR014 51 10,1 4 BR002 37 8 3 BR020 56 8,8% 0 BR020 42 7,12% 0 BR020 58 9,4
4 BR078 33 6,5 -2 BR027 36 7,8 -1 BR002 52 8,2% 0 BR002 38 6,44% 1 BR078 41 6,7
-1 BR020 31 6,1 -1 BR078 35 7,6 0 BR078 48 7,5% 0 BR078 30 5,08% 1 BR002 37 6,0
-1 BR001 24 4,7 -1 BR020 31 6,7 -2 BR027 32 5,0% 10 BR070 29 4,92% 5 BR106 22 3,6
-2 BR002 21 4,1 1 UCL046 23 4,7 0 UCL046 17 2,7% -1 BR027 22 3,73% 0 BR027 20 3,2
1 UCL046 17 3,36 4 UCL016L 16 3,3 6 UCL 16b 15 2,4% 2 BR001 20 3,39% 0 UCL05a 20 3,2
6 BR023 16 3,10 8 UCL 26 12 2,6 2 BR023 15 2,4% -1 UCL046 20 3,39% 0 UCL046 18 2,9
0 UCL 16b 12 2,40 -4 BR001 10 2,1 -2 UCL016L 14 2,2% 8 BR106 19 3,22% 2 UCL016L 17 2,8
3 BR012 12 2,40 -1 BR023 10 2,1 0 BR001 14 2,2% 2 UCL 23f 15 2,54% 9 BR087 17 2,8
4 UCL016L 11 2,10 6 UCL 23f 9 2 UCL 33 13 2,0% -3 BR023 15 2,54% 5 BR070 17 2,8
0 UCL05a 10 2,00 -2 BR012 9 2 -1 UCL 23f 12 1,9% 0 UCL05a 15 2,54% 1 BR023 15 2,4
Epidemiology of Clostridium difficile infection in Belgium | 2015
© Scientific Institute of Public Health, WIV-ISP, Brussels 2015 37/54
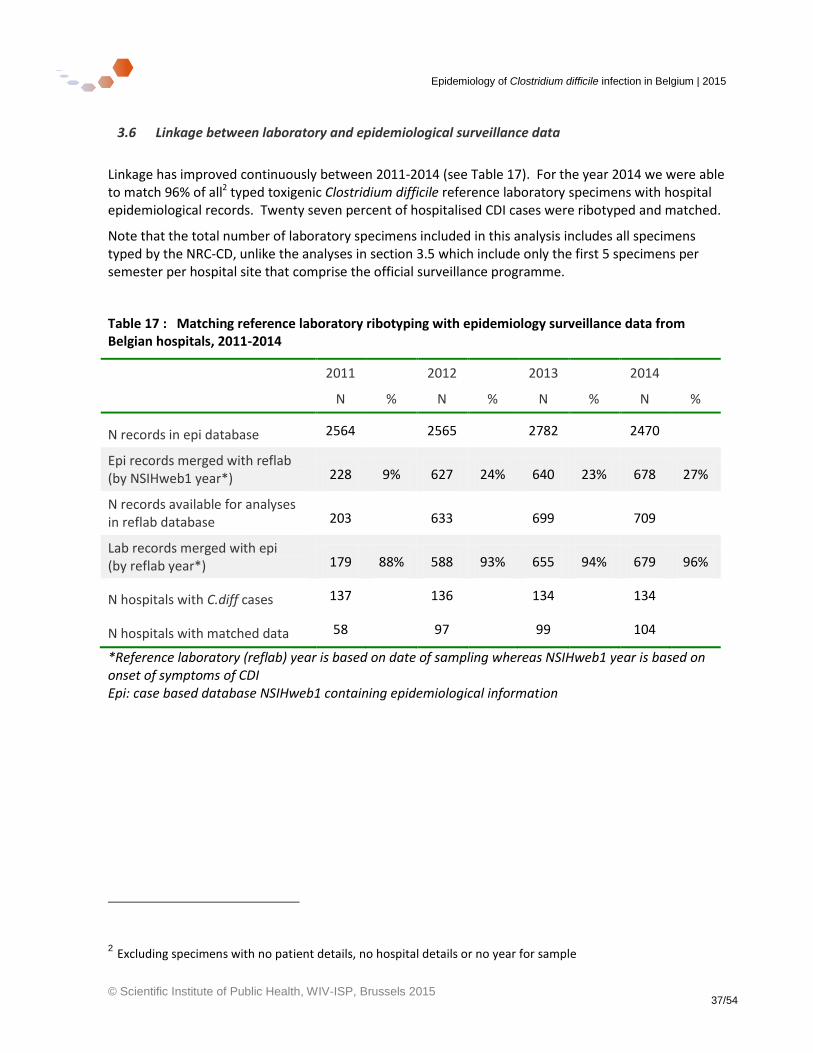
3.6 Linkage between laboratory and epidemiological surveillance data
Linkage has improved continuously between 2011-2014 (see Table 17). For the year 2014 we were able to match 96% of all2 typed toxigenic Clostridium difficile reference laboratory specimens with hospital epidemiological records. Twenty seven percent of hospitalised CDI cases were ribotyped and matched.
Note that the total number of laboratory specimens included in this analysis includes all specimens typed by the NRC-CD, unlike the analyses in section 3.5 which include only the first 5 specimens per semester per hospital site that comprise the official surveillance programme.
Table 17 : Matching reference laboratory ribotyping with epidemiology surveillance data from Belgian hospitals, 2011-2014
2011 2012 2013 2014
N % N % N % N %
N records in epi database 2564 2565 2782 2470
Epi records merged with reflab (by NSIHweb1 year*) 228 9% 627 24% 640 23% 678 27%
N records available for analyses in reflab database 203 633 699 709
Lab records merged with epi (by reflab year*) 179 88% 588 93% 655 94% 679 96%
N hospitals with C.diff cases 137 136 134 134
N hospitals with matched data 58 97 99 104
*Reference laboratory (reflab) year is based on date of sampling whereas NSIHweb1 year is based on onset of symptoms of CDI Epi: case based database NSIHweb1 containing epidemiological information
2 Excluding specimens with no patient details, no hospital details or no year for sample
Epidemiology of Clostridium difficile infection in Belgium | 2015
© Scientific Institute of Public Health, WIV-ISP, Brussels 2015 38/54
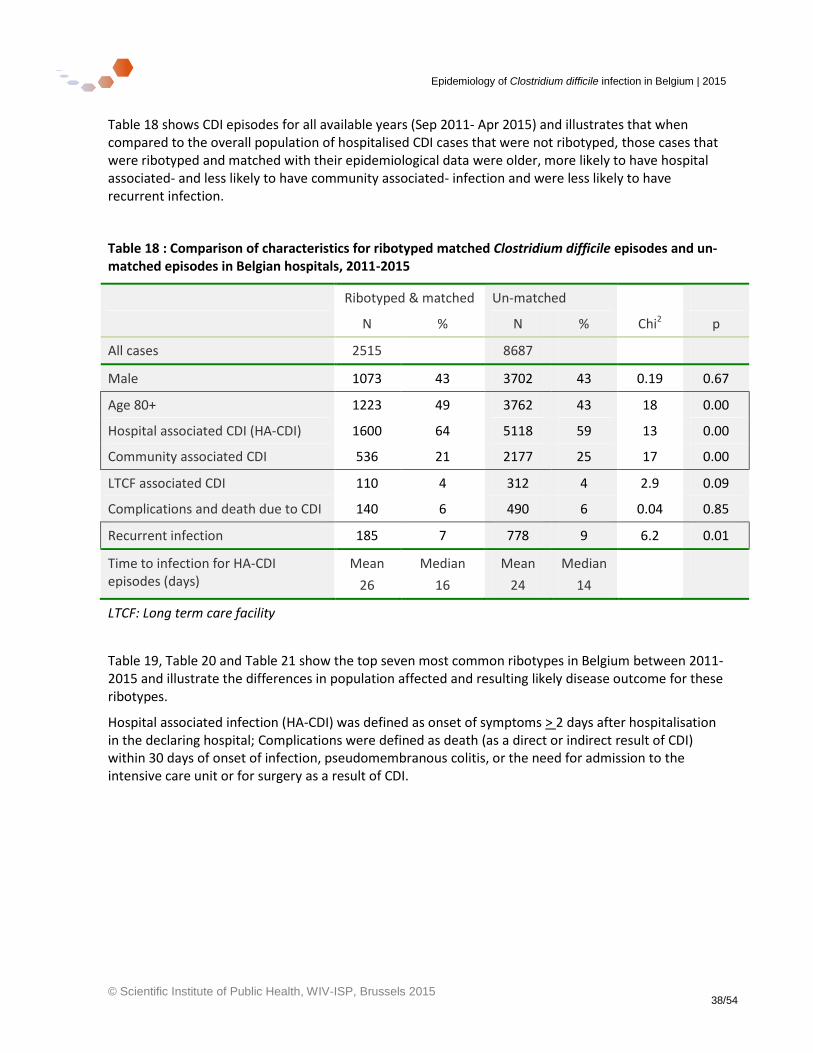
Table 18 shows CDI episodes for all available years (Sep 2011- Apr 2015) and illustrates that when compared to the overall population of hospitalised CDI cases that were not ribotyped, those cases that were ribotyped and matched with their epidemiological data were older, more likely to have hospital associated- and less likely to have community associated- infection and were less likely to have recurrent infection.
Table 18 : Comparison of characteristics for ribotyped matched Clostridium difficile episodes and un-matched episodes in Belgian hospitals, 2011-2015
Ribotyped & matched Un-matched
N % N % Chi2 p
All cases 2515 8687
Male 1073 43 3702 43 0.19 0.67
Age 80+ 1223 49 3762 43 18 0.00
Hospital associated CDI (HA-CDI) 1600 64 5118 59 13 0.00
Community associated CDI 536 21 2177 25 17 0.00
LTCF associated CDI 110 4 312 4 2.9 0.09
Complications and death due to CDI 140 6 490 6 0.04 0.85
Recurrent infection 185 7 778 9 6.2 0.01
Time to infection for HA-CDI episodes (days)
Mean
26
Median
16
Mean
24
Median
14
LTCF: Long term care facility
Table 19, Table 20 and Table 21 show the top seven most common ribotypes in Belgium between 2011- 2015 and illustrate the differences in population affected and resulting likely disease outcome for these ribotypes.
Hospital associated infection (HA-CDI) was defined as onset of symptoms > 2 days after hospitalisation in the declaring hospital; Complications were defined as death (as a direct or indirect result of CDI) within 30 days of onset of infection, pseudomembranous colitis, or the need for admission to the intensive care unit or for surgery as a result of CDI.
Epidemiology of Clostridium difficile infection in Belgium | 2015
© Scientific Institute of Public Health, WIV-ISP, Brussels 2015 39/54
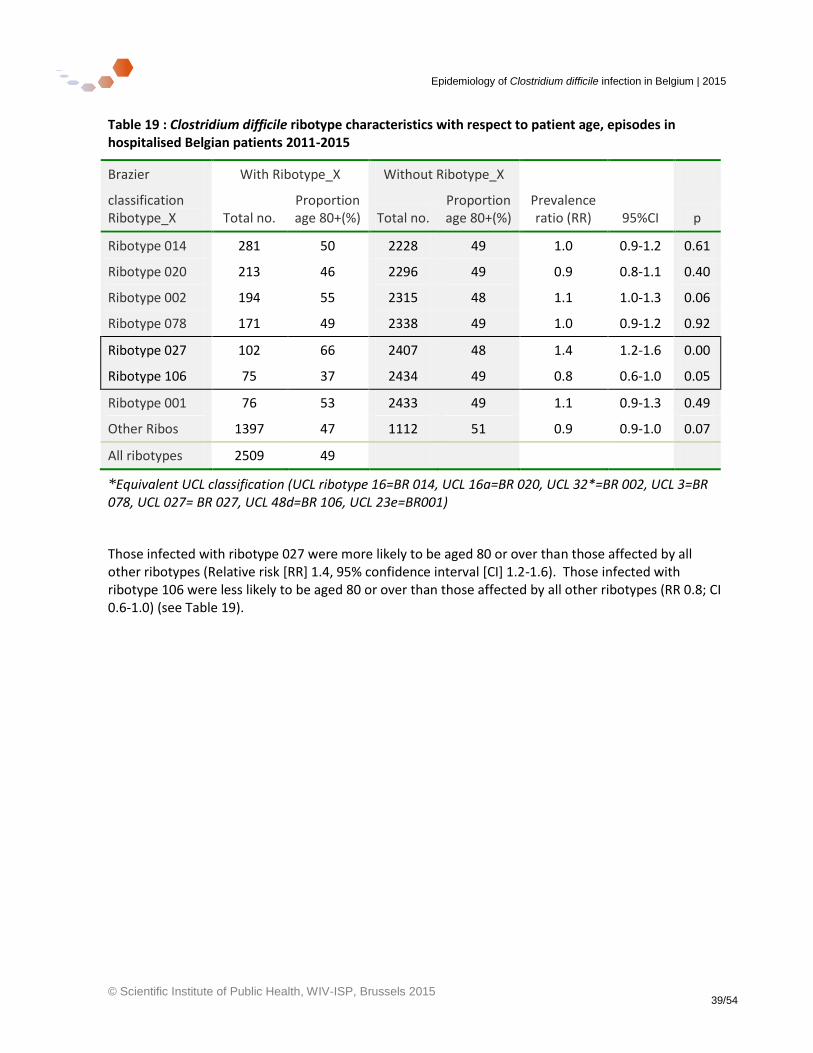
Table 19 : Clostridium difficile ribotype characteristics with respect to patient age, episodes in hospitalised Belgian patients 2011-2015
Brazier With Ribotype_X Without Ribotype_X
classification Ribotype_X Total no.
Proportion age 80+(%) Total no.
Proportion age 80+(%)
Prevalence ratio (RR) 95%CI p
Ribotype 014 281 50 2228 49 1.0 0.9-1.2 0.61
Ribotype 020 213 46 2296 49 0.9 0.8-1.1 0.40
Ribotype 002 194 55 2315 48 1.1 1.0-1.3 0.06
Ribotype 078 171 49 2338 49 1.0 0.9-1.2 0.92
Ribotype 027 102 66 2407 48 1.4 1.2-1.6 0.00
Ribotype 106 75 37 2434 49 0.8 0.6-1.0 0.05
Ribotype 001 76 53 2433 49 1.1 0.9-1.3 0.49
Other Ribos 1397 47 1112 51 0.9 0.9-1.0 0.07
All ribotypes 2509 49
*Equivalent UCL classification (UCL ribotype 16=BR 014, UCL 16a=BR 020, UCL 32*=BR 002, UCL 3=BR 078, UCL 027= BR 027, UCL 48d=BR 106, UCL 23e=BR001)
Those infected with ribotype 027 were more likely to be aged 80 or over than those affected by all other ribotypes (Relative risk [RR] 1.4, 95% confidence interval [CI] 1.2-1.6). Those infected with ribotype 106 were less likely to be aged 80 or over than those affected by all other ribotypes (RR 0.8; CI 0.6-1.0) (see Table 19).
Epidemiology of Clostridium difficile infection in Belgium | 2015
© Scientific Institute of Public Health, WIV-ISP, Brussels 2015 40/54
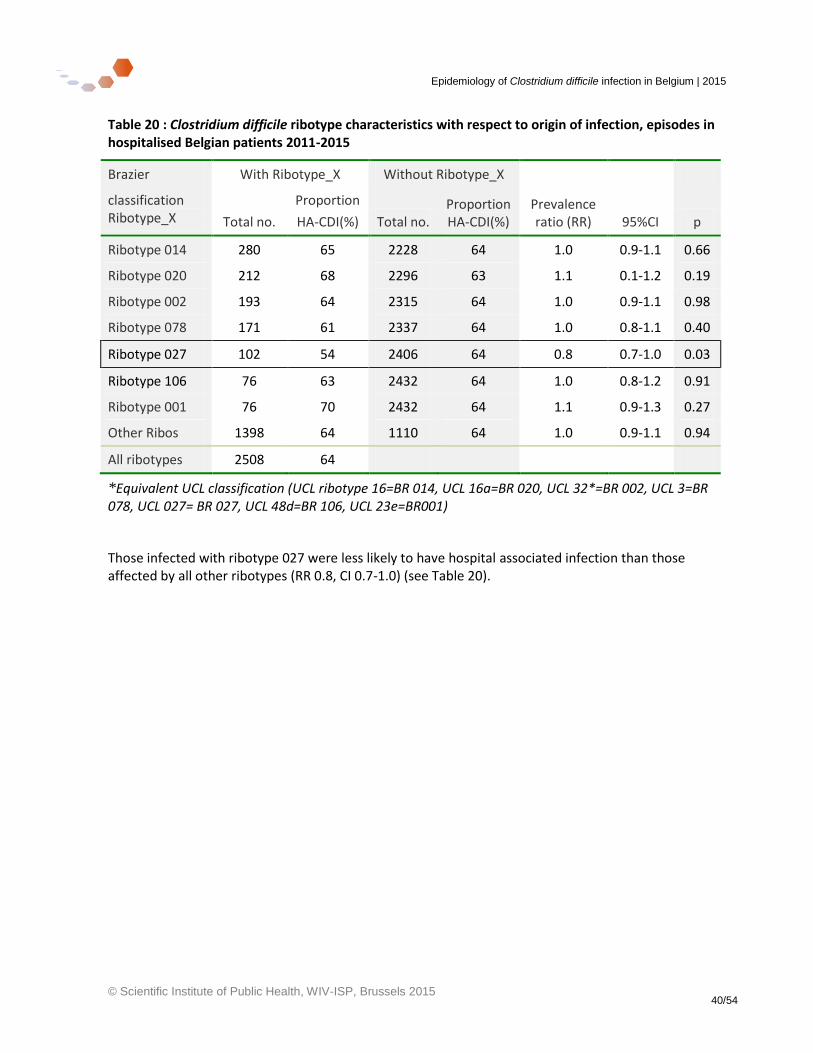
Table 20 : Clostridium difficile ribotype characteristics with respect to origin of infection, episodes in hospitalised Belgian patients 2011-2015
Brazier With Ribotype_X Without Ribotype_X
classification Ribotype_X Total no.
Proportion
HA-CDI(%) Total no. Proportion HA-CDI(%)
Prevalence ratio (RR) 95%CI p
Ribotype 014 280 65 2228 64 1.0 0.9-1.1 0.66
Ribotype 020 212 68 2296 63 1.1 0.1-1.2 0.19
Ribotype 002 193 64 2315 64 1.0 0.9-1.1 0.98
Ribotype 078 171 61 2337 64 1.0 0.8-1.1 0.40
Ribotype 027 102 54 2406 64 0.8 0.7-1.0 0.03
Ribotype 106 76 63 2432 64 1.0 0.8-1.2 0.91
Ribotype 001 76 70 2432 64 1.1 0.9-1.3 0.27
Other Ribos 1398 64 1110 64 1.0 0.9-1.1 0.94
All ribotypes 2508 64
*Equivalent UCL classification (UCL ribotype 16=BR 014, UCL 16a=BR 020, UCL 32*=BR 002, UCL 3=BR 078, UCL 027= BR 027, UCL 48d=BR 106, UCL 23e=BR001)
Those infected with ribotype 027 were less likely to have hospital associated infection than those affected by all other ribotypes (RR 0.8, CI 0.7-1.0) (see Table 20).
Epidemiology of Clostridium difficile infection in Belgium | 2015
© Scientific Institute of Public Health, WIV-ISP, Brussels 2015 41/54
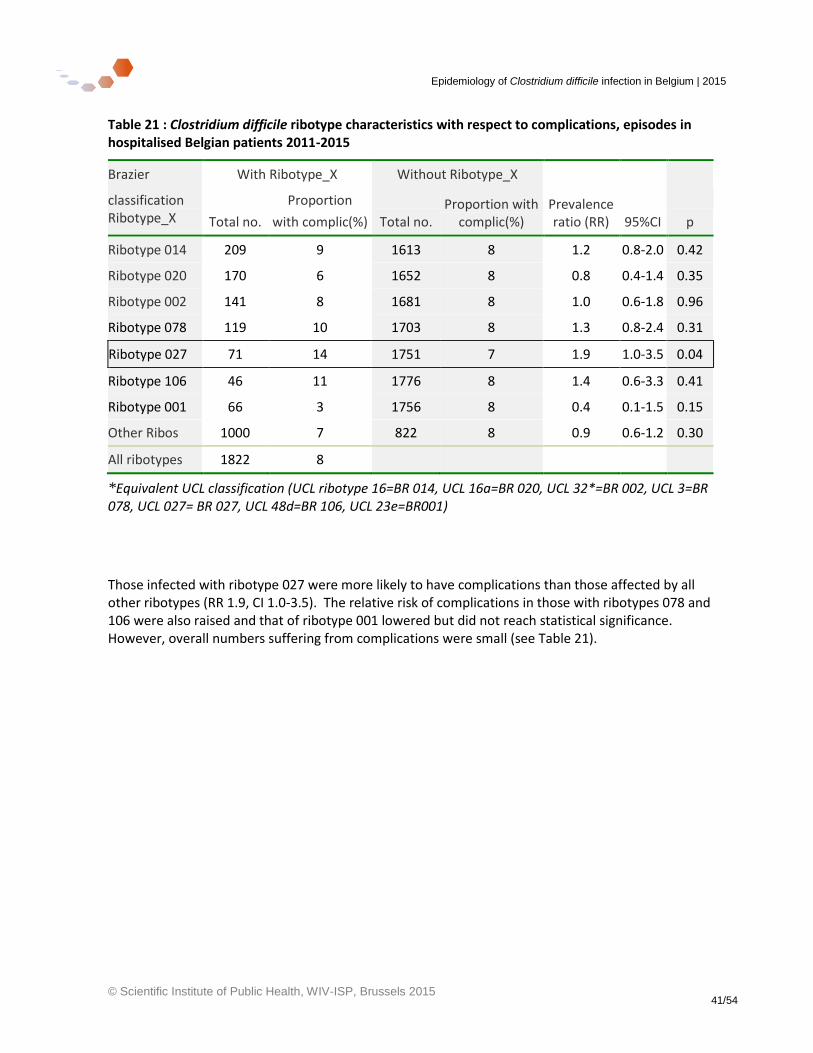
Table 21 : Clostridium difficile ribotype characteristics with respect to complications, episodes in hospitalised Belgian patients 2011-2015
Brazier With Ribotype_X Without Ribotype_X
classification Ribotype_X Total no.
Proportion
with complic(%) Total no. Proportion with
complic(%) Prevalence ratio (RR) 95%CI p
Ribotype 014 209 9 1613 8 1.2 0.8-2.0 0.42
Ribotype 020 170 6 1652 8 0.8 0.4-1.4 0.35
Ribotype 002 141 8 1681 8 1.0 0.6-1.8 0.96
Ribotype 078 119 10 1703 8 1.3 0.8-2.4 0.31
Ribotype 027 71 14 1751 7 1.9 1.0-3.5 0.04
Ribotype 106 46 11 1776 8 1.4 0.6-3.3 0.41
Ribotype 001 66 3 1756 8 0.4 0.1-1.5 0.15
Other Ribos 1000 7 822 8 0.9 0.6-1.2 0.30
All ribotypes 1822 8
*Equivalent UCL classification (UCL ribotype 16=BR 014, UCL 16a=BR 020, UCL 32*=BR 002, UCL 3=BR 078, UCL 027= BR 027, UCL 48d=BR 106, UCL 23e=BR001)
Those infected with ribotype 027 were more likely to have complications than those affected by all other ribotypes (RR 1.9, CI 1.0-3.5). The relative risk of complications in those with ribotypes 078 and 106 were also raised and that of ribotype 001 lowered but did not reach statistical significance. However, overall numbers suffering from complications were small (see Table 21).
Epidemiology of Clostridium difficile infection in Belgium | 2015
© Scientific Institute of Public Health, WIV-ISP, Brussels 2015 42/54
3.7 International comparisons
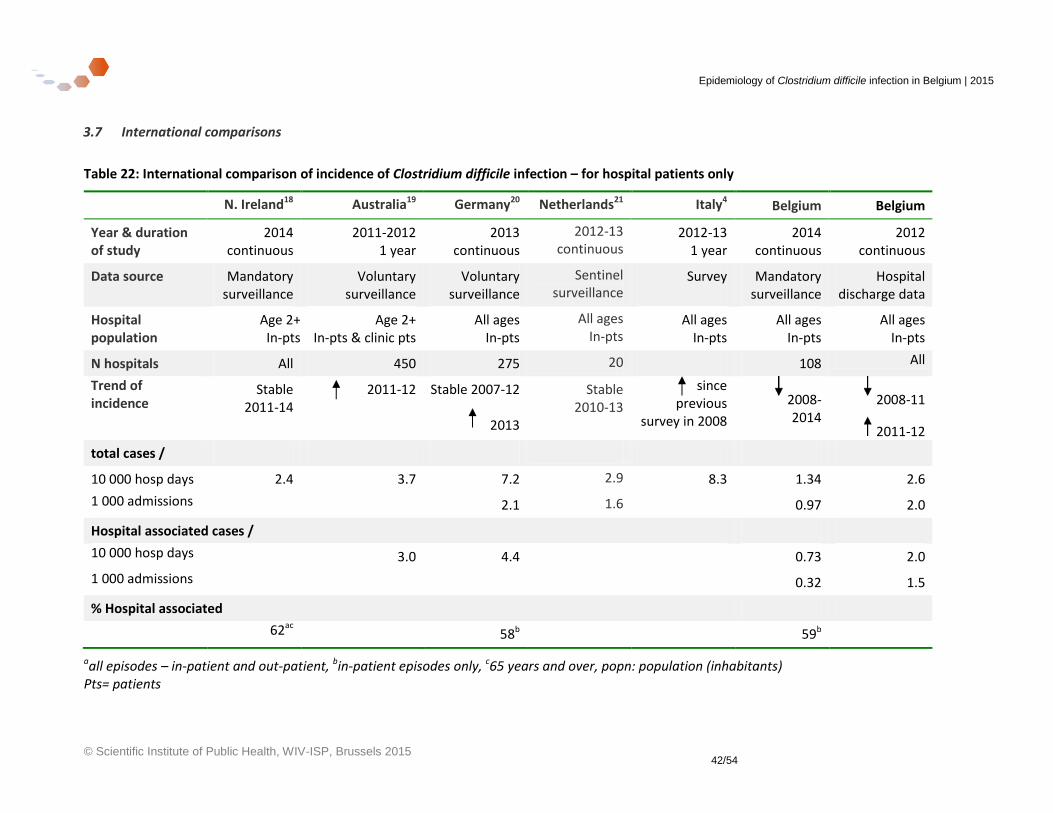
Table 22: International comparison of incidence of Clostridium difficile infection – for hospital patients only
N. Ireland18 Australia19 Germany20 Netherlands21 Italy4 Belgium Belgium
Year & duration of study
2014 continuous
2011-2012 1 year
2013 continuous
2012-13 continuous
2012-13 1 year
2014 continuous
2012 continuous
Data source Mandatory surveillance
Voluntary surveillance
Voluntary surveillance
Sentinel surveillance
Survey
Mandatory surveillance
Hospital discharge data
Hospital population
Age 2+ In-pts
Age 2+ In-pts & clinic pts
All ages In-pts
All ages In-pts
All ages In-pts
All ages In-pts
All ages In-pts
N hospitals All 450 275 20 108 All
Trend of incidence
Stable 2011-14
2011-12 Stable 2007-12
2013
Stable 2010-13
since previous
survey in 2008
2008-2014
2008-11
2011-12
total cases /
10 000 hosp days 2.4 3.7 7.2 2.9 8.3 1.34 2.6
1 000 admissions 2.1 1.6 0.97 2.0
Hospital associated cases /
10 000 hosp days 3.0 4.4 0.73 2.0
1 000 admissions 0.32 1.5
% Hospital associated
62ac 58b 59b
aall episodes – in-patient and out-patient, bin-patient episodes only, c65 years and over, popn: population (inhabitants) Pts= patients
Epidemiology of Clostridium difficile infection in Belgium | 2015
© Scientific Institute of Public Health, WIV-ISP, Brussels 2015 43/54
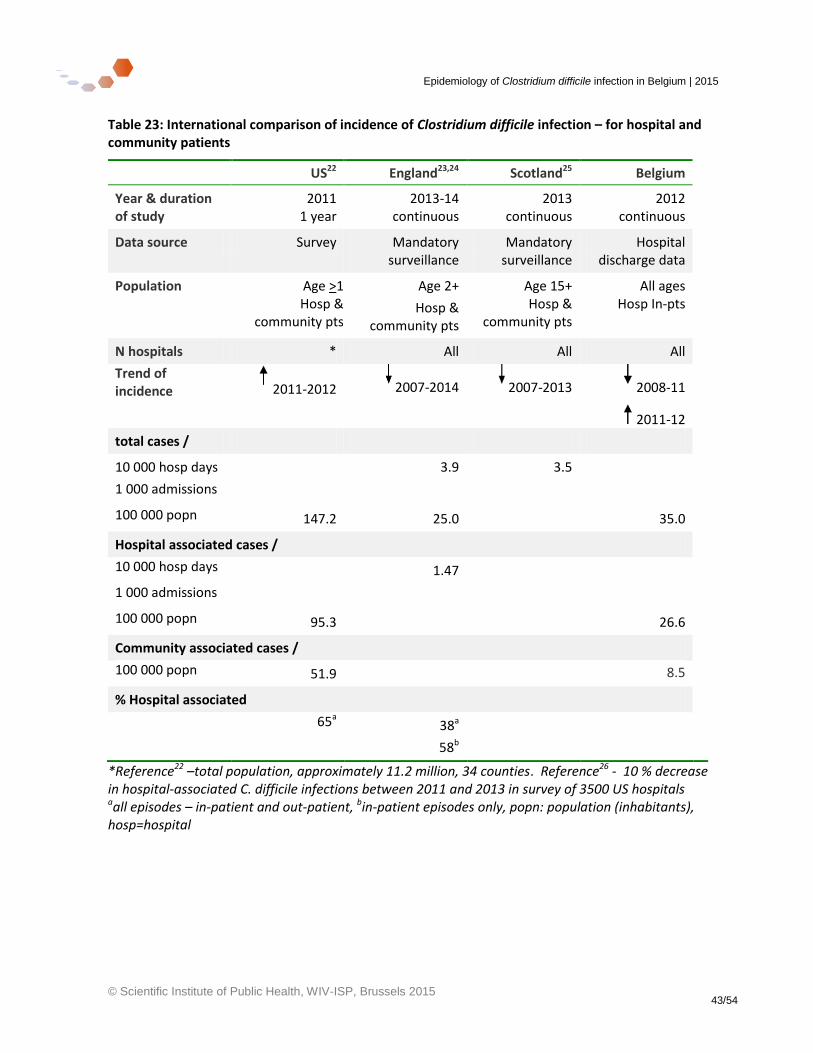
Table 23: International comparison of incidence of Clostridium difficile infection – for hospital and community patients
US22 England23,24 Scotland25 Belgium
Year & duration of study
2011 1 year
2013-14 continuous
2013 continuous
2012 continuous
Data source Survey Mandatory surveillance
Mandatory surveillance
Hospital discharge data
Population Age >1 Hosp &
community pts
Age 2+
Hosp & community pts
Age 15+ Hosp &
community pts
All ages Hosp In-pts
N hospitals * All All All
Trend of incidence 2011-2012 2007-2014 2007-2013 2008-11
2011-12
total cases /
10 000 hosp days 3.9 3.5
1 000 admissions
100 000 popn 147.2 25.0 35.0
Hospital associated cases /
10 000 hosp days 1.47
1 000 admissions
100 000 popn 95.3 26.6
Community associated cases /
100 000 popn 51.9 8.5
% Hospital associated
65a 38a
58b
*Reference22 –total population, approximately 11.2 million, 34 counties. Reference26 - 10 % decrease in hospital-associated C. difficile infections between 2011 and 2013 in survey of 3500 US hospitals aall episodes – in-patient and out-patient, bin-patient episodes only, popn: population (inhabitants), hosp=hospital
Epidemiology of Clostridium difficile infection in Belgium | 2015
© Scientific Institute of Public Health, WIV-ISP, Brussels 2015 44/54
In Europe as a whole, infection rates increased substantially between 2008-2013 from 4.1 to 7.9 cases per 10, 000 hospital bed days4. However, some European countries within this grouping have succeeded in decreasing their incidence during this time, notably the UK and Belgium. Direct comparisons between countries are difficult. Completeness of surveillance varies widely – with only Belgium and UK using mandatory surveillance. Other countries use continuous voluntary surveillance and others undertake surveys to quantify infection in a subset of hospitals over a short period. The frequency of testing varies between countries; testing algorithms vary, with a variety of different sensitivity tests used. Definitions of infection, such as hospital-acquired/ hospital-associated/ hospital-onset cases which can be defined as onset of symptoms anywhere between >2 days to 4 days after admission. Post-discharge infections which can be attributed to hospital care may be more completely included in some countries and denominators also vary between countries. Table 22 shows that the reported national incidence of CDI in hospitalised patients in Belgium is less than that of Germany and Italy and on a par with the Netherlands and N. Ireland (for the respective years given in the table). However, the incidence of total cases / 100 000 national population is calculated as greater in Belgium than in England, despite the fact that the English data include hospitalised and non-hospitalised CDI patients and Belgium includes only hospitalised patients (Table 23). On the basis of these data, even given the caveats in making comparisons, we believe it can be said that Belgium has an incidence of CDI in the mid to lower range of other European countries, and certainly somewhat lower than the United States. The proportion of hospitalised patients who have hospital associated CDI is remarkably consistent at 58-59% in Belgium, Germany and England. The European prevalence studies noted an increase in the prevalence of ribotype 027 across Europe as a whole4, in marked contrast to the declining trend in UK27 and Belgium (see NRC laboratory report in section 3.5).
Epidemiology of Clostridium difficile infection in Belgium | 2015
© Scientific Institute of Public Health, WIV-ISP, Brussels 2015 45/54
4 Discussion and conclusions
4.1 Discussion
This report summarises the different sources of available data on the epidemiology of Clostridium difficle infection (CDI) in Belgium. A large number of hospitals have participated in the surveillance programme whilst it has been mandatory between 2007-2014. The majority of them have provided data for the whole year, despite the legal obligation being to provide data for only six months. It remains to be seen how the change in legal obligation, effective from the end of 2014, will affect future participation and thus our ability to monitor the epidemiology of Clostridium difficile in Belgium.
Incidence of CDI in hospitalised patients has declined almost continuously between 2008-2014. In 2014 (latest data), the mean incidence of all CDI from all participating hospitals was 1.49 per 1 000 admissions (1.46 episodes for acute hospitals and 4.91 episodes for chronic hospitals per 1000 admissions), less than the preceding year. The mean incidence of hospital-associated CDI was higher in chronic hospitals when measured in episodes per 1000 admissions but higher in acute hospitals when measured per 10 000 hospital days (0.84 episodes for acute and 3.30 episodes for chronic hospitals per 1000 admissions; and 1.20 episodes for acute and 0.93 episodes for chronic hospitals per 10 000 hospital days). Incidence has consistently been lowest in the northern part of the country (Flanders).
Changes in testing rates cannot fully explain the national trends in incidence of CDI.
The proportion of hospital associated cases has decreased from 64% to 59% of total cases between 2008-2014 with a reflected increase in community associated cases (from 56% to 64% of all other cases) during the same time period.
Mortality and hospital stay data highlighted an important increase in incidence in CDI and CDI deaths from the early 2000s reaching a peak between 2007-2008. Mortality rates for CDI decreased markedly after the peak in 2005-2006 and now are either stable or decreasing in all regions. The CDI mortality rate for Belgium was 0.80 deaths per 100 000 inhabitants in 2012 (the latest year with available data). Mortality rates (crude or age standardized) are highest in Brussels and for most years since the peak, have been lowest in Wallonia. The high rate in Brussels probably reflects the high number of secondary and tertiary referral hospitals in the region. Surveillance data indicates that the proportion of patients suffering complications of CDI (pseudomembranous colitis, admission to the intensive care unit or the need for surgery as a result of CDI) have also decreased between 2008-2014.
There is a seasonal variation in incidence of CDI with a peak during January-April months each year. Hospital associated cases follow the same seasonal pattern as other cases. Research could examine a possible association with antibiotic therapy for seasonal respiratory tract.
There exists a large variability in the incidence of hospital associated CDI between hospitals and between regions. Even with the usual precautions of interpretation applied (different populations of patients, case-mix, different diagnostic tests with different sensitivity), there may, nevertheless, remain an important potential for prevention of CDI such as in infection prevention and control or antibiotic stewardship.
Epidemiology of Clostridium difficile infection in Belgium | 2015
© Scientific Institute of Public Health, WIV-ISP, Brussels 2015 46/54
The incidence of CDI calculated when using hospital stay data was greater than that calculated when using hospital surveillance data (mandatory hospital programme), but the difference between the two measures remains constant (2008-2012), indicating the validity of the surveillance data.
Other countries use different definitions and include different cases within their surveillance. As far as possible we have tried to be consistent with common practice and guidelines throughout the EU and the world. Examples of differences are the inclusion of 0-2 year olds in the Belgian surveillance system and a difference in the definition of healthcare-associated, hospital associated or hospital acquired cases. We have shown that only 40 (1.7%) of all cases in 2014 were 0-2 years old, and the exclusion of them made little difference to the results of our analyses. There was also very little difference in the results when we re-defined hospital-associated cases as those with onset >3 days after admission instead of > 2 days after admission.
International comparisons indicate that Belgium has incidence rates of CDI in the mid- to lower range of other European countries and lower than that in the United States.
The process of sending Clostridium difficile samples by the local laboratories to the NRC-CD for ribotyping has now stabilised and participating laboratories are to be congratulated. There is a great variety of ribotypes circulating in Belgium, which indicates that transmission is not caused by one particular strain and that there are multiple pathways of transmission. The different ribotypes are generally spread throughout the whole country without localisation within certain towns or regions.
The prevalence of ribotype 027 continues to diminish (now 3% of all ribotyped samples). There was an initial rise in the prevalence of ribotype 078 in 2010 but this levelled off quickly to around 7%. The predominant strain is now 014 (12% of ribotyped samples).
Ribotype BR106, for which the prevalence is rising in Belgium is a ribotype that was second in frequency in UK in 2007-2008 but which has decline there since then.28
Linkage of patient information with their laboratory ribotyping information is continuing to improve. We have shown that those patients whose samples are sent to the reference laboratory for ribotyping and are matched with their epidemiological data from NSIHweb1 are older and ;ore likely to have HA-CDI or recurrent CDI than the overall population of CDI patients. For the first time, we have described certain epidemiological characteristics of patients and their CDI with the infecting ribotypes.
Our data show that those hospitalised patients with ribotype 027 are more likely to be aged 80 and over than those infected with other ribotypes and their infection is less likely to be hospital associated than those with other ribotypes. Patients with ribotype 027 are more likely to suffer complications. This is consistent with other studies.29 In addition, other studies have indicated that riobtypes 07830 and 01430 may have more severe outcomes and that ribotype 00131 less severe outcomes. Our data point in the direction to confirm these findings although overall numbers of patients with complications are low.
Epidemiology of Clostridium difficile infection in Belgium | 2015
© Scientific Institute of Public Health, WIV-ISP, Brussels 2015 47/54
4.2 Conclusions and key points
There was a peak in incidence in 2008. Incidence has declined in acute and chronic hospitals and in most years up until and including 2014.
Of the three regions, Flanders has had the lowest incidence of CDI since 2010
Mortality rates continue to decrease after their peak in 2004-2005, and there is no further sign of increasing severity of cases in recent years.
Mortality rates have consistently been highest in Brussels out of the three regions
The incidence of hospital associated infection is very variable between hospitals and regions and indicates a potentially important area for prevention
The incidence of infection is seasonal
There has been an increase in the proportion of community associated cases and a decrease in the proportion that have hospital associated infection between the years 2008-2014
Reference laboratory data provide evidence of a large variety of strains. The most notable trend is the decline since 2009 of ribotype 027. The predominant strains in Belgium are now 014 and 020. Ribotype 078 is now the third most common ribotype in Belgium. Ribotype 106 has emerged in the last two years.
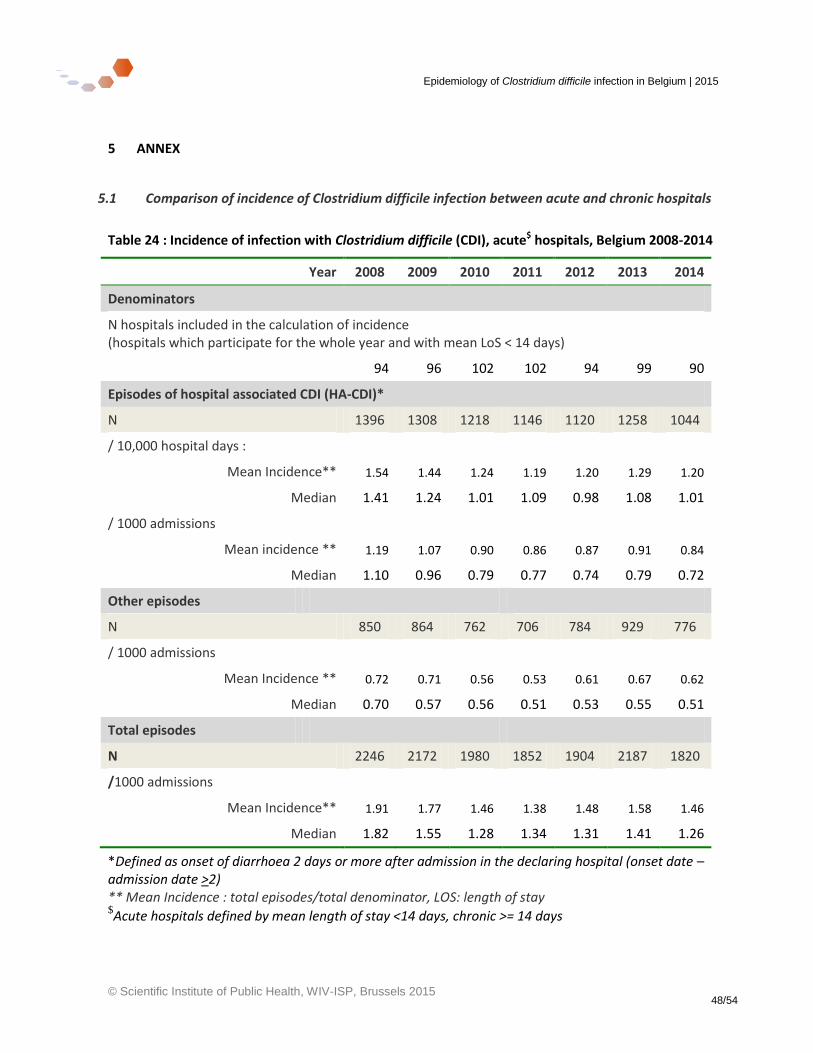
Epidemiology of Clostridium difficile infection in Belgium | 2015
© Scientific Institute of Public Health, WIV-ISP, Brussels 2015 48/54
5 ANNEX
5.1 Comparison of incidence of Clostridium difficile infection between acute and chronic hospitals
Table 24 : Incidence of infection with Clostridium difficile (CDI), acute$ hospitals, Belgium 2008-2014
Year 2008 2009 2010 2011 2012 2013 2014
Denominators
N hospitals included in the calculation of incidence (hospitals which participate for the whole year and with mean LoS < 14 days)
94 96 102 102 94 99 90
Episodes of hospital associated CDI (HA-CDI)*
N 1396 1308 1218 1146 1120 1258 1044
/ 10,000 hospital days :
Mean Incidence** 1.54 1.44 1.24 1.19 1.20 1.29 1.20
Median 1.41 1.24 1.01 1.09 0.98 1.08 1.01
/ 1000 admissions
Mean incidence ** 1.19 1.07 0.90 0.86 0.87 0.91 0.84
Median 1.10 0.96 0.79 0.77 0.74 0.79 0.72
Other episodes
N 850 864 762 706 784 929 776
/ 1000 admissions
Mean Incidence ** 0.72 0.71 0.56 0.53 0.61 0.67 0.62
Median 0.70 0.57 0.56 0.51 0.53 0.55 0.51
Total episodes
N 2246 2172 1980 1852 1904 2187 1820
/1000 admissions
Mean Incidence** 1.91 1.77 1.46 1.38 1.48 1.58 1.46
Median 1.82 1.55 1.28 1.34 1.31 1.41 1.26
*Defined as onset of diarrhoea 2 days or more after admission in the declaring hospital (onset date – admission date >2) ** Mean Incidence : total episodes/total denominator, LOS: length of stay $Acute hospitals defined by mean length of stay <14 days, chronic >= 14 days
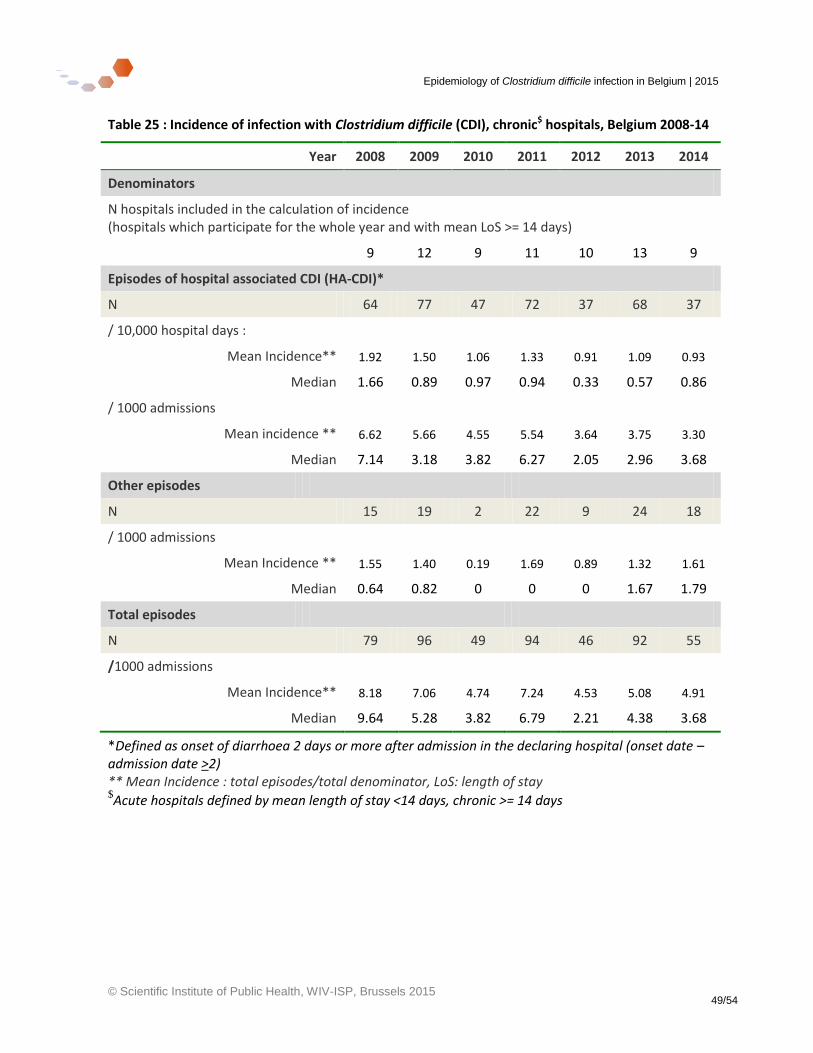
Epidemiology of Clostridium difficile infection in Belgium | 2015
© Scientific Institute of Public Health, WIV-ISP, Brussels 2015 49/54
Table 25 : Incidence of infection with Clostridium difficile (CDI), chronic$ hospitals, Belgium 2008-14
Year 2008 2009 2010 2011 2012 2013 2014
Denominators
N hospitals included in the calculation of incidence (hospitals which participate for the whole year and with mean LoS >= 14 days)
9 12 9 11 10 13 9
Episodes of hospital associated CDI (HA-CDI)*
N 64 77 47 72 37 68 37
/ 10,000 hospital days :
Mean Incidence** 1.92 1.50 1.06 1.33 0.91 1.09 0.93
Median 1.66 0.89 0.97 0.94 0.33 0.57 0.86
/ 1000 admissions
Mean incidence ** 6.62 5.66 4.55 5.54 3.64 3.75 3.30
Median 7.14 3.18 3.82 6.27 2.05 2.96 3.68
Other episodes
N 15 19 2 22 9 24 18
/ 1000 admissions
Mean Incidence ** 1.55 1.40 0.19 1.69 0.89 1.32 1.61
Median 0.64 0.82 0 0 0 1.67 1.79
Total episodes
N 79 96 49 94 46 92 55
/1000 admissions
Mean Incidence** 8.18 7.06 4.74 7.24 4.53 5.08 4.91
Median 9.64 5.28 3.82 6.79 2.21 4.38 3.68
*Defined as onset of diarrhoea 2 days or more after admission in the declaring hospital (onset date – admission date >2) ** Mean Incidence : total episodes/total denominator, LoS: length of stay $Acute hospitals defined by mean length of stay <14 days, chronic >= 14 days
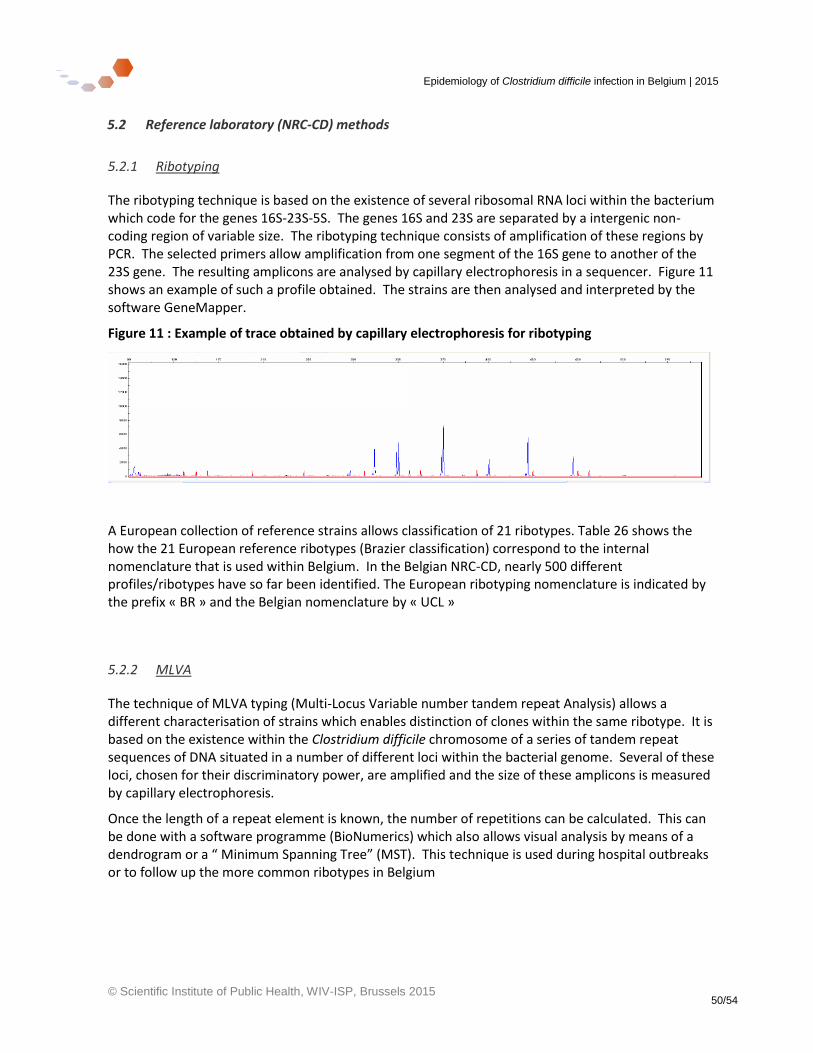
Epidemiology of Clostridium difficile infection in Belgium | 2015
© Scientific Institute of Public Health, WIV-ISP, Brussels 2015 50/54
5.2 Reference laboratory (NRC-CD) methods
5.2.1 Ribotyping
The ribotyping technique is based on the existence of several ribosomal RNA loci within the bacterium which code for the genes 16S-23S-5S. The genes 16S and 23S are separated by a intergenic non-coding region of variable size. The ribotyping technique consists of amplification of these regions by PCR. The selected primers allow amplification from one segment of the 16S gene to another of the 23S gene. The resulting amplicons are analysed by capillary electrophoresis in a sequencer. Figure 11 shows an example of such a profile obtained. The strains are then analysed and interpreted by the software GeneMapper.
Figure 11 : Example of trace obtained by capillary electrophoresis for ribotyping
A European collection of reference strains allows classification of 21 ribotypes. Table 26 shows the how the 21 European reference ribotypes (Brazier classification) correspond to the internal nomenclature that is used within Belgium. In the Belgian NRC-CD, nearly 500 different profiles/ribotypes have so far been identified. The European ribotyping nomenclature is indicated by the prefix « BR » and the Belgian nomenclature by « UCL »
5.2.2 MLVA
The technique of MLVA typing (Multi-Locus Variable number tandem repeat Analysis) allows a different characterisation of strains which enables distinction of clones within the same ribotype. It is based on the existence within the Clostridium difficile chromosome of a series of tandem repeat sequences of DNA situated in a number of different loci within the bacterial genome. Several of these loci, chosen for their discriminatory power, are amplified and the size of these amplicons is measured by capillary electrophoresis.
Once the length of a repeat element is known, the number of repetitions can be calculated. This can be done with a software programme (BioNumerics) which also allows visual analysis by means of a dendrogram or a “ Minimum Spanning Tree” (MST). This technique is used during hospital outbreaks or to follow up the more common ribotypes in Belgium
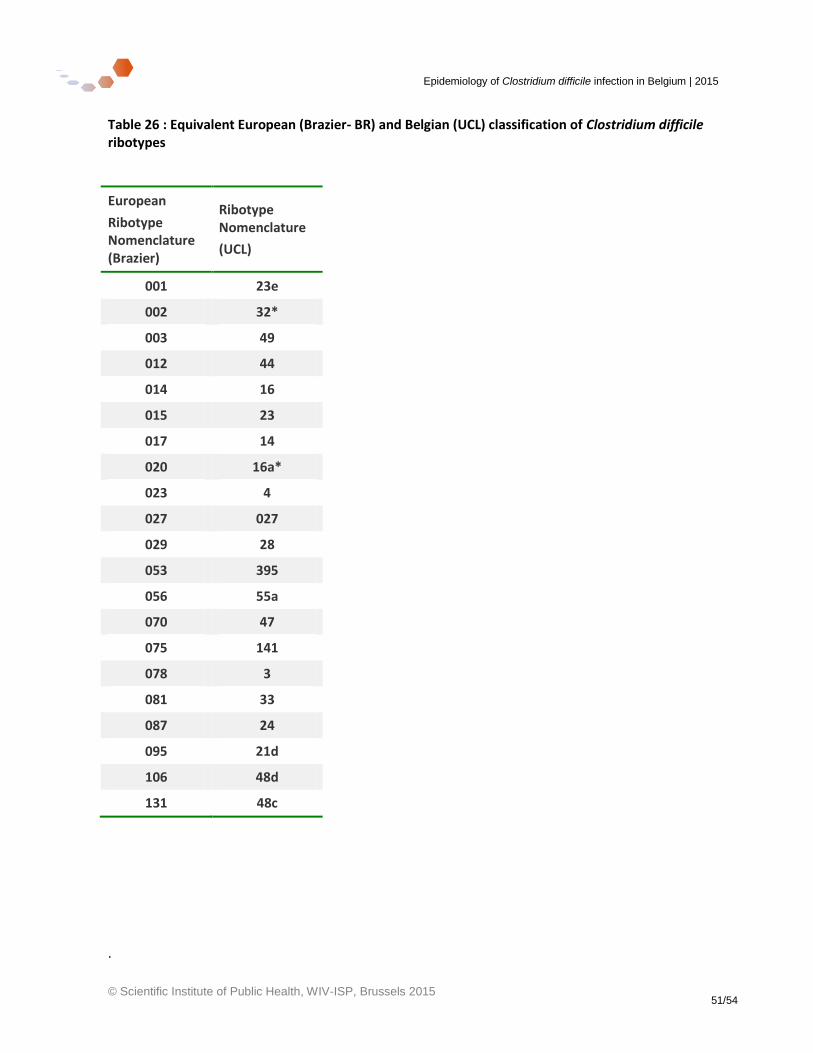
Epidemiology of Clostridium difficile infection in Belgium | 2015
© Scientific Institute of Public Health, WIV-ISP, Brussels 2015 51/54
Table 26 : Equivalent European (Brazier- BR) and Belgian (UCL) classification of Clostridium difficile ribotypes
European
Ribotype Nomenclature (Brazier)
Ribotype Nomenclature
(UCL)
001 23e
002 32*
003 49
012 44
014 16
015 23
017 14
020 16a*
023 4
027 027
029 28
053 395
056 55a
070 47
075 141
078 3
081 33
087 24
095 21d
106 48d
131 48c
.
Epidemiology of Clostridium difficile infection in Belgium | 2015
© Scientific Institute of Public Health, WIV-ISP, Brussels 2015 52/54
6 Reference List
(1) European Centre for Disease Prevention and Control. Point prevalence survey of healthcare-associated infections and antimicrobial use in European acute care hospitals 2011-2012. Stockholm: ECDC; 2013. http://www.ecdc.europa.eu/en/publications/Publications/Forms/ ECDC_DispForm.aspx?ID=1155
(2) Health Protection Agency. English National Point Prevalence Survey on Healthcare-associated Infections and Antimicrobial Use, 2011: Preliminary data. London; 2012. https://www.gov.uk/government/uploads/system/uploads/attachment_data/file/331871/English_National_Point_Prevalence_Survey_on_Healthcare_associated_Infections_and_Antimicrobial_Use_2011.pdf Date accessed 13-5-2015
(3) Meyer E, Gastmeier P, Weizel-Kage D, Schwab F. Associations between nosocomial meticillin-resistant Staphylococcus aureus and nosocomial Clostridium difficile-associated diarrhoea in 89 German hospitals. J Hosp Infect 2012 Nov;82(3):181-6.PM:23021304
(4) European Centre for Disease Control. EUCLID - European multi-centre prospective bi-annual point prevalence study of Clostridium difficile infection in hopsitalised patients with Diarrhoea: the fuller picture of the incidence of Clostridium difficile infection (CDI) across Europe . Job code FDX/14/0017/EUc. 2014. http://www.multivu.com/assets/71400524/documents/ 71400524-EUCLID-backgrounder-original.pdf
(5) Experts Attend European Parliament to Call for Urgent Action to Improve Clostridium Difficile Infection Management in Europe. http://www prnewswire co uk/news-releases/experts-attend-european-parliament-to-call-for-urgent-action-to-improve-clostridium-difficile-infection-management-in-europe-284435891 html 2014 December 2
(6) Davies KA, Longshaw CM, Davis GL, Bouza E, Barbut F, Barna Z, et al. Underdiagnosis of Clostridium difficile across Europe: the European, multicentre, prospective, biannual, point-prevalence study of Clostridium difficile infection in hospitalised patients with diarrhoea (EUCLID). Lancet Infect Dis 2014 Dec;14(12):1208-19.PM:25455988
(7) Bauer MP, Notermans DW, van Benthem BH, Brazier JS, Wilcox MH, Rupnik M, et al. Clostridium difficile infection in Europe: a hospital-based survey. Lancet 2011 Jan 1;377(9759):63-73.PM:21084111
(8) Conseil Supérieur de la Santé, Belgian Infection Control Society, Institut Scientifique de Santé Publique. Recommandations belges pour le contrôle et la prévention des infections à Clostridium difficile dans les hôpitaux aigus et dans les maisons de repos et de soins. 2008 May. Report No.8365. http://www.gezondheid.belgie.be/internet2Prd/groups/ public/@public/@shc/documents/ie2divers/14112500_fr.pdf
(9) European Center for Disease Prevention & Control. European Surveillance of Clostridium difficile infections: Surveillance protocol version 2.1. Stockholm: ECDC; 2015 May. Report No.: Technical document.http://ecdc.europa.eu/en/publications/Publications/Clostridium-difficile-infections-surveillance-protocol-version-2.1.pdf
Epidemiology of Clostridium difficile infection in Belgium | 2015
© Scientific Institute of Public Health, WIV-ISP, Brussels 2015 53/54
(10) Outbreaks of Clostridium difficile-027 Netherlands. Wekelijks overzicht van infectieziektesignalen week 8, 3-4. 19-2-2015. Rijksinstituut voor Volksgezondheid en Milieu, Ministerie van Volksgezondheid, Welzijn en Sport.
(11) Eyre DW, Cule ML, Wilson DJ, Griffiths D, Vaughan A, O'Connor L, et al. Diverse sources of C. difficile infection identified on whole-genome sequencing. N Engl J Med 2013 Sep 26;369(13):1195-205.PM:24066741
(12) Janezic S, Zidaric V, Pardon B, Indra A, Kokotovic B, Blanco JL, et al. International Clostridium difficile animal strain collection and large diversity of animal associated strains. BMC Microbiol 2014;14:173.PM:24972659
(13) Arrêté Royal, C-2015/24034, Moniteur Belge - Belgisch Staatsblad 27.01.2015, Arrêté Royal, (2015).http://www.nsih.be/download/CDIF/Arrete%20Royal%202015.xps
(14) World Health Organisation. International Classification of diseases (ICD). http://www who int/classifications/icd/en 2011
(15) Belgian Federal Government. Direction générale Statistique et Information économique (DGSIE). http://statbel fgov be/en/statistics/organisation/statistics_belgium/ 2013 Accessed 2014 Jun 12
(16) Institut Scientifique de Santé Publique. SPMA : Standardized Procedures for Mortality Analysis - Belgium/Population. https://www wiv-isp be/epidemio/spma/index htm 2014 https://www wiv-isp be/epidemio/spma/index htm Last update 2014
(17) Jans B, Glupczynsk Y, Denis O. Surveillance des bactéries résistantes aux antibiotiques dans les hôpitaux belges: Rapport annuel 2013. Institute Scientifique de Santé Publique, Bruxelles; 2014 Dec. Report No.: 2014- 046 http://www.nsih.be/download/MRSA/MRSA_RAP_2013/ RAPPORT_COMPLET_Y2013_FR_final.pdf
(18) Public Health Agency NI. C.difficile surveillance: Quarterly report Oct-Dec 2014 (Q4 2014). 2015. http://www.publichealth.hscni.net/directorate-public-health/health-protection/healthcare-associated-infections
(19) Slimings C, Armstrong P, Beckingham WD, Bull AL, Hall L, Kennedy KJ, et al. Increasing incidence of Clostridium difficile infection, Australia, 2011-2012. Med J Aust 2014 Mar 17;200(5):272-6.PM:24641152
(20) Nationales Referenzzentrumfür Surveillancevon Nosokomialen Infektionen. KISS Krankenhaus-Infektions-Surveillance-System Modul CDAD-KISS Referenzdaten. 2013 Apr 16. Report No.: Berechnungszeitraum: 1 Januar 2012 bis 31 Dezember 2012.http://www.nrz-hygiene.de/surveillance/kiss/cdad-kiss/
(21) Leiden University Medical Center DoMM, Center for Infectious Diseases Control (CIb) RB. Seventh Annual Report of the National Reference Laboratory for Clostridium difficile and results of the national surveillance May 2012 to May 2013. 2013. http://www.rivm.nl/ dsresource?objectid=rivmp:211067&type=org&disposition=inline&ns_nc=1
(22) Lessa FC, Mu Y, Bamberg WM, Beldavs ZG, Dumyati GK, Dunn JR, et al. Burden of Clostridium difficile infection in the United States. N Engl J Med 2015 Feb 26;372(9):825-34.PM:25714160
(23) Public Health England. Annual epidemiological commentary: MRSA, MSSA and E. coli bacteraemia and C. difficile infection data up to and including financial year April 2013 to March 2014. 2014 Jul 10. Report No.: Publications gateway: 2014160. https://www.gov.uk/government/statistics/mrsa-mssa-and-e-coli-bacteraemia-and-c-difficile-infection-annual-epidemiological-commentary
Epidemiology of Clostridium difficile infection in Belgium | 2015
© Scientific Institute of Public Health, WIV-ISP, Brussels 2015 54/54
(24) Eyre DW, Walker AS, Griffiths D, Wilcox MH, Wyllie DH, Dingle KE, et al. Clostridium difficile mixed infection and reinfection. J Clin Microbiol 2012 Jan;50(1):142-4.PM:22075589
(25) Health Protection Scotland. Healthcare Associated Infection Annual Report 2013. 2014 May. http://www.hps.scot.nhs.uk/haiic/publicationsdetail.aspx?id=58412
(26) WHO Media Centre. WHO's first global report on antibiotic resistance reveals serious, worldwide threat to public health. http://www who int/mediacentre/news/releases/2014/ amr-report/en/ 2014 April 30
(27) Public Health England. Clostridium difficile Ribotyping Network (CDRN) for England and Northern Ireland. 2014 Jan. Report No.: PHE publications gateway number: 2013396.http://www.hpa.org.uk/webc/HPAwebFile/HPAweb_C/1317140658750
(28) Clostridium difficile Ribotyping Network: 2011-2013 report. Health Protection Report - Weekly Report 31-1-2014;8(4). http://www.hpa.org.uk/hpr/archives/2014/news0414.htm#snslnflnz
(29) Jones AM, Kuijper EJ, Wilcox MH. Clostridium difficile: a European perspective. J Infect 2013 Feb;66(2):115-28.PM:23103666
(30) Walker AS, Eyre DW, Wyllie DH, Dingle KE, Griffiths D, Shine B, et al. Relationship between bacterial strain type, host biomarkers, and mortality in Clostridium difficile infection. Clin Infect Dis 2013 Jun;56(11):1589-600.PM:23463640
(31) Patterson L, Wilcox MH, Fawley WN, Verlander NQ, Geoghegan L, Patel BC, et al. Morbidity and mortality associated with Clostridium difficile ribotype 078: a case-case study. J Hosp Infect 2012 Oct;82(2):125-8.PM:22947650