Epidemiology. Classically speaking Epi = upon (among) Demos = people Ology = science Epidemiology =...
59
Epidemiology
-
Upload
gladys-simmons -
Category
Documents
-
view
240 -
download
0
Transcript of Epidemiology. Classically speaking Epi = upon (among) Demos = people Ology = science Epidemiology =...

Epidemiology
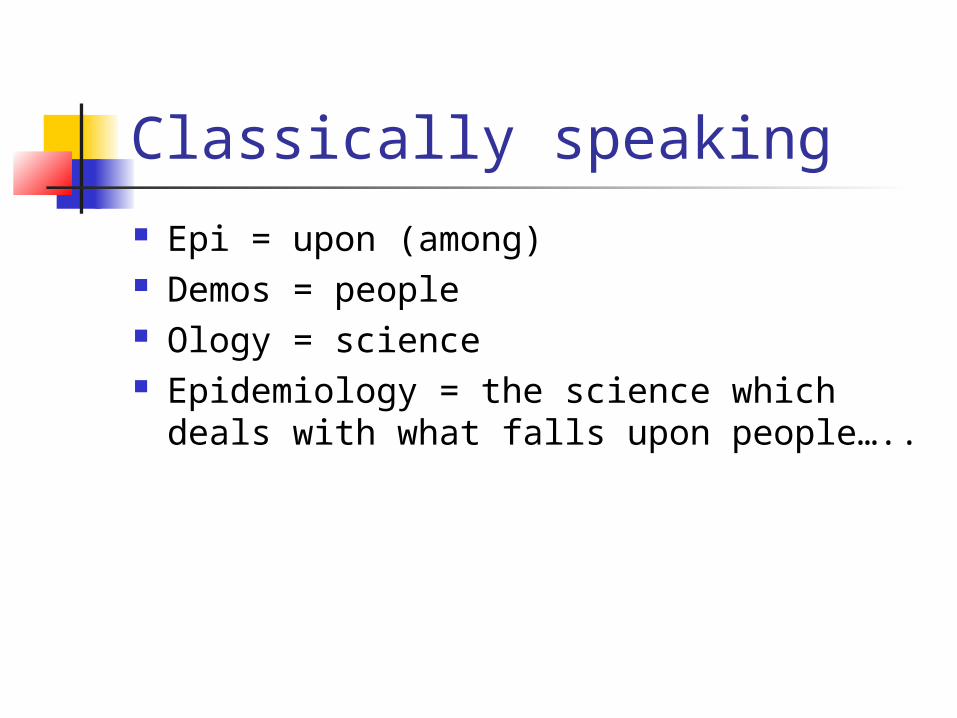
Classically speaking Epi = upon (among) Demos = people Ology = science Epidemiology = the science which deals with what
falls upon people…..
A Modern Definition
“The study of the distribution and determinants of health-related states in specified populations, and the application of this study to control health problems."
(Last J)
Search for knowledge Apply in health service
Objectives of Epidemiology
1. To describe the distribution and magnitude of health and disease problems in the population.
2. To identify the etiological factors – risk factors in the population.
3. To provide the data essential to planning, implementation and evaluation of services for prevention, control and treatment of disease and to setting up of priorities for these services.
The ultimate aim of epidemiology is to eliminate or reduce health problem or its
consequences
and to promote health and well-being of society as a whole.

Purposes of EpidemiologyPurposes of Epidemiology
1. To investigate nature / extent of health-related phenomena in the community / identify priorities
2. To study natural history and prognosis of health-related problems
3. To identify causes and risk factors4. To recommend / assist in application of / evaluate
best interventions (preventive and therapeutic measures)
5. To provide foundation for public policy

Component:
Disease Frequency- Rate and Ratio e.g Rate- incidence rate, prevalence rate etc
Ratio- sex ratio, doctor-population ratioDistribution of Disease-Disease in community find causative factor
Generate hypothesis
Descriptive epidimiology

Determinants of Disease- To test hypothesis
Analytic epidemiology
Help in develop sound scientific
program
Incidence
Number of new cases of a disease which come into being during a specified period of time.
(Number of new cases of specific disease during a given period)/(population at risk during that period) x 1000
Importance: If incidence increasing, it may indicate failure or ineffectiveness of control measure of a disease and need for better/new health control measure.
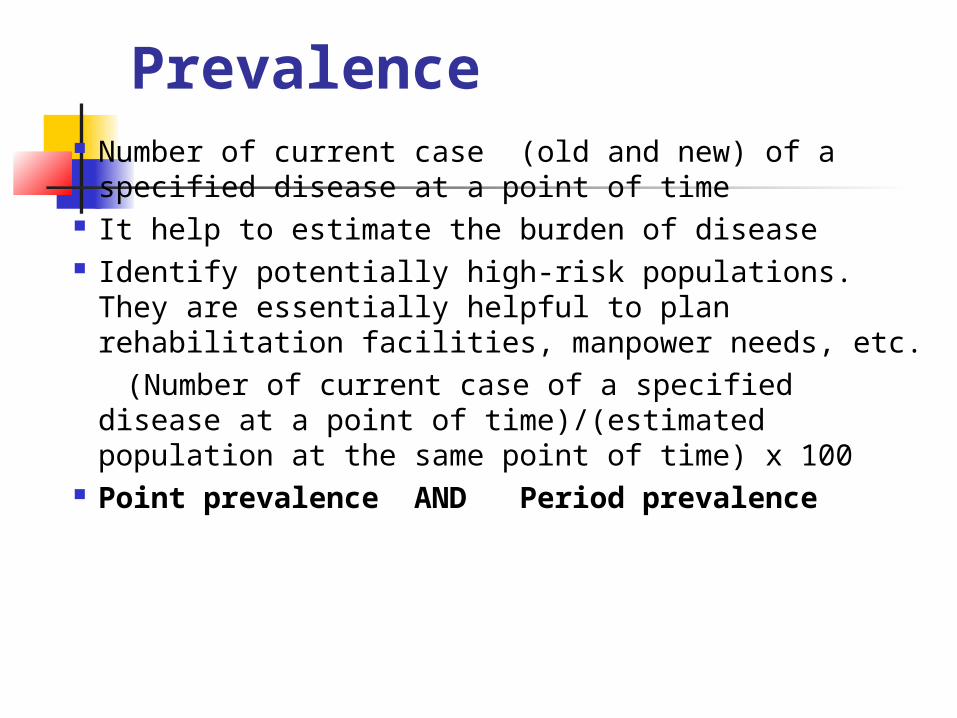
Prevalence Number of current case (old and new) of a specified disease
at a point of time It help to estimate the burden of disease Identify potentially high-risk populations. They are
essentially helpful to plan rehabilitation facilities, manpower needs, etc.
(Number of current case of a specified disease at a point of time)/(estimated population at the same point of time) x 100
Point prevalence AND Period prevalence

Relationship between incidence and prevalence
Prevalence =Incidence x Duration
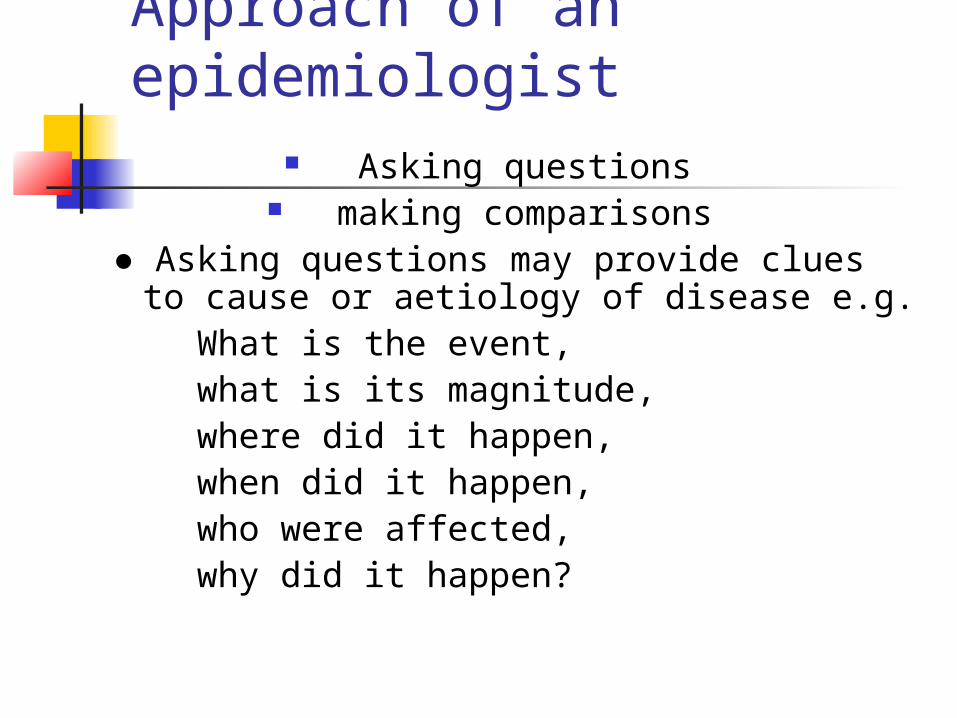
Approach of an epidemiologist Asking questions
making comparisons ● Asking questions may provide clues to cause or
aetiology of disease e.g. What is the event, what is its magnitude, where did it happen, when did it happen, who were affected, why did it happen?

Making comparisons will help draw inferences to support asking questions.
This comparison may be:
● Between those with the disease and those without the disease;
● Those with risk factor and those not exposed to risk factor;
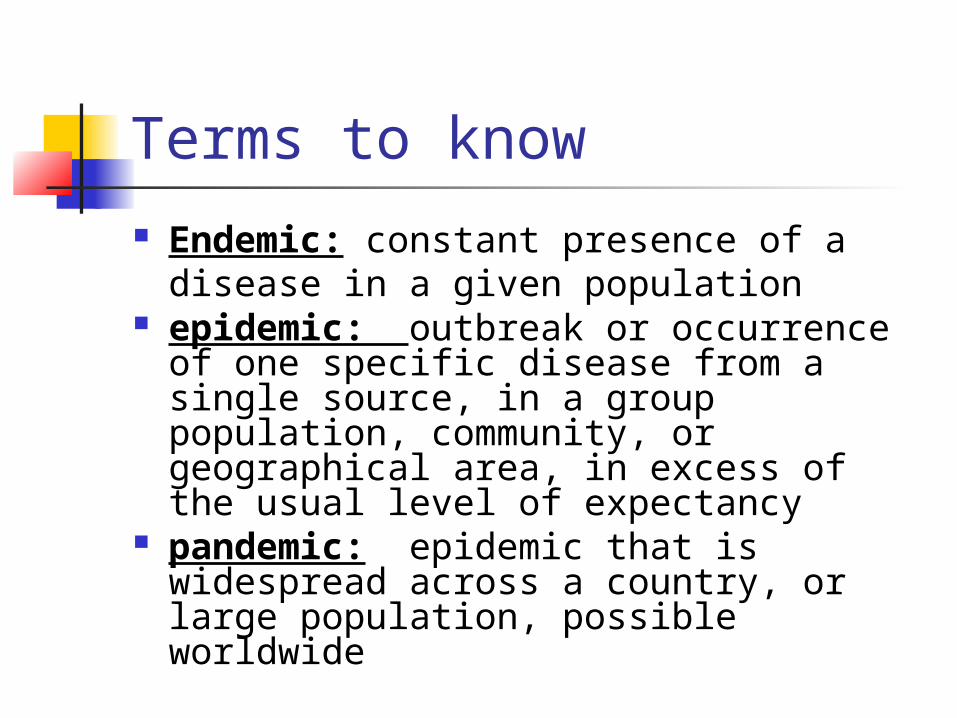
Terms to know Endemic: constant presence of a
disease in a given population epidemic: outbreak or occurrence of
one specific disease from a single source, in a group population, community, or geographical area, in excess of the usual level of expectancy
pandemic: epidemic that is widespread across a country, or large population, possible worldwide


Epidemiology versus clinical medicine
Epidemiology
Unit of study is a defined population or population at risk
Concerned with sick as well as healthy
Investigator goes to the community
identify source of infection, mode of spread, an Etiological factor, future trend or recommend control measures
Clinical medicine
Unit of study is case
Concerned with only sick
Patient comes to doctor Seeks diagnosis,
derives prognosis, prescribes specific treatment
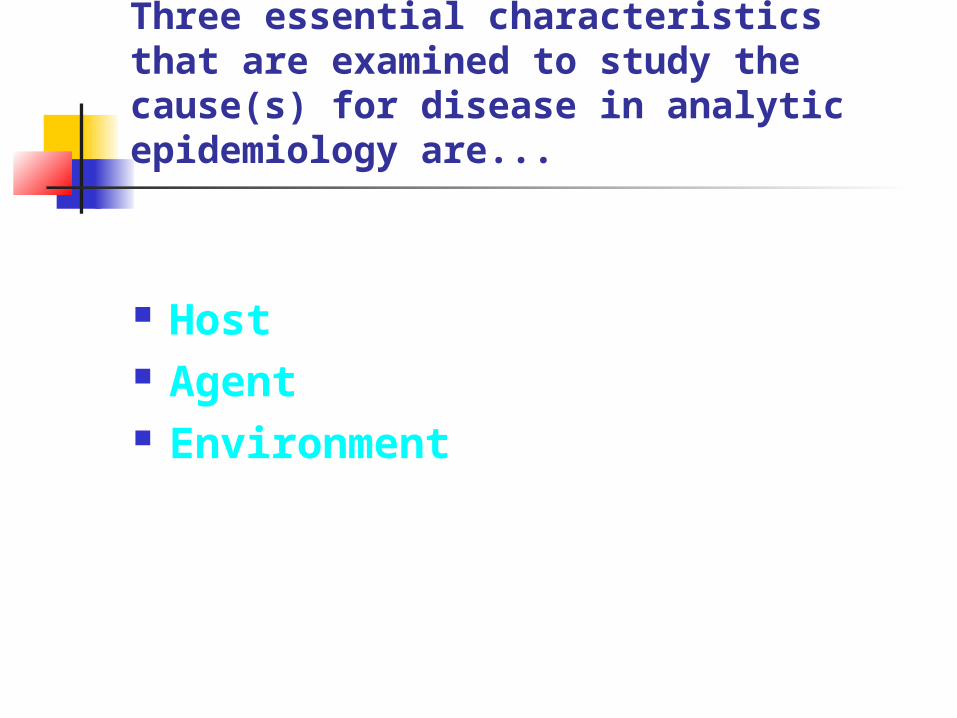
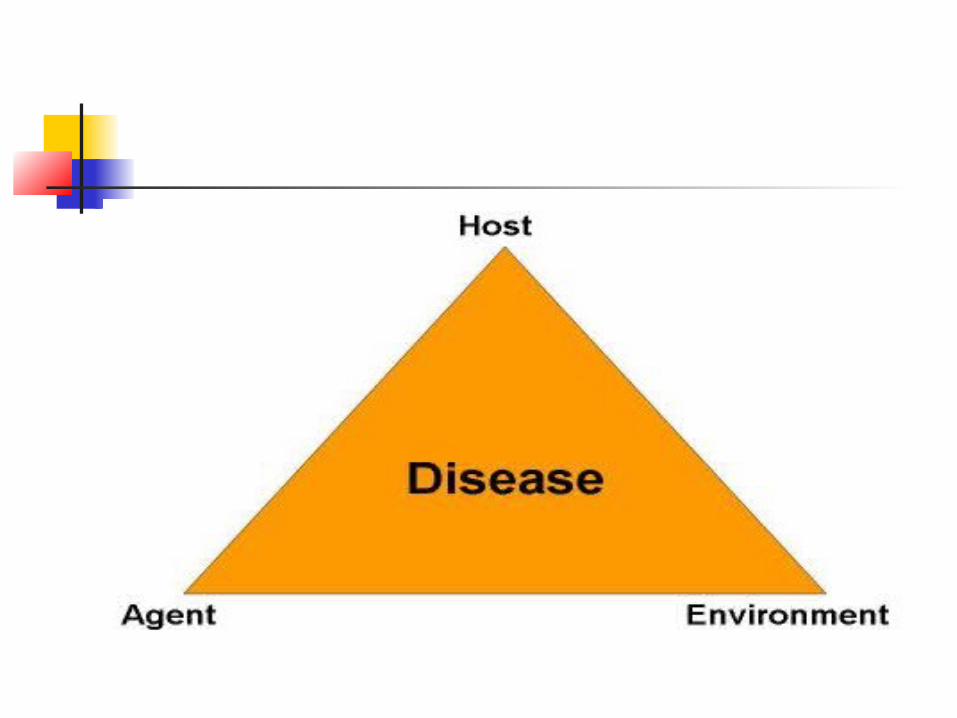
Host Agent Environment
Three essential characteristics that are examined to study the cause(s) for disease in analytic epidemiology are...
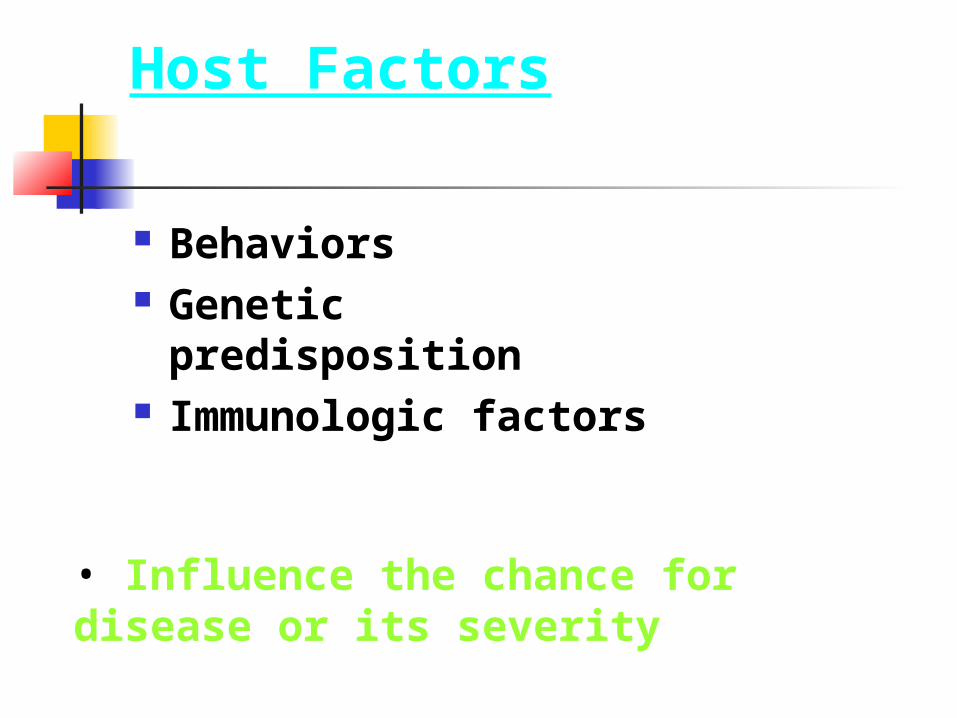
Host Factors
Behaviors Genetic
predisposition Immunologic
factors
• Influence the chance for disease or its severity

Agents
Biological Physical Chemical
• Necessary for disease to occur

Environment
External conditions
• Contribute to the disease process

Epidemics arise when host, agent, and environmental factors are not in balance
Due to new agent Due to change in existing agent (infectivity,
pathogenicity, virulence) Due to change in number of susceptibles in the
population Due to environmental changes that affect
transmission of the agent or growth of the agent
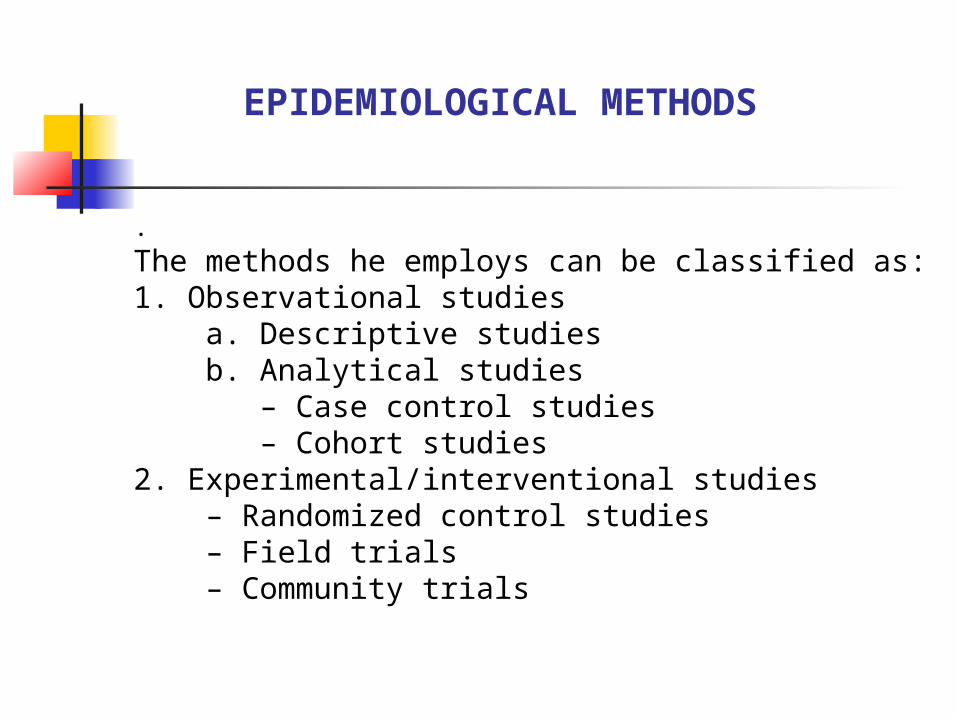
EPIDEMIOLOGICAL METHODS
. The methods he employs can be classified as:1. Observational studies a. Descriptive studies b. Analytical studies – Case control studies – Cohort studies2. Experimental/interventional studies – Randomized control studies – Field trials – Community trials

Descriptive observations pertain to the “who, what, where and when of health-related state occurrence”. However, analytical observations deal more with the ‘how’ of a health-related event occur.
Randomized control trial (often used for new medicine or drug testing), field trial (conducted on those at a high risk of conducting a disease), and community trial (research on social originating diseases)
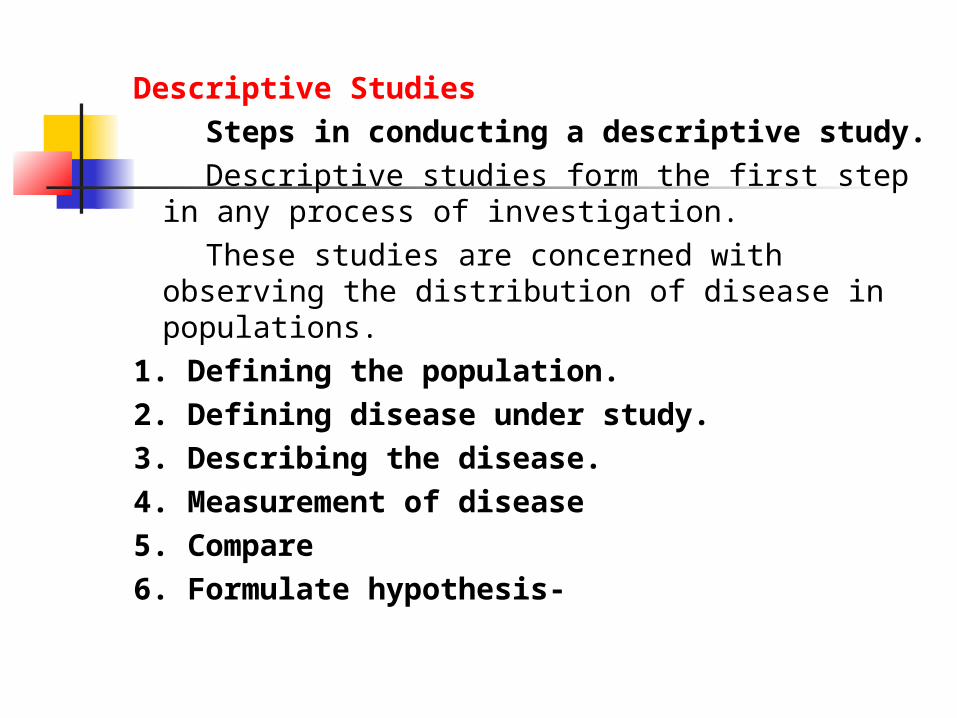
Descriptive Studies
Steps in conducting a descriptive study.
Descriptive studies form the first step in any process of investigation.
These studies are concerned with observing the distribution of disease in populations.
1. Defining the population.
2. Defining disease under study.
3. Describing the disease.
4. Measurement of disease
5. Compare
6. Formulate hypothesis-
Defining the population. Defined population may be the whole population or a representative sample.
It can also be specially selected group such as age and sex groups, occupational groups, hospital patients, school children, small community, etc.

2. Defining disease under study.
3. Describing the disease.
Disease is examined by the epidemiologist by asking three questions:
● When is the disease occurring—time distribution?
● Where is it occurring—place distribution?
● Who is getting the disease—person distribution?

A. Time Distribution Short-term fluctuations. Common source epidemics - single exposure/point source—bhopal tragedy Propagated-infectious :Hep A Periodic fluctuations; Seasonal –measles (early spring) cyclic- ,, in pre-vaccinated era (peak 2-3 yr) Long-term or secular trends; diabetes, CVD

B. Place Distribution International variations:
Cancer of stomach very common in Japan
less common in US.
oral cancer- India
Breast cancer- Low-japan, high-western National variations, e.g. Distribution of fluorosis,
Rural-urban differences, e.g.
CVD, Mental illness more common in urban areas.
Skin diseases, worm infestations more common in rural areas.
Local distributions, e.g. Spot maps- John Snow in London to incriminate water supply as cause of cholera transmission in London.
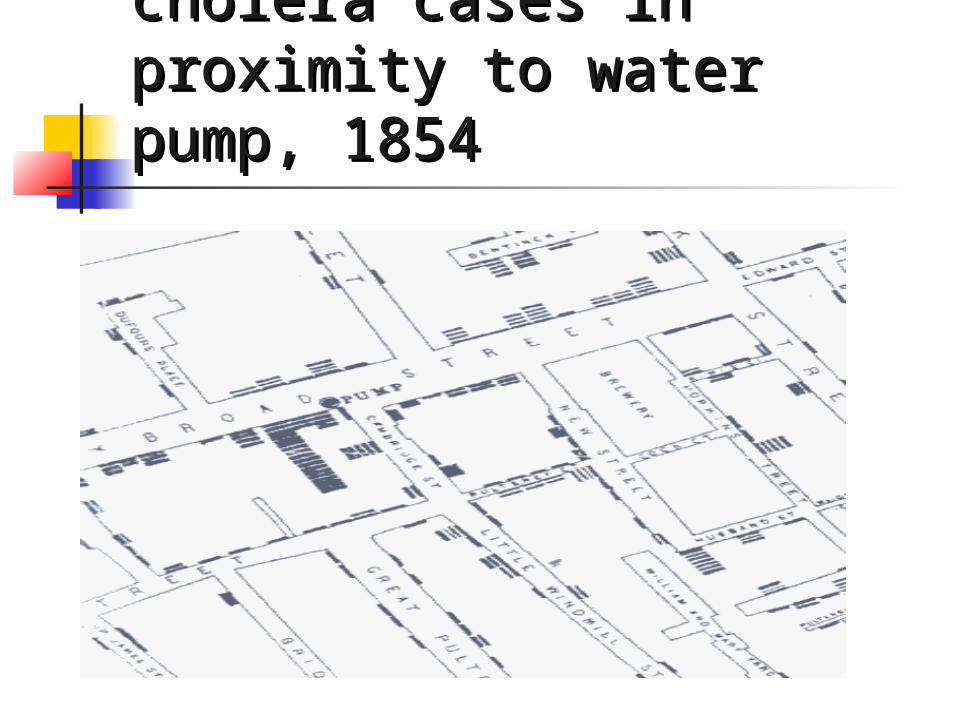
cholera cases in proximity cholera cases in proximity to water pump, 1854to water pump, 1854


C. Person Distribution
Age: e.g.
Measles is common in children,
Cancer in middle age
Degenerative diseases in old age.
Sex:
Women- Lung cancer-less
Hyperthyroidism- more
c. Social class- Diabetes, Hypertenson– upper class

4. Measurement of disease- Mortality/ Morbidity
5. Compare- Between different population, subgroups
6. Formulate hypothesis. On basis of all data epidemiologist form hypothesis.
Cross-sectional studies Cross-sectional study is also called prevalence
study. Cross-sectional study is the simplest form of
observational study. It is based on single examination of cross-section
of population at one point of time. If the sampling methodology is accurate, results
can be projected to the entire population. They are more useful for chronic illnesses, e.g.
hypertension. Cross-sectional studies save on time and
resources, but provide very little information about natural history of disease and incidence of illness.
Case- control studies
It start from effect and then proceed to cause Both exposure and outcome have occurred
before start of the study The study proceeds backwards from effect to
cause

Select subjects based on their disease status.
A group of individuals that are disease positive (the "case" group) is compared with a group of disease negative individuals (the "control" group).
The control group should ideally come from the same population that gave rise to the cases.
Basic steps in a case-control study 1. Selection of cases and controls 2. Matching 3. Measurement of exposure 4. Analysis and interpretation.
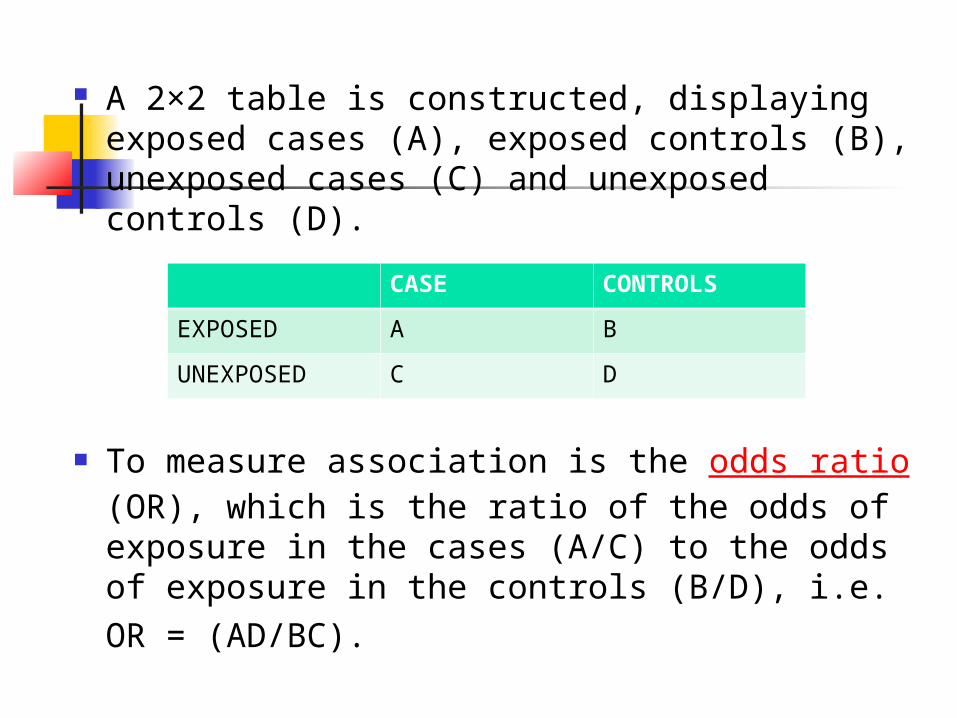
A 2×2 table is constructed, displaying exposed cases (A), exposed controls (B), unexposed cases (C) and unexposed controls (D).
To measure association is the odds ratio (OR), which is the ratio of the odds of exposure in the cases (A/C) to the odds of exposure in the controls (B/D), i.e.
OR = (AD/BC).
CASE CONTROLS
EXPOSED A B
UNEXPOSED C D

Case with lung cancer
Control without lung cancer
Smokers (less than 5 )
33 (a) 55 (b)
Non-Smokers (less than 5 )
2 (c) 27 (d)
The first step is to find out1. Exposure rates among cases
=a/(ac) = 33/35 =94.2%2. Exposure rate among the controls
=b/(bd) = 55/82 =67%
If the exposure rate among the cases is more than the controls.
We must see if the exposure rate among the cases is significantly more than the controls. This is done by using the chi-square test
It is significant if p is less than 0.05.

Odds ratio
It is a measure of strength of association between the risk factor and outcome.
The derivation of the odds ratio is based on three assumptions:
● The disease being investigated is relatively rare● The cases must be representative of those with the
disease● The controls must be representative of those
without the disease.

Odds ratio a.d/b.c
33X27/55X2 = 8.1 People who smoke less than 5 cigarettes per
day showed a risk of having lung cancer 8.1 times higher as compared to non-smokers.
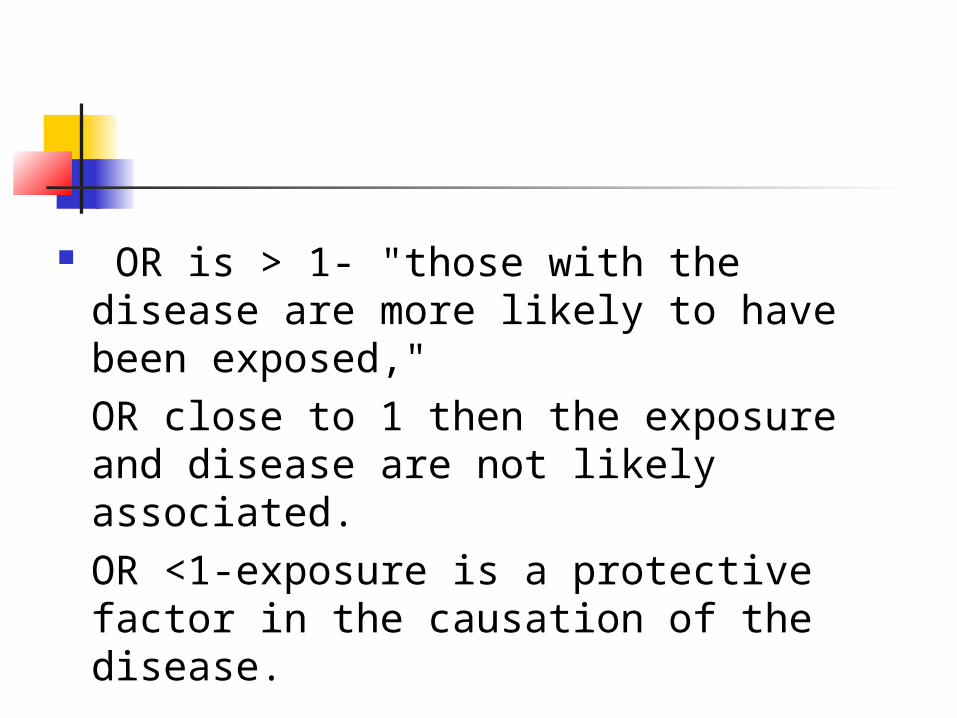
OR is > 1- "those with the disease are more likely to have been exposed,"
OR close to 1 then the exposure and disease are not likely associated.
OR <1-exposure is a protective factor in the causation of the disease.

Case control studies are usually faster and more cost effective
Sensitive to bias (selection bias). The main challenge is to identify the appropriate
control group; The distribution of exposure among the control
group should be representative of the distribution in the population that gave rise to the cases.

Cohort Study
It look at cause and proceed to effect study before the disease is manifest and
proceed to study over a period of time for the disease to occur.
Cohort means a group of people sharing a common experience.
Cohort studies are often prospective studies, they can be retrospective also, or a combination of both prospective and retrospective components can be brought in.
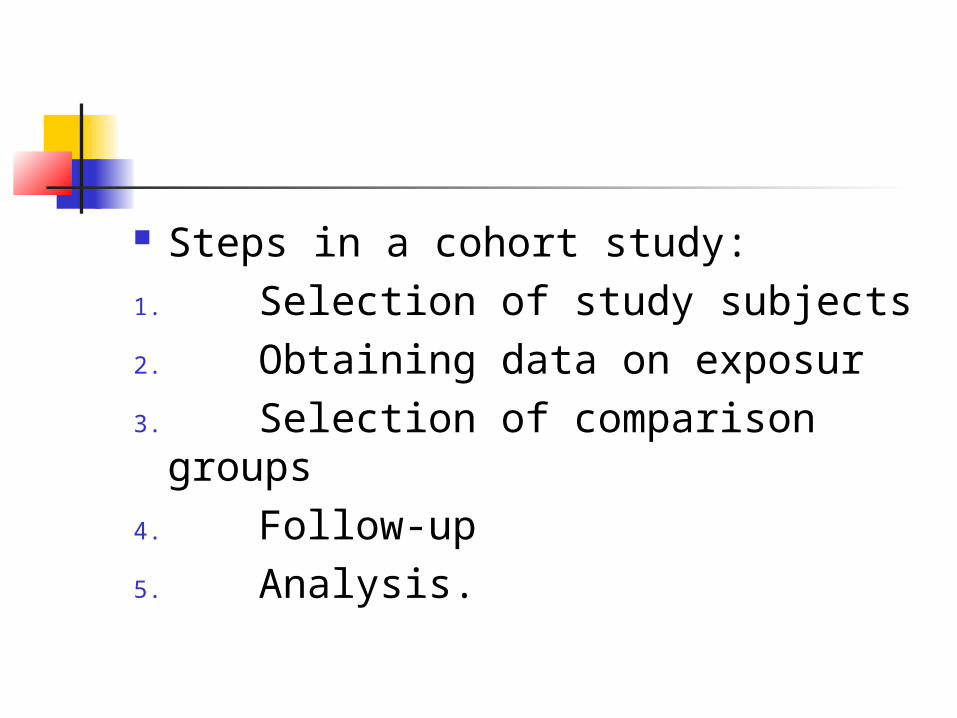
Steps in a cohort study:1. Selection of study subjects2. Obtaining data on exposur3. Selection of comparison
groups4. Follow-up5. Analysis.

CHD Develop
CHD does not develop
total
Smoker 84 (a) 2916 (b) 3000 (a+b)
Nno-smoker
87 (C) 4913 (d) 5000 (c+d)
Total 171 (a+c) 7829 (b+d) 8000
The incidence rates of CHD among smokers i.e. a/(a+b)=84/3000 =28 per 1000
The incidence rates of CHD among non-smokers i.e. =c/(c+d)=87/5000 =17.4 per 1000
Then, we must determine if the incidence rate among the smokers is significantly more than among the non-smokers by using the chi-square test.
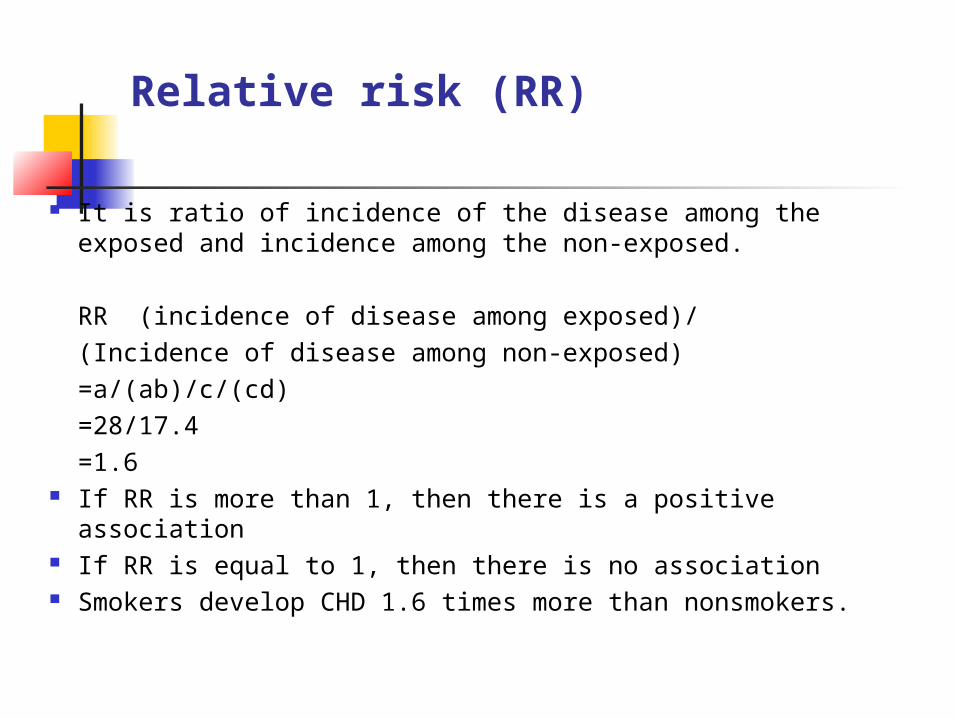
Relative risk (RR)
It is ratio of incidence of the disease among the exposed and incidence among the non-exposed.
RR (incidence of disease among exposed)/(Incidence of disease among non-exposed)
=a/(ab)/c/(cd) =28/17.4 =1.6
If RR is more than 1, then there is a positive association If RR is equal to 1, then there is no association Smokers develop CHD 1.6 times more than nonsmokers.
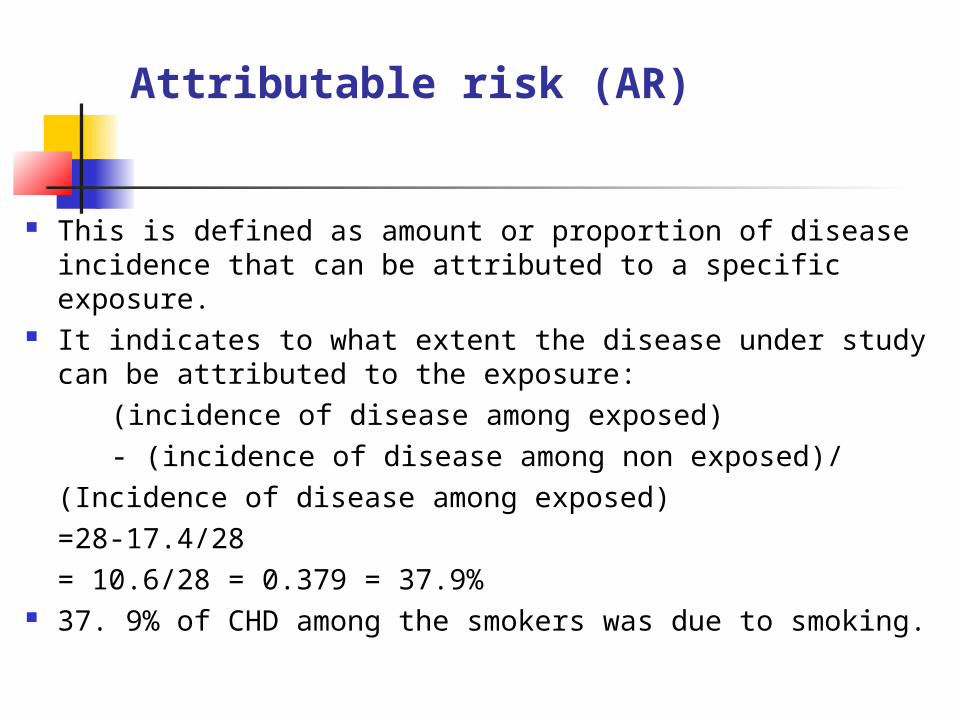
Attributable risk (AR)
This is defined as amount or proportion of disease incidence that can be attributed to a specific exposure.
It indicates to what extent the disease under study can be attributed to the exposure:
(incidence of disease among exposed) - (incidence of disease among non exposed)/
(Incidence of disease among exposed)=28-17.4/28 = 10.6/28 = 0.379 = 37.9%
37. 9% of CHD among the smokers was due to smoking.

Differences between case-control andcohort studies
Case-control Cohort studiesProceeds from effect to ● Proceeds from cause to cause effectStarts with the disease ● Starts with people exposed to risk factorRate of exposure among ● Tests frequency of disease exposed and those not among those exposed and exposed is studied those not exposedFirst approach to testing ● Reserved for testing hypothesis precisely define
hypothesis
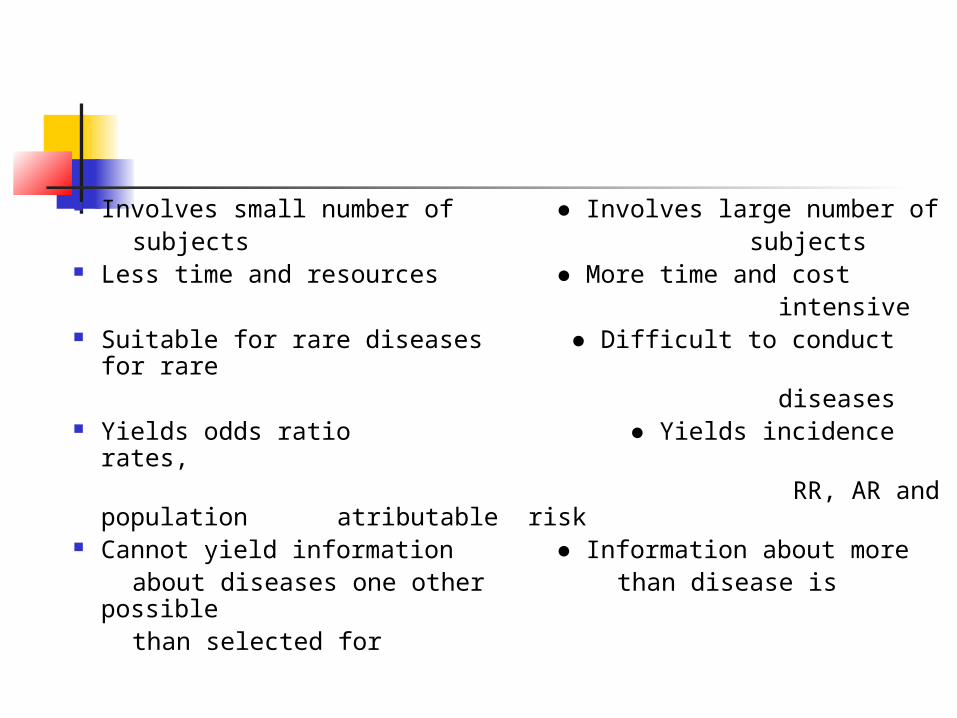
Involves small number of ● Involves large number of
subjects subjects Less time and resources ● More time and cost intensive Suitable for rare diseases ● Difficult to conduct for
rare diseases Yields odds ratio ● Yields incidence rates, RR, AR and population
atributable risk Cannot yield information ● Information about more about diseases one other than disease is possible than selected for

Randomized Control Studies
Essential elements are: Drawing up a strict protocol, selecting reference and experimental populations, randomization, intervention, follow-up assessment of outcome.

Randomization is a statistical procedure whereparticipants are allocated into groups called
study and control groups to receive or not to receive an experimental therapeutic or preventive procedure, intervention.
Randomization is an attempt to avoid bias and allow comparability.
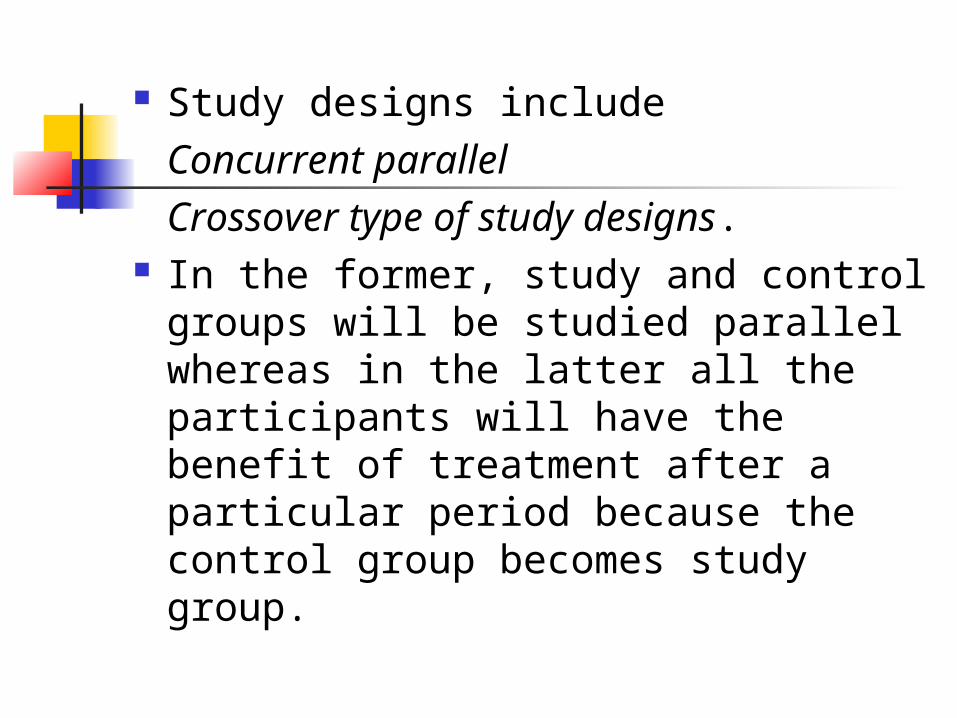
Study designs include Concurrent parallel Crossover type of study designs.
In the former, study and control groups will be studied parallel whereas in the latter all the participants will have the benefit of treatment after a particular period because the control group becomes study group.
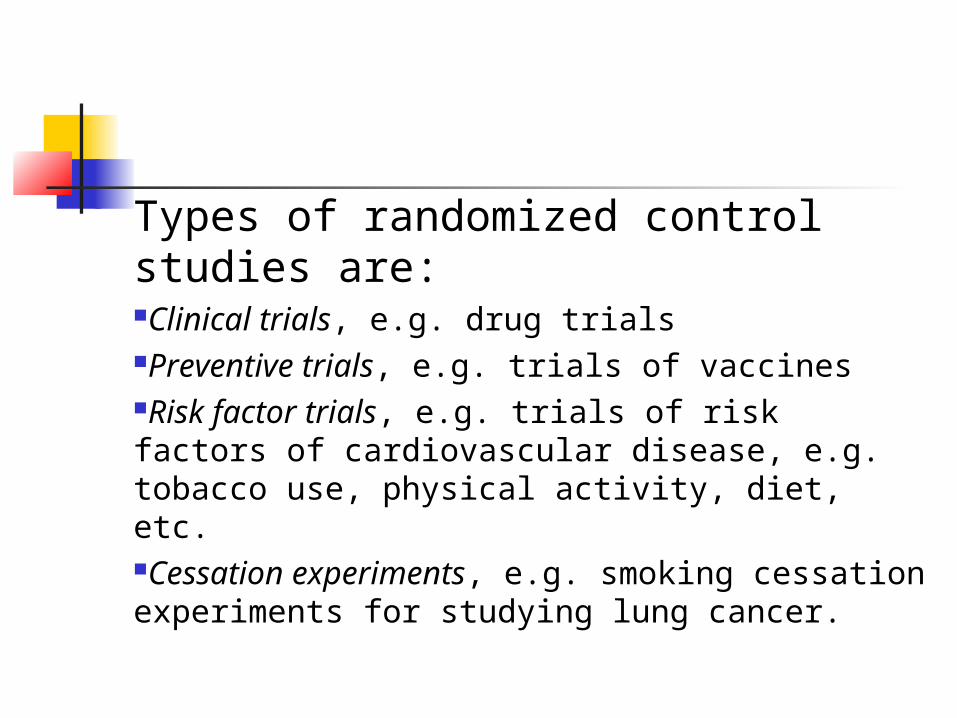
Types of randomized control studies are:Clinical trials, e.g. drug trialsPreventive trials, e.g. trials of vaccinesRisk factor trials, e.g. trials of risk factors of cardiovascular disease, e.g. tobacco use, physical activity, diet, etc.Cessation experiments, e.g. smoking cessation experiments for studying lung cancer.
What is bias?
Bias is systematic error that comes in. Bias on the part of participants if they know
they belong to study group—participant bias bias because of observer if he knows that he
is dealing with study group—observer bias bias because of investigator investigator
bias, if he knows he is dealing with study group.
In order to prevent this, a technique called blinding is adopted.

Concept of blinding
Single blind trial means participant will not know whether he belongs to study group or control group.
In double blind studies, both the participant and the observer will not be aware.
In triple blind study, the participant, observer as well as the investigator will not be aware