Epidemiology and risk factors-Viegi - World Allergy … and ris… · · 2015-10-02Epidemiology...
92
Epidemiology and risk factors for asthma and COPD Director , CNR Institute of Biomedicine and Molecular Immunology “Alberto Monroy”, Palermo, Italy Head, Pulmonary Environmental Epidemiology Unit, CNR Institute of Clinical Physiology, Pisa, Italy Professor of “Health Effects of Pollution”, School of Environmental Sciences, University of Pisa, Italy 2006-07 Past-President , European Respiratory Society (ERS) Member of Planning Group , Global Alliance against chronic Respiratory Diseases (GARD ) DURATION: 25’ Giovanni Viegi, MD
Transcript of Epidemiology and risk factors-Viegi - World Allergy … and ris… · · 2015-10-02Epidemiology...

Epidemiology and risk factors for asthma and COPD
Director , CNR Institute of Biomedicine and Molecular Immunology “Alberto Monroy”, Palermo, Italy
Head,Pulmonary Environmental Epidemiology Unit, CNR Institute of Clinical Physiology, Pisa, Italy
Professorof “Health Effects of Pollution”, School of Environmental Sciences, University of Pisa, Italy
2006-07 Past-President, European Respiratory Society (ERS)
Member of Planning Group, Global Alliance against chronic Respiratory Diseases (GARD) DURATION: 25’
Giovanni Viegi, MD


Viegi et al, CHEST 2004


Silva et al, CHEST 2004


Bleecker, Chest 2004

• Globally, about 250000 people die of asthma every year
http://www.ginasthma.orghttp://www.who.int/gard
0
50000
100000
150000
200000
250000
300000
World High Upper-Middle
Lower-Middle
Low
Deaths by Income
Asthma mortality

www.who.int
Asthma mortality

Asthma mortality rates (deaths per 100,000 persons 5 to 34 years of age) in 20 countries since 1960 (gray circles and interpolation) and the smoot hed fit with 90% confidence intervals (black lines).
Wijesinghe M et al. Chest 2009;135:1045-1049 ©2009 by American College of Chest Physicians
The countries included are Australia, Austria, Belgium, Canada, Denmark, Engla nd and Wales, Finland, France, Germany, Hong Kong, Italy, Japan, the Nethe rlands, New Zealand, Norway, Republic of Ireland, Scotland, Spain, Sweden, and the United States.
Asthma mortality trends

EUROPE A: Andorra – Austria – Belgium – Croatia - Czech Republi c – Denmark - Finland - France –Germany – Greece - Iceland – Ireland - Israel – Italy – L uxembourg – Malta – Monaco – Netherlands -Norway – Portugal - San Marino – Slovenia - Spain - Swed en – Switzerland - United Kingdom
EUROPE B: Albania – Armenia – Azerbaijan - Bosnia and Herzegov ina – Bulgaria – Georgia –Kyrgyzstan - Poland - Romania – Slovakia – Tajikistan - The former Yugoslav Republic of Macedonia –Turkey – Turkmenistan – Uzbekistan - Yugoslavia EUROPE C: Belarus – Estonia - Hungary – Kazakhstan – Latvia – Li thuania - Republic of Moldova -Russian Federation - Ukraine
Trends of Asthma mortality in EuropeTrends of Asthma mortality in Europe
http://data.euro.who.int
Updated:July 2010
Asthma mortality trends

Asthma mortality

Asthma Prevalence in the WorldAsthma Prevalence in the World
http://www.ginasthma.orgWHO-OMS 2007http://www.who.int/gard
Aria update 2007http://www.whiar.org
• 300 million people of all ages have Asthma.The prevalence of asthma varies highly around the World (from 1 to 18%).
Asthma prevalence

www.who.int
Asthma prevalence

0
50000
100000
150000
200000
250000
World High Upper-Middle
Lower-Middle
Low
Asthma Prevalence (000s) in WHO Regions Asthma Prevalence (000s) in WHO Regions -- Estimates for 2004 Estimates for 2004 --
Cases of reported wheeze in the last 12 months plus current bronchial hyperresponsiveness, defined as a 20% fall in FEV1 with a provoking concentration of histamine (PC20) at 8 mg/ml or les s.
Graphic by original data in: GBD 2004 SUMMARY TABLE S,October 2008, http://www.who.int/evidence/bod
Prevalence by Income
Asthma prevalence

Sample: 6,543 subjects, median age 30 years (range: 8-93 years), 53% males.
The overall self-reported prevalence of asthma was 13%. Direct standardization with the UAE population as the reference yielded a prevalence of 12%.
In aged 13-19 years, males had a significantly higher prevalence of asthma [17 and 14%; adjusted odds ratio (OR): 1.45; 95% confidence interval (CI): 1.10-1.90]In aged >19 years, males had a significantly lower prevalenceof asthma (11 and 13%; adjusted OR: 0.77; 95% CI: 0.60-0.95) than females.
Prevalence and risk factors of asthma among adolesc ents and their parents in Al-Ain (United Arab Emirates). Alsowaidi S et al - Respiration 2010
Asthma prevalence

Asthma Asthma Trends in the Trends in the
worldworld
Asthma prevalence trends

Asthma prevalence

• The average age of the world’s population is increasing at an unprecedented rate.
• The number of people worldwide 65 and older is estimated at 506 million as of midyear 2008; by 2040, that number will hit 1.3 billion.
• Thus, in just over 30 years, the proportion of older people will double from 7% to 14% of the total world population.


• Prevalence of asthma is similar in older and younger adults.
• Asthma in the elderly patient is underdiagnosed because of false perceptions by both patient and physician.
• Asthma is undertreated in the older population.
• The high incidence of comorbid conditions in the elderly patient makes the diagnosis and management more difficult.
Asthma in the elderly

Asthma Diagnosis was reported by 10 (3.3%) centenarians includingseven (2.7%) females and three (7.0%) males. The mean age at diagnosis was 89.6 ±10.7 years! There were no reported cases of childhood-onset asthma among centenarians (possible low reliability of self-reported life-long medical hist ory?)
301 subjects over the age of 100 years
Asthma in the elderly

National income, self-reported wheezing and asthma diagnosis from the World Health Survey. Sembajwe G et al. Eur Respir J 2009
0% 5% 10% 15% 20% 25% 30% 35%Prevalence
FIGURE 2: WHS weighted prevalence and 95% confidenc e intervals of diagnosed asthma by country and per capita gross national income adjusted for purchasin g power parity (GNI PPP) – Part I of III
Self-reported asthma

0% 5% 10% 15% 20% 25% 30% 35%Prevalence
FIGURE 2: WHS weighted prevalence and 95% confidenc e intervals of diagnosed asthma by country and per capita gross national income adjusted for purchasin g power parity (GNI PPP) – Part II of III
National income, self-reported wheezing and asthma diagnosis from the World Health Survey. Sembajwe G et al. Eur Respir J 2009
Self-reported asthma

FIGURE 2: WHS weighted prevalence and 95% confidenc e intervals of diagnosed asthma by country and per capita gross national income adjusted for purchasin g power parity (GNI PPP) – Part III of III
0% 5% 10% 15% 20% 25% 30% 35%Prevalence
National income, self-reported wheezing and asthma diagnosis from the World Health Survey. Sembajwe G et al. Eur Respir J 2009
Self-reported asthma

Trends in hospital admission rates in Europe (inTrends in hospital admission rates in Europe (in--patienspatiensper 1000 populations) per 1000 populations) –– Main diagnosis: AsthmaMain diagnosis: Asthma
www.euro.who.int/InformationSources/Data
Last update August 2009
Asthma exacerbation

COPD mortality
0
500000
1000000
1500000
2000000
2500000
3000000
3500000
World High Upper-Middle
Lower-Middle
Low
• More than 3 million people died of COPD in 2005, which corresponds to 5% of all deaths globally.
• Almost 90% of COPD deaths occur in low-and middle-income countries.
WHO-OMS 2007, http://www.who.int/gard
Deaths by Income

Graphic by Original data in Table 3
0 20 40 60 80 100 120 140
Japan
France
Germany
Italy
Russia
UK
Iran
Philippines
M exico
USA
Ukraine
Egypy
Turkey
Brazil
Thailand
Nigeria
Congo
Ethiopia
M yanmar
Indonesia
Bangladesh
Pakistan
India
Vietnam
ChinaCOPD mortality

• Total deaths from COPD are projected to increase and WHO predicts that COPD will become the third leading cause of death worldwide by 2030.
www.who.int/whosis/whostat/2008/en/index.html COPD mortality

COPD mortality trends

Currently, approximate estimates indicate COPD is the fifth leading cause of global morbidity (210 million people with COPD).In 2010 the disease is expected to rank as number three.
WHO-OMS 2007, http://www.who.int/gard
COPD prevalence

0
10000
20000
30000
40000
50000
60000
70000
World High Upper-Middle
Lower-Middle
Low
COPD Prevalence (000s) in WHO Regions -Estimates for 2004
Chronic (stable) airways obstruction with FEV1< 1 l itre (corresponding to symptomatic disability)
Graphic by original data in: GBD 2004 SUMMARY TABLE S,October 2008, http://www.who.int/evidence/bod
COPD prevalence
Income

COPD Prevalence
COPD prevalence

PURPOSE: Chronic Obstructive Pulmonary Disease (COPD) is a common diseaseworldwide. There are no reports about the prevalence of COPD in the United ArabEmirates (U.A.E.). We therefore conducted a study to determine the prevalence of COPD in U.A.E.METHODS: This cross-sectional study is being conducted at the division of Respiratorymedicine, Zayed Military Hospital, UAE. Individuals were randomly sampled using a sampling frame of individuals working for the military and their dependents (includingparents). Inclusion criteria were (1) age 40 years and (2) ability to perform spirometry. Global Initiative for Chronic Obstructive Lung Disease (GOLD) definition i.e. FEV1 / FVC < 70% post bronchodilation was being used to diagnose COPD. RESULTS: Out of a targeted 1000 subjects, 218 have been studied so far. Mean age of participants is 58.5 years.10 subjects met the COPD diagnosis criteria (4.6%).CONCLUSION: COPD prevalence in U.A.E. is comparable to other countries. CLINICAL IMPLICATIONS: This study provides the first data on COPD prevalence in U.A.E. We included potentially new risk factors for COPD that were not previouslystudied. Examples: Shisha smoking and scent/bakhour inhalation which is unique to the arabic culture. We expect to have enough power to analyze their impact at the end of the study.
COPD prevalence

COPD prevalence trends

Trends in hospital admission rates (In-patiens per 1000 populations)Main diagnosis: COPD and bronchiectasis
www.euro.who.int/InformationSources/Data
COPD morbidity trends

RISK FACTORS

Risk Risk Factors for Factors for AsthmaAsthma

www-goldcopd.com
Risk factors for COPDRisk factors for COPD

Obesity

et Al
Baseline in 1990 FU in 2003
(73-82yrs)
Obesity

Truncated
Age of the sample at baseline(size)
Obesity

15+ aged
Current smoking

Prevalence of smoking habit in UAE
Current smoking

COPD defined by : Spirometry or Patient-reported Diag nosis or Physicians diagnosis or Physical/radiography
Spirometric criteria in the Studies included in the meta-analysis:
Current smoking

ERS (1995) : FEV1/VC<88% predicted in men, <89% predicted in women
Clinical : FEV1/FVC<0.70
ATS (1995) : FEV1/FVC<0.75
Current smoking

WAO White Book, first Ed, 2010, in press. Chapter: Environmental risk factors: indoor and outdoor pollution. Maio S, CerraiS, Simoni M, Sarno G, Baldacci S, Viegi G..
Com
bust
ion
Unvented Gas/Kerosene heaters
CO2CO NO2
Biomass (wood/coal) for heating/cooking
PM
Tobacco
ETS
ETS
SO2
Vehicular Traffic
Coal/petrol/wood/gas for heating, industry, power plants, fires
VOCs
Wood (fireplaces)/Gas ranges-pilot lights
New furnitures, solvents, painting, adhesives, insulation, cleaning products,
materials for offices,
Radon O3
Building materials, water
Sources Pollutants
Indoor Outdoor
COx=Carbon Oxides, NO2 =Nitrogen dioxide, PM=Particulate Matter, ETS=Environmental Tobacco Smoke, SO2 =Sulphur dioxide, VOCs=Volatile Organic Compounds, O3 =Ozone (secondary pollutant)
Figure 1. Main anthropogenic outdoor/indoor pollutants and relative sources.

Viegi G and Baldacci S, Eur Respir Mon, 2002
Outdoor pollution

EnvironEnviron HealthHealth PerspectPerspect 20102010
A A significantsignificant changechange of +2.8% in asthma symptoms, +1.2% for of +2.8% in asthma symptoms, +1.2% for
cough, and cough, and ––0.082 L/min for PEF for a 100.082 L/min for PEF for a 10--µµg/mg/m33 increase in PMincrease in PM1010
A A significantsignificant increaseincrease in in asthmaasthma symptomssymptoms of 3.1%.of 3.1%. forfor anan
increaseincrease of 10of 10 µµgg/m/m33 NONO22

Outdoor pollution

FIGURE 2. Associations between exposure to air pollutants and health outcomes according to the duration of residence at the address recorded during the survey (A: 4,907 children residing at their current address for ≥≥≥≥3 yrs; B: 2,834 children residing at their current address for ≥8 yrs; C: 2,213 children residing at their current address since birth ). a) Lifetime asthma. Marginal model adjusted for age, sex, older siblings, family history of allergy, parental education, mother’s ethnic origin, smoking at home, mould or dampness at home, natural gas used for heating, cooking or forwater-heater at home, and pets at home, with an exchangeable working correlation structure using the community as a stratum. OR were calculated per increment for the interquartile range.
Outdoor pollution
6,683 children (9–11 yrs)
a) Lifetime asthma .

FIGURE 2. Associations between exposure to air pollutants and health outcomes according to the duration of residence at the address recorded during the survey (A: 4,907 children residing at their current address for ≥≥≥≥3 yrs; B: 2,834 children residing at their current address for ≥8 yrs; C: 2,213 children residing at their current address since birth ). b) asthma in the last 1 yr ; c) sensitisation to pollens.Marginal model adjusted for age, sex, older siblings, family history of allergy, parental education, mother’s ethnic origin, smoking at home, mould or dampness at home, natural gas used for heating, cooking or forwater-heater at home, and pets at home, with an exchangeable working correlation structure using the community as a stratum. OR were calculated per increment for the interquartile range.
6,683 children (9–11 yrs)
Outdoor pollution
b) asthma in the last 1 yr c) sensitisation to pollens

Outdoor pollution

RMS = mean asthma score
Bénédicte Jacquemin et Al
Outdoor pollution

Figure 3 : Association between incidence of asthma and change in traffic-related PM10 among subgroups of never-smokers (models are adjust ed for age, sex, atopy at baseline, BMI at baseline, bronchial hyperreactivity at baseli ne, maternal allergies). Hazard ratios are presented per 1 µg/m3 dTPM10 with 95% CI (p-value for interaction for parental allergies = 0.088; all other interactions p>0.1).
SAPALDIA Study
Outdoor pollution

Maio, Chest 2009

Outdoor pollution

Outdoor pollution
50-64 years
Outdoor pollution

Outdoor pollution

ETS ETS

* Adjusted for age, educational, residence, age-residenceinteraction
Part I of II
Studio Epidemiologico Ambientale sulla Salute delle Donne (SEASD)
Po Delta, Pisa, Rome, Viterbo
ETS ETS

Part II of II
Studio Epidemiologico Ambientale sulla Salute delle Donne (SEASD)
Po Delta, Pisa, Rome, Viterbo
ETS ETS


Multivariate logistic regression analysis controlling f or age, sex, race, smoking history, educational atta inment, and marital status. Each source of ETS exposure was evaluat ed in a separate logistic regression model.
ETS ETS

TRUNCATED
TRUNCATED
ETS ETS

§ Odds ratio (OR) and 95% confidenceinterval (CI) from metaanalysis (referencegiven in brackets) or, if a summaryestimate is not available, range of OR9s from individual studies, lung functionparameter data given as effect estimate (95% CI);
# Causality as judged by the authors. Meaning of the symbols is the following. +++ causal relationship established; ++ strong evidence of a causal relationship; + some evidence of a causal relationship; 0 no clear evidence of a causal relationship.
¶ The difference in forced expiratoryvolume in one second (FEV1) levelbetween the exposed and unexposed, expressed as a percentage of the level in the unexposed group. COPD: chronicobstructive pulmonary disease.
ETS ETS

BiomassBiomass fuelfuel

Model 5 is also adj for marital status, education, re ligion, caste/tribe, hause type, separate kitchen, crowding, SES, rural/urban residence, and Region.
Truncated Table
38,595 elderly persons (India’s 2nd National Family Health Survey (NFHS-2), 1998–1999)
BiomassBiomass fuelfuel

Children
MouldMould//DampnessDampness

MouldMould//DampnessDampness

MouldMould//DampnessDampness

Median value of population attributable risk (PAR) for chronic bronchitis or airflow obstruction, due to occupational exposure, ranged from 15 to 19%.
Estimated population attributable risk (PAR) for either chronic bronchitis or airflow obstruction due to occupational factors was of 15%.
OccupationalOccupational exposuresexposures

ECRHS-II
OccupationalOccupational exposuresexposures

ECRHSECRHS
OccupationalOccupational exposuresexposures

EUROPEAN LUNG WHITE BOOK, 2003

• The WHO has estimated that 15 millionDALYs are lost annually due to asthma, representing 1% of the total global disease burden.
DALYs for Asthma in the World
WHO-OMS 2007, http://www.who.int/gard

Murray CJL, Lopez AD. eds. The Global Burden of Dise ase: a comprehensiveassessment of mortality and disability from diseases, injuries, and risk factors in 1990 and projected to 2020. Cambridge; Harvard University Press; 1996.
DALYs FOR COPD in the WORLD - PROJECTIONS -

http://www.ginasthma.orghttp://www.who.int/gard
Prevalence

WHO-OMS 2007, http://www.who.int/gard
• Considering the excess morbidity and mortality associated with chronic respiratory diseases, there is considerable interest in directing research at identifying modifiable Risk Factors.

PreventionPrevention
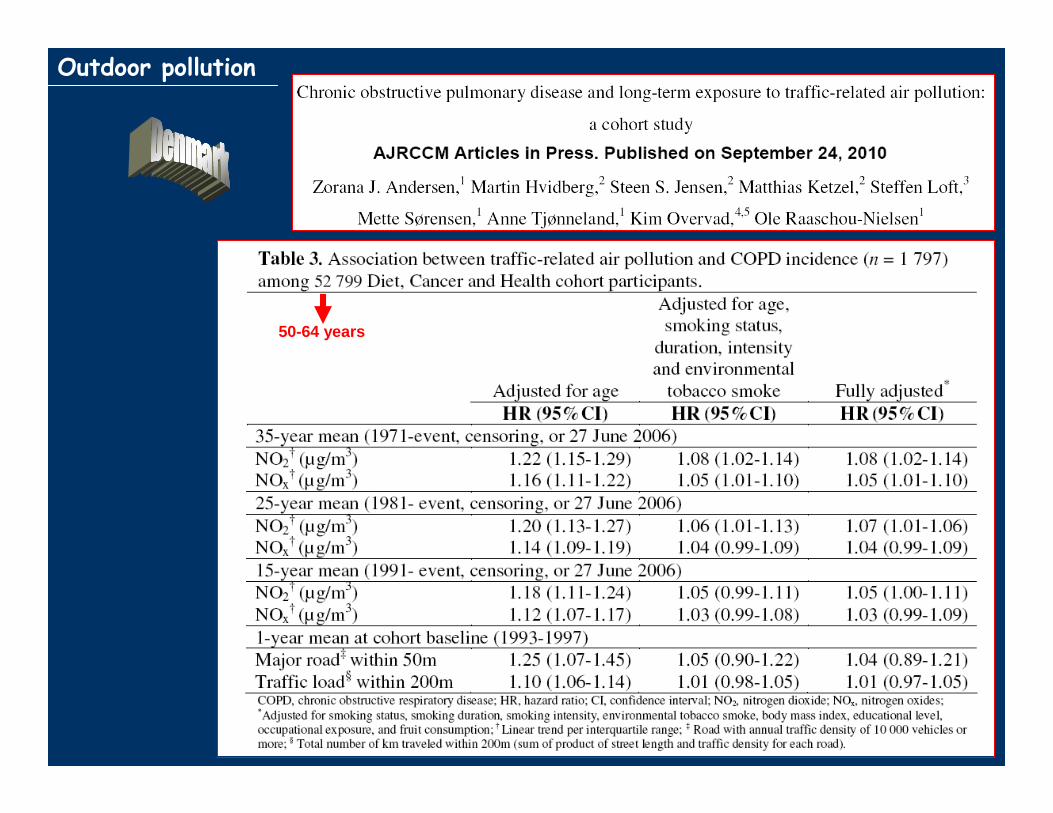
Prevention strategies for COPD:
- Primary (smoking cessation and adequatetreatment of asthma)
- Secondary (early detection and modification of risk factor exposure)
- Tertiary (prevention of complication)
Mannino and Buist, Lancet 2007
PreventionPrevention

• 31 May 2007: ban on smoking in government buildings and public places.
• 15 September 2007: smoking areas in cafés and restaurants with designated prerequisites (proper ventilation and smoke absorbers). Persons under 21 are not allowed into these areas.
• 15 November 2007: ban on smoking in educational establishments (including schools and universities), as well as in hair salons, health clubs, internet cafés, food courts and offices.
• 15 January 2008: smoking ban in hotels and hotel apartments.
• January 2010, a smokefree law was signed that included public transport, enclosed public places, and vehicles in which children under 12 years were riding.
The Federal AntiThe Federal Anti--smoking legislation in UAEsmoking legislation in UAEETS ETS

active smoke
ETS in non-smokers
PM10
combined abatement
PreventionPrevention

The alternative transportation strategy implemented during the 2008 Summer Olympic Games in Beijing provided an opportunity to studythe impact of the air pollution control measures and weather conditions on air quality and asthma morbidity.
The average number of outpatient visits for asthma per day during the Olympics showed a 41.6% overall decrease. The G ames were associated with a significant reduction in asthma v isits (RR 0.58, 95%CI: 0.52-0.65).
Along with "good" weather conditions, efforts to reduce traffic congestion in Beijing during the Olympic Games were associated with a prolonged reduction in air pollution and significantly lower rates of adult asthma events.
These data provide support for efforts to reduce air pollution and improve health via reductions in motor vehicle traffic.
Impact of air pollution control measures and weathe r conditions on asthma during the 2008 Summer Olympic Games in Beij ing . Li Y, Wang W, Wang J, Zhang X, Lin W, Yang Y. Int J Biometeorol. 2010
Outdoor pollution

WHO calls for a global and coordinated effortto fight chronic respiratory diseases and allergies
GARD


http://www.ncdalliance.org
http://www.uicc.org

“Many thanks
for the invitation
and for the attention”
Giovanni Viegi
Pisa
Palermo