Epic research special report of 04 aug 2015
8
DAILY REPORT 04 th AUG. 2015 YOUR MINTVISORY Call us at +91-731-6642300 Global markets at a glance Asian shares edged lower on Tuesday after downbeat eco- nomic data pressured Wall Street ahead of key U.S. jobs data later this week that could provide a key clue to the timing of the U.S. Federal Reserve's interest rate increase. MSCI's broadest index of Asia-Pacific shares outside Japan MIAPJ0000PUS was down 0.2 percent in early trading, while Japan's Nikkei stock index slipped 0.5 percent, after breaking a three-day winning streak in the previous ses- sion. U.S. equities markets logged solid losses on Monday, after manufacturing data from China and U.S. figures released on Monday both disappointed. The Institute for Supply Management's index of national factory activity slipped to 52.7 in July, falling short of expectations that it would match last month's reading of 53.5. The weak reading, combined with the rout in oil prices that raised fears of dis- inflation, led investors to pare bets that the U.S Federal Reserve's long-awaited interest rate hike will come as early as September. European shares rose on Monday, shrugging off a slump for the Greek stock market when it reopened after a five-week shutdown, as strong results from Heineken and banks sup- ported the broader market. The pan-European FTSEurofirst 300 index rose 0.7 percent to 1,583.52 points. The euro zone's blue-chip Euro STOXX 50 index gained 1 percent, Germany's DAX advanced 1.2 percent and France's CAC 0.8 percent. The STOXX European 600 Banking Index gained 0.5 percent. Shares in HSBC edged up after the bank reported higher first-half earnings and announced the sale of its Bra- zilian unit to Banco Bradesco SA for $5.2 billion. Previous day Roundup The market ended with gains ahead of monetary policy re- view tomorrow. The Sensex ended up 72.50 points at 28187.06 and the Nifty was up 10.20 points at 8543.05. About 1775 shares advanced, 1147 shares declined, and 148 shares are unchanged. Index stats The Market was very volatile in last session. The sartorial indices performed as follow; Consumer Durables [up 151.42pts], Capital Goods [up 60.95pts], PSU [up 39.72pts], FMCG [up 23.33pts], Realty [up 4.29pts], Power [up 15.08pts], Auto [up 139.27pts], Healthcare [up 56.47Pts], IT [down 58.81pts], Metals [down 93.86pts], TECK [down 17.15pts], Oil& Gas [down 50.20pts]. World Indices Index Value % Change D J l 17598.20 -0.52 S&P 500 2098.04 -0.28 NASDAQ 5115.38 -0.25 FTSE 100 6688.62 -0.11 Nikkei 225 20526.94 -0.10 Hong Kong 24328.75 -0.34 Top Gainers Company CMP Change % Chg SBIN 281.25 11.20 4.15 BANKBARODA 184.80 7.30 4.11 ICICIBANK 312.25 9.85 3.26 PNB 155.00 4.00 2.65 BOSCHLTD 25,300.00 630.30 2.55 Top Losers Company CMP Change % Chg DRREDDY 4,163.65 87.55 2.15 IBULHSGFIN 759.20 21.00 2.84 JUBILANT 274.55 10.60 4.02 LICHSGFIN 514.40 15.20 3.04 MARUTI 4,434.00 102.55 2.37 Stocks at 52 Week’s HIGH Symbol Prev. Close Change %Chg DRREDDY 4,163.65 87.55 2.15 IBULHSGFIN 759.20 21.00 2.84 JUBILANT 274.55 10.60 4.02 LICHSGFIN 514.40 15.20 3.04 Indian Indices Company CMP Change % Chg NIFTY 8543.05 +10.20 +0.12 SENSEX 28187.06 +72.50 +0.26 Stocks at 52 Week’s LOW Symbol Prev. Close Change %Chg NMDC 101.35 -0.55 -0.54 TITAN 316.70 -6.95 -2.15
-
Upload
epic-research-private-limited -
Category
Business
-
view
76 -
download
0
Transcript of Epic research special report of 04 aug 2015

DAILY REPORT
04th
AUG. 2015
YOUR MINTVISORY Call us at +91-731-6642300
Global markets at a glance
Asian shares edged lower on Tuesday after downbeat eco-nomic data pressured Wall Street ahead of key U.S. jobs data later this week that could provide a key clue to the timing of the U.S. Federal Reserve's interest rate increase. MSCI's broadest index of Asia-Pacific shares outside Japan MIAPJ0000PUS was down 0.2 percent in early trading, while Japan's Nikkei stock index slipped 0.5 percent, after breaking a three-day winning streak in the previous ses-sion.
U.S. equities markets logged solid losses on Monday, after manufacturing data from China and U.S. figures released on Monday both disappointed. The Institute for Supply Management's index of national factory activity slipped to 52.7 in July, falling short of expectations that it would match last month's reading of 53.5. The weak reading, combined with the rout in oil prices that raised fears of dis-inflation, led investors to pare bets that the U.S Federal Reserve's long-awaited interest rate hike will come as early as September.
European shares rose on Monday, shrugging off a slump for the Greek stock market when it reopened after a five-week shutdown, as strong results from Heineken and banks sup-ported the broader market. The pan-European FTSEurofirst 300 index rose 0.7 percent to 1,583.52 points. The euro zone's blue-chip Euro STOXX 50 index gained 1 percent, Germany's DAX advanced 1.2 percent and France's CAC 0.8 percent. The STOXX European 600 Banking Index gained 0.5 percent. Shares in HSBC edged up after the bank reported higher first-half earnings and announced the sale of its Bra-zilian unit to Banco Bradesco SA for $5.2 billion.
Previous day Roundup
The market ended with gains ahead of monetary policy re-view tomorrow. The Sensex ended up 72.50 points at 28187.06 and the Nifty was up 10.20 points at 8543.05. About 1775 shares advanced, 1147 shares declined, and 148 shares are unchanged.
Index stats
The Market was very volatile in last session. The sartorial indices performed as follow; Consumer Durables [up 151.42pts], Capital Goods [up 60.95pts], PSU [up 39.72pts], FMCG [up 23.33pts], Realty [up 4.29pts], Power [up 15.08pts], Auto [up 139.27pts], Healthcare [up 56.47Pts], IT [down 58.81pts], Metals [down 93.86pts], TECK [down 17.15pts], Oil& Gas [down 50.20pts].
World Indices
Index Value % Change
D J l 17598.20 -0.52
S&P 500 2098.04 -0.28
NASDAQ 5115.38 -0.25
FTSE 100 6688.62 -0.11
Nikkei 225 20526.94 -0.10
Hong Kong 24328.75 -0.34
Top Gainers
Company CMP Change % Chg
SBIN 281.25 11.20 4.15
BANKBARODA 184.80 7.30 4.11
ICICIBANK 312.25 9.85 3.26
PNB 155.00 4.00 2.65
BOSCHLTD 25,300.00 630.30 2.55
Top Losers
Company CMP Change % Chg
DRREDDY 4,163.65 87.55 2.15
IBULHSGFIN 759.20 21.00 2.84
JUBILANT 274.55 10.60 4.02
LICHSGFIN 514.40 15.20 3.04
MARUTI 4,434.00 102.55 2.37
Stocks at 52 Week’s HIGH
Symbol Prev. Close Change %Chg
DRREDDY 4,163.65 87.55 2.15
IBULHSGFIN 759.20 21.00 2.84
JUBILANT 274.55 10.60 4.02
LICHSGFIN 514.40 15.20 3.04
Indian Indices
Company CMP Change % Chg
NIFTY 8543.05 +10.20 +0.12
SENSEX 28187.06 +72.50 +0.26
Stocks at 52 Week’s LOW
Symbol Prev. Close Change %Chg
NMDC 101.35 -0.55 -0.54
TITAN 316.70 -6.95 -2.15
DAILY REPORT
04th
AUG. 2015
YOUR MINTVISORY Call us at +91-731-6642300
STOCK RECOMMENDATION [CASH]
1. JUBILANT (CASH)
After consolidating around 270 Jubilant given breakout today and finished at 275.80 with 4.49% gain on EOD chart, Today it made new 52 week high of 277.90 since still momentum indicator showing positive move so we advise so to buy it above 278 use strict stop loss of 274 for target of 281-285-290
MACRO NEWS
Results today: Bharti Airtel , Britannia Industries , Fu-ture Lifestyle Fashions, Godrej Properties, Hexaware Technologies, JK Tyre, Torrent Power, TV Today, Astra-Zeneca, Capital First, Clariant Chemicals, EID Parry, EIH, ENIL, Grindwell, Hinduja Ventures, IITL, Indian Hume Pipe, Mangalam Drugs, MEP Infrastructure, MM For-gings, Multibase, Orient Cement, Peninsula Land, SPIC, Sundaram Clayton, Tamilnadu Petro, Oudh Sugar Mills
RBI likely to cut rate by 0.25% today in monetary policy around 11 a.m.
FinMin to give Rs 1,300 cr kerosene subsidy
Bharatmala project: Govt to develop 7,000 kms of NHs for Rs 80,000 cr
CBI says Loop Telecom Ltd was front company for Essar
FDI in petroleum and gas sector jumps 10 times
Reliance, Essar Oil to supply diesel to Railways
Mahindra Two Wheelers sales up 10.22 per cent in July
Berger Paints India plans 2 new plants in Assam
Centre has identified 200 sites for new thermal power projects
Hero Motocorp Q1 -Net profit up 33.3% at Rs 750.3cr vs Rs 562.7cr (YoY)
STOCK RECOMMENDATIONS [FUTURE]
1. HCL TECH [FUTURE]
Due to below expectation result of Q1 HCL TECH future to-day faced selling pressure and finished with 5.76% loss and on EOD chart it is forming channel so we can see breakdown for that we advise to sell it around 945-948 use stop loss of 963 for target of 935-920-900
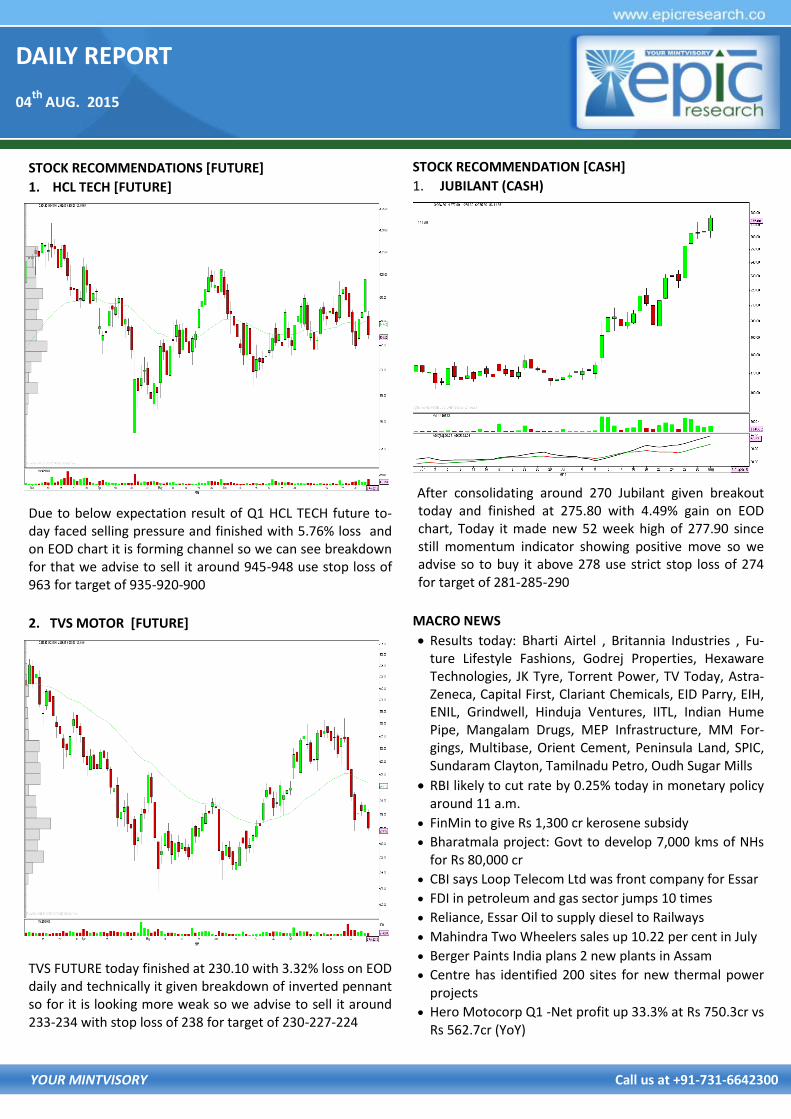
2. TVS MOTOR [FUTURE]
TVS FUTURE today finished at 230.10 with 3.32% loss on EOD daily and technically it given breakdown of inverted pennant so for it is looking more weak so we advise to sell it around 233-234 with stop loss of 238 for target of 230-227-224

DAILY REPORT
04th
AUG. 2015
YOUR MINTVISORY Call us at +91-731-6642300
FUTURE & OPTION
MOST ACTIVE PUT OPTION
Symbol Op-
tion
Type
Strike
Price
LTP Traded
Volume
(Contracts)
Open
Interest
NIFTY PE 8,300 9.00 12,62,696 55,89,025
NIFTY PE 8,400 36.70 8,79,465 38,57,525
BANKNIFTY PE 18,000 16.00 89,315 7,89,000
YESBANK PE 800 2.80 11,424 6,93,750
RELIANCE PE 1,000 6.90 6,247 6,57,750
MARUTI PE 4,200 3.95 5,987 1,80,375
YESBANK PE 780 0.75 5,401 2,93,000
SBIN PE 250 0.85 3,723 11,90,000
MOST ACTIVE CALL OPTION
Symbol Op-
tion
Type
Strike
Price
LTP Traded
Volume
(Contracts)
Open
Interest
NIFTY CE 8,400 24.50 17,37,962 60,13,125
NIFTY CE 8,300 91.50 5,79,894 17,08,950
BANKNIFTY CE 18,500 21.95 1,35,175 6,20,750
YESBANK CE 820 5.65 11,603 5,56,250
MARUTI CE 4,300 10.50 9,536 1,24,375
INFY CE 1,100 3.25 8,533 8,88,250
RELAINCE CE 1,020 1.35 7,895 10,03,250
SBIN CE 260 0.40 7,409 24,09,000
FII DERIVATIVES STATISTICS
BUY OPEN INTEREST AT THE END OF THE DAY SELL
No. of
Contracts Amount in
Crores No. of
Contracts Amount in
Crores No. of
Contracts Amount in
Crores NET AMOUNT
INDEX FUTURES 31175 933.05 41033 1121.37 617532 14735.45 -188.32
INDEX OPTIONS 251502 6365.36 235054 5776.83 2313646 62203.07 588.52
STOCK FUTURES 114848 3270.48 100562 2807.53 1766997 49109.09 462.94
STOCK OPTIONS 56198 1544.23 58207 1592.75 62557 1721.60 -48.52
TOTAL 814.62
STOCKS IN NEWS Bharti Airtel Q1 net seen up 6%, Africa may remain
sluggish HCL Tech Q4 net up 5.9% to Rs 1783 cr, revenue
meets street Welspun Renewables commissions 34 MW solar pro-
ject in Punjab GSK halves seretide price to take on Cipla HDFC Bank ties up with Snapdeal for co-branded
credit card NIFTY FUTURE
NIFTY FUTURE in last trading session remained steady with an upward touch and gave somewhat positive clos-ing. Having broken a strong resistance of 8500, it has closed in green though not with strongly bullish candle-sticks but overall Nifty seems to go up. So we advise you to buy it around 8550 for targets of 8650 and 8750 with strict stop loss of 8400
INDICES R2 R1 PIVOT S1 S2
NIFTY 8,594.20 8,568.60 8,538.35 8,512.75 8,482.50
BANK NIFTY 19138.15 19026.15 19904.40 18792.40 18670.65

DAILY REPORT
04th
AUG. 2015
YOUR MINTVISORY Call us at +91-731-6642300
RECOMMENDATIONS
GOLD
TRADING STRATEGY:
BUY GOLD OCT ABOVE 24980 TGTS 25060,25160 SL BE-
LOW 24890
SELL GOLD OCT BELOW 24900 TGTS 24820,24720 SL
ABOVE 24990
SILVER
TRADING STRATEGY:
BUY SILVER SEP ABOVE 33600 TGTS 33800,34100 SL BE-
LOW 33300
SELL SILVER SEP BELOW 33400 TGTS 33200,32900 SL
ABOVE 33700
COMMODITY ROUNDUP
COMEX Gold dropped as traders turned their back towards the metal after the failure of the commodity to break above $1100 per ounce. The US dollar eased swiftly and helped Gold launch an amazing turnaround from its five and half year lows near $1080 per ounce in the last session. Poor demand and lack of speculative buying had hit the metal before the latest reprieve. The commodity is quoting at $1092 per ounce right now, down 0.26% on the day. MCX Gold futures for October ended above the key Rs25000 per 10 grams in the last session, up nearly Rs 100 on the day. However, the counter as dropped under this mark today and currently quotes at Rs 24950 per 10 grams, down0.24% on the day. MCX Silver futures are trading at Rs 33845 per kg, down 0.53% on the day.
Oil prices fell in Asia today on persistent concerns about the global supply glut after the OPEC cartel's indication that it will not budge from its current lofty output levels.
Among other metals, Aluminium production is on an ele-vated levels and drastic respite from this is unlikely even though there has been some declines noted. However the prices will be keenly eyeing the upcoming events in terms of the production especially from China. In Aluminium, pro-duction numbers are worrisome and can halt the journey in coming days.
Copper prices in July 2015 settled at $ 5467.68 per tonne, down 23% from last year. The prices were $ 7104.5 per tonne during same time last year. The LME's three-month copper contract was down 1.2% at $5,165 a metric ton in morning European trading, having dipped to a low of $5,142 a ton. The prices of Copper declined by 6.2% from June 2015 when they were $ 5833.61 per tonne. On Monday, MCX Copper was trading at Rs 333.75 per kg, down 0.5%.
Copper sank to six year lows on LME today, while other ex-changes also faced collapse after China reported yet an-other depletion in the PMI numbers. The official PMI num-bers of China declined in the month of July 2015 causing panic selling in commodities like Copper and Aluminium. The Caixin China manufacturing PMI, fell to a final reading of 47.8 in July, a two-year low. A number below 50 indicates economic contraction. This followed Saturday's announce-ment by the government's National Bureau of Statistics that China's official PMI slipped to 50 in July from 50.2 in June.

DAILY REPORT
04th
AUG. 2015
YOUR MINTVISORY Call us at +91-731-6642300
NCDEX
RECOMMENDATIONS
DHANIYA
BUY CORIANDER SEP ABOVE 11129 TARGET 11154 11194
SL BELOW 11099
SELL CORIANDER SEP BELOW 10960 TARGET 10935 10895
SL ABOVE 10990
GUARSGUM
BUY GUARGUM OCT ABOVE 8220 TARGET 8270 8340 SL
BELOW 8160
SELL GUARGUM OCT BELOW 7980 TARGET 7930 7860 SL
ABOVE 8040
NCDEX ROUNDUP
Fresh short position was seen in chana futures due to
steady sowing progress of kharif pulses in major producing
regions along with surge in daily arrivals in local mandies.
The NCDEX Chana futures declined by 0.20% today. As per
the latest release from Ministry of Agriculture, the total
pulses sown area as on 28th July increased by 21 percent to
reach 68.20 lakh tonnes. This was mainly due to favorable
rainfall in major pulses growing states such as Maharashtra
and Andhra Pradesh. The prices were also dampened by
strong supplies in local mandies. The daily arrivals of chana
at Delhi mandi were stood higher at 50 motors as traders
are expecting some strong measures to be taken by Indian
Food Ministry to increase pulses supplies in domestic mar-
ket. The NCDEX September Chana futures settled at Rs 4650
per quintal , down 0.20% from the last day. The NCDEX fu-
tures added 9.16 percent in open interest indicating fresh
short position by traders.
Pepper prices in Lampung and Bangka increased steadily,
though market players tracked the new arrivals from initial
harvest. Local price of black Pepper in Lampung was IDR
112,500 per Kg this week and IDR 172,000 per Kg for white
Pepper in Bangka, showing a marginal decrease of 1% from
the average price last week. In Vietnam the price of black
and white Pepper remained stable. In Sarawak, except local
price of black Pepper, the prices were also reported stable.
Indian pepper continued to rule steady at around $11.25
per kg. Indian pepper prices are up 10% over the year.
NCDEX INDICES
Index Value % Change
CAETOR SEED 4010 +0.58
CHANA 4581 -0.04
CORIANDER 10813 -4.00
COTTON SEED 1920 -1.69
GUAR SEED 3625 +1.74
JEERA 15230 +0.76
MUSTARDSEED 4174 -0.55
REF. SOY OIL 567 -1.34
SUGAR M GRADE 7328 +3.97
TURMERIC 1496 -1.25

DAILY REPORT
04th
AUG. 2015
YOUR MINTVISORY Call us at +91-731-6642300
RBI Reference Rate
Currency Rate Currency Rate
Rupee- $ 63.9623 Yen-100 51.5600
Euro 70.1602 GBP 99.9347
CURRENCY
USD/INR
BUY USD/INR AUG ABOVE 64.38 TARGET 64.51 64.66 SL BE-
LOW 64.18
SELL USD/INR AUG BELOW 64.32 TARGET 64.19 64.04 SL
ABOVE 64.52
EUR/INR
BUY EUR/INR AUG ABOVE 70.62 TARGET 70.77 70.97 SL BE-
LOW 70.42
SELL EUR/INR AUG BELOW 70.44 TARGET 70.29 70.09 SL
ABOVE 70.64
CURRENCY MARKET UPDATES:
Snapping its two-day losing streak, the rupee recovered by 9 paise at 64.04 against the US dollar on fresh selling of the greenback by banks and exporters on hopes of fresh for-
eign capital inflows into equity markets. The rupee opened higher at 64.01 as against last weekend's level of 64.13 at the interbank foreign exchange market and hovered in a range of 63.92 and 64.07 before concluding at 64.04,
showing a gain of 9 paise, or 0.14 per cent. The local cur-
rency had lost 22 paise, or 0.34 per cent, in the previous
two days. The rupee firmed up further against the pound sterling to close at 99.73 from 99.86 on last Friday and re-
covered against the euro to 70.18 from 70.33. It also moved up against the Japanese currency to 51.55 per 100
yen from 51.58 previously.
The US dollar climbed higher on Monday, following data
that showed U.S. personal spending rose in line with ex-pectations in June, fuelling optimism over the strength of
the economy. Data showed that U.S. personal spending rose 0.2% in June, in line with expectations. Personal
spending increased by 0.7% in May, whose figure was re-vised from a previously estimated gain of 0.9%. The dollar was higher against the pound, with GBP/USD shedding
0.33% to 1.5576. Research group Markit reported on Mon-
day that the U.K. manufacturing PMI ticked up to 51.9 last
month from 51.4 in June, which was the lowest level in over two years. As against the yen, dollar rose, with USD/JPY up 0.34% to 124.24.
The dollar index was up by 0.24 per cent against a basket of six currencies in late afternoon trade.
The Canadian dollar was buying C$1.3159 per U.S. dol-lar CAD=D4, after it notched 11-year years lows overnight with Canadian markets shut for a public holiday. The Aus-
tralian dollar last traded at $0.7271 AUD=D4, down about
0.2 percent on the day and moving back towards last week's six-year low of $0.7234 as investors awaited the
outcome of the Reserve Bank of Australia's policy meeting at 0430 GMT.

DAILY REPORT
04th
AUG. 2015
YOUR MINTVISORY Call us at +91-731-6642300
CALL REPORT
S T O
PERFORMANCE UPDATES
Date Commodity/ Currency
Pairs Contract Strategy Entry Level Target Stop Loss Remark
03/08/15 NCDEX DHANIYA SEPT. BUY 11410 11435-11475 11380 NOT EXECUTED
03/08/15 NCDEX DHANIYA SEPT. SELL 11225 11200-11160 11255 BOOKED FULL PROFIT
03/08/15 NCDEX GUARGUM OCT. BUY 8170 8220-8290 8110 BOOKED PROFIT
03/08/15 NCDEX GUARGUM OCT. SELL 7980 7930-7860 8040 BOOKED PROFIT
03/08/15 MCX GOLD AUG. BUY 24900 24720-24620 24810 NOT EXECUTED
03/08/15 MCX GOLD AUG. SELL 24800 24720-24620 24890 BOOKED PROFIT
03/08/15 MCX SILVER SEPT. BUY 34100 34300-34600 33800 NOT EXECUTED
03/08/15 MCX SILVER SEPT. SELL 34000 33800-33500 34300 NOT EXECUTED
03/08/15 USD/INR AUG. BUY 64.55 64.68-64.83 64.35 NOT EXECUTED
03/08/15 USD/INR AUG. SELL 64.40 64.27-64.12 64.60 NOT EXECUTED
03/08/15 EUR/INR AUG. BUY 70.90 71.05-71.25 70.70 NOT EXECUTED
03/08/15 EUR/INR AUG. SELL 70.68 70.53-70.33 70.88 NOT EXECUTED
Date Scrip
CASH/
FUTURE/
OPTION
Strategy Entry Level Target Stop Loss Remark
03/08/15 NIFTY FUTURE BUY 8550 8650-8750 8400 CALL OPEN
03/08/15 TCS FUTURE SELL 2490-2500 2520-2540 2470 NOT EXECUTED
03/08/15 FEDERAL BANK FUTURE SELL 69-69.25 68-67 70.25 NOT EXECUTED
03/08/15 RAJESH EXPORT CASH BUY 530 537-545 520 BOOKED FULL PROFIT
DAILY REPORT
04th
AUG. 2015
YOUR MINTVISORY Call us at +91-731-6642300
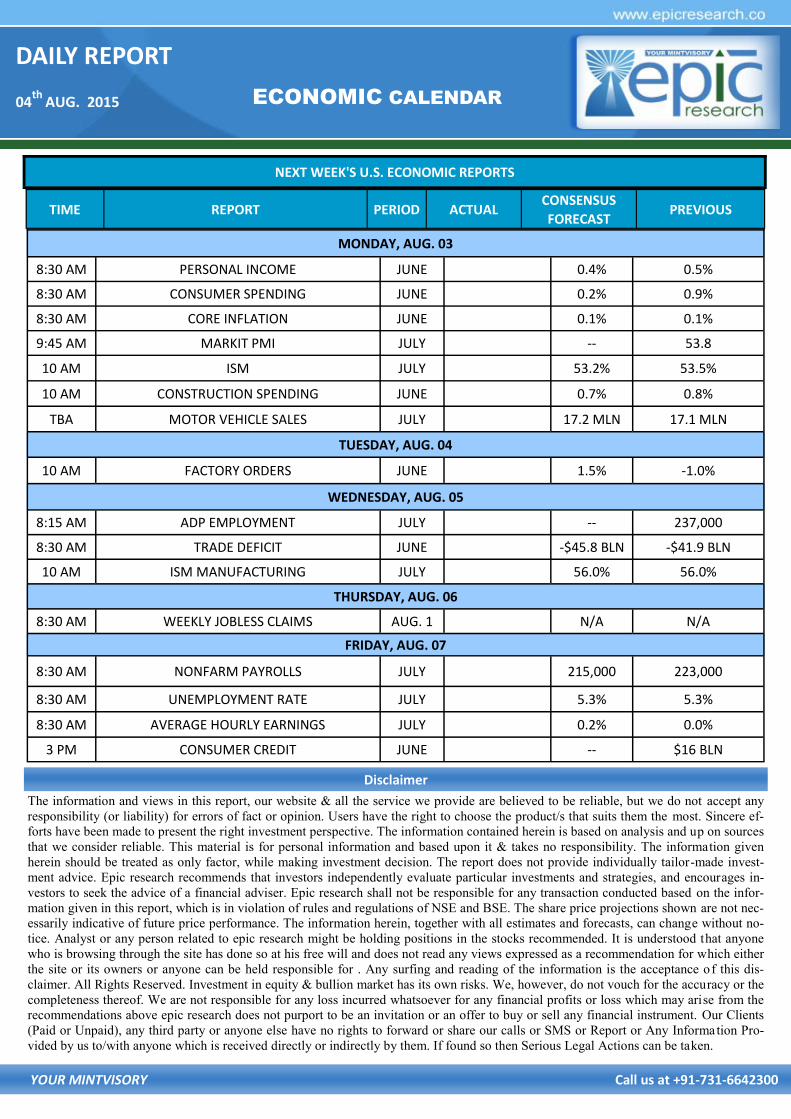
NEXT WEEK'S U.S. ECONOMIC REPORTS
ECONOMIC CALENDAR
The information and views in this report, our website & all the service we provide are believed to be reliable, but we do not accept any
responsibility (or liability) for errors of fact or opinion. Users have the right to choose the product/s that suits them the most. Sincere ef-
forts have been made to present the right investment perspective. The information contained herein is based on analysis and up on sources
that we consider reliable. This material is for personal information and based upon it & takes no responsibility. The information given
herein should be treated as only factor, while making investment decision. The report does not provide individually tailor-made invest-
ment advice. Epic research recommends that investors independently evaluate particular investments and strategies, and encourages in-
vestors to seek the advice of a financial adviser. Epic research shall not be responsible for any transaction conducted based on the infor-
mation given in this report, which is in violation of rules and regulations of NSE and BSE. The share price projections shown are not nec-
essarily indicative of future price performance. The information herein, together with all estimates and forecasts, can change without no-
tice. Analyst or any person related to epic research might be holding positions in the stocks recommended. It is understood that anyone
who is browsing through the site has done so at his free will and does not read any views expressed as a recommendation for which either
the site or its owners or anyone can be held responsible for . Any surfing and reading of the information is the acceptance of this dis-
claimer. All Rights Reserved. Investment in equity & bullion market has its own risks. We, however, do not vouch for the accuracy or the
completeness thereof. We are not responsible for any loss incurred whatsoever for any financial profits or loss which may arise from the
recommendations above epic research does not purport to be an invitation or an offer to buy or sell any financial instrument. Our Clients
(Paid or Unpaid), any third party or anyone else have no rights to forward or share our calls or SMS or Report or Any Information Pro-
vided by us to/with anyone which is received directly or indirectly by them. If found so then Serious Legal Actions can be taken.
Disclaimer
TIME REPORT PERIOD ACTUAL CONSENSUS
FORECAST PREVIOUS
MONDAY, AUG. 03
8:30 AM PERSONAL INCOME JUNE 0.4% 0.5%
8:30 AM CONSUMER SPENDING JUNE 0.2% 0.9%
8:30 AM CORE INFLATION JUNE 0.1% 0.1%
9:45 AM MARKIT PMI JULY -- 53.8
10 AM ISM JULY 53.2% 53.5%
10 AM CONSTRUCTION SPENDING JUNE 0.7% 0.8%
TBA MOTOR VEHICLE SALES JULY 17.2 MLN 17.1 MLN
TUESDAY, AUG. 04
10 AM FACTORY ORDERS JUNE 1.5% -1.0%
WEDNESDAY, AUG. 05
8:15 AM ADP EMPLOYMENT JULY -- 237,000
8:30 AM TRADE DEFICIT JUNE -$45.8 BLN -$41.9 BLN
10 AM ISM MANUFACTURING JULY 56.0% 56.0%
THURSDAY, AUG. 06
8:30 AM WEEKLY JOBLESS CLAIMS AUG. 1 N/A N/A
FRIDAY, AUG. 07
8:30 AM NONFARM PAYROLLS JULY 215,000 223,000
8:30 AM UNEMPLOYMENT RATE JULY 5.3% 5.3%
8:30 AM AVERAGE HOURLY EARNINGS JULY 0.2% 0.0%
3 PM CONSUMER CREDIT JUNE -- $16 BLN