Epic research special report of 03 aug 2015
8
DAILY REPORT 03 rd AUGUST 2015 YOUR MINTVISORY Call us at +91-731-6642300 Global markets at a glance Wall Street ended on a sour note on Friday as a drop in en- ergy stocks eclipsed wage data that supported expectations that the US Federal Reserve might hold off on an interest rate. The drop in those stocks, as well as additional de- clines in crude prices amid oversupply concerns, contrib- uted to a 2.6 % decline in the energy index, its deepest one -day drop since January. Earlier in the week, many investors considered positive comments by the Fed about the econ- omy as a signal that a rate rise could come as early as Sep- tember. The DJI average ended down 0.31 % at 17,690.46. The S&P 500 finished 0.22 % lower at 2,103.92 after open- ing with a gain. The Nasdaq edged down 0.01 % to 5,128.28 European shares marked a positive end to the month on Friday, as takeover hopes and positive earnings reports off- set weakness in commodities and mining. The FTSEurofirst 300 closed up 0.1 % at 1,572.26 points, giving it a 4 % gain for the month of July. A robust start to Europe's earnings season has helped lift stocks, along with relief earlier in the month when Greece agreed on terms for a new bailout. Hang Seng index ended higher on Friday, but an index tracking Chinese companies fell following ailing mainland shares. The Hang Seng index rose 0.6 % to close at 24,636.28pts. It fell around 2 % on the week and slumped 6.1% for the month of July, its biggest monthly loss since Sep 2014. The China Enterprises Index lost 0.1 % to 111,31.68 points. It shed 4.7 % for the week and tumbled 14.3 % for the month, the worst since Sep 2011. China stocks fell on Friday and posted their biggest monthly loss in nearly six years, even as Beijing rolled out a series of sup- port measures and promised to step up efforts to bolster the flagging economy. Previous day Roundup The market performed remarkably amidst mixed Q1 corpo- rate earnings. The Sensex ended up 409.21 points or 1.5 % at 28114.56, and the Nifty was up 111.05 points or 1.3 % at 8532.85. About 1650 shares advanced, 1222 shares de- clined, and 166 shares were unchanged. Index stats The Market was very volatile in last session. The sartorial indices performed as follow; Consumer Durables [up 58.71pts], Capital Goods [up 69.99pts], PSU [up 108.85pts], FMCG [up 142.41pts], Realty [up pts], Power [up pts], Auto [up 338.36pts], Healthcare [up 333.18Pts], IT [up 145.49pts], Metals [up 145.49pts], TECK [up 77.57pts], Oil& Gas [down 27.02pts]. World Indices Index Value % Change D J l 17689.86 -0.32 S&P 500 2103.84 -0.23 NASDAQ 5128.28 -0.01 FTSE 100 6696.28 +0.41 Nikkei 225 20585.24 +0.30 Hong Kong 24636.28 +0.56 Top Gainers Company CMP Change % Chg BANKBARODA 179.40 10.80 6.41 SBIN 269.30 12.50 4.87 COALINDIA 440.20 19.85 4.72 HCLTECH 1,002.00 44.10 4.60 DRREDDY 4,086.00 172.90 4.42 Top Losers Company CMP Change % Chg BHEL 278.40 8.50 -2.96 KOTAKBANK 696.00 20.80 -2.90 TATAPOWER 68.45 1.15 -1.65 BPCL 933.00 14.20 -1.50 TATASTEEL 245.70 2.45 -0.99 Stocks at 52 Week’s HIGH Symbol Prev. Close Change %Chg ABIRLANUVO 2,188.90 -16.05 -0.73 COALINDIA 440.20 19.85 4.72 INDUSINDBK 975.00 1.30 0.13 MARUTI 4,332.00 35.55 0.83 Indian Indices Company CMP Change % Chg NIFTY 8532.85 +111.05 +1.32 SENSEX 28114.56 +409.21 +1.48 Stocks at 52 Week’s LOW Symbol Prev. Close Change %Chg NMDC 102.05 -0.25 -0.24 SAIL 56.25 -2.15 -3.68
-
Upload
epic-research-private-limited -
Category
Business
-
view
156 -
download
2
Transcript of Epic research special report of 03 aug 2015
DAILY REPORT
03rd
AUGUST 2015
YOUR MINTVISORY Call us at +91-731-6642300
Global markets at a glance
Wall Street ended on a sour note on Friday as a drop in en-ergy stocks eclipsed wage data that supported expectations that the US Federal Reserve might hold off on an interest rate. The drop in those stocks, as well as additional de-clines in crude prices amid oversupply concerns, contrib-uted to a 2.6 % decline in the energy index, its deepest one-day drop since January. Earlier in the week, many investors considered positive comments by the Fed about the econ-omy as a signal that a rate rise could come as early as Sep-tember. The DJI average ended down 0.31 % at 17,690.46. The S&P 500 finished 0.22 % lower at 2,103.92 after open-ing with a gain. The Nasdaq edged down 0.01 % to 5,128.28 European shares marked a positive end to the month on Friday, as takeover hopes and positive earnings reports off-set weakness in commodities and mining. The FTSEurofirst 300 closed up 0.1 % at 1,572.26 points, giving it a 4 % gain for the month of July. A robust start to Europe's earnings season has helped lift stocks, along with relief earlier in the month when Greece agreed on terms for a new bailout. Hang Seng index ended higher on Friday, but an index tracking Chinese companies fell following ailing mainland shares. The Hang Seng index rose 0.6 % to close at 24,636.28pts. It fell around 2 % on the week and slumped 6.1% for the month of July, its biggest monthly loss since Sep 2014. The China Enterprises Index lost 0.1 % to 111,31.68 points. It shed 4.7 % for the week and tumbled 14.3 % for the month, the worst since Sep 2011. China stocks fell on Friday and posted their biggest monthly loss in nearly six years, even as Beijing rolled out a series of sup-port measures and promised to step up efforts to bolster the flagging economy.
Previous day Roundup
The market performed remarkably amidst mixed Q1 corpo-rate earnings. The Sensex ended up 409.21 points or 1.5 % at 28114.56, and the Nifty was up 111.05 points or 1.3 % at 8532.85. About 1650 shares advanced, 1222 shares de-clined, and 166 shares were unchanged.
Index stats
The Market was very volatile in last session. The sartorial indices performed as follow; Consumer Durables [up 58.71pts], Capital Goods [up 69.99pts], PSU [up 108.85pts], FMCG [up 142.41pts], Realty [up pts], Power [up pts], Auto [up 338.36pts], Healthcare [up 333.18Pts], IT [up 145.49pts], Metals [up 145.49pts], TECK [up 77.57pts], Oil& Gas [down 27.02pts].
World Indices
Index Value % Change
D J l 17689.86 -0.32
S&P 500 2103.84 -0.23
NASDAQ 5128.28 -0.01
FTSE 100 6696.28 +0.41
Nikkei 225 20585.24 +0.30
Hong Kong 24636.28 +0.56
Top Gainers
Company CMP Change % Chg
BANKBARODA 179.40 10.80 6.41
SBIN 269.30 12.50 4.87
COALINDIA 440.20 19.85 4.72
HCLTECH 1,002.00 44.10 4.60
DRREDDY 4,086.00 172.90 4.42
Top Losers
Company CMP Change % Chg
BHEL 278.40 8.50 -2.96
KOTAKBANK 696.00 20.80 -2.90
TATAPOWER 68.45 1.15 -1.65
BPCL 933.00 14.20 -1.50
TATASTEEL 245.70 2.45 -0.99
Stocks at 52 Week’s HIGH
Symbol Prev. Close Change %Chg
ABIRLANUVO 2,188.90 -16.05 -0.73
COALINDIA 440.20 19.85 4.72
INDUSINDBK 975.00 1.30 0.13
MARUTI 4,332.00 35.55 0.83
Indian Indices
Company CMP Change % Chg
NIFTY 8532.85 +111.05 +1.32
SENSEX 28114.56 +409.21 +1.48
Stocks at 52 Week’s LOW
Symbol Prev. Close Change %Chg
NMDC 102.05 -0.25 -0.24
SAIL 56.25 -2.15 -3.68
DAILY REPORT
03rd
AUGUST 2015
YOUR MINTVISORY Call us at +91-731-6642300
STOCK RECOMMENDATION [CASH]
1. RAJESH EXPROT (CASH)
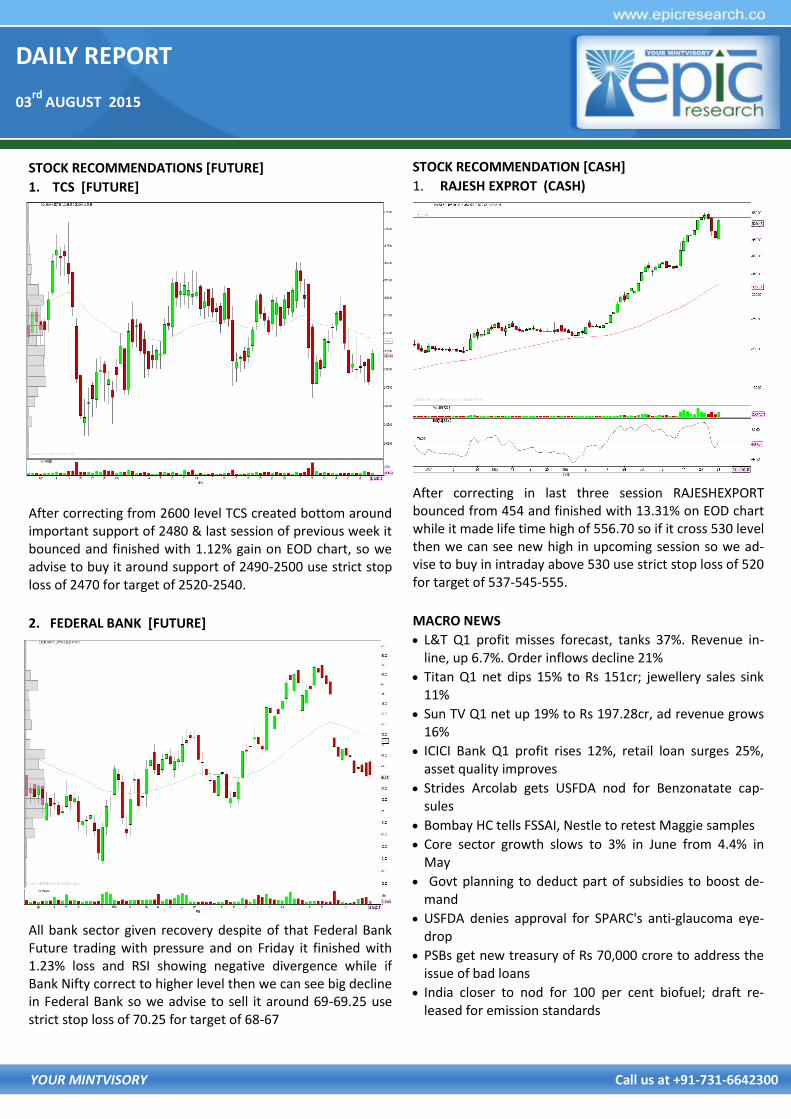
After correcting in last three session RAJESHEXPORT bounced from 454 and finished with 13.31% on EOD chart while it made life time high of 556.70 so if it cross 530 level then we can see new high in upcoming session so we ad-vise to buy in intraday above 530 use strict stop loss of 520 for target of 537-545-555.
MACRO NEWS
L&T Q1 profit misses forecast, tanks 37%. Revenue in-line, up 6.7%. Order inflows decline 21%
Titan Q1 net dips 15% to Rs 151cr; jewellery sales sink 11%
Sun TV Q1 net up 19% to Rs 197.28cr, ad revenue grows 16%
ICICI Bank Q1 profit rises 12%, retail loan surges 25%, asset quality improves
Strides Arcolab gets USFDA nod for Benzonatate cap-sules
Bombay HC tells FSSAI, Nestle to retest Maggie samples
Core sector growth slows to 3% in June from 4.4% in May
Govt planning to deduct part of subsidies to boost de-mand
USFDA denies approval for SPARC's anti-glaucoma eye-drop
PSBs get new treasury of Rs 70,000 crore to address the issue of bad loans
India closer to nod for 100 per cent biofuel; draft re-leased for emission standards
STOCK RECOMMENDATIONS [FUTURE]
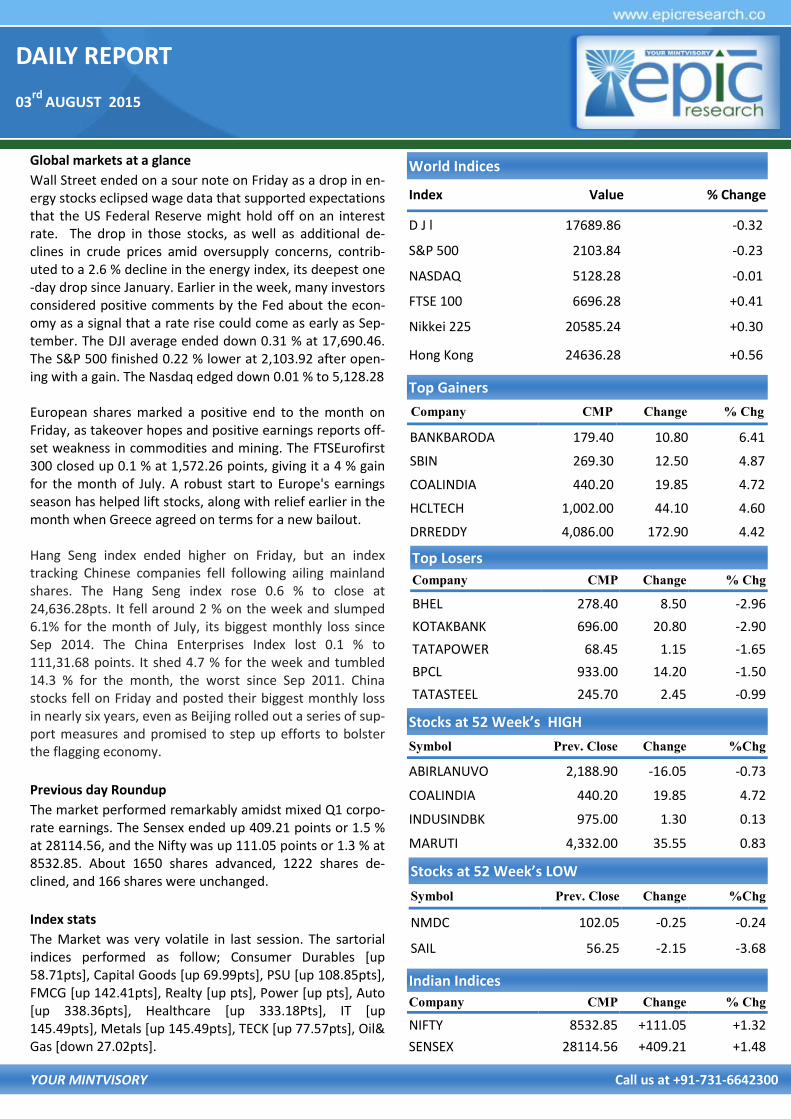
1. TCS [FUTURE]
After correcting from 2600 level TCS created bottom around important support of 2480 & last session of previous week it bounced and finished with 1.12% gain on EOD chart, so we advise to buy it around support of 2490-2500 use strict stop loss of 2470 for target of 2520-2540.
2. FEDERAL BANK [FUTURE]
All bank sector given recovery despite of that Federal Bank Future trading with pressure and on Friday it finished with 1.23% loss and RSI showing negative divergence while if Bank Nifty correct to higher level then we can see big decline in Federal Bank so we advise to sell it around 69-69.25 use strict stop loss of 70.25 for target of 68-67
DAILY REPORT
03rd
AUGUST 2015
YOUR MINTVISORY Call us at +91-731-6642300
FUTURE & OPTION
MOST ACTIVE PUT OPTION
Symbol Op-
tion
Type
Strike
Price
LTP Traded
Volume
(Contracts)
Open
Interest
NIFTY PE 8,400 64.25 4,09,302 31,18,600
NIFTY PE 8,500 94.50 3,11,588 20,03,825
BANKNIFTY PE 18,000 129.55 27,398 2,49,725
ICICIBANK PE 290 4.90 5,373 11,40,000
LT PE 1,700 25.50 5,224 2,20,750
ICICIBANK PE 300 8.65 4,705 12,50,000
RELIANCE PE 1,000 21.50 2,892 3,85,250
SBIN PE 250 2.80 2,380 13,46,000
MOST ACTIVE CALL OPTION
Symbol Op-
tion
Type
Strike
Price
LTP Traded
Volume
(Contracts)
Open
Interest
NIFTY CE 8,700 66.20 4,38,331 32,42,625
NIFTY CE 8,800 37.60 3,37,621 34,92,900
BANKNIFTY CE 19,000 323.00 45,220 3,56,350
ICICIBANK CE 310 7.40 11,286 37,91,000
ICICIBANK CE 300 11.80 9,167 19,90,000
LT CE 1,900 23.65 5,677 2,17,125
SBIN CE 300 2.10 4,680 15,93,000
RELIANCE CE 1,020 19.00 4,447 4,74,750
FII DERIVATIVES STATISTICS
BUY OPEN INTEREST AT THE END OF THE DAY SELL
No. of
Contracts Amount in
Crores No. of
Contracts Amount in
Crores No. of
Contracts Amount in
Crores NET AMOUNT
INDEX FUTURES 105490 2508.03 59484 1353.41 624228 14762.83 1154.62
INDEX OPTIONS 474316 11930.71 427213 10590.67 2288804 61237.57 1340.04
STOCK FUTURES 118212 3380.31 108130 3038.98 1757951 48654.68 341.33
STOCK OPTIONS 72755 1967.87 67024 1809.62 49538 1352.82 158.25
TOTAL 2994.23
STOCKS IN NEWS Tata Power to launch app for consumers in six months
Maruti Suzuki July sales spike 20.1%, passenger cars lead
NTPC signs JV with Jharkhand for Patratu Power Plant
CESC lines up Rs 3,000 crore for renewables, acquisi-tions on radar
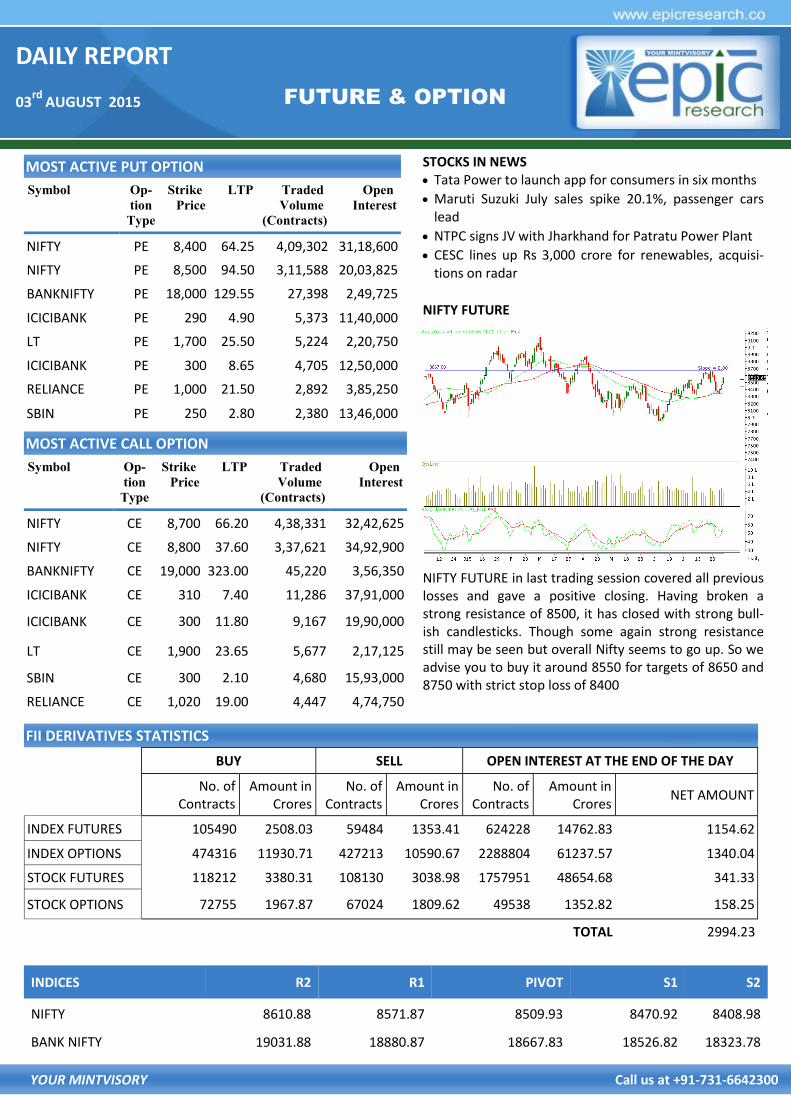
NIFTY FUTURE
NIFTY FUTURE in last trading session covered all previous losses and gave a positive closing. Having broken a strong resistance of 8500, it has closed with strong bull-ish candlesticks. Though some again strong resistance still may be seen but overall Nifty seems to go up. So we advise you to buy it around 8550 for targets of 8650 and 8750 with strict stop loss of 8400
INDICES R2 R1 PIVOT S1 S2
NIFTY 8610.88 8571.87 8509.93 8470.92 8408.98
BANK NIFTY 19031.88 18880.87 18667.83 18526.82 18323.78
DAILY REPORT
03rd
AUGUST 2015
YOUR MINTVISORY Call us at +91-731-6642300
RECOMMENDATIONS
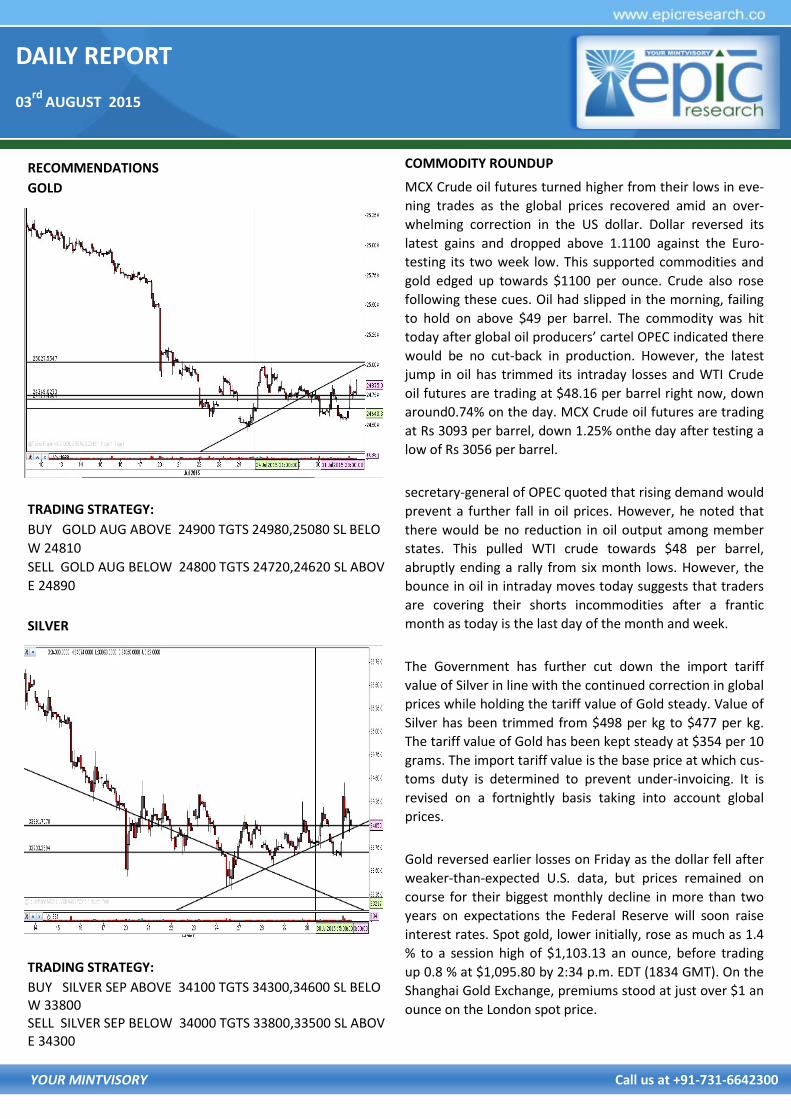
GOLD
TRADING STRATEGY:
BUY GOLD AUG ABOVE 24900 TGTS 24980,25080 SL BELO
W 24810
SELL GOLD AUG BELOW 24800 TGTS 24720,24620 SL ABOV
E 24890
SILVER
TRADING STRATEGY:
BUY SILVER SEP ABOVE 34100 TGTS 34300,34600 SL BELOW 33800 SELL SILVER SEP BELOW 34000 TGTS 33800,33500 SL ABOVE 34300
COMMODITY ROUNDUP
MCX Crude oil futures turned higher from their lows in eve-
ning trades as the global prices recovered amid an over-
whelming correction in the US dollar. Dollar reversed its
latest gains and dropped above 1.1100 against the Euro-
testing its two week low. This supported commodities and
gold edged up towards $1100 per ounce. Crude also rose
following these cues. Oil had slipped in the morning, failing
to hold on above $49 per barrel. The commodity was hit
today after global oil producers’ cartel OPEC indicated there
would be no cut-back in production. However, the latest
jump in oil has trimmed its intraday losses and WTI Crude
oil futures are trading at $48.16 per barrel right now, down
around0.74% on the day. MCX Crude oil futures are trading
at Rs 3093 per barrel, down 1.25% onthe day after testing a
low of Rs 3056 per barrel.
secretary-general of OPEC quoted that rising demand would
prevent a further fall in oil prices. However, he noted that
there would be no reduction in oil output among member
states. This pulled WTI crude towards $48 per barrel,
abruptly ending a rally from six month lows. However, the
bounce in oil in intraday moves today suggests that traders
are covering their shorts incommodities after a frantic
month as today is the last day of the month and week.
The Government has further cut down the import tariff
value of Silver in line with the continued correction in global
prices while holding the tariff value of Gold steady. Value of
Silver has been trimmed from $498 per kg to $477 per kg.
The tariff value of Gold has been kept steady at $354 per 10
grams. The import tariff value is the base price at which cus-
toms duty is determined to prevent under-invoicing. It is
revised on a fortnightly basis taking into account global
prices.
Gold reversed earlier losses on Friday as the dollar fell after
weaker-than-expected U.S. data, but prices remained on
course for their biggest monthly decline in more than two
years on expectations the Federal Reserve will soon raise
interest rates. Spot gold, lower initially, rose as much as 1.4
% to a session high of $1,103.13 an ounce, before trading
up 0.8 % at $1,095.80 by 2:34 p.m. EDT (1834 GMT). On the
Shanghai Gold Exchange, premiums stood at just over $1 an
ounce on the London spot price.
DAILY REPORT
03rd
AUGUST 2015
YOUR MINTVISORY Call us at +91-731-6642300
NCDEX
RECOMMENDATIONS
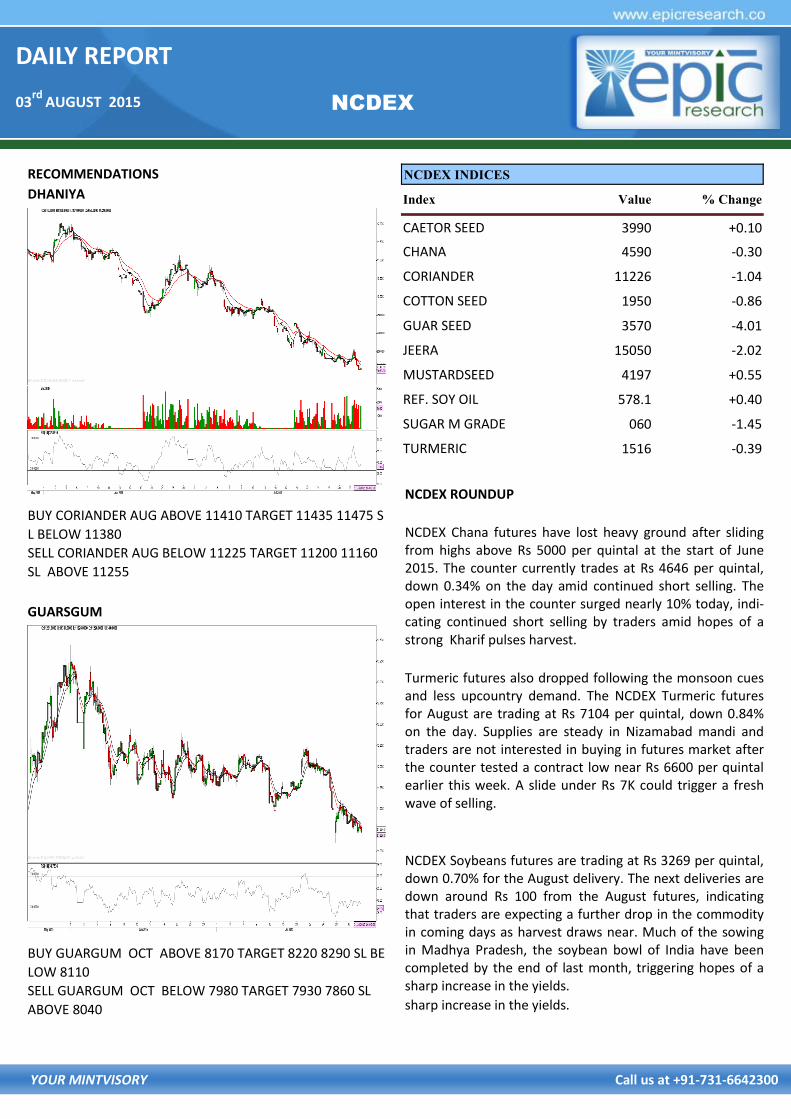
DHANIYA
BUY CORIANDER AUG ABOVE 11410 TARGET 11435 11475 S
L BELOW 11380
SELL CORIANDER AUG BELOW 11225 TARGET 11200 11160
SL ABOVE 11255
GUARSGUM
BUY GUARGUM OCT ABOVE 8170 TARGET 8220 8290 SL BE
LOW 8110
SELL GUARGUM OCT BELOW 7980 TARGET 7930 7860 SL
ABOVE 8040
NCDEX ROUNDUP
NCDEX Chana futures have lost heavy ground after sliding from highs above Rs 5000 per quintal at the start of June 2015. The counter currently trades at Rs 4646 per quintal, down 0.34% on the day amid continued short selling. The open interest in the counter surged nearly 10% today, indi-cating continued short selling by traders amid hopes of a strong Kharif pulses harvest.
Turmeric futures also dropped following the monsoon cues and less upcountry demand. The NCDEX Turmeric futures for August are trading at Rs 7104 per quintal, down 0.84% on the day. Supplies are steady in Nizamabad mandi and traders are not interested in buying in futures market after the counter tested a contract low near Rs 6600 per quintal earlier this week. A slide under Rs 7K could trigger a fresh wave of selling.
NCDEX Soybeans futures are trading at Rs 3269 per quintal, down 0.70% for the August delivery. The next deliveries are down around Rs 100 from the August futures, indicating that traders are expecting a further drop in the commodity in coming days as harvest draws near. Much of the sowing in Madhya Pradesh, the soybean bowl of India have been completed by the end of last month, triggering hopes of a sharp increase in the yields.
sharp increase in the yields.
NCDEX INDICES
Index Value % Change
CAETOR SEED 3990 +0.10
CHANA 4590 -0.30
CORIANDER 11226 -1.04
COTTON SEED 1950 -0.86
GUAR SEED 3570 -4.01
JEERA 15050 -2.02
MUSTARDSEED 4197 +0.55
REF. SOY OIL 578.1 +0.40
SUGAR M GRADE 060 -1.45
TURMERIC 1516 -0.39
DAILY REPORT
03rd
AUGUST 2015
YOUR MINTVISORY Call us at +91-731-6642300
RBI Reference Rate
Currency Rate Currency Rate
Rupee- $ 64.0054 Yen-100 51.5500
Euro 70.1627 GBP 99.8356
CURRENCY
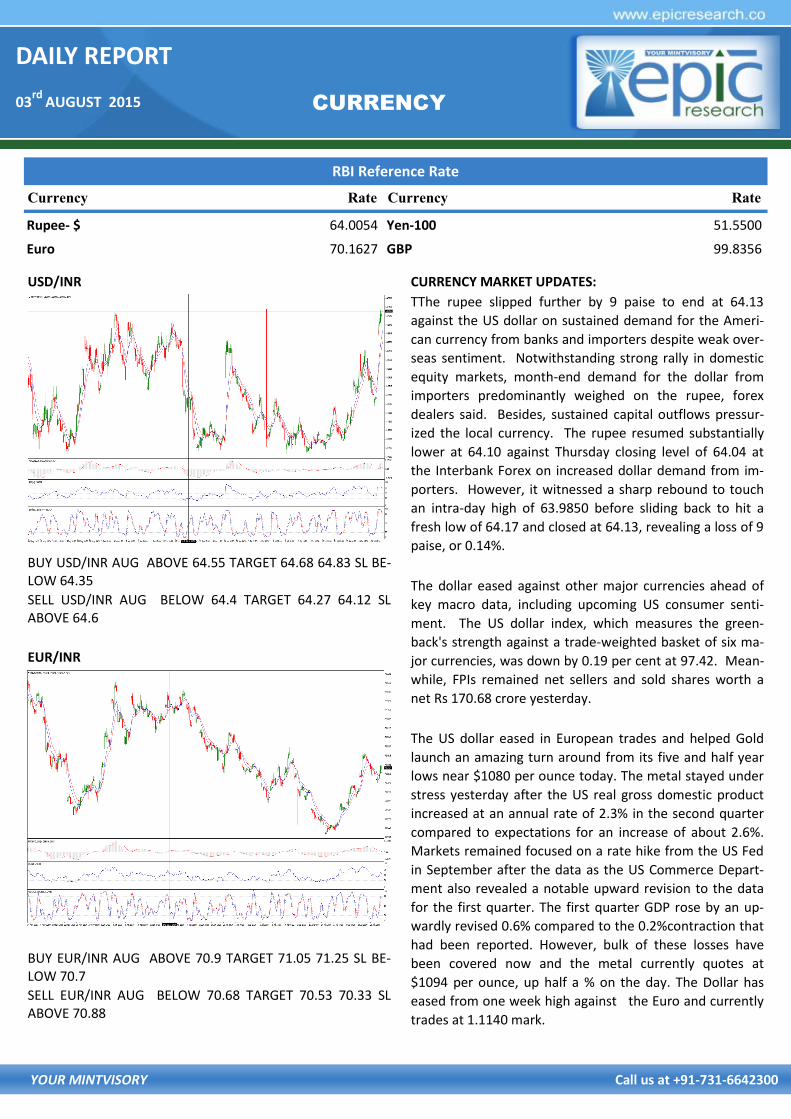
USD/INR
BUY USD/INR AUG ABOVE 64.55 TARGET 64.68 64.83 SL BE-LOW 64.35
SELL USD/INR AUG BELOW 64.4 TARGET 64.27 64.12 SL ABOVE 64.6
EUR/INR
BUY EUR/INR AUG ABOVE 70.9 TARGET 71.05 71.25 SL BE-LOW 70.7
SELL EUR/INR AUG BELOW 70.68 TARGET 70.53 70.33 SL ABOVE 70.88
CURRENCY MARKET UPDATES:
TThe rupee slipped further by 9 paise to end at 64.13
against the US dollar on sustained demand for the Ameri-
can currency from banks and importers despite weak over-
seas sentiment. Notwithstanding strong rally in domestic
equity markets, month-end demand for the dollar from
importers predominantly weighed on the rupee, forex
dealers said. Besides, sustained capital outflows pressur-
ized the local currency. The rupee resumed substantially
lower at 64.10 against Thursday closing level of 64.04 at
the Interbank Forex on increased dollar demand from im-
porters. However, it witnessed a sharp rebound to touch
an intra-day high of 63.9850 before sliding back to hit a
fresh low of 64.17 and closed at 64.13, revealing a loss of 9
paise, or 0.14%.
The dollar eased against other major currencies ahead of
key macro data, including upcoming US consumer senti-
ment. The US dollar index, which measures the green-
back's strength against a trade-weighted basket of six ma-
jor currencies, was down by 0.19 per cent at 97.42. Mean-
while, FPIs remained net sellers and sold shares worth a
net Rs 170.68 crore yesterday.
The US dollar eased in European trades and helped Gold
launch an amazing turn around from its five and half year
lows near $1080 per ounce today. The metal stayed under
stress yesterday after the US real gross domestic product
increased at an annual rate of 2.3% in the second quarter
compared to expectations for an increase of about 2.6%.
Markets remained focused on a rate hike from the US Fed
in September after the data as the US Commerce Depart-
ment also revealed a notable upward revision to the data
for the first quarter. The first quarter GDP rose by an up-
wardly revised 0.6% compared to the 0.2%contraction that
had been reported. However, bulk of these losses have
been covered now and the metal currently quotes at
$1094 per ounce, up half a % on the day. The Dollar has
eased from one week high against the Euro and currently
trades at 1.1140 mark.
DAILY REPORT
03rd
AUGUST 2015
YOUR MINTVISORY Call us at +91-731-6642300
CALL REPORT
S T O
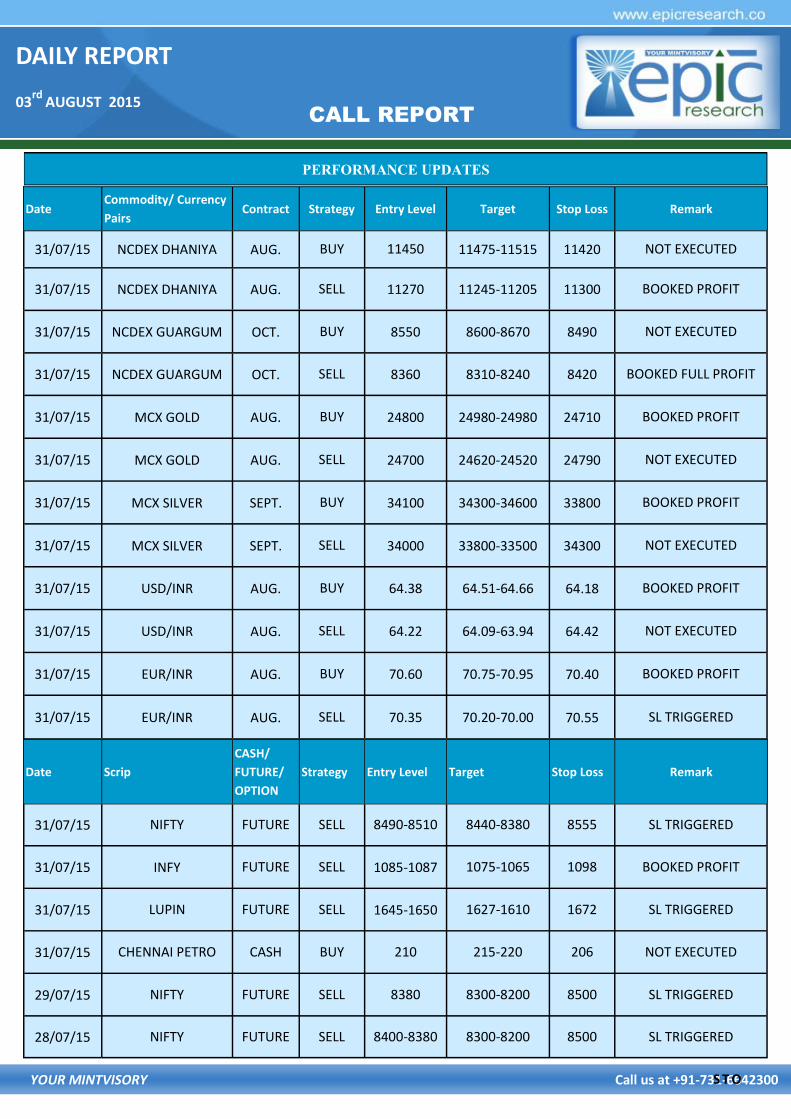
PERFORMANCE UPDATES
Date Commodity/ Currency
Pairs Contract Strategy Entry Level Target Stop Loss Remark
31/07/15 NCDEX DHANIYA AUG. BUY 11450 11475-11515 11420 NOT EXECUTED
31/07/15 NCDEX DHANIYA AUG. SELL 11270 11245-11205 11300 BOOKED PROFIT
31/07/15 NCDEX GUARGUM OCT. BUY 8550 8600-8670 8490 NOT EXECUTED
31/07/15 NCDEX GUARGUM OCT. SELL 8360 8310-8240 8420 BOOKED FULL PROFIT
31/07/15 MCX GOLD AUG. BUY 24800 24980-24980 24710 BOOKED PROFIT
31/07/15 MCX GOLD AUG. SELL 24700 24620-24520 24790 NOT EXECUTED
31/07/15 MCX SILVER SEPT. BUY 34100 34300-34600 33800 BOOKED PROFIT
31/07/15 MCX SILVER SEPT. SELL 34000 33800-33500 34300 NOT EXECUTED
31/07/15 USD/INR AUG. BUY 64.38 64.51-64.66 64.18 BOOKED PROFIT
31/07/15 USD/INR AUG. SELL 64.22 64.09-63.94 64.42 NOT EXECUTED
31/07/15 EUR/INR AUG. BUY 70.60 70.75-70.95 70.40 BOOKED PROFIT
31/07/15 EUR/INR AUG. SELL 70.35 70.20-70.00 70.55 SL TRIGGERED
Date Scrip
CASH/
FUTURE/
OPTION
Strategy Entry Level Target Stop Loss Remark
31/07/15 NIFTY FUTURE SELL 8490-8510 8440-8380 8555 SL TRIGGERED
31/07/15 INFY FUTURE SELL 1085-1087 1075-1065 1098 BOOKED PROFIT
31/07/15 LUPIN FUTURE SELL 1645-1650 1627-1610 1672 SL TRIGGERED
31/07/15 CHENNAI PETRO CASH BUY 210 215-220 206 NOT EXECUTED
29/07/15 NIFTY FUTURE SELL 8380 8300-8200 8500 SL TRIGGERED
28/07/15 NIFTY FUTURE SELL 8400-8380 8300-8200 8500 SL TRIGGERED
DAILY REPORT
03rd
AUGUST 2015
YOUR MINTVISORY Call us at +91-731-6642300
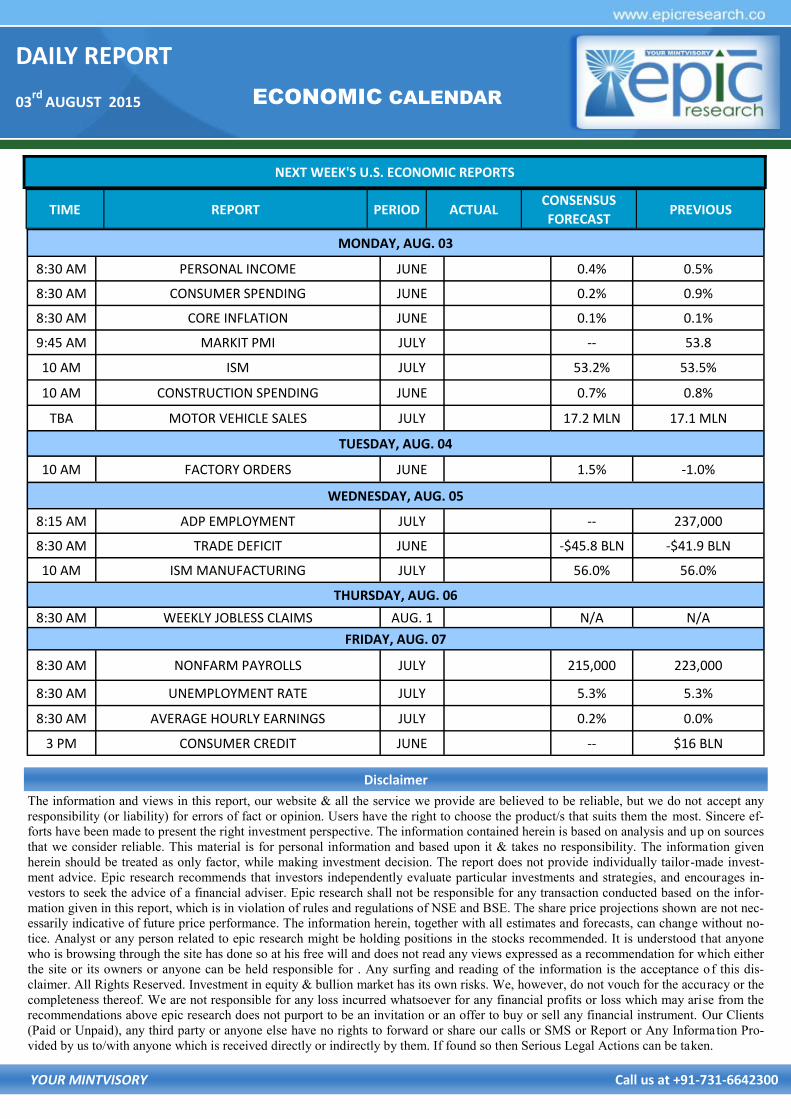
NEXT WEEK'S U.S. ECONOMIC REPORTS
ECONOMIC CALENDAR
The information and views in this report, our website & all the service we provide are believed to be reliable, but we do not accept any
responsibility (or liability) for errors of fact or opinion. Users have the right to choose the product/s that suits them the most. Sincere ef-
forts have been made to present the right investment perspective. The information contained herein is based on analysis and up on sources
that we consider reliable. This material is for personal information and based upon it & takes no responsibility. The information given
herein should be treated as only factor, while making investment decision. The report does not provide individually tailor-made invest-
ment advice. Epic research recommends that investors independently evaluate particular investments and strategies, and encourages in-
vestors to seek the advice of a financial adviser. Epic research shall not be responsible for any transaction conducted based on the infor-
mation given in this report, which is in violation of rules and regulations of NSE and BSE. The share price projections shown are not nec-
essarily indicative of future price performance. The information herein, together with all estimates and forecasts, can change without no-
tice. Analyst or any person related to epic research might be holding positions in the stocks recommended. It is understood that anyone
who is browsing through the site has done so at his free will and does not read any views expressed as a recommendation for which either
the site or its owners or anyone can be held responsible for . Any surfing and reading of the information is the acceptance of this dis-
claimer. All Rights Reserved. Investment in equity & bullion market has its own risks. We, however, do not vouch for the accuracy or the
completeness thereof. We are not responsible for any loss incurred whatsoever for any financial profits or loss which may arise from the
recommendations above epic research does not purport to be an invitation or an offer to buy or sell any financial instrument. Our Clients
(Paid or Unpaid), any third party or anyone else have no rights to forward or share our calls or SMS or Report or Any Information Pro-
vided by us to/with anyone which is received directly or indirectly by them. If found so then Serious Legal Actions can be taken.
Disclaimer
TIME REPORT PERIOD ACTUAL CONSENSUS
FORECAST PREVIOUS
MONDAY, AUG. 03
8:30 AM PERSONAL INCOME JUNE 0.4% 0.5%
8:30 AM CONSUMER SPENDING JUNE 0.2% 0.9%
8:30 AM CORE INFLATION JUNE 0.1% 0.1%
9:45 AM MARKIT PMI JULY -- 53.8
10 AM ISM JULY 53.2% 53.5%
10 AM CONSTRUCTION SPENDING JUNE 0.7% 0.8%
TBA MOTOR VEHICLE SALES JULY 17.2 MLN 17.1 MLN
TUESDAY, AUG. 04
10 AM FACTORY ORDERS JUNE 1.5% -1.0%
WEDNESDAY, AUG. 05
8:15 AM ADP EMPLOYMENT JULY -- 237,000
8:30 AM TRADE DEFICIT JUNE -$45.8 BLN -$41.9 BLN
10 AM ISM MANUFACTURING JULY 56.0% 56.0%
THURSDAY, AUG. 06
8:30 AM WEEKLY JOBLESS CLAIMS AUG. 1 N/A N/A
FRIDAY, AUG. 07
8:30 AM NONFARM PAYROLLS JULY 215,000 223,000
8:30 AM UNEMPLOYMENT RATE JULY 5.3% 5.3%
8:30 AM AVERAGE HOURLY EARNINGS JULY 0.2% 0.0%
3 PM CONSUMER CREDIT JUNE -- $16 BLN