EPA Update on LIght-Duty Vehicle GHG Emissions and ... UPDATE ON LIGHT-DUTY VEHICLE GHG EMISSIONS...
30
EPA UPDATE ON LIGHT-DUTY VEHICLE GHG EMISSIONS AND TECHNOLOGIES Michael Olechiw National Vehicle and Fuel Emissions Laboratory Office of Transportation and Air Quality U.S. Environmental Protection Agency April 2, 2017
Transcript of EPA Update on LIght-Duty Vehicle GHG Emissions and ... UPDATE ON LIGHT-DUTY VEHICLE GHG EMISSIONS...

EPA UPDATE ON LIGHT-DUTY VEHICLE GHG EMISSIONS AND TECHNOLOGIESMichael Olechiw
National Vehicle and Fuel Emissions LaboratoryOffice of Transportation and Air QualityU.S. Environmental Protection Agency
April 2, 2017

U.S. Environmental Protection Agency – OAR-OTAQ
How the EPA GHG Standards Work
Industry Progress To Date
What Might the 2025 Time-Frame Look Like – EPA assessment (thus far)
What Comes Next
Overview
2

HOW THE EPA STANDARDS WORK
3
U.S. Environmental Protection Agency – OAR-OTAQ
So What is the 2025 EPA Standard?
4
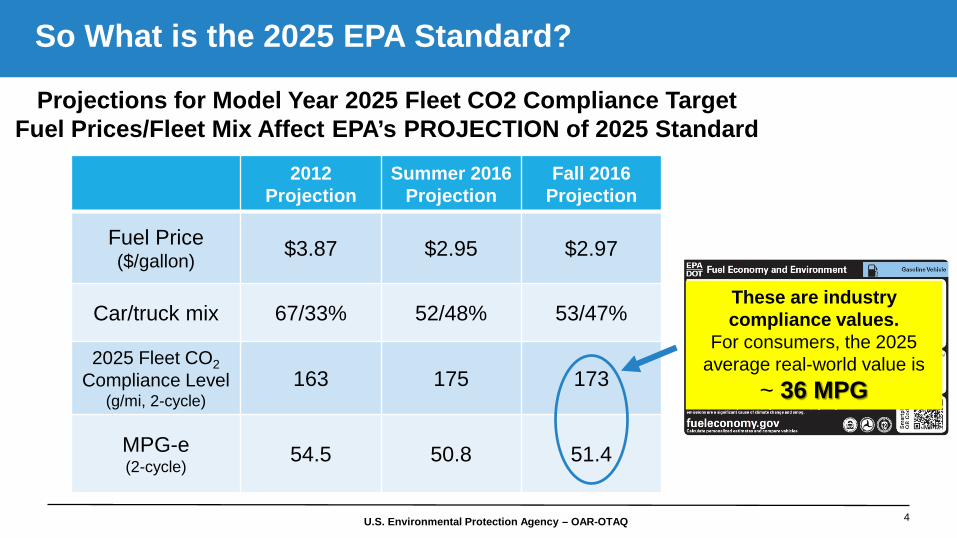
Projections for Model Year 2025 Fleet CO2 Compliance TargetFuel Prices/Fleet Mix Affect EPA’s PROJECTION of 2025 Standard
2012Projection
Summer 2016 Projection
Fall 2016 Projection
Fuel Price ($/gallon) $3.87 $2.95 $2.97
Car/truck mix 67/33% 52/48% 53/47%
2025 Fleet CO2Compliance Level
(g/mi, 2-cycle)163 175 173
MPG-e(2-cycle)
54.5 50.8 51.4
These are industry compliance values.
For consumers, the 2025 average real-world value is
~ 36 MPG

U.S. Environmental Protection Agency – OAR-OTAQ
Passenger Car Target (g/mi) = (3.26 x footprint) – 3.2• for vehicle footprints >41 and < 56 square feet
Light-Truck Target (g/mi) = (3.58 x footprint) +12.5• for vehicle footprints >41 and < 74 square feet
For each individual company the Car & Truck standards are a function of the # vehicles produced & each vehicle’s footprint
2025 CO2 Standard is a Function of Car & Truck Production Volume and Vehicle Footprint
5

U.S. Environmental Protection Agency – OAR-OTAQ
Footprint-based CO2 Target Curves for Trucks – “The Standards”[separate footprint curve for Cars]
6
Buick Encore
Nissan Murano
Toyota Sienna
Chevy Silverado
Ford F-150
With a shift from cars to SUVs &
trucks, the OEM’s standard becomes
less stringent

INDUSTRY PROGRESS TO DATE
7

U.S. Environmental Protection Agency – OAR-OTAQ
Vehicle CO2 Emissions at Record Low –every major vehicle category improving
8
MY2015: 358 g/mi CO2 (24.8 mpg)MY 2016 Projected : 25.6 mpg Truck SUVs highest % improvement since 2004, up 33%
Pickups improved most in past year, up 0.8 mpg to 18.8 mpg
All values Real world
All values Real world

U.S. Environmental Protection Agency – OAR-OTAQ
Automakers Adopting a Wide Array of Technologies at Rapid Rates
9
GDI use on nearly half of all vehicles (up from 3% in MY2008), with Mazda at 100%, 6 more OEMs above 75%
~20% fleet use 7+ speed transmissions, led by Mercedes, BMW, and Fiat-Chrysler
>20% fleet use CVTs, led by Subaru, Nissan, and Honda

U.S. Environmental Protection Agency – OAR-OTAQ
Early Years of Program Producing Positive Results
10
Industry Outperforming Standards 7 Years of Sales Increases Thru 2016First Time in 100 Years

U.S. Environmental Protection Agency – OAR-OTAQ
GHG Program is a Multi-Year Program, multiple layers of flexibility for OEMs
• No single year determines compliance.• Program includes emissions banking and trading• Credits last at least 5 model years, and early credits last longer.• Debits can be carried forward for 3 model years.
• Today, the bank is 280 Million Megagrams CO2o What’s a Megagram? o 280M worth about 80 grams CO2/mile for the entire U.S. fleeto Would allow the MY2015 fleet to comply with EPA standards through 2019, if all firms
participated fully in credit tradingo Through MY2015, 12 OEMs involved in credit trading
What Happens to the Over Compliance?
11

U.S. Environmental Protection Agency – OAR-OTAQ
Advanced Gasoline Vehicles can Take the Industry Much Further … many vehicles already meet future targets
12
Vehicle Production that Meets or Exceeds MY2020 CO2 Targets
With fleet averaging, in any given model year, only about 50% of vehicles would need to meet/exceed their target, depending on sales volumes.
In just 4 years

U.S. Environmental Protection Agency – OAR-OTAQ
Case Study: 2017 Honda CRV 1.5 liter AWD
13
*Illustrative example only. EPA estimated real-world fuel economy targets from CO2 compliance targets, assuming A/C credits and 5 g/mi off-cycle credits
• Best-selling SUV in U.S.
• AWD versions make up 2/3 of sales
• Advanced Gasoline Technology:o Turbocharged GDI 1.5 liter I4 engineo Continuously variable transmissiono No electrification
• Could already meet* 2022 target o 5 years ahead
• Within 4 mpg of 2025 target With 8 years to go

WHAT MIGHT 2025 LOOK LIKE –EPA TECHNICAL ASSESSMENT
(THUS FAR)
14

U.S. Environmental Protection Agency – OAR-OTAQ
EPA’s Assessments are Informed by a Wide Range of Information
15
Technical research performed by EPAo Benchmarking testing of 30 vehicles across wide range of powertrains & segments (with more to come)
o Published more than 30 peer-reviewed papers and technical reportso Vehicle simulation modeling, cost teardown studies, mass reduction feasibility/cost studies, manufacturer
“learning by doing” costs, research on consumer issues, economic inputs, others
Extensive reviews of the literature o 100’s of reports/papers from the literature published since 2012, including major studies such
as the 2015 National Academy of Sciences report
Stakeholder outreach & collaborationo Hundreds of meetings with automakers, suppliers, NGOs, consumer groups, labor, states/local
governments, otherso Collaboration with NHTSA, CARB, DOE, Transport & Environment Canada

U.S. Environmental Protection Agency – OAR-OTAQ
EPA technical information available to all stakeholders/public
Wide range of peer-reviewed publications and presentations:• Technical papers,
including SAE papers and EPA reports
• Conference presentations
• Modeling workshop
+ more …16
Modeling and Simulation
EPA’s National Vehicle and Fuel Emissions Laboratory
Ann Arbor, MI
U.S. Environmental Protection Agency – OAR-OTAQ
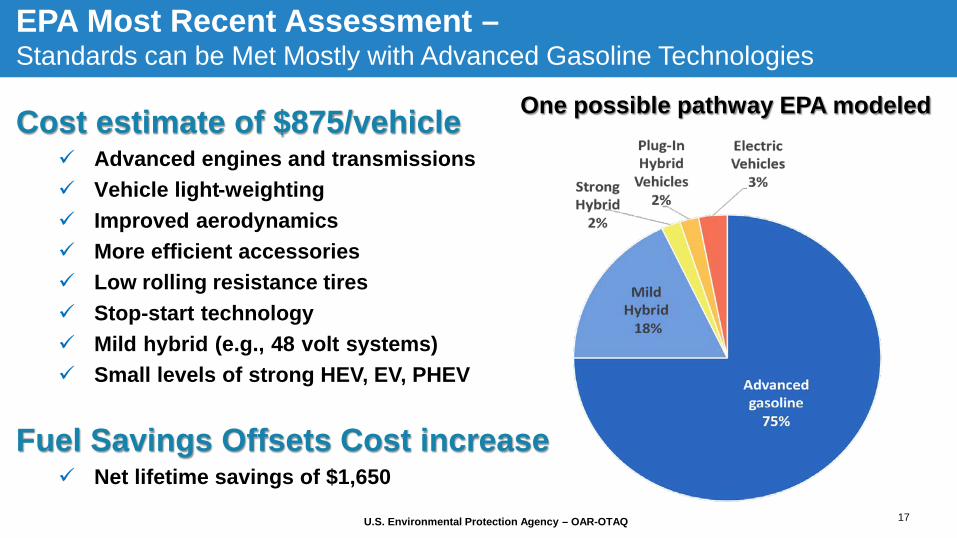
EPA Most Recent Assessment –Standards can be Met Mostly with Advanced Gasoline Technologies
Cost estimate of $875/vehicle Advanced engines and transmissions Vehicle light-weighting Improved aerodynamics More efficient accessories Low rolling resistance tires Stop-start technology Mild hybrid (e.g., 48 volt systems) Small levels of strong HEV, EV, PHEV
Fuel Savings Offsets Cost increase Net lifetime savings of $1,650
17
One possible pathway EPA modeled
U.S. Environmental Protection Agency – OAR-OTAQ
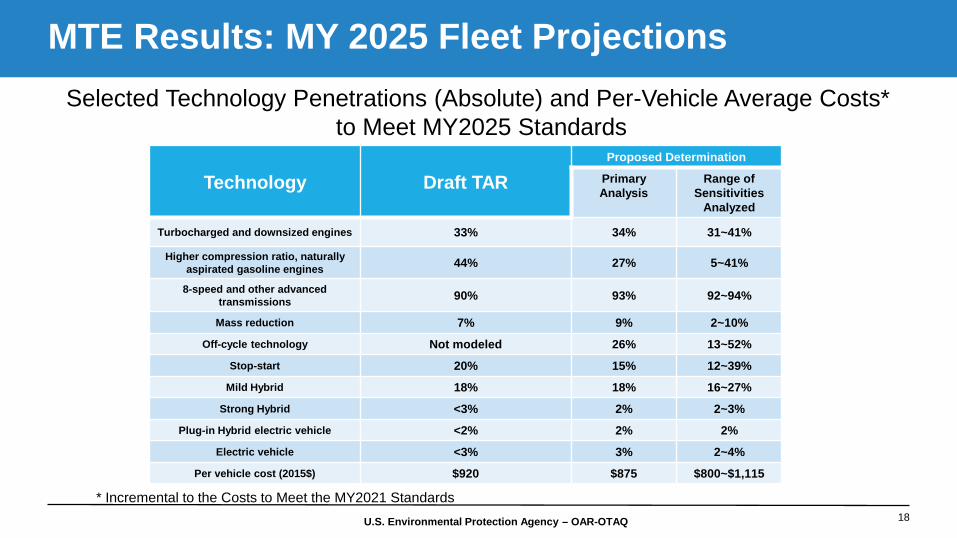
MTE Results: MY 2025 Fleet Projections
18
Technology Draft TARProposed Determination
Primary Analysis
Range of Sensitivities
Analyzed
Turbocharged and downsized engines 33% 34% 31~41%
Higher compression ratio, naturally aspirated gasoline engines 44% 27% 5~41%
8-speed and other advancedtransmissions 90% 93% 92~94%
Mass reduction 7% 9% 2~10%
Off-cycle technology Not modeled 26% 13~52%
Stop-start 20% 15% 12~39%
Mild Hybrid 18% 18% 16~27%
Strong Hybrid <3% 2% 2~3%
Plug-in Hybrid electric vehicle <2% 2% 2%
Electric vehicle <3% 3% 2~4%
Per vehicle cost (2015$) $920 $875 $800~$1,115
Selected Technology Penetrations (Absolute) and Per-Vehicle Average Costs* to Meet MY2025 Standards
* Incremental to the Costs to Meet the MY2021 Standards
U.S. Environmental Protection Agency – OAR-OTAQ
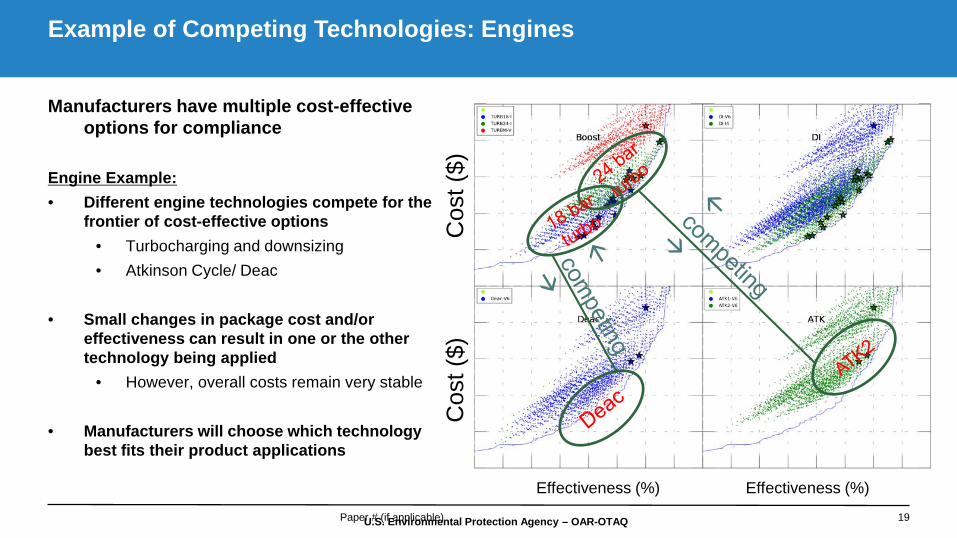
Manufacturers have multiple cost-effective options for compliance
Engine Example:• Different engine technologies compete for the
frontier of cost-effective options• Turbocharging and downsizing• Atkinson Cycle/ Deac
• Small changes in package cost and/or effectiveness can result in one or the other technology being applied
• However, overall costs remain very stable
• Manufacturers will choose which technology best fits their product applications
Example of Competing Technologies: Engines
Paper # (if applicable) 19
Effectiveness (%) Effectiveness (%)
Cos
t ($)
Cos
t ($)

U.S. Environmental Protection Agency – OAR-OTAQ
Similar alternatives exist for vehicle manufacturers regarding the selection of transmission technologies
Manufacturers are predominantly applying three current primary transmission architectures:
• Conventional automatic transmissions• Continuously variable transmissions• Dual clutch transmission
All three transmission types are driving towards the same goal of providing maximum flexibility to operate the engine and maximum transmission efficiency.
Once again, vehicle manufacturers will select the transmission architecture that best fits its product portfolio.
Example of Competing Technologies: Transmissions
20

U.S. Environmental Protection Agency – OAR-OTAQ
MY2008 PFI Engine
Progress in Engine Efficiency
21
MY2008 Actual PFI Engine• Peak thermal efficiency 34%• Narrow efficiency region

U.S. Environmental Protection Agency – OAR-OTAQ
MY2014 GDI Engine
Progress in Engine Efficiency
22
MY2014 Actual GDI Engine• Peak thermal efficiency 36%• Broader efficiency region
MY2008 Actual PFI Engine• Peak thermal efficiency 34%• Narrow efficiency region

U.S. Environmental Protection Agency – OAR-OTAQ
MY2016 Turbo downsized Engine
Progress in Engine Efficiency
23
MY2014 Actual GDI Engine• Peak thermal efficiency 36%• Broader efficiency region
MY2016 Actual Turbo downsized Engine• Peak thermal efficiency 38%• Very broad efficiency region• Large overlap with 2-cycle test operation
MY2008 Actual PFI Engine• Peak thermal efficiency 34%• Narrow efficiency region

U.S. Environmental Protection Agency – OAR-OTAQ
MY2025 EPA Projected TDS engine
Progress in Engine Efficiency
24
MY2025 EPA projected turbo downsized engine• Peak thermal efficiency 38%• Similar efficiency region as MY2016 actual
engine• Hardware improvements provide some
improved low-load efficiency
MY2014 Actual GDI Engine• Peak thermal efficiency 36%• Broader efficiency region
MY2016 Actual Turbo downsized Engine• Peak thermal efficiency 38%• Very broad efficiency region• Large overlap with 2-cycle test operation
MY2008 Actual PFI Engine• Peak thermal efficiency 34%• Narrow efficiency region

U.S. Environmental Protection Agency – OAR-OTAQ
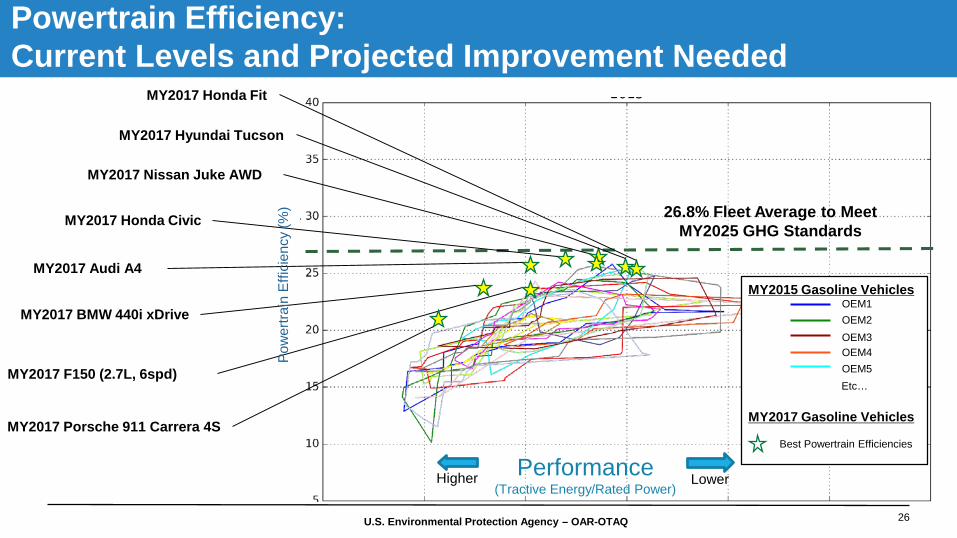
Current vs. Future Gasoline Powertrain Efficiencies
25
In 10 model years, average powertrain efficiency is
expected to increase from 21.5% to 26.8%
U.S. Environmental Protection Agency – OAR-OTAQ
Performance(Tractive Energy/Rated Power)
Higher Lower
Powertrain Efficiency: Current Levels and Projected Improvement Needed
26.8% Fleet Average to Meet MY2025 GHG Standards
OEM1OEM2OEM3OEM4OEM5Etc…
MY2015 Gasoline Vehicles
MY2017 Honda Civic
MY2017 Nissan Juke AWD
MY2017 Audi A4
MY2017 Porsche 911 Carrera 4S
MY2017 BMW 440i xDrive
MY2017 F150 (2.7L, 6spd)
MY2017 Hyundai Tucson
MY2017 Honda Fit
MY2017 Gasoline Vehicles
Best Powertrain Efficiencies
26
Pow
ertra
in E
ffici
ency
(%)

WHAT COMES NEXT?
27

U.S. Environmental Protection Agency – OAR-OTAQ
March 15, 2017 - EPA Administrator Pruitt issued a Notice announcing he will reconsider the EPA Final Determination published in January 2017:
“ … EPA has concluded that it is appropriate to reconsider its Final Determination in order to allow additional consultation and coordination with NHTSA in support of a national harmonized program.”
“In accord with the schedule set forth in EPA’s regulations, the EPA intends to make a new Final Determination regarding the appropriateness of the MY 2022-2025 GHG standards no later than April 1, 2018.”
EPA’s Reconsideration of the MTE Final Determination
28
U.S. Environmental Protection Agency – OAR-OTAQ
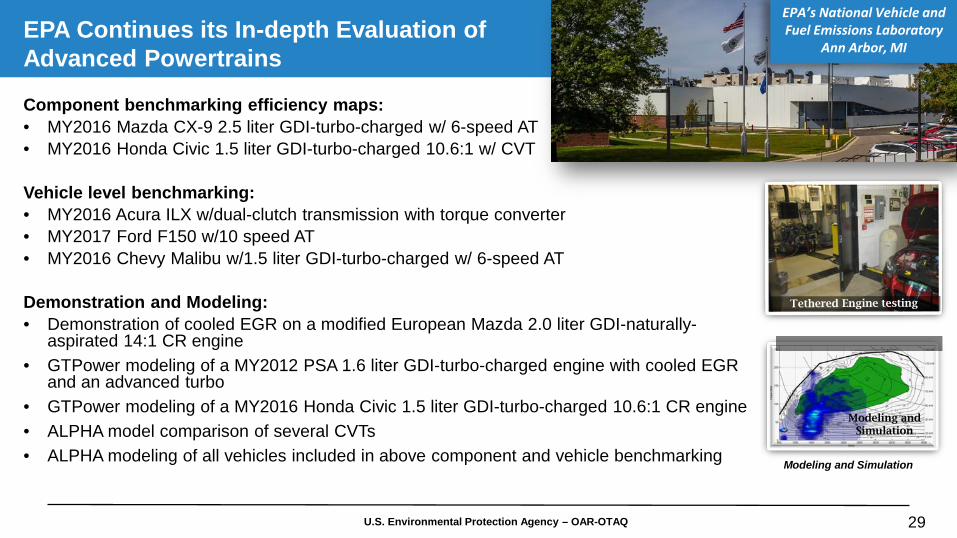
EPA Continues its In-depth Evaluation of Advanced Powertrains
29
Component benchmarking efficiency maps:• MY2016 Mazda CX-9 2.5 liter GDI-turbo-charged w/ 6-speed AT• MY2016 Honda Civic 1.5 liter GDI-turbo-charged 10.6:1 w/ CVT
Vehicle level benchmarking:• MY2016 Acura ILX w/dual-clutch transmission with torque converter• MY2017 Ford F150 w/10 speed AT• MY2016 Chevy Malibu w/1.5 liter GDI-turbo-charged w/ 6-speed AT
Demonstration and Modeling:• Demonstration of cooled EGR on a modified European Mazda 2.0 liter GDI-naturally-
aspirated 14:1 CR engine• GTPower modeling of a MY2012 PSA 1.6 liter GDI-turbo-charged engine with cooled EGR
and an advanced turbo• GTPower modeling of a MY2016 Honda Civic 1.5 liter GDI-turbo-charged 10.6:1 CR engine• ALPHA model comparison of several CVTs• ALPHA modeling of all vehicles included in above component and vehicle benchmarking Modeling and Simulation
Modeling and Simulation
EPA’s National Vehicle and Fuel Emissions Laboratory
Ann Arbor, MI

U.S. Environmental Protection Agency – OAR-OTAQ
Global Passenger Car CO2 Standards
30
Source: International Council for Clean Transportation.
http://www.theicct.org/blogs/staff/improving-conversions-between-passenger-vehicle-efficiency-standards