Environmental Waist Health and Social Implications Professor Iain Broom Research Professor and...
32
Environmental Waist Health and Social Implications Professor Iain Broom Research Professor and Consultant in Clinical Biochemistry and Metabolic Medicine The Robert Gordon University and NHS Grampian
-
Upload
rosalind-brooks -
Category
Documents
-
view
214 -
download
0
Transcript of Environmental Waist Health and Social Implications Professor Iain Broom Research Professor and...

Environmental WaistHealth and Social Implications
Professor Iain BroomResearch Professor and Consultant in
Clinical Biochemistry and Metabolic MedicineThe Robert Gordon University and NHS Grampian

Homo Sapiens Homo Adipatus
50 Years
A NEW SPECIES ?
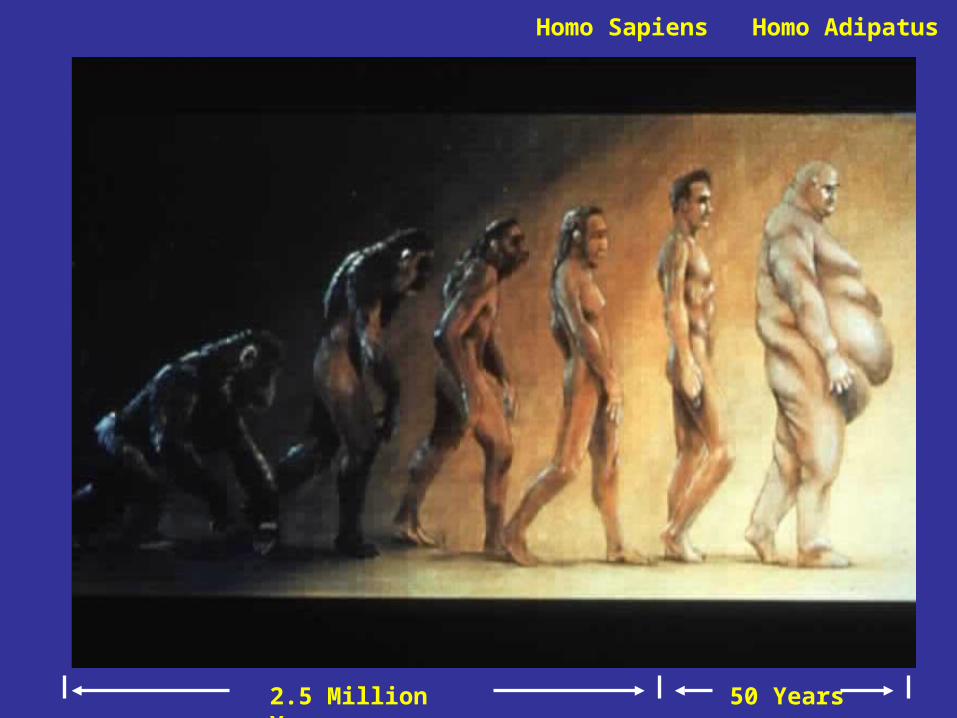
2.5 Million Years 50 Years
Homo AdipatusHomo Sapiens

Genetic
Neurologic and
Physiologic
Biochemical
Environmental Cultural and Socio-economic
1. Adapted from Weighing the Options; 1995:52. 2. Clinical guidelines. National Heart, Lung, and Blood Institute
Web site. Available at: http://www.nhlbi.nih.gov/guidelines/obesity/ob_home.htm. Accessed March, 2001.
Factors involved in the creation of “Homo Adipatus”


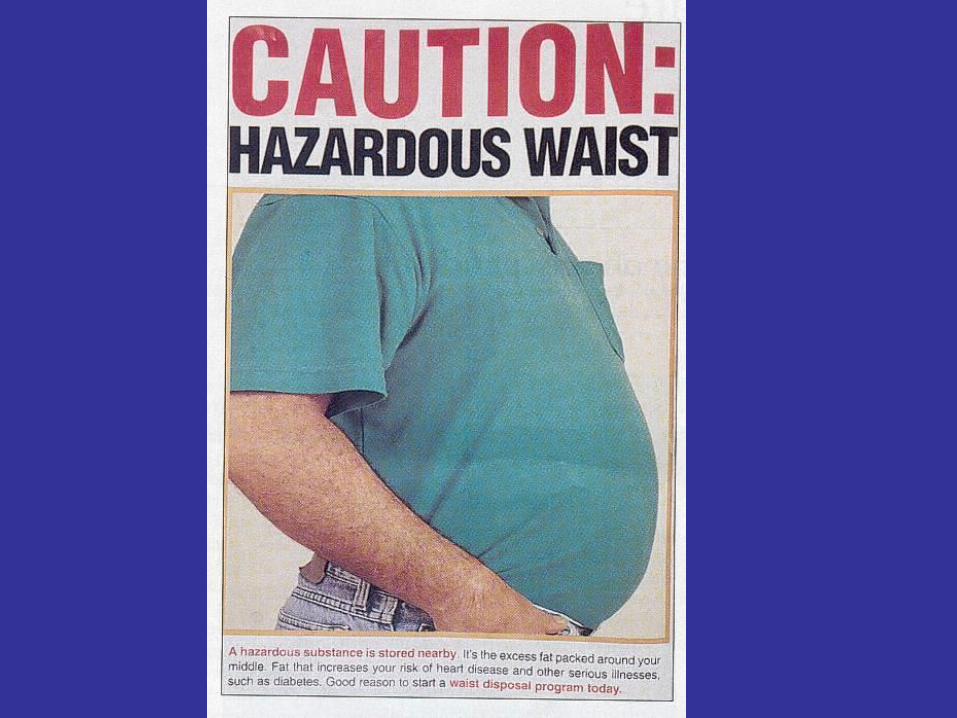


Abdominal Fat DistributionObesity and Risk

Definition of Metabolic Syndrome:WHO and ATP III (1)
Risk factor WHO ATP III
Fasting glucose > 6.1 mmol/L > 6.1 mmol/L
2h post-OGTT glucose - > 6.7 mmol/L
Insulin resistance - Yes
Abdominal obesity
Men WC > 102 cm WC > 102 cm
Women WC > 88 cm WC > 88 cm
WHO (website)_NCEP Expert Panel - ATP III JAMA 2001; 285:2486-97
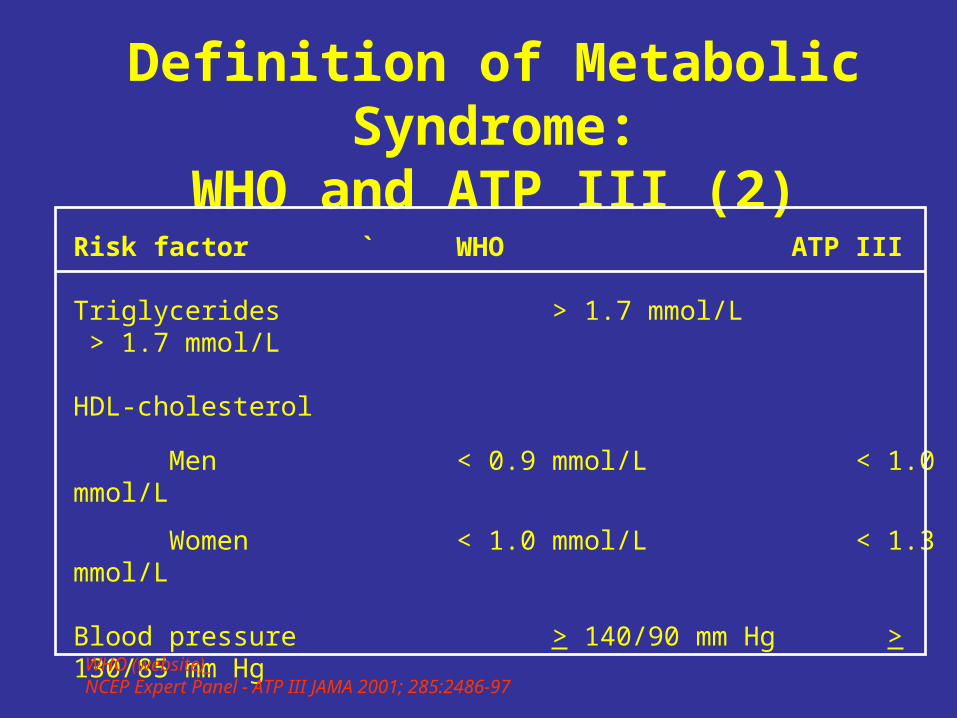
Definition of Metabolic Syndrome:WHO and ATP III (2)
Risk factor ` WHO ATP III
Triglycerides > 1.7 mmol/L > 1.7 mmol/L
HDL-cholesterol
Men < 0.9 mmol/L < 1.0 mmol/L
Women < 1.0 mmol/L < 1.3 mmol/L
Blood pressure > 140/90 mm Hg > 130/85 mm Hg
Microalbuminuria UAE > 20 g/minor alb:creatinine > 30 mg/g
WHO (website)_NCEP Expert Panel - ATP III JAMA 2001; 285:2486-97
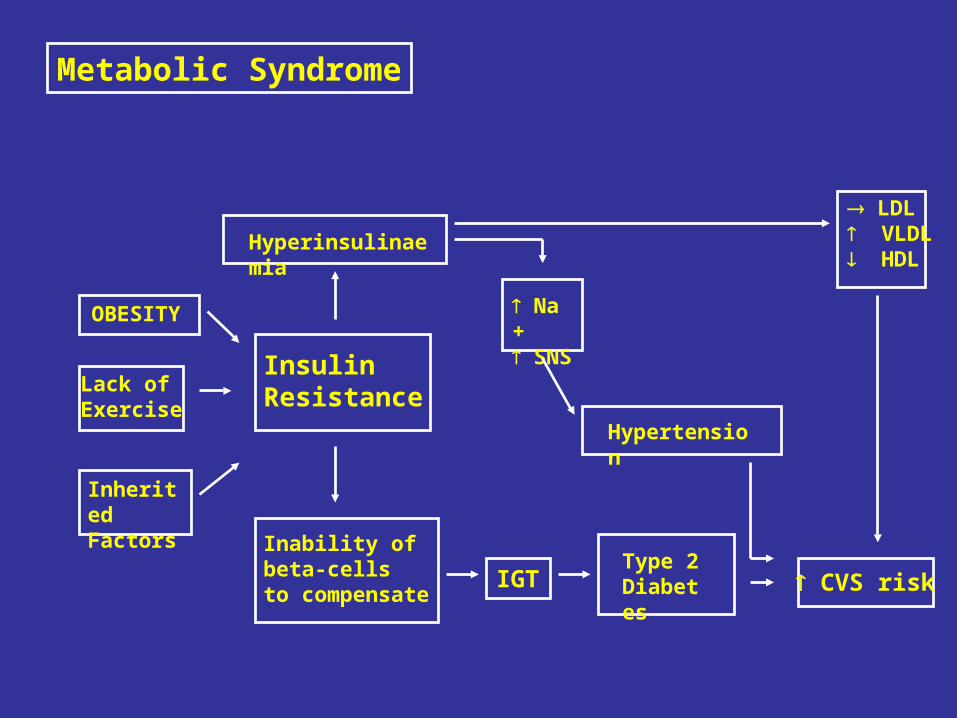
Metabolic Syndrome
Hyperinsulinaemia
OBESITY
Lack ofExercise
InheritedFactors
InsulinResistance
Inability ofbeta-cellsto compensate
IGT
Hypertension
Na + SNS
Type 2Diabetes CVS risk
LDL VLDL HDL
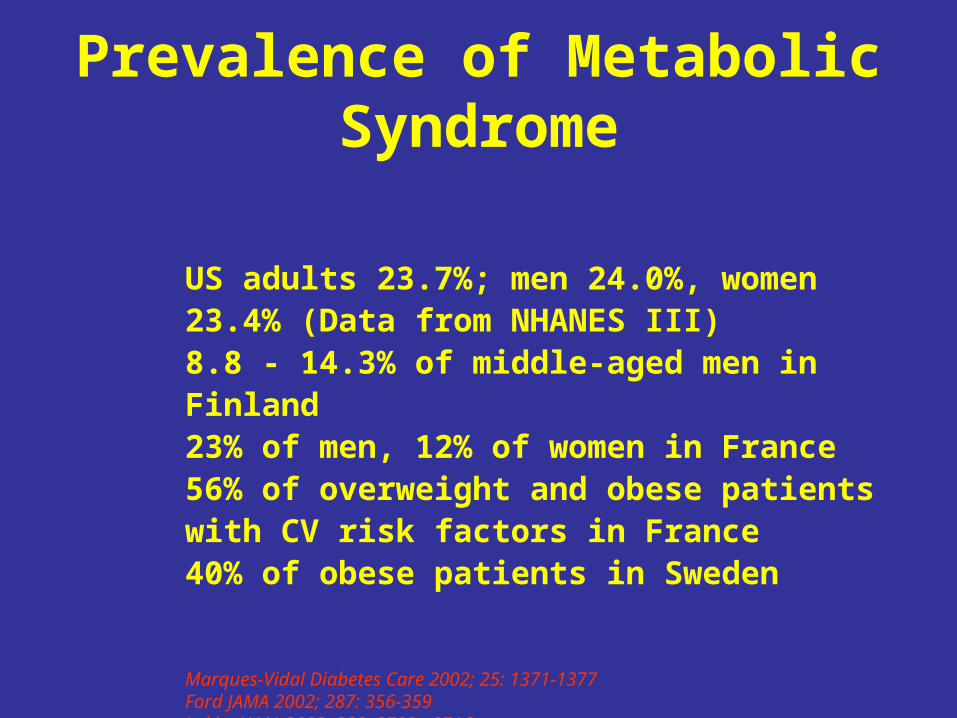
Prevalence of Metabolic Syndrome
US adults 23.7%; men 24.0%, women 23.4% (Data from NHANES III)8.8 - 14.3% of middle-aged men in Finland23% of men, 12% of women in France56% of overweight and obese patients with CV risk factors in France40% of obese patients in Sweden
Marques-Vidal Diabetes Care 2002; 25: 1371-1377Ford JAMA 2002; 287: 356-359Lakka JAMA 2002; 288: 2709 - 2716Davidson ADA 2003; Guy-Grand ECO 2003

Obesity Prevalence UK 1980 - 2010
30
20
10
♂
♀
8 6
16 14
3129
1980 1990 2000 2010
2321

Prevalence of overweight & obesity in England & Wales
Classification BMI (kg/m2) % Population
Pre-obese 26-29 > 50%
Obese > 30 23% males
23% females

The prevalence of obesity%
po
pu
lati
on
wit
h B
MI
30 k
g/m
2
0
10
20
30
40
MenWomen
All data 1991 or later
Fra
nce
Net
her
lan
ds
Fin
lan
d
UK
W G
erm
any
Cze
ch
Rep
ub
lic
E G
erm
any
Ru
ssia
US
A–w
hit
eU
SA
–h
isp
anic
sU
SA
–bla
cks
Can
ada
Au
stra
lia

0
10
20
30
40
50
60
70
80
30-34.9 35-39.9 40-44.9 45-49.9 50+
% o
f aud
it po
pula
tion
Aberdeen Bath Birmingham Glasgow Hammersmith Leeds Luton National Aggregate
BMI distribution in obese sub sample compared across Counterweight regions

Economic costs of obesity
Country Year Definition Estimated % national health
of obesity direct costs care costs
Australia 1989-90 >30 AU$ 464 million >2%
France 1992 27 FFr 12 000 million 2%
Netherlands 1981-89 >25 Dfl. 1000 million 4%
USA 1995 29 US$ 51.64 billion 5.7%
WHO Obesity: preventing and managing the global epidemic. WHO, 1998Wolf AM, Colditz GA. Obesity Research 1998

Consequences of obesity
Respiratory diseaseHeart disease
Gall bladder disease
Hormonal abnormalities
Hyperuricaemiaand gout
Stroke
Cardiovascular risk factors
Diabetes
OsteoarthritisCancer

Comorbidity Costs 1995/6e
Disease Total Cost PAF Obesity Cost
£ Million %age £ Million
________________________________________________Diabetes 2,350 49.0 1,151.5
Hypertension 364 20.0 72.8
IHD 1,326 19.0 251.94
Stroke 1,343 5.0 67.15
Cancer 1,043 2.3 23.98
Musculoskeletal 1,230 10.0 123.00
____________________________________________________
Total cost of Comorbidities £1,690,379,000

0
10
20
30
40
50
1.02.2
12
42
0
25
50
75
100
1.08.1
40
93
<23 25 31 35 <22 25 31 35
Men1 Women2
BMI1Chan JM et al. Diabetes Care 1994; 17: 961-9; 2Colditz G et al. Ann Intern Med 1995; 122: 481-6
Age-adjusted relative risk of type 2 diabetes
Obesity is the Primary Risk Factorfor Type 2 Diabetes
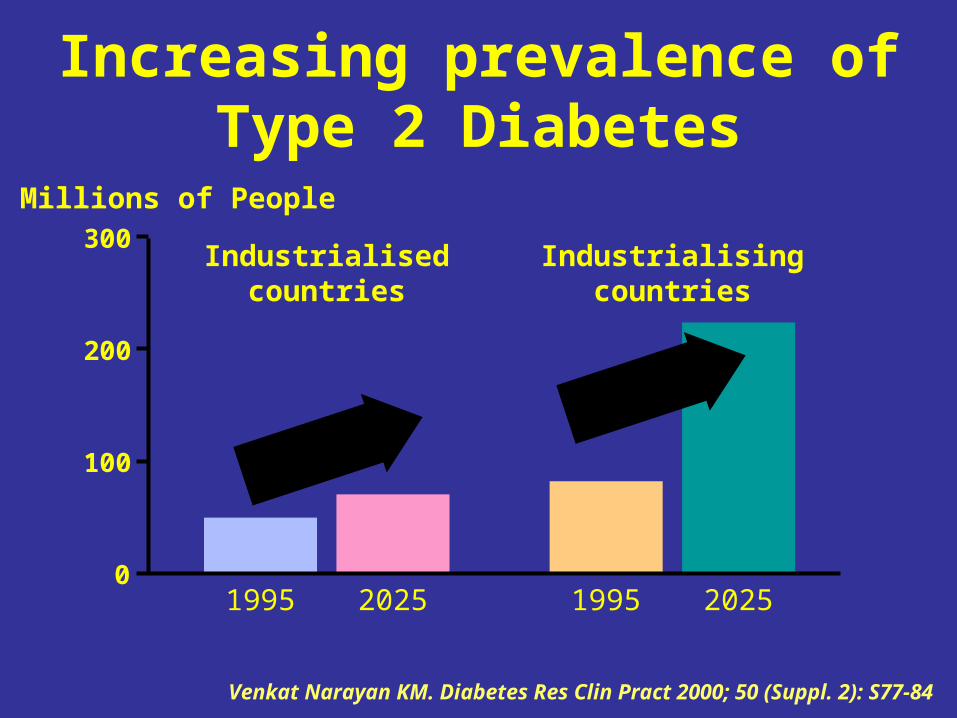
Increasing prevalence ofType 2 Diabetes
Industrialisedcountries
Industrialisingcountries
Millions of People
1995 2025
Venkat Narayan KM. Diabetes Res Clin Pract 2000; 50 (Suppl. 2): S77-84
0
300
200
100
1995 2025
42%
170%

Environmental changesEvolutionary Flashpoint
• Energy Expenditure
• Energy Intake
• Automation
• COMPUTERISATION
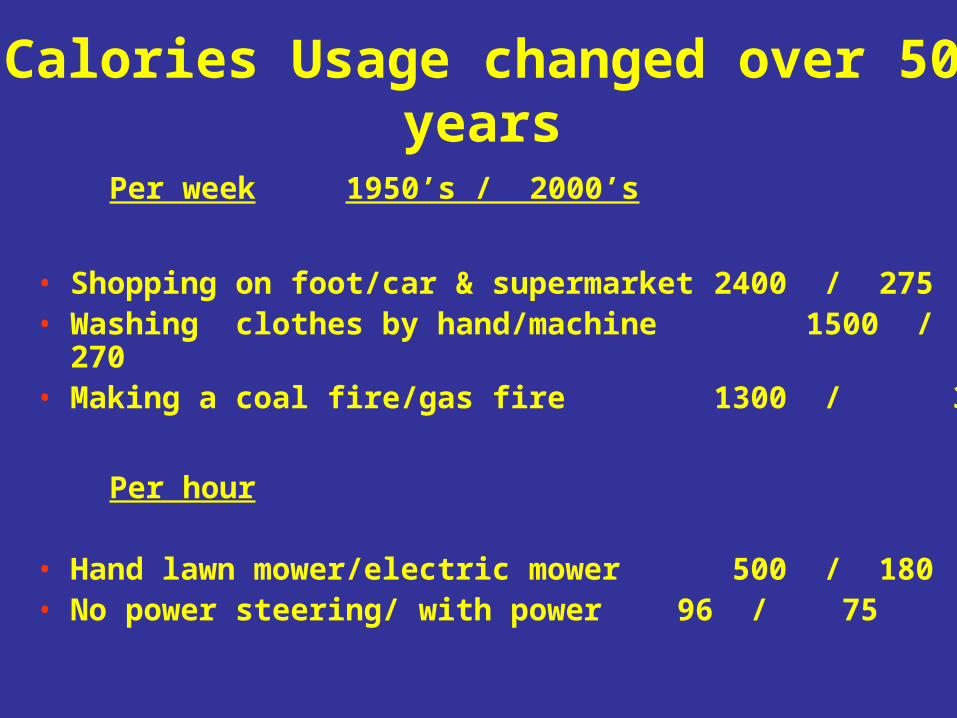
Calories Usage changed over 50 years
Per week 1950’s / 2000’s
• Shopping on foot/car & supermarket 2400 / 275• Washing clothes by hand/machine 1500 / 270• Making a coal fire/gas fire 1300 / 3
Per hour
• Hand lawn mower/electric mower 500 / 180• No power steering/ with power 96 / 75

School Children involved in sporting activities (USA)
80
60
40
20
H/S - High SchoolM/S - Middle School
H/S M/S H/S M/S
Data from Centre for Disease Control 2000
1991 1999
3% DROP per annum

Computerisation and ObesityYear Computer Status % Obesity
1979 First desktop Computer 6 – 8 %
1980’s Computerised machines 12 – 14%MicrowavesAutomated Washing Machines
1990’s Computer Games 16 – 18% Childhood obesity2000’s Widespread computerisation
GlobalisationFree Market Economy 23% expenditure on computer Childhood obesity education and comorbidities School activity (Sport)

The Risk Society
• Not all environmental by force of nature (eg global warming)
• Interrelated changes within contemporary social life
• Shifting employment patterns
• Heightened job insecurity
• Erosion of traditional family patterns
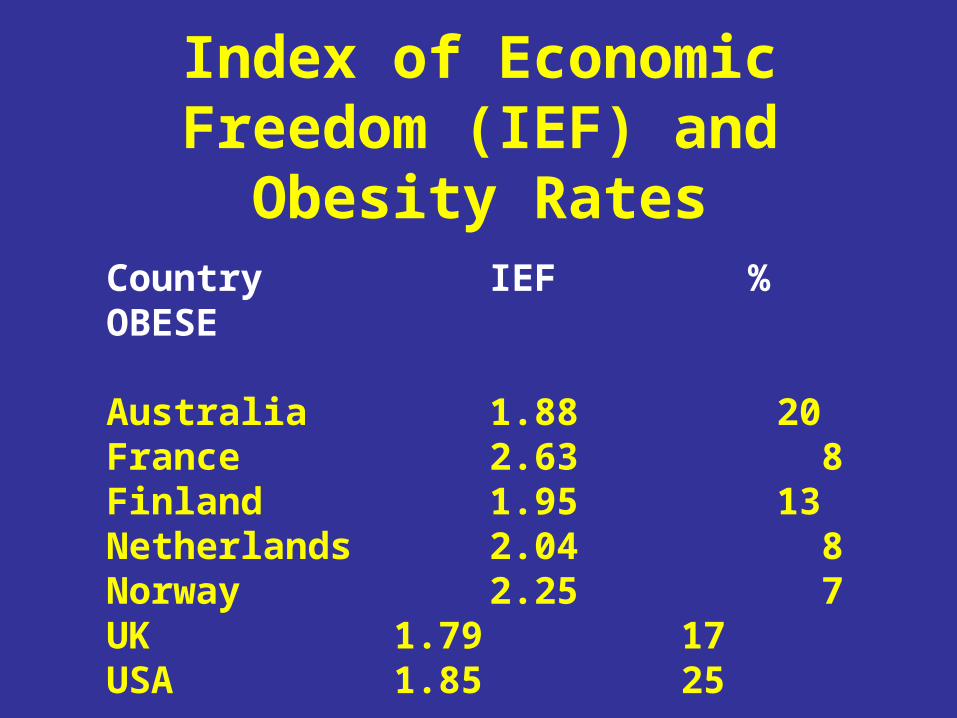
Index of Economic Freedom (IEF) and Obesity Rates
Country IEF % OBESE
Australia 1.88 20France 2.63 8Finland 1.95 13Netherlands 2.04 8Norway 2.25 7UK 1.79 17USA 1.85 25

Globalisation and the Free Market Economy
• AUSTRALIA, USA and UK - DEREGULATED in an uncontrolled fashion with no political intervention
• NETHERLANDS - CONTROLLED DEREGULATIONprevention of inequalities in job securityfood choice and leisure time activities
• SCANDINAVIA - similar political intervention to regulate the forces of globalisation

Globalisation
• Effects are not inevitable
• Political intervention is possible
• Beneficial effects on Food consumption leisure time energy
expenditure

Treatment/Prevention Strategies
• Not just an NHS issue
• Government (local and national)
inter-department cooperation
• Public and Government Education
• Simple Messages do not work
• Complex related strategies needed

Treatment/Prevention Strategies
• Population
• Society
• Individual