Radioecological Studies in Nordic Countries after the Chernobyl Accident

General rights Copyright and moral rights for the publications made accessible in the public portal are retained by the authors and/or other copyright owners and it is a condition of accessing publications that users recognise and abide by the legal requirements associated with these rights.
• Users may download and print one copy of any publication from the public portal for the purpose of private study or research. • You may not further distribute the material or use it for any profit-making activity or commercial gain • You may freely distribute the URL identifying the publication in the public portal
If you believe that this document breaches copyright please contact us providing details, and we will remove access to the work immediately and investigate your claim.
Downloaded from orbit.dtu.dk on: Jul 02, 2018
Environmental studies on radioecological sensitivity and variability with specialemphasis on the fallout nuclides 90Sr and 137Cs. Part 1. Main text
Aarkrog, Asker
Publication date:1979
Document VersionPublisher's PDF, also known as Version of record
Link back to DTU Orbit
Citation (APA):Aarkrog, A. (1979). Environmental studies on radioecological sensitivity and variability with special emphasis onthe fallout nuclides 90Sr and 137Cs. Part 1. Main text. (Denmark. Forskningscenter Risoe. Risoe-R; No.437(Pt.1)).

M (^/H\ Risø-R-437
^\\£j) P a r t 1 (Main text)
Environmental Studies on Radioecological Sensitivity and Variability with Special Emphasis on the Fallout Nuclides 90Sr and 137Cs Asker Aarkrog
Risø National Laboratory, DK-4000 Roskilde, Denmark
June 1979

ENVIRONMENTAL STUDIES ON RADIOECOLOGICAL SENSITIVITY AND
VARIABILITY WITH SPECIAL EMPHASIS ON THE FALLOUT NUCLIDES 90Sr and 137Cs
Asker Aarkrog
Denne afhandling er af det naturvidenskabelige fakultet ved
Københavns Universitet antaget til offentligt at forsvares
for den naturvidenskabelige doktorgrad.
København, den 25. november 1980 Claus Nielsen dekan
Forsvaret vil finda atad fradag d. 27. marta 1981 kl. 14
i Annan auditorium A, Studlaatrada 6, Kabanhavn K.

RISØ-R-437
Part one
Main text
ENVIRONMENTAL STUDIES ON RADIOECOLOGICAL SENSITIVITY AND
VARIABILITY WITH SPECIAL EMPHASIS ON THE FALLOUT NUCLIDES 90Sr and 137Cs
Asker Aarkrog
Health Physics Department
Abstract, Radioecological sensitivity and variability are quan
tities that are used to characterize the radioecological pro
perties of environmental samples.
The radioecological sensitivity is the infinite time-integrated
radionuclide concentration in the environmental sample con-_2
sidered arising from a deposition of 1 mCi km of the radionuclide in question.
This quantity makes it possible to compare various environments
as to their vulnerability to a given radioactive contamination.
The variability of the concentrations of a radionuclide in an
environmental sample, with respect to a given parameter, is
defined as the partial coefficient of variation due to this
parameter. (Continued next page)
June 1979
Risø National Laboratory, DK 4000 Roskilde, Danmark

The variability with time is a useful way to assess the route
of contamination of the sample and the local variability is
measure of environmental inhomogenity with respect to radioac
tive contamination.
Radioecological sensitivity and variability were applied to
the Sr and Cs data obtained from the environmental studies
on the human foodchain carried out during the last two decades
in Denmark, the Faroe Islands, and Greenland.
The per caput effective dose-equivalent commitments from radio
active debris from nuclear weapons testing was estimated to be
1.6 mSv in Denmark, 4.2 mSv in the Faroe Islands, and 1.6 mSv
in Greenland.
INIS-descriptors: AIR, ATMOSPHERIC PRECIPITATIONS, BODY, BREAD,
CESIUM 137, CEREALS, COMPILED DATA, CONTAMINATION, DENMARK,
DIET, DOSE COMMITMENTS, DRINKING WATER, ENVIRONMENT, ENVIRON
MENTAL EXPOSURE PATHWAY, EXPERIMENTAL DATA, FAROE ISLANDS,
FISHES, FOOD CHAINS, FRESH WATER, FUCUS, GRAMINEAE, GLOBAL
FALLOUT, GREENLAND, LICHENS, MAN. MEAT, MILK, RADIOACTIVITY,
RADIOECOLOGY, RADIOECOLOGICAL CONCENTRATION, RADIONUCLIDE KINE
TICS, RADIONUCLIDE MIGRATION, SAMPLING, SEAWATER, SEDIMENTS,
SEEDS, SENSITIVITY, SOILS, STATISTICAL MODELS, STRONTIUM 90,
TEETH, TRANSLOCATION, VEGETABLES.
UDC 614.73 (489 + 491.2 + 988)
ISBN 87-550-0734-1
ISBN 87-550-0727-9
ISS!I 0106-2840
Risø Repro 1981

To my collaborators

•a fik tf« Mangt tit Skavta $e* dtt godt lcvcb**4« Skt/ti, M » . 4«« vat k«a C«a. ic« kra k/ea aca* tt 5taat F f t t ( « « « } ; l u f t * k«vac v M « tfyfct aa i * » • « , *a kaa 4a <kk« k c t t t « . aaa aaa •«$«?« aaj a t Ktekkc-latfca kaai |<a « • acaat »<•* Uatc i a t kaa t t T*#! a*ct wa« aaaaaa «« V«««rfaaw-«a<*. »c« «4c-t « f * te« » i t Hovtd awa* Ttacf . aca ea l#aca kørn | t a aca« Navca' c ( ( c t | t a aca kafe Staaac r itt kmmdt kaa <kkc caataa mtd ttéttmtktd tigt, og »a« kfcv aaa aatat »c« reaacaa Ktekkc« og iktev kvct t Aa* ca tittt AfkaaatCiaa ea Oafca; a ta tigtmtgtt vidttt
KlØKKEN
Raabc** ol pteptt mom wtnt te tkt tied in tkt kept ol jtt ti mg »uc* a good tppoint-mtnt, bat t h e « aa* o at if oa< prito ca«« fcca« mitk mnm k«arf c$ «tptaaat«ea. Noac c< tk ta katf beca {at caaaafc into tkt need, act ktd tki* aaa e i t k e t , bat mtl tkt aaac kt mmdt %rut that t k t btt t - teuad' caac Jtca a vcta> fctj ewt in a kettøa t t « « . I f wa* a k*nrf e j e*t e j »itrfe« that kept knocking t t « head a j a i a t t tfce f t e c ; bat aketket tkc »cuarf caae {taa tk t c a t ' * At*«! et j tea tkt koltom ttuak ft« ceafaa ' t ytt *ay «-ct* aay cttttintw. Se kt aa« »ppointtd Univtntmt BcCt- t iaact , aaa* tvc t« aca* kt atofc a litttt ««»ay ea fk« c a t , but ae eat «a* any aiset tftaa br jotc .
THE BELL

- 7 -
CONTENTS Page
PART ONE: MAIN TEXT 3
INDEX 7
GENERAL INTRODUCTION 15
1. AIR, HATER AND SOIL 19
1.1. Introduction 19
1.2. Air 20
1.2.1. Strontium-90 21
1.2.2. Cesiua-137 22
1.2.3. Strontiun-89 23
1.2.4. Manganese-54 25
1.2.5. Other radionuclides 26
1.3. Precipitation 29
1.3.1. Variation with time and location 29
1.3.2. Relations between concentrations in air
and precipitation 33
1.4. Freshwater 35
1.4.1. Danish ground water • 36
1.4.2. Danish streams 39
1.4.3. Danish lakes 41
1.4.4. Danish drinking water (tap water) 42
1.4.5. Faroese tap water 44
1.4.6. Greenlandic drinking water 45
1.5. Sea water 47
1.5.1. Inner Danish waters 48
1.5.2. North Atlantic ocean and Greenlandic
waters 52
1.6. Soil and sediment • • ••• 55
1.6.1. Variation with time and location 55
1.6.2. The vertical distribution of radioactive
debris in soils 59
1.6.3. Sediments 62
1.7. Conclusions 64
1.7.1. General 64
1.7.2. Air 65

- 8 -
Page
1 .7 .3 . Precipitation 66 1.7j.4. Freshwater 67 1 .7 .5 . Sea water 68 1.7.6. Soil and sediment 69
2. GRAIN AND OTHER VEGETABLE PRODUCTS 70
2.1. Introduction 70
2.2. Cereal grain 71
2.2.1. Variation with tine, species and
location 72
2.2.2. Prediction models 78
2.2.3. Manganese-54 in cereal grain 80
2.2.4. Strontium-89 in cereal grain 82
2.3. Bread 82
2.3.1. Variation with time, location and
species 83
2.3.2. Prediction models and relations 88
2.3.3. Other grain products 89
2.4. Grass and other fodder crops 90
2.4.1. Grass 90
2.4.2. Fodder crops other than grass 92
2.5. Vegetables and fruit 94
2.5.1. Variation with time, location and
species 95
2.5.2. Prediction models 103
2.5.3. Iodine in green leaf vegetables 104
2.5.4. Imported vegetable products 105
2.5.5. Faroese potatoes 106
2.6. Lichen 107
2.6.1. Variation with time and location 108
2.6.2. Prediction models HO
2.7. Sea plants Ill
2.7.1. Variation with time, species and
location HI
2.7.2. Relations and prediction models 113
2.8. Conclusions 113
2.8.1. General 115
2.8.2. Cereal grain 115
2.8.3. Bread 116

- 9 -
Page
2.8.4. Grass and other fodder crops 117
2.8.5. Vegetables and fruit 117
2.8.6. Lichen 118
2.8.7. Sea plants 118
3. MILK AND OTHER ANIMAL PRODUCTS 120
3.1. Introduction 120
3.2. Danish Bilk 120
3.2.1. Variation with time and location 122
3.2.2. Relations and prediction models 128
3.2.3. Short-lived nuclides in Danish milk 132
3.3. Faroese milk 134
3.3.1. Variation with time and location 135
3.3.2. Relations and prediction models 137
3.4. Meat from terrestrial animals 138
3.4.1. Danish beef and veal 138
3.4.2. Danish pork 140
3.4.3. Faroese and Greenlandic mutton 141
3.4.4. Greenland reindeer and musk ox 143
3.5. Fish 148
3.5.1. Variation with time, location and
species . 148
3.5.2. Relations and prediction models 150
3.6. Various animals 151
3.6.1. Sea mammals 151
3.6.2. Birds and eggs 154
3.7. Conclusions 158
3.7.1. General 158
3.7.2. Danish milk 158
3.7.3. Faroese milk 159
3.7.4. Meat from terrestrial animals 160
3.7.5. Fish 161
3.7.6. Various animals 162
4. MAN - TOTAL DIET AND HUMAN TISSUES 163
4.1, Introduction 163
4.2. Total diet 164
4.2.1. Variation with time and location 165
4.2.2. Relations and prediction models 168
4.2.3. Stable strontium in the Danish diet ...... 171

- 10 -
Page
4.2.4. Faroese total diet 174
4.2.5. Greenlandic total diet 176
4.3. Hunan bone 177
4.3.1. Variation with time, age and location .... 178
4.3.2. Relations and prediction models 180
4.4. Hunan teeth 186
4.4.1. Variation with time, type of tooth and
location 187
4.4.2. Relations and prediction models 188
4.5. The human body 191
4.5.1. Variation with time, sex and individual .. 191
4.5.2. Relations and prediction models 193
4.6. Human milk 19*
4.6.1. Variation with time 194
4.6.2. Relations and prediction models 196
4.7. Conclusions 198
4.7.1. General 198
4.7.2. Total diet 199
4.7.3. Human bone 200
4.7.4. Human teeth 201
4.7.5. Human body 202
4.7.6. Human milk 202
4.7.7. Dose estimates and risk evaluations 203
4.7.8. Concluding remarks on radioecological
sensitivity and variability 206
5. GENERAL DISCUSSION 209
5.1. Introduction 209
5.2. Inventories and transfers of Sr and Cs
in the Danish terrestrial ecosystem 210
5.2.1. Definitions 210
5.2.2. Calculations 211
5.2.3. Discussion of themodels 216
5.3. Physiological and environmental radiotoxicivy ., 219
5.3.1. Physiological radiotoxicity w 220
5.3.2. Environmental radiotoxicity 222
5.3.3. Comparison of radiotoxicities 224
- 11 -
Page
5.4. Applications 226
5.4.1. Other radionuclides coopered with sr
and 137Cs 227
5.4.2. A hypothesis 228
5.4.3. Considerations in case of nuclear
accidents 230
5.5. Conclusions - 233
5.5.1. General 233
5.5.2. Inventories and transfers 233
5.5.3. Radiotoxicities 234
5.5.4. Applications 235
5.5.5. Further studies 235
ACKNOWLEDGEMENTS 239
REFERENCES 240
DANSK RESUME 265
PART TWO: APPENDICES 269
APPENDIX A
SAMPLING, ANALYSIS, MEASUREMENT AND ERROR 275
A.l. Sampling Methods 275
A.2. Analytical procedures and measurements of
radioactivity 313
A.2.1. kadiostrontium analysis 314
A.2.2. Plutonium analysis 315
A.2.3. Assessment of radiocesium 316
A.2.4. Radioactivity Measurements 317
A.3. Quality of data assessment 321
A.3.1. The precision of the data 322
A.3.2. The accuracy of the data 325
APPENDIX B
ANALYSIS OF VARIANCE, AND THE VARIABILITY 328
B.l. Introduction 328
B.2. Some statistical definitions 328
B.3. Analysis of variance 331
B.4. Variability j 335
B.5. Anova and variability tables 337

- 12 -
Page
APPENDIX C
PREDICTION MODELS AND RADIOECOLOGICAL SENSITIVITY 361
C.l. Introduction 361
C .2. Actual models 362
C.3. Radioecological sensitivity 364
C.4. FIT-tables 365
APPENDIX D
NOTES TO THE MAIN TEXT 399
D.1.2. Summary of history of nuclear
weapons testing 399
D.1.2.1. Local variations in the con-90 137
centrations of Sr and Cs in
air samples 400 90
Table D.1.2.1. Total deposition of Sr in
the northern hemisphere relatad to 90_ , 137„ ^ _ Sr and Cs concentrations in
ground-level air at Risø 401 90
Table D.l.3.2. Earlier estimates of the Sr deposition in Denmark before Danish
measurements began 402
D.1.3.3. Calculation of the fallout-weighted
mean precipitation at the state
experimental farms ^"2
90 D. 1.4.1. An estimate of the transfer of Sr
from Danish ground water to the
biosphere 403 90
D.l.4.2. Estimate of Sr run-off with
Danish streams 404 90 137
Table D.1.5.1. The Sr and Cs concentrations in Danish waters related
to salinity 405
Table D.1.5.2. Strontium-90 in deep sea water
collected by the Dana in the North
Atlantic 406

13
Page
D. 1.6.1.1. Removal processes for radio
nuclides deposited on the surface of
the earth 406 90
Table D.1.6.1.1. An estimate of the total Sr 137
and Cs uptake by Danish crops
1950-1974 408 137
Table D.1.6.1.2. Strontium-90 and Cs in
Greenlandic and Faroese soils 410
D.l.6.2. Estimate of the effective halflife 90 of Sr in Danish soils 410
Table D.1.6.2.1. Calculated effective
halflives for the root uptake of 90
Sr from uncultivated soils 411
Table D.1.6.2.2. Calculated effective
halflives for the root uptake of 90
Sr from cultivated soils 414
Table D.l.6.2.3. Calcium and stable strontium
in the soil of the ploughing layer
collected from 10 Danish experimental
farms in 1966 415
D.2.2.1. Influence of variety on radionuclide
concentrations in cereal grain 415
D.2.2.2.1. Comparison between prediction models 90 -1 for pCi Sr (g Ca) in cereal grain .. 417
D.2.2.2.2. Error estimate of prediction models for grain 418
D.2.4.1. The calcium and potassium content
of Danish, Faroese and Greenlandic
grass samples 419
Table D.3.2.1. Feed units in various crops
r TaMve to feed units from grass .... 420
D.3.4.4. On the fallout rate used in the
prediction models for samples from
West Greenland 420
D.3.5.1. Calcium content of cod-flesh 421

- 14 -
Page
D.4.2.1. The importance of the variations in
the composition of the Danish total
diet 421
D.4.2.2. Assessment of the radioactive contami
nation of the Danish total diet 424
Table D.4.2.2. A comparison of the relative
contributions from the various uiet
groups and of the transfer coefficients
P23 4 2 6
D.4.3.2. Prediction models based on diet levels 90
for Sr in adult human bone 426
D.4.4.1. Influence of the time of tooth 90 sampling on the Sr concentrations
observed in shed deciduous teeth 428
D.4.7.7. The collective effective dose
equivalent commitment 428
D.4.7.8. The significance of the time distri
bution of the fallout when applied
for calculation of the radioecologi-
cal sensitivity 429
D.5.2.1. Statistical information on Danish agri
cultural produce with estimates of cal
cium and potassium levels 430
ABBREVIATIONS AND UNITS 435
APPENDED REPRINTS 4 3 7

- 15 -
GENERAL INTRODUCTION
Shortages of natural resources and increasing pollution have
in recent decades made an understanding of the interaction
between man and nature even more necessary. As compared to most
chemical pollution, t^3 radioactive contamination of the
environment is modest. The prospects of increasing nuclear
power production in the next decades, however, justify radio-
ecological studies. Radioactive contamination of the human
environment became a reality on 1.6 July 1945, when the first
fission weapon was tested near the town cf Alamogordo in New
Mexico. Military use of nuclear energy is still the main source
of global radioactive contamination; atmospheric test explosions
with thermonuclear weapons such as those still performed by the
People's Republic of China thus contribute measurably to the
concentrations of radionuclides in man's environment, even far
distant from the test sites. Accidents involving nuclear
weapons, e.g., those that took place at Palomares, Spain, and
at Thule, Greenland, have resulted in local contamination, but
were not of global concern with respect to pollution. The use
of nuclear energy to produce power has also given rise to
measurable concentrations of radionuclides in the environment,
especially close to nuclear installations; however, the global
mean dose rate originating from nuclear energy production is
at present (1979) nearly two orders of magnitude less than that
from military applications.
Radioecology comprises the relationships between radioactive
substances or radiation and the environment. Thus this science
includes the movement of radionuclides v.'ithin ecological
systems and their accumulation within specific ecosystem
components such as air, water, soil and living organisms. The
effects of ionizing radiation upon ecological systems, which
are not d_alt with in this study, may best be termed "iadiation
ecology", although this last term is used by some authors
(Sc72) instead of "radioecology".

- 16 -
The movement and accumulation of radionuclides in the environ
ment may be studied in two different ways. Radionuclides may
be experimentally introduced in known amounts into a limited
and well defined environment, or use may be made of the con
tamination already present in the natural environment. Each
method has its merits and limitations. The experimental method
may shed light on single mechanisms acting in the environment, i
but it is not able to describe the whole complex of interactions
and combinations that makes up natural conditions. The second
method, the environmental approach, yields information on the
variation of radioactive contamination in the environment
studied, but it gives xittle information on the various pro
cesses responsible for the levels observed. Neither of the two
methods is thus ideal, but one complements the other. In the r
present study, emphasis has been laid upon the last method.
A radiobiological study of environmental samples may have
several aims. A primary purpose is often to ensure that certain
limits of contamination are not exceeded, in other words to
ensure the radiological protection of man. A further purpose
may be to set up models based on the data collected, and then
from these models to predict the levels resulting from known
releases of a contaminant to the environment and from the
predicted radionuclide levels to assess the doses to man from
the release. Finally, we may intend to make a study of various
processes in the environment, in which case radioactive sub
stances are used as tracers.
The present study intends to identify and define quantities
that characterize the radioecological properties of environ
mental samples, Radioecological sensitivity and variability are s
the two quantities used for this purpose.
i
The ra^ioecological sensitivity of a sample is the infinite
time integral of appropriate quantities of the sample from an
appropriate quantity of the radionuclide deposited (cf. C.3).
The radioecological sensitivity equals the steady state con
centration in the sample of the radionuclide considered from a
constant annual deposition rate of the radionuclide distributed
like global fallout throughout the year. Radioecological sensi-

tivity makes possible a comparison between various environments
of the vulnerability to a given radioactive contamination. Such
information is useful for the planning to be made in connection
with releases of radionuclides from nuclear installations.
The variability of radionuclide concentrations in an environmen
tal sample with respect to a given parameter is the partial coef
ficient of variation due to this parameter (cf. b.4), determined
by means of an analysis of variance. The variability gives in
direct information on the mechanisms of contamination for the
various samples. It is useful as an indication of the necessary
number of samples and t.eir frequency in environmental monitoring
programmes for nuclear facilities. Furthermore, the variability
may contribute to an assessment of the maximum concentrations
of a contaminant likely to occur in a given environment.
The present study began as a pre-operational study in 1956
around the Risø site. Later, when the research establishment
came into operation, the measurements became the operational
surveillance of the environmental radioactivity at Risø. In
co-operation with the Danish National Health Service, the
measurements were extended in 1959 to a general study of
radioactive contamination in Denmark. Three years later the
Faroe Islands and Greenland were also included in the studies.
Contamination at that time was the result of the atmospheric
nuclear tests carried out by the USSR, the USA and the UK.
Since 1957 the results of these radioactivity measurements have
been published in a series of Risø Reports (RRD59-76, RRF62-76,
RRG62-76), which contain the basic data for this study. The
data were compiled in the so-called STATDATA program (Li75),
which makes feasible the treatment cf the approx. 40,000 data.
The present dissertation is divided into two parts: the main
text, and four appendices. The main text comprises five chapters.
The first chapter deals with the abiotic environment: air, water
and soil, which are the primary recipients of radioactive pol
lution. Chapter two comprises the radioactive contamination of
the producers, with emphasis on cereal grain, which is a main

- 18 -
contributor to the radionuclide content cf the Danish diet. The
radioactive contamination c the consumers and their products,
especially milk, are treated in the third chapter. Chapter four
discusses the contamination of the human diet and tissues. The
conclusion to chapter four furthermore contains an estimate of
the population doses due to the contamination from nuclear
weapons testing. Chapter five is a general discussion of im
portant features of the four preceeding chapters.
Details of methods and procedures are contained in the ap
pendices. Appendix A summarizes sampling programmes, radio
chemical procedures, the various methods used for the measure
ments of the ionizing radiation emitted by the samples, and the
estimation of errors. Appendix B contains the statistical
procedures mentioned and tables with analysis of variance
(anova) and the estimates of the variability of the various
samples. The prediction models used for the estimation of the
radioecological sensitivity are shown in appendix C, while
appendix D contains various notes to the main text.
90 137 As Sr and Cs are the two fallout nuclides that contribute
most to the dose from fallout to present generations, this
study puts emphasis on these two nuclides. Not all sample items,
areas and periods have been covered with the same intensity and
thoroughness. Importance has been attached to those samples
assumed to be the most pertinent. The samples were obtained
from Denmark, the Faroe Islands and Greenland. Environmental
conditions (meteorology, soil characteristics) as well as the
habits of life show marked differences in these three areas;
and studies of the radioecological sensitivity and variability
of environmental samples from Denmark, the Faroe Islands and
Greenland may give an idea of the variation to be expected of
these quantities within the north Atlantic region.

- 19 -
1. AIR, MATER AND SOIL (the abiotic environment)
1.1. Introduction
The atmosphere is the primary recipient of airborne radioactive
contaminants, whether these pollutants originate from atmos
pheric nuclear test explosions or from airborne releases from
nuclear installations. The air is the medium in which the con
tamination is dissipated and transported.
Radioactive contamination of the atmosphere may result in doses
to living organisms from three exposure routes: by direct
radiation from th*» debris suspended in the air, from inhalation
(assimilation)r or indirectly from contamination of the food
chains.
UNSCEAR (Un77) applies the model:
Inhalation
I » Input •• Atmosphere •+ Earth's surface -» Diet -»• Tissue •*• Dose
(0) (1) (2) (3) (4) (5)
I J External irradiation
Nuclear debris may be deposited directly from the atmosphere
on the surface of the earth, as so-called dry fallout; but a
substantial amount of the radioactive contamination in the air
reaches the earth with precipitation. The term direct con
tamination of crops is used when the above-ground parts of
crops collect airborne debris, or adsorb radionuclides from
precipitation.
In the case of water-borne releases, e.g. waste-water fror.
nuclear installations, the sea or fresh-water systems are the
primary recipients of the contaminants. In analogy with air,
the doses from water-borne radioactive contaminants are
delivered either by external radiation from the activity in the

- 20 -
water, or from drinking (assimilation) of the water, or in
directly from contamination of aquatic or (in the case of
irrigation) terrestrial food chains, respectively.
Soil is normally not a primary recipient of unsealed radio
active contaminants, but underground nuclear explosions provide
an exception. Soil usually receives contamination from air or
from water. The transport of radioactive substances in the soil
is in general connect-"! to water transport. Under dry con
ditions especially, contaminated soil may be resuspended in
the air by the wind. The activity in the soil strongly influ
ences the indirect contamination of crops, i.e. contamination
due to root uptake. In the special case of resuspension there
may, however, be direct contamination from the soil.
1.2. Air
N««4 Vindt* Itbtl hen øve« Giatitt. da Me« tht mind itttlpi eve* tht gtati, it k*u4t* dtt éig som et r«*rf, Ctbct dtn tugjtea it likt mat it; and tehtn it itcttpi ken eve* Koxntt, d* bttgtx dtt 4c* en eve* tht •"<«, it g«.ea »utging tike tht ita. St, dtt t\ Vi*dtni P«*d«; That'i thi dånet of tht Mind. VINDEN F0RT4UER ON VALDEMAR DAAE 0G THE WIND TELLS THE STOKV Of HANS DØTRE VALDEMAR DAA AND HIS
DAUGHTERS
In atmospheric thermonuclear weapons testing (cf. D.I.2.), which
has been the main contributor to anthropogenic radioactive
contamination with long-lived radionuclides, nearly all the
debris ( 99%) is injected into the stratosphere. From here the
fallout descends mainly in the spring through the tropopause
into the troposphere with a mean residence time in temperate
latitudes of the order of 1 year. The residence time for
particulate radionuclides in the troposphere is about one month.
The debris, which has a particle size of the order of 0.1-ly
(Pei65) is removed from the troposphere by three processes:
rain-out caused by droplet formation within clouds, washout by
falling raindrops picking up radionuclides, and dry deposition
on land surfaces or plant cover (Un77).
The first tystematic studios of important fallout nuclides in
air were initiated when thermonuclear test-explosions began.
In the U.K., air samples have thus been collected since 1952 137
at Chilton (Pei60) and analyzed for Cs. A world-wide study

- 21 -
of radionuclides in surface air was started in 1957 by the
U.S. Naval Research Laboratory; since 1963 this study has been
continued by HASL (the Health and Safety Laboratory of the
U.S. Atomic Energy Commission) (Ha58-78).
Ir. Denmark, the National Defence Research Council (Am58)
initiated fallout studies of air and precipitation in the mid
fifties. Systematic investigations of radiostrontium in air
samples collected at Risø began in 1957 (RRD58-59) .
1.2.1. Strontium-90
The time variation of fallout nuclide concentrations in air is
mainly controlled by the number and intensity of atmospheric
nuclear test-explosions and by the meteorology of the earth's
atmosphere. The first factor is chiefly responsible for the
variation among years, while the second primarily influences
the seasonal variation.
6
5
UN
ITS
2 3 S ui2
1
n
-
ii
YEARS * * * M
L
2 . 0 -
1.5 -
1.0 -
0.5 -
l l . l i l l . . i i
ONTHS « * *
-
..
—
II ' 60 65 70 75 JFMAMJJAS0ND
90 ria. 1.2.1. The annual and aonthly variation of Sr in
around-level air collected at RIM 1957-1975. The bara
indicate the air concentrations relative to the grand Meant
5.31 fCl *"3(« 1 at the relative sealee).
90
An anova (analysis of variance) (table B.1.2.1.) of Sr in
ground level air collected at Risø showed highly significant
variations among years and among months. The maximum appeared
in 1963 after the 1962 test series (cf.D.1.2.) As shown in fig.

- 22 -
1.2.1, the maximum within the year occurred in May-June and the
minir.um in November-December; although the anova showed an
interaction between years and months, all years displayed the
so-called spring peak. The variability among years (table
B.l.2.3.) was 1.45 for the period 1957-1975, and among months
it was 0.56.
As the air samples in the present material were collected at
one location only, there is no direct means of studying a
possible local variation. The air sampling programmes conducted
by HASL (Ha58-78) and by Harwell (Ae58-74) may, however,
(cf.D.1.2.1.) be applied for an assessment of the local vari
ation in Denmark, which was estimated to be negligible.
The integrated air activity concentration for the entire period
of nuclear testing (up to 1975) was estimated from table
D.1.2.1. at 121 fCi 7USr m y . This quantity arose from 12.13 9ft
MCi Sr deposited in the northern hemisphere (Un77), (local 90
fallout at the test sites excluded). Hence, 1 MCi Sr deposited 90 -3 in the northern hemisphere corresponded to 10 fCi Sr m y
in ground-level air collected in Denmark. However, the infinite
time integral of the air activity may also be related to the 90
total amount of Sr dissipated as global fallout, i.e., 16 MCi. 90 °0 -3
In which case, 1 MCi Sr results in 7.6 fCi ' Srm y in
ground-level air in Denmark. As the majority of tests were
carried out in the northern hemisphere, the figure was con
sidered representative of injections in the northern hemisphere.
90 The half residence time of Sr has been earlier (X) estimated
at 10 months for the period 1963-1967; the inclusion of the
post-test periods 1959-1961 and 1971-1973 confirmed this
estimate.
1.2.2. Cesium-137
According to UNSCEAR (Un77), the ratio between 137Cs and 90Sr
in nuclear weapons debris is 1.6. This ratio is higher than
the ratio at formation, which according to HARLEY is 1.45
(Harl72). It is not clear whether this difference is due to
analytical errors or to fractionation phenomena (Sh75). If the

- 23 -
Cs/ Sr ratios in the Risø air samples are considered, the
anova shows no significant seasonal variation. The variation
between the years was significant; however, the time variation
observed for the Risø filters did not reflect a general global 137 90
variation of the Cs/ Sr ratio in air (cf.D.1.2.1.). Hence
it was, as earlier suggested (X), assumed that the Cs/ Sr
ratio in airborne debris at an annual base was nearly constant
in time and equal to 1.6.
137 The variability of the Cs air concentrations among years was
1.65 (1957-75) and among months 0.64, i.e. a little higher but
not 137, not significantly different from that of Sr. If Sr and
Cs are considered together during the period 1962-1975, when
precipitation data are available too, the variability among
years becomes 1.72 (table B.I.2.3.).
From table D.1.2.1. the integrated air activity for the entire
period of nuclear testing (up to 1975) was estimated at 222 fCi 137 -3
Cs m y. This estimate is comparable to that obtained from Chilton in the U.K. (Ae58-74) for the period 1954-1975 ( 240
137 -2 137 fCi Cs m y). The total production of Cs from nuclear weaDons testing was 1.6 • 16 MCi = 25.6 MCi, hence the transfer
137 -3 factor from input ground-level air was 8.7 fCi Cs m y per
137 MCi Cs injected. This is 15% higher than the corresponding
90 factor for Sr. As the half-lives of the two nuclides are
nearly the same, the infinite time integrals of the air con
centrations per MCi were expected to be nearly identical. The
difference was mainly due to the measured ratio of Cs/ Sr
in the air samples being higher than the adapted ratio of 1.6.
1.2.3. Strontium-89 90
Strontium-89 is detectable in fresh fallout together with Sr; 89
but, due to its relatively short half-life (50.5 days), Sr is
seldom measurable more than a year after its creation. As the 89 90
Sr/7 Sr ratio at formation is 185, according to UNSCEAR
(Un77), this ratio decays to approx. 1 in one year. Strontium-
89 is thus often difficult to determine because the measurement 90
takes place on the background of the Sr activity (A.2.I.). 89 90
According to HASL (Harl72), the Sr/7USr ratio at formation is

- 24 -
147, but Risø's measurements of the ratio based on precipi
tation and air samples have indicated that the UNSCEAR value
of 185 is the best fit to the observed data (RRD63).
Pig. 1.2.3. Strontium-89 concentration« In ground-level
air collected at Risø 1958-1971.
89 Figure 1.2-3. shows the Sr levels in monthly air samples
collected since 1958. The data were complete for the period 89
1961-1963? the Sr air debris in this period was created in the Of)
1961-1962 test series when approx. 9 MCi Sr (estimated from
UNSCEAk (Un77)) or 1665 MCi 89Sr were injected into the northern hemisphere. The integral air level during this period
89 —3 89 was 514.5 fCi Sr y m . Hence, 1 MCi Sr corresponded to 0.3
og „-1 fCi Sr m J y. During the periods 1958-1959 and 1967-1971, the
89 data were incompletet during these periods 1 MCi Sr "ielded 89
approx. 0.4 and 0.2 fCi Sr m " y, respectively. An integral og _3 OQ
air level of 0.3 fCi Sr m per MCi Sr was a reasonable
average, and for the entire period of nuclear testing the 89 —3
integral air level becomes: 16 • 185 »0.3 - 890 fCi Sr y m .

- 25 -
1.2.4. Manganese-54
During the intensive test series that took place in the USSK in
1961. Mn, (Gu64) which is a neutron activation product, was
produced in such quantities that it was measurable in ground-
level air samples collected during 1942-1966 (fig. 1.2.4.). The
integral level was 149 fCi ^Mn y m~3. This is in agreement
with the w a n level: 132 t'Ci ^Mn y m~3 found at the four
U.K. stations: Chilton, Milford Raven, Orfordness and Eskdalemuir
(51° - «5° :.) (A«58-74), but incompatible with the UNSCEAR
figure (Un77) of 1130 fCi M M n y m~3 based on KASL measurements
(Ha58~78) fro« Sterling *r. Virginia (39° H) . If the Sterling
air levels are compared with the rainwater concentrations from
Hestwood in New Jersey (41° H) from 1963-1965, (Ha58-78) it is
noticed that the washout ratio (cf. 1.3.2.) is 0.06 + 0.02
(1 SE), while the washout ratio usually found is an order of
magnitude larger (En71). It is therefore concluded tha* the
Sterling Mn air data used by OKSCEAR were probably an order
of magnitude too large.
1962 1966 1964 YEA*
Tim. 1.1.4. HOTfBMM-M «meaatrttiOM la fia—a i w l air collect«* at Rlaa 1H2-M.

- 26 -
54 The effective half-life of Mn in the atmosphere was approx.
5 months, which corresponds to the theoretical value con
sidering that the half residence time of long-lived debris was
10 months. The total production of Mn in the 1961-1962 test
series was estimated at 54 MCi (cf. table 1.2.5.).
1.2.5. Other radionuclides
Throughout the years a number of other radionuclides have been
studied in ground-level air at Risø.
Cerium-144 has been measured regularly in most years. From the 144 test series in 1961-1962, approx. 430 MCi Ce yielded an
integral air level of 1278 fCi 44Ce y m~3, or 1 MCi 144Ce 144 -3
corresponding to 3.0 fCi Ce y m . From this ratio the total 144
integral air level at Risø from 762 MCi Ce (cf. table 1.2.5.) 144 -3 was estimated at 2.3 pCi Ce y m . This estimate is
o 144 -3 comparable to those for Moonsonee (51 N) of 2.5 pCi Ce y m
o 144 -3 (Ha58-78) and for Chilton (D1 N) of 2.0 pCi Ce y m
144 (Ae58-74). The effective half-life of Ce in air samples
collected in the years 1963-1966 was approx. 5 months, i.e.
equal to the observed effective half-life of Mn in air.
Europium-155 was measured in air filters collected from the
middle of 1961 to the end of 1966 (III). The integral air level
for this period was 26 fCi Eu y m . The production of Sr
available as global fallout was approx. 9 MCi in the 1961-1962 *) ice go
test series , and a? the ratio Eu/ Sr at formation was estimated at 0.66 (III) , the globally available Eu became
155 1 H -3 6 MCij 1 MCi Eia thus corresponded to 4.4 fCi Eu y m .
95 During 1971-1974 Zr was determined in air samples. The air
activity in this period resulted from atmospheric test series 90
in 1970-1973, and was equivalent to 0.4 MCi Sr (table
D. 1.2.1.) or 90 MCi 95Zr (table 1.2.5.). The observed integral 95 -3 91
air level was 40 fCi Zr m y, hence i MCi "Zr injected into 95 -3
the northern hemisphere resulted in 0.44 fCi Zr m y .
' This ^uSr yield was lower than the previous estimate (III)
which was based on an early yield estimate (Fe63) of these test
series
- 27 -
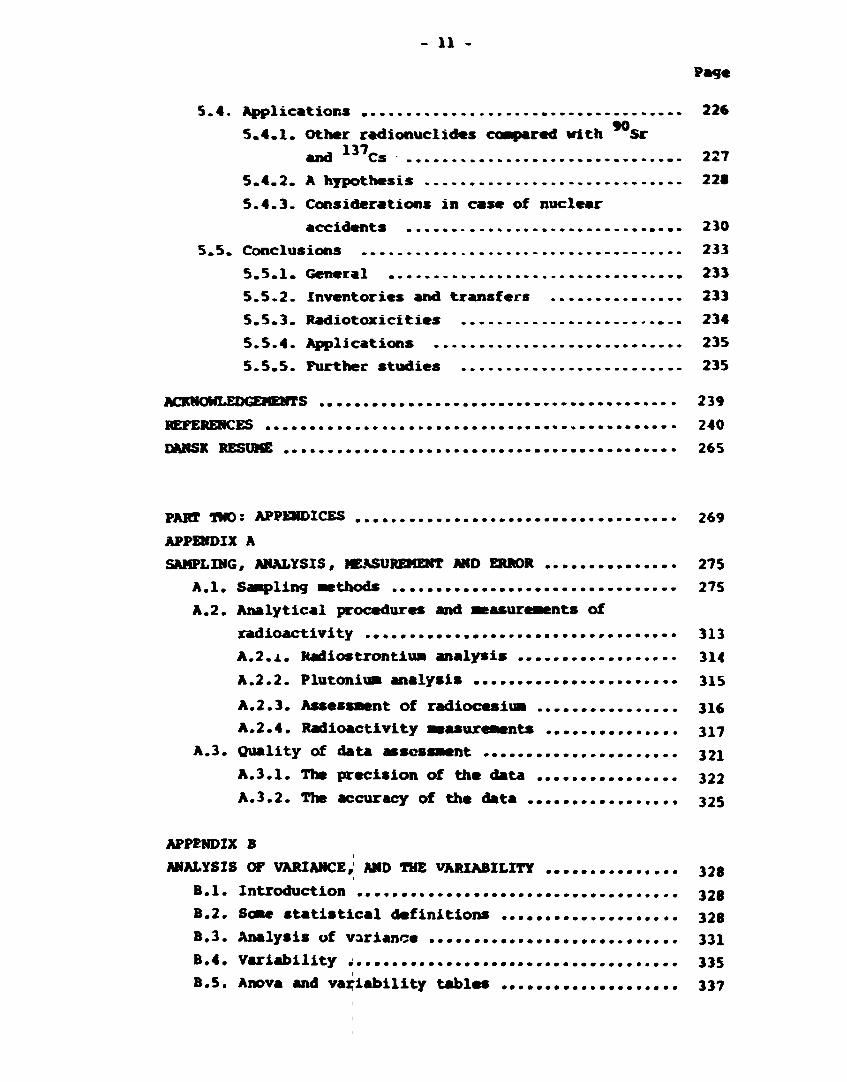
If the transfer factors: T (fCi m y per MCi) are plotted
against the effective half-ljves in the atmosphere: t (yr) of
the various nuclides in a log-log coordinate system as shown
in fig. 1.2.5., the values follow a straight line, i.e., a
power curve:
T = 11.6 • t1"7. (Eq.1.2.5.)
The correlation between observed and calculated values
(r = 0.9979) is highly significant.
o
o
101
10°
10"1
1
-
1 1
1 1
-
-
- _ J
1 1 t 1
1 . 1 1 . 1
" I
95Zr /
A9Sr
i l l i
i r j i i i i i
137°v AQSr
'«Ct / ' " E u 0 /
i , i i i i i 1
-
-
-
-
i i
i i
-
-
10'1
YEARS 10°
Fig. 1.2.5. The Integral air concentration* (T) from 1 MCi
Injectad Into the northern hemisphere a* a function of the
effective half-lives (t) in the atmosphere« T • 11.6 • t1'
T equals the transfer coefficient Pfll fro*) input to the
atmosphere.
The above equation may be used for the calculation of the
infinite time integrals of fallout radionuclides with effective
atmospheric half-lives within the range of those included in
the equation, i.e., between 0.1 and 0.9 years. Ruthenium 106
is such a radionuclide; the infinite time-integrated level was

- 28 -
in this case estimated at 1 pCi 106Ru m y. UNSCEAR (Un77)
assumes a value of 0.50 for the ratio of the time integrals of
the activity concentrations in air of Ru and Ce, hence
the expected value was 0.5 • 2.3 = 1.15 pCi Ru m~ y, which
agrees reasonably with the estimate.
Table 1.2.5. summarizes the time-integrated air concentrations
for various fallout nuclides at Risø and the transfer factors
from injections in the northern hemisphere. Short-lived
radionuclides such as I, Ba, Ce and Ru do not become
well mixed during periods comparable to the mean residence of
an aerosol in the troposphere (Un77) and equation 1.2.5. does
not apply in such cases. The transfer factors estimated from
the equation for Ru and Ce were thus approx. twice as
high as those actually found in the period 1971-1974.
Table 1.2.5. Estlstates of tlae-lntearated air concentrations, yields and transfer factors of various
radionuclides in weapons debris collected In Deiaark
nuclide
M « n M f r
»°lr **lr I M « u ,0i«» 1«,„ 131,
" 7 C .
1 4 0 « a
m C .
>"c. 1Mm " » • »
Radioactive
half-life
312
SO.J
2«
44
J»
1
2.77
1.04
30
12.1
32. S
219
1.7
2.4«
d
d
y
d
d
y
y
d
y
d
d
d
y
•10«y •»
Effective
half-life
In the at
mosphere
In year
0.43
0.12
0.»3
0.14
0.0«
0.44
0.4«
0.021
0.13
0.034
o.oti 0.41
0.S7
0.04
«ucllde/",Sr
at formation
In thenao-
nuclear
tes^s
. K S (Un 77)
1
22S (Hail 72)
3*0 (Marl 72)
H . J IMarl 72)
0.»5(Karl 72)
1040 (Marl 72)
1.4 (On 77)
1170 (Hail 72)
400 INarl 72)
47.* (Marl 72)
0.44(111)
0.020 (Un 77)
Integral
air con
centration
fCl a" 3 y
until 1*75
14* «'
»•0
121
1400
700
1000
71
222
440
2300
24 «>
2.07
Total
yield c )
MCI until
1*75
»4 •'»»
2**0
1«
3400
«0«0
30*
1?.*
14440
25.4
11720
4400
7*2
t »'
0.32
Tra-.«- ..
factor
fCl «" 3
y per MCI
2.« b>
0.)
7.*
0.44
0.11
3.1 W
5.7 "'
0.7
0.0«*
3.0
4.4
».0
Orv. .rvatio;
period
1942-19««
1961-1963
1»5S-1»75
Wl-1974
1971-1974
1962-1975
1*71-1*7«
19(1-1*4*
1941-1***
•' IH2-1HI b)
e)
•) 21*.
calculated value* from Iq. 1.2.5.
available as global fallout.
ru.
During the 1961-1962 test series an estimated 630 Ci (Da66)
of 32Si was created. The transfer factor of a long-lived
fallout nuclide was 9 fCi m~3 y per MCi, hence the expected
*
* The Si yield was previously estimated at 700Ci, (Da66), 90
however, this estimate was based on an overestimated Sr yield
(cf.D.l.2.)
- 29 -
32 -3 time-integrated air concentration was 5.7 aCi Si m y.
Measurements performed on May-June samples collected in 32 -3
1962-1965 corresponded to 4.7 aCi Si m y (the annual concentrations were estimated from fig. 1.2.1.); considering that
32 some bomb-produced Si was still left in the atmosphere by June 1965, the two estimates are compatible.
1.3. Precipitation
l)g Vindtn ky&stdt T*»et, oq Vuggen giad And the wind kined the tree, and the de\a uiept teati Taoiet ovtt det, mtn dtt io\6tod Cian- oven, it, but this meant nothing to the <*t ttee. t**Ct ikkt. T « FIR TREE
GRANTR4ET
Normally, precipitation plays a predominant role in the
transfer of radioactive debris from the atmosphere to the
surface of the earth. Showers of rain can, however, both
contaminate and decontaminate, by washing deposited debris off
the surface of vegetation. In Greenland and the Faroes pre
cipitation is often collected directly for drinking. This is
usually not the case in Denmark with the exception of a few
small islands.
Systematic measurements of -uSr were initiated in 1954 at
Milford Haven in the U.K. (Cr60) and at the Health and Safety
Laboratory (HASL) in New York (Ha58-78). Country-wide Danish
studies at 11 locations began in 1962 (RRD62), and in the same
year regular measurements were started of radiostrontium in
precipitation samples collected in the Faroes at 2 stations
(RRF62) and in Greenland at 5 stations (RRG62).
1.3.1. Variation w\th time and location
When radionuclide measurements are made of precipitation, the
activity concentrations in the rain (pCi 1~ ) as well as in
the deposited activity (mCi km ) are usually determined; -2 -1 the fallout rate may be given as mCi km y
The variability among years (table B.l.3.4.) of Sr in Danish
precipitation during 1962-1974 was 1.73 (fallout rate) and
1.86 (concentration). This is not significantly different

- 30 -
from the va r i ab i l i t i e s of the corresponding a i r concentrations (table E . I . 2 . 3 . ) . /•jnong the months the va r iab i l i ty in rain also corresponded to that observed in a i r (CVD n t h ^ 0 .6) . In Faroese and Greenlandic precipi ta t ion the va r i ab i l i t y among years was ident ical to tha t in Danish ra in . Among months, however, the Faroese rain showed a lesser va r i ab i l i ty than the Danish, i . e . the spring peak was less pronounced in the Faroes.
I 3
> s2
YEARS • • *
1.5
1.0
0.5
l l l t l l l . l
MONTHS » * *
1.5
1.0
0.5
LOCATIONS * • *
65 70 T
Jon Feb
Hay Sep Jun Oct
Tyl Stu Jyrt Tys Abe Ødu Ask Bla Vir Åki
Hor July Nov Apr Aug Dec
90
Fig. 1.3.1. The variation of Sr Fallout rate with year,
month and location assessed from precipitation samples
collected at the Danish state experimental farms (fig.
A.1.1.3.1.) 1962-1974. The bars indicate the Fallout rates — 2 -1
relative to the grand mean: 0.SS mCi km (2 months) (»1
at the relative scales).
90
The Sr levels tn rain decreased from the spring peak (in
May-June) to the winter minimum (in November-December) with a
half-life of approx. 60 days. The slope fitted the seasonal 90
trend for Sr in air from June to December, (fig. 1.2.1.).
The annual decay during the periods 1963-1967 and 1971-1973
corresponded to effective half-lives of 11 and 8 months,
respectively. This is compatible with the 10-month half-life 90 137 found for the annual Sr and Cs mean levels in air.

- 31 -
90 An anova (table B.l.3.3.) of the annual Sr deposits in
Denmark, the Faroes and Greenland showed no interaction between 90 ~2
years and locations. The yearly Sr deposition in mCi km in
the Faroes and Greenland may thus be estimated from the Danish
data by multiplying by the mean ratios between the Faroese (or
Greenlandic) and the Danish fallout levels. The following
ratios were determined from data collected during the period
1962-1974:
Faroes (mean of Thorshavn and Klaksvik)/D«j-jnark = 2.06
West Greenland (Godthåb)/Denmark = 0.75
East Greenland (Kap Tobin)/Denmark = 0.47
These ratios are used throughout the text where precipitation
data are missing.
Within years, Danish data should not be used for the estimation
of Faroese and Greenlandic fallout, as anovas showed significant
interactions between months and locations.
The local variation among the Danish state experimental farms
was highly significant for fallout rate (table B.I.3.2.), but 90 -1 in general not significant for pCi Sr 1 (Table B.l.3.1.).
The local variability of fallout rate was 0.16, which corre
sponded to that of mm precipitation among the farms. We may 90
expect the Sr deposition to be proport
precipitation in meters (Lu71, Ke59-77):
1974 1974
I mCi 90Sr km"2 =5.3+4.9 I
1962 1962
90 expect the Sr deposition to be proportional to the amount of
I mCi 90Sr km"2 =5.3+4.9 I m Eq. 1.3.1,
As the regression line intercepts the ordinate axis at 5.3 90 -2
mCi . Sr km , this figure is an estimate of the fallout for
zero precipitation. This amount of so-called "dry fallout"
corresponded to 11% of the total mean fallout in the period.
The actual amount of dry fallout was not necessarily 11% because
the rain collectors may have shown an efficiency with respect
to collecting dry fallout that differed from that of the
surface of the earth (Me56, Cham60). Studies of accumulated

- 32 -
90 Sr in Danish soil havei however, shown (cf.1.6.1.) that the
90 amounts of Sr found in the soil throughout the years have corresponded to the levels to be expected from the pre
cipitation collectors. It is therefore concluded that, with
respect to the estimation of total Sr fallout, the rain-
bottles seem to have been adequate. In 1957-1960 HARDY et al.
(Ha62) found that, for an annual mean precipitation correspond-on
ing to that in Denmark, approx. 1/3 of the total Sr fallout
up until 1960 had been received as dry deposit. KARDY concluded
that the specific activity of the precipitation was independent
of the amounts of precipitation when the contribution from
dry deposit was taken into account. In Denmark the contribution
from dry deposit was too low to produce a significant local 90
variation of the Sr concent
various years of observation.
90 variation of the Sr concentrations in rain water within the
90 Using Eq.1.3.1. for an estimate of the Sr deposition in the
Faroes and Greenland (Du7 5, Da63-76), the mean ratio between
observed and estimated values became 0.73+0.11 (1 SD), which
is significantly less thin unity. As air concentrations
decrease with increasing latitude (Ha58-78), this was also to
be expected for the concentrations in precipitation; we may . 90 thus expect a lower Sr deposition in Greenland and the
Faroes than in Denmark for the same amount of precipitation.
Dry deposition is of special importance in connection with
direct contamination of vegetation. In lichen (D.3.4.4.) it was
observed that the concentrations of radionuclides were more or
less independent of variations in precipitation, but primarily
related to the rain-water concentrations. During rainfall
nuclear debris from the atmosphere is carried down to the
vegetation cover, but at the same time the rain washes off the
deposit on the vegetation. The two effects may offset each
other, so that dry deposit only determines the contamination of
plants (Wi67).
If it, according to Eq.1.3.1./ was assumed that the dry depositon
from 1962-1974 was 5.i mCi ruSr km , this corresponded to a —5 90 —2 -1
mean rate of dry deposition of 1.3 • 10 pCi Sr m sec. —3 90 —2
The mean air activity was 6.4 • 10 pCi Sr m during

- 33 -
1962-1974. Thus the d e p o s i t i o n v e l o c i t y (Cham60) of f a l l o u t 90
Sr during 1962-1974 became:
V (m s e c ' 1 ) » * ' 3 * 1 0 x m s e c " 1 = 2 • 10~3 m s e c - 1 . 9 6.4 • 10"3
SMALL (Sxn60) found for gross beta fallout cctivity collected in
vessels during 1956-1959 deposition velocities ranging from
(2-34) • 10~3 m sec"1. PEIRSON et al. (Pei65) found during
1960-1964 a deposition velocity for global fallout in the range
(1-3) -10 m sec . In case of tropospheric fallout V was
nearly an order of magnitude higher. In his studies of dry 137
deposition of fallout Cs on alfalfa, WILSON (Wi69) reported -3 -1
a deposition velocity of 6 • 10 m sec *, but for radon
daughters the median deposition velocity on alfalfa was only
1 • 10 m sec ; this -'alue was close to those reported by
CHAMBERLAIN (Cham60) for submicron particles in wind-tunnel -3 -1
experiments. The present value of 2 • 10 m sec for fallout gn "Sr was compatible with the above mentioned findings.
CHAMBERLAIN (Cham60) found in experiments that deposition
velocity increased rapidly with particle size in the micron
diameter range. The results of Risø's studies of the variation
of specific radiostrontium activity with altitude in the 120 m
high meteorological tower (I, II) were compatible with this
observation. It appeared that the specific activity of pre-
cipitation samples increased with sampling height. The pheno
menon was ascribed to increasing amounts of dry deposition in
the rain-bottles located at the top of the tower, which was
partly a result of the higher wind speeds and consequently
higher deposition velocity here than at the bottom. It was 89 90
furthermore demonstrated that the Sr/ Sr ratio increased 89
with altitude. This is intelligible if the Sr in global
nuclear debris was generally attached to larger particles than 90 89
was Sr, because the Sr was deposited with relatively fresh 90
debris that settled first, while Sr also occurred in old debris on fine particles.
1.3.2. Relations between concentrations in air and precipitation
The observed washout or scavenging ratio, W . is the ratio

- 34 -
between the concentrations of a given nuclide in precipitation
md in air. The units us
(En71)^ we shall apply:
and in air. The units used for W differ in the literature o
w = PC* 1~* w*tert Eo.1.3.2, ° fCim air
During the period 1960-1972 corresponding samples of air and
precipitation were collected monthly at Risø and analyzed for 90 89 137
Sr; Sr was analyzed in 1961-1963 and Cs in 1960-1961 and
1965-1966. The overall mean of the 285 monthly scavenging ratios
was estimated by means of VAR-3 (cf.B.3.) at 0.99, and the total
coefficient of variation (cf.B.4.) was 0.51. The anova showed
that the variation among nuclides was not significant. The
variations among months as well as among years were, however,
significant. The seasonal variation thus showed a maximum in
January-February and a minimum in August-October. Several
reasons can be suggested for such a difference. Firstly, during
winter the relative amount of dry fallout, which was included
in the precipitation samples, was higher than during the summer,
due to the lower amounts of precipitation. Secondly, snow may
be more efficient than rain as a scavenger of activity from the
air. Thirdly, the absolute humidity of the air was lowest
during the winter and, according to ENGELMANN (En71), the
washout ratio should vary inversely with the absolute humidity.
The annual variation of the washout ratios showed minima at
the beginning and at the end of the period. There was no
obvious explanation for this observation.
137 A comparison with the UK data on Cs collected since 1954 at
Chilton (Ae58-74) showed that the Danish annual mean washout
ratio was approx. 1.5 times higher than the corresponding
washout ratio observed in the UK. The difference between the
two ratios was highly significant. Monthly scavenging ratios 90
for Sr determined from September 1969 to July 1970 in Arkansas
varied between 0.55 and 1.45 with a mean value of 0.80 (No73).
Washout ratios from six locations in the USA (En71) collected
in 1962-1964 showed local mean values varying from 0.26 to
1.32. The Risø mean for the same period was 1.14. It thus seems
that local variations in W are to be expected. There are,

- 35 -
however, no clear explanations of such variations, although
absolute humidity and precipitation rate, as proposed by
ENGELMANN (En71), seem to have some influence.
90 The total deposition of Sr in Denmark was estimated from the
precipitation data obtained at the state experimental farms.
As the data were incomplete before 1962, the HASL data for New
York (Ha58-78) were applied considering that the mean ratio 90 between Sr fallout in Denmark and New York was 0.7 in the
90 period 1962-1974 (D.I.3.2.). The total amount of Sr deposited
since nuclear tests were started and up until 197 4 was 73 mCi -2
km for Denmark (81.3 for Jutland and 64.8 for the Islands).
These estimates may be compared with the UNSCEAR estimate of
79 mCi 90Sr km"2 for the 50-60°N latitude band (Un77). We may, 90 however, also calculate the total Sr deposited in Denmark
from the Danish air data (1.2.1.). According to these data the 90 -3 integral air level was 121 fCi Sr m y; as the observed
washout ratio was 0.99, the time-integrated rain concentration 90 —1 became 120 pCi Sr 1 y. The mean precipitation at the state
experimental farms was 628 mm y~ (D.I.3.3.), thus the total 90 -2 deposition was 75 mCi Sr km , which is close to the above
estimate.
1.4. Fresh water
Va hun igjen van. klMdt og havde ilet- When »he uiat die i i id again and had plaited tet *it langt Haa\, gik hun til dt hex long hai\, the went to the bubbling tpMng, ipiudttnde Vild, dnak aj tin hule diank i*om he* cupped handl, and then Haand og vandKtdt tangent ind i Skov- wandeted 4u\the\ on into the wood without en, uden at vide hvonhen. xeallu knowing whete the wa& going.
Vt VUVE SVAHtK T«£ WUP SWANS
Fresh-water systems are either lenitic, e.g. lakes and reser
voirs, or lotic, e.g. streams and ground water (ground water
may be considered as a subterranean stream). Radioactive con
tamination of fresh waters originates partly directly from the
atmosphere, mostly via precipitation, partly indirectly from
the soil, i.e., from older deposits that have been washed out.
Nuclear installations may release radionuclides directly to
fresh-water recipients. The transfer of radiocontaminants from
fresh water to humans may either be directly through drinking
water, or indirectly through animals and vegetation whose
habitat is fresh water. Finally, fresh water is used for

- 36 -
irrigation and for drinking water for animals and may as such
contaminate terrestrial food chains.
Systematic surveys of fresh vater samples have been concentrated 90 on Sr assays of drinking water. HASL (Ha58-78) started such
90 a study in 1954 on New York City tap water. The Sr levels in
a countrywide collection of samples of Danish ground water have
been followed since 1961 by Risø (RRD61). Drinking water samples
have been collected regularly in the Faroes and Greenland since 90
1962 and analyzed for Sr (RRF62, RRG62).
137 The Cs levels in fresh water are generally lower than the 90 137 Sr concentrations, because Cs is retained to a larger
90 degree than Sr in soil minerals, (cf.1.6.)
1.4.1. Danish ground water
Radionuclides in ground water may reach man with the drinking
water, which in Denmark is generally ground water. Irrigation
of crops may be another way of exposure. Ground water passes
through the soil layers, which act as a filter and a kind of
ion exchange column. Clay minerals, which are abundant in
Danish soils, are particularly efficient ion exchange media
for several radionuclides contained in the water seeping through
the soil. Eight of the nine borings used since 1961 for 90
ground-water samples have in fact contained very low Sr concentrations. The anova showed a highly significant variation among years (fig.1.4.1.1.). Although the maximum coincided with the maximum fallout rate in 1963, the variability among years
90 of the Sr coiirentrations in ground water (table B.1.4.1.) was
significantly lower (CV .. = 0.57) than the variability in J p year
rain water (CV year = 1.8). This suggested that although some 90 Sr may be rapidly transferred to the ground water, the con-
90 centration-; "iso depend on the accumulated Sr in the soil, which during the period of observation displayed a lower variability among years than the fallout rate (cf.1.6.).
The variation among the & localities was also highly significant
(fig.1.4.1.1.). The local variability was 0.49, i.e. signifi
cantly higher than that observed for precipitation, because the

- 37 -
ground-water activity depended upon the ability of the
surrounding soil layers to retain the radionuclides contained
in the percolating water, rather than on local variations in
the rain-water concentrations.
2 -z
UJ
> < 11-
YEARS * * *
II
_ LOCATIONS * * *
65 70 75 FfirHvi FreRemRovKOI HosRan
90 Fig. 1.4.1.1. The anual and local variation of Sr in
ground water collected in 1961-1976 from 8 borings in
Denmark (cf. fig. A.1.1.4.1.). The bars indicate the
concentrations relative to the grand mean: 14.7 fci 1
<= 1 at the relative scale).
90 The Sr concentrations in Danish ground water may be related
to the fallout rate and the accumulated fallout. The prediction
models (table C.1.4.1.) show that the.radioecological 90 sensitivity of ground water to Sr contamination from fallout
-3 90 -1 was, as expected, extremely low: 7.4 • 10 pCi Sr 1 y 90 —2 90
per mCi Sr km . The infinite time integral of Sr in Danish ground water from nuclear weapons testing became 73 • 7.4
= 0.54 pCi 90Sr l"1 y (cf. also D.l.4.1.).
10 -3
Right from the start of the ground-water sampling programme
one of the nine locations, Feldbak, has steadily shown relatively
high Sr levels. Furthermore, tlv levels have increased
throughout the years, while the other eight locations have on
the whole shown decreasing concentrations since 1963. Figure
1.4.1.2. shows that the levels until 1974 followed an expo
nential increase. Assuming the maximum concentration in the
Feldbak ground water was reached in 1974, and from then that it 90
followb the radioactive decay of Sr, the maximum infinite 90 -1
time integral became 73 pCi Sr 1 y. This arose from a total

- 38 -
90, -2 deposit in Jutland of 81.3 mCi Sr km . Hence the maximum
radioecological sensitivity of Feldbak ground water became:
0.90 pCi Sr 1 y per mCi Sr km , or 2 orders of magnitude
higher than that of the other ground-water samples.
T 10°
8
10 r i
«r
T — i — i — i — i i r r i i i—r
O J L J » i i « J I L_l L
60 66 70 75 2 4 6 6 10 12 U K t years
PlQ. 1.4.1.2. StrontiuK-90 in ground water collected at
Feldbak (cf. fig. A.1.1.4.1.) in 1961-1*74. The concen
trations increased exponentially:
pCi,0Sr l"1 - 0.00« « 0' 3 2 e.
The Infinite time integral (cf. the text) was: 17
0.0093 e 'o
0.32 ln2 'dt • fl.CS e" Ti" 'dt » 73 pCi ,0Sr I - 1 - y.
The higher levels and the deviating time pattern found at
Feldbak resulted from very poor filtering strata at this lo
cation. The filtering material consisted of sand which, com
pared to clay, only has a rather low cation exchange capacity. Oft
The Sr layer deposited from precipitation therefore moved
relatively rapidly through the filtering layers at Feldbak, and
this explains the increasing levels.

- 3* -
1.4.2. Danish streams
The radionuclide content in stream water originates fro« direct
deposition in streams, from activity contained in springs
(ground water) and from the washing out of activity retained by
soils and crops. In Denmark streams may be used for irrigation,
and they are the habitat of fresh-water fish such ar trout, but
the consumption of fresh-water fish by the general Danish
population is very modest.
90 An anova of the 5r levels in stream water did not demonstrate
any significant time variation during the period of systematic
sampling from 1971-1975. However, 3 stream samples collected 90 —1 in Zealand in 1964 showed c mean of 2.0 + 0.6 pCi Sr 1 , as
90 -1 compared with 0.4 pCi Sr 1 from the same area of the courtLry
in 1970-1973.
90 The Sr concentrations in stream water were thus undoubtedly
related to the fallout rate. The anova also showed a significant
local variation (fig.1.4.2.). The local variability was C.43,
i.e., nearly the same as found for ground water; it was thus
again soil characteristics and other local environmental
factors rather than the possible variations in rain-water con
centrations that determined the local variability.
In December 1970 we undertook a study of the possible variation 90 between the Sr levels near stream sources and outfalls
(RRD70). Six streams were measured and no systematic difference
between the two positions was observed. Even the two largest
streams in the study (Gudenå and Suså) showed no significant 90
difference between the source arvi the outfall. A« the Sr concentrations of the stream water were 10-100 times higher than
the ground wate" levels, it was evident that the main part of 90 the Sr in the streams came from run-off from the uppermost
soil layers and from direct precipitation. In Denmark approx. 3 -1
12 km y are run-off with lotic waters to the sea, correspond'
ing to approx.45% of the annual precipitation (the remainder 90
evaporates) (Je69). If the mean Sr content in stream water
for 1971-1975 (0.35 pCi ^Sr l"1) was assumed representative of 90
the Sr concentration in run-off from the entire country, the 90
mean annual amount of Sr in the run-off during 1971-1975 is
estimated at: 0.35 • 10"12. 12 • 10 2 « 4.2 Ci. As the accumu-
- 40 -
90, lated Sr in Danish soil in 1971-1975 (RRD59-76) amounted to
55 • 10 • 43,069 = 2369 Ci, the annual removal of Sr
becomes 1.8& of the accumulated fallout. During the periods
with high fallout rates, when a substantial part of the fallout
was present in the upper few centimetres of the soil, the
run-off may have been somewhat higher than when the activity
had been displaced down to a median depth of, say, 10 cm - a
situation close to that in 1971-1975. (cf.Fig.l.6.2.) U
NIT
S R
ELA
TIV
E
0
YEARS 2
^ 1 971
> h 4 S h 1973
1 S 1975
1
LOCATIONS * # *
—
I 1
-
—
BooGudSkj Rib Ode Sus Hol LOPS
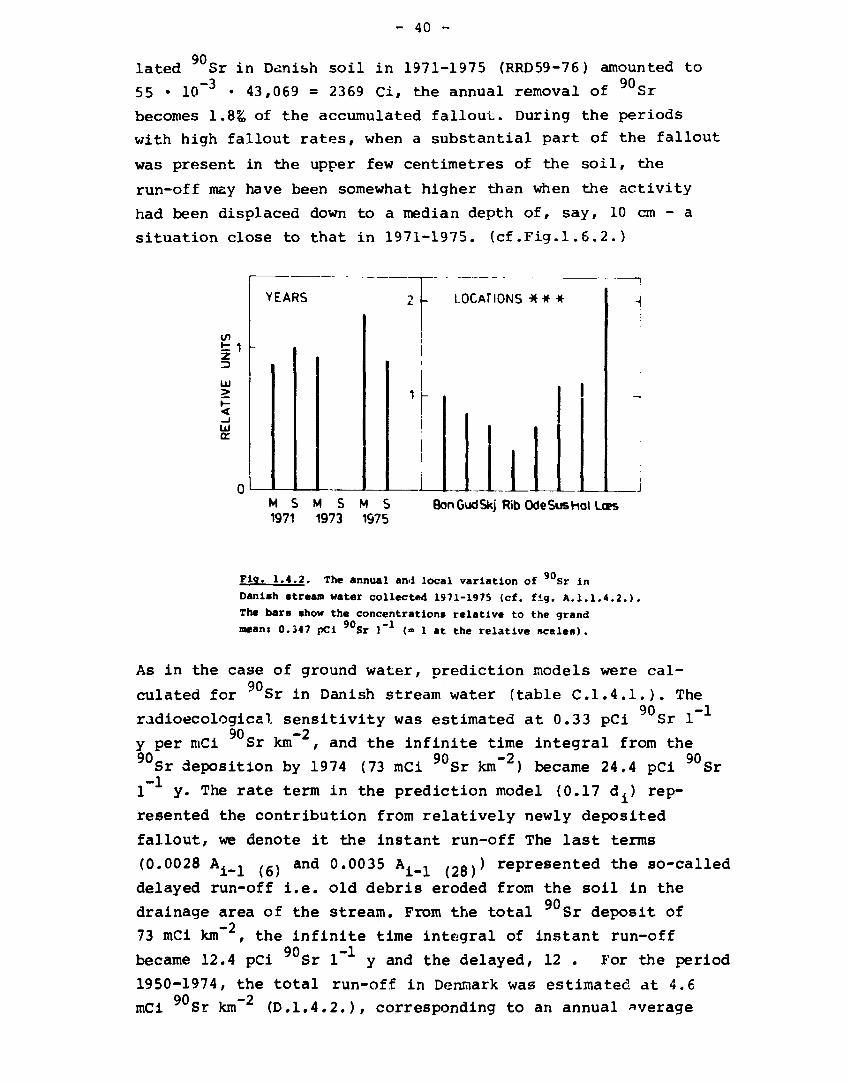
Fig. 1.4.2. The annual an.i local variation of 90Sr in
Danish stream water collected 1971-1975 (cf. fig. A.1.1.4.2.).
The bars show the concentrations relative to the grand 90 —1
mean: 0.347 pCl '"Sr ] (» 1 at the relative scales).
As in the case of ground water, prediction models were cal-90
culated for Sr in Danish stream water (table C.l.4.1.). The 90 -1
radioecologica! sensitivity was estimated at 0.33 pCi Sr 1 90 -2
y per mCi Sr km , and the infinite time integral from the 90Sr deposition by 1974 (73 mCi 90Sr km"2) became 24.4 pCi 90Sr
1~ y. The rate term in the prediction model (0.17 d.) rep
resented the contribution from relatively newly deposited
fallout, we denote it the instant run-off The last terms
(0.0028 A,, ,g. and 0.0035 A. , /2g\) represented the so-called
delayed run-off i.e. old debris eroded from the soil in the 90 drainage area of the stream. From the total Sr deposit of
73 mCi km , the infinite time integral of instant run-off 90 -1
became 12.4 pCi Sr 1 y and the delayed, 12 . For the period
1950-1974, the total run-off in Denmark was estimated at 4.6 90 -2
mCi Sr km (D.I.4.2.), corresponding to an annual average

- 41 -
removal of approx.5£, which is higher than the above estimate
of 1.8&, but, as mentioned above, an annual run-off of 1.8& 90 was an underestimate for freshly deposited Sr. In a study of
US streams made in 1959-1966, MENZEL (Me74) found an annual 90 erosion of accumulated Sr varying between 1.7 and 1.5%,, and
YAMAGATA et al. found 3.1£ for 9°Sr and 0.6% for 137Cs (Ya6 3)
in 1962 in Japan.
1.4.3. Danish lakes 2
The total area comprised by lakes in Denmark is approx.550 km
(La69), or 1.3% of the total area. Lake water is to a limited
extent used for drinking water, e.g., in the Copenhagen region.
The lakes are the habitat of fresh-water fish but, as mentioned
above, there is little consumption of these fish in Denmark.
The lake water was collected together with the stream water in
1971, 1973 and 1975. The anova showed no significant variation 90 with time of the Sr concentrations. A sample collected in
90 -1 June 1963 from Arresø contained 4.8 pCi Sr 1 , or 3.6 times
more than the corresponding mean level in 1971-1975. As the 90„
Sr concentrations in rainwater decreased by a factor of
approx.20 from 1963 to 1971-1975, this suggests that the
activity in the lake water not only depended upon the fallout
rate but also on the accumulated 90Sr.
90 The local variation among the Sr concentrations in lakes was
highly significant. The variability was 0.83, i.e., higher than
that observed for lotic waters. The explanation lies in the
fact that some lakes have little exchange of water (e.g. Nors
Sø), while others (e.g. Flyndersø) may be nearly lotic because
streams flow through them. Such lakes may in the present 90
context be regarded as a "widened stream", and the Sr concentrations in such "lotic" lakes may be as low as in stream
water, whereas the lakes with little exchange of water display 90 relatively high Sr concentrations (fig.1.4.3.).
The prediction model (table C.1.4.1. No 6) was based on
relatively few observations, but the correlation coefficient
between observed and calculated values was highly significant. 90 -1
The radioecological sensitivity was 1.1 pCi Sr 1 y per

- 42 -
M S 1971
M S 1973
M S 1975
Nor MosFly Hos Ar s Ar r SønGrA
90 Flq. 1.4.3. The annual and local variations of Sr in
Danish lake water (cf. fig. A.1.1.4.2.) collected in 1971-
1975 in March and September. The bars show the concentrations
relative to the grand mean 1.35 pCi 1~ (= 1 at the rela
tive scales).
90 -2
mCi Sr km , i.e., 3 times higher than for streams. Using a
similar prediction model, CARLSSON (Ca76) found a transfer
factor for 137Cs of 0.7 3 pCi 137Cs l-1 y per mCi 137Cs km"2
for a Swedish dysoligotrophic lake. The agreement between the 90 137 two figures may be fortuitous as Sr and Cs do not behave
in the same way in freshwater systems (cf.l 6.3.), and because
the Danish lakes were not dysolrgotrophic but rather eutrophic
(La69).
1,4.4. Danish drinking water (tap water)
The main source of tap water in Denmark is ground water.
Surface water, however, is used in increasing amounts, es-
specially in the Copenhagen region.
90 An anova of the Sr data on tap water collected from the whole
country since 1965 showed a significant time variation. The
levels in 1965 and 1971 were thus higher than the levels in
1970 and 1973. However, in contrast to ground water, it was
not possible to observe a general decreasing trend in the
levels.

- 43 -
The variation between locations v/as highly significant. Bornholm,
East Jutland and Lolland-Falster showed 4-5 times higher levels
than the rest of the country. The local variahfity was 0.79
(table B.l.4.1.); the high variability »as due to the con
tribution of surface water to the potable water at certain
locations. Tap water from Copenhagen, which was not included 90 in the anova, contained significantly more Sr than the
drinking water from the rest of the country.
Reliable prediction models for tap water were difficult to set
up because the data from year to year showed great variations
that seemed uncorrelated to fallout data as well as to
accumulated fallout. An inexplicably high value from 1971 was
especially annoying in this respect. The prediction models
(table C.1.4.1.) disregarded this value. The radioecological —3 90 —1 90 —2
sensitivity became 4.9 • 10 pCi Sr 1 y per mCi Sr km ,
which was of the same order as that estimated for ground water.
This suggested that borings, such as that in Feldbak which 90 showed relatively high Sr levels, did not play any important
role for the supply of Danish tap water.
If the Copenhagen tap water was included, the population weighted
mean sensitivity of Danish drinking water became 9 • 10~ pCi 90 -1 90 —2 90
Sr 1 y per mCi Sr km , because the mean Sr con
centration in drinking water from Copenhagen v/as 4 times that
in the remaining part of the country. As the annual per caput
drinking water intake by the Danish population is 54 8 1, the 90 infinite time-integrated Sr intake from drinking water became
9 • 10 J • 548 • 73 = 360 pCi *uSr, which was less than 2%, of 90 the total Sr intake of a Danish individual (cf.4.2.2.).
Although drinking water was thus unimportant as a source of 90
Sr, it was a main contributor to the stable Sr intake. The
usual mean concentration was about 6 mg Sr (g Ca) , or 0.5 mg
Sr 1 i drinking water from Lolland-Falster, however, contained
28 mg Sr (g Ca)" , or 2.8 mg Sr l" , and in Zealand the level
was 17 mg Sr (g Ca)" , or 1.7 mg Sr l" . The occurrence of
coelestin (SrSO ) in the underground of the south-eastern part
of the country (Ra75) may explain the higher stable Sr/Ca
ratios found in Lolland-Falster; the inflow of sea-water may
in some borings be another factor contributing to the higher

- 44 -
stable Sr to Ca ratios, because the mg Sr/g Ca ratio in sea
water is normally higher than in fresh water (Od50). In a
study of Ca and Sr in raw and tap water from 5C cities located
throughout the United States, ALEXANDER et al. (A154) found that
the highest Sr concentrations v/ere associated with waters from
regions having soils containing a large proportion of easily
leached soft lime carbonate. The highest Sr/Ca ratio in the
U.S. study was similar to that observed for Lolland-Falster,
but the mean content of stable Sr in US tap water was one third
only of that in Danish tap water (Lolland-Falster and Zealand
excluded)•
1.4.5. Faroese tap water
Faroese drinking water is obtained from surface water. An anova on
of the Sr data collected in 1962-1974 showed a highly
significant variation among years. The variability was 0.55,
and thus significantly less than that observed in Faroese 90 precipitation (CV =1.78), suggesting that the Sr con-p year
cent ra t ion in Faroese t ap water also depended upon the accumulated f a l l o u t .
2.0
z
Hi
> 5 -J
1J0
0.0
Y E A R S * * * MONTHS LOCATIONS
* * *
65 70 75 J F M A M J J A S 0 N D Thorshavn
Klaksvig , Tvae rå
Fig. 1.4.S. The annual, monthly and local variation of an Sr in Faroese drinking water collected in 1962-1974
(cf. fig. A.1.1.3.2.). The bars show the concentrations
relative to the grand mean 1.58 pCi 1 tiv* seal«).
-1 (» 1 at the rela-

- 45 -
QQ on
In 1962 (RRF62) and 1963 (RRF63) the Sr/ Sr ratios were
determined in Fatoese tap water. The measurements showed that
the ratio in tap water v/as approx. half of that in precipitation
from the same month. This suggested that approx. half of the 90
Sr in Faroese tap water had been obtained from recent pre
cipitation. The local variation was also highly significant (fig.1.4.5. ) .
During the whole period the levels at Thorshavn were nearly 90 twice as high as the Sr concentrations at Klaksvig and
Tvaera, where tH.e levels did not differ significantly from each
other. It has been shown (RRF67) that the lower levels at
Tvaerå, as compared with Thorshavn, coincided with a 2-3 times
greater ion-exchange capacity for Sr of the Tværå soil.
Because of the pronounced local variations in the Sr con-
oen*-~-tions, prediction models were calculated for the water
for each of the three locations (table C.l.4.1.). The radio-
ecologica! sensitivity of the Thorshavn drinking water was
nearly five times as high as that of the water from Klaksvik. 90 -1
The mean sensitivity of Faroese tap water was 0.11 pCi Sr 1 90 -2 y per mCi Sr km . The infinite time-integrated level from
90 -2 90 a total deposition of 152 mCi Sr km became 17 pCi Sr 1 y, which was nearly 30 times higher than in Danish drinking
90 -1 water (0.66 pCi Sr 1 y). The infinite time integral in
the Faroese tap water was similar to that observed for Danish 90 -1 streams (24 pCi Sr 1 y), but definitely lower than for
90 -1 Danish lakes (82 pCi Sr 1 y). The calcium concentration
in Faroese drinking water was measured at 0.004 + 0.002 g Ca
1~ in 1962 (RRF62), i.e. 5% of that in Danish drinking water.
1.4.6. Greenlandic drinking water
Drinking water in Greenland is obtained from two main sources:
surface water from lakes, rivers or rain-water reservoirs, and
meltwater from snow and (old) ice. The activity levels
strongly depend upon the source of the water. The old ice thus
has zero activity, while snow and surface waters may often
have concentrations close to those found in precipitation.

- 46 -
90 An anova carried out on the yearly Sr mean concentrations in
Greenlandic drinking water from 1962-1974 showed a highly
significant variation an<ong years. The variability was 0.61
(table B.l.4.1.), or similar to that observed in Faroese
drinking water but significantly lower than in Greenlandic
precipitation (CV year = 1.75). As in the ca^p of Faroese
drinking water, we may conclude that the Sr levels in
Greenlandic drinking water did not ncltiy depend on fresh 90
fallout but also on older deposition of Sr.
2.0
YEARS * * *
U)
z
LU > !< 1.0 -
ui
0.0
LOCATIONS * * #
ll 65 70 75 DAN PCS I UPV G8H UPV
SCO JUL GOD
90 Pig. 1.4.6. The annual and local variation of Sr in
Greenlandic drinking water collected in 19*2-1974 (cf.
fig. A.1.1.3.3.).
DAN * Danmarkshavn, SCO * Scoresby Sund, PCS « Prins Chri
stians Sund, JUL - Julianehib, GHB - Godthåb, GOD » Gotihavn,
UPV « Upernavik. The bars indicate the concentrations rela
tive to the grand mean 1.30 pCi 1~ (- 1 at the relative
scale).
The local variability was 1.14 in Greenlandic drinking water
(fig.1.4.6.), which value was higher than found in Danish or
Faroese water. There were low levels at Godhavn and Upernavik,
where snow and ice are used in the supply of drinking water,
and the highest level was found in water from Prins Christians
Sund where rain-water was collected in a reservoir and used
directly for drinking. The local variation was thus a result
of the extraction of the water used at the given location,
rather than of local variations in waters of the same origin.

- 47 -
90 The prediction model for Sr in Greenlandic drinking water
(table C.1.4.1.) was based unon the samples received from the
west coast of Greenland between Upernavik and Julianehåb. As
the dat., were incomplete, annual means calculated by VAR-3
(B.3.) were applied in the model. The fallout data used were
those measured at Godthåb (cf.1.3.). The radioecological 9P —1 90
sensitivity was estimated at 0.52 pCi Sr 1 y per mCi Sr km and the infinite time exposure integral from a deposit of
9n -2 90 -1
55 mCi Sr km * was 29 pCi Sr 1 y, i.e., higher than
in Faroese and Danish drinking water. The lower temperatures
in Greenland, which give permafrost at many locations, may
prevent the soil from acting as an effective absorbing medium 90 for Sr and thus of removing the activity from Greenlandic
fresh water.
1.5. Sea water
Langt udt i Havet et Vandrt iaa bliat, fat cut at *ra tht u a t f i ' i at blue JI tnt >.>etalj tern bladene pi dtn dtiligsti Koin- c-{ tht l o v e l i e s t ccin^lcxei. and aj citat blomtt 09 iaa klait torn dtt ttittstt ai tftc putesf j i a i « . Glat. THI LITTU SitRUAlV
VIM LILLE HAVFRUE
The anthropogenic radioactive contamination of the si a orig-
nates primarily from nuclear weapons testing. As approx.70% of
the surface of the world consists of water, a substantial part
of the global fallout has been deposited in the oceans. Further
more, the sea is the ultimate recipient of run-off from the
land masses. In local waters, contamination from peaceful uses
of nuclear energy may predominate over fallout. This has, e.g.,
been the case in recent years in the North Sea, which is
contaminated with radionuclides released from the reprocessing
plants at Windscale and at Cap de la Hague.
90 Some radionuclides, e.g. Sr, stay in solution in the sea, while 137
others, e.g. plutonium and to some degree Cs, settle in the
sediments. The latter process is especially found in estuaries
where the concentration of particulate matter is high and where
lower salinities occur.
The marine environment is a habitat for animals and vegetation
exploited by man, and studies of the radioactive contamination

- 48 -
of the «=ca were initiated already in 1946 (Se71) shortly after 90 nuclear weapons tests began. Global contamination with Sr has
been studied in surface sea water from the Atlantic Ocean since
1954 by HASL and the Woods Hole Oceanographic Institution (WHOI) 90 'Vol71). Ris* has since 1962 measured the Sr levels in sea
water samples collected in inner Danish waters (RRD62) and in
the waters along the coasts of the Faroes (RRF62) and Greenland
(RRG62) .
1.5.1. Inner Danish waters
In inner Danish waters a northward surface current carries the
light Baltic water out through the Danish Sounds and Belts, and
a southward bottom current transfers the heavy North Sea water 90 to the Baltic Sea (He€8). In 1963 the Sr concentrations in
the Baltic (Vc 1) and in the North Se^ (Vol71) were approx. 90 -1
the same ( 0.6 pCi Sr 1 ), while the levels in inner Danish 90 -1 waters were somewhat higher (^ 0.9 pCi Sr 1 ), because the
90 rather intensive fallout rate at that time influenced the Sr
concentration of the shallow Danish waters to a larger degree
than the deeper waters usually found in the North Sea and the
Baltic Sea. Finnish data (Voi71) suggest that the situation
persisted until about 1965 du-3 to the relatively intensive
fallout rate till then.
By 1966 the situation had changed. At that time tne Baltic Sea 90 -1
contained the highest levels ( C.9 pCi Sr 1 ) because runoff, fallout, and inflow from Danish waters in the preceding years had all contributed to an increase of the inventory of the Baltic. The water in the North Sea had in the same period
90 -1 been diluted to about 0.4 pCi Sr 1 by the low level (•v 0.2
90 -1 pCi Sr 1 ) Atlantic Ocean water. By 1966 the mean concentration of inner Danish waters had decreased to about 0.7 pCi 9°Cr T 1.
90 In accordance with the above considerations, the lowest Sr
concentrations in 1963 would be expected in the low salinity
samples, because the activity in these samples was diluted by
the low activity water from the Baltic Sea. A similar dilution
did not take place for the high salinity surface water from
the Cattegat because the heavy North Sea water remains at the

- 49 -
bottom. Hence proportionality was found between salinity and 90 Sr concentrations in inner Danish waters in 1963.
ft«. 1.5.1.1. Strontlue-90 and 137C» In Danish surface
sea water collected 19(2-1974 in the inner Danish waters
(cf. fig. A.I.I.S.). The values shown were the tieans of
appro«. 10 determinations (• 1 SE indicated). The full curve
•hows the predicted values (cf. Table C.1.5.1. No 1). The
dotted curve connects the 137, Cs
After ">66 the low salinity Baltic water carried the highest 90
Sr concentrations, while the inner Danish waters - due to the
lower fallout rates at that time and to the dilution with low
activity North Sea water that had been increasingly mixed up
in the water column - carried lower concentrations. An inverse 90
relationship between salinity and Sr concentrations in the inner Danish waters was therefore observed from 1966 (cf. table D.1.5.1.) .
Equation no. 1 in table D .1 .5 .1 . implied that the Baltic component ('v lo t ) of the inner Danish waters during 1967-1971
90 -1 showed a mean level of 0.8 pCi Sr 1 , while the North Sea
an _ i component C>> 34%) contained 0.3 pCi 'wSr 1 . Since 1972 the
90 equations have gradually changed. The S*r concentration of North Sea water has nearly doubled since 1967-1971, while the
Sr concentration of Baltic water is essentially unchanged.

- 50 -
137 The equations for Cs in table D.1.5.1. indicate that the
activity levels in inner Danish waters are again approaching
direct proportionality to the salinity. However, as compared 90 „
to 1963-1965, the mechanism differs. In recent years the Sr 137 and Cs levels in the North Sea have increased (fig.1.5.1.1.)
due to the operation of reprocessing plants in the UK and in
France (Je73, De71-77).
Inner Danish waters have thus shown an evident time variation 90 of the Sr levels, which were at first dominated by fallout
but later influenced by releases from reprocessing plants
indirectly to the North Sea. The local variations were, as a
whole, obscured by interaction (fig.1.5.1.2.) . For the period 90 1967-1972, the Sr concentrations were inversely proportional
to the salinity, and the levels found in the Baltic water were
typically 2-3 times higher than that of the North Sea.
2.0
1.5
r'° u O.
0.5
0.0
—i 1 1 1 1 1 1 r
• Baltic Sea i Møns Klint. Fakse Bugt)
O Cattegat (Hessel*. Sjællands Odde)
1962 _l_ _L
196A 1966 YEAR
1968
rig. 1.5.1.2. Strontium-90 In Baltic sea water (»alinlty
10t) and in Cattegat aaa water (salinity 20t) collected
in 1962-1969 at two locations for each type of water (cf.
fig. A.I.I.S.). Up until 1966 the "high salinity" stations
in th« Cattegat showed higher level« than the "low" salinity
stations, but since then this situation has been reversed
(cf. the text).

- 51 -
The variability among years (table B.1.5.1.) was 0.26 for J Sr
in Baltic water (1961-1974) and 0.18 in North Sea water
(1963-1974). The time variability of Danish sea water was low
compared with the fallout rate (CV .,_-_ = 1.7), but of the 90- Y e a r
same order as that observed for Sr accumulated in the soil.
Organisms acquiring their radionuclide contents from the sea
usually display a low variability among years compared to most
terrestrial organisms, because the radionuclide levels of the
latter are more strongly influenced by the fallout rate.
During 1972-1974 the variability of Cs among years in Baltic
water was lower than that in North Sea water because the time 137 variability of the Cs concentrations in the North Sea was
enhanced by the varying releases of Cs from Windscale and
Cap de la Hague.
90 Prediction models for Sr concentration in inner Danish waters
were calculated from the data on surface water collected in the
period 1961-1972 (table C.l.5.1.). The radioecological
sensitivity was estimated as the mean of the two models (nos. 90 -1
1 and 2 in table C.l.5.1.), i.e., 0.35 pCi Sr 1 . y per mCi 90 —2 90 Sr km , and the infinite time-integrated Sr level in
Danish surface sea water (mean salinity 16&) became 26 pCi 90 -1 Sr 1 y. As the mean Ca content in sea water with a mean
salinity of 16& is 0.19 g 1 , the radioecological sensitivity 90 of Danish sea water may also be expressed as 1.9 pCi Sr
-1 90 -2 (g Ca) y per mCi Sr km .
137 90 The mean ratio between Cs and Sr in surface water during
1972-1974 was 1.07. Assuming this ratio to be valid also for
the period 196 0-1972, which is compatible with Finnish data 117 (Voi71), we may estimate the transfer coefficient for Cs as
°-35.'s1,07 =0.23 pCi 137Cs l"1 y per mCi 137Cs km"2 deposited, 137 It is remarkable that the transfer coefficient for Cs was
90 approx. 2/3 of that for Sr; the reason for this being the 137 sedimentation of Cs (cf.6.3.). The radioecological
90 sensitivity to Sr contamination of sea water was about one
third of that of Danish lake water, which was partly due to the 90
shorter residence time of Sr in sea water than in most lakes.

- 52 -
1.5.2. North Atlantic ocean and Greenlandic waters
Since 1962 surface sea-water samples have been collected at
Thorshavn and along the coasts of Greenland. These samples
were supplemented by other samples taker bf the M/S DANA on
cruises to the Faroes and Greenland during 1962-1974. Anovas 90 of the Sr concentrations showed that the highest levels were
found in East Greenland waters and the lowest in the Atlantic
Ocean and the coastal Faroese waters. There was no significant
difference between the Atlantic Ocean water and the Faroese on
water. With respect to Sr content, we may thus consider the
Faroese sea-water samples to be representative of North Atlantic
Ocean water from latitude 60° - 70°N between the Faroe Islands 90 and Greenland. The Sr levels of Kest Greenland waters were
not significantly different from those of North Greenland
waters .
0.7 j-
0.6 H
I — i — I — i — ! — ! — i — r
0.5 U
«s> S o 0.3 Q.
0.2
T—i—i—i— T — r — • — r
v The Faroes t Atlantic Ocean (60° - 7 0 ° N i l o W. t H. Grcenlond \
ft o E. Greenland-»
k
0.1
0 , 0 I — i — i — ' i i i i — i » i i ' • i • i t
60 65 70 75 YEAR
Fig« 1.3.2. StrontiuM-90 in North Atlantic surface sea
water collected in 19(2-1974 between and at the Faroe« * Greenland.
Figure 1.5.2. oepicts the interaction between time and locations,
The East Greenland waters showed a diverging time variation;
since 1967 the levels in East Greenland waters have thus been
higher than in West and North Greenland waters. Sea-water
samples from the GEOSECS (Vol73a) cruise to the Greenland Sea 90
in August 1972 indicate that Sr inventories are here greater
than expected. Samples fror. tr.e Last Greenland Polar current
collectc-d in 1966 (PRGf.6) by the DANA sugaested that the 9v,'Sr
levels in t!us current are d little Maher than ir. the Irrir-g«*i
current. There seems no obvious explanation of the enhanced 90
Sr concentrations in the Polar current, ror cf the higher
levels genera l ly found ir. saisples frora East Creer.iand waters (RRG62-76).
The variabilities among years (1962-1^7«i in North Atlantic
Ana Greenlandic waters were C.4 8 and C.46, respectively, i.e.,
significantly higher than in Danish waters (table E.l.5.1.}.
This was a result o: the higher dilution occurring ir. ocean
waters than in shallow seas. In recent vears sor.e samples of 137Cs/96Sr rat, Faroese (RRF62-76) waters have shown enhanced Cs/' Sr ratios
(> 2), suggesting contribute
North Atlantic Ocean (Ku78).
{> 2), suggesting contributions of * 'Cs from Kir.dscale to the
The ra^ioecclogical sensitivity of .Korth Atlantic surface water
to 7,-Sr contamination from fallout was lew: 0.03 nCi Sr I 90 -2 y per mCx Sr km (table C.1.5.1.}* the reason for this
beinr the effective dilution by the large sea-water masses.
Greenlandic coastal waters showed a sensitivity similar to
that observer in inner Danish waters, i.e., a.-t order of
magnitude higher than in the North Atlantic Ocean water. The
East Greenland waters were apparently more sensitive than the
West Greenland waters, or they nay have been subject to an
unknown source of radioactive rortar.ination.
The radioecological sensitivity of North Atlantic surface
sea water to Cs contamination was equal to that of Sr,
because th»- Cs/ Sr ratio in the ocean water was similar
to that ip nuclear debris.
DANA collected deep water samples on a number of occasions 90
(cf. table D.I.5.2.). Concentrations of Sr in the deep sea
have been a most controversial subject (Vol71). BOWEN et al.
(Bo60) were thus convinced that measurable Sr (and Cs)
concentrations have been present below a depth of 1000 m in the
North Atlantic since the beqinning of the sixties, while
BROCCKER et al. (Bro6*a) thought it safe to say that any finite or) 137
amounts of Sr and Cs founH prior to 196^ in samples from

- 54 -
below 1500 m were almost certainly due to undetected blanks.
The present material showed that samples collected from about
latitude 60-65 N, where the vertical mixing of the Atlantic 90 Ocean is pronounced (He66), displayed Sr concentrations that
were definitely above background concentrations. A few samples
collected from about latitude 40 N in 1966 showed lower levels,
and for one location it was doubtful whether the levels below
2000 m were significantly above the detection limit.
From the DANA samplings in 1966, 1971 and 1973, the total inte
grated Sr level in the water column from about 62 N in the North 90 -2
Atlantic (RRG73) was estimated at 146 + 12 {1 SE) mCi Sr km , 90 i.e. not incompatible with the ac^umulatt-d Sr fallout in the
Faroes and in Prins Chr. Sund. During the GEOSECS cruise in 1972
(Vol73a) similar observations were made at other locations in
the North Atlantic. But according to fallout studies carried
out on 4 weather ships in the North Atlantic Ocean (Vol74,
Vol73b), the expected fallout was only half of that actually 90 found in the water column. The study of Sr concentrations
in deep water samples collected in the North Atlantic Ocean 90 thus suggest an excess Sr fallout in this part of the Ocean,
which seems incompatible with the levels expected from fallout
measurements on the weather ships. Various explanations of
this phenomenon have been proposed. For example, it has been
assumed that the amount of dry fallout was greater over the 90
sea, or that sea spray activity scavenged the Sr from the
air. None of these mechanisms has so far been demonstrated
in environmental (Bro66b) or in experimental studies (Vol74).
Assuming a substantially greater fallout rate over the ocean
than over land implies that the global inventory from weapons
testing has been seriously underestimated (at least by a 90 factor of two), or that the Sr inventories on land have been
overrated. According to VOLCHOCK (Vol74), both hypotheses
seem unlikely. Measurements in the Pacific and Indian Oceans do 90 not suggest these oceans to be depleted in Sr as compared
with the Atlantic Ocean.

55 -
1.6. So i l and sediment
Regnolmen kom lige op a{ Hejen, IH 'CI "And I've dad a tatfe u'<tli an eatffcuii>ii» I d e « , tø#t*e* ug Vage havde to det i fcnoic." satrf <i f/;ttif i ' t r a i d . "Ho »-as ^ u s t com-J c t d e n j den havde høtt en heel Veet, ing up \ am the Hi(t, iWiete ( d i n^gi t t j and 4ee fean den jo ikke, det etcndige Viji. dam lie lifld been lummaging in the giound,
ILVERHCl and he had uvetheatd a g i e a t deaf , (?4 c c u t j e , lie c a n ' t s e c , poet c i e a f u i e .
THE HILL Or THE ELVES
In the terrestrial environment soil is the final recipient of
radioactive debris not removed by re-suspension or run-off to
the sea. The ability of the soil to retain radioactive
substances depends upon numerous environmental factors: soil
characteristics, meteorological and hydrological conditions,
man's use of the terrestrial environment, animal life and
vegetation, and the physical and chemical properties of the
radioactive debris. Crops may absorb radionuclides from the
soil through their root systems; radioactive substances are
then introduced into the food chains by so-called indirect
contamination. The extent to which this happens also depends
upon the factors mentioned above. Most of the deposited
radioactive contamination, however, remains ion-exchanged or
physically adsorbed in a soil rich in clay minerals.
90 The first systematic soil sampliny for Sr determination was
carried out in 1955 in the United States (Has58). In the
following years this soil programme was expanded by HASL to a 90 global study of the accumulated Sr levels in soil. Country-
90 wide soil sampling aimea at estimating the accumulated Sr in
Danish soil was initiated by Risø in 1961 (RRD61).
1.6.1. Variation with time and location
In theory, the fallout A accumulated by the vear n is the sum n J
of the annual amounts of-fallout d. up till n corrected for
radioactive decay:
A = V d e"Ar (n-i + 1> (Eq.1.6.1.) n i=0 i
90 —1
where \ is the decay factor (for Sr: 0.025 yr )j i=0 in
1950, when fallout began. Equation 1.6.1. presumed that all
fallout deposited in a year (i) had been received by the start

- 56 -
of the year. Although more than half of the long-lived global
fallout is usually deposited in the first part of the year,
the method of calculation applied will underestimate the 90
accumulated fallout. For long-lived radionuclides, such as Sr
and 13 Cs, this underestimate is, however, immaterial.
~ i i — i — i — i — i — i — i — i — i — i — i — i — i
v 0-15 cm • 0-30 cm o 0-20 cm D 0-50 cm
(2 ISE)
effective halt lives
28 yr
20 yr
15 yr
10 yr
5yr
0 i i i - * * i i i i i i i i i i i i i i i i i i i i i i i i
50 55 60 65 70 75 YEAR
AA
Fig. 1.6.1. The Sr level* observed In Danish uncultivated
•oils collected in 1961-1975 at the state experimental farms
I tig. A.1.1.3.1.) compared with the calculated levels (the
curves) assuming various effective half-lives (cf. Eq. 1.6.1.)
of the 90Sr deposited. The correlation coefficients between
observed and calculated levels wares 0.9825 for 28 yr,
0.9700 for 20 yr, 0.9289 for 15 yr, 0.7834 for 10 yr and
0.3587 for 5 yr.
Figure 1.6.1. shows a comparison between the levels observed
in uncultivated soil and the calculated values. The upper curve
was calculated from (Eq.1.6.1.) using the Danish precipitation
data (1.3.) as d. values. The underlying curves were analogous,
assuming half-lives of the accumulated fallout of 20, 15, 10

- 57 -
and 5 years, respectively. A correlation analysis showed that
a half-life of 28 yr gave the best fit to the observed data
(r=0.9825***).
In the case of cultivated soil, the measurements from 1973
(RRD73) and 1975 (RRD75) show that the mean ratio between the
activity levels in cultivated and uncultivated soil was
0.92 + 0.25 (1 SD) for Sr and 0.93 _f 0.22 for xo Cs. We may
thus establish that although the vertical distribution of the
activity in cultivated soil differed from that of uncultivated
soil (cf.1.6.2.), the cumulated activity was on an average
only a little lower in the cultivated soil. On the basis of
the measurements of cultivated soil in 1962 (RRD62), 1973, and
1975, the "observed half-life" of ?0Sr (and 137Cs) was
estimated at 20-25 years in cultivated soils.
Figure 1.6.1. suggests that radioactive decay was mainly
responsible for the reduction of the radionuclide content of
the soil. However, other factors, e.g., run-off and removal by
crops, may also have contributed. It was estimated (D .1.6.1.1.) 90 that the overall decay factor of Sr in Danish cultivated
soils for the various removal processes (radioactive decay
included) was: A = 0.036 yr~ , during 1950-1974 and would in 90 -1
future approach the decay factor for Sr, i.e. 0.025 yr . The
decay factor A = 0.03 6 yr during the past period, which
corresponded to an "observed half-life" of 19 years, was thus
compatible with actual observations in Danish cultivated soil.
ERIKSSON (Er77) estimated the effective half-life of 13 Cs and 90 Sr in the root zone of Swedish soils at 23 and 22 yr,
respectively.
The variability among years (table B.l.6.1.)(1962-1974) of the 90 Sr levels in Danish soil was 0.20. This time variability may
90 be considered as the theoretical minimum for Sr from global fallout in terrestrial ecosystems in Denmark, in the same way
as the time variability in the precipitation and air samples
was considered the theoretical maximum. The reasoning behind
these assumptions was the fact that terrestrial ecosystems 90 obtain their Sr contents through varying amounts of direct
and indirect contamination, i.e. from fresh as well as old
deposits. If the contamination is mainly derived from new

- 58 -
90 „ deposits, the tine variation resembles that of Sr in precipitation and air; on the other hand, if the sample in question
90 has obtained its Sr from the cumulated debris in the soil, 90
the time variability approaches that of Sr in soil. However,
as discussed below (2.2.1.), environmental factors other than
fallout vary with time and may thus influence the time varia
bility.
Anovas of the Sr and Cs data on soil showed a significant,
local variation. The highest levels were found at Studsgård,
Askov and Jyndevad, and the lowest at Tystofte and Ledreborg.
The variation was correlated to the local precipitation
pattern (r = 0.7943** for the 10 stations). We may therefore
conclude that dry fallout either plays a minor role or that
the amounts of dry fallout are proportional to the amounts of
precipitation. The local variability was 0.13 (table B.l.6.1.),
which was lower than that observed for precipitation (CV
location = 0.16), because Studsgård showed lower soil than
rain levels, while the data from Abed were reversed. The
deviations between soil and precipitation data from these two
locations were probably due to local soil characteristics and
environmental conditions. In the sandy soil at Studsgård some 90 Sr may have penetrated below the sampling depth and the total
90 deposit of Sr in the soil was thus underestimated. At Abed the soil was sampled in a meadow (table A.l.1.6.2.), and some
90 flow of Sr from areas more highly situated may have enhanced
the soil Sr.
Studies of 137Cs in soil (Ka72, Kr73, Ha74b, Ha58-78) have all 137 90 shown greater Cs/ Sr ratios than the theoretical value of
1.45 (Harl72). The 137Cs/90Sr mean ratio in Danish soil lay
between 1.6 and 1.7, i.e. not significantly different from the
mean ratio found in air samples collected at Risø since 1962.
The ratio higher than the theoretical 1.4 5 may be a result of
fractionation (Ed59, Fr61). MAMURO et al. (Ma65) thus observed
that the highly radioactive primary fallout particles collected
in the autumns of 1961 and 1962 after the Russian test series 137
were impoverished in Cs. This was compatible with the 137
delayed, long-range global fallout being enriched in Cs.
Assuming that the debris over Denmark contained relatively
large amounts of global fallout as compared with primary

- 59 -
fallout, because Denmark is distant from the test sites, we may
expect a
samples.
137 expect a relatively larger Cs content in the air and soil
Soil samples have not been collected routinely from the Faroes
and Greenland. From the fallout data (1.3.) the accumulated 90Sr in 1967 at Thorshavn was estimated at 78 mCi km" and in
Godthåb in 1970 at 4 2 mCi km-2; HARDY et al. (Hard72) found 9
mCi >3Sr km in 1970 at Thule Air Base, which is a few
kilometers south of Dundas. These figures are all in reasonable 90 agreement with the Sr levels shown in table D.1.6.1.2. As
regards Tværå, there is no information on rainfall and fallout
from this location. The soil data from Tværå suggested that
the fallout rate was between those at Thorshavn and at Klaksvig, 137 The Cs concentrations of the Faroese and Greenlandic soil
samples were in general higher than the expected 1.6 times 90 the Sr concentrations. As also observed in the case of Danish
soils (1.6.2.), the "median depths" of Cs in the Faroese and 90 Greenlandic soils were lower than that of Sr.
1.6.2. The vertical distribution of radioactive debris in soils
Several investigators (Th60, Sc60, An66) have studied the
vertical penetration of radionuclides in soil and have described
the distribution and migration by mathematical expressions.
The models have, however, been unable to describe the long-term
situation under natural conditions in the environment. As
mentioned above, the environmental factors that determine the
retention and distribution of radionuclides in the soil are
rather complex, and it seems difficult to make allowances for
all significant factors in theoretical models.
Over a period of 8 years SQUIRE (Sq66a, Sq66b) studied the 90 117
behaviour of Sr and Cs in soil. These studies were carried
out with artificially added activities applied at one time to
experimental concrete cylinders. SQUIRE observed that the
median depth of the activity was proportional to the square
root of time since deposition of the activity; this she found
"compatible with movement being determined largely by the random
diffusion of ions in the exchange complex of the soil".

- 60 -
90 As the Sr fallout in Danish soils had penetrated by 1975 to
a depth of approx. 50 cm (RRD75), and as fallout commencftd
approx. 25 years ago, it was assumed that the front of the
activity deposited t years ago had reached a depth D cm:
D = 10/t. (Eq.1.6.2.)
90 Eight y*>ars after the application of Sr to 3 soils of sandy
loam and one of calcareous loam, SQUIRE (Sq66a) observed that
the activity front had reached a depth of 20-30 cm. Equation
1.6.2. predicts a depth of 28 cm.
The distribution of the activity of the deposit of a given
year may be descriDed by:
, -ax 1 " e~D~ Y = ii_ (Eq.1.6.3.)
1 - e" a
where Y is the fraction of the total integrated activity in the
soil column present down to a depth x cm (x <_ D) and a is the
"vertical distribution coefficient". This model was derived
fron; experimental studies of the Cs activity profiles in
British soils (GaG3), which suggested vertical distributions
compatible with Eq.1.6.3. The "vertical distribution coefficient'
depended on environmental factors, e.g., soil texture, and on 90
the radionuclide considered. For Sr in sandy soils, a equalled 90
approx. 3 and in loamy soils approx. 1. The variability of Sr
among depths was in fact higher for loamy than for sandy soils
(table B.l.6.1.). As an average for the Danish soils, a = 2
fitted the data with good approximation (fig.l.6.2.). A
comparison between the experimental data of SQUIRE (Sq6 6a) and
this model showed that the UK experiments yielded a-values of
3.5 and 2 for soils without and with application of fertilizers,
respectively. The Danish average value thus corresponded to the
UK value for fertilized soil.
A high a-value implies a shallow median depth, i.e. the bulk
of the activity remains in the uppermost layers of the soil;
the distribution is uneven. The opposite is the case if the
a-value is small, the activity is then more evenly distributed

- 61 -
( — i — i — i — i — i — i — i — i — r T — i — i — i — i — i — ! — i — r
65
60
55
SO
45
'Ltn E
8
u 30 E 25
20
10
5
v 0-15 cm • 0-30 cm * 0-10cm o 0-20 cm o 0-50 cm
(•ISE)
0-20cm-
0-10 cm
0 I i. I 1 I 1 1 i 1 1 1 1 1 1 1 1 I 1 ' '
60 65 70 75 YEAR
90 Fig. 1.6.2. The integrated Sr levels in uncultivated Danish soil measured at various depths
compared with the calculated levels (the curves). The total deposit was calculated from Eq. 1.6.1.
applying an effective half-life of 28 yr (cf. Fig. 1.6.1.). The vertical distribution was cal
culated from Eqs. 1.6.2. and 1.6.3 applying a vertical distribution coefficient a = 2 (cf. the
text). Eq. 1.6.3. implies that the maximiimconcentrations will remain in the uppermost soil layer.
Actually the maximum is displaced downward with time. However as shown the displacement is so
slow, that it was not detectable, when 10 cm thick samples were analysed. The samples were col
lected at the state experimental farms (Fig. A.1.1.3.1.) and in 1970 at an additional ten lo
cations distributed over the country (cf. Fig. A.1.1.6 and Table A,1.1.6.1.).
in the soil column. If Y = 0.5 is inserted into Eq.1.6.3. and the
equation is solved with respect to x, the "median depth" x=a
becomes:
- D » In [0.5 (1 + e"a) ] a_ =
m a (Eq.1.6.4.)

- 62 -
90 The root uptake of Sr by the crops is influenced by the
median depth of th» activity in the soil. As shown in D.1.6.2., 90
the effective halflife for root uptake of Sr may be estimated
for various crops in various soils. According to these estimates,
both cultivated and uncultivated Danish soils showed effective 90
halflives of Sr of the order of 15 years, somewhat lower for
crops with a shallow root system such as grass and a little
higher for crops with deeper roots such as cereals and root
crops. If fresh fallout ceases, we can in the long run expect 90 increasing effective half-lives for root uptake of Sr because
the half-lives observed in the soil will increase (1.6.1.),
although at first we nay expect a tenporary decrease in the
effective half-life for cultivated soils.
Several experiments (Ru66b) provide convincing evidence that 90
the conversion of Sr into sparingly soluble forms is unlikely
to reduce its availability to plants to a significant degree
over a period of several years. However, whether or not such a
reduction in availability could take place over long periods
has not yet been clarified.
If Eq.1.6.3. is applied to Cs, the "vertical distribution
coefficient" is close to 5 for Danish average soils. The higher 137 90
a-value for Cs than for Sr was tantamount to a steeper 137 gradient of the vertical Cs distribution in the soil, in 137 agreement with the well known (Fr66) higher retention of Cs
90 than of Sr by clay minerals.
1.6.3. Sediments
Sediments and sedimentary particles remove radionuclides from
water. Certain radionuclides are more strongly sorbed on
sediment particles than others. More Cs is thus carried by 90 sediments than Sr (cf.1.5.1.). Nuclear debris noves through
the sediments after deposition. Diffusion through interstitial
water is one way of transportation. Where sediment accumulation
is rapid, the radioactive particles may be covered by later
sedimentary deposits before diffusion, and other transport
processes can displace the nuclides. In such cases it may be
possible to identify single years of deposition in the sediment

- 63 -
lavers and thus te ostirt.ate the serii; r.tation rato (Pe73).
Arong the other transport processes of radionuclides in
sediir.ents the burrowipti nf henthie ornani^ns, currents near the
bottom and ice p.cverr.ents nay play a role.
Sediment cores were collected in inner Danish waters in 197?
(P.P.D75) and 1976 (RRD76) and analyzed for Cs. The r.ean
half-depth of the 11 locations studied was 4 en, which is
comparable to data from the Irish Sea (He75) showing half-
depths between 4.1 and 7.2 cm. The integrated mean level in
sediments from inner Danish waters was estimated at 14 + 6 raCi lj7Cs km-2 (1 SD), or approx. 15% of the 137Cs fallout found
in soil. This estimate was approx. half that obtained from a
comparison of the transfer coefficients for u£r and Cs in
inner Danish waters {cf.1.5.1.}. The sediment samples ir.ay,
however, not be representative of inner Danish waters as a
whole because most of then were collected along the Swedish
west coast.
In November 1973 and in April 1974 sediment core samples were
collected to a depth of 20 cm from lake Kongsø in central
Jutland by the Laboratory of Freshwater Biology in Hillerød. 137
The samples were analyzed for 'Cs in 5 mm sections, and the
activity decreased exponentially with a half-depth of 4 cm,
i.e. equal to that observed for sea-water locations. The
integrated mean level of the two samplings from Kongsø was 137 —2 79 + 15 nCi Cs km . This deposition came close to the
theoretical amount of Cs in soil from fallout ("- 90 mCi 137 -2
Cs km ) , and it was definitely higher than the inventory
found in sea-water sediments. The distribution coefficient,
K,, between Cs in sediments and lake-water was estimated at
10 pCi o'Vc.6 • 10"3 pCi ml"1 % 2 • 104 ml g-1. The K, value 137 2 3 -1
for Cs in Danish sea-water was (10 - 10 ) ir.l g , which was
in agreement with experimental observations (Du71). The
distribution coefficient K. of Cs for sediments in fresh
water was thus more than an order of magnitude greater than the Kd for sea-water sediments. Several investigators have observed a rlose relationship between
137 239 240 the vertical distribution of Cs and ' Pu in sediments
(He75, No72, Ed75). In a study of sediments from inner Danish

- 64 -
waters (RRD76), the ' Pu/ Cs ratios in the various
sediment layers suggested that the vertical distributions of
the radionuclides were similar. The integrated plutonium
deposit corresponded to the levels found in Danish soils (RRD76), 239 240 -2
i.e., about 1.5 mCi ' Pu km
239 240
The studies of " Pu at Thule (V) have shown with approxi
mation that plutonium from a single release was distributed
exponentially both horizontally and vertically. The half-depth
value was 1-2 cm, and the K, value was 10 - 10 ml g~ . This
indicated that nearly all plutonium was found in the sediments,
which is in agreement with other observations (He75) . The
investigations also suggested that biological transport may be
important for the vertical displacement of plutonium in sea
sediments.
Strcntium-90 has not been studied in Danish sediments but
various investigations (Du71) have shown K, values of the order 2 - 1
of (10 - 10 ) ml g in marine sediments and 120-440 in lake
sediments (Le72), i.e. more than an order of magnitude less
than that observed for Cs. We may therefore neglect the Sr
inventory of sediments compared to the amounts present in sea
and lake water.
1.7. Conclusions
1.7.1. General
The atmospheric nuclear test explosions performed since the
detonation of the first nuclear weapon in 1945 have contaminated
air, water and soil with a variety of radionuclides. The
residence time in the environment of the majority of these
nuclides has been relatively short, but a few remain even 90 137 decades after their creation. Among these are Sr and Cs
which, due to their chemical affinity with the biologically
important elements calcium and potassium, respectively, are
readily transferred from the abiotic environment to living
tissues.

- 65 -
The measurements of the Sr and Cs concentrations in air.
water and soil constitute the basis of the prediction models
estimated for the various samples in this study, and hence for
the calculation of the transfer factors from fallout to man.
The variabilities of the abiotic environmental samples are
useful as indicators of the routes of contamination of the
biological environmental samples.
1.7.2. Air 90 137 The air concentrations of Sr and Cs showed similar
variabilities among years (CV =1.7) as well as among
months within the various years (CV .. =0.6). The mean 137 90 p months
Cs/ Sr ratio was approx. 1.6 and showed neither local nor
yearly variations.
An empirical model was proposed for the estimation of transfer
factors from injection to ground-level air concentrations
(fCi m y per MCi globally injected by the test explosion);
according to this model, the transfer factor of a given radio
nuclide was related to the effective half-life in the atmosphere
of the nuclide by a pover function. The transfer factor for 90 137 -3 Sr and Cs was estimated at 8 fCi m y per MCi.
The total integrated air levels originating from nuclear weapons Qft —T —^ — "i
t e s t i n g was e s t i m a t e d a t 0.12 pCi Sr m y ( 4 . 4 » 1 0 B q m y) , 0.22 pCi 1 3 7 Cs m - 3 (8 .1 • l O - 3 Bq m"3 y) and 2.9 fCi ?~<9 ?4n -^ —A -"\ - J , ' " % m y (1.07 • 10 * Bq m J y) . A "standard man" breathes 7.300 m3 air per year (Ic59), hence 0.88 nCi 90Sr, 1.6 nCi 137Cs
239 240 and 21 pCi ' Pu from nuclear weapons debris have been inhaled under Danish conditions by standard man. As regards 90 137
Sr and Cs, these intakes were 4 and 2.5%, respectively, of
the corresponding intakes with the diet (cf.4.2). From the
ICRP Task Group Lung Model (Ic66), assuming a mean fallout particle size of 0.4u (Sh66), it was estimated that 9% of the 90 Sr inhaled was absorbed into the blood, 4 5% was carried to
the GI tract, while 46% was expirated. The corresponding values 137 for Cs were 44$, 9% and 47%, respectively. It was thus
evident that the contributions to body burden from the inha-

- 66 -
lation of Sr and Cs were negligible as compared with
intakes from diet (cf.4.7). In the case of plutonium, uptake
from the diet is immaterial (Un77, IX) and inhalation is the
important pathway. BENNETT estimated the plutonium doses to
man (Be74). He found that the cumulative dose to bone through
the year 2000 was 1.5 mrad from 5.8 fCi 2 3 9 ' 2 4 0 p u m y, hence
the bone dose under Danish conditions to standard man was
estimated at 0.8 mrad (or 1? mrem), and the lung dose became
0.4 mrad (or 8 mrem); the liver received a dose similar to that
to the lungs according to BENNETT.
1.7.3. Precipitation 90 The Sr concentration in precipitation showed a variability
among years and among months similar to that in the air con-
cei 90,
90 centrations of Sr. Furthermore, the annual v a r i a b i l i t i e s of
Sr in Faroese and Greenlandic precipi ta t ion corresponded to those in Danish rain water, and the annual depositions of 90 Sr in the Faroes and Greenland were proportional to the Danish
90 -2 levels. An annual deposition of 1 mCi Sr km in Denmark thus -2 -2
corresponded to 2.08 mCi km in the Faroes and 0.75 mCi km in West Greenland (Godthåb district). There was no significant
90 —1 variation among locations as regarded pCi Sr 1 rain in 90 —2
Denmark, but the deposition (mCi Sr km ) was proportional
to rainfall, hence the local variability of depositions (CV
locations = °*16) w a s similar to that of mm precipitation. 90 The deposition velocity of global Sr dry fallout in Denmark was
-3 -1 2 • 10 m s and the observed washout ratio (or scavenging
ratio) for Sr was 0.99 pCi 1 (fCi m J) . On the average, 90 -1
the Sr concentration in rain water (pCi 1 ) has thus shown -3
the same numerical value as the air concentration in fCi m
The coefficient of variation of the monthly scavenging ratios
was 0.5. 90 The total deposition of Sr in Denmark from nuclear weapons
debris was 73 mCi km"2 (2.7 • 109 Bq km"2) with 81.3 mCi km2
(3.0 • 109 Bq km"2) in Jutland and 64.8 mCi km"2 (2.4 • 109
-2 137 Bq km ) in the Islands. The corresponding Cs levels were
90 1.6 times higher. The total Sr deposition in the Faroes was 152 mCi km"2 (5.6 • 109 Bq km"*2), and in West and East Greenland

67 -
the levels were SS and 34 mCi ^°Sr Yn , respectively, (2.0
109 and 1.26 • iO9 Bq km'2).
1 . 7 . 4 . Fresh water The Danish ground water showed a lower v a r i a b i l i t y among years
Oft
of the w S r concentrat ions {CV » 0.6) than rain water . p years
This results fro« the dependence of the ground-water con-on
centrations upon the Sr accumulated in the soil layers. On the other hand, the local variability (CV i o c a tj 0 n s
= °-5) w a s
higher for ground-water than for precipitation because the
soil characteristics influenced the ground-water concentrations,
For similar reasons, stream water as well as lake water also showed higher local variabilities than the rain.
The radioecological sensitivities of Danish ground, stream and
lake water were 7 • 10~ , 0.3 and 1 pCi Sr 1~ y per »Ci 90 —2
Sr km , respectively. One ground water station rfith sand as
a filtering layer showed a sensitivity that was two orders of
magnitude higher than the other ground-water borings.
The total run-off in Denmark from the land area to the sea was 90 —?
4.6 mCi Sr km up until 1974. The annual run-off has, on 90 the average, been 5% of the deposited Sr; in recent years it
has decreased to approx. 2&.
90 Because of the low Sr concentrat ions in ground water , the
90 - 1
intake of Sr with drinking water was 5 pCi (cap) ~ per ntCi 90 —i or Sr km , or 2t of the intake of Sr with the diet (table
4.2.2.). The Cs concentration in Danish drinking water is 90 even lower than the Sr level because the Danish soil retains
137Cs more efficiently than 90Sr (1.6).
90 Although drinking water is unimportant as a source of Sr
in Denmark, it is a main contributor to the humar. intake of
stable Sr, as nearly half of the stable Sr (200-300 mg (cap)"
y" ) is derived from drinking water. The local variations of
stable Sr were pronounced. Kater from Lolland-Falster thus con
tained 12 time'; more Sr than water from West Jutland.

- 68 -
Drinking water in the Faroes was derived from surface waters. 90 -1 The radioecological sensitivity was 0.1 pCi Sr 1 y per
9n -2 mCi " Sr km ; the variability among years was 0.6.
In Greenland the drinking water showed a high local variability
(CV , .. =1.1) because the origin of the water at the p locations various locations differed. At some Greenland locations, old
ice free of radioactive fallout was used, at others the water
was fresh rain water with relatively high radionuclide con
centrations. The radioecological sensitivity of drinking water Qfl —1 90 —?
from West Greenland was 0.5 pCi Sr 1 per mCi Sr km .
1.7.5. Sea water 90 The Sr concentrations in inner Danish waters were inversely
related to the salinity during 1966-1972, because the highest
levels came from the little saline Baltic water, while highly
saline North Sea water was low in activity due to dilution
from the Atlantic Ocean. Since 1972 releases, especially of 137
Cs, from Windscale have been increasingly detectable in
inner Danish waters and the activity levels have become
directly related to salinity. 90
The variability in the Sr levels among years was low (CV
= 0.2) as compared with air and precipitation, but it
corresponded to that observed in soil.
The radioecological sensitivity of Danish waters (salinity 90 — 1 90 —2
16&) was 0.4 pCi Sr 1 y per mCi Sr km . In comparison,
North Atlantic surface water showed a sensitivity of 0.03.
Greenland coastal waters showed sensitivities similar to those
observed in Danish waters. 90 The variability of Sr in North Atlantic sea water from the
Faroes and Greenland was higher (CV ' = 0.5) than in Danish
waters due to the more rapid dilution of the deposited debris
in a deep ocean than in shallow waters.
Deep sea samples from the North Atlantic suggested a deposition 90 -2
of approx. 150 mCi Sr km over this area of the sea. This
- 59 -
90 observation is compatible with the deposition of Sr in the
Faroes, but twice as high as the estimate from North Atlantic
weather ships.
1.7.6. Soil ana sediment 90 The effective half-life of Sr in uncultivated Danish soil was
not significantly different from the radiological half-life
of 28 years. Hence the soil measurements suggested that the 90 deposition of Sr estimated from rain-funnel sampling (1.3.)
corresponded to the deposition in the pastures used for soil 90 sampling. The variability of Sr in Danish soils among years
was 0.2 and the local variability was 0.13, which was close tc
that of rain fall.
137 90 As in air samples, the Cs/ Sr ratio in Danish soils was 137 in the range 1.6-1.7. The median depth of Cs was lower than
90 137
that of Sr, because Cs is more easily retained in the
soil layers. Hence A Cs/ Sr decreased with increasing sampling
depth.
90 The vertical penetration of Sr in soil was proportional to
the square root of years elapsed since the deposition took 90 place. An empirical model for the median depth of Sr was 90 combined with a model for the relative root uptake Sr by
Danish crops. The model suggested that the effective half-life 90 of Sr in crops grown in Danish soil would be approx. 15 years,
somewhat lower for grass but higher for cereals and vegetables.
In the long run, the effective half-life in the crops would
approach the radiological half-life.
Sea sediments from inner Danish waters contained 1 4 + 6 mCi (+1SD) 137Cs km"2 (5.2 • 108 Bq km"2) and 1.5 mCi 2 3 9' 2 4 0
P u km"2 (5.6
7 -2 • 10 Bq km ). The plutonium level equalled that in soils, 137 137
while the Cs figure was approx. 15% of the Cs deposit. 137
A lake sediment sample contained nearly all the Cs expected in a corresponding soil sample taken from the same area,
suggesting that the distribution factor between water and
sediments is an order of magnitude higher for lake sediments
compared with sea sediments from inner Danish waters.
- 70 -
2. GRAIN AND OTHER VEGETABLE PRODUCTS (the producers)
2.1. Introduction
In general, plants are the primary recipients of radioactive
contamination to the food chain from the abiotic environment.
Vegetation may be subject to direct and indirect contamination
(Ru66a). In the case of terrestrial vegetation, direct con
tamination implies an uptake of radioactive debris from the
atmosphere by the above-ground parts of plants. Indirect conta
mination is a sorption of debris from the soil by the root
system of plants. Aquatic plants are contaminated by contact
with radioactive water and sediments (Lo71). Sea weed on the
surface may receive direct contamination from the atmosphere.
Whereas all radionuclides may be taken up by vegetation as a
result of direct contamination, relatively few are of relevance 90 as regards root uptake. Among these, Sr is the most important,
because it continues to enter the food chain many years after 90 its deposition; and this is the main reason why Sr is of
foremost interest in radioecology. The radionuclides that occur
both in a soluble form and also translocate within the plants
are of special interest as direct contaminants, because they
may concentrate in parts of the plants which have not themselves
been exposed to direct contamination. This feature may be very
important for the radionuclide concentrations in cereal grain,
and thus it has been examined in a number of field experiments
(VI, VII, VIII, Aa72b) described in the present study.
Vegetable products are an important constituent of the human
diet; in Denmark the daily per capita consumption is approx.
0.7 kg, which equals the consumption of animal products. Some
products are used directly for human consumption, such as cereal
grains, vegetables, and fruit. But plants may also play an
indirect part in the intake of radionuclides from foods. The
concentration of radionuclides in grass and beets thus plays

- 71 -
an important role in the radionuclide content of cows' milk,
while the presence of radioactive debris in a vegetation cover,
such as lichen, strongly influences the radioactive contamination
of reindeer meat.
2.2. Cereal cjrain
Oe* vai åta dtitiat ude pi landet; Summet time'. Huw (ovetij it iraj cut <n det val Sammen'. Koinet itod auutt, the countttf, uiith the utheat s tanding Havnen g i » n . ijet(cu>, tie oati g:ezn.
PEN GRIMME E L L I N G THE UGIV VUCKIIHO
Studies of fallout nuclides in the Danish diet have revealed
that cereal products, especially rye bread, play an essential
part in the radioactive contamination of the diet. When grain
is contaminated by radioactive fallout, the importance of direct
contamination is greater than that of the indirect. The outer
parts of the grain therefore carry the major share of the
contamination. Whole-grain flour (100% extraction) consequently
shows higher concentrations of fallout radioactivity than flour
made of the inner parts of the grain only. Hence, rye bread
made of 100% extraction flour contains more radioactivity than,
e.g., white bread of 70% extraction flour. As the preference in
most western countries is for white bread rather than dark rye
bread, grain products are relatively more important for the
radioactivity content of the Danish diet, which does contain
rye bread, than for the diet elswhere. The present study has
therefore emphasized cereals.
The first UNSCEAR report (Un58) summarized the earliest mea-90 surements of Sr in grain. The samples were rice and wheat
collected in Japan, the USSR and the USA in 1956. The first 90 systematic study of Sr in rye, barley, wheat and oats was
carried out in 1959 in Denmark (RRD59). Extensive studies of 137 on
Cs as well as Sr in wheat and in milled wheat were per
formed in Canada on samples from the crop years 1957-1959
(Gr60). Since 1958 UNSCEAR has occasionally (Un62, Un69)
published summaries of worldwide studies of fallout nuclides
in grain and grain products.

- 72 -
2.2.1. Variation with time, species and location
Radionuclide concentrations in cereal grain have varied with
time, species and location as appears from figs. 2.2.1.1-2.2.1.4
(cf. also tables B.2.2.1.-B.2.2.5.}j the time variation was the
most pronounced (tables B.2.2.7.-B.2.2.8.). The variability
9
8
7 in t 6 z Ui
> 4 t-
23 Ui a 2
1
0
YEARS * * *
14-L
2.0
1.5
1.0 -
0.5
LOCATIONS * * * 2.0 - SPECIES
l l i l U h . 4-60 62 64 66 68 70 72 74 Tyl Ødu JyrjTys
1.5 r.
1.0 i-
0.5 i-
Abeled Stu Ask Bio Vir Åki
Rye Wheat Barley Oats
Fig. 2.2.1.1. The variation of pCi 90Sr kg-1 in Danish cereal grain among years, locations (fig. A.1.1.3.1.) and species. The bars are the concentrations relative to the grand mean 77 pCi kg-1 {=- 1 at the relative scales) .
9
8
7 tn t 6 z => 5 ui > 4
?3 UI
* 2
1
0
YEARS * * *
i4-L
2-0 I- LOCATIONS * * * 2 0 *~ SPECIES * * - * '
1.5 H
1.0 -
0.5 -
11»111 I-U4-
1.5 L.
1.0 f-
0.5 K
60 62 64 66 68 70 72 74 Tyl lødu JyrfTys Stu Ask Bio Vir Åki
AbtJLed Rye Wheot Barley Oots
Flo. 2.2.1.2. The variation of pel ,0Sr <g Ca)"1 in Danish cereal grain among years, locations (fig. A.1.1.3.1.) and species. The bars are the concentrations relative to the grand mean 155 pel (9 Ca)'1 (- 1 at the relative scales), (cf. remarks to table 2.2.1.1.).

- 73 -
2.01-
£ 1.5 I-
1 £ 1.0
Ui K0.5 \-
0.0
YEARS *
62 64 66 68 70 72 74
t-
L0CATI0NS * * *
Tyl |Ødu JyrjTys JAbtjL«! StuAskBlaVir Aki
SPECIES** * ]
-
i — —
j
i Rye i Wheat!
Borley Oats
Flq. 2.2.1.3. The variation of stable Sr In Danish cereal
$rain aaon«; years, locations (fig. A. 1.1.3.1.) and species.
The bars are the levels relative to the grand m a n 2.6 ng
<g Ca)' 1 (« 1 at the relative scale).
9
8
7 -in £ 6 -z = > 5 -ui !
231-UJ or 2 (-
1
YEARS * * *
I I » I ' I I t • I
2.0 -
1.5
1.0
0.5
LOCATIONS * * * 2.0
1.5
1.0
0.5
SPECIES** *
62 64 66 68 70 72 74 Tyl Ødu JyrjTys AbeJLed Stu AskBlo Vir Åki
Ry* Wheat Borley Oats
Pig. 2.2.1.4. The variation of pCi 1 3 7C* kg-1 in Danish
cereal grain among years, locations (fig. A.1.1.3.1.) and
species. The bars are the concentrations relative to the
grand mean 192 pCi kg"1 (« 1 at the relative scales).
90 Sr. In the case of among years from 1959-1974 was 0.85 for 137
Cs it was even higher; from 1962-1974 it was thus 1.77 or raarly equal to the variability of precipitation observed in that period (1.3.). The time variability of 137Cs was greater
90 than for Sr because there is no moderating effect from root
uptake of Cs from the soil in Denmark. Rye and barley showed
higher variability among years than wheat and oats because the

- 74 -
former two species are more subject to direct contamination
than the latter two; this is partly due to morphological reasons
(greater surface of the ears because they have awns), and
partly to physiological reasons, viz., a greater root uptake of 90 Sr by wheat and oats. The various parts of the country showed
the same time variability. As expected, the variability among
years was highest in the high-fallout period 1962-1966. Although
the fallout rate and the accumulated fallout are the factors 90 137
chiefly responsible for the time variation of Sr (and Cs) in grain, other factors may also be of significance (Aa72a),
such as variation in grain yields from year to year, increasing
air pollution, alterations in agricultural practice, e.g.
switching fro:a using a reaper to using a combine harvester, and
growing different varieties of grain (D.2.2.I.).
As appears from table B.2.2.9. the variability among species was
higher for Pu (CV -„„„ice = 0.73) than for any of the other p species .^7 54
nuclides studied, i.e. Sr, Cs and Mn. This can be as
cribed to a combination of the morphology of the cereal crops
and the low solubility of Pu (IX). Strontium-90 showed a lower 137
variability among species than Cs, because the high suscep-90
tibility of rye and barley to direct contamination with Sr 90
was counteracted by a relatively high root uptake of Sr by 90
wheat and oats. In 1962-1966 the variability of Sr among
species was lower ir. Jutland than in the Islands; during 1967-
1972 the opposite was the case. The reason was that during the
high fallout period in 1962-1966, when direct contamination
prevailed, this domination was more pronounced in the soils
with high Ca of the Islands than in the more sandy soils of
90 Jutland. This resulted in a levelling of the Sr concentrations in the species from Jutland because, as mentioned above, wheat and oats are more sensitive to indirect contamination than rye and barley. During 1967-1972 when direct contamination was less dominant, the levelling effect of the remaining direct contamination was most effective in the Islands, because the indirect contamination of wheat and oats in Jutland
137 clearly prevailed at that time. In the case of Cs, as
expected, no evident trend was found between thp variability
among species from Jutland and the Islands because direct con-137 tamination dominated the uptake of Cs.

- 75 -
90 Before 1966, rye showed both highest Sr as well as highest 137
Cs concentrations (Aa66c). Throughout the entire period of 137 observation, the Cs concentration in rye was approx. 50 per
cent higher than in the other three species, which did not
differ significantly from one another. Since 1967, when direct 90 contamination became less important in case of Sr, oats have
90 -1 shown the highest and rye the lowest pCi Sr kg figures.
There may be several reasons why rye is more susceptible to
direct contamination than the other species; the two main ones
being the morphology ajid the precocity of rye. Rye crows taller
than the other species. The straw length is 120-130 cm, compared
with 100-120 an for wheat (Pe63) and even less for barley and
oats. The yield of rye is generally lower than of the other
species (Pe63, Lu71). Furthermore, the grain of rye is rela
tively small in size (Pe6 3) and the surface-to-volume ratio
consequently greater than for the other species. Finally, rye
carries awns whereas other Danish cereal crops, except barley,
are normally without awns. The ears of rye emerge by the end of
May, while the other species ear by the end of June. The 90
precocity of rye is of special relevance for Sr because the
important period for the direct contamination with this and
other nuclides not translocated within the plant is after ear
emergence (Mi59, VI, VIII).
Two important factors influence the local variation: the amount
of precipitation (fallout) and the agricultural conditions
(soil type, cultivation practice, etc.). In Jutland, the amounts
of precipitation, and hence of fallout, are approx. 20 per cent
higher than in eastern Denmark (table A.l.1.6.2.). Furthermore,
the soils of the experimental farms in Jutland are on the
average less fertile than those of farms in the east, and the
Ca coi.tent is lower. All these factors enhance the con-90
tamination of grain with"fallout Sr (Cham70, Aa72a, An67a),
especially at the sandy locations in Jutland (Studsgård and
St. Jyndevad). The stable Sr to Ca ratio is higher in samples
from the sandy stations, as illustrated in fig.D.2.2.1., which
indicates a relatively higher root uptake of Sr (Aa66c). As
appears from tables B.2.2.7. and B.2.2.8., the local variability
was more pronounced for 90Sr than for 137Cs (and for 54Mn and O 1 Q O A f\
' Pu as well (table B.2.2.9.)}. The relatively higher root 90
uptake of Sr in Jutland accentuated the local variations. In

- 76 -
90 the case of Sr, the local variability of rye was lower than 90 that of the other species because the Sr concentration in rye
depends relatively more on direct contamination than does the
concentration in other species, which means that the amplifying
effect on the local variability of root uptake is less evident
in rye. The local variability among the four stations in
Jutland: TYL, STU, ASK and JYN, was generally higher than the
local variability among the stations in the Islands: BLA, TYS,
ABE, LED and ÅKI. This was ascribed to differences in fallout
pattern as well as to variations in soil characteristics and
agricultural practice. In the case of Cs, the local
variability was close to that observed for precipitation (mCi 90 -2
Sr km , cf.1.3.) suggesting than the cereal grain was con
taminated by direct contamination only. During the low fallout 90 period 1967-1972 the local variability of Sr was higher than
in the high fallout period 1962-1966, because of the amplifying
effect of indirect contamination when the importance of direct
contamination decreased. As a whole, the local variability 90 of Sr increased throughout the period from approx. 0.3 in
1963-1965 to 0.6 in 1975-1976. In the case of 137Cs the
variability among locations was nearly constant until 1972, but
in recent years it has shown an increase, which may indicate
slight root uptake at the sandy locations in Jutland.
Table 2.2.1. Strontiun-90 (pCi ,0Sr (9 Ca)"1) in rye
and wheat collected in Jutland and the Islands in 1963
and 1973.
Year
1963
1973
1963
1973
Species
rye
wheat
rye
wheat
rye
wheat
Jutland
1357
993
S6
••
15. •
11.3
Islands
953
748
40
34
23.t
22.0
Jutland
Islands
1.42
1.33
2.15
2.59
1963 1.37 1.27 1973 nr«/wh..t 0 p M

- l i
the anovas of the grain data revealed significant interactions
between tine and species, between species and location, and
between location and time. Table 2.2.1. illustrates the 90 -1
interactions for pCi Sr (g Ca) . The years 1963 and 1973
were selected because the fallout rate as well as the accumu
lated fallout differed markedly between these years. In 1963
the fallout rate was high and the accumulated fallout relatively
low, whereas in 1973 the fallout rate was low and the accumulated
fallout relatively high. The interaction between years and
locations appeared as lower activity ratios between Jutland and
the Islands in 1963 than in 1973, due co the greater importance
of root uptake in 1973. The interaction between species and
years was manifested as higher activity ratios between rye and
wheat in 1963 than in 1973, which is explained by the fact that 90
root uptake of Sr was relatively more important for wheat
than for rye. The interaction between locations and species
manifested itself as higher ratios between the activities from
the two years for rye than for wheat, because the direct con
tamination played a greater role for rye than for wheat, which
was less susceptible to the fallout rate because of the stronger
influence from indirect contamination. Finally, the table also
displays the second-order interaction between years, locations
and species: The activity ratio between rye and wheat decreased
more in Jutland than in the Islands from 1963 to 1973 because
the relatively higher root uptake in 1973 influenced wheat more
than rye, and because root uptake played a greater role in
Jutland than in the Islands. It thus appears that the main 90
reason for the interactions observed for Sr in Danish cereal grain is variations in the relative importance of direct and
indirect contamination. These variations are influenced by
fallout rate, accumulated fallout, soil type, fertilizers
(An71), grain varieties, methods of harvesting, climate, and
other environmental factors.
90 As indirect contamination only plays a role in the case of Sr,
137 it was to be expected that the interactions for Cs in grain
were less evident. In fact the anovas showed that these
interactions were only significant in a few cases (cf.tables
B.2.2.3. and B.2.2.4.).

- 78 -
2.2.2. Prediction models 90
Tables C.2.2.1. - C.2.2.3. show the prediction models for Sr
in cereal grain. Estimates from previous models were compared
with the present ones in D.2.2.2.1. The radioecological
sensitivity of grain in Jutland was higher than that in the a« "117
Islands for Sr as well as for Cs (tables C.2.2.4. -
C.2.2.6.), although., as expected, it was less pronounced for
Cs because of the lack of root uptake (cf.2.2.1.). The
radioecological sensitivity of cereal grain for the entire
country may either be estimated directly, as shown in tables
C.2.2.3. and C.2.2.6., or it may be calculated from the figures
found for Jutland and the Islands. In the last case we have to
weight with the relative fallout and with the production of
grain in the respective parts of the country. This probably
yields a better estimate than that obtained from the total
country models because the production of grain species differs
in the different parts of the country. Table 2.2.2.1. shows the
various estimates for the entire country. The production
weighted models y. elded higher sensitivities than the un
weighted total country model except in the case of wheat,
because approximately 75% of the wheat was grown in the Islands
whereas the other species were most frequent in Jutland.
However, as the relative standard error of radioecological
sensitivities of grain was of the order of 10% (D.2.2.2.2), the
differences observed between the various estimates in table
2.2.2.1. are generally immaterial.
137 On a kg basis the cereal crops were more sensitive to Cs 90 than to Sr contamination, except for oats which showed a
90 higher sensitivity to Sr contamination due to the high root 90 uptake of Sr, especially in Jutland.
The prediction models for grain suggested that direct con
tamination played an important role for the radionuclide
content in cereals. SCOTT RUSSELL (Ru66a) has called attention
to the importance of so-called floral absorption in connection
with the contamination of cereal crops with nuclear debris.
Floral absorption is direct contaminarion during Inflorescence.
Experiments (VI, VIII) with direct contamination of cereal
crops by radiostrontium and radiocesium have shown that cesium

- 79 -
Summary of radioecological sensitivities (pCi kg- y per mCl km~ ) Table 2.3.2.1
In cereal grain from the entire country.
Species Nuclide Total country
modal
(tables C.2.2.3.
and C.2.2.6.)
Fallout-weighted Fallout- and
Jutland and production-
Islands model a) weighted Jutland
tnd Islands
model b)
Fye
Barley
Wheat
Oats
Rye
Barley
Wheat
Oats
'wSr m
m
m
137c,
m
m
at
32
26 24
37
46
32
28 27
(tables C.2.2.1. and C.2.2.4.)
27
25
23
37
45
31
30
27
29
29
20
43
48
34
25
29
-2 -2
a) 1 mCi km in Denmark corresponded to 1.113 mCi km in Jutland and
0.887 mCi km*3 in the Islands.
b) Jutland produced 2/3 of eh« rye and barley, 1/4 of the wheat and
3/4 of the oats grown in Denmark (Da 57-77).
The calculation of the radioecological sensitivities from the prediction 90 — y — 1 QA — 0
models assumed that 1 mCl Sr km y corresponded to 0.24 mCi Sr km
(July-Aug)"1 and 1 mCi l37Cs km"2 y"1 ~ 0.54 mCl 137Cs km"2 (May-Aug)"1.
These relations were the mean values observed since 1962 in Danish fallout.
is translocated to the grain to a far larger extent than
radiostrontium, and that for the levels found in the mature 90 grain the time of contamination is thus more important for Sr
137 than for Cs. Since 1967 a series of experiments (Aa72b, VI
VII, VIII) has been performed to investigate the direct con
tamination of cereal crops with various radionuclides. A study
has been made of the translocation of these nuclides and an
estimate of the so-called "normalized specific activity",
NSA, (Cham70) defined as: '(Ci kg dry weight of crop) • -1 -2 -1
(Ci d m of ground) . The NSA is analogous to the rate factor (cf.C.2.) in the prediction models: (pCi kg crop weight) • (mCi km"2 period"1)"1.
When all experimental data collected since 1967 are applied,
we obtain the NSA figures shown in table 2.2.2.2. It appears

- 80 -
Table i.2.2.2. A comparison between experimentally cod
empirically determined USA fievres for M S r and XJ7Cs in
c t m l grain. (MSA: (Ci ha-1) • <Ci d^m"2)-1)
Nuclide study Barley Nrnt
»°Sr •sp. 1.3 J 0.« (n * «) 1.) : 0.6 (n « 2)
eap. 2.1 • 0.2 (a - 5) 1.3 t 0.6 (n > 5)
cxp. S.2 t 1.0 (a - 5) 7.4 : 1.3 (n - 2} 1 3 7C.
asp. (.3 • 0.7 (a - Si S.4 t 0.3 (a • SI
The error tarm« ara 1 SE aatlaatad froa tha MSA values
froa single experiments and from individual state exper
imental fame for tha experimental and empirical values,
respectively. The n-valuaa indicate tha number of exper
iments and state experimental farms on which are based
the experimental and empirical means, respectively. As the
experiments uere all performed at Rise, the means of the
five state experimental farms for the Islands were used
in th. empirical estimates of the MSA valuest t-tests between the empirical and the experimental values revealed
•to significant difference between the two sets except in
the case of Sr in barley, where the experimental KSA was
probably (p « 0.02) lower than the empirical.
The empirical values In the table differed a little from
those estimated from tables C.2.2.1. and C.2.2.4., because
the former were estimated from individual prediction
•odels for each farm.
that the values for Sr found experimentally were approximately
half those determined empirically, MIDDLETON et al. (Mid63)
found a similar ratio between experiments and survey data. The
experimental NSA figures for Cs were higher for wheat but a
little lower for barley than the empirical NSA. Thus the
experimentally determined NSA values were generally a little
lower than the empirical. This should be recalled if the
experimental data are applied for prediction purposes in con-90 137
nection with other nuclides than Sr and Cs (cf.2.2.3.).
However, the experimental NSA values may give the correct
answer within a factor of approximately two.
2.2.3. Manganese-64 in cereal grain
During 1963-1965 54Mn was determined in Danish cereal grain (Aa66c, RRD63, RRD64, RRD65), and it was observed that the con
tamination of the grain was direct and not, as suggested by
SUTTON and KELLY (Su66), indirect. These two authors base

- 81 -
t h e i r conclus ions on the fact that the « n / s t a b l e Mn r a t i o s were nearly constant in d i f f e r e n t m i l l i n g f rac t ions of US wheat
grown in 1963. However, as has been experimental ly shewn (VI, VIII) , Mn deposi ted d i r e c t l y en the crops i s trans located
within the p l a n t s , and the Mn from d i r e c t depos i t i on may thus
fo l low the s t a b l e nanganese d i s t r i b u t i o n in the croos . The anova of Mn in cerea l grain ( table B . 2 . 2 . 5 . ) showed s i g n i f i c a n t
main e f f e c t s , but no i n t e r a c t i o n s . The time v a r i a t i o n was snost 54
pronounced. The Kn concentrat ions in c e r e a l grain thus decreased by a factor of approx. 30 frora 1963 to 196 5 c o r r e sponding to an e f f e c t i v e h a l f - l i f e of 0.4 y , which was i d e n t i c a l
to the e f f e c t i v e h a l f - l i f e observed in a i r samples ( 1 . 2 . 5 . ) .
The loca l v a r i a b i l i t y ( tab le B . 2 . 2 . 9 . ) was s i m i l a r to that of 137
Cs (table B.2.2.8.). As regarded the variation among species, lye showed the highest levels (as also observed for 'cs) but
54 the variability among species was less pronounced for Mn; oats 54
thus contained nearly as much Mn as rve.
As both the anova ar.d the expericents on direct contamination
of grain indicated that Cs and Mn behaved similarly in 54 cereal grain, the prediction models for Mn were assuined to be
similar to those for Cs, i.e. the concentrations in grain
were proportional to the fallout rates in May-August. However,
the total deposition from harvest to harvest, i.e. fron
September to August in the following year, in some cases fitted
the data better (table C.2.2.7.). The radioecological
sensitivities for Mn were on the average 3/4 of those found
for Cs, which was compatible with a less pronounced
translocation of Mn as compared with Cs (VI, VIII). The
experimentally determined NSA values were 2.2 + 0.8 (r. = 2) and
2.9+0.2 (n * 2) for barley and wheat, respectively. Although
these values were lower than those found empirically ( 6 + 1 and
5 + 1 (n - 5), they were not significantly different from them
(cf.2.2.2.).
The infinite time exposure integral of Danish grain was 54 -1 54 -2
estimated at 25 pCi Mn kg y per mCi Mn km , or (according
to (1.2.5.)) as 54 MCi 54Mn resulted in 149 pCi 54Nn w"3 y -••
148 pCi 54Mn l"1 y ^ 93 mCi 54Mn km"2 (1.3.2.), then 1 MCi 54Mn

- 82 -
released in a megaton test in the northern hemisphere would 54 -1
yield 44 pCi Mn kg y in Danish average cereal grain. The 137 137 -1
corresponding figure for Cs was 150 pCi Cs kg y per MCi Cs, and for Sr it was 130 pCi Sr kg" y per MCi 90,,
Sr.
2.2.4. Strontium-89 in cereal grain 89
During the high-fallout periods in 1962 and 1963 Sr was
present in Danish grain samples. An anova revealed no significant
variations among species and the data concerning the various
species were consequently pooled before the estimation of the
NSA. The fallout rates during July-August 1962 and 1963 were DO _ 0 _"|
156 and 302 pCi Sr m d , respectively (RRD62, RRD63) . On 89
this basis, and from the Sr concentrations in the grain, the oq _i on _-y
NSA was estimated at 5.5 + 1.3 pCi Sr kg d per pCi Sr m . 89 54
The NSA for Sr in grain was thus close to that found for Mn 13 7 90 89
and Cs, but higher than that for Sr, because Sr is sup-90
posed to be attached to greater particles than is Sr (I, II).
Strontium-89 does not play any important role in the con
tamination of cereal products because the time elapsing between
harvest and consumption normally reduces the concentrations of
this nuclide to insignificant levels as it has a short half-
life (50.5 d) . Thus, the relatively high NSA in grain does
not manifest itself as a high radioecological sensitivity of 89
the diet to Sr contamination.
2.3. Bread
0g dtn v.ae hzntix Hvidtbled og Kiingle.1 And they get ui'iite bizad hoi dzn andtn, hoi gemmed Had Smagen, and biicuiti {torn each otkti; hoi othti bidit. people'i hood taitei but.
HOLGER VAHiKE HOLGtK THE PANE
In Denmark rye bread is made of rye flour (100% extraction) and
white bread of wheat flour (75% extraction). The grain ufied for
the flour does not necessarily come from the area of the
country in which the bread is consumed. Furthermore, the flour
may not originate from the last harvest. Finally, small

- 83 -
quantities (of the order of 1% (Da57-77)) of the wheat and rye
used in the production of bread usually come from abroad. The
main purpose of our bread measurements was therefore to
elucidate to what extent the cereal grain discussed in the
preceding section represents the actual intake of radionuclides
from cereal produce.
2.3.1. Variation with time, location and species 90
The ratios between the radionuclide cor. entrations (pCi Sr
kg and pCi Cs kg- ) in bread collected in June of a given
year and the corresponding concentrations in grain from the
previous harvest were analyzed by anovas for the period 1962-
197 3. It was assumed that bread from June was manufactured
only from grain grown in the previous year and that all bread
was made of locally grown grain. All anovas showed a significant
time variation; the ratios were thus in general low when the
grain activity levels were relatively high, while high ratios
appeared when the grain levels were low. This resulted mainly
from the fact that the bread samples had also been prepared
from grain older than that of the previous harvest. The local
variations were significant too. The ratios from the Islands
generally exceeded those from Jutland, because of the transfer
of rye from Jutland to make rye bread in the Islands and of
wheat from the Islands to make white bread in Jutland (Da57-77). 90 137 As both Sr and Cs concentrations were lower in grain from
the Islands than from Jutland, the bread/grain activity ratios
showed the observed tendency. The anovas finally indicated
significant interactions between years and locations, which
were among other things ascribed to a changing pattern in the
time of the transfer of grain, and thus of activity to the
bread, from one part of the country to another. From the
beginning of the sixties to the start ot the seventies Jutland
has thus shown a decreasing relative contribution to the total
production of wheat as well as rye in Denmark (Da57-77).
The mean ratios between the activity concentrations in the bread 90 and in the corresponding grain were 0.75 for Sr in rye bread,
90 1 T 7
0.18 for Sr in white bread, 0.75 for i0/Cs in rye bread and 137 0.40 for Cs in white bread. These ratios were calculated

- 84 -
»/> t 3 z LJ
> 2 < _i LU CE 4
MONTHS * * *
II »I I »
1.5
1.0
0.5
I
LOCATIONS * * *
J D J D J D J D J D J O J O J D J D J D J D J D J D 62 63 64 65 66 67 68 69 70 71 72 73 U
n iv YivniVcph
Flg. 2.3.1.1. 90 —1
The variation of pel Sr kg in Danish rye
bread collected in June and December 1962-1974 (cf. table
A.1.2.3.) In the 8 zones and in Copenhagen (cf. figs.
A.1.4.2.1. and A.1.4.2.2.). The bars show the concentrations
relative to the grand mean 83 pCl kg
scales).
•1 (• 1 at the relative
»-z 3 => UJ
< _ i in <r
M O N T H S * * * 1.5
1.0 -
0.5
111 I I I « i l l I
LOCATIONS * * *
D J D J D J D J O J D J O J O J 0 J 0 J 0 J D 63 64 65 66 67 68 69 70 71 72 73 U
II IV VI YTlFcph
fig. 2.3.1.2. 137 -1
The variation of pCl Cs kg in Danish rye
bread collected in June and Member 1963-1974 (cf. table
A.1.2.3.) in the 8 tones and in Copenhagen (cf. figs. A.1.4.2.1.
and A.1.4.2.2.). The bars show the concentrations relative
to the grand mean 239 pCi kg (• 1 at the relative scales).

- 85 -
L -
t 3 z LU
> 2
il II
MONTHS * * * 1.5
1.0 -
0.5
l l l l l l l l l l I I 1
LOCATIONS
J D J D J D J D J D J D J D J D J D J D J D J D J D 62 63 64 65 66 67 68 69 70 71 72 73 74
II IY YIYIII^Cph
90 -1 Fig. 2.3.1.3. The variation of pCi Sr kg in Danish white
bread collected in June and December 1962-1974 (cf. table
A.1.2.3.) in the 8 zones »nd in Copenhagen (cf. figs. A.1.4.2.1.
and A.1.4.2.2.). The bars show the concentrations relative
to the errand mean 13.7 pCi kg (= 1 at the relative scales).
t 3 z
> 2
ui
MONTHS * * * 1.5
1.0 -
0.5 -
I . I I • • • I I
LOCATIONS
II IY YIYIIlWph 0 J 0 J 0 J D J D J D J D J D J D J D J D J 0 63 64 65 66 67 68 69 70 71 72 73 74
Plq. 2.3.1.4. The variation of pCi 137Cs kg-1 in Danish white
bread collected In June and December 1963-1974 (cf. table
A.1.2.3.) in the 8 tones and in Copenhagen (cf. fig. A.1.4.2.1.
and A.1.4.2.2.). The bars show the concentrations relative
to the grand mean 75 pel kg'1 (» 1 at the relative scales).

- 86 -
for the period 1962-1973 for 9°Sr and for 1964-1973 for 137Cs
under the assumption that approx. 2/3 of the rye used for rye
bread and 1/4 of the wheat used for white bread were grown in
Jutland (Da57-77). The theoretical ratios between broad and
grain were 0.74, 0.15, 0.74, and 0.37, respectively. These
theoretical ratios were based on the assumption that 1 kg flour
yielded 1.35 kg bread (Da68), and that the Sr and Cs con
centrations in flour used for rye bread contained all the
activity of the whole grain (100% extraction), while the white
bread flour (75% extraction) contained 20% and 50%, respectively,
of the concentrations in the whole grain (RRD60, RRD64). The 90 figure of 20% for Sr in wheat flour was determined at a time
when direct contamination was dominant. Since about one third
of the stable Sr is found in white flour (70% extraction) (Un69),
it was to be expected that the percentage would increase from
20% towards 33% as the indirect contamination became relatively
more important. This would result in an increasing ratio 90
between Sr concentrations in bread and in grain from 0.15 to
0.24. Thus we may expect a ratio higher than 0.15 for the
entire period, as also observed, and for the long-term
situation with decreasing fallout rate we may further expect a
ratio approaching 0.24.
An evident result of the transfer of grain from one part of the
country to another is the obliterating of the local variation
of the activity concentrations of the bread samples (table
B.2.3.1. and figs.2.3.1.1.-2.3.1.4.). Although wheat from 90 117
Jutland tnus showed higher Sr as well as Cs concentrations
than wheat from the Islands, the white bread did not show any
significant local variation. In the case of rye bread, the 90 137
lccal variability of Sr and Cs was 0.13 and 0.12, respectively, as compared with 0.28 and 0.21 for rye (tables B.2.2.7 and B.2.2.8.).
From December 1963 to December 1965 Danish bread samples were 54
also analyzed for Mn (RRD63, RRD64, RRD65). The mean ratio 54
between the Mn concentrations in rye bread and rye was 0.77,
i.e. in agreement with the theoretical values of 0.74. For
wheat and white bread, the mean ratio was 0.09, indicating that 54
the Mn concentration of th<=» flour was approx. 10-15% of that

- 87 -
of the v/hole grain. In their study of milling products of
Kansas wheat, SUTTON and KELLY (Su66) found that the 54Mn con
centration of wheat flour (extraction rate 0-69%) was 10% of
the concentration of the whole grain, i.e. in agreement with 54
the above estimate. We may thus conclude that Mn is concentrated in the outer parts of the grain to a greater extent
90 n 7 54
than are both Sr and ~ Cs. As far as contamination by Mn
is concerned, the consumption of rye bread (100% extraction)
is thus much more important than that of white bread. The
consumption of rye bread was in fact the main reason why the 54 Danish diet contained measurable concentrations of Mn during
1963-1965.
Since 1964 rye bread and white bread have been collected in
June and December in the Faroes. Anovas of the ratios between 90
the radionuclide Sr concentrations found in Faroese and in
Danish bread did not show any significant variation with time
or with bread type. The mean ratios were 0.5 for rye bread and 137 0.6 for white bread. In the case of ^ Cs, Faroese bread also
contained less activity than the Danish bread. The mean ratios
were 0.6 and 0.9 for rye and white bread, respectively, and
the two ratios differed significantly from each other. The
lower concentrations in Faroese bread partly resulted from a
lower extraction flour used for the rye bread (light rye
bread), and partly from the importation of flour from countries
other than Denmark, e.g. the U.K. Less than half of the grain
imported to the Faroes comes in fact from Denmark (Da70). The
foreign flour may in general have contained less activity than
the Danish flour, and furthermore the Cs/ Sr ratio may
have been greater in the foreign flour due to root uptake of
Cs in the foreign cereals. This woi:ld explain the relatively 13?
high mean ratio found between the Cs concentrations in 90 Faroese and Danish white bread as compared to Sr. Thf» lower
90 137 Sr and Cs concentrations' in Faroese brsad imply a
correction of the estimates of the intakes of the two radio
nuclides with the total Faroese diet (RPF62-76) . For cereal
products, these estimates have been based on Danish grain data,
which has involved an overestimate of the intake.
Since April 1958 creta praeparata (CaCO^) has been added to

- 83 -
Danish flour. The mean contents were 3.07+0.52 (1 SD) g Ca
kg~ rye bread (244 determinations) and 2.07 + 0.37 g Ca kg_±
white bread (236 data) in the period 1960-1975. According to a
Government notice of July 29, 1957, (Da68), the contents should
be .ipprox. 3 g Ca kg rye bread and 1.5 g Ca kg" white bread.
As the natural Ca content (" 0.3 g Ca kg" bread) was included
in the measurements, the white bread apparently contained a
little more of riie creta praeparata than recommended, while rye
bread or: the average contained a little less. There rfas no time
trend in the Ca concentrations of the bread, but it appeared
that the Ca content of white bread from Lolland-Falster was 25%
higher than in white bread from West Jutland. Milk is often
used in the manufacture of bread (Da68), and this may explain
the observed variations of the calcium levels.
Faroese bread contained approx. half as much Ca as Danish, viz.
1.72 + 0.73 (1 SD) g Ca kg-1 rye bread (25 data) and 0.99 + 0.48
g Ca kg white bread (25 data) during 1964-1975. In some cases 90 -1 the pCi Sr (g Ca) levels may thus be higher in Faroese
90 -1 bread than in Danish, although the pCi Sr kg levels were
generally lower in Faroese bread.
2.3.2. Prediction models and relations
As the radionuclide concentrations in bread were not strictly
proportional to the concentrations in grain, prediction models
were obviously calculated from the bread data. The transfer
factors from grain to bread were estimated from tables C.2.3.1. 90 and 2.2.2.1. For Sr in rye bread, the factor was 0.79, for
Cs: 0.79; in the case of white bread, 0.21 of the Sr and 137 0.40 of the Cs were transferred from the wheat to the bread.
These estimates were in agreement with the theoretical values
mentioned above. It appeared that Danish bread was more sensitive
to environmental contamination with Cs than with ' Sr, which 137 is partly a result of the greater sensitivity of grain to Cs
contamination (table 2.2.2.1.), and partly of the greater 137 translocation of Cs within the grain.
Although the Faroese bread was not made solely from Danish
grain, its concentrations may be related to the Danish fallout

- 89 -
data as shown in table C.2.3.1. The ratios between the radio-
ecological sensitivities of Faroese and Danish bread were 0.62
in the case of rye bread and 0.86 for white bread (for both
Sr and Cs) •. The ratio for Sr between Faroese and Danish
white bread was higher than found by the measurements made
hitherto (2.3.1.) because the soil factor in the models carried
a relatively heavy weight when the infinite time integrals were
calculated. As the soil factors for Danish and Faroese white 90 bread were nearly identical, the Faroese Sr bread levels
would have to approach the Danish.
2.3.3. Other grain products
Oat grits have been collected regularly through the years and
analyzed for Sr and Cs. From the prediction models for
grits (table C.2.3.1. Nos. 10 and 11) and from table 2.2.2.1.
(last column) , the transfer factor from oats to grits was
estimated at 0.33 for 90Sr and 0.45 for 137Cs. In the cal-90 137 culations of the Sr and Cs concentrations in grits from
90 oats (RRD59-76), the transfer factors 0.4 and 0.75 for Sr
137 and Cs, respectively, have been used hitherto. Hence, the 137 estimates of Cs in grits have been 67% too high and estimates
90 of Sr 20% too high. The calcium content in grits, which also
contained creta praeparata, was measured at 3.3 + 0.2 g Ca kg
(1 SD) (RRD59-76).
Rice was also analyzed for Sr and Cs, but the data were
too few and scattered to calculate any prediction models. The
concentrations of Sr and Cs in polished rice were in
general very low. The infinite time integrated levels for the
period up to 1975 were estimated to be of the order of 1 pCi —1 —2 90 137
kg y per mCi km for Sr as well as for Cs. As there was no information on deposition from the area where the rice
90 —2 was grown, the Danish data for deposition of 73 mCi Sr km during 1950-197 5 was used in ti.e estimate.

- 90 -
2.4. Grass and other fodder crops
Han iCttttdt itg t* St*± «4 5***«tta« eg fc««9 rfe« u*de* tt ite\t Skxapptbttd, »i k**dt dtt ikkt xtqnt på ktndt;
TOMME USE
Skt fi-i-k biidti ft j * m ,xnd piait/J htfitd a btd. »Inc* »if ittmj unrftt a tatgt d^ek-itjtt, >•• a: ts be .-uf »•< tht *a«H.
THUHStltHA
2.4.1. Grass
Grass is a useful collector of direct radioactive contamination
because its large surface-to-volume ratio retains nuclear
debris with good efficiency, and because it is generally easy
to obtain. Furthermore, because it is an important constituent
of cattle fodder, and thus influences the radioactivity con
centrations encountered in cows* milk and in beef, grass was
included right from the start in the fallout measurements
carried out at Risø (He56-57). The first UNSCEAR report (Un58)
presented some of the earliest results of Sr and Cs
determinations on grass and hay collected in 1954-1957 in the
U.S. and the U.K.
The samples in the present study were collected throughout the
year at Risø and during the grazing period at the state
experimental farms. In the Faroes and Greenland, grass was 90
obtained during the summer (cf.fig.2.4.1.). The higher Sr
concentrations in Faroese grass were partly explained by the
higher fallout levels in the Faroes, partly by the higher
direct contamination of the Faroese pastures because of their
lower productivity (Cham70), and partly by the higher indirect
contamination, which is due among other things to the lower
Ca content (Mi60) of Faroese soil. The last two reasons for
the enhanced levels also apply to grass samples from Greenland.
The variability among years (table B.2.4.1.) was generally
higher for Denmark than for the Faroes and Greenland, because
direct contamination of grass was more important in Denmark.
In the case of Cs, the indirect contamination on the soils
rich in organic matter (Fr63, Ba64) played an imp rtant role
for the Faroese and Greenlandic grass samples, whereas the root 137 uptake of Cs from the mineral-rich Danish soils was a
on
secondary factor. The local variability of Sr in Danish grass was similar to that observed for precipitation (0.22 against
90 0.18) suggesting the indirect contamination of grass with Sr
to be proportional to the direct contamination and thus rela-

- 9i -
tively unaffected by the type of soil; this was in the period
1962-1970, in 1977 (PJ-.077), however, the local variability was
0.32 showing the increasing importance of root uptake. 137 Cs, 90.
however, showed a higher variability among locations than "Sr;
this may be due to indirect Cs contamination of grass at some
locations, while others rely on direct contamination only.
* V2 -
u
u a »' I-
XJ1
» ' 1 ! 1 1 — I 1 1 1 1 1 1 1 T
a Greenland v The Faroes O Denmark • Rise
V-o
j i • •
65 70 YEAR
75
Pi«. 2.4.1. The medians of th« *°Sr and 137"* levels in
Danish, Faroes« and Greenlandlc "sumer $rass* collected
Kay-Octcher since 19*2 (cf. table A.1.2.4.).
90
An anova of all Sr data on Danish grass showed a significant
variation with time and location. Throughout the years, the
highest Sr concentrations normally occurred in the first
quarter of the year just before the maximum fallout levels
normally appeared. This apparent pecularity was due to the
rapid increase in growth rate of the grass in the second
quarter of the year. The sudden increase in the productivity
of the pastures was tantamount to a reduced susceptibility to

- 92 -
direct contamination (Cham70) and an enhanced field loss*) of
deposited activity (Chad70). Although the fallout rate thus
increased, the net result was decreasing grass concentrations
of fallout nuclides.
The radioecological sensitivity of sumrcer grass (table C.2.4.1.)
was 31 pCi ^Sr (g Ca)"1 y (or 38 pCi 90Sr kg"1 y) per mCi 90£r
km (D.2.4.1.) in Denmark. The corresponding values for the
Faroes and Greenland were 216 (or 268) and 442 (or 548),
respectively. The Faroese and Greenlandic grass was thus nearly 90
7 and 14 tines more sensitive to contamination with Sr than 137 Danish grass. In the case of Cs, the radioecological
sensitivity (table C.2.4.2.) of Danish grass was 5.1 pCi 137Cs
(g K)" 1 y (or 24 pCi 137Cs kg"1 y) per raCi 137Cs tan-2. In
th© grass from the Faroes and Greenland, the corresponding
values were 76 (or 524) and 79 (or 352), respectively. The
radioecological sensitivities estimated for Greenlandic grass
were approximate as the data were scarce; especially the
estimates of the pCi kg sensitivities were uncertain, because
the Ca and K concentrations in the Greenlandic (and Faroese)
samples showed great variations (cf.D.2.4.1.). The radio
ecological sensitivities of Faroese and Greenlandic grass may
thus be nearly similar (cf. also the observations for sheep,
3.4.3.) .
The normalized specific activity (NSA) was calculated for the 90 —1 90
Danish grass samples: 45 pCi Sr kg ,, „ . . „ , per pCi Sr -2 -1 137 -I lQry matter/.-- __ _.
m d and 20 pCi iJ/Cs kg (<Jry roatter) per pCi 1J/Cs m d \
CHAMBERLAIN (Cham70) and ERIKSSON (Er77) auoted similar values
for summer grass. CHAMBERLAIN found that winter grass showed
2-3 times higher NSA values, which is also in agreement with
the observations in table C.2.4.1. (Nos.l, 2 and 3) where the
ratio between the radioecological sensitivities of winter grass
and summer grass was 2.3.
2.4.2, Fodder crops other than grass
Besides grass, the main constituents of Danish cattle fodder
*) Field loss is the loss of activity from crops due to reasons
other than radioactive decay.

Tabla 2.4.2. Tranafar factora for '°Sr and 137Ca In cattla faad. (Poddar claaa 5 ~ 11 k9 * U k d"1
(4.25« fat) i faad unlta)*).(»r 49).
P « ko'1 daya par »Cl km'3
Nlntar plan No 16
Nlntar (.Ian No 1
Nlntar plan No 46
Nlntar
plan No 31
SllMMr
plan No S
Wsr 1 J 7 C .
kg d"1
par cow
(faad unlta)
kg d"1
par cow
(faad unlta)
kg d"1
par cow
(faad unlta)
kg d"1
par cow
(faad unit«)
kg d"1
par cow (faad unlta)
Graaa
and hay
(aa fraah)
14030
• 760
5.5
11)
-
33
(6)
-
44
(•)
Koota
lit dry
Mittar
4941
292
45
(4.5)
25
(2.5)
20
(2)
i 7
(5.5)
Laavaa
of
roota
(allaaa)
40515
4191
12
(1)
60 (6.5)
-
-
-
Straw
95063
22995
2
(0.
1
(~0>
-
4
(1)
Barlay
(concan-
trataa)
9506
11498
2
S) (2)
-
1
(1)
2.4
(2.4)
1
(1)
Total
pci ,0«r par
cow par
mCi ,c8r km"2
1.00 • lo6
2.S5 • 10S
0.S1 • 106
C.68 • 10É
0.41 . 10b
inrakas 117 pTi ' "cm par
cow per 117 - 2 mCi ' ru km *
1.H1 • 10S
2,82 • IC5
•\.(>t. • 10^
1.16 ' \05
1.07 • 10 5
Tna milk production corraapondad to that in the middla of thu purlod 1962-1974. At prvnant (1979) Danish cow« produce appro«, 11 kg milk d and the fnddnr rt«w.s in corrnapondlngly hlqher.

- 94 -
are roots, root leaves (silage), straw and concentrates (mostly
barley grain) (Br€9). The sampling of roots, leaves and straw
has not been systematic, and prediction models for these items
were consequently partly based on related samples. Tables
C.2.4.3. and C.2.4.4. show the models estimated.
Based on the fodder mixtures recommended for Danish cows (Br69),
the infinite time-integrated intakes of Sr and Cs with
cattle feed were estimated as shown in table 2.4.2. The intakes
were calculated for an a\eiago milk yield of 11 kg y (4.25% on
fat) (Da57-77). It appeared that the highest Sr intakes
originate from fodder rich in silage and the lowest from grass
diets. As regarded Cs, grass diets yield a two to three
times higher intake than root diets. The Cs/ Sr ratio of
the grass and hay diet was higher than in the root and silage
diet. These variations influenced the local and seasonal
variations of Sr and Cs concentrations in Danish milk
(cf.3.2.1.).
2.5. Vegetables and fruit
5«« kumdt 4t %**. *( 4*t ve\ m •[<.» S.- t'mttt .•{ csu'.it tktu ccuid ttt (kat f.t tif P f t « r f t ( l l C , i* «!«« $\tn*t* dt tuvr •tatln ir*> a Pumctiy. 6»c»u»,' ykt k*a i*tt tkt Nflt ta i lCt »9 ét tøvt Hit 1 Juan i Vt(*<l pr* -nik I f in.-uj« tke twtmtn matfitiit i **d hmvdt mMiktt flttm. t'r» trnttn <f.ifiji-bfi>.
*tl*VSl$SlH MA ttTlH THC rtlHCtSS A « TM PfA
After cereals and milk products, vegetables and fruit have been 90 the most important Sr donors in the Danish diet. This group
contributed 17 + 6% (1 SD) to the total Sr intake» with 137 ~ respect to Cs, the contribution was 10 + 3%. During periods
with a high fallout rate, such as 1962-1964, the relative con-on 137
tributions of Sr and Cs from vegetables and fruit were
lower than when the accumulated fallout was hijh compared to
the fallout rate (X).
The first samples of vegetables for Sr and Cs analysis
were collected in 1956 (Un58) in the United Kingdom, the United
States and in Japan. Danish investigations of radioactive con
tamination in vegetables began in 1959. Since then potatoes,
white cabbage, carrots and apples have been collected regularly

- 95 -
throughout the years from all parts of the country. In I960,
1962 and 1966 nearly all species of Danish fruit and vegetables
were sampled.
2.5.1. Variations with time, location and species 90 The time variation for Sr in vegetables has in general been
less pronounced than in grain and grass. Potatoes, cabbage and 90 carrots have thus all shown relatively slowly decreasing Sr
concentrations since the maximum years of 1963-1964 ; by 1975
the levels in these products were approx. two-thirds of the
maximum (fig.2.5.1.1.). The variability among years (table
B.2.5.3.) was approx. 0.2 (1962-1974) or similar to that 90
observed for Sr in soil.
90 Compared to this, Sr in grain and in grass showed variabilities
of 0.8 and 1.0, respectively, in the same period. This clearly
demonstrates the relatively strong dependence of vegetables on Q0 the accumulated " Sr in the soil. The surfaces of grass and
grain exposed to direct contamination are much greater per
weight unit than that of the vegetables mentioned above and
this enhances direct contamination and with it the time
variability of grain and grass. In the case of potatoes and
carrots, the edible parts are furthermore hidden below the
soil surface, which thus provides an additional protection
against direct contamination. Vegetables with a relatively
large above-soil surface, such as kale, depend to a greater
degree on direct contamination than, e.g., cabbage. From 1963
to 1976 the 90S:
factor of four.
90 to 1976 the Sr concentration in kale thus decreased by a
90 In apples, the Sr concentration was closely related to the
fallout rate. From 1963 to the first half of the seventies the
levels thus decreased by a factor of approx. 15 (CV v e a r s =
0.99).
137 The Cs concentrations in vegetables and fruits varied
primarily with the fallout rate. The concentrations in cabbage,
potatoes and carrots all decreased by an order of magnitude
from 1963 to the fi^st half of the seventies (fig.2.5.1.2.).
The variability among years was 1.0-1.6 for these products

- 96 -
1.5
«/>
=> 1.0 UJ
>
g 0.5
0.0
T E A R S * * « LOCATIONS * * *
60 65 70 Tyl Stu Jyn Tys Lad Ak ØduAskBIa Vir Abe
90 -1 The variation of pCl Sr kg in potatoes
Pig. 2.5.1.1
collected In 1959-1974 at the atate experimental farms
(fig. A.1.1.3.1.). The bars Indicate the concentrations
relative to the grand nean 3.1 pCi kg (• 1 at the relative
scale).
in
z 3
% UJ
5 -
4 -
2 2
YEARS * * *
inil!
2.0
1.5
1.0
0.5
III
LOCATIONS * * *
65 70 Jut. Isl.
Fife The variation of pCi Cs kg" in potatoes 2.5.1.2.
collected in 1963-1974 at the scate experimental farms in
Jutland and the Islands (fig. A.1.1.3.1.). The bars show
the concentrations relative to the grand mean 19 pCl kg
(« 1 at the relative scale).
90, (table B.2.5.2.), i.e., significantly higher than for "wSr.
Apples showed an annual variability of 1.32 during 1963-1974,
In a special study carried out in 1962 and 1963 (RRD62, RRD63)
the large basal leaves of brussels sprouts plants were 90 137, collected and analyzed for ' Sr, XJ'Cs and stable Sr during the

- 97 -
3 -
</>
^ 2 -
ui CC
iU
SFEPES* * * .. LOCATIONS * * * Y E A R S * * *
Ui 2 4. 6 8 10 12 II IY YI YHI 60 62 64 66
qn —i Flg. 2.5.1.3. The variation of pCi Sr kg in leaf
vegetables collected in 1960-1966 in the 8 zones (cf. table
A.1.2.5.2.). The bars show the concentrations relative to
the grand mean 23 nCi kg- (= 1 at t^- relative scale) .
The species were: 1: white cabbage, 2: spring cabbage,
3: red cabbage, 4: kale, 5: cauliflower, 6: cucumber,
7: peas, 8: beans, 9: lettuce, 10: spinach, 11: parsley,
12: brussels sprouts.
3h
z =>2 h >
UJ
cr
SPECIES * * .. LOCATIONS * * * YEARS***
II 2 4 6 8 10 12 II IY YI YIII 60 62 64 66
Fig. 2.5.I.*. The variation of pCi 90Sr (g Ca)" 1 in leaf
vegetables collected in 1960-1966 in the 8 zones (cf. table
A.1.2.5.2.). The bats show the concentrations relative to the
grand mean 30 pCi (g Ca)'1 (» 1 at the relative scale).
For identification of the species, cf. caotion to fig. 2.5.1.3.
growing season from six locations distributed throughout
Denmark (fig.2.5.1.11.). The study showed that within the
growing season, i.e. from June to December, there was only a 90
probably significant difference between the monthly Sr levels
(CV i.u - 0.10). The concentrations in December were thus p month probably higher than those of the other months. However, the
stable Sr to calcium ratio in the leaves showed a highly
significant seasonal variation (CV m o n th ~ 0.25), and so did

- 98 -
the 137 Cs concentrations (C~/ _ = 0.24). The highest con-
p month centrations of stable Sr were found in mid summer, the lowest 89 90
(approx. half the summer levels) in winter. The Sr/ Sr ratio 90
in the leaves indicated that about 1/4 of the Sr came from
direct contamination in 1962-1963 and 3/4 from root uptake from
the soil. The studies of grass (2.4) show that winter grass is
more sensitive to direct contamination than suirjr.er grass. If the
same applies to the leaves of brussels sprouts, we may expect
relatively higher direct contamination during the winter than 137 in the summer, as also observed for Cs and to some degree
90 for Sr. If, however, the Sr/Ca guotient from indirect contamination is lower during the winter, as indicated by the
90 stable Sr/Ca guotient, the winter Sr levels may be observed
2 L 6 8 10 12 II IV YIYIII
Fla. 2.5.1.ft. The variation of stable Sr in leaf vegetables
shown in figs. 2.5.1.3. and 2.5.1.4. The bars show the concen
trations relative to the grand mean 2.9 mg (g Ca)" 1 (= 1 at the
relative scale). For identification of the species see caption
to fig. 2.5.1.3.
3 -W»
= 2 -
lli or
ii
SPECIES** .. LOCATIONS
J l
YEARS**
2 6 6 8 10 12 II IY YIYIII 60 62 64 66
Fl«. 2 . 5 . 1 . 6 . Tn» variation of pCl 137C« kg"1 in leaf vegetables collected in 1963-19C« in the 8 cones (ef.
table A.I.2.S.2.). The bars show the concentrations relativ«
to the grand Mean 27 pCi kg*1 (> 1 at the relative scale).
For identification of the species, cf. caption to fig. 2.S.I.).

- 99 -
3 h
z r> ui2f-
UJ 1 CC
SPECIES*** LOCATIONS*** YEARS***
li II IY YIYIH 60 62 64, 66
Fig. 2.5.1.7. 90 -1
Tne variation of pCi Sr kg in root vegetables collected in 1959-19(6 in the 8 zones (cf. table
A.1.2.5.2.). The bars show the concentrations relative to
the grand mean 14.4 pCi kg (» 1 at the relative scale).
The species were: 1: potatoes, 2: carrots, 3: onion, 4: leek,
5: beetroot, 6: celeriac.
L O C A T I O N S * * * Y E A R S * * *
11 2 4 6 II IY YIYIII 60 62 64 66
90 -1
Fig. 2.5.1.8. The variation of pCi ,wSr (g Ca) x in root
vegetables collected in 1959-1966 in the 8 zones (cf.
table A.1.2.5.2.). The bars show the concentrations relative
to the grand mean 54 pCi (g Ca)" (» 1 at the relative
scale). For identification of the species, cf. caption to
fig. 2.5.1.7.
to increase less rapidly during the winter months than expected
solely from the direct contamination.
As regards the local variation in vegetable.«*, and fruit, Jutland 90
showed generally higher Sr concentrations than the Islands
(figs.2.5.1.3, 2.5.1.4, 2.5.1.7 and 2.5.1.8.). The local
variability was 0.17 for cabbage and potatoes, and 0.33 for
carrots. Grass showed a local variability of 0.22 and grain of
"o 0.4. In the study of brussels sprouts the local variability 90
of Sr was 0.31, the two stations in Jutland showing 1.8

- 100 -
times the mean concentration in the Islands. The difference in
soil characteristics between the stations in Jutland and in 90
the Islands enhanced the difference between the local Sr
concentrations in the leaves of brussels sprouts. As was the 90
c*se for the tine variation of Sr in leaves of brussel sprouts,
the local variation may also have been reduced because the
stable Sr to Ca ratios in the leaves were to some degree
inversely related to the fallout rate, i.e. the highest mg Sr/g
Ca quotients were found in the Islands (fig.2.5.1.12; cf. also
figs.2.5.1.5 and 2.5.1.9.). As regards the local variation of 137
the Cs concentrations in root vegetables (fig.2.5.1.10.),
Jutland showed higher levels than those of the Islands
^cvp locations ~ °»24)» while leaf vegetables including peas.
3h i
S ! UJ
» -
UJ tr.
S P E C I E S * *
llll
L O C A T I O N S * * *
mil 2 4 6 n IV YIYffl
riq. 2.5.1.«. The variation of stabl* Sr in root vegetable* shown in figs. 2.5.1.7. and 2.5.1.*. The bars show the concentrations relative to the grand Mean 4.6 mq (g Ca)" 1 (» 1 at the relative scales).
«/>
i2 -
ui 1
S P E C I E S * * * LOCATIONS*
li
Y E A R S * * *
1 2 4 6 n IY in Yni 60 62 64 66
fig. 2.5.1.10. TIM variation of pel 137C» kg'1 in root vegetables collected in 19*3-1get in the • sones (cf. table A.I.2.5.2.) . The bars show the concentrations relative to the grand swan 2« pCi kg"1 (- 1 at the relative scale). For identification of the species, cf. caption to fig. 2.5.1.7.

- 1 C 1 -
l/l
l 2
YEARS MONTHS*
6263 j A S O N O
r- —! LOCATIONS * i
-i
lniii JUi Ho Bta Si
Sp Vir Vo
fl«. 2.5.1.11. The variation of pCi *°Sr (« C«)"1 in lHnt
of Brussels sprout plants collcctod nonthly (July-Oecenber)
(ef. tablo a.1.2.5.2.) at t •xperinaatal fans (cf. fis.
A.1.2.S.2.) dwrina. 1M2-1M3. Th* bars show th* lavals r«la-
ti va to th* eraad
scala).
37 pCi (« Ca> (-1 at tha relativ«
rig. 2.5.1.12. Th* variation of stabl« Sr in th« brussels
sprout leaves shown in fie. 2.5.1.11. Th* bars show the
levels relativ* to tha arand nean 2.4 ag (a Ca) <« 1 at
th* relative scale).
beans and cucumbers showed a local variability of only 0.11 13/
(fig.2.5.1.6.). This suggested some root uptake of Cs from
the soils in Jutland. ANDERSEN (An67a) found that root crops 137
tended to accumulate more Cs than other crops; root crops
may thus show a greater local variability than leaf vegetables. 90 137
Anovas of the Sr and Cs levels in fruit (apples and soft
fruit) showed no significant local variations, although the
concentrations found in Jutland generally seemed to be a little
higher than those in th~ Islands.
The interspecific variations of radionuclide concentrations
depend upon the morphology and the physiology of the plants.
Morphology plays an important role in direct contamination and

physiology in indirect contamination. ANDERSEN (An67a) studied
the indirect contamination of Danish vegetables; he found that 89
the Sr/Ca ratio decreased from root to top, because plants
were able to discriminate against Sr relative to Ca during the 89
translocation of thes^ elements within the plants; the Sr/Ca
ratios in leaves were approx. two-thirds of those in roots. In
agreement herewith the present study showed that the stable
Sr to Ca mean quotient in green leaf vegetables was approx.
two-thirds of the quotient found in root vegetables.
ANDERSEN furthermore observed that the root uptake of Sr by
different plant species was related to Ca uptake, i.e., a high
Ca uptake was tantamount to a relatively high Sr root uptake. 90 -1
As regards the Sr concentrations (pCi kg fresh weight) in
leaf vegetables, kale and spinach showed the highest levels
due to their high Ca concentrations (figs.2.5.1.3. and 2.5.1.4.).
The calcium levels in root vegetables and fruit were generally 90 lower, consequently the Sr content per kg of vegetables and 90 -1 fruit was lower tco. The pCi Sr (g Ca) ratios showed less
variation among different species as well as within the same
species than the pCi kg figures. The variability among root 90 -1
vegetables (table B.2.5.3.) was thus 0.89 for pCi Sr kg but 90 -1
0.23 for pCi Sr (g Ca) only, and for leaf vegetables the
corresponding values were 0.88 and 0.24, respectively. The
higher variation of the pCi kg figures within a single species
resulted mainly from the varying water content of the samples.
However, this variation also occurs when the products are used
for consumption, and it is thus not pertinent to relate the
activity levels to the dry matter consent. It is notable that 90
the Sr levels in vegetables were more dependent upon the Ca
content of the crops than was the case for grain (cf.figs. 90
2.2.1.1. and 2.2.1.2.), because root uptake of Sr is more
important for vegetables than for grain.
The Cs concentrations also varied among species, but the
variability among species was less than the corresponding 90 90
variability for Sr (cf.table B.2.5.3.) because Sr was in-137
fluenced not only by direct contamination, as Cs was primarily, but also by indirect contamination and this enhanced

- 103 -
90 the interspecific differences fo~ Sr. The variability among
species was nearly twice as high for the pCi Cs kg figures
than for the Cs (g K)~ ratios. Analogous to Sr and
calcium, the Cs concentrations in vegetables were thus
influenced by the congener, potassium, in such a way that high
concentrations of the congener were tantamount to enhanced
concentrations of the radionuclide. With respect to tree fruit
such as apples, pears and plums, the Cs levels were signifi-90 -1
cantly greater than the Sr concentration (pCi kg figures).
This was contrary to the observations for most vegetables and
soft fruit. Tree fruit were primarily contaminated by direct
contamination, but whereas Cs was translocated from other 90 parts of the tree to the fruit, this was not the case for Sr.
Consequently, the Cs concentration in apples became greater 90
than the Sr concentration, because the "effective area" 137
exposed to direct contamination was greatest for Cs.
The anovas showed significant interactions between years and
locations for leaf vegetables both for Sr and for Cs. For 90 root vegetables, this interaction was significant for Sr
only. The interaction between species and locations was 90 significant for Sr in root vegetables only. Interactions
were to be expected due to the varying contributions from
direct and indirect contamination (cf. grain, table 2.2.1.).
2.5.2. Prediction models
For cabbage, carrots, potatoes and apples, the prediction models 90 137 were calculated for Sr and Cs both per kg and per g of
the congeners Ca and K, respectively (tables C.2.5.1. -90
C.2.5.4.). With respect to Sr, Jutland did not show higher
radioecological sensitivity than the Islands except in the case
of carrots; however, the correlation between observed and
calculated values was poor for carrots from the Islands. 137
Potatoes from Jutland were probably more sensitive to Cs
contamination than potatoes from the Islands, which suggests a
slight "root" uptake from the soils in Jutland.
Vegetables were in general more sensitive to contamination with
°Sr than with Cs (pCi kg"1)* cabbage and carrots thus

- 10< -
showed a 5-6 times higher sensitivity to the former nuclide.
Potatoes, however, were approx. 1.5 times more sensitive to
Cs than to Sr, while apples showed a radioecological
sensitivity to Cs that was approx. 3 times higher than that 90
observed for Sr.
Table C.2.5.5. gives prediction models for some less frequently
sampled vegetables and fruit. Kale was the species most 90 sensitive to radioactive contamination with Sr as well as
with Cs - primarily because of its large surface and the
subsequent susceptibility to direct contamination. As compared
with grain and grass, vegetables and fruit were in general 137 less sensitive to contamination. The transfer factors for Cs
in grain and grass were thus an order of magnitude higher than
those f<
higher.
90 those for vegetables, and the Sr factors were 2-3 times
It appeared that the correlations between observed and cal
culated pCi kg" figures generally were superior to those of
the pCi 90Sr (g Ca)"1 and pCi 137Cs (g K ) _ 1 quotients. This
suggested that possible variations in the water content of
the samples were less important than the analytical errors
involved in the Ca and K determinations.
2.5.3. Iodine in green leaf vegetables
In the western diet vegetables and fruit have been of minor
importance as a source of I as compared with fresh milk
(Ga66). Measurements have therefore been few. After a Chinese
atmospheric test explosion in October 1976 (RRD76), a sample
of cabbage, one of brussels sprouts and five of kale were 131 collected in Zealand and measured for I, as both fresh and 131 cooked samples. Cabbage contained no I, brussels sprouts
contained 31 pCi 131I kg"1 and kale 127 pCi 131I kg"1 (median
84 pCi kg ). The cooked kale samples contained on the average 131 74% of the I found in the fresn samples. As expected, kale
with its large surface was the most sensitive of the samples
to contamination. From precipitation data, the transfer factor
for 131I in kale was estimated at 5-10 pCi 131I y • kg"1 per 131 -2 mCi I km , i.e., an order of magnitude more sensitive than
milk but an order of magnitude less sensitive than grass for

- 105 -
which the transfer factor in 1976 was estimated at 50 pCi I
y kg~ per mCi I taa~ . As the annual mean consumption per
caput of kale was 0.7 kg only, while the consumption of milk
was 164 kg y"1 (table D.4.2.I.), the contribution of 131I from
vegetables was of the order of one tenth of that of milk
(cf.3.2.3.).
2.5.4. Imported vegetable products
Denmark is almost self-sufficient as regards foodstuffs, but a
few products are imported. Among these, tea and coffee con
tributed to the 90Sr and 137Cs content of the diet with
(1.9 + 1.2)% (1 SD) and (4.3 + 2.5)%, respectively. Citrus
fruit (oranges, lemons, grapefruit) and bananas constituted
1/4-1/3 by weight of the total fruit consumption in Denmark
(RRD62), but imported fruit was in genera, of minor importance 9 0 "l in
as a source of Sr and Cs in the diet; the mean contribution
from citrus fruit and bananas to the total intakes of these
radionuclides was (1.3 + 1.1)% and (0.6 + 0.4)%, respectively.
For the period 1963-1976 the mean contents of Sr and Cs
in coffee were 10 and 44 pCi kg" , and for tea 45 and 259 pCi
kg" , respectively. Tea thus contained levels approx. five
times higher than those found in coffee. The concentrations
were those actually extracted into the liquid coffee and tea,
the activity remaining in coffee grounds and used tea leaves
was thus excluded. One litre of water required 20 g tea or 50 g
coffee (Da68), thus the liquid tea contained approx. twice as
high concentrations of Sr and Cs than the liquid coffee. 90 137
Neither the Sr nor the Cs showed significant variations
with time, but the concentrations were in general higher in the
first half of the sixties; this was especially evident for tea. 137
Citrus fruit sampled during 1963-1976 showed decreasing ..Cs
concentrations from approx. 25 to 3 pCi kg ana nearly constant 90 -1
Sr levels at about 8 pCi kg j bananas contained similar
Cs concentrations but the Sr mean level was only 1.5 pCi
kg"1.
In dried fruit (raisins, dates, prunes and figs) the levels

- 106 -
decreased from approx. 100 pCi 'C~ kg~ in 1?64 to approx. —1 90 -1
10 pCi kg in 1972, and from approx. 20 to 10 pCi Sr kg .
The levels in nuts (almonds, walnuts, hazelnuts) decreased
from approx. 500 pCi 137Cs kg"1 to 50 pCi kg"1, and the Sr
levels were around 50 pCi kg" during 1964-1972. Brazil nuts 90
contained 7 tines sore Sr than other nuts, compatible with a high stable Sr content in the Brazil nut of approx. 55 mg Sr
kg , or 30 nsg Sr (g Ca)~ . The ability to concentrate Sr as
well as Ra (Ha58a) is connected to the content of polysaccharides
in Brazil nuts. Brown algae also contain polysaccharides and
they show a similar affinity to Sr (cf.2.7.1.).
It was not possible to propose meaningful prediction models
for imported foods because the origin of the samples was
unknown.
2.5.5. Faroese potatoes
A total area of approx. 1 km grows potatoes in the Faroes and
the annual production was approx. 1500 ts (Ri72) during the
period of observation (table A.1.2.5.1.). The cultivation of
other vegetables and fruit is of minor importance (Da58, Ka50),
and most fruit and vegetables consumed in the Faroes are thus
imported.
The variability among years of the Sr as well as of the Cs
concentrations in Faroese potatoes was 0.44. In comparison, 90 Danish potatoes showed a variability of 0.15 for Sr and of
137 1.13 for Cs. The Faroese data thus indicated a strong 137 dependence on accumulated fallout in the case of Cs, contrary
to the Danish observations. Casium-137 in Faroese Bulk from
Tverå showed a low variability among years similar to that of
the potatoes (cf.3.3.1.). The ability of potatoes to accumulate 137
Cs from Faroese soil makes potatoes one of the important 137
Cs donors in the Faroese diet, as they contribute 21 + 121 157
(1 SD) of the total Faroese Cs diet intake. The relative
contribution from potatoes has been highest in recent years
when the fallout rate has been low. As compared to the con
centrations found in Danish potatoes during 1962-1976, Faroese
potatoes contained 3.8+1.9 (1 SD) times more ^Sr and 43 + 30
times more 13 Cs* the lowest 137Cs ratios between the two

- 107 -
countries occurred in 1963-1964 when there were high fallout
rates.
The prediction models for Faroese potatoes (tables C.2.5.1. -
C.2.5.4.) indicated a radioecological sensitivity of 2.8 pCi 90 -1 9 0 - 2
Sr kg y per mCi Sr km , or a little greater than that
of Danish potatoes. For Cs the sensitivity was 44 pCi Cs
kg y per mCi Cs km" , or approx. 12 times higher than
that of Danish potatoes; the radioecological sensitivities of
grass (2.4.1.) and milk (3.2.2 and 3.3.2) from the two countries
showed similar ratios, the sensitivity of grass being approx.
15 times and that of milk approx. 10 times higher in the
Faroes.
The infinite time-integrated levels in Faroese potatoes
originating from the Sr and Cs hitherto deposited in the
Faroes became 426 pCi Sr kg y and 10.7 nCi Cs kg" y.
2.6. Lichen
Og iaa &lei Kemdytet a&tted ovet Bujfee And the teindeet tlete aunaq acton ttubble og Stubbe, gjennim den Stole Skov, ovet and sctub, thtough the length o& the &oteit, Uoiet og Steppet att hvad det hunde. oven bagi and ptai.t4.ei, a* bait at he could go.
SHtVKONHIHGtH THE SNOW O.UEEN
Lichens are long-lived (50-100 years) duplicate organisms
composed of fungi and alyae. As growths with persistent aerial
parts and relatively large surface-to-weight ratios, lichens
are likely to be effective accumulators of radioactive debris.
Radioactivity measurements of lichens began in the late fifties
(Go58, RRD58-59). It was, however, first when LIDEN in 1961 137
(Li61) drew attention to the Cs contamination of the arctic
food chain - lichen-re J.ndeer-man - that lichen became an object
of primary radioecological interest.
In Greenland, reindeer live on the west coast, and they are most
abundant in the district around Sukkertoppen (V171). Since the
beginning of the sixties samples of lichens have been obtained 90
from the west coast of Greenland and measured for Sr and 137
Cs. Lichens have also been collected from other parts of
Greenland, but these samples have not been considered in the
present context.

- 108 -
2.6.1. Variation with time and location
The samples chiefly consisted of Cladonia species; Cetraria and
Alectoria species were, however, also found in most samples.
The samples received suggested that they had been .collected
from the upper part of the lichen carpet and thus corresponded
to the lichen layer normally grazed by reindeer; but the ex?ct
sampling depth was not reported. The Sr and Cs con
centrations in the lichen samples did not show significant local
variations; fig.2.6.1.1. and fig. 2.6.1.2. suggest decreasing
levels v/ith time but the differences among years were not 137
significant. The J-"Cs levels in 1962 were, however, probably
lower than those in the remaining period.
90 The variability of Sr among years (0.41) was probably higher
Cs (0.27) (table B.2.6.1.) which is compatible an Sr in lichen being higher than that
than that of 137
with the field loss of 137 137, of """""Cs (Ne66). The low variability of """"Cs was typical for
samples related to the accumulated deposit; however, the con
tamination of lichen was not indirect but direct and the low 137 variability was thus due to the long residence time of Cs
in the lichen. The local variability of lichen from west
Greenland was lower than that of grass (2.4.1.), due to the
75 GodtWb Sukkertoppen
Hoisteir.sborg Egedesminde
KU. 2.6,1.1. The variation ox nCl vSr kg * in lichen collected in 1962-1975 in Greenland (cf. f ig. A . l .1 .3 .3 . ) . The but« show the concentrations relative to the grand mean 5.4 nCi kg"1 <- 1 at the relative scale).

- 109 -
75 Godthåb Sukkertoppen
Holsteinsborg Egedesminde
r i g . 2 . 6 . 1 . 2 . The variation of nCi 1 3 7Cs kg"1 in l ichen co l l ec ted in 1962-1975 in Greenland. The bars show the concentrations re lat ive to the grand mean 25 nCl leg (» 1 at the re la t ive s c a l e ) .
negligible radionuclide uptake from the soil in the case of
lichen.
The most comprehensive studies of radionuclides in lichens
have been carried out by PERSSON (Per7(n and MATTSSON (Ma72)
in Northern Sweden and by HANSON in Alaska (Han73). In the 90 Swedish studies the annual mean Sr levels varied between 5
-1 13 7 and 13 nCi kg and the Cs levels between 16 and 50 nCi
kg during 1962-1970. For the same period, the Alaskan
averages were 7.4 nCi 90Sr kg"1 and 26 nCi 137Cs kg"1 The 90 137
Sr and Cs concentrations in lichens were thus similar in
Alaska, Lapland and Greenland. This was also expected from the
similar fallout rates for the three territories, all of which are situated in the 60-70°N latitude belt. A more detailed
137 90 inspection of the data showed that the Cs/ Sr ratios of
the Alaskan lichen samples were in general lower than those of
the Swedish and Greenlandic samples. This was because the
Alatfkan samples included the whole biomass, while the Green-
landic and Swedish samples only included the top layer of the 137 90 plants. The Swedish studies have revealed decreasing Cs/ Sr
ratios down through the lichen layer. Consequently, the Alaskan 90
samples should contain relatively more Sr than the other samples.

- 110 -
90 137 The effective half-lives of Sr and Cs in lichen have also
been studied. MATTSSON thus estimated an effective half-life 137 of 8-14 years for Cs in undisturbed carpets of Cladonia
alpestris, but in lichen carpets grazed by reindeer the half-life
was only 5-6 years. HANSON concluded that an effective half-life 137 of more than 10 years was reasonable for Cs in lichens. In
137 fig.2.6.1.2. the half-life of Cs in West Greenland lichen
during 1964-1975 is estimated at 14 years. PERSSON estimated 90
the effective half-life of Sr in the lichen carpet at 2.5 +
0.8 years, and for lichen podetia HANSON experimentally found
effective half-lives of 1.0 - 1.6 years and in field studies 90
approx. 3 years. The Sr in West Greenland, lichen did not seem
to decay in accordance with such short half-lives. The slope
of the regression lira corresponded to an effective half-life 90 of 11 years. It should, however, be noted that the Sr levels
in lichen samples are rather sensitive to the sampling depth;
as the Greenland samples were less well defined in this respect
than the Swedish and Alaskan samples, it may be too early to
draw any definite conclusions, although the period of observation
in the present material was extended by five years as compared
to the other two studies.
2.6.2. Prediction models 90
It was not possible to obtain empirical models for the Sr
concentrations in Greenland lichen for which the predicted
values were significantly correlated with the observed values. 90 -1
The best fit showed a transfer factor of 1.6 nCi Sr kg y 90 -2
lichen per mCi Sr km deposited (table C.2.6.I.), and the
estimated total infinite exposure integral in South-West 90 -?
Greenland from an estimated mean deposition of 55 mCi Sr km *
(the estimated mean deposition at Godthåb, cf.O.3.4.4.) was
88 nCi 90Sr kg'1 y.
137 In the case of Cs in lichen, the radioecological sensitivity
117 -1 137 -2 was 17.6 nCi J",/Cs kg x y per mCi Cs km' . The total infinite
137 -2 137*
exposure integral from 88 mCi Cs km became 1550 nCi Cs
kg~ y. The above transfer factors suggest that lichen was
approx. an order of magnitude more sensitive to contamination
with 137Cs than with 90Sr. NEVSTRUEVA et al. (Ne66) have
experimentally shown that lichen concentrates ten times more

- Ill -
Cs than Sr, when it was immersed in a water solution of the
two nuclides. As compared with Greenland grass, lichen was 137
approx. 50 times more sensitive to contamination with Cs 90
and approx. 3 times more sensitive to Sr. NEVSTRUEVA et al.
found that the upper parts of lichen contained 50-100 times 137 more Cs than contained in annual grasses.
The radioecological sensitivity of lichen is thus exceptionally
high, and it is evident that links subsequent to lichen in the
food chain are also expected to display high radioecological
sensitivities.
2.7. Sea plants
Paa din op&kylltdi Tang laae ettive On the maihed-up ieaa'^J lay eleven uthitt hvidt Svantijtl; iuian- ieathtti .
VI VILVl SVAHIK J Hl VUP SWANS
Phytoplankton concentrates several radionuclides from water
and may thus be used as an indicator organism for radioactive
contamination of the aquatic environment. Normally, sea plants
are not part of the human food chain, but the well known
porphyra-laverbread-man pathway of the Irish sea that trans
ferred Ru from the Windscale reprocessing plant to Welsh
population groups is an exception (He76, Fo71). Among fission 90 products, Sr is especially concentrated by brown algae, and
90 Sr concentrations in sea water may thus be monitored by
90 measuring the Sr levels in sea plants.
Since 1957 samples of seaweed (Zostera marina), which is a
higher plant, and bladderwrack (Fucus vesiculosus). which is
a brown algae, have been collected every half-year from
Roskilde Fjord.
2.7.1. Variation with timef species and location 90
Anovas showed a highly significant variation in the Sr concentrations with time (fig.2.7.1.). The variability among years (table B.2.7.1.) was 0.64 for both species, i.e. higher than in sea water, which feature was ascribed to direct contamination through rain water when the sea plants were found

- 112 -
70 75 Fucus vesiculosa*-1
Zostera morina
The variation of pCi 90Sr (9 Ca)" 1 in sea plants Fig. 2.7.1.
collected in 1959-1975 in Xoskllde Fjord (cf. figs. A.l.1.5.
and A.1.2.4.). The bars show the levels relative to the
grand mean 9.9 pCi {9 Ca)" 1 (- 1 at the relative scales).
on the surface; the shallow water in Roskilde Fjord may have
enhanced the direct contamination. The maximum occurred in
1965 and since then the levels have generally decreased; at 90 the beginning of the seventies the Sr concentrations were
thus approx. 1/3 of the maximum. There was no significant 90
difference between the Sr concentrations in sea plants from
the various seasons of the year, although the summer levels
tended to be higher than the winter concentrations, which was
the general trend also shown by Danish sea water (fig.1.5.1.)
90 -1 The pCi Sr (g Ca) levels in Fucus vesiculosus were 2-3
times higher than in Zostera marina, and there was no signifi
cant interaction between species and sampling years. In a 90
study of the interspecific variation in Sr concentration in

- 113 -
sea plants (RRD61), it appeared that the Sr (g Ca) ratios
were correlated with the stable Sr to Ca ratio of the plants.
The stable Sr to Ca ratio in Fucus vesiculosus was thus 3
tines higher than in Zostera marina (RRD59-76), and Fucus
serratus and Laminaria digitata contained approx. twice as
high mg Sr (g Ca) levels than Fucus vesiculosus, vhile
Furcellaria fastigiata (a red algae) only contained approx. 1/4
of the levels found in Fucus vesiculosus (RRD61). Brown algae
and especially Fucus serratus and Laminaria digitata thus
concentrate Sr from sea water. As compared to the rag Sr (g Ca)
ratios in sea water, these two species contained 4 times higher
ratios Uian the water (Pet62), i.e. they preferred Sr 4 times
as much as Ca. It has been shown that alginates rich in
guluronic acid have a greater affinity with Sr in the ion-
exchange reaction strontium-calcium (Ha67). Because brown
algae in particular, such as Laminaria, are relatively rich in
guluronic acid this explains why these species concentrate Sr
in preference to Ca from sea water.
Brown algae - mainly Laminaria and Fucus species - have alsc 90
been obtained from Faroese and Greenlandic waters. The Sr
concentrations in these samples were generally lower than in
the corresponding Danish samples, as expected from the lower 90 Sr levels in Faroese and Greenlandic sea water (1.5.2.).
90 However, the sea plants contained relatively more Sr than 90 the low Sr concentrations in Faroese and Greenlandic waters might have suggested. This was partly because the samples taken
consisted of Laminaria and Fucus serratus, which as shown
above concentrate Sr more effectively than Fucus vesiculosus.
However, the most important reason for the enhanced levels was
undoubtedly direct contamination through precipitation of the
plants occurring on the surface. This method of exposure was
relatively more important in the low activity Faroese and
Greenlandic waters.
2.7.2* Relations and prediction models
Fucus vesiculosus contains approx. 10 g Ca per kg wet weight,
the dry matter content being 20%. As the stable Sr content is
approx. 30 mg Sr (g Ca)" , (RRD59-76) 1 kg bladderwrack (wet

- 114 -
weight) contains 300 mg Sr. The concentration of Sr measured
in the Sound is 2.4 mg Sr 1~ (salinity 13.4£)(Pet62), hence
the expected concentration factor (CF) between bladderwrack
and sea water becomes 125, i.e. 1 kg bladderwrack at equilibrium
is supposed to contain the amount of Sr present in 125 1 of
sea water.
The prediction models for sea plants (table C.2.7.1.) show that
the radioecological sensitivity was 2.7 for Zostera marina and QO -1 90 -2
10.7 pCi y Sr (g Ca) y per mCi Sr km for Fucus vesiculosus;
the higher sensitivity for Fucus was in agreement with the
higher mg Sr (g Ca) quotient in this species. When the Fucus
value was combined with the radioecological sensitivity for
Danish sea watei (1.5.1.), the transfer factor from sea water
to Fucus vesiculosus was estimated at T n'-m ~ 306 ?Ci
Sr kg y per pCi Sr 1 y. This value was higher than that estimated for stable Sr above because, as mentioned above,
90 the direct contamination with Sr came into play for the 90 airborne fallout " Sr. In the case of a pure waterborne 90 release of Sr a closer agreement would have been expected
between the radioactive and the stable Sr CF.
The sampling of sea plants in the Faroes and in Greenland was
less systematic than in Denmark. The prediction models (table
C.2.7.1.) showed radioecological sensitivities lower than for
Fucus in Denmark. In the Faroes the transfer factor was
estimated at 1.2 pCi 90Sr (g Ca)" 1 y per mCi 90Sr km"2 and in *
West Greenland at 5.6. As compared with sea water (1.5.2.), the
transfer was 38 pCi 90Sr (g Ca)" 1 . y per pCi 90Sr l"1 y in
the Faroes and 24 in West Greenland, as compared with 30 in
Denmark for Fucus. Considering instead the "observed ratios" 90 -1 between the pCi Sr (g Ca) quotients in sea plants and in
sea water, these become 16 for the Faroes, 8 for Greenland
and 6 for Denmark, which demonstrates the relatively greater
importance of direct contamination in the low activity waters.

- 115 -
2.8. Conclusions
2.6.1. General
Apart from the influence of radionuclide concentrations in the
abiotic environment on the radioactive contamination of
vegetation, environmental factors such as climate, soil type
and agricultural practice also play an important modifying role.
These factors affect the radioecological sensitivity as well
as the variability of the radionuclide levels in vegetation.
Crops with a large surface-to-weight ratio and slow growth show
in general higher direct contamination than plants of an
opposite nature. Indirect contamination is an important pathway 90
for Sr in many vegetables. In the Faroes indirect contamina-137
tion is mainly responsible for the enhanced 'Cs levels in
vegetation. Lichen holds an exceptional position due to its
high radioecological sensitivity, especially to Cs con
tamination.
2.8.2. Cereal grain
The variability among years was greater for Cs than for 90Sr 137
in grain. In the case of J Cs, the variability (CV 1 p years 1.8) was similar to that in precipitation and air, in agreement
11? with expectations, because the Cs was derived from direct
contamination only. Rye and barley showed higher variabilities 90
among years for Sr (cv xroara = 1) than did wheat and oats
(CV y e a r s = 0.7) because of the higher indirect contamination
of the latter.
90 The variability among species was lower for Sr than for 137
Cs because indirect contamination counteracted direct 90
contamination in the case of Sr. Plutonium showed a marked interspecific variability, barley showing 5-6 times higher
concentrations than wheat.
90 The local variability was more pronounced for Sr (CV .
i-t-j Qn p locations « 0.4) than for 1J/Cs (CVp l o c a t i o n 8 - 0.2)» for
90Sr, it was

- 116 -
lower for rye than for the other species. This also reflected
the differences between the two nuclides and among species
with respect to indirect and direct contamination.
an _l
The radioecological sensitivities were 32 pci Sr kg y per 90 -2 mCi Sr km in the case of rye, 26 for barley, 24 for wheat
and 37 for oats; in the case of Cs the sensitivity was 46 137 -1 117 -2
pCi XJ,Cs kg y per mCi XJ/Cs km ' for rye, 32 for barley, 28
for wheat and 27 for oats. Jutland showed 1.4 and 1.2 times
higher radioecological sensitivities than the Islands regarding
Sr and Cs contamination, respectively.
Manganese-54 occurred in grain in 1963-1965; the radioecological 54 sensitivity of grain to Nn contamination was approx. 75%
137 of that of Cs, and the contamination was direct.
2.8.3. Bread 90 137
The local variability of Sr and Cs in Danish bread war
lower than that of grain because rye was transferred from
Jutland to the Islands, while the opposite was the case for
wheat. The mean ratios between the concentrations of the two
radionuclides in bread and grain were 0.75 for rye-bread - rye
for both nuclides, and in the case of white-bread - wheat 0.15
for Sr and 0.4 for Cs. Manganese-54 showed a ra*:io for rye
bread similar to that of * Sr and Cs, but the Mn con
centration in white bread was only 9% of the concentration in
wheat. Danish rye br^ad was thus an exceptionally important 54 source of Mn amons cereal products.
90 Faroese bread contained half as much Sr as Danish bread and
137 60-90% as much Cs, because the degree of extraction of
Faroese rye flour is less than that of Danish rye flour, and
also because more than half of the Faroese flour is imported
from countries other than Denmark. The creta praeparata in
Danish cereal products contributed nearly 40% of the total
calcium intake with the adult human diet. The amount of calcium
in bread varied within the country, bread from Lolland-Falster
thus contained more calcium than bread from West Jutland.
Bread from the Faroes contained half as much creta praeparata
as Danish bread.

- 117 -
2.8.4. Grass and other fodder crops QQ
The local variability of Sr in Danish grass {CV . . . » 90 P locations
0.2) was similar to that of the deposition of Sr, but Cs showed a higher local variability. In general, the first
90 quarter of the year displayed the highest Sr levels in grass.
The radioecological sensitivity of Danish grass was 31 pCi 90 ~1 90 —2
Sr (g Ca) y per mCi Sr km ; the value for Faroese grass
was 216, and for Greenlandic grass 442. In the case of Cs,
Danish grass had a sensitivity of 5 pCi Cs (g K) y per 137 -2
mCi Cs km , Faroese 76 and Greenlandic 79. The high sensitivities in the Faroes and Greenland were ascribed to the pronounced indirect contamination of grass in these areas.
The Cs/ Sr ratio of grass and hay was higher than that of
fodder from roots and silage of root leaves. This phenomenon
inf: 137.
90 influenced local as well as seasonal variations of Sr and
Cs in cows' milk in Denmark.
2.8.5. Vegetables and fruit
The variability among years of Sr in cabbage, carrots and
potatoes (CV y e a r s =0.2) was similar to that observed for the
accumulated fallout in soil, indicating a strong dependence on 137 indirect contamination. The variability of Cs, on the other
hand, (CV_ „„___ • 1.2) suggested direct contamination as the
main pathway. Apples displayed a relatively high variability 90 137
among years (CV y e a r s =1.1) for Sr as well as for Cs,
also an indication of direct contamination.
The local variabilities (CV . .. , = 0.2) were similar 90 137 p l o c a t i o n s on
for 'vSr and AJ,Cs and close to the variability of *uSr
deposition. The local variability of 9 Sr in vegetables was
lower than that observed in grain. Higher stable Sr/Ca ratios
in vegetables from the eastern part of the country suggested
enhanced indirect contamination at the low fallout stations,
which would reduce the local variability. 90 -1
Leaf vegetables showed higher pCi 7USr kg than root vegetables
because of a higher calcium content and greater direct con-

- 118 -
taniination. On the other hand, the stable Sr/Ca ratios in leaf
vegetables were two-thirds of those in roots, which suggested
enhanced indirect contamination of roots relative to leaf
vegetables.
The radioecological sensitivity of vegetables to contamination
with Sr was in general higher than that of Cs, except 137 for potatoes and apples, where the translocation of Cs
90 enhanced these levels relative to the less mobile Sr. The
radioecological sensitivity of vegetables was nearly the same
in Jutland and in the Islands.
The tadioecological sensitivity of Faroese potatoes was 44 pCi 137 -1 137 -2
Cs kg y per mCi Cs km , while Danish potatoes showed 90 a sensitivity of 3.8. In the case of Sr the radioecological
sensitivity was nearly the same for Danish and for Faroese 90 —1 90 -2
potatoes ( 2.7 pCi Sr kg y per mCi Sr km ).
Coffee, tea, and imported fruits contributed only a few per 90 137
cent to the total intakes of Sr and Cs.
2.8.6. Lichen 90 137
The variability of Sr and Cs among years (CV = 0.4
and 0.3, respectivexy) in Greenland lichen was relatively low
suggesting that the lichen retained the radionuclides and that
the field loss thus was low. The effective half-lives in the 137 Greenland lichen were estimated at 14 years for Cs and 11
90 years for Sr.
137 The radioecological sensitivity of lichen was 18 nCi Cs -1 137 -2
kg y per mCi Cs km , which was higher than observed for 90
any other sample in this study. The sensitivity to Sr was 137
approx. 10 times less than that of Cs.
2.8.7. Sea plants 90
The time variability of Sr in Fucus vesiculosus (a brown
algae) and in Zostera marina (a higher plant) (CV „_.__ * 0.6)
- 119 -
was higher than that observed in Danish inner waters, indicating
some direct contamination of the plants with rain water. Fucus 90 contained nearly 3 times more Sr/Ca than Zostera, in agreement
with the stable Sr/Ca ratios between the two species.
The "observed ratio" between brown algae and sea water was 4
for stable Sr/Ca, and the concentration factor between Fucus
and sea water was 125 (g Sr kg" fresh weight per g Sr l" sea 90 water), but for Sr the factor was 3o6 because of the direct
90 Sr contamination of the sea plants.
The radioecological sensitivity of Fucus from Roskilde Fjord 90 -1 90 -2
was 11 pCi Sr (g Ca) y per mCi Sr km and for Zostera it was 3. In the Faroes and Greenland the radioecological sensitivities of sea plants were lower than in Denmark, but
90 the transfer factors of Sr from sea water to sea plants were higher as a result of the relatively higher direct con
tamination of marine vegetation through rain water in these
areas.

- 120 -
3. »LU AND OTHER ANIMAL PRODUCTS (the consumers)
3.1. Introduction
The tropaic level of the human food chain following the
producers is stade up of the consumers, i.e. animals and their
products. The consumers utilised by man are mostly herbivores.
This applies generally to domestic animals, although they may
receive minor amounts of additional fodder of animal origin
e.g. bone meal and fish meal. As regards the aquatic animals
included in the human food chain, these are often carnivores
and as such they may display enhanced levels of certain radio
nuclides, e.g. Cs, compared to aquatic herbivores. Among
the various animal products, milk is an important constituent
of the human diet, at least in the industrialized world, as it
is the main diet for infants (0-1 year) and because some of
the most abundant fallout nuclides are easily secreted in milk.
Therefore the emphasis in this chapter is laid on milk. Because
Faroese milk holds an exceptional position with respect to
radioactive contamination, a special section is devoted to the
milk from this area. The section on terrestrial animals com
prises Greenland reindeer in addition to domestic animals.
The reindeer are expected to show a high radioecological
sensitivity according to the high contamination levels found in
lichen. Marine fish from Danish, Faroese and Greenlandic waters
are dealt with in the following section, and the chapter is
concluded with marine mammals, seabirds and hens' eggs.
3 .2 . Danish milk
"Gm4 «fti l«v («« Httktm'. *a§4t K««c«, • « • fe«M V* f « C NCCfeCM*. SØM 9% 0»t paa Møiétt. Ht v«<t It 4tiU§t tmtW.
HMf MUCK GJØK
"thank §0*4ntH j#« »MN mitkl" ta*4 tht w«(c; "*** it cam h«»c milk-pm44im§t ami wnttt* c me cfcfct« U tat. M t f a I *ttt ttth mat:"
Mf I HmatS tlCmT
Milk i s an important constituent of European, North nmrican and Oceanian d i e t . In modern society where breast-feeding of infants

- 121 -
is to a large extent supplemented or even replaced by cows '
milk, this substance is the main source of diet for infants in
their first year of life.
89 90 131 137 Fission products such as Sr, Sr, I and Cs are all
readily transferred to milk. As these radionuclides are to a
considerable extent absorbed in the gastrointestinal tract
(Ic59), they contribute to the internal radiation dose of milk
consumers if the fodder of the cows is contaminated by fission
products.
Hence milk was included at an early stage in the environmental
studies of radioactive contamination from nuclear weapors tests,
A sample of cheese collected in Wisconsin in July 1953 was 90 among the very first items to be measured for Sr in the human
90 -1 environment. This sample contained 0.5 pCi Sr (g Ca) (Ku6 2)
In April 1954 the Health and Safety Laboratory (HASL) of the 90
USAEC (Has58) initiated the first systematic study of Sr in
milk. The first samples consisted of powdered milk from Perry
in New York State* a few months later this was supplemented
by samples of liquid milk from New York City. In 1956 the Los 137
Alamos Scientific Laboratory (Has58) began Cs determinations 131
in milk. The first attempt to measure I fallout in milk was
made in the USA in February-June 1955 parallel with a study of 131
I in the thyroid glands of cattle and of humans (Co57a).
In the last half of the fifties studies of fallout nuclides in
milk were rapidly expanded because of the increasing intensity
of nuclear weapons tests, and also because of improved
analytical techniques. Data from most areas of the world have
since 1958 been compiled in the UNSCEAR reports (Un58-77). The
first Danish data on Sr and Cs in milk appeared in 1959
(RRD59). The samples came from four dried milk factories
selected for this purpose by Risø in co-operation with the
National Health Service of Denmark.
Throughout the years, the Sr and Cs contents of Danish
cheese have occasionally been measured (RRD59-76). However,
it has been shown (Re66) that both the Sr/Ca and the Cs/K
ration in general seem unaffected by dairy processes. The 90 137 Sr and C3 concentrations in the various dairy products

- 122 -
may therefore be calculated from the milk analysis, if the
concentrations of Ca and K in the products are known. In the
case of cheese, it has been assumed in the total diet estimates
(4.2.) that 1 kg cheese contains 8.5 g Ca and 1.2 g K.
3.2.1. Variation with time and location
The Sr and Cs concentrations in milk have shown a
significant variation among years (tables B.3.2.1 and B.3.2.2,
figs.3.2.1.1, and 3.2.1.2). The maximum occurred in the last
half of 1963, and since then the levels have generally been 90 137
decreasing, Sr more slowly than Cs, in agreement with the
observations for vegetation. The variability among years was
0.62 for 90Sr and 1.02 for 137Cs (1961-72)? which are lower
variabilities than found for grass (2.4) and grain (2.2), but
higher than those of vegetables (2.5). The variation among 90 years depended primarily on the fallout rate and, for Sr,
also on the accumulated fallout in the soil. However, these
were not the only reasons for variation. The composition of
cattle fodder has thus been altered during the period in
question. In 1957 the ratio between feed units from roots and
grass was 1.0, while it had decreased to approx. 0.65 by the
beginning of the seventies (Da57-77). From table 2.4.2. it
appears that this implies a relatively slower annual decrease
in the Cs levels than in the Sr concentrations of the
milk. Another factor that has interferred with the general fall
in levels has been the more rapid decrease in milk production
in the Islands than in Jutland (Da57-77) . This has enhanced 90 137
the relative mean concentration of Sr and especially of Cs
in Danish milk, because milk from Jutland shows higher levels
than milk from the Islands (figs.3.2.1.1. and 3.2.1.2.). Beside the annual variation, the seasonal variation within the
year was studied. This variation was most pronounced in the 137 case of Cs; the variability among months was thus 0.34 for
Cs, while it was only 0.04 for Sr. If the monthly
variations within the so-called "milk year" (May,^ - April.i+1))
are considered, i.e. the period in which the fodder used for 90
milk production originates mainly from the year (i) , the Sr 137
levels were nearly constant from month to month. The Cs

- 123 -
</>
I3
Ui
>
5 2 UJ
or
YEARS * * *
il
MONTHS
1.5 -
1.0 -
0.5
lllllli
1.5
1.0 -
0.5 -
LOCATIONS * * *
60 65 70 75 M J J A S O N D J F M A Hjø VKl Ode rh Åb« R'm
Nak
Fig. 3 . 2 . 1 . 1 . 90 —1 The variation of pCi "sr (g Ca) A in Danish dried milk co l l ec ted monthly
at 7 dried milk factories (cf. Fig . A . l . 3 . 2 . ) from May 1959 to April 1976 (cf . Table A . 1 . 3 . 2 . ) . The bars indicate the l eve l s re la t ive to the grand mean 9.4 pCl (g Ca) - 1
(= 1 at the re la t ive s c a l e s ) . The years were "milk years" (cf. the t e x t ) .
11
Y E A R S * * *
1.5 -
1.0 -
0.5
llli I II I
MONTHS * * *
1.5
1.0 -
0.5
LOCATIONS * * *
60 65 70 75 M J J A S 0 N D J F M A Hj« Vid 0d«| Nok Årh Åt» Rin
Fig. 3.2.1.2. The variation of pCi " ' e s (g K) * in Danish dried milk collected monthly at 7 dried milk factories (cf. Fig. A.l .3.2.) from Nay 1959 to April 1976 (cf. Table A. l .3 .2 . ) . The bars Indicate the levels relative to the grand mean 18.5 pCi (g K)~ (« 1 at the relative scales). The years were "milk years" (cf. the text) .
concentrations were, however, 2-3 times higher in July than in 137 90 January. The Cs/ Sr ratio of the summer milk was thus
significantly higher than that of the winter milk. This
seasonal variation was a result of the seasonal change in the
composition of the fodder of the cows. It appears from table

- 124 -
2.4.2. that the Cs/ Sr ratio in summer fodder was signifi
cantly higher than in winter fodder.
Anovas showed a significant interaction between "milk years"
and months. During periods with increasing fallout levels
(1961-1963), the autumn months showed relatively high con
centrations of Sr and Cs in the milk because of the con
tamination of grass and root vegetable leaves by fresh fallout
(from the autumn test series in 1961 and 1962). During periods
with decreasing levels of contamination (1964-1967), the
relatively high milk concentrations observed in the late spring
were due to the consumption by the cows in May of some residual
fodder (from the preceding "milk year"}.
90 137 The local variations of the Sr and Cs concentration in
Danish milk were similar for the two nuclides (figs.3.2.1.1. and
3.2.1.2.). The highest levels were observed in the western
parts of the country where also the highest fallout levels
and thus the highest concentrations in the crops occurred. As 137 was the case for the time variation, Cs showed a more
90 pronounced local variation than Sr, which was in contrast to
the observations made for, e.g., grain (2.2.). The local
variability (table B.3.2.3.) was 0.39 for 137Cs and 0.26 for 90 137 Sr. The quotient between the Cs concentrations in milk
from Videbæk in West Jutland and Nakskov in Lolland-Falster 90 was 3.0, while for Sr it was 2.2. In other words, the
137 90
Cs/ Sr ratio of milk from Nakskov was lower than that of
milk from Videbæk. This difference was due to differences in
the composition of the fodder in the two areas. The ratio
between feed units produced from roots and offal (from sugar
beet production) and from grass was nearly twice as high in
Lolland-Falster than in West Jutland (table D.3.2.I.). The
cattle-feed in Lolland-Falster thus contained relatively more
roots and less grass than the fodder used in the other parts
of the country (Hau73). Table 2.4.2. indicates that a high 137 90
root-to-grass ratio resulted in a lower Cs/ Sr ratio than in diets with a low root-to-grass ratio. STEWARD et. al (Ste65)
137 have shown that the transfer of Cs from cattle feed to milk
was closely related to the crude fiber content of the feed:

- 125 -
the hiaher the crude fiber content, the lower the percentage of 137
Cs intake secreted per litre of milk. As the crude fiber content of grass is higher than that of roots (Hau73), one
137 would expect a relatively lower secretion of Cs in milk from cows on a grass diet than in milk from cows on a root diet. The
lowering effect of a high root/grass ratio in cattle feed on 137 the Cs levels in milk may therefore be counteracted but not
137 necessarily compensated by an increasing effect on the Cs
levels from the lower crude fiber content of such feed.
90 Anovas of the quotients between the Sr concentrations in milk
from Videbæk and in milk from Nakskov showed no significant
variation within the "milk year", but the ratio increased
through the years. This was ascribed to the increasing importance 90
of root uptake of Sr, which played the gre&test role for the
sandy soils in West Jutland (Videbæk) (An67a, An67b) (cf. also
the greater soil factors in the prediction models for crops
from Jutland (e.g. table C.2.2.1.)).
The interactions between time and location were in general not 90 very pronounced; the local pattern of the Sr as well as of
137 the Cs levels in the milk was nearly unchanged with time.
Besides the above-mentioned inrluence of variations in the
relative importance or direct to indirect contamination from one
place to another, yearly alterations in the relative feed habits
of the cattle for the various areas, and shifts in the livestock
supplying the milk to a given factory, should be considered.
It is remarkable that the interaction between locations and
years was less pronounced for x Cs, which in Danish milk
generally depends on direct contamination. This suggests that
variations in root uptake were mainly responsible for the 90
interaction observed for Sr. A study of the monthly pattern
of the radionuclide concentrations in the milk at the individual
locations did not reveal any marked variations in the pattern 90 137
for Sr from one place to another. In the case of Cs,
Videbæk and Nakskov showed a marked and narrow peak in Julv,
whereas Hjørring and Åbenrå showed a broader maximum covering
July-September. Århus, Odense and Kalundborg held an intermediate
position. A broad maximum suggested a relatively constant
application of additional fodder throughout the grazing season,

- 126 -
whereas a narrow peak reflected decreasing amounts of additional
fodder throughout the grazing season until July, and thereafter
increasing amounts.
1.8 -
(A 1 -
z z> Hi
> Hr < tu
14
1.0
0.6
V)
lit a.
tfi
UJ
> —i
0.2
U
1.0
0.6
0.2
1.4
1.C
0.6
0.2
i — i — i — i — i — i — i — i — i — r
1962-63
/ ÅbenrA
Hjørring
- i — l — i — i — i — i i t — t — % — \ — t -
1964 - 65
Hjwring *••" "• Åbenrfi
- • — i — i — i — » — t - H 1 1 1 f -
1968 - 69
Åbenrå Hjerring
j i_ _i i i_ j i i_ M J J A S 0 N D J F M A
MONTH
Fig . 3 . 2 . 1 . 3 . An i l l u s t r a t i o n of f i r s t - (L»M, Y*M, Y»L) and second-order (YxM»L) interactions (Table
an . i B.3 .2 .1 . ) of pCi '"Sr (g Ca) A in Danish dried milk. Where there were no interact ions , the curves for the two l o c a l i t i e s should have been paral le l both within and among milk years .
The second-order i n t e r a c t i o n between years , loca t ions and months 90 was s ign i f i can t for Sr in Danish dried milk, r i gu re 3 . 2 . 1 , 3 .
exemplifies t h i s i n t e r a c t i o n . I t appeared t ha t the f i r s t - o r d e r in te rac t ions between loca t ions and months varied among the years . As for grain ( 2 . 2 . 1 . ) , a main reason for the i n t e r a c t i o n s observed in milk was v a r i a t i o n s in the r e l a t i v e importance of d i r ec t and i n d i r e c t contamination with time and l oca t i on ; but
- 127 -
furthermore the interactions for milk were influenced by the
variations in the composition of the cattle feed.
An anova of the quotients between dried milk and fresh milk of 90 -1 pCi Sr (g Ca) did not reveal any significant time variation
between the two types of milk, but the local variation was
significant. The dried milk from Videbæk thus showed higher
concentrations than the fresh milk from West Jutland, while
dried milk from Nakskov showed lower levels than fresh milk 90
from Lolland-Falster. The local variability of Sr in dried
milk (CV locations = °-26) w a s a lj-ttle higher than that of
fresh milk (CV i o c a t i o n s = 0.22) -r in the case of Cs, the
local variabilities of the two milk types were 0.39 and 0.27,
respectively (table B.3.2.3). The countrywide mean quotient 90 -1
between the pCi Sr (g Ca) levels in dried milk and fresh
milk was 1.09 + 0.22 (1 SD) (231 ratios), and for pCi 137Cs -1 13 7
(g K) the mean ratio was 1.22 + 0.48 (227 ratios); the Cs
ratio was generally higher in summer than in winter. The dried
milk factories thus apparently received some of their milk from 90 137
areas with a higher milk concentration of Sr and Cs than the consumption average for the areas in which the factories were
137 90 situated. The higher Cs/ Sr ratios in the dried milk suggested that the suppliers of milk to the factories other than
the local were situated in the western part of the country, 137 °0 because the Cs/" Sr ratio in milk from Jutland was somewhat
higher than in milk from the Islands. The fresh milk samples
made it furthermore possible to evaluate the production and the
population-weighted countrywide activity means in Danish milk
(RRD59-76). The mean ratio between the two weighted means was
approx. 1.11. This showed that the milk used for consumption in
Denmark as fresh milk had a lower activity content than the
mean activity of the total production. The Danish population
thus obtained a reduction in its intake of Sr and Cs from
milk by preferentially using the more contaminated milk to other milk products such as butter and cheese, which are
exported to a large extent. As most milk was produced in
Jutland , it agrees with expectations that the surplus pro-
*)
At the beginning of the sixties two-thirds of all milk
produced in Denmark came from Jutland, ten years later the
fraction had increased to four-fifths (Da57-77) .

-128 -
duction mainly originated from this area, and thus showed a 90 137 higher mean content of Sr and Cs than the country mean,
which was not significantly different from the population-
weighted mean (RRD59-76). However, since the beginning of the
seventies, the latter mean has shown a tendency to increase
because of the transfer of milk from Jutland to the eastern
part of the country, especially to Copenhagen.
The summer sampling of untreated whole milk from livestock at
the state experimental farms during 1962-1970 showed that the
mean concentrations in this milk were somewhat lower than those
of dried milk, just as observed above for the fresh consumers
milk. The mean ratios between dried milk and whole milk were
1.01 137. 1.06 + 0.27 (1 SD) (73 ratios) for *uSr and 1.28 + 0.62 for
Cs (68 ratios).
3.2.2. Relations and prediction models
The prediction models for milk have been throughly studied by
many investigators. Already in 1958 in the first UNSCEAR report 90 (Un58) a model was proposed for the Sr concentration in milk.
90 This model assumed the milk concentration of Sr to depend on 90 Q0
the fallout rate of Sr and on the " Sr accumulated in the
soil. Later, more sophisticated models were suggested and these
included a so-called lag rate factor (Ba66, Aa66a) which takes
the fallout rate in the preceding year into acount. These
models were further refined by assuming effective half-lives of 90
the Sr in milk of less than the physical half-life of 28 years (Ba72, Be72). Figures 3.2.2.1.-3.2.2.4. show the most
90 137 recent prediction models for Sr and Cs in milk for the
Islands and Jutland compared with the observed values. Dried 137 90
milk was more sensitive to contamination by Cs than by Sr
and milk from Jutland was more sensitive to contamination than
milk from the Islands (tables C.3.2.1 and C.3.2.2.).
The radioecological sensitivity of Danish milk was estimated
from the two independent transfer factor estimates based on
dried milk and fresh milk, respectively. If all equations in
tables C.3.2.1. and C.3.2.2. are used, the means of the four
estimates for the entire country of each nuclide are 3.25 +

- 129 -
Fig. 3.2.2.X. Predicted (the curve calculated from
Table C.3.2.1. No. 1) and observed pCt 90Sr (g Ca)"1
levels in dried »ilk from Jutland. Correlation coef
ficient r - 0.9979***.
30
§20
§10
- i — i — i — i — i — i — i — i — i — i — i — i — i — i — i — i — i — i — i — i — r
Fig. 3.2.2.2. Predicted (the curve calculated from — • • • " « — . - •
Table C.3.2.1. No. 3) and observed pel '"sr (g ca) x
levels in dried milk from the Islands* r - 0,9977***.
Oft _ i an _ o 0.23 (1 SE) pCi Sr(g Ca) A y per mCi 3USr km ^ and 3.43 +
137 -1 137 -2 0.27 pCi Cs (g K) A y per mCi AO/Cs km . The present
90 transfer factor for Sr is 4% higher than the transfer factor
most recently estimated for Danish milk by UNSCEAR (Un77); 137
but in the case of Cs the UNSCEAR estimate was 27% higher
than the above value. The UNSCEAR models assumed lower root
uptake of Sr but higher of Cs than the present models.

- 130 -
90 The present estimate of the radioecological sensitivity of Sr
was only half of the value proposed in 1968 (X) when the 90
effective half-life of Sr available for indirect contamination 137 was assumed equal to 28 years; the estimate for Cs was 71%
of the 1968 value.
Pia. 3.2.2.3. Predicted (the curve calculated fro«
Table C.3.2.2. Mo. 1) and observed pCi 137C» (9 K ) " 1
levels in dried Milk fro« Jutland* r - 0.9990***.
ric. 3.2.2.4. Predicted (the curve calculated £torn Table C.3.2.2. Mo. 3) and observed pCi 137Cs (9 K)" 1
levels in dried stilk fro*) the Islandst r - 0.997C***.

- 131 -
The prediction models for milk and table 2.4.2. permit an
estimation of the transfer factors from cattle fodder to cows'
milk. If the six winter months are assumed represented by
winter plan 18 and the summer month by plan S in table 2.4.2.,
the infinite time-integrated mean intakes of an average cow -2
from a deposition of 1 mCi km of the nuclide in question
becomes 0.82 uCi Sr and 0.29 yCi Cs. The infinite time-
integrated secretion with milk of the average cow becomes
3.25 • 1.2 • 11 • 365 • 10"6 = 0.016 yCi 90Sr per mCi 90Sr km"2
and 3.43 • 1.6 • 11 • 365 • 10~6 = 0.022 pCi 137Cs per mCi 137 -2
Cs km . (Milk contains 1.2 g Ca and 1.6 g K per litre and a cow produces on the average 11 1 milk day ). Hence,
90 1.9% of the Sr in the fodder was secreted in the milk, or 137
0.17% per litre, and 7.6% of the Cs intake, or 0.7% per
litre. The secretions are compatible with the observations of
other authors. COX et al. (Co60) thus observed in a field 90 study of a dairy herd that 1.2% of the total ingested Sr (and
stable Sr) was secreted into the milk. In an experimental study,
COMAR et al. (Co61b) found that 0.08% of the daily radio-
strontium dose was secreted per liter of milk. In both studies
the daily calcium intakes were approx. 100 g per cow. From flow
and balance considerations for stable Sr in the cow, COMAR
(Co66a) has estimated that 4% of the daily Sr intake would
appear in the milk if the daily calcium intake was 50 g; in
the case of 1C0 g Ca d" , the secretion would be 2% provided
that the observed ratio: !|^a)fodder w a s c o n s t a n t ^ 0.1).
137 In the case of Cs, the percentage of cæsium ingested daily
that may be found in milk under conditions of prolonged
exposure ranged from about 6 to 12 per cent for cows (Fr66).
In the food chain, the so-called observed ratio, OR, between
a radionuclide and its congener in step (j) and the preceding 90
(i) is often considered (Co56). In the case of Sr:
OR. - = PCi 90Sr (q Ca)" 1 (1) j / i pCi 90Sr (g Ca)"1 (i)
The steps (j) and (i) are denoted sample and precursor,
respectively.

- 132 -
The OR values are supposed to be constant within a limited
r .nge of calcium concentrations. Hence, if the calcium con
centration in the precursor is increased by a certain factor 90 and the amount of Sr is kept constant, we may expect a
90 —1
reduction in the pCi Sr (g Ca) ratio by the same factor in
the sample. If the precursor is cattle feed and cows' milk is
the sample, the observed ratio is 0.1 (range 0.08-0.16) (Co66a)
according to numerous investigations. The average daily Ca
intake per cow fed Danish fodder of the above-mentioned
composition was approx. 60 g (Br69), and the daily secretion of
Ca with the daily milk production of the cow was 13 g. Hence, t h e 0Rmilk/fodder = ¥ M £ § ' °-089' B e S i d e S t h e 6° * C a in
the fodder, mineral calcium is often added to the fodder during
the winter; 50 g dicalcium-phosphate is thus recommended in
winter plan 18 (table 2.4.2.), this increased the annual OR
value to 0.10. If the total daily calcium intake the year round
was 100 g, the OR became 0.15. The present radioecological 90 sensitivities for Sr in fodder and milk thus yielded
0Rmilk/fodder v a- u e s *n agreement with other observations.
3.2.3. Short-lived nuclides in Danish milk
During periods with atmospheric nuclear test-explosions, short-OQ 111
lived nuclides, such as °'sr (t1/2 : 50.5 days) and ° I
(t, ,2 = 8.04 days), may appear in milk if the cows are grazing
when the fresh fallout is received. During 1961-1963 (RRD61,
RRD62, RRD63), in connection with the intensive test series
in 1961-1962, these two short-lived nuclides were studied in
Danish milk.
Strontium-89 was measured from October 1961 to December 1963. 89 —1
The time-integrated level became 116 pCi Sr (g Ca) y in Danish dried milk. This level originated from a total deposition
89 —2 of 269 mCi Sr km (RRD59-76). Hence, the transfer factor
89 — 1 89 —1 became 0.43 pCi Sr (g Ca) y per mCi Sr km , or 13% of
90 89 the corresponding factor for Sr. Prom Sr milk measurements in 63 cities in the United States, UNSCEAR (Un77) estimated
QQ _1 QQ „O
0.38 pCi Sr (g Ca) y per mCi Sr km . Due to the short 89 half-life of Sr, milk was significantly less sensitive to 90 contamination by this nuclide than by the long-lived Sr.

- 133 -
Indirect contamination from root uptake thus played no ro e for 89 Sr in milk, and the stored fodder used during the winter lost
89 90 its content of Sr more rapidly than it did Sr.
89 As Sr in milk only depended on direct contamination, just like 137
Cs, the two nuclides could obviously be compared. An anova 137 89
of Cs/ Sr in dried milk showed a probably significant variation between locations, besides the highly significant variation
137 89 between months. The Cs/ Sr ratio in milk from Lolland-Falster was thus probably less than in milk from West Jutland, which
137 90 agrees with the observations for the Cs/ Sr ratios (3.2.1). 89 90
As there was no significant difference between the Sr/ Sr
ratios in milk from West Jutland and from Lolland-Falster, the
observations suggested that the fodder in West Jutland was 137 relatively more sensitive to direct contamination by Cs than
by radiostrontium, than the fodder in Lolland-Falster. This
observation did not preclude that the fodder also differed with 90 respect to indirect contamination by " Sr. In nuclear weapons
89 90 the ratio between Sr and Sr at detonatr.on is 185 (Un77),
and the mean ratio between the deposited activities in Denmark
was measured to be 6.3 from the 1961-1962 test explosicns (RRD59-76) 89
Hence, the infinite time-integrated Sr milk levels from atmospheric nuclear explosions in the Northern hemisphere in 1961-1962
90 were approximately 80* of the corresponding Sr level in milk
from these explosions.
Iodine-131 in Danish milk has been measured in three periods:
September-November 1961 (RRD61), September-November 1962 (RRD62)
and in October 1976 (RRD76). In all periods samples were
obtained from farms near Risø, and in 1961 and 1962 they were
also collected countrywide. The 1961 study showed that samples 131
from Jutland contained approx. 20% more I than samples
simultaneously collected from the Islands. The time-integrated
levels in Danish milk in 1961 were estimated at 2-3 pCi I
I"1 y, in 1962 at 5-6 pCi 1 3 1I l"1 y and in 1976 at 0.5-1 pCi 131I l"1 y. In 1962 and 1976 the deposition of 1 3 1I was mea
sured? from this were estimated the transfer factors from
deposit to milk. In 1962 the factor was 0.7 pCi l" y per mCi 131I km"2 and in 1976 0.5 pCi l"1 y per mCi 1 3 1I km"2. These

- 134 -
estimates were based upon observations Made in the last Months
of the summer grazing season and the first of the winter stall
season. The factors were thus lower than expected for midiumar.
but defintely higher than those for the winter, and they say
correspond to the annual man situation. As coapared with
transfer factors from other countries (Un72) with a man value
of 2.2. pCi y l""1 per mCi km"2 (range: 0.6-4.1), th«s Danish
factors were low. In 19(2 the concentrations in grass and »ilk
were coopered in samples collected from the state experimental
farm in September (RRD62). The man ratio pCi 131I l-1 silk/
pCi 131I kg'1 grass (dry matter) (20% dry matter) was 0.0066
(1 SE 0.001). Prom simultaneous measurements of nSr/*°Sr in
milk and grass, it was estimated that 67% of the cattle fodder
was freshly contaminated, and it was assumed that this part
of the fodder consisted of grass. Hence, for a pure grass diet,
the activity ratio between milk and grass became 0.01. This
estimate was consistent with the majority of values found in
field studies (Ga66). The relatively low sensitivity of Danish
milk to contamination by I was thus due to the high
productivity of the grazing areas (cf.2.4.1.) combined with
the relatively large amounts of supplementary fodder, and to
the fact that Danish cows are stalled for half of the year,
which implies that short-lived nuclides disappear from the
stored fodder.
3.3. Paroese milk
it d€t *m * • « tpuHftt dtca miméttt «{ "f* *-»• talt that tk<n* a mttt?" tocafCM *§ ptgtét på ttwtHhmi. "9ft « i t « i Cfct frwmmt* r§ tktm, primtimm. t«C4c V« mpp% « *0\aa CC mmf. t* ChC Iti Kilt. "Bp *« IttaMy m
CIMtmfl th*mt* CMtl it m c « r c . " r»c »in *r TM litis
A combination of high rainfall and specific agricultural con
ditions may result in enhanced radionuclide concentrations in
milk. Already by the end of the fifties, such sites were
identified in the United Kingdom (Ag60) and in Norway (Hv61).
Later, similar regions (Un69) have been found in Florida,
Mew Zealand, the Ukraine, Jamaica and in the Faroe Islands.
The Norwegian study showed that high Cs milk levels might
occur even for relatively low fallout rates. Agricultural
conditions may thus be more important than rainfall. In the
Faroes, precipitation is high (i 1500 mm yr ) , farming is

- 135 -
extensive, and the mineral content of the soil is relatively
low while the organic matter content is high; an enhanced
content of radioactivity in Faroese milk was thus to be presumed.
3.3.1. Variation with time and location 90 137 Sr and Cs concentrations in
The variation of the annual
Faroese milk was nighly significant (tables B.3.3.1 and
MA Thorshavn
Klaksvig Tværii
Fig. 3.3.1.1. The variation of pCi Sr (g Ca) In fresh Faroese milk collected weekly at 3 locations (Fig. A.l .1.3.2.) from May 1962 to April 1976 (cf. Table A.1.3.3.) . The bars indicate the levels relative to the grand mean 57 pCi (g Ca) scales). The years were "milk years".
(» 1 at the relative
3 -• -
Z
> L
oc 1
YEARS # * * 1.5 -
1J0
0.5
l l l l
MONTHS 1.5
1.0
0.5
LOCATIONS * *
65 70 75 M J J A S 0 N D J F M A Thorshovh
Klaksvig Tvawd
Fig. 3.3.1.2. The variation of pCi 137Ca (9 K)'1 in fraah Faroese milk collected weakly at 3 locations (Fig. A.l .1.3.2.) from May 1962 to April 1976 (ef. Table A.I .3 .3 . ) . The bare indicate th« level« relative to th« grand mean 329 pCi (g K)"1 ( - 1 at th« ralativa aeales). The years ware "milk years".

- 136 -
90 B.3.3.2.). The annual maximum Sr levels in 1963-1964 were
approx. 7 times higher than the concentrations found in 1973-137 1975, and the Cs levels were 5-6 times higher (figs. 3.3.1.1.
and 3.3.1.2.). The variability (table B.3.3.3.) of the annual 90 1^7
Sr levels in milk levels was 0.73, and that of the Cs
concentrations was 0.67; the variability of the two nuclides
was not significantly different. This was contrary to the
observations concerning Danish milk (3.2.1.), where the annual
variability was 1.45 for Cs and 0.70 for Sr.
The variation among the monthly Faroese milk concentrations was 137 90
not significant for Cs but was significant for Sr in some 90 years. The Sr levels in the summer months were thus generally
20-25% higher than those in the rest of the year. The
va] 90,
137 variabilities among months were 0.09 and 0.12 for Cs and
Sr, respectively. Once again there is an evident difference
compared to the Danish time pattarn, where the Cs milk
levels during the summer months were significantly higher than
during the winter (CV m o n t j 1 " 0.29), but where, on the other
hand, the Sr concentrations showed no marked variations
throughout the year (CVp m o n t h = 0.04).
As regards the local variations, there was only little 90
difference between the Sr concentrations in milk from the 3
locations (CV i o c a t i o n = 0.05). The Cs levels, however,
differed significantly (CV l o c ati 0 n = 0.29). Milk from Tværå
thus contained nearly e0% more Cs than milk from Thorshavn. 90
Compared with Danish milK, the Sr concentrations in Faroese 137
milk have been 4-6 times those in Danish, while the Cs
levels in Faroese milk have Leen 8 to 44 times higher than the
Danish levels, with the highest quotients in the later years. 137 It is remarkable that the local variability for Cs in Faroese
milk has shown an increasing tendency with time (table B.3.3.3.),
and that the variability among years was lower for Tværå than
for Thorshavn and Klaksvig. The marked difference between the 137 time variation of Cs in Faroese and in Danish milk was
primarily ascribed to the indirect contamination of Faroese 137
cattle feed with Cs from root uptake (cf.2.4.1.). Consequently, 137
the Faroese Cs levels in milk were influenced not only by
the fallout rate, as the Danish milk, but also by the accumu-

- 137 -
lated fallout, and as the fallout rate decreased the indirect
contamination became relatively more important, which caused
an increasing local variability. The lower variability among
years observed for Cs in Tværå milk suggests that the
levels in milk from this location were more influenced by
indirect contamination of the cattle feed than was tne case in
the two other localities.
3.3.2. Relations and prediction models 90
As the local variation of the Sr concentrations in Faroese 90 milk was modest, the prediction models for Sr in Faroese milk
were calculated from the mean of the 3 locations (table
C.3.3.1) . The radioecological sensitivity of Faroese milk
( 8.6 pCi Sr (g Ca) x y per mCi ^uSr km z) was 2.6 times
that of Danish milk for 90Sr (table C.3.2.1). As the 9CSr fallout rate was 2.08 times higher in the Faroes than in Denmark,
90 the infinite time-integrated Sr concej
milk was 5.5 times that in Danish milk.
90 the infinite time-integrated Sr concentration in Faroese
137 The radioecological sensitivity of Faroese milk to Cs contamination was approx. twice as high in Tvaera than in Thorshavn and Klaksvig. The mean sensitivity for Faroese milk (table
C.3.3.2) was 35 pCi 137Cs (g K ) - 1 y per mCi 137Cs km-2, or 59 137 -1 13 7 -2
pCi Cs 1 y per mCi Cs km . This was a 10 times higher sensitivity than that observed for Danish milk (table C.3.2.2.).
137 The infinite time-integrated Cs level in Faroese milk was thus approx. 20 times higher than that in Danish milk.
According to the Faroese Agricultural Adviser (Wa74), 38% of
the feed units consumed by Faroese cows were imported con
centrates. By the middle of the seventies, Faroese cows
received 8 feed units per day and they produced approx. 2500 kg
milk yr~ (3.7% fat). In analogy with the secretion estimates
for Danish milk (cf.3.2.2.}, the secretions of Sr and Cs
in Faroese milk were estimated at 0,1-0,3% and 0.4-0.7* per 1 of
the daily intakes, respectively. This was compatible with the
Danish estimates. The estimates for Faroese milk assumed that the
Faroese fodder consisted of 38% imported Danish barley and 62%

- 138 -
Faroese grass (Wa74). The activity contributions from the con
centrates (the barley grain) were negligible as compared with
those from the Faroese grass, which were estimated from the
radioecological sensitivities shown in 2.4.1.
At the beginning of the sixties, the annual milk production in
the Faroes was 1200 kg per cow and each cow received approxi
mately 6 feed units (Wa74). The increase in the consumption of
imported concentrates since then may have contributed to a
reduction of the radioecological sensitivity of Faroese milk.
3.4. Meat from terrestrial animals
Vtt van et godt Taa\, godt i Stand "J could do with that aheep, I could" oa godt mid Utd. "Vet gad jeg nok thought the j«n«tt. "I* mould &ind plenty oi tie'. ttHkte Sonden. "Vet vildt ikke g\azing at the bide o{ out ditch. Komme til at tavne G**ining pi vol PAP'S ALWAYS RICH! GMfttekant.
HI/AP FATTER GJØK. PET ER ALTIP PET RIGTIGE
Besides milk and cereal grain, meat is one of the important 137
Cs donors in the western diet. In certain arctic population groups, where reindeer or caribou are the main source of meat,
137 the Cs whole-body concentrations have been orders of magnitude higher than in the general population of the northern
137 hemisphere (L161, Han73). In the food chains, Cs is often
concentrated compared to the congener potassium. It has thus
been observed that meat displays a Cs/K quotient that is
approx. 3 times that of the fodder. Meat does not contain an
substantial amounts of 7USr and is thus relatively unimportant 90 as a Sr donor in the total diet. Animal bones are, however,
90 useful indicator samples for Sr contamination of the
terrestrial environment.
3.4.1. Danish beef and veal 137 -1 Anovas of pCi Cs (kg) in beef and veal collected from
June(i» to March (i+1\ / i«e. within the "milk year" (3.2.1.),
showed significant variation among years and among sampling
months. The maximum levels occurred in 1963 (fig.3.4.1.) , and
within the year September and June showed the highest levels,

- 139 -
in agreement with the observations for milk. The Cs con-
centra' ions in beef and veal did not differ significantly. The
Sr levels in beef were approx. 40 times lower than the Cs 90 levels. In general, the Sr levels decayed more slowly than
137 the Cs levels, which is also in agreement with the milk 137 observations. The variabilities of Cs for beef and veal
among years were 1.16 and among months: 0.24 (table B.3.4.I.), 90 while for Sr they were 0.60 and 0.17, respectively. Table
B.3.2.3. shows that the variabilities among years for milk were
similar to those for beef and veal.
137 The Cs contents of beef and veal were thus correlated to
that of milk, the concentration of the meat was 4-5 times that
of the milk; similar factors have been observed in Sweden (Li65) 137 The transfer factor for Cs to beef from fallout was 27 pCi
tf
X)3
10'
u a.
101
T — i — i — i — i — i — i — r -(—i—r
10° -
10'
- i—r
• Beef O Pork
J i i i i i i i i i i • ' • •
65 70 75 YEAR
Fig. 3.4.1. Annual mean« of 90Sr and Cs in Danish beat and pork collactad from Juna 1963 - March 1976 in copanhagan (cf. Tabla A.1.3.4.1.) . Tha annual maana war« baaad on "milk yaars" «ct. tha taxt).

- 140 -
137Cs kg"1 y per mCi lo7Cs km"2 (table C.3.4.2., nos. 1 and
2), and for ^Sr it was 1.4 pCi ^Sr kg"1 y per mCi 90Sr km"2
(table C.3.4.1., nos. 1 and 2}. Beef was thus approx. 20 times
more sensitive to contamination by Cs than by Sr. Beef was
approx. 5 times more sensitive to radioactive contamination by 137
Cs than was milk, and approx. 3 times less sensitive than 90 —1
milk with respect to contamination by Sr (pCi kg figures).
The total infinite time-exposure integrals in beef from the
deposition of 73 mCi 90Sr km"2 and 117 mCi 137Cs km-2 became
3.2 nCi 137Cs kg"1 • y and 100 pCi 90Sr kg"1 • y.
3.4.2. Danish pork
Approximately two-thirds of the meat consumed in Denmark
consists of pork, while the remainder is mainly beef and
veal. (RRD62). The Cs and Sr concentrations in pork 137 resemble those in beef (fig.3.4.1.), although in pork the Cs
90 levels have been generally higher and the Sr concentrations
137 lower. Pork is thus an important contributor to the Cs 137
content of the Danish diet. The variability of Cs among
years was 1.57, i.e. higher than for beef, but among months it
was only 0.09, i.e., lower than for beef (table B.3.4.I.).
Besides metabolic differences between pigs and cattle, the
fodder of the two species may have influenced the radionuclide
concentrations of the meat. The fodder of pigs mainly consists
of barley, crushed soya and skimmed milk, while grass, grain
and beets are the main constituents of cattle feed (Da57-77).
Moreover, while cattle feed shows a pronounced seasonal
variation due to summer grazing, this is not the case to the
same extent for pig fodder.
The transfer factors from fallout to pork were 34 pCi Cs -1 137 -2
kg y per mCi Cs km (table C.3.4.2., nos. 3 and 4) and on —I on —2
0.9 pCi Sr kg y per mCi Sr km (table C.3.4.I., nos. 3
and 4). The factors thus resembled those estimated for beef;
but pork was apparently slightly more sensitive to radioactive
contamination by i Cs than was beef. The total infinite
time-exposure integrals in Danish pork from fallout were
4.0 nCi 137Cs kg"1 y and 66 pCi 90Sr kg"1 y.

- 141 -
3.4.3. Faroese and Greenlandic mutton 137 90 Since the beginning of the sixties Cs and Sr have been
determined in samples of Faroese and Greenlandic sheep. Both
mutton and bone have been measured; bone was included in the 90 studies because it is a more sensitive indicator of Sr uptake
than meat. In the Faroes some 40 000 (Ri72) and in Greenland
approx. 20 000 sheep and lambs (Da70) are slaughtered annually.
Sheep graze nearly the whole year round and g«t little - if
any - additional fodder. As they often feed on very sparse
vegetation, they collect nuclear debris deposited over
relatively large areas, and because of the often low
productivity of the fields where sheep normally graze the con
centration of radionuclides in their fodder is relatively high
(Cham70).
The anovas showed that the Cs concentration (pCi Cs (g
K) ~ ) in Faroese mutton was 1.8 times that of Greenland mutton 90 (fig.3.4.3.1.) and the Sr content of sheep bone was 2.7 times
higher in the Faroes than in Greenland (fig.3.4.3.2). These
factors may be compared with the approximately 2.8 times higher
2.5
2.0
£1.5
2 5 i.o UJ CL
0.5
0.0
YEARS *** LOCATIONS
65 70 75 F G
rut. 3 .4 .3 .1 . The variation of nCl 137C« (« X)"1 In •utton collected In 1962-1976 in the Faroes and in Greenland (Table A.I.3.4.2.) . The bare show the levels relative to the grand nean 0.66 nCl (9 K)"1 (> 1 at the relative scale).

- 142 -
2.5
2.0 -
YEARS * * * LOCATIONS
I 1.5 UJ
>
a. '•"
0.5
0.0
4-
65 70 75
Fig . 3 . 4 . 3 . 2 . The variation of pCi ' Sr (g Ca) in sheep bone co l l ec ted in 1962-1976 in the Faroes and in Greenland (Table A . I . 3 . 4 . 2 . ) . The bars show the l e v e l s r e l a t i v e to the grand mean 200 pCi (g Ca) (« 1 at the re la t ive s c a l e ) .
fallout rate in the Faroes than in West Greenland (Godthåb). 137 The variabilities of Cs amonq years were 0.79 in Faroese
and 0.99 in Greenland mutton, i.e. not significantly different
(table B.3.4.1.).
As some of the samples received from the Faroes consisted
of dried meat it was expedient to use the quotients Cs/K 90 and Sr/Ca in the comparisons between Faroese and Greenlandic
mutton instead of pCi kg . The radioecological sensitivities
(tables C.3.4.1. and C.3.4.2.) of Faroese mutton were 79 pCi 137 -1 137 -1 137 -2
^'Cs (g K) L y ( 205 pCi XJ Cs kg x y) per mCi A""cs km
and 31 pCi 90Sr (g Ca)"1 y ( 3.1 pCi 90Sr kg"1 y) per mCi 90Sr
km . The corresponding values for Greenland mutton were 135
(-v 355) and 53 ( 5.3), respectively. Although the radio
ecological sensitivities were apparently higher in Greenland
than in the Faroes, the difference may not be significant
because the Greenland data were incomplete. Table C.3.4.3.
presents an estimate of the radioecological sensitivities of 90 Sr in sheep bone. It appears that in this case the Faroes and
Greenland showed the same transfer factors, as also expected

- 143 -
from the above-mentioned anova. The total infinite exposure
integrals of Faroese mutton from fallout from nuclear weapons
testing were 50 nCi Cs kg y and 0.5 nCi Sr kg y, and
for Greenland mutton the levels were 31 nCi Cs kg" y and
0.3 nCi 90Sr kg"1 y.
3.4.4. Greenland reindeer and musk ox
Since 1961 samples of reindeer meat and bone have been obtained
from Greenland. The main part of the material was collected
between Godthåb in the south and Egedesminde in the north
during the fall (August-October) and in late winter (February-
March) . The samples consisted of wild reindeer (Rangifer
tarandus groenlandicus) as well as domestic animals. Reindeer
were also purchased from the Royal Greenland Trading Company;
the exact geographic location of these samples was unknown,
but they were allocated to the south-west coast in general.
There are approximately 4 0 000 reindeer in Greenland and of
these approximately 3 000 are domestic animals concentrated
along the Godthåb Fjord. In 1967 approximately 7 000 animals
were slaughtered (Vi71).
137 The anova showed no significant local variation in the Cs 90 and Sr concentrations of the samples. This was compatible
with similar observations for grass (2.4.1) and for lichen
(2.6.1.) from the south-west coast of Greenland. The time
variation was, however, significant (figs. 3.4.4.1 and 3.4.4.2)
From the first half of the sixties to the first half of the 90 137
seventies, both the Sr and the Cs levels in the meat decreased by an order of magnitude. The variabilities among
137 90
years were 1.6 for Cs and 1.1 for Sr, and thus they were
higher than those observed for the fodder of reindeer (cf.
tables B.2.4.1 and B.2.6.1). The higher variabilities in the
reindeer were due to relatively high activity samples from
1967 and 1968. Individual extremes, which carried much weight
in the limited number of samples, may.thus have produced this
apparent difference among the variabilities of fodder and reindeer. In agreement with the studies of HANSON (Ha73) in Alaska and of MIETTINEN (Mie63) , PERSSON (Per70) and SWEDJEMARK (Sw74) in Lapland, the activity levels in Greenland reindeer

- 144 -
15
3.0
2.5
£ 2 . 0
z => LU
:> i 1.5
1.0
0.5
0.0
Y E A R S * * *
J_L 65 70 Godthåb
Sukkertoppen Holsteinsborg
Egedesminde 137 -1
M g . 3.4.4.1. The variation of nCi Cs kg x in
reindeer neet collected in 1962-1974 in Hest Greenland
(Table A.1.3.4.2.). The bars show the concentrations 1 relative to the grand mean 5.8 nCi kg
relative scale).
(» 1 at the
137, samples also showed seasonal variations. The "'""Cs levels in
reindeer meat from the late winter and the spring were thus
approx. three times higher than in meat from the fall, while 90 the Sr concentrations were twice as high. As shown in the
Alaskan and Lapland studies, this agrees with the feeding habits
of reindeer, which generally eat lichen during the winter but
in summer generally feed on vegetation with a lower content
of radioactivity such as grass, sedges, herbs, mushrooms and 137 leaves from bushes. The Cs levels in Greenland were
significantly lower than the corresponding concentrations in
meat from Alaska and Lapland, which contained respectively two 137 and three times more Csj however, in the far north of the
USSR local variations of more than a factor of three are not

- 145 -
3.5
3.0
2.5
£2.0 I
1.0
0.5
0.0
Y E A R S * * *
1.5
1.0
0.5
LOCATIONS 1
65 70 Godthåb Sukkertoppen
Holsteinsborg Egedesminde
Flq. 3 . 4 . 4 . 2 . The variation of pCi ' Sr kg x in reindeer meat co l lected in 1962-1974 in West Greenland (Table A. 1 . 3 . 4 . 2 . ) . The bars show the concentrations re la t ive to the grand mean 45 pCi kg (« 1 at the re la t ive s c a l e ) .
on
unusual (Ne66). As regards Sr, the Greenlandic levels in
meat as well as in bone were close to the Swedish ones, but
significantly higher than the Alaskan values, which were one
third to one half of the Greenland and Lapland concentrations.
As the arctic regions showed only minor differences with respect 137 90
to the Cs and Sr concentrations in lichen (2.6), the observations suggested that the local differences in the
reindeer levels depended on factors other than the radionuclide
concentration in lichens; feeding habits may thus show local
variations. NEVSTRUEVA et al. (Ne66) draw a similar conclusion
from their studies in the arctic USSR.

- 146 -
The prediction models for reindeer (cf.D.3.4.4) showed that the
transfer factors for meat were 1.5 nCi Cs kg" y per mCi 137Cs km-2 (table C.3.4.2., nos. 9 and 10) and 15 pCi 90Sr
kg" y per mCi Sr km (table C.3.4.I., nos. 8 and 9), or on _i on _o
120 pCi Sr (g Ca) y per mCi Sr km and in bone 100 pCi on —l Qfi —7
*uSr (g Ca) y per mCi 'uSr km * (table C.3.4.3., no. 5).
Prediction models for the meat collected in the late winter
showed transfer factors approx. three and two times higher for 137 90
Cs and Sr, respectively, than for meat collected in the
fall. The radioecological sensitivity of reindeer to Cs con
tamination was 4-5 times higher than that of Greenland sheep
(3.4.3.), which is compatible with the observations of HANSON 137 (Han73), who found 4-10 times more Cs in caribou flesh than
in Dall sheep.
The total infinite time-integral in Greenland reindeer meat
from fallout became 132 nCi 137Cs kg"1 y and 0.8 nCi 5GSr . -1 kg y.
The musk ox (Ovibos noschatus) lives in north-east Greenland.
By the end of the sixties there were 6 000-12 000 animals,
according to VIBE (Vi71). The musk ox is most frequently found
in the Scoresbysund Fjord district, at Kejser Tranz Joseph
Fjord, at Danmarkshavn and in Peary Land. Samples of musk ox
were obtained from north-east Greenland during 1964-1973. The
pres 137,
90 present data are the only information available on Sr and
Cs levels in musk ox.
The median concentrations in musk ox meat during 1964-1973 137 —1 90 —1
were 140 pCi Cs kg and 8 pCi Sr kg , and in bone 60 pCi 90 -1
Sr (g Ca) . The levels have shown a decreasing tendency
similar to that observed for reindeer samples. The variability
among years in musk ox was 0.8 for both Cs and Sr, i.e.
close to that observed for sheep. It was evident that the 137 90
Cs and Sr levels in musk ox were significantly lower than
those in reindeer. The potassium content of the musk ox meat
samples was approx. 75% of that of the reindeer samples. This
feature, together with the different feeding habits of the 137
animals, contributed to the relatively lower Cs concentrations in the flesh of the musk ox.

- 147 -
The limited number of data and the great local variations in
precipitation, and thus in the fallout levels, between the
Scoresbysund Fjord districts and Danmarkshavn (the areas frost
where the samples were obtained) make the calculation of pre
diction models problematic. The precipitation at Scoresbysund
and on the south-west coast of Greenland is 4-5 times higher
than that in Danmarkshavn; but the low precipitation at
Danmarkshavn may yield an underestimate of the fallout at this
station if dry fallout makes significant contributions (cf.
also D.3.4.4.). The radionuclide levels in moss and lichen from
Danmarkshavn (RRG62-76) indicated that the fallout levels may
have been a little lower than in other parts of Greenland, but
certainly not 4-5 times lower. As the best available estimate
of fallout in North-East Greenland, measurements from Kap Tobin
at Scoresbysund were therefore applied. This may be an
overestimate of the actual mean fallout for North-East Greenland,
and the transfer factors calculated may thus be too low. The
radioecological sensitivities of musk ox neat were 0.08 nCi 137 -1 137 -2 90 -1
Cs kg y per mCi xo Cs km and 4 pCi ' Sr kg y per mCi 90 -2 vSr km (tables C.3.4.1. and C.3.4.2.). The infinite time-
integrals until 1975, i.e. from a total deposit of 55 mCi 137 -2 90 -2
Cs km and 34 mCi Sr km from fallout became 4.4 nCi 137 -1 9f. -1 "'Cs kg y and 0.14 nCi ^ Sr kg .
The radioecological sensitivities of musk ox meat to con
tamination by Sr and Cs were less than for reindeer meat, 90 but in the case of Sr the difference may not be significant
because of the uncertainty of the fallout data used for musk
ox. The difference in radioecological sensitivity between the
two animals was ascribed to the different feeding habits. While
lichen is important to reindeer, musk oxen prefer grass, sedges,
leaves and twigs of small bushes, and during the winter they
eat arctic willow, but if starving they will consume anything.

- 148 -
3 . 5 . Fish
fitktm V* ktttrtm fmmftt. It*ft f* Xkt ink k*4 *«c« cm*§kt. T*«v«f. étljt «$ k M v i wf i Ijttizxtt tats* f? •at*«« axé «-*<. *•* kt\t fcir*i Hgtm »fe«« O« »p •*<" €• »<#t ét* **> «» f*€ fe«fc**«. m e t * rk« •*<* *•«•- r»{ i f .-•«• mttk < ircf t a « | « .
Ma STM->MfTicf riHMiMr rat $T*U«C* rr« scitut
Fish obtain radioactive substances via two Kain pathways: through
absorption of the surrounding water by their gills and from
the ingestion of food, which again directly or indirectly
depends upon the radionuclide content of the water. In shallow
waters direct contamination fro*, sedirsents nay be a third
exposure route (Lo71).
rish are not a major component of the Danish diet, the annual
mean per caput consumption oeing of the order of 10 kg. However,
in the Faroes and Greenland the annual per caput consumptions
are an order of magnitude higher. Kearly all fish consumed in
the three countries are of rrarine origin. Fresh water fish is
of very little importance, and enhanced Cs levels such as
those observed especially in fish from oligotrophic lakes in
the other Nordic countries (Ca76, Ko66) play no role for the
Cs intake with the Danish diet.
3.5.1. Variation with tine, location and species
The radioactivity content of marine fish is expected to be
closely re It-ted to the radionuclide concentrations of sea water.
A comparison of the variabilities found in tables B.3.5.1. and
B.1.5.1- confirms this expectation. The radionuclide levels in
fish from the Faroes and Greenland shoved a significantly
higher variability among years ( 0.5) than Danish fish ("- 0.3),
in accordance with the higher variability observed in the 90 Atlantic ocean (i 0.5) than in Danish waters ("- 0.2) . The Sr
and Cs concentrations in fish were highest in the first part 137
of the sixties (fig.3.5.1.). An anova showed that the Cs
concentrations in Faroese cod fish were 7 times lower than in
cod from Denmark, which implied that the Cs per caput intake
from fish was nearly the same in the two countries, because
the Faroese per caput fish consumption was 8 times that of the
Danish.

- 149 -
t z 3 w > 1 <
YEARS * * SPECIES * * *
LOCATIONS
65
Pig. 3 . 5 . 1 .
70 75 Cod Flot fish fish
DFG
137 -1 The variation of pCi Cs kg in flesh
of cod fish (mostly cod and haddock) and flat fish
(mostly plaice and halibut) collected in Denmark, the
Faroes and Greenland in 1962-1976 (Table A.I.3.S.).
The bars show the concentrations relative to the grand
mean 36 pCi kg" (» 1 at the relative scale).
90
Cs-137 and Sr showed similar variabilities among years? the
marked internuclide difference of the variability observed for
terrestrial samples was thus absent for fish. The variability
among years was lower for fish than for terrestrial animals
because of the generally stronger dependence of the marine
fauna on the accumulated fallout; the sea acted, so to say,
as a buffer and smoothed out short-term variations from the
fallout rate.
90 The Sr concentrations in fish flesh were 1-2 orders of 137,
magnitude lower than the Cs levels, i.e. similar to the
ratio observed for terrestrial neat (3.4.1. and 3.4.2.). Fish 90
bone contained Sr concentrations that were 3 orders of
magnitude higher than those in the flesh, corresponding to the 90
higher content of Ca in bone. The Sr concentrations in fish
flesh were thus influenced by the presence of even small
amounts of bone in the samples (0.3.5.1.).
The anovas showed that cod fish (gadus species) had nearly 137 twice as high concentrations of Cs than flat fish
(pleuronectes species), which may be a result of the feeding

- 150 -
habits of the two species, the trophic levels of the cod being
higher than those of the flat fish. The few samples of
euryhaline species (eel, salmon and trout) suggested higher
Cs as well as Sr levels than in other species, in agreement
with expectations from the generally higher levels encountered
in fresh-water fish. The interspecific variability in Danish 137 90
fish species was nearly the same for Cs and for Sr.
3.5.2. Relations and prediction models
The term "concentration factor" (CF) is defined as the ratio of
the concentration of the radionuclide in an organism to the
concentration directly available from the environment of the
organisms under steady-state conditions (Lo71). As organisms
may derive radionuclides from various sources, including food,
water and sediments, concentration factors are not absolute?
they may be altered by biological and environmental factors.
POLIKARPOV (Po66) found that the CFs of a given radionuclide
within closely related species of marine plants and animals
do not differ significantly from each other in different seas
and oceans with different salinity (from 3 5°X to 17%) . This
finding was not fully compatible with the observations of rELDT 90 (Fe66) and BRYAN (Bry66) , who found that the CF for Sr and
Cs in marine organisms showed a decrease with increasing
salinity.
The prediction models estimated for Danish, Faroese and
Greenlandic cod fish (tables C.3.5.1. and C.3.5.2.) and waters
(table C.l.5.1.) may be used to estimate the CF in the three
areas. As Windscale started to contaminate Danish waters from
1972-1973 (1.5), only samples from before 1972 v^re included 137 in the Danish models. The transfer factors for Cs in cod
were 20 pCi ^ Cs kg y per mCi "'Cs km in Denmark, 1.7 in 90 tfc'? Faroes and 9 in Greenland. In the case of Sr, Danish cod 90 —1
showed a radioecoiogical sensitivity of 0.9 pCi Sr (g Ca) y 90 -1 90 —2
(or 0.09 pCi Sr kg y) per mCi Sr km and Faroese cod
fish 0.6 or 0.06, respectively. From these data and the
corresponding figures for the radioecoiogical sensitivities of
the respective waters (1.5.), the transfer factors from water 13 7 -1
to fish were estimated at 87, 57 and 39 pCi Cs kg y per

- 151 -
137 —1 pCi Cs 1 y for Denmark, the Faroes and Greenland, 90 90 -1
respectively, and for Sr at 0.3 and 2 pCi Sr kg y per
pCi Sr 1~ y for Denmark and the Faroes. The Cs figures
suggested that the CF was higher in the low salinity Danish
waters (16%) than in the high salinity Faroese and Greenlandic seas (34% and 29%) in agreement with the observations of FLLDT
90 (Fe66) and BRYAN (Bry66). However, for Sr, the opposite
90 was the case. The prediction models for Sr in fish were
encumbered with some uncertainty, due partly to the relatively
few data available and partly to the varying amounts of bone
in the samples. Concentration factors for marine fish in the
literature (Ji72) were in the range 5-244 (mean 48) for Cs and
0.1-1.5 (mean 0.43) for Sr.
137 The radioecological sensitivity of Greenland salmon to Cs
contamination was similar to that of cod; Danish plaice seemed
to be less sensitive to radioactive contamination than Danish
cod (tables C.3.5.1. and C.3.5.2.). It was remarkable that the
radioecological sensitivity of cod was appro:. 75% of that of
beef; this relatively modest difference was a result of the
slower decrease in the Cs levels of the marine fauna than
of the terrestrial fauna in Denmark. Although the terrestrial 137
Cs levels after global contamination were thus initially
higher than the marine levels, the infinite time-integrated
levels for environmental samples from the two environments w^re
not much different from each other.
3.6. Various animals
Sae gih det paa Tang&t'. Hatpunen btev Aiten that came the pithing. The hatpoon tat i Hvalxctttni Siytt, »aa den tvat plunged in the heaxt o$ the waliui, 40 dampende Btcditxa&le ttod iom et that the ittaming blood spitted up like a Splittgvand oven I*en. fountain cvex the ice.
PAKA01SETS HAVE THE GAtVEH Of lVlt>
3.6.1. Sea mammals
Seal and whale are important constituents of the Faroese and
Greenlandic diets. In the Faroes, 25% of the "meat and egg"
consumed was whale (RRF62), while in Greenland seal and whale
contributed 65% (RRG62). The sampling of seal and whale (Piked
Whale and Grindhval) from Greenland and the Faroes has been
irregular; most samples were received during the first half
of the sixties.

- 152 -
S
o a
t>2
10'
10°
10-'
i n 2
• T
-
•
" V O
V
_
-
•
T- r • 7— i
* • .
V
o 0
o
The Faroes t Greenland:
i i i i
i • t r - r
• • • •
V
• 0
O
o o v
o
v »Sr. o ^Sr.
i i i i
T T " 1 1 1
•
•
• * V
o o
9 v V
v 137Cs • ,37Cs
• i i i i
r - •
-
-
•"
•
-
-
-
-
«
-
•
1
65 70 YEAR
75
137„ Fig. 3 . 6 . 1 . 1 . Strontlum-90 and Cs in individual samples of whale flesh from animals col lected in the Faroes and Greenland 1962-1977 fcf. Table A . 1 . 3 . 6 . 1 . ) .
90 As for other animals, the Sr levels in the meat were 1-2 orders
137 of magnitude lower than the Cs concentrations, which ranged
between approx. 10 and 100 pCi kg . Although whales tended tc
show higher concentrations than seals, the difference between
the two animals was not significant. The concentrations showed
a decreasing time trend (figs.3.6.1.1. and 3.6.1,2.). The levels
were thus approx. 5-10 times higher at the beginning of the
sixties than 10 years later. The variabilities among years were
relatively high, but as discussed in table B.3.6.1. this was
probably the result of an artifact. Two samples of whale meat
from 1970 and 1972, respectively, showed exceptionally high
levels (1700 and 570 pCi 137Cs kg" 1). Had the source of these
enhanced levels been Windscale, some Cs could have been 137
expected together with the Cs (Ku78), but the samples were
free of 134Csj the origin of the high levels was thus unknown.

- 153 -
X>3
102
10'
s o o.
10°
IQ'1
w
-i 1 — i — i — i — i — r - "i 1 — i — I — i — i -
90
- 5
© o
K> o
- o o
o o
• •
o o
8 o
' I • ' I 1 I 1 _
Sr " 7 Cs
65 70 YEAR
137,
O O
O o
75
Fig. 3 . 6 . 1 . 2 . Strontlum-90 and Cs In Individual samples o ! seal flesh from Greenland col lected in 1962-1977 (cf. Table A . 1 . 3 . 6 . 1 . ) .
Prediction models were estimated for Greenlandic seal meat
collected in 1963-1969. The radioecological sensitivities became 90 1 90 —2
0.3 pCi sr kg" y per mCi Sr km (table C.3.6.1.) and 5
pCi 137Cs kg-1 y per mCi 137Cs km-2 (table C.3.6.2.). In the
case of whales, the prediction models were calculated for the
Greenlandic as well as for the Faroese environment, because
the radionuclide content of these animals does not necessarily originate from the area where they were caught. The radiooecol-
137 -1 137 -2 ogical sensitivities were 5 pCi Cs kg y per mCi Cs km
90 90 —1 in the Faroes and 15 in Greenland, and for Sr: 0.3 pCi Sr kg
90 -2 y per mCi Sr km and 0.8, respectively.

- 154 -
3.6.2. Birds and eggs
In Greenland and the Faroes 20-25% of the "meat and eggs"
consumed originate from birds and eggs (RRF62, RRG62), cor
responding to approx. 9 kg per capita per year. In Denmark, the
annual egg consumption was approx. 11 kg per capita. The birds
and eggs consumed in the Faroes and Greenland are derived to
a considerable extent from sea-bird3. In Denmark, avian food
products are mostly derived from poultry.
90 137 The Sr and Cs concentrations in hens' eggs (figs.3.6.2.1
and 3.6.2.2.) from Denmark decreased by an order of magnitude
from 1963-1964 to 1974-1975. The variability of the radio
nuclide concentrations among years (table B.3.6.1.) was approx.
1.3,. which was comparable with the variabilities observed for
»*
W3
~~102 -
? £
K)1
10°
K> ,-i
i—i—i—i—r~i—i—i—i—i—r
- O
o v ? o
o Denmark v The Faroes
v v
o v v
o v v v „
* * * 8
-I I L_J I L. t I I I l—L. 15 70
YEAR 75
riff. 3.«.2.1. Stronti<m-90 In Dulm nid ranws« hm*' •99« (aliiiM tha shall) collect«* in 19(2-197« (Tabic A.1.3.«.2.) .

- 155 -
* « <
- i — i — i — i i i i i — r — i — i — I — r — i — r
O Denmark v The Faroes
§ 0 v 9
o o v V
V o v
v ° o
V v d
i n * 1 1 • • • i i i i i i L__i i i i i_
65 70 75 YEAR
Fig. 3 .6 .2 .2 - Cesiiue-137 In Danish and Paroese hens' •99S (Minus the shel l ) col lected In 1963-1977 (Table A . I . 3 . 6 . 2 . ) .
137 Cs in milk ( 3 . 2 . 1 . ) and meat ( 3 . 4 . 1 . ) 90,
The 137Cs levels in
eggs were approx. 3 times the Sr levels. The difference
between the concentrations of the two nuclides was thus far
less pronounced than in the case of meat and fish. Two samples 137
of chicken meat and chicken pluck from 1972 showed a Cs concentration 3-4 times higher than that of eggs; this suggested
137 a discrimination against Cs in hens' eggs. In the Faroes,
the Sr and Cs concentrations in hens' eggs were similar to
those observed in Denmark, because some of the chicken feed
(grain) used in the Faroes originates from Denmark.
Samples of sea-birds from the Faroes (Fulmar (Fulmarus glacialis),
Guillemot (Uria aalge), Puffin (Fratercula arctica) and
Razorbill (Alca torda)) and from Greenland (Brunnich's

- 156 -
Guillemot (Uria lomvia), Black Guillemot (Cepphus grylle) and
Eider (Somateria mollissima)) showed Cs and Sr concen
trations similar to those in fish and seals (fig.3.6.2.3.).
103
10* -
10' -
10° -
10-1!-
10"
— 1 — 1 — 1 — f —
a V
•m
v
« i • V
* Q * • • v '
- • v v . D V
a * *
1 — 1 »
137Cs. 13?Cs.
V
V •
v a v o a
1 1 l . .L_
V
1 >
— i — T — r
o "Sr. v " S T .
•
V
V
V
V
V
1 1 1
— I — 1 — 1 — 1 — 1
Greenland The Faroes
• f
V
V
i i i i i
_
-
-
_
-
1 '
65 70 75 YEAR
Pig. 3 . 6 . 2 . 3 . Strontiu»-90 and 137C» in f lash of Farossa and Graanlandlc saa-birds (cf. Table A . I . 3 . 6 . 2 . ) , col lected in 1962-1976.
The prediction models for Danish hens' eggs showed transfer
factors of 1.3 pCi 90Sr kg"1 y per mCi 90Sr km"2 (table C.3.6.1,
and 1.8 pCi 137Cs kg"1 y per mCi 137Cs km"2 (table C.3.6.2.). 90 Whereas the radioecological sensitivity to Sr was thus close
137 to that observed for beef and pork, the sensitivity to Cs
was approximately 20 times lower. Hens' eggs are thus an animal
product with a low sensitivity to radioactive contamination 137 by Li,Cs.

- 157 -
As the material relating to sea-birds was sparse, the data from
Greenland and the Faroes were combined by the VAR-3 procedure
(cf.B.3.) before the prediction models for the two area? were
calculated. The radioecological sensitivity in North Atlantic
sea-birds to Cs contamination was estimated at 3.5 pCi Cs
kg y per mCi Cs km (table 3.6.2. Nos. 8 and 9), i.e.
similar to the sensitivities observed for fish (3.5.2.) and
marine manmals.
3
8 <5 a.
vp
KT1
m-2
. 1 1 " T
: The _ Faroes
V
- *7 - q»
• 8 .
- & v • o
8
o o
I 1
i j T i r r r
i
! 1
• Seal and whale O | • Sea birds • Fish (cod)
•
•
§ 1 „ | o o ' •
&fc * •
0
0 o
o
•
1 1 1 1 1 1 I
a v
J
o
> '
r i T"" T .
_ Greenland '
V
v
•
i
•
• •
-
—
-V -
V -V
fc : as? -
a
i i
62 64 66 66 70 YEAR
72 74 76
Fig. 3.8.2.4. Strontlu»~90 in th* bona« of sarin« • • m i l , bird« and fish celiac tad In tha Faroaa and Graanland in 19(2-1976.
The 90Sr contents of the bones of marine animals from the
Faroes and Greenland (cf. fig.3.6.2.4.1 were similar as regards
locations and species; but a decreasing trend with time was
evident - in the first half of the sixties the levels were 90 -l
about 0.1-1 pCi Sr (g Ca) and by the middle of the 90 -1
seventies they had decreased to 0.05-0.5 pCi Sr (g Ca) .

- J.DO -
3.7. Conclusions
3.7.1. General
Both the origin and the composition of cattle fodder influence
the radioactive contamination of cows* milk. A high proportion
of grass results in higher Cs levels in Danish milk than 90 those observed in milk from cows on a root diet, but the Sr
milk levels are less sensitive to the composition of the fodder.
In the Faroes the high indirect contamination of the fodder by 137 137
Cs enhances the Cs concentrations in the milk. The
terrestrial animals used for human consumption are in general
herbivores, hence the radioactivity levels in meat are related
to the concentrations found in the vegetation making up the
animals' fodder. The extreme levels found in lichen are thus
reflected in reindeer meat. Salt-water fish and marine mammals
contain in general lower radioactivity levels than terrestrial
animals; however, as the radionuclide concentrations in the
sea are related to the accumulated deposit rather than to the
fallout rate, the infinite time-integrated levels in marine
animals are not entirely negligible. Apart from milk, animal 90 products are in general low in Sr, whereas fish and meat as 137 well as milk are important Cs donors to the human diet.
3.7.2. Danish milk 90
The variabilities among years of Sr (CV „ _ „ =0.7) and of 137 ™ years
Cs (CV =1.5) in Danish milk were within the ranges p years of those observed for grain and vegetables. V/ithin years, the 90 Sr milk levels were nearly constant from month to month,
137 while the Cs concentrations were 2-3 times higher in the summer months than in midwinter. This resulted from the change
in the composition of fodder during the year, which influenced
137 90 the Cs/ Sr ratio of the cattle feed. The local variability
was higher for 137Cs (CV l o c a t i o n s = 0.35) than for 90Sr
(CV ,„„„,.„.,„ = 0.25). Milk from Lolland-Falster showed a lower 137p 1%iitl-ons
Cs/ Sr ratio than milk from West Jutland, because the
fodder from Lolland-Falster contained relatively high amounts
of refuse from sugar beet factories, and this material was
lower in Cs/ Sr than, e.g., grass.

- 159 -
On the average, Danish milk products cortained 11% higher
concentrations, of Sr and Cs than the milk consumed in
Denmark. However, in recent years the increasing consumption
of milk from Jutland in east Denmark has reduced the difference.
The radioecological sensitivities of Danish milk were 3.3 pCi an _i an _ i an _o uSr (g Ca) x y (or 4 pCi * Sr 1 x y) per mCi Sr km and
3.4 pCi 137Cs (g K) ~1 y (or 5.5 pCi 137Cs l"1 y) per mCi 137Cs -2
km . The sensitivities of milk from Jutland were 1.3 and 1.5
times higher than those of milk from the Islands with respect
to contamination by Sr and Cs, respectively.
90 Of the Sr intake with fodder, the Danish cows secreted 0.2%
l"1 milk and of 137Cs 0.7X l"1. The "observed ratio" of 90Sr
(g Ca)~ in milk and fodder was in the range 0.09 - 0.15.
89 The radioecological sensitivity of Danish milk to Sr con-90 tamination was 13% of that of Sr. The total infinite time-
89 integrated Sr level in milk contaminated by fallout from the 90
1961-1962 test series was 80% of that of Sr.
131 The transfer factor of I from deposition to milk was 0.6 pCi 131 -1 131 -2
I I y per mCi I km . The t rans fe r fac tor from grass
to milk was 0.01 pCi 1 3 1 I l " 1 per pCi 1 3 1 I kg - 1 dry weight {20%
dry matter in g r a s s ) . Danish milk showed a r e l a t i v e l y low 131 s e n s i t i v i t y t o contamination with I because of the high
product ivi ty of the pas tu re s , and a l so because of the use of
r e l a t i ve ly large amounts of supplementary fodder, which i s
often stored food tha t i s f ree of sho r t - l i ved nucl ides such as 1 3 l i .
3.7.3. Faroese milk 90 Contrary to Dar Lsh milk, the variability among years of Sr
137 and Cs in the Faroes was nearly identical for the two
nuclides (CV . . = 0.7), indicating that indirect con-p years
tamination was of equal importance for the two nuclides. Faroese 137 milk did not show any marked seasonal variations for Cs such
as was the case for Danish milk. The local variability was more pronounced for Cs (CVp i o c a t i o n s =0.3) than for Sr

- 160 -
(CV l o c a t i Q M " 0.05). Milk from Tværå thus contained 1.8
times more Cs than milk from Thorshavn, while the Sr levels
were nearly the same.
The radioecological sensitivities of Faroese milk were 9 pCi 90 -1 90 -1 90 -2 *wSr (g Ca) x y (or 10 pCi *uSr 1 y) per mCi * Sr km * and 35 pCi 137Cs (g K)'1 y (or 60 pCi 137Cs l"1 y) per mCi 1 3 7Cs -2
km . These sensitivities were 2.6 and 10 times higher,
respectively, than the corresponding sensitivities of Danish
milk. Taking the higher deposition in the Faroes into account, 90 Faroese milk contains nearly 6 times more Sr and 20 times 137 more Cs than Danish milk. The radioecological sensitivities
of Faroese grass suggested that imported fodder reduced the
levels in Faroese milk compared to those expected for a pure
Faroese grass diet.
3.7.4. Meat from terrestrial animals
The variability among years of Cs in Danish beef (CV v e a r =
1.2) was similar to that of milk, and this was also the case 90 for Sr (CV „___ = 0.6). The radioecological sensitivity of
p y 137 -1 137 -2 beef was 27 pCi Cs kg y per mCi Cs km , or beef was 5
137 times more sensitive than milk to contamination with Cs. In 90 the case of Sr in beef, the radioecological sensitivity was 20 times lower than that of Cs. Caesium-137 in pork showed a
higher variability among years (CV_ „____ =1.6) than beef, but p yeaiB
within the years the variability in pork was lower because of a more constant seasonal composition of the fodder. The radio-
137 -1 ecological sensitivity of Danish pork was 34 pCi Cs kg y 137 —2 90
per mCi Cs km , and for Sr the sensitivity was 40 times lower.
Faroese and Greenlandic mutton showed similar variabilities of 137Cs among years (CV\ „____ = 0.9). The radioecological
sensitivity of Paroese and Greenlandic mutton was estimated 117 _i 137 -2
at 0.3 nCi Cs kg y per mCi Cs km , i.e. an order of
magnitude higher than that of Danish meat. As compared with
Paroese milk, Paroese mutton showed a 3 times higher sensitivity 117 tjQ
to Cs contamination. With respect to Sr, the sensitivity of mutton was 4 pCi 90Sr kg"1 y per mCi 90Sr km"2, or 75
137 times lower than that of Cs.

- 161 -
The variabilities among years of Cs and Sr in reindeer meat
were in the range 1.6 to 1.0, which was higher than the
variability of lichen (0.3-0.4), suggesting that lichen was
not a dominating constituent of reindeer fodder in Greenland.
Reindeer meat from the spring and late winter contained 2-3 90 137
times more Sr and Cs than autumn samples. The radio-ecological sensitivities of Greenland reindeer meat were 1.5 nCi 137Cs kg"1 y per mCi 137Cs km"2 and 15 pCx 90Sr kg"1 y per mCi Sr km *, and of reindeer bone 100 pCi Sr (g Ca) x y
90 —1 90 —2
(or 37 nCi Sr kg y) per mCi Sr km . Reindeer showed the
highest radioecological sensitivity of the animal samples in
this study.
The radioecological sensitivity of musk ox meat from East 137 -1 137
Greenland was estimated at 0.08 nCi Cs kg y per mCi Cs -2 90 -1 90 -2
km and 4 pCi Sr kg y per rcCi Sr km , which was 20 and
4 times lower, respectively, than the corresponding sensiti
vities for reindeer.
3.7.5. Fish 90 137 The variabilities among years of Sr and Cs in fish were
similar, and they were lower in Denmark (CV „_„ =0.3) than •* p years
in the Faroes and Greenland (CV ,„„ = 0.5), in agreement p years
with the variabilities observed for sea water from these
locations. The radioecological sensitivity of cod from Danish waters was
137 -1 137 -2
20 pCi Cs kg y per mCi Cs km , the corresponding
sensitivities in Faroese and Greenlandic codfish were 2 and 9,
respectively. The transfer factors from sea water to fish flesh
were 90, 60 and 40 pCi 137Cs kg"1 y per pCi 137Cs l"1 y for
Danish, Faroese and Greenlandic codfish, respectively, 137
suggesting that the transfer of Cs ';as relatively higher in low salinity water than in high. Due to its dependence upon
137 the accumulated Cs in the sea, the radioecological sensitivity of Danish cod was as high as 75* of that of Danish
beef. The radioecological sensitivities of fish to ^Sr con
tamination were in general 1-2 orders of magnitude less than 137
those of Cs, in agreement with the observations for
terrestrial animals.

- 162 -
3.7.6. Various animals
The radioecological sensitivities of Marine aaaaals (seals and
whales) frost Greenlandic and Faroese waters were in the range
of 5-15 pCi 137Cs kg-1 y per aCi U 7 C s fca"2 and 0.3 - 0.B pCi
Sr kg y per aCi Sr ka~ , which was siailar to the
sensitivities of fish and sea-birds froa these areas.
Hens' eggs frosi Denmark showed nearly the same variability 40 117
among years for Sr and iJ/Cs (CV « 1.3). which
corresponded to the variabilities of Cs in »ilk and stat.
Faroese eggs contained concentrations of Sr and Cs
siaiilar to the Danish. The radioecological sensitivity of Danish
eggs was 1.3 pCi ^Sr kg"1 y per aCi ^Sr ka~2, i.e. siailar
to that of Danish seat, but in the case of Cs the sensitivity
of eggs was 20 tiaes lower than that of aeat, namely 1.8 pCi 137Cs kg"1 y per aCi 137Cs km"2.

- 163 -
4. MAN - TOTAL DIET AND HUMAN TISSUES
4.1. Introduction
Man is by definition the last link in the human food chain. In
health physics man is considered the critical organism and dose
limits are established with a view to protect individuals,
their progeny and mankind as a whole (Ic77). If man in his
natural environment is not at risk from a radiological point of
view, it may be anticipated i-hat populations of other organisms
in the same environment are also protected against radiation
hazards.
In the preceding chapters emphasis has been laid on the two
radionuclides whose use of the food chain is of foremost
importance as a pathway to man, namely Sr and Cs. Radio-
strontium concentrates in calcified tissues, i.e. in human bone
and teeth, while radiocaesium accompanies potassium and thus
occurs in soft tissue. Wholebody counting makes possible the 137 in vivo assessment of the Cs content in humans, because
137 137 Cs - Ba are detectable by Nal scintillation counting,
90 being y-emitters. In the case of Sr it is impossible to determine the radionuclide content with reasonable accuracy by
90 90 means of an in vivo measurement, because both Sr - Y are 8
emitter . Only if there is substantial contamination is an
assessment possible by means of a bremsstrahlung measurement of 90 Y (E max = 2.3 MeV) (Be64a) . Radiostrontium in man must thus
be determined either by means of autopsy samples of bone tissue or by the analysis of tooth samples. Excreta and urine (Cz63)
90 may be used for an indirect evaluation of the Sr content of
the human body. Other methods have been proposed, e.g., analysis
of human hair (Ho63). Such methods have, however, not bean
applied to any large extent because of difficulties in
interpreting the results.
A«* the concentrations of Sr and Cs in human tissue are

- 164 -
closely related to the diet levels, the study of the con
centrations of these radionuclides in the total human diet is
warranted. Although some items of food are more important than
others as radionuclide donors to the diet, the relative con
tributions from the various diet components show considerable
variations in time (X). In studies of the Danish total diet it
was thus considered appropriate to include all ingredients, even
those normally considered insignificant as donors of fallout
radionuclides.
4.2. Total diet
Men dtt Mltxkonttigitt van dog, at Sut the cunningest aiiangement o i alt mat naan man holdt fingtutn ind i Vampen ihat, i& ijou httd i/oul iingel in the steam jta Cnydtn, iaa bundt man it\ax fugte, &*om the pot, IJOU could at once smell uihat hvad Had det blev tavet i hvtl Skotstttn, w«4 being cooked on eveMj iixe in the town. del vat i Byen. THE SWINEHERP
SVINEDRENGEN
Comprehensive long-term studies of Sr - and later of Cs -
in the total human diet have been carried out since the end of
the fifties in the UK (Br58, Ag59), the USA (Ku58, Has60) , West
Germany (De70), Japan (Na63) and in Denmark (RRD60) . The UK
studies were discontinued in 1965 (Ag66) and replaced by milk on
analysis because the Sr milk concentrations in the UK seemed
to be closely related to the total diet levels.
Several methods have been used to estimate the radionuclide
content of the total diet. From the analysis of individual diet
constituents collected at the location of production, combined
with information on the composition of the human diet, the
total intake of the various radionuclides with the diet may be
calculated. This method has been applied in studies of the
Danish, Faroese and Greenlandic diet. The diet components may,
however, also be collected at the location of consumption and
pooled into one sample before analysis. The two methods are not
necessarily identical. In Danish studies fcf.A.l.), milk has
thus been represented by dried milk from seven factories and
by fresh milk from 48 towns. In the case of grain products,
the radionuclide levels found, using the first method, were
calculated from grain samples collected at 10 experimental
farms, while in the last method bread purchased in 48 towns was

- .16 5 -
used. Also the samples of potatoes and some other vegetables,
of fruit, meat, fish and eggs originated from different sampling
locations and sampling periods in the two methods. Finally,
direct sampling of meals from private households or institutions
may be used. This method was occasionally applied in the present
studies (RRD60, RRD62, RRD64, RRD65).
The composition of the diet may be estimated from statistical
information on the consumption of feds (Da57-77) , or from
interviews concerning food habits in selected population groups
(Da68). The composition of the Danish total diet was estimated
from a combination of these methods by HOFF JØRGENSEN (RRD6 2) in
1962. The food habits of a population change with time, however,
especially during periods with rapid changes in the socio
economic structure of society. For clarity, the composition of
the original diet has been kept unchanged in this study. In
table D.4.2.I., however, the 1962 diet is compared with a 1975 90 137 diet estimate, and the 1976 concentrations of Sr and Cs in
the various diet components were used as an example of the
differences between the compositions of the two diets. The 137 composition of the 196 2 diet seemed to underestimate the Cs
levels in 1976, because the consumption of meat and fish has
increased since 1962. Nevertheless, as the potassium intake has 137 also increased, the Cs/K quotient was nearly unchanged in
the two diets. Bread consumption has decreased since 1962 while
the consumption of milk has increased. This resulted in a net
decrease of Ca and stable Sr in the total diet. The Sr/Ca
quotient had consequently decreased only a little from the 196 2
to the 1975 diet. The variations in the composition of the diet 90 thus played only a minor role with respect to the Sr/Ca and
137 137 Cs/K ratios, but the total intake of Cs may have been
underestimated by 10-20% in recent years. Prediction models for
futi 137,
90 future levels should therefore be based on the Sr/Ca and
Cs/K ratios rather than on the total intakes of the two
radionuclides.
4.2.1. Variation with time and location ] 37 The variability of Cs with time in the Danish total diet was
twice as high as that of 90Sr (cf. tables B.4.2.1 and B.4.2.2).
As appears from figs. 4.2.1.1. and 4.2.1.2, the maximum con-

- 166 -
- i — i — 7 — r
102 L
o o
£ 101
u a
10°
a West Jutland • Lolland - Falster
_i i _ i I l I I l l 1 1 1 1 I 1 L
66 70 75 YEAR
rig. 4.2.1.1. Strontium-90 In the Danish total diet
("Diet C" cf. Table A.1.4.2.) collected in West Jutland
and in Lolland-Falster in 1962-1976* the two areas of
the country represented the maximum and the minimum
mean values, respectively, for the period of observation.
centrations in the Danish total diet occurred in 1963-1964. 90 Since then the Sr levels have decreased by a factor of 10-15,
137 while the Cs levels have decreased 25-30 times. The higher
time variability of 137Cs (1.29) than of 90Sr (0.60) in the 137 Cs period 1962-1974 was due to the dominating dependence of
137 on direct fallout for most of the important Cs donors to the
diet. The time variability of Cs and Sr in milk was 1.5
and 0.7, respectively, (1962-1976), and in rye bread the
corresponding figures were 1.56 and 0.72 (1962-1974). In fish,
the time variability of 137Cs was 0.26 (1963-1973). It was thus
evident that fish contributed to a reduction of the time 137 90
variability of Cs in the diet. In the case of Sr, the low

- 167 -
102
Ol
£> 10'
o o.
- | — i — i — i — i — i — i — i — r — r ~ i — r — r — i r
10°
?Wes» Jutland 0 LcUand- Falster 1 ' l L _ J I I l I l l i I l I L
65 70 YEAR
75
Fig. 4 . 3 . 1 . 2 . Cesliui-137 in the Danish t o t a l d i e t {"Diet C", c f . Table A . 1 . 4 . ; . ) co l l ec t ed in Neat Jutland and in Lol land-Palster in 1961-197«.
variability among years in vegetables (table B.2.5.3.) lowered
the variability of the total diet.
The local variation followed the general pattern observed for
the various components of the Danish diet; the Sr and Cs
levels in Jutland were higher (1.3 times) than the concei.-90 trations in the diet from the Islands. In the case of Sr,
the concentrations in West Jutland were the highest, while
those in Lolland-Falster were the lowest (fig.4.2.1.1) . In the 137 case of Cs, the local pattern changed with time (fig.
4.2.1.2), i.e. the interaction between location and years was
significant (table B.4.2.2.). The local variability was 0.16
for 13?Cs and 0.13 for 90Sr during 1962-1966. In 1973-1976 it
had decreased to 0.12 and 0.10, respectively (table B.4.2.3),

- 168 -
because the transfer of food (e.g. milk) between the various
areas of the country had increased. Milk products were mainly
responsible for the local variability of Cs in the total
diet, but meat was also of importance (cf. tables B.3.2.1. and 90 137
B.3.4.1). The local variabilities of ^Sr and iJ Cs in the
total diet were lower than the corresponding variabilities for
fresh milk (CVp ( l o c a t i o n s S r ) « 0.22, CVp ( l o c a t i o n s C s } = 0.27),
and higher than of white bread (CVp ( l o c a t i o n s S r ) = 0.04, CTp (locations Cs) = °'06) ' b u t s i m i l a r t 0 t h O S e °f *£ b r e a d
(cf. table B.2.3.1). The local variabilities of both Sr and 137 90
Cs were also close to that observed for fallout (mCi Sr
km ), which displayed a local variability of 0.16 for the
state experimental farms during 1962-1974. This was, however,
fortuitous as the fallout levels were not the only source of
local variation.
4.2.2. Relations and prediction models
As milk is an important constituent of the diet, and plays a 90 special role as a donor of fallout radionuclides such as Sr
and Cs, it has been common practice (Un58-77) to relate diet
levels to the milk concentrations of these nuclides. Anovas of 90 -1 90 -1
the pCi Sr (g Ca) diet/pCi Sr (g Ca) milk ratios (table
B.4.2.5) showed a highly significant variation among years
(1962-1976) and among the 8 zones. Similar results were obtained 137 -1
by an anova of the corresponding pCi Cs (g K) ratios 90
(table B.4.2.6). The mean Sr ratio between diet and milk was 137
1.44 during 1962-1976, and for Cs the corresponding ratio was 1.57. The anovas furthermore showed highly significant
interactions between years and locations. It was thus evident 90 that the approach used in the UK of estimating dietary Sr
levels from milk levels (Ag66) would be inappropriate under
Danish circumstances, mainly because milk is less important 90
as a Sr donor in the Danish diet than it is in the UK.
90 As bread and milk contributed 70-90% (X) of the Sr in the
Danish total diet, it was obvious to consider the diet/milk +
bread iatioj however, also this ratio varied significantly with
time (1962-1972) as well as with location. There was thus no
simple substitute for a sampling of the total diet.

- 169 -
TO2
o o
S
o Q.
X)0 -I I I 1 t 1 • » » • ' '
55 60 65 YEAR
70 75
90, Fig. 4.2.2. Predict«! and observed *uSr levels in the
Danish total diet. The dotted curve represents the pre
dicted values for "Diet C" (cf. Table A.1.4.2.) according
to Table C.4.2.1. No. 1, and the circles are the corre
sponding observed values (r - 0.9924***). The unbroken curve
represents the predicted values for 'Diet P" (cf. Table
C.4.2.1. No. 7), and the triangles the corresponding
observed values (r - 0.9883***).
Prediction models were calculated for total diet samples
(D.4.2.3) ("consumption data") (tables C.4.2.1 and C.4.2.2) and
from the data obtained based on single component measurements
(RRD59-76) ("production data"). In the following, the two
types of sample are called "Diet C" and "Diet P". In fig. 4.2.2.
the two diet, types are compared with each other and with their
respective prediction models. The agreement was generally 90
satisfactory. The radioecological sensitivity for Sr in the 90 —1 90
total Danish diet (unit: pCi Sr (g Ca) ^ • y per mCi 7"Sr _2
km ) , according to the models used in fig.4.2.2., was 6.0 for
"Diet C" and 5.0 for "Diet P" (tables C.4.2.1 Nos. 1 and 7 ) .
If equations Nos. 2 and 8 in table C.4.2.1. were used, the
sensitivities became 4.3 and 5.0, respectively. The mean of
these estimates was 5.1 + 0.33 (1 SE) j the radioecological
sensitivity for the diet in Jutland was not significantly
different from that in Zealand; both were close to the country
mean. This was not surprising, although Jutland milk showed

- 170 -
approx. 1.3 times higher sensitivity than Islands milk (C.3.2.1) 90 because bread, which was the most important Sr donor, showed
only minor local variations (2.3.1.).
137 The radioecological sensitivity of Cs in the Danish total 137 -1 137 -2
diet (unit: pCi Cs (g K) • y per mCi Cs km ) was 4.2
(table C.4.2.2. Nos. 1 and 8) for both "Diet C" and "Diet P".
Equation 6 in table C.4.2.2. gave a sensitivity of 4.7 for
"Diet P". The mean of the three estimates was 4.4 + 0.15 (1 SE); 137 in the case of Cs the radioecological sensitivity was 1.08
times higher in Jutland than in the Islands. This difference 90 from Sr was not unexpected as milk (and thus presumably also
beef) showed a higher sensitivity in Jutland than in the 137
Islands, and also because bread was less important as a Cs
donor than milk and meat (X).
90 A comparison between the radioecological sensitivities of Sr 137 and Cs required a normalisation of the sensitivities to, e.g.,
pCi (caput) . According to table D.4.2.I., the annual per
caput intakes were 623 g Ca and 1281 g K (1962 diet composition); 90 hence the sensitivities became 3.2 nCi Sr per caput per mCi
90 -2 137 137 -2 Sr km and 5.6 nCi Cs per caput per mCi Cs km
The total diet was thus 1.75 times more sensitive to con
tamination with Cs than with Sr. As the total Sr deposited -2 137 -2
in Denmark was 73 mCi km , and the total Cs was 117 mCi km , the infinite exposure integrals to the Danish population became
90 137 234 nCi Sr per caput and 655 nCi Cs per caput, i.e. the
137 intake with diet of Cs from nuclear weapons fallout was 2.8 90
times that of Sr.
Table 4.2.2. lists the contributions from the various diet
components to the radioecological sensitivity of total diet.
It appears that the sums of the individual contributions are
close to those estimated for the total diet. It should be noted
that coffee and tea were not included in table 4.2.2., which
means that the sums should probably have been a few per cent
higher (2.5.4.). UNSCEAR (Un77) has also estimated the con
tributions from the various diet components to the total intake
of Sr and Cs in Denmark, as shown in table D.4.2.2. The
UNSCEAR estimate was in general agreement with the present one.
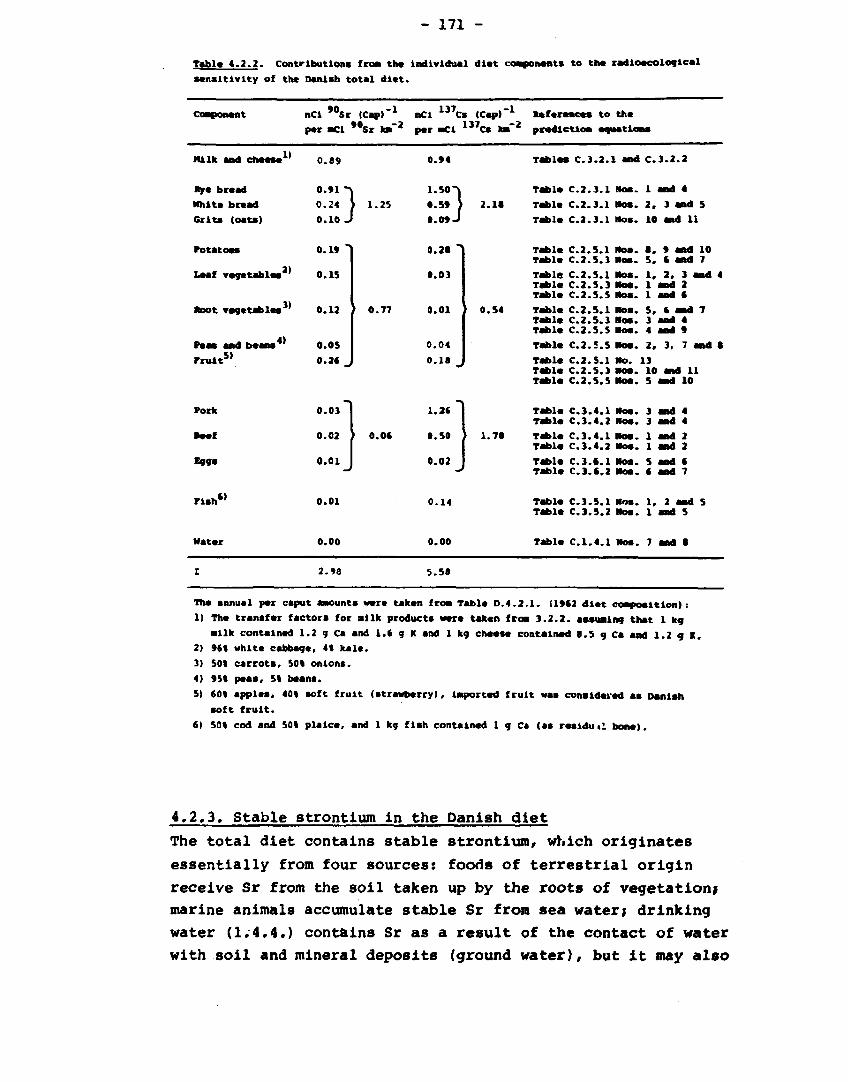
- 171 -
sensitivity of
Component
the
Milk and e h M N 1 1
aye bread
Wilt* bread
Grits (oats)
Potatoes
Leaf vegetables2'
Root vegetables3'
Peas and beans '
fruit51
Pork
Beef
Eggs
Danish total diet.
i»Ci *°Sr
per mCl
0.89
0.91 -|
0.24
0.10 J
0.19 '
0.1S
0.12
0.05
0.2« -
0.03*1
0.02
0.01
ICap)"1
»°Sr km"*
> 1.25
1 0.77
» 0.0C
nCl 1 3 7Cs (Cap)"1
per mCi
0.94
i.so-\ 0.S9 >
0.09J
0.28 "
0.03
0.01
0.04
0.1« -
1.2« "*
0.50
0.02
" 7 C S km"*
2.
0.
1 " •
1«
54
70
References to the
prediction equations
Tables C3.2.1 and c.3.2.2
Table C.2.3.1 Hos. 1 and 4
Table C.2.3.1 Hos. 2. 3 and 5
Table C.2.3.1 Mos. 10 and 11
Table C.2.S.1 Nos. •, 9 and 10 Table C.2.S.3 Hos. 5. C and 7
Table C.2.5.1 Ros. 1, 2, 3 and 4 Table C.2.5.3 Hos. 1 and 2 Table C.2.5.S Res. 1 and «
Table C.2.5.1 Hos. 5. « and 7 Table C.2.5.3 Hos. 3 and 4 Table C.2.5.5 Hon. 4 and 9
Table C.2.5.S Hos. 2. 3, 7 and •
Table C.2.5.1 Ho. 13 Table C.2.S.3 H O S . 10 and 11 Table C.2.5.5 Hos. S and 10
Table C.3.4.1 Roe. 3 and 4 Table C.3.4.2 Hos. 3 and 4
Table C.3.4.1 Hos. 1 and 2 Table C.3.4.2 Hos. 1 and 2
Table C.3.C.1 Hos. S and « Table C.3.C.2 Ros. C and 7
rish s> o.oi 0.14 Table C.3.5.1 Hos. 1, 2 and 5 Table C.3.5.2 Nos. 1 and 5
Mater 0.00 0.00 Table C.1.4.1 Hoe. 7 and •
2.98 5.58
The annual per caput amounts were taken from Table D.4.2.1. (19C2 diet composition):
1) The transfer factors for Milk products were taken from 3.2.2. assunlng that 1 kg
milk contained 1.2 g Ca and 1.« g K and 1 kg cheese contained 8.5 g Ca and 1.2 9 K.
2) 9«t white cabbage, 4« kale.
3) 501 carrots, 50% onions.
4) 951 peas, 5* beans.
5) COt apples, 401 soft fruit (strawberry), imported fruit was considered as Danish
soft fruit.
6) 501 cod and 50« plaice, and 1 kg fish contained 1 g C« (as reslduil bone).
4.2.3. Stable strontium in the Danish diet
The total diet contains stable strontium, which originates
essentially from four sources: foods of terrestrial origin
receive Sr from the soil taken up by the roots of vegetation;
marine animals accumulate stable Sr from sea water; drinking
water (1.4.4.) contains Sr as a result of the contact of water
with s o i l and mineral deposits (ground water), but i t may a l so

- JL / -
receive some stable Sr from the influx of sea water; and
finally the creta praeparata added to Danish flour contains
stable Sr of mineral origin.
Stable Sr in the diet was studied in order to estimate the
relative contributions from indirect contamination (root uptake) 90 of Sr in the various diet groups. In this case, only the
first source of stable Sr mentioned above need be considered.
Hence, instead of an annual intake of 1083 mg Sr (cf. table
D.4.2.I.), the intake became 243 mg Sr y (coffee, tea, beer
and wine were not included as drinks). The relative contri
butions to this total stable Sr intake were 34% from milk
products, 27% from grain products, 34% from vegetables and
fruit, and 5% from meat and eggs. From the prediction models
referred to in table 4.2.2., the contributions to the radio-90 ecological sensitivities from the Sr accumulated in the
soil, i.e. from indirect contamination, may be estimated.
According to this calculation, milk products contributed 27*
of the overall radioecological sensitivity resulting from
indirect contamination of the total diet, grain products 32«
vegetables and fruit 39% and meat and eggs 2%. These figures
were correlated with those stated above for stable Sr (r =
0.9313*), and this supported confidence in the prediction
models. It may be noticed that in the case of a wholly indirect 90 contamination, i.e. in the absence of Sr in the atmosphere,
grain products were no longer the most important contributor 90 of Sr to the diet; vegetables and fruit then became the main
sources.
The studies of stable strontium may also be used to estimate
the discrimination against Sr as compared to calcium when
passing from one step in the food chain to another, e.g. from
soil to total diet. As long as direct contamination occurs, the
observed ratios between pCi 90Sr (g Ca)"1 in diet and soil are
not valid as an estimate for this discrimination. According to
table D.4.2.1. and the above assumptions, where creta praeparata,
fish and drinks were excluded, the annual calcium intake with
the total diet was reduced to 334 g. Hence the stable Sr level
in a diet that contained only Sr and Ca originating from root
uptake became 0.73 mg Sr (g Ca) . The stable Sr-to-Ca ratio

- 173 -
was determined in cultivated soils from the Danish state
experimental farms (table 0.1.6.2.3.). The mean content in the
ploughing layer was 2.88 + 0.15 rag Sr (g Ca}~ (+ 1 SE for 10
samples). ANDERSEN (An67a) found a mean of 2.90 + 0.14 mg Sr
(g Ca) in 21 Danish soils, and he found no difference between
the ratios obtained by HCl and by ammonium-acetate extractions.
Hence the observed ratio of stable Sr/Ca between diet and soil
in Denmark was 0.73/2.9 = 0.25; Ca was thus transported four
times as easily from the soil to the diet than Sr.
90 In 1975 (RRD75) the mean concentration of Sr in the ploughing
layer (0-20 cm) at the state experimental farms was 102 +10 90 -1 pCi Sr kg (+ 1 SE, 10 locations), the mean calcium content
(table D.1.6.2.3) was 2.7 + 0.7 g Ca kg , i.e. the mean pCi 90 -1 Sr (g Ca) ratio was 38 +_ 11. From the observed ratio of
0.25 between soil and diet, the total diet level from indirect 90 terrestrial contamination was estimated at 9.5 + 2.75 pCi Sr
(g Ca)~ . The measured level was 6.4 pCi Sr (g Ca)~ and of
this 1.4 pCi was estimated to be due to direct contamination
(table C.4.2.I., No. 1), hence only 5 pCi Sr (g Ca)
originated from accumulated fallout. If we corrected this ratio
to the above Ca intake from root uptake (334 g y ), we found
— ^ n — = 9.3 pCi Sr (g Ca)~ , i.e. in accordance with the 90
estimate of 9.5 based on the Sr to Ca ratio in the soil. This 90
agreement suggested that the Sr from fallout in the ploughing
layer followed the stable Sr, i.e. the availability to the
plants of the strontium isotopes did not differ significantly.
ANDERSEN (An67a) has shown that discrimination against radio-
strontium relative to Ca probably does not occur during root
uptake from Danish soils. Hence the discrimination against Sr
from soil to total diet takes place in the later steps of the
food chain, e.g. from grass to milk (3.2.) and from wheat to
white bread. According to British investigations (Ag62), the
ratio of stable strontium to calcium in flour was appreciably
lower than that in bran and fine offal; on the average the
ratio in flour was 0.71 that of grain.
The stable Sr to Ca ratio was determined in total diet samples
collected in 1963-1972 in Denmark. Table B.4.2.4. shows the

- 1/4 -
anova of the three main effects. The local variation was
pronounced. The highest levels occurred in Lolland-Falster,
Zealand and Copenhagen in accordance with the high Sr/Ca ratios
in drinking water from these localities (1.4.4.). The levels
in June were approx. 20% higher than those in December, in
accordance with higher Sr/Ca ratios in vegetables in June than
later on in the season (2.5.1.).
4.2.4. Faroese total diet
In the Faroes the total diet did not consist of locally
produced foods only. Cereals, vegetables, fruit and some milk
were imported from Denmark and other countries, especially the
U.K. Hence it was not possible to obtain a figure for the
radioecological sensitivity of the Faroese total diet in the
same way as for the Danish diet. However, in the case of global
contamination, such as that from nuclear weapons testing, a
sensitivity may be calculated assuming that all the foods
imported to the Faroes came from Denmark and that a deposition -2 1 -2
of 1 mCi km in the Faroes corresponded to 2 no m C i ^ i n
Denmark (1.3.1.), i.e. the Danish sensitivities were divided
by 2.08 to obtain the corresponding Faroese.
Table 4.2.4. shows the results of such a calculation. With 90 respect to Sr, the Faroese total diet showed a lower
90 sensitivity than the Danish because the important Sr donors 137 were derived from abroad. In the case of Cs, however, the
radioecological sensitivity of Faroese total diet was nearly
three times higher than that of the Danish because of the high
sensitivity of Faroese milk, potatoes and mutton to radioactive
contamination.
As the fallout rate in the Faroes was 2.08 times that in 90^
Denmark, the Faroese total diet contained 1.6 times more Sr 137
and 5.7 times more Cs than the Danish diet. The radioecologi-90 137
cal sensitivity of Sr and Cs in the Faroese total diet may
also be related to the congeners Ca and K* the infinite time' 90 —1 137 —1
integrated pCi Sr (g Ca) and pCi Cs (g K) quotients were respectively 2.3 and 6.2 times those of the Danish diet.

- 175 -
Taal« 4 .2 .4 . Ta* caatrtkMtta« f r a " taa ta l l vMaa l * t * t i a » i » i m <• l a * raataacalaa,i,«al araatt ivt ty aff taa raraaa* t««*s « t « t . ivtat < w | i i a w * arcsrgts? ta ilfflff Jfft^i is|» «aar 4 2 n .
Cl | linn« »• ) T l 1 Ca"' aet * * S I K a p ) * 1 • «*' *Ct l * ' e » t r a p l * 1 aataraasaa c* ****i£;>.at « , < - 1 r l k*r - c . * * f , a . ' 1 , " 1 K * -C« l " = » • " " * aajaMMa**1
i*aa) fcaal~'
r u m u U i t« .S X I I . « 1.11 | 17% 4 . « ] Takl« C l . K l I > H . i aat I
•aajåaa a * u H . $ « ) . • 4.4T ) i . l e M »-I4 > 4.14 Takl* c ) . 1.2 [ I aas. 7. * . ». 1 * . I I . U
Daauui Ciaaaa 7.1 »2.1 t.ilj • « . c l J
3*at«h - . -. Tak l * C.2.1.1 rya a n a l M .« 41.1 4.27 | 10* 4.411 u . t aw •
Kt. i t* kraW 14.1 54.1 « . « i * . « • ) 5 . 2 4 ) ».T« Takl * C . l . l . i
Baatah « r i t« 1.1 24.1 4.41 1 14
r»ra*»* Takt* C.2.1.1 aasataaa t i 2 . * 9.21 1 i«« • . •af l a n . 11 ajat 12 Daatah laat I I Tak l * c .2 .1 .1
12 . • ( . 1 4.41 I 4.01 I aas. 4 aa« 4 ) 1.1» 42
< ^ < - . a l n 7.2 2.1 4.04 i M u m frsit 14 1-4 O.04J 21
raraasa asctas 14.5 l .» 0.0*~) 4« \.te~\ Takl« 0 . 4 . 1 a a * . 1 a 4 4
4 .1 4 . * • l 2 * » . « » l Tak l * 0 . 4 . 2
raraaaa k i r « . 4 . 4 1 .Mann «eas 4 . 4 J 1 . 0
>. 1 a*4 4 14 I Tak l * C ) . 4 . 1 a * . 1
» -* Takl* C. 1.4.2 J a l l
r a r a n * (tak 41 1.1 S.4I M l ".11 Takl* c .1 .1 .1 •ak . I aa* 4 Takl* C.1.1.2 • a s . I a 4 I
raraaa* watarc> 14« 2.1 3.C4 4 -1.42 Takl* C l . 4 . 1 9a*. 4 . 14. 11
Total raraaa* a la t 411 2.14 1174 11.12
»' *»a eaatrtaatlaa* f r a * t a * t a u t - i t a a M * t « t i i | t * * « r * aktataa« (raa Uw aaaattaa* r*c*rr*s u 1« Takl« 4 . 2 . 2 . , t a k l * * l a te areaaat aka (aet Jtat ta* CalUat ra t * •* **Sr aa* l , 7 c . ta t a * raraaa - a * 2.34 : t a w that ta Daaaack (et. t it* t a a t ) .
kl K t C i M l cantaata • ( aka IMalsk araaact* ' * *c*at kraaaT) «*r« takaa rraa Tak l * 3 . 4 . 2 . 1 . Ta* C» aa* I 1«"»1» ta raraaa« araaaata apt* la k l * * « a*r* tjt* • * « * l « * * u ta (raak saaal** laa<r t *0 aaaaara«
taraaafcout tfc« year« 'Utr 42-741.
« t a * 1 , T C * caftcaatrattan In tfrlaklaa; vatar « • a i a a l ta a* 4.21 ttawa 01« " $ r l « * * l nta » • - ' • 1 .
The d i f ferences between the two d i e t s were enhanced due t o the lower Ca and K content of the Faroese d i e t .
In the case of l o c a l airborne contamination l i m i t e d t o the Faroese environment, the imported foods would be free of contamination, and the r a d i o e c o l o g i c a l s e n s i t i v i t y of the Faroese
- 1 —2 t o t a l d i e t would be reduced to 1.5 nCi cap per mCi km for 9 0 S r . Only a minor reduct ion of Cs would occur because a l l
137 the important Cs donors are of Faroese o r i g i n ; the s e n s i -- 1 -2
t i v i t y would in t h i s case be 14.4 nCi cap per mCi km .

— I ( ». —
4.2.S, Greenlandic total diet
In analogy with the calculation of the radioecological
sensitivity of the Faroese diet, this may be estimated for the
diet in Greenland (table 4.2.5.) assuming that the fallout rate
measured at Godthåb was representative for the population of
Greenland as a whole. A deposition of 1 mCi km from global
long-lived fallout in Godthåb corresponded to g—j= mCi km"
in Denmark, and the radioecological sensitivities of Danish-
produced foods were consequently divided by 0.75 to estimate
the equivalent sensitivities in Greenland.
- • t i t c ^r-.<£*.-*
•"»!>• a»r»** *^
* * t i t * 4 r « * 4 ~ "
Ztizs
r .t *•-*** '•'*<•* ramies T m t
i r . « ; : ; » ~t. r v t & t e v
• c . s * « l
Zt. *feai* '*?. s * a - * i r m s
*«»
**. J
**.. k_ ^
S i . «
:_<. ; ?_*•
«.w ^ . i i
: * . « ; . i
4 .«
«.
- ; . i
.;«-. *•-*
..« ;.) :.; 5 . *
• : . i
-.' ; . i
•-'1 --••
- > ' >
• * J
• . : : - » ; : ' j
• • ; - ^
- - v ! i
*-** _/
i» . »ate?
•}
Tttavl £r***L«*4tc <ti*T
«i T>* earnerl»*tl<MS tt*m ?s# »anis^-pr^-t^or* <**? - « f n - . « T < *r»r« *r*:r:*"* ' T T - ?>.»• #-?I^T -. -r.s : * * ir t« Takle 4 . J . 2 . , takimc * t « w . t *f the far? tna; T"» f a i l ' s ^ .r. ; r w . i r ! » » t ' . ' ' -'.-^-s -n*^ -.-*rf. the t e s t ? .
»t I»cit*4e€ * . • t ? i K s m t t * fry*, 1*3* ••TractsiaC _ «» Iaci«Are • . • ** %*•%«• rye fcr**** 'rye , to* » n r » r ! i r . A tlte Ca a*4 * C W I I M U la damlsh products wrr* taken f r « Tafci* ^ . « . i . i . 7»» "* r t » :* -» :* in :r~
lem4lc a>g*mec<* werr Cfc* m*am l e w i s ir. ?r**?i l i m i t « '*n**t*«ii j»*4«*r*-* ?\r-*-a«?i-»-.i-. -h~ y**r* it'"1
A « Ca C M teat i-. f i s h «#a» est imat** ' n m the r a f * w * *amp:<rt **F *J-T4. . r** •* cmt«?" ar.-t ^ * C»'' Sr rett<> tr 4 r t s * t n * » r « r »^r» •j* l ia«*.*i ?^ »»* #*-*«l i« ?.*>"»* -*f r*r"*<* » * ? « ?«&:- « . :
«» T*e transfer f*ct'»r f^r i r t* fi*ft » « * * T I W * * 4 ** ?*« «»«« *! ?*-*? f>? r'*r '**<* *a-i :*s^*^. - * * d i v e r t * 1 * tat* tA* :r«*nlamrftc f a l ^ - j t ra t* .
90 In the case of Srr the sensitivity of the Greenlandic total
diet was similar to that of the Danish diet; for Cs, the
sensitivity of the Greenlandic diet was twice as high, due to
the consumption of local, terrestrial animals such as sheep and
reindeer*

- 177 -
In the case of local contamination in Greenland, the imported
foods would reduce the radioecological sensitivity of the -1 -2 90
Greenlandic total diet to 0.37 nCi cap per mCi km for Sr and to 6.6 for Cs. The Greenlanders could thus be at lower
90 risk as regards Sr than the Danish population in a similar
137 situation; concerning Cs, the risk would be a little higher -1 -2
than for the Danish population (5.6 nCi cap per mCi km ).
However, it should be recalled that diet habits vary consider
ably in Greenland, keindeer breeders may thus receive an order 137 of magnitude more Cs than seal hunters.
The estimated radioecological sensitivities and the measured
calcium and potassium levels in the diet suggested that the 90 -1 137 -1
infinite time-integrated pCi Sr (g Ca) and pCi Cs (g K)
ratios of the Greenlandic total diet were, respectively, l.l
and 1.7 times the corresponding Danish values, or respectively
0.5 and 0.3 times the Faroese levels.
4.3. Human bone
Vand i i ikal Vul iagde han, dandie paa "Vance i/m shall", iaid the angel, "dance dim \»de Skoe, til Vu blive* bleg og in you* ted ihoes until . .u a\e cold and kold', til din Had ikiumpen sammen som pate, until ycui tkin shiivels up like a skele-en Beeniads'. ton' j.'
Pf HOVE SKOE THE REP SHOES
90 Because of the chemical affinity of Sr with calcium, Sr
accumulates in bone tissue. Human bone was included at an
early stage of the fallout studies. KULP and co-workers (Ku57) 90 performed the first Sr fallout measurements of human bone
collected in 1955 from the USA, Europe (including Denmark),
Africa and the Far East, uater, comprehensive long-term studies
have been carried out in the USA by the AEC, Health and Safety
Laboratory (Be76), in the UK by the British Medical Research
Council (Me73), in West Germany by the University of Kiel
(De72), and in J?pan by the National Institute of Radiological
Science (Na75). Bone programme? have also been accomplished
in Australia, Canada, Czechoslovakia, Finland, France, Norway,
and the USSR (Un77) .
90 In Denmark, the initial Sr analyses of human bone were
performed at the University of Copenhagen (Le62) in 1953. The

- 178 -
samples were mostly derived from stillborn infants and children
in the Copenhagen area. Countrywide sampling of human bone
from all age groups began in 1961 iRRD61). The programme was
initiated in co-operation with the Danish National Health
Service and carried out by Risø.
The bone samples (vertebrae) were obtained from the institutes
of forensic medicine at Copenhagen and Aarhus. Most samples
were derived from the victims of accidents and could thus
be considered to "epresent a random and unbiased sample of
the population. However, for certain age groups (infants and
old people), such samples are relatively few and for these
groups samples were mostly derived from the victims of
diseases. However, there has been no indication that such bone 90 samples differ with respect to Sr from the samples obtained
from accident victims (Ha58-78).
4.3.1. Variation with time, age and location
The anovas of human vertebrae showed a significant variation
with time for all age groups. The maximum occurred for stillborn
2.5
2.0
IS)
=> 1.5
>
£1.0
0.5
0.0
YEARS **#
1.0
05 -
AGE *#
1.0
0.5
LOCATIONS **
65 70 75 0 1234 II IY VI
rig. 4.3.1.1. The variation of pCl 90Sr (g Ca)"1 in Danish infant bone (0-4 yaara old) collected in 1962-1976 in xonea I-VI (cf. Pig. A.1.4.2.1. and Table A.1.4.3.). The bar* show the levels relative to the grand mean 2.S pCl (g Ca)*1 (• 1 on the relative scale«),

- 179 -
2.0
1.5 -
z r> LU
> 1.0 _i LU OT
0.5
0.0
YEARS * * * A G E # * LOCATIONS * # *
60 65 70 75 20-29 30-39
AO-49 50-59
=80 70-79
60-69
II IY YI YIII
r i g . 4 . 3 . 1 . ; . 90 -1 The variation of pCi Sr (g Ca) in Danish adult bone (20-90 years
old) col lected in 1960-1976 in the eight »ones (ex. Fig. A .1 .4 .2 .1 . and Table A . I . 4 . 3 . ) . The bars show the l eve l s relative to the grand mean 1.3S pCl (g Ca) (« 1 on the re lat ive s c a l e ) .
children in 1964, for infants in 1964 (fig.4.3.1.1.), for
children in 1965 and for adulto in 1965-1966 (fig.4.3.1.2.) .
As compared with the diet, which peaked in 1963-1964 (fig.
4.2.1.1), the delay was evident and reflected the rate of
turnover for Sr in bone, which decreases with age (Be77b) . The
highest concentrations were found in bone of infants (6-12
months old) and the lowest in bone of adults (> 30 years) and
newborn children. In recent years the differences among age 90 groups have become less pronounced due to the decreasing Sr
90 concentrations in the diet. This reduces the Sr levels in
infant bone more rapidly than in the bone of adults and newborn
children, the bone levels of the latter also being influenced 90
by the adult Sr bone levels (cf.4.3.2.). Finally, adult human
bone levels in Denmark varied significantly with location (fig.
4.3.1.2.). Jutland showed approximately 20% higher levels than
the Islands, which was compatible with observations of the diet, 90
that contained about 30% more Sr in Jutland than in the
Islands.

- 180 -
The variability among years (table B.4.3.3.) for the perioo
1961-1976 was approx. 0.4, and it differed only little between
the various age groups. The time variability was a little
higher for infants (CV = 0.45) than for children p years
between 5 and 11 years old (CV = 0.30), which reflected 9§> years
the higher turnover rate for Sr in infant bone. As expected, the time variability of bone was somewhat lower than that of diet (CV ) "•• 0.6). Also as regarded local variability, p years J * bone showed lower values (CV„ „ „ ^ ^ ^ 0.1) than diet
p locations
(CV iocations = °*14^* T h e lesser local variability for bone
may partly result from the relocation of people during the
period of observation.
Because the bone samples consisted of vertebrae they may not 90 necessarily have been representative of Sr in the whole
skeleton. Studies in the UK (Br61) have shown that the Sr con
centration in children and adolescents was nearly uniform among 90 ami within the bones analyzed, thus the Sr concentration in
the vertebrae of these age groups was essentially equal to
that of the whole skeleton. For adults, vertebrae levels may,
however, differ from those of the total skeleton because spongy
bone such as the vertebrae have a relatively more rapid
turnover rate than ivory bones such as, e.g., the femoral
diaphysis (Br70). RIVERA (Ri64) found in two human skeletons 90 -1
from 1960 and 1961 that the pCi Sr (g Ca) ratio was 1.8
times higher in the vertebrae than in the entire skeleton. 90
During periods with increasing Sr levels in the diet, 90
vertebrae bone will generally show higher concentrations of Sr
than the skeleton as a whole, but with decreasing levels the
situation may reverse.
The average ratio between males and females with respect to 90 Sr concentrations in bone tissue was 1.11 in adult bone; but
anovas showed no significant difference between the two sexes.
4«3,2« Relations and prediction models
The observed ratio between Sr and Ca in bone and diet (ORtone/
,. .) has been determined by measurements of the stable Sr-to-Ca
ratios in the two types of sample. RIVERA (Ri63a) found a mean
ratio of 0.16. He analyzed samples of adult bone and of diet

- 181 -
from New York, Chicago and San Francisco, and, although the
stable Sr in the three diets differed by a factor of two, he
found the same observed ratios for the three locations. The
observed ratio between Sr/Ca in Danish vertebrae and diet was
0.12 + 0.02 (1 SE, 12 samples), i.e. not significantly different
from the findings of RIVERA. Other autnors (Br61) though have
found OR. ,,. . close to 0.25; it has not been clarified
whether these differences were due to artefacts or variations
in dietary and metabolic factors. It should, however, be noted
that the UK study (Br61) was performed on femur shafts, while
RIVERA used vertebrae. In another study (Ri63b) RIVERA found
the stable Sr concentration of the vertebrae ash to be 0.79
times that of the femur shaft, which may suggest a higher Sr/Ca
ratio in the femur than in vertebrae. The 0RKOne/Hiet seeme(^
to increase for the youngest age groups; in the first year of
life there thus seemed to be very little discrimination by the
infant against Sr relative to Ca, i.e. the OR was close to
unity (Co66b).
90 Various prediction models for Sr in bone have been proposed
(Ri66) throughout the years. One of the more simple and yet
adequate models has been that developed by the Health and
Safety Laboratory (Be77b):
00
B = c D + g £ D me"m A (Eq.4.3.1) n n _ n-m m=o
where
90 -1 B : pCi Sr (g Ca) in vertebrae in the year n
90 -1 D : pCi Sr (g Ca) in diet from midyear in the
year n-1 to midyear in the year n
90 c : short-term retention of Sr in bone
90 g : long-term retention of Sr in bone
-X 90 1-e : effective removal rate for Sr in bone
including radioactive decay f*gr-90 " °*025 v *

- 182 -
* i — i — i — i — r
r a)
a
60
~ i — r — i — r — i — i — i — r — i — i — I — r
65 70 YEAR
75
Pig . 4 . 3 . 2 . 1 . Stront lu*-90 In adult husan bona fro« Jut land. The curve represents the predicted values a c cording t o :
PCi *°Sr (g C . ) ^ ^ , - 0.018a - 1 »°Sr (9 C . ) d ] . t ( 1 )
0.021 I pel , 0 S r {9 CaK* d i e t 1-n
-0.23»
the c i r c l e s Indicate iit« observed values t 1 SE, the nuebers In the c i r c l e s the nuaber of sanp le s . All Ind iv idua l s Included were at l e u t 30 / ears o ld and a l l were born before 1935.
In figs.4.3.2.1 and 4.3.2.2., Eq.4.3.1 has been applied, with
minor modifications, to the adult bone and diet data from
Jutland and the Islands, respectively.
Considering a steady state where the fallout rate, and thu:;
the diet and bone levels, has become constant, the observed
ratio between bone and diet became:
OR (bone/diet) steady state: c +
A_ASr-90
(Ec.4.3.2.)
For adult bone, the OR according to (Eq.4.3.2.) should be equal
to that observed for mg Sr (g Ca)~ in bone and diet. The
Danish data (mean of Jutland and Islands data) gave OR = 0.16
(1 SE: 0.005), which was compatible with the above estimate
based on stable Sr (Ri63c) . However, the US bone data (Be77b)
gave an OR of 0.31 ', i.e. nearly twice the Danish value. UNSCEAR
*) A recent recalculation has given a figure of 0.10.
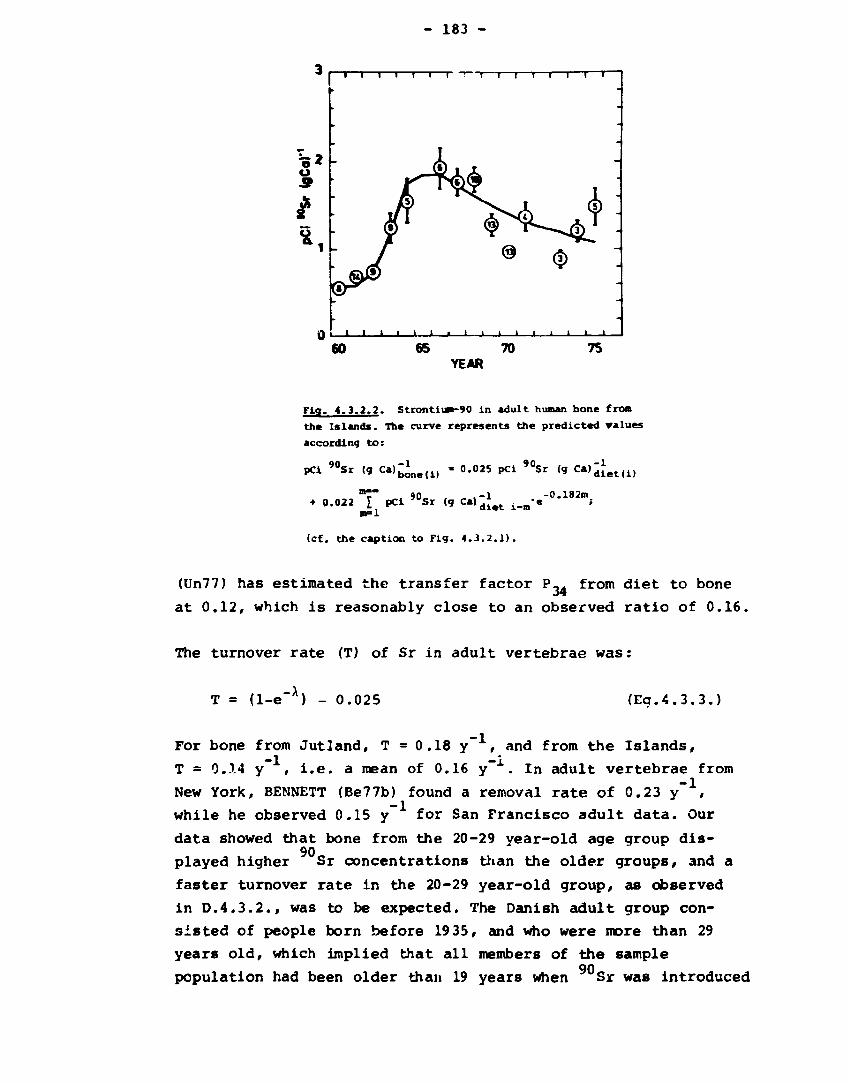
- 183 -
Fig. 4 . 3 . 2 . 2 . Strontium-90 in adult human bone from the Islands. The curve represents the predicted values according t o :
pCi 9 0 Sr (9 C a ) ; o n e ( 1 ) - 0.025 pCi 9 0 Sr (g C a ) ^ e f c ( 1 )
• 0.022 I PCi *°Sr (g C - » d ^ t , . „ -m=l
-0.182m
(c£. the caption to Fig. 4.3.2.1),
(Un77) has estimated the transfer factor P0„ from diet to bone
at 0.12, which is reasonably close to an observed ratio of 0.16.
The turnover rate (T) of Sr in adult vertebrae was:
T = (1-e A) - 0.025 (Eq.4.3.3.)
For bone from Jutland, T = 0.18 y , and from the Islands,
T = 0..14 y , i.e. a mean of 0.16 y~x. In adult vertebrae from
New York, BENNETT (Be77b) found a removal rate of 0.23 y" ,
while he observed 0.15 y for San Francisco adult data. Our
data showed that bone from the 20-29 vear-old age group dis-90
played higher Sr concentrations than the older groups, and a
faster turnover rate in the 20-29 year-old group, as observed
in D.4.3.2., was to be expected. The Danish adult group con
sisted of people born before 1935, and who were more than 29
years old, which implied that all members of the sample 90 population had been older than 19 years when Sr was introduced

- 184 -
into the human biosphere in 1953-1954 (cf.D.4.3.2.). The US
material, included only samples of subjects age 20 years
or older in 1954. Thus both the Danish and the US adult
materials represented adult metabolism for the entire period
of contamination.
Figure 4.3.2.3. shows the OR. . . , .. ,. . . based on Danish 3 (new-born/adult diet) w a a c u w" uau±an samples of bone and diet collected since 1963. As the foetus
°0 receives a substantial part of its J Sr (and Ca) from the
skeleton of the mother (Bo72) during the last part of pregnancy, 90 the Sr concentrations of the foetal skeleton will in periods
with decreasing diet levels be relatively higher, as compared
with the diet levels, than during periods with increasing diet 90 concentrations of Sr. This is because the turnover rate in
the maternal skeleton acts as a moderating factor on the foetal 90 Sr concentrations. Hence the observed ratios as seen in fig.
4.3.2.3. increased with the decreasing Sr diet levels (cf. fig. 4.2.1.1.)
The radioecological sensitivity of human bone to contamination 90 from Sr was estimated from the prediction nodels shown in
table C.4.3.1; the models (Nos. 2,4,6,8,10,12 and 14) that 90
assumed a single exponential decay of Sr gave average sensitivities which were only 60% of those obtained with the double exponential decay. The transfer factor P234 ^
roIa fallout to adult bone) was calculated from 4.2.2, where P ^ (from fallout
90 -1 to diet) was estimated at 5.1 + 0.33 pCi Sr (g Ca) • y per 90 -2
mCi Sr km , and from figs.i.3.2.1. and 4.3.2.2, where P 90 (from diet to bone) was estimated at 0.16 + 0.00 5 pCi Sr
(g Ca) • y, hence P~34 = 5.1 • 0.16 = 0.82 + 0.06. According
to equations (13) and (14) in table C.4.3.1, P234 was 1.05 and
0.59r respectively. In UNSCEAR's latest report P534 i s estimated
at 0.7 for the northern hemisphere (Un77). This estimate was
30% higher than UNSCEAR's previous one from 1972 (Un72). Hence
it was a matter of importance which model was used for the 90 prediction of Sr in bone. The best available estimate inay be
the mean of the present three estimates: 0.82, 1.05 and 0.59,
i.e. P234 = 0.82 + 0.13 (1 SE), which is thus 20% higher than
the latest UNSCEAR estimate.

- 185 -
0.30 -
0.20 0T O Ul > OL Mi «n
S 0.10
0.00
Pia. 4.3.2.3. Ih* observed ratios between pCi °Sr
(9 C«) in bone frosi newborn Danish infants and the
corresponding adult diet frost the saa* sone and period
as the bone. The nuaber of ratios included in the aeans
froa each year is shown In the circles and tl SE is
indicated. For comparison, the curve shows the observed
ratios between pCi *°Sr (« ca)" 1 in adult vertebrae and
diet.
As regards the radioecological sensitivities of the various age
groups, it appeared that the most sensitive group was that
covering the first year of life. The sensitivity of this group
was approx. 75% higher than that of the adult group. Children 90
were in general more sensitive to Sr contamination than adults,
except newborn infants whose sensitivity was similar to that
of adults.
90 — 1
The observed ratio (OR) between pCi Sr (q Ca) in bone of
Danish newborn infants and Danish diet was 1.04/5.1 = 0.20
according to the radioecological sensitivities of the two
samples. A few samples of bone from newborn infants were ob
tained from the Faroes during 1965-1976 (RRF62-76). The radio
ecological sensitivity of these samples was estimated at 0.62
pCi 9 0 S r (g C a ) " 1 y per mCi 9 0 S r km" 2, (table C.4.3.1 (Nos. 15
and 16) and OPhoneAUet W a s e8tin,ate<* from table 4.2.4 as

- 186 -
0.62/5.4 = 0.12. This was lower than the Danish estimate, but
not incompatible with the observations in fi?. 4.3.2.3. and with
the range 0.1 to 0.2 of OR, t -riven in (newborn bone/maternal diet)
the literature (Be77b).
As compared to other western diets, the Danish diet is re
latively rich in calcium due to the addition of creta oraeparata
to the flour. Creta praeparata has been added to Danish flour
since 1958 to compensate for the loss of calcium caused by the
phytic acid found in cereal products. As demonstrated by COKAR
(Co57b), phytate would not influence the discrimination between
Sr and Ca, because the solubility of the phytates of the two
elements is nearly the same (Han60); and CARR et al. (Ca62)
demonstrated that the radiostrontium in wholemeal wheat bread
and in milk in the human diet was approximately equally
available. In other words, the ratio between Sr and Ca in the
organism does not depend on the presence of phytates. Hence,
the creta praeparata in the Danish diet has undoubtedly 90 reduced the doses from the relatively high Sr intake from
rye bread. However, as shown by KORNBERG (Ko59) and other 90 authors (Ha64, Sp67), the reduction in Sr uptake is not
necessarily proportional to the increase in calcium intake
because the observed ratio between bone and diet may vary with
the calcium intake.
4.4. Human teeth
Nan tmtrfc dalkt. jta é<* •"«• (»t i f f Skt eeutd itmtmbu mt cutting my {<t»t Tanrf øj f*mitit§l*dt* fcctcwrt. Of" teeth **d ft?« dtlijhttd tht 4«*<(.y «f«J i»**tt Tamt! Utkqtdt 1**4, tki**t*dt Tht {ilhl teeth'. Tht teetk of imnoctncr, »om m tittt hvid Httktd***bt, Httkt- \kiniH$ tikt a titttt tthitt d\op ei mi(k: tandti. thr mitk teeth.
TANTE TAWPFINE AUNTIE TOOTH ACM
90
The Sr concentrations in teeth are of no direct interest as
a source of internal contamination of the human body. In the
present study shed deciduous teeth have been used as a
substitute for infant bone, because such bone samples have
generally been unavailable from the Faroes and Greenland. To 90
interpret tne results cf the tooth measurements, the Sr concentrations in corresponding samples of Danish shed deciduous teeth and infant bone have been used. The preliminary results
90 of the tooth studies (XI, XII) indicated that Sr in shed

- 187 -
90« deciduous teeth may be considered as a measure of the ' Sr bone
level of the 1-year-old tooth donor. This implies, among other
things, that the shed deciduous tooth has not exchanged 90
significant amounts of Sr with the environment since the 90
calcification of the tooth, i.e. that the turnover rate of Sr
in the shed deciduous tooth crown after formation is insignifi
cant (D.4.4.I.).
4.4.1. Variation with time, type of tooth and location 90 The Sr concentration in deciduous teeth has shown a pronounced
variation with time. At the beginning of the fifties when the
fallout rate was negligible, the tooth levels were nearly zero
(XI). The maximum occurred in teeth from children born in 1963,
i.e. in the cohort that showed the highest bone levels as
1-3 i- 6 7-910-1213-15 I C HI Mil
Pi«. 4.4.1. the relativ« pel *°Sr (9 Ca)*1 eoacentra-tlOM in infant bona (1-3 aontns, 4-4 »onthe, ate.) ami deciououa teeth1 ineiaora, cuaaioa, f irst and aaeontf aolare, collect«« In 1»42-1»70 In Dawaark (cf. taxt). Iha erand Mean wan 4.5 pCl (a Ca)" •cala).
(- l in the relative

- 188 -
1-year-old infants in 1964. Since then, the levels have been
decreasing and deciduous teeth from children born in 1967-1S69
contained approx. one third of the maximum level.
Incisors have« in general, contained less and second molars a
little more than the mean level of all types of tooth, but in
the Faroese and Greenlandic materials the differences among
types of tooth were not significant. Teeth from Jutland 90 contained approx. 20% higher Sr levels than teeth from the
Islands, which finding was in agreement with observations for
human bone (4.3.1.).The Greenlandic material contained nearly
the same levels as those found in the Danish, but the Faroese
tooth levels were significantly higher, as was expected from 90 the elevated Sr concentrations of Farcese milk (3.3.1.). The
variability among years was the same for teeth from Denmark,
the Faroes and Greenland (table B.4.4.2.).
4.4.2. Relations and prediction models 90
As the Sr tooth studies aimed to obtain an estimate of the
5r concentrations in infant bone where and when bone samples 90
were scarce or unavailable, mutual Sr measurements were
carried out on Danish infant bone and corresponding shed
deciduous teeth from 1962 to 1970. A comparison could thus be
madi> for this period. An anova showed significant variation
among sample types (bone of infants 1-3 months and 12-15 months
old contained less 90Sr than the other samples), as well as
among years, but no interaction between samples and years.
Figure 4.4.1. shows that the Sr concentration in shod
deciduous teeth of a tooth donor born in the year (i-1) cor
responded to that found in his bone when he was around 1 year
old in year (i) . If the prediction model for 4-12 month-old
infant bone (table C.4.3.I., No 3) was used to predict the tooth
levels in children born in 1952-1969, and if these predicted
values were compared with those actually observed, the corre
lation coefficient: r = 0.884 was highly significant and the
mean ratio between the predicted and the observed values was
1.14 + 0.08 (1 SE), i.e., not significantly different from
unity. In a similar way one may compare the measured 4-12 month-
old infant bone levels from 1962-1976 with those predicted from

- 189 -
the tooth prediction »odel (table C.4.4.1, No 1). In this case
r = 0.889 was also highly significant and the mean ratio was 90 0.95 + 0.07. The Sr concentrations in shed deciduous teeth
may thus be used as an estimate of the bone level of the one-
year-old (4-12 month) tooth donor. This has earlier been
suggested (XII), but at that time there were too few parallel
tooth and bone samples to confirm the hypothesis.
In table C.4.4.1. the radioecological sensitivities of shed
deciduous teeth have been calculated. It appears that the 90 —1
sensitivity for Danish teeth was 0.89 pCi Sr (g Ca) y per 90 —2 nCi Sr km , which was lower than the sensitivity estimated
for infant bone (4-12 month-old: 1.1 - 1.7). The reason may
be that the tooth material did not represent the later years
(1971-1976), when the importance of indirect contamination
from the accumulated fallout increased relative to that from 90
direct contamination. Vhe relatively higher uptake of Sr from the soil improved the estimate of the soil factors in the
90 prediction models. If the Sr results for tooth and infant
bone (4-12 month-old) were pooled for the period 1951-1976,
and new prediction models (table C.4.4.1., Nos. 5 and 6) were
calculated, the radioecological sensitivities oecame identical
to those in 4-12 month-old infant bone (fig.4.4.2.).
The radioecological sensitivity of Faroese deciduous teeth was
approx. 1.2 times that of Danish teeth (table C.4.4.1., Nos. 3
and 4). This indicated that Faroese milk played no dominating 90
role as a Sr donor to Faroese deciduous teeth as the radio-on
ecological sensitivity of Sr in Faroese milk was 2.6 times
higher than that of Danish milk (3.2.2. and 3.3.2.}. Faroese 90
children apparently consumed foods relatively low in Sr as
compared to Faroese milk; Danish imported milk, human milk,
Danish bread, fruit and vegetables would all lower the Faroese
infant bone levels relative to a pure Faroese milk diet (cf.
4.2.4.). As fallout in the Faroes was 2.08 times that in
Denmark, the Faroese teeth (and infant bone) contained 1.2 * 90 2.08 = 2.5 times the Danish levels, and the doses from Sr to
Faroese infant bone have therefore been 2.5 times the Danish
doses. This estimate was lower than the previous one (XI, XII),

r u . « .« . ! . rreolctM mU oao«r»oo S* l«**ls la Oasisfc iafaot boa* aa* 4 t c M m i tMtk. th* aVsclssa is tit* yoor of 4 u t » of ih« bon« ésaar aaa the yoar uttoa m« cooth oaaor eaaalotad His f irst T*ar. Ih* anabor of i s s l « io -elwémt is shows i s tho clrclos aaa ;1 SI l i taaicato«. Por 19Sf-19*l th» saaplos CMS is too of tooth only, te: .-.* 19(2-1970 both tooth as* bom« wore iacloow), aa* slac* 1*71 boa* oaly. Ih* corvo is th« aroaictoa vsloos occoro-iao to Tsbi« C « . 4 . 1 . »o. 5 !r » » .» !» • • • ) .
which was estimated as four times the Danish levels. However.
similar to the Danish "pure tooth" model, the Faroes« mo»iel
nay have underestimated the radioecoloaical sensitivity due to
incomplete data from later years.
The tooth samples were the only environmental samples in the
present material that covered the period cf the fir t global
fallout, i.e. the beginning cf the fifties. As the measurements
of fallout and of accumulated 'Sr in the soil were very »parse
and incomplete fro«?, these years, it was difficult to obtain
reliable prediction nodels based on data from this period. To
test the influence of the estimated fallout data for the years
prior to 1961, the prediction model for teeth was calculated
only from the data collected aft*»r 1961. This model, however,
came very close to the model using all data, thus the poten
tially unreliable fallout di*-? from the beginning of the
fifties did not seem to have much influence on the tooth models.
From fig.4.4.2. it appears that the predicted tooth levels in
the fifties were generally higher '..han the observed levels.

- 191 -
90 This suggests a minor overestimate of the Sr fallout levels
in this period. Earlier estimates of the fallout in the
fifties were lower than the present one; however, there were
other reasons for preferring the present estimate (cf.D.i.3.2.)
and the observations for teeth do not justify any adjustments.
4.5. The human body
Hun tog den title Gerda om Livet og She put he* atm lound tittle Getda and iaid, lagde: "Ve ikat ikke ilagte Vig, "Thetj shan't kitt tjou unlet* I get angry uii'th you. laaltnge jeg ikke bliver vred på Vig'. THE SNOW "UEEN
SNEDRONNINGEN
Cæsium-137 is accumulated in muscle tissue, just like potassium
- its chemical congener. The concentration in the human body is
conveniently measured together with potassium in a whole-body
counter. Due to the relatively short biological halflife of 137
Cs in the human body (approx. 110 days (Ek66)),the levels in
the diet and in the body attain equilibrium relatively rapidly.
Caesium-137 was first detected in humans in 1956 (Mi56). The
first more comprehensive assessments were carried out at Los
Alamos, USA (An57), and at Harwell, UK (Ru60). At present,
routine measurements are made in France, West Germany, Sweden,
Switzerland, Finland, USSR, Japan, Argentina and Australia
(Un77). The Danish study began in 1963 and has been performed
on a control group of Risø staff, numbering approx. 20 adults, 13 7 who were not occupationally exposed to Cs. The group has
been measured each year in the spring, late summer and winter. 137 In adults (> 20 years) , Cs concentrations (often given as
137 -1 pCi Cs (g K) ) are with approximation independent of age
(On62), but in children and adolescents the levels may differ
from those found in adults due to a shorter biological haiflife 137 of Cs in the younger age groups (Be67, Bo69).
4.5.1. Variation with time, sex and Individual 137 The maximum level of Cs in the Risø control group occurred
in 1964 (fig. 4.5.1.) with a mean concentration of 162 pCi 137 -1
Cs (g K) corresponding to a wholebody content in standard man ('v 140 g K) of approx. 23 nCi 137Cs (RRD64) . Since then

- 192 -
3.5
3.0 -
2.5
z 3
UJ
>
2.0
1.5
LU or
1.0
0.5
0.0
YEARS * * *
1.5 -
1.0
0.5
iilLLL
SEX
65 70 75
Flg. 4 . 5 . 1 . The variat ion of pCi 1 3 7Cs (g K)"1 i n adult human bodies in Zealand (cf. Table A . 1 . 4 . 5 . ) during 1963-1976. The bars show the l e v e l s r e l a t i v e to the grand mean 58 pCi (g X)~ (• 1 on the re la t ive s c a l e s ) .
concentrations have decreased and by the middle of the seventies 117 —1
the mean level was approx. 10 pCi J'Cs (g K) . The variation
among years was thus highly significant (table B.4.5.1.), the
variability was 1.13 (table B.4.5.2.) and not significantly
different from that of 137 Cs in total diet (B.4.2.3.). An anova
of all data with year and sex as main factors showed a sig
nificant variation between the two sexes. The 137 Cs mean con-137 -1
centration (pCi Cs (g K) ) was 1.3 times higher in males
than in females (fig.4.5.1.). This intersexual difference became 137 -1
ever* more pronounced if the pCi Cs kg body weight figures
were considered, because the potassium concentrations in

- 193 -
females are lower than in males. UNSCEAR (Un72) reports that
the pCi 137Cs (g K)" 1 in women is 20-30% lower than in man.
The phenomenon is thus general, and it may be due to a difference
in metabolism between males and females. It is thus known that
the basal metabolic rate in women is lower than that of men 137 of comparable size (Ek66). The biological hal ft isne of Cs is
probably longer for males than for females (Be67, Bo69). The
phenomenon could, however, also be influenced by differences in
composition of the diet between the two sexes. It has been
demonstrated (RRD64) that vegetarians contain lower Cs levels
than other adults. If the male diet on the average contained
more meat and bread than the female diet, which may be enriched 137 -1 with respect to vegetables and fruit, the Cs (g K) ratio
of the male diet would be higher than that of the female. The
variability between sexes increased with time (table B.4.5.2.),
the difference between males and females has thus become more
pronounced in later years. Reference groups in West Germany
(De76) and Switzerland (Hu74) showed decreasing ratios between
men and women in the same period. As there seems no evident
explanation for a decreasing or increasing variability between
sexes, the observation may be fortuitous.
4.5.2. Relations and prediction models 137
The radioecological sensitivity of the human body to Cs contamination was calculated from the prediction models in table
137 C.4.5.1. The sensitivity of the male body to Cs contamination
was 1.3 times that of the female. The models indicated that 137 there was no strong influence of old deposited Cs, and thus
137 there were no indications of a Cs pool in the body with a
slow turnover rate as earlier suggested (X). This agreed with 137
the observations of HARDY (Ha74a), which showed that Cs was
barely measurable in specimens of calcified bone tissue. From 137
the models for Cs in diet (table C.4.2.2 Nos.4 and 5) and the 137 whole body models, the_transfer factor from diet to body of Cs
234 137 -1 was estimated; P.. (= ) became 2.85 pCi Cs (g K)bo<3V P
er
137 -1 23 pCi Cs (g K ) d i e t / which agreed with earlier estimates (X, Un77). As the best available estimate for the radioecological
sensitivity of the Danish human body to J/Cs concentration
from fallout, the mean of the two estimate* Nos. 1 and 2 in

- 194 -
table C.4.5.1. was applied, i.e. 11.5 * 0.3 (1 SE) pCi 3 Cs
(g K) • y per mCi Cs km" . In standard roan (Ic59) the 137 -2 potassium content is 140 g, hence 1 mCi Cs km corresponded
to 1.6 nCi Cs • y (cap)"" . In the case of Sr, where
standard man contains 1,100 g Ca, the infinite body-burden time 90 -2 90
integral of 1 mCi Sr km was estimated at 0.90 nCi Sr • y (cap) (cf.4.3.2.). Thus the radioecological sensitivity of
137 90
the human body to Cs was 1.8 times that of Sr, i.e., by
chance nearly the same factor as found for the total diet
intakes (4.2.2.).
4.6. Human milk
Sat mødte han en Ammt med et litte Bain. Then ht mtt a nutie ulitk a baby. "1 »ait. you Tutk-"HfH (fit Ty*kt-A«»e!" iagdt han, 'hvad nanny*, ht began, "uthat'i thii quest cattle t* dtt io\ et ttott Stot he* t»t ved hele, clvit to the toum, uiith the high utin-BgtH, Vindueint sidde iaa hfitl* dont?"
PEN nvvtuvt Korrini THE FLYING TROW«
Human milk is a unique link in the human food chain, because it
is both produced and utilized by the human organism. Measurements
of the radioactive contamination of human milk have been scarce,
partly because it is difficult to obtain samples, partly
because breastfeeding, at least in the western world, is a minor
source of radioactive contamination for infants, as mothers'
milk is often substituted by cows' milk products. The first
information on radionuclides in human milk originated from mea
surements of a few individual samples collected in the UK in
1957 in connection with the Windscale accident (Ma58a). A 90
systematic study of Sr in human milk was carried out in the
USA in 1959 (L06O), and the first study of the secretion of 137
Cs in human milk was performed in 1962 (XIII). Danish studies
of fallout nuclides in human milk continued until 1969, when
levels were so low that it had become difficult to make reasonably accurate measurements on the samples obtainable. 90 137 However, the Danish study of Sr and Cs in human milk is
the only study covering several years mentioned in the literature.
4.6.1. Variation with time
In analogy with cows' milk (3.2.), human milk was investigated
within the so-called milk year, i.e. the period from May in a

- 195 -
3 _ YEARS • • •
z
UJ > I -< _ l UJ a:
.. MONTHS
61 63 65 67 69 MJ J A S O N D J FMA
Fig . 4 . 6 . 1 . 1 . The var iat ion of pCi , 0 S r (g Ca)"1 i n hiasan Milk c o l l e c t e d in 1961-1969 i n Zealand (cf. Table A . I . 4 . 6 . ) . The bar* show the l e v e l s r e l a t i v e to the grand Mean 2 .2 pCi (g Ca)""1 {- 1 on the r e l a t i v e s c a l e ) . The years were the "milk years" (cf. the t u t ) .
given year until April in the following year. The relative mean
levels shown in figs. 4.6.1.1. and 4.6.1.2. were calculated
from VAR-3 (table B.4.6.I.), assuming no interaction between
milk-year and month. The samples contained 0.27 + 0.10 Ca 1~
(1 SD) (mean of 28 determinations) and 0.58 + 0.12 g K l"1
(135 determinations), which was in agreement with observations
in the literature (Sp56, Lo60, Str65, Ca70), considering that
the Danish human milk samples were all mature milk, i.e. on
secreted more than 10 days after parturition. The Sr con
centrations showed a highly significant variation among years
but no variation among months. The variability (table B.4.5.2.)
among years was 0.59, i.e. compatible with that observed for 90 Sr in cows' milk (3.2) and in total diet (4.2). In the case 137
of Cs the variability was 1.03, also in accordance with the observations for milk and total diet. The variability of 137Cs

- 196 -
61 63 65 67 69 MJ J A S O N O J FHA
r u . 4.1.1.2. Ih* variation of pCi 137cs I« R ) ' 1 in
•ilk collected in 19*1-19*9 i~ Scala (cf.
Tabl« A.1 .4 .C) . Ih* bars show the lavals relativ* to the grand nean 43 pCi (f W*1 (« 1 on the relative scale) . The years were "nllk years" (cf. the text) .
90
among months was 0.18, higher than for Sr (CV .. = 0.11),
but lower than the variability among months for 'Is in cows'
milk, indicating that the other constituents of the human diet
(especially bread) varied less throughout the year than cows'
milk.
1.6.2. Relations and prediction models
During the period of human milk sampling, the diet intakes of
Sr and Cs were determined on four occasions. The milk
donors prepared double portions of everything they consumed
during seven days, and their milk was sampled and analyzed in
the same period. These experiments showed that 33% +13% (1 SD) 137 of the daily intake of Cs were secreted per litre of milk
90 and 2.3% + 1.05% of the daily Sr intake. The percentages
could also be estimated from the total diet measurements carried
- 197 -
out on samples collected in Zealand and Copenhagen (RRD69,
RRD59-76). In this case the percentages became 22% + 9% for 137Cs and 2.6% • 1.05% for 90Sr. LOUGH et al. (L06O) found
90 1.5% + 0.42% for Sr, and CALAPAJ et al. (Ca70) found 1.6% +
1.4% for Sr and 75% + 37% for Cs. In an experimental study
of Cs secretion in human milk (XIII), 10% per cent of a
single acute intake were secreted with the milk within two weeks
after intake. The secretion of Cs followed a two-component
exponential curve with halftines of approx. 2 and 7 days within
the period of observation. The above higher percentages for 137 chronic intakes, however, indicated that the secretion of Cs
in human milk may rather follow a three-component exponential
curve with a final halflife equal to the biological halftime
of Cs in the human body. The estimated Cs content in milk
from "normal fallout" contaminated diet may thus have been too
high in the experiment (cf. table 3 in (XIII)).
On six occasions (RRD64, RRD65) milk donors were measured during 137 lactation for wholebody Cs in 1964-1965. The observed mean
137 -1 ratio between pCi Cs (g K) in milk and body was 0.53 + 0.08
(1 SD). BENGTSSON et al. (Be64b) found experimentally, for a
single individual, a ratio of 0.2 between the specific (per 137 kg wet weight) concentrations of Cs in milk and the whole
body. Assuming that milk and body contained respectively 0.6
c K kg and 1.8+0.5 (1 SD) g K kg" , the agreement between
the two observed ratios was satisfactory. Instead of cal-137 culating a special prediction model for Cs in human milk, it i 37
was more expedient to use the models for " Cs in women from
Zealand (table C.4.5.I., Nos. 5 and 6) multiplied by 0.53 (fig.
4.6.2.1). Hereby the radioecological sensitivity of human milk i->7 137 -i
to Cs fallout was estimated at 5.3 pCi Cs (g K) y per 137 -2 137 -1 137 -2
mCi Cs km or 3.1 pCi Cs 1 y per mCi Cs km . A
woman with a daily milk production of 1 litre may thus in a
year have secreted 1.1 nCi Cs with her milk, or ^ i = 20%
of her 1 3 7Cs intake with the diet (cf.4.2.2). This estimate 137 -1
was compatible with the above observations. As pCi Cs 'g K) y is higher in Danish human milk than in Danish cow milk,
137 higher time-integrated Cs body concentrations were to be
expected in Danish babies fed on human milk instead of cows'
milk. RUNDO (Ru70) found in a study performed in the UK in
1963-1964, using both breast-and bottle-fed babies, that babies

- 198 -
fed on human milk showed lower body concentrations than babies
fed on cows' milk. However, in RUNDO's study the pCi Cs
(g K ) - 1 levels were approx. 20% higher in cows* milk than in
human milk.
In the case of 90Sr, mothers' milk shows nearly the same pCi 90Sr (g Ca)"1 ratio as the bone of newborn children, i.e. the
discrimination against Sr relative to Ca was nearly the same
via the placenta as via the mammary gland (Co61a). If the
half-year periods between January 1964 and December 1969 are
considered, the mean observed ratio between human milk and bone
of newborn children became 1.09 + 0.14 (1 SE) (11 periods),
and the correlation coefficient between milk and bones 0.702, 90 i.e. significant. Hence the prediction model for Sr in bone
90 of newborn children was applied as a model for Sr in human
milk. Hereby the radioecological sensitivity of human milk to 90Sr fallout became 1 pCi Sr (g Ca)~ • y per mCi Sr km"
90 -1 (table C.4.3.I., Nos. 1 and 2), or 0.3 pCi Sr 1 y per mCi
Sr km .In analogy with Cs, the % of secretion with milk
of the total diet Sr intake was - ^ = 3.6%, i.e. in reasonable
agreement with the measurements.
4.7. Conclusions
4.7.1. General
Man is an carnivore and the total human diet thus contains
vegetable as well as animal products. In general, the first 90
category contains the important Sr donors, whereas animal 137
products are the main source of Cs. However, the two important 90 diet groups, milk and cereals, are both pronounced Sr and
137 Cs donors despite their origin. Faroese and Greenlandic
137 diets are characterized by a relatively high Cs content? this is mainly because local produce from these areas is of
animal origin, while most vegetable products are imported. The
Danish, Faroese and Greenlandic populations show a higher
radioecological sensitivity to environmental contamination with 137 90
Cs than with Sr. The calculated wholebody doses from internal contamination originating from nuclear weapons fallout,

- 199 -
based on the 1CRP weighting factors for t*ie various organ doses, 137 90
were higher for Cs than for Sr. If furthermore the contri
bution fros external radiation from deposited Cs was
considered, Cs becau^ definitely the most hazardous of
the two radionuclides.
4.7.2. Total diet 90
The variability among years of Sr in the Danish total diet
(CV =0.6) was lower than that in milk and bread, but p years 1 3 7
higher than that in vegetables. The variability of Cs
(CV „ =1.3) was close to that in meat but lower than that p years
in milk and bread and higher than that in fish.
The local variability of Sr and Cs in the Danish total
diet was nearly the same for the two nuclides (CV . .. = p location
0.13). Milk showed a higher local variability of these nuclides
than total diet, white bread a lower, but rye bread and
vegetables nearly the same variability.
90 The ratios between the Sr/Ca quotients in the total diet and
in milk showed significant variations among years as well as
among locations, and so did Cs/K quotients. Milk measure
ments were thus no possible substitute for total diet measure
ments .
The radioecological sensitivities of the Danish total diet were c i „, 90„ , „ i-l „, 90- . -2 , . . „. 137„ 5.1 pCi Sr (g Ca) y per mCi Sr km and 4.4 pCi Cs
-1 137 -2 137
(g K) y per mCi Cs km . The sensitivity to Cs con
tamination was 1.08 times higher in Jutland than in the Islands;
but the two areas of the country did not differ with respect to 90
sensitivity to Sr. The infinite time-integrated intakes with the Danish total diet originating front fallout were 0.23 uCi 90Sr (cap)"1 (8.5 • 103 Bq) and 0.66 pCi 137Cs (cap)"1 (2.4
4 • 10 Bq). Grain products contributed approx. 40% of the radio*
90 ecological sensitivity of the Danish total diet for Sr as
137 well as for Cs, milk 30% and 17%, respectively, vegetables
and fruit 26% and 10%, and meat and eggs 2% and 32%.
In the case of exclusive indirect contamination of the total
Danish diet, milk products, cereals and vegetables would each

- 200 -
90 contribute about one third to the total Sr intake from the
90 diet. The Sr/Ca quotient of the diet would in the case of
indirect contamination be 25% of the quotient in the ploughing
layer of Danish soil, provided that all calcium in the diet was
derived from crops; if calcium in creta praeparata and drinking
water was included, the percentage would be halved.
The Faroese total diet showed slightly less radioecological 90
sensitivity to Sr contamination than the Danish, but in the
case of Cs the sensitivity of the Faroese diet was three
times higher than the Danish, due to its content of Faroese
milk, potatoes and mutton. The infinite time-integrated intakes
with the Faroese total diet originating from nuclear weapons
fallout were 0.34 yCi 9°Sr (cap)"1 (1.3 • 104 Bq) and 3.7 vCi 137Cs (cap)"1 (1.4 • 10 5Bq).
90 The radioecological sensitivity to Sr contamination of the
Greenlandic total diet was similar to that of the Danish, while 137 the sensitivity to Cs was twice as high, because of the
consumption of Greenlandic mutton and reindeer. The infinite
time-integrated intakes of the two nuclides with the Greenlandic 90 -1 3
total diet were 0.17 yCi Sr (cap) (6.5 • 10 Bq) and 1.0 pCi 137Cs (cap)"1 (3.6 • 104 Bq).
4.7.3. Human bone 90
The variability among years of the levels of Sr in human bone
(CV m - 0.4) was lower than that of 90Sr in the diet as p years 90
a result of the relatively long residence time of Sr in bone.
The time variabilities of the various age groups were not much
different, but infants and teenagers showed higher values than
the average because of the rapider turn-over rates of Sr-Ca in
these age groups.
The local variability (CV locations = 0 , 1 ) o f 9 ° S r i n h u m a n
bone was also lower than that of the diet because people do
not always remain in the same part of the country for life.
Adult bone from East Jutland contained 10% higher levels than 90
adult bone from Zealand. The Sr levels in bone showed no
significant differences between the two sexes.

- 201 -
90 The observed ratio between the Sr/Ca quotients in adult
90 vertebrae and diet was 0.16. The turnover rate of Sr in adult
vertebrae ( 29 yr) was estimated at 0.16 y , corresponding
to an effective half life of 3.8 years. The observed ratio Aft
between the Sr/Ca quotients in bone of newborn infants and 90
the Sr/Ca quotients in the adult diet increased from 0.1 in
the first part of the sixties to approx. 0.2 in the seventies, 90
suggesting the transfer of Sr from maternal bone to the fetal
skeleton.
The radioecological sensitivity of adult human vertebrae in 90 -1 90
Denmark was estimated at 0.82 pCi Sr (g Ca) y per mCi Sr —2
km . Infants (4-12 months old) showed the highest sensitivity of all age groups, namely 1.4. The radioecolcgical sensitivity
decreased with increasing age from infants to adults. The creta 90
praeparata in the diet has reduced the Sr concentration in
Danish bone.
4.7.4- Human teeth
After formation during pregnancy and the first year of life,
the shed deciduous tooth crown does not exchange significant 90 90
amounts of Sr with its surrot..dings. The Sr concentration
in shed deciduous teeth from a tooth donor born in the year
(i-1) corresponded to that of his bone when he was approx. 1
year old in the year (i). 90
Teeth from Jutland showed 20% higher Sr levels than teeth
from the Islands. Greenlandic teeth contained concentrations 90
similar to the Danish, but Faroese teeth had higher Sr levels,
The variability among years (CV y e a r s "1.1? 1950-1969) was
the same for Denmark, the Faroes and Greenland. The radio-90 ecological sensitivity of Faroese teeth to Sr contamination
was 1.2 times that of the Danish. From this value, the infant
Faroese bone levels were estimated at 1.2 • 2.08 = 2.5 times
the Danish levels. The Greenlandic tootn levels suggested that
the infant bone levels were similar to those observed in
Denmark.

- 202 -
90 The Sr concentrations in teeth suggested that the estiMated fallout levels for the first years of nuclear testing prior
to 1959 are not seriously eneuMbered by error.
4.7.5. HuMan body
The variability aaong years of Cs in the human body
(CV _ « 1.1) was siMilar to that of the total diet. Hales p years 1 3 7 _j showed 1.3 tiMes higher pCi Cs (g K) levels than females.
*37 The observed ratio between human body and total diet * Cs/K
quotients was 2.85. The radioecological sensitivity of the
human body was 11.5 pCi 137Cs (g K) _ 1 y (1.6 nCi 137Cs (cap)"1 y) 137 -2
per mCi Cs km . The infinite time exposure integral from a
total deposit of 117 mCi 137Cs km'2 was 0.19 yCi 137Cs (cap)"1 y 3 90
(7.0 • 10 Bq), compared to a Sr time integral of 0.07 yCi 90Sr (cap)"1 y (2.4 - 103 Bq) from 73 mCi MSr km"2.
4,7,(i, Human »UK 90
The variabilities among years of Sr (CV 3 0.5) and 137 P years
Cs (CV .. _ = 1.0) in Danish human milk were similar to p years
those of cows* milk. The variability of human milk among aonths 137 on -as higher for Cs (CV .. - 0.2) than for w S r (CV _ t. p montn p montns - u.l), but the difference was less pronounced than for cows' milk.
Of the daily diet intakes, 33 + 13% (1 SD) of the 137Cs and 90 ~~
2.3 + 1.05% of the Sr was secreted per liter human milk;
these percentages vere approx. 50 and 10 tiMes higher than the
corresponding ones for cows' milk. Even if the higher Milk
production of the cow was taken into acount, the human f-?male
still secreted a larger pro
with her milk than the cow.
137 still secreted a larger proportion of the diet intake of Cs
The radioecological sensitivities of Danish human Milk were
estimated at 5,3 pCi 137Cs (g Kl*1 y (or 3.1 pCi 137Cs l"1 y) 137 -5 9 0 — 1
per mCi Cs km and 1 pCi Sr (g Ca) y (or 0.3 pCi Sr l"1 y) per mCi 90Sr km"2. Hence a Danish baby living
137 solely on human milk would have a hightr Cs body burden, but

- 203 -
90 a lower Sr content than a baby living on cows' milk only.
A Faroese baby would receive more Cs as well as Sr from
cows' milk than from mother's milk. A Greenlandic baby gets a
higher Cc body content if l . is fed on mother's milk instead
of Danish cows' milk.
4.7.7. Dose estimates and risk evaluations (cf.table 4.7.7.) 90 In the case of Denmark doses to the population from Sr were
estimated from the radioecological sensitivity of adult human
bone, whereas the corresponding estimates for the Faroes and
Greenland were based on the sensitivities of the respective
diets (tables 4o2.4. and 4.2.5.) and on the transfsr factor 90 -1 90 -1
P34 = 0.16 pCi uSr (g Ca) y in bone per pCi Sr (g Ca) y
in diet estimated from Danish diet and bone measurements. The 90 -2
integral deposits of Sr in the three areas were 73 mCi km -2 -2
in Denmark, 152 mCi km in the Faroes, and 55 mCi km in
Greenland (west coast), and the transfer factors: P-5 (tissue
to dose) were, according to UNSCEAR, (Un77) for bone marrow: 90 -1
1.4 mrad per pCi Sr (g Ca) y and for bone lining cells: 1.9 „. 90o / „ »-I mrad per pCi Sr (g Ca) y. 137
The internal doses from Cs were estimated from the radio-ecological sensitivities of total diet (tables 4.2.2., 4.2.4.
1 7 and 4.2.5.) and from the transfer factor P.. - 2.85 pCi Cs
-1 137 34-l
(g K) y in soft tissue per pCi Cs (g K) y in diet
estimated from Danish diet and wholebody measurements. The
integral deposits of Cs were 1.6 times those of Sr, i.e. -2 -2
117 mCi km in Denmark, 243 mCi km in the Faroes and 88 mCi -2
km in Greenland, and the transfer factor P.,. from tissue to -2 137 -l
dose to wholebody was: 1.8 • 10 mrad per pCi Cs (g K) y (Un77). The external dose factor for Cs was 1.44 mrad per mCi Cs -2
km (Un77); 0.32 (see the table) was a factor estimated by
UNSCEAR which, among other things, took the shielding effect of
buildings into consideration. This factor was con: idered
constant for the various radionuclides contributing to external
dose.

- 204 -
Table 4 . 7 . 7 . Dose commitments from nuclear weapons debris through 1975.
Bone marrow dose
from 9 0 S r
Dose t o bone l i n i n g 90 c e l l : - from Sr
Whole-body d o s e
from body 1 3 7 C s
Whole-body d o s e
from e x t e r n a l c s
Lung d o s e from Ru
144 Lung d o s e from Ce
T o t a l body ( w e i g h t e d )
' " Pu through 2000
E x t e r n a l d o s e from 9 5 Z r , 1 0 3 R u , 1 0 6 R u , 1 4 0 B a , 1 4 1 C e , 1 4 4 c e
T o t a l body do3e
from 3H
T o t a l body (weighted) 14
d o s e from c
through 2000
T i s s u e - w e i g h t e d
whole -body d o s e
e q u i v a l e n t commitment
C o l l e c t i v e d o s e '
e q u i v a l e n t commitment
Denmark
( 5 * 1 0 6 i n h a b i t a n t s )
1 . 4 * 7 3 * 0 . 8 2 = 8 4 mrad
( 0 . 8 4 mGy)
1 . 9 * 7 3 * 0 . 8 2 = 1 1 4 mrad
( 1 . 1 * mGy)
0 . 0 1 8 * 1 1 7 x 4 . 4 * 2 . 8 5 =
26 mrad ( 0 . 2 6 mGy)
1 .44*0 .32*117=
54 mrad ( 0 . 5 4 mGy)
1*27=27 mrad
( 0 . 2 7 mGy)
2 .3*22=51 mrad
( 0 . 5 1 mGy)
0 . 1 irxa<? (1 uGy)
28+2+12+3+0+2=
47 mrad ( 0 . 4 7 mGy)
2 mrad ( 0 . 0 2 mGy)
8 mrad ( 0 . 0 8 mGy)
1.62 mSv (162 mrem)
8100 man»Sv
Faroes
(4*10 4 i n h a b i t a n t s )
1 . 4 * 1 5 2 * 0 . 1 6 * 5 . 4 0 =
184 mrad ( 1 . 8 4 mGy)
1 . 9 * 1 5 2 * 0 . 1 6 * 5 . 4 0 =
250 mrad ( 2 . 5 0 mGy)
0 . 0 1 8 * 2 4 3 * 1 3 . 0 5 * 2 . 8 5 =
163 mrad ( 1 . 6 3 mGy)
1 .44*0 .32*243=
112 mrad ( 1 . 1 2 mGy)
27 mrad ( 0 . 2 7 mGy)
51 mrad ( 0 . 5 1 mGy)
0 . 1 mrad (1 uGy)
47x2.08=98 mrad
(0.9C mGy)
2 mrad ( 0 . 0 2 mGy)
8 mrad ( 0 . 0 8 mGy)
4.24 mSv (424 mrem)
170 man-Sv
Greenland'
( 5 * 1 0 4 i n h a b i t a n t s )
1 . 4 * 5 5 * 0 . 1 6 * 7 . 1 6 =
88 mrad ( 0 . 8 8 mGy)
1 . 9 * 5 5 * 0 . 1 6 * 7 . 1 6 '
120 i.irad ( 1 . 2 0 mGy)
0 . 0 1 8 * 8 8 * 9 . 9 6 * 2 . 8 5 =
45 mrad ( 0 . 4 5 mgy)
1 . 4 4 * 0 . 3 2 * 8 8 =
41 mrad ( 0 . 4 1 mGy)
27 mrad ( 0 . 2 7 mGy)
51 mrad ( 0 . 5 1 mGy)
0 . 1 mrad (1 uGy)
47*0 .75=35 mrad
( 0 . 3 5 mGy)
2 mrad ( 0 . 0 2 mGy)
8 mrad ( 0 . 0 8 mGy)
1.57 mSv ( 157 mrem)
78 man • Sv
As the mortality risk factor for radiation-induced cancers from uniform whole-body irradiat ion
i s about 10 • Sv (Ic 77) , the estimated number of deaths from ?uch cancers from a c o l
l e c t i v e dose of 8348 man'Sv i s 83. The expected number of ser ious cases of i l l - h e a l t h in future
generations due to hereditary detriment following irradiat ion was a l so of the order of 100
(Ic 77) . Cesium-137 was responsible for 50% of the c o l l e c t i v e dose equivalent commitment in
Denmark, for 65* in the Faroes and for 55« in Greenland.
The to ta l radioecological s e n s i t i v i t y of the Faroese and Greenlandic populations was approx.
30% higher than that of the Danish (Faroes! - i}'?4 . , = 1.26j Greenlands n £ ' 5 ? r . -- 1 . 29 ) . i . v ø x i , 0 l 0 . 7 5 X 1 , 0 2
also called per caput effective dose equivalent commitment,
here identical with collective effective dose equivalent
commitment (D.4.7.7).

- 205 -
The integrated air concentrations of Ru and 1 4Ce were taken
from table 1.2.5. The dose factors: 27 and 22 rar ad, respectively,
to lung tissue per pCi m y were those estimated by UNSCEAR
(Un77) .
239 240 The tissue doses from ' Pu were estimated in 1.7.2. The
weighted wholebody dose was calculated by means of the ICRP
weighting factors (Ic77) (gonads: 0.25, breast: 0.15, red bone
marrow: 0.12, lung: 0.12, thyroid: 0.03, bone surfaces: 0.03,
remainder: 0.30 (distributed on five organs, each attributed a
weighting factor of 0.06)). (cf. also D.4.7.7).
The integral deposits of 95Zr, 1 0 3Ru, 106Ru, 141Ce and 144Ce
were estimated from the integral air concentrations of these
radionuclides (table 1.2.5.) assuming a wash-out factor of -1 -3 90
1 pCi 1 per fCi m , i.e. equal to that of Sr (1.3.2.), and a rainfall of 628 mm y in Denmark. Hence the integral Danish
95 -2 103 -2
deposits became: 1005 mCi Zr km , 440 mCi Ru km , 628
mCi 106Ru km"2, 276 mCi 141Ce km"2 and 1,444 mCi 144Ce km"2.
The dose conversion factors for the five radionuclides were -2
0.087, 0.011, 0.060, 0.0014 and 0.0045 mrad per mCi km , 137
respectively (Un77), as in the case of Cs a shielding factor 140
of 0.32 was furthermore applied. Danish data on Ba was not
available, therefore the UNSCEAR estimate for the northern
temperate zone was applied instead. The Faroese and Greenlandic
doses were obtained from the Danish ones by multiplying by 2.08 90
and 0.75, respectively, i.e. the ratios between Sr fallout in the respective areas and in Denmark.
3 14 The doses from H and C were those estimated by UNSCEAR (Un77)
14 for the northern temperate zone. The doses from C were
transformed into wholebody doses by means of the ICRP weighting
factors. Contributions from other radionuclides were not taken
into account as their doses were considered to be less than 1%
of the total dose froi» the nuclides considered above.
The tissue-weighted wholebody dose equivalent was calculated
from the ICRP weighting factors assuming the quality factor
to be 20 for the plutonium dose and 1 for the other nuclides in
ttfble 4.7.7.

- 206 -
4.7.8, Concluding remarks on radioecological sensitivity and
variability
Radioecological sensitivity and variability were applied to
quantify the response of environmental samples to radioactive
contamination from nuclear weapons debris. Three areas were
studied: Denmark, the Faroe Islands and Greenland. As appears
from table 4.7.8, the radioecological sensitivities found in
various types of sample from these areas displayed a wide range
of values; thus, for the same nuclide and sample type, the
radioecological sensitivity varied between two locations by, 137 e.g., a factor of 20 for Cs in Faroese and Danish grass.
Between nuclides in the same type cf sample, e.g., Faroese 137 90
mutton, the sensitivities to Cs and Sr contamination
differed by a factor of 70. Becween different species of sample,
Greenland lichen showed, e.g., nearly 14000 times higher 137
sensitivity to Cs contamination than did Danish cabbage.
Table 4.7.8 may also be used to estimate the transfer factors
from air to the various environmental samplesj e.g. if the 137
annual mean air concentration at steady state was 1 fCi Cs
kg , then the Greenland lichen Cs concentration would -1 • -1
be 14 nCi kg , Faroese milk 0.1 nCi kg and Danish cabbage , „. , -1 1 pCi kg .
In this study radioecological sensitivity has been defined as
the transfer factor from deposition to the environmental sample.
However, on various occasions the environmental radioactivity
levels indicated some independence of the activity deposited
with rainfall, i.e. radioecological sensitivity depended upon
precipitation in such a way that increased rainfall was tant
amount to a lower sensitivity of the vegetation sample due to
wash-off of the adsorbed debris. In earlier studies (Aa66a,
Aa66c, X) prediction models applying air concentrations instead
of deposition with rainfall have been suggested. In the case
of prevailing direct contamination, such models were generally
successful. Radioecological sensitivity could thus have been
based on air concentrations instead of deposition. However, as
precipitation measurements are necessary to assess the indirect
contamination from accumulated deposits, the present method of

Table 4,7,a. Infinite time integral concentrations In various environmental samples resulting from a
deposition ot I SCI km"2 o£ 90Sr or 137Ca, respectively.
The Faroes West Greenland
kg (9 K) kg lg ca) kg (g K)
Rain b ,
S o i l ' -
S e a water
Drinking water
Rye
Wheat
Grass
Cabbage
P o t a t o
Lichen
Sea p l a n t s
Rye b r e a d 8 '
White bread*'
Heat
Cod
T o t a l d i e t
Human bone 9
Human body '
Human milk
h>
1.3»10"''
1 . 6
46
0.35
7 «10" 3
32 .
2 4
38
« 2 . 6
-no
23
4
3 . 9
1 . 4
0 .09
3
300
--
1 7
1 . 9
9»10" 2
79
5 8
31
1 7
52
-1 1
8
2
3 . 3
1 4
0 . 9
5 . 1
c.a
1.3«10
1 . 6
4 6
0.23
-46
28
24
1 . 3
3 . 8
--
38
10
5 . 5
2 8
20
5
-
0.3
2S
3
--3
1 . 4
-1 1
8
5
0 . 5
1 . 0
0 . 6 - 1 0 '
0 . 7
1 5 2
0 . 0 3
0 . 1
--
250
-2 . 8
11
7
3.4
11.5
5
12
7
2
10
3
0.06
2.1
O^'IO"-1
0 . 7
1 5 2
0 .03
-
--
8 0
0 .
-0 8
1 . 3 - 1 0
1 . 6
6 0
0,23
0 . 5
1 . 2
4
2
9
30
0 . 6
5 . 4
( 0 . 9 )
-12
4
60
200
1.7
14
-
<!.!>
--4
3
3 5
8 0
0 . 5
1 3
-(40)
118)
l . 6 » 1 0 3
6 0
---5
-J . 3
--_
0.7
l.J>
1.
60 1
0.8
50
-7
(1 .2 )
-(1 .4 )
135
10
11
---
350
1
10
-(30 |
(14)
a) Estimated from the rainwater concentrations assuming a scavenging factor of 0.99 pci 1~ rain
b) Estimated from an annual mean precipitation of 62R mm in Denmark, 1500 mm In the Faroes, ai.d
630 mm in West Greenland.
c) Estimated from an effective half-life of 90Sr and Cs la the 0-50 ex. soil layer of 22.5 y (1.6.1)
The mean volume weight of soil was 1.4 g cm in Denmark IRRD 75), 0,43 g cm" In the Faroes, and
1.1 g cm'3 in West Greenland (cf. Table D,1.6.1.2),
d) The figures used for Denmark wore those calculated for ground water.
e) The radioecological sensitivities of Faroese bread were derived from the sensitivities calculated
in Table C.2.3.1. divided by 2.08 {cf. 4.2.4.).
t) Seef in Denmark, and mutton in the Faroes and Greenland.
9) Adult human bone.
h) The Faroese and Greenlandic figures were estimated from the respective diet levels and from the
Danish transfer factors.

- 208 -
estimating the radioerological sensitivity was preferred. It
should, however, be recalled that the radioecological sensi
tivity may not be althogether independent of precipitation,
(cf. also D.4.7.8).
The variability with time of the concentration of a radio
nuclide in an environmental sample is a useful way to assess
the route of contamination of the sample. A low variability
among years generally suggested strong dependence upon root
uptake (indirect contamination), or of a long residence time
of the debr s in a directly contaminated sample such as
observed in, e.g., lichen, while a high variability was indicative
of prevailing direct contamination combined with a short
residence time of the debris in the sample. In the case of
nearly constant fallout rate, the annual variabilities of direct
and indirect contamination approach each other. Hence it should
be recalled that the interpretation of variability with regard
to routes of contamination is linked to the variability of
fallout rate and accumulated deposit.
The local variability of radionuclide levels is a measure of
environmental inhomogenity with respect to radioactive con
tamination. The local variability depends upon fallout and on
the radioecological sensitivity of the area considered. A low
local variability is tantamount to the area being relatively
homogeneous to radioactive contamination, implying that the
number of sample locations in such an area can be relatively low.
The local variability may vary with time. This could arise
from variations in the relative contributions from direct and
indirect contamination, from alterations in agricultural
practice, or from the transfer of foodstuffs from other areas
into the area in question. Such variations of the local
variability imply current revisions of the environmental
surveillance programmes.
In conclusion, radioecological sensitivity and variability have
shown to be useful quantities for characterizing the radio
ecological properties of environmental samples contaminated by
global fallout from nuclear weapons testing.
- 209 -
5. GENERAL DISCUSSION
5.1. Introduction
The preceding four chapters have been a presentation of data,
and we have seen hov proper treatment of the data could charac
terize the radioecological properties of various environments.
Chapter five aims to show various applications of the results
obtained. The chapter is more speculative and less substantial
than the previous ones as the intention is also to raise problems
and provoke discussion.
In the first section we calculate the steady state inventories 90 137 of Sr and Cs in the Danish terrestrial environment; we as-
_2 sunte a constant annual fallout rate of 1 mCi km of each of the
90 two radionuclides. He further assess the transfers of Sr and 137
Cs between important parts of the terrestrial ecosystem.
The next section discusses the toxicity concept; it appears that
toxicity of a substance is not an absolute but depends essential
ly on the context in which the toxic substance is considered.
Some practical applications of radioecological sensitivity and
variability are shown in connection with siting evaluation and
in relation to remedial measures in case of a major environmen
tal radioactive contamination. Finally in the conclusion further
environmental radioactivity studies are proposed.

- 210 -
5.2. Inventories and transfers of 90Sr and 137Cs in the Danish
terrestrial ecosystem
"Tte\ I. dtt «* kttt V-*4in'.-**t4t M*4c\c«; dtm *t*#kket 4*9 t**$t pi dm *mdt* Sidt ii«vCK, ti$t ind i Fiattta* Jte-tfc; ac« dt\ fc«* jeg at-
9ctt Gtimme IUINC
m9e y#tt **>j»«»c thi i ié <ke wfcotc ••*<*?" »«irf tfcett aoCfcc«. ' M y , ** foti a ton§ Mty p««* tht etkt* *idt oj tkt Jatacn, \19kt into the pm\*on'% iitld; but I've neve* been a* j«4 «« tfc«{.
TKC UGIV ØUCLING
An inherent difficulty when dealing with ecosystems is its con
finement. Aril ecosystems have some connection with the surround
ing world. In this respect the Danish terrestrial ecosystem is
no exception. However, in theory agricultural production in Den
mark is sufficient for the Danish food and fodder supply.
The aim of this section is for steady state theory to estimate 90 137 the inventories and annual transfer rates of Sr and Cs in
the terrestrial ecosystem, which just covers Denmark. For the
purpose the ecosystem is divided into four major parts: the soil,
the vegetable agricultural products, the animal agricultural
products and the human population.
5.2.1. Definitions
The "soil" comprises the total Danish abiotic terrestrial en
vironment; furthermore it includes all living organisms not dealt
with under agricultural products in the present context. We
shall thus not consider transport and inventories of radionucli
des in wild flora and fauna, nor in microorganisms. Although
such a study may be essential it is not pertinent to the pre
sent context where our main objective is the important sources 90 137
to the human diet of Sr and Cs. The "soil" also comprises
those parts of the cultivated crops which neither are grazed
nor harvested but which remain in the fields. The dried weight
of the upper 20 cm of the Danish soil - the ploughing layer -
is estimated as the mean weight of the layer at the ten Danish 8 2
experimental farms: 2.55 x 10 kg km (RRD 75).
The "vegetable agricultural products" are the vegetable products
grazed or harvested at the 3 x 10 km used for agricultural
purpose in Denmark.

- 211 -
The "animal agricultural products" are composed of the stocks
of cattle, pigs and poultry and of their produce. Other domestic
animals e.g. sheep and horses are neglected because they are very few in comparison to the above mentioned categories.
He assume the Danish "human population" at equilibrium to be five
million and the death rate (and birth rate) to equal 65,000 per
year. We shall neglect immigration as well as emigration.
5.2.2. Calculations
To accomplish the calculations of inventories and transfer rates 90 137 of Sr and Cs in the Danish ecosystem we suppose a constant
-2 -1 fallout rate of 1 mCi km y of the radionuclide considered,
and we assume the fallout distributed throughout the year to be 90 the global Sr fallout (cf. fig. 1.3.1). At steady state the
situation has persisted so long that the annual total removal
from radioactive decay, run off, etc. equals the annual supply
of activity from fallout. If the mean residence time of the
radionuclide considered in the Danish terrestrial ecosystem is _2
T years the equilibrium level is T mCi km m ' ^ m
90 According to D.l.4.2. the Sr run-off in Denmark is 9.3% of the 137 total deposit. For Cs we estimate the run-off as 1/5 of the
uSr run-off (Ya63,'Voi71), i.e. to 1.8 X of the total Cs
deposit. Wind erosion is neglected because the Danish soil is
not wind eroded to any large extent; furthermore the main part
of the wind-eroded soil remains in the terrestrial ecosystem.
90 In case of Sr the annual removal rate due to run-off is _2
0.093 mCi km at steady state and the radioactive decay is _2
consequently 1-0.093 = 0.907 mCi km corresponding to a terrestrial steady state deposit of 0.907 (1- exp (-ln2/28))~ -
90 -2 137 37.1 mCi Sr km .In the case of Cs the steady state level
—1 137 -2 becomes 0.982 (1- exp(-ln2/30)) =43 mCi Cs km assuming
137 a total Cs run-off of 1.8 X. In this calculation we have neglected export and import of activity from agricultural and
fishery products to the system, because these sources - as we
shall see in the following - are immaterial In this context.

- 212 -
The production of Danish vegetable agricultural produce in 1975
is given in table D.5.2.1. in the appendix. We have assumed that
1975 represented a steady state situation. The standing crop of
grass during summertime, which was used as reference time of the
year for the calculations of the inventories, was estimated to be _2
9 Tg (~ 1 kg grass m (RRD63, RRD77).
Table 5.2.2.1. The annual steady state production and
consumption levels of Sr and Cs in Curies from
Danish vegetable agricultural produce for an annual de
position rate of 1 mCi km"2 y"1 (of 90Sr or i37Cs
respectively)
Product
Grain etc.
Straw
Roots
Tops
Grass etc.
Vegetables
Fruits
Total
Production
90sr
0.18
1.38
0.168
0.44
1.26
0.0016
0.0002
3.43
137Cs
0.21
0.33
0.0099
0.046
0.54
0.0003
0.0006
1.14
Fodder
*-Sr
0.18
0.43
0.14
0.38
1.10
-
-
2.23
1 3 7C.
0.20
0.104
0.008
0.039
0.47
-
-
0.82
Human
90Sr
0.0043
-
o.ooio -
-
0.0021
0.0004
0.0078
diet
137Cs
0.0079
-
0.0014
-
-
0.0004
0.0010
0.0107
It was assumed that there was neither import nor export
of vegetable agricultural products. The grain actually
exported was supposed used as fodder instead of imported
concentrates. Keeping this in mind, the figures were
calculated from the data in table 0.5.2.1. and from the
radioecological sensitivities calculated in appendix C.
In the calculation of "Grain etc." the last column of
table 2.2.2.1. was applied together with table C.2.3.1.
for flour and grits. Straw, root crops and grass were
estimated from tables C.2.4.3. (Nos. 4 and 5), C.2.4.4.
(No. 4), C.2.4.1. (Nos. 1, 2 and 3) and C.2.4.2. (Nos.
7 and 8) respectively. Tables C.2.5.1. and (..2.5.3.
were applied for vegetables and fruits.
90 137
Table 5.2.2.1 shows the production and division of Sr and Cs
in Danish vegetable agricultural products. The inventories at
midyear are equal to the production figures except for grass
which contains 9/23 of the production levels because the weight
ratio between standing crop and annual production of grass is
9123. Hence the inventories in vegetable agricultural products 90 become 2.7 Ci Sr and 0.81 Ci 137 Cs.

- 213 -
The Danish livestock in 1975 consisted of 3.1 x 10 cattle,
7.7 x 10 pigs and 13.4 x 10 hens; the living weights - esti
mated from the numbers and weights of the various age groups
(Da 57-77, Da 68) - were 1 Tg, 0.5 Tg and 0.02 Tg respectively.
The annual production of animal agricultural produce appears in
the appendix in tables D.5.2.2 and D.5.2.3 (milk products).
Table 5.2.2.2. The annual steady state production, consumption and export levels
of Sr and Cs in mlllicuries from Danish animal agricultural produce for an
annual deposition rate of 1 mCi km" y (of °Sr or Cs respectlcely)
Cattle
P«.qs
Poultry + eggs
Bone and meat meal
Whole milk, cream
Skimmed milk etc.
Dried milk
Whey
Cheese
Butter
Production
90. Sr
116
145
7.6a)
117
2.8
6.2
4.8
1.33
4.1
0.07
All milk products Z 19.3
Total 288
Cs
14.9
36
0.9b>
5.6
3.9
8.7
6.8
7.2
0.62
0.10
27
79
Fodder
90e Sr
(76)
(49)
-
125
0.49
5.3
0.94
1.33
-
-
8.1
133
1 3 7CS
(2.5)
(3.1)
-
5.6
0.69
7.5
1.31
7.2
-
-
16.7
22
Human
9°o Sr
0.12
0.19
0.01
-
2.2
0.75
-
-
1.36
0.03
4.3
4.7
diet
137-Cs
2.5
7.4
0.34
-
3.1
1.0
-
-
0.21
0.03
4.3
14.5
Export
90_ Sr
35
82
2.4
-
0.13
-
3.9
-
2.7
0.03
6.8
126
1 3 7 C ,
4.6
21
0.43
-
0.17
-
5.5
-
0.41
0.07
6.2
32
*' 3 mCl Sr were from eggs and 4.6 mCi from poultry.
' 0.1 mCi Cs were from eggs and 0.8 mCi from poultry.
The figures in the table were calculated from the production figures in tables
D.5.2.2. and D.5.2.3. and from the radioecological sensitivities in appendix C.
Tables C.3.4.1. and C.3.4.2. were applied for beef and pork (recalling that
1 kg meat contains 0.1 g Ca and 3.2 g X). As the observed ratio between pCi 90Sr (g Ca)'1 in poultry bone and diet equals the ratio between eggs and diet
of the hen (Co66a), the radioecological sensitivity of poultry equaled that of
eggs (» 2.5 pCi Sr (g Ca) y per mCl Sr km cf. table C.3.6.1). The radio-137
ecological sensitivity of poultry was for Cs estimated at 3.5 times that of 137 —1 137 —2
eggs (cf. 3.6.2), i.e. of 6.3 pCi "'Cs kg x y per mCi 'Cs km ' (cf. table
C.3.6.2) or 2 pel 137Cs (g K)" 1 y per mCi 137Cs km"2. The radioecological sensi
tivities used for the various milk products were from tables C.3.2.1. and
C.3.2.2.
90 137
The production and division of Sr and Cs in Danish animal
agriculture are shown in table 5.2.2.2. The inventories in the
livestock become 0.31 Ci 90Sr and 0.049 Ci 137Cs.

- 214 -
C O
cont'aminatio/1260 2700 1170 waste
'Vegetation"
waste 24 310
"Animal'
1595000 "Soil"
bone meal and meat meal
L v^04Q/ excreta
\l
animal products 7 3.8 0.055 death
Man i
V ;000V NI390001
<I23/ excreta
7 ' 6 M4T rad. decay NM-
run-off rad. decay
90« no. 5.2.3.1. Inventories (italics) and annual transfers of Sr in the Danish terrestrial
environment (43 000 Km2), assuming steady state at an annual deposition rate of 1 mCi 90Sr Km"2 y"1. All figures are mCi 90Sr.

- 215 -
C O
indirect
rad. decay NJIOOCH/ w o o o l / run-off rod. decay
1 37 Fia. 5.2.3,2. Inventories (italic*) and annual transfers of Cs in the Danish terrestrial
2 environment (43 000 km ) assuming steady state at an annual deposition rate of 1 mCl 1 3 7C. km"2 y-1 All figures are mCl 137, Cs.

- 216 -
The age-weighted weight *f the Danish human population is 0.3 Tg. The potassium content is 0.6 Gg assuming 2 oK kg" living weight
(RRD5"-76) and the Ca content is 4.6 Gg, calculated from the Ca
content of the various age groups as estimated by MITCHELL et.
al. (Mi45). Assuming the mean radioecological sensitivities in on -1 30 -2
humans to be equal to 0.82 pCi Sr (gCa) y per mCi Sr km
(4.3.2) and to 2.85 x 4.4 * 12.5 pCi l^Cs (gK)"1 y per mCi 121Cs km (4.5.2 and 4.2.2), the inventories of the Danish population
become 3.8 mCi Sr and 7.5 mCi Cs at steady state for an
annual fallout rate of 1 mCi km~~ of each of tl«e tvo radionuclides.
5.2.3. Discussion of the models
The circulation of Sr and Cs in the Danish terrestrial ecosystem at steady state is shown in figs. 5.2.3.1 and 5.2.3.2
respectively. Table 5.2.3 summarizes the relative inventories
and concentrations of Sr and Cs together with those of the
twc chemical congeners: Ca and K.
It has sometimes been discussed whether Sr or Cs show bio-
magnification in the food chain. It is evident froer. table 5.2.3., 90 that the concentration of Sr is approx. three times higher in
animals than in the vegetable fodder. In the case of 137cs we
notice an increase in the animals by approx. 60t. However in 90 humans the Sr concentration is 4 times lower than in vegetation
137 and 14 times lower than in domestic animals. The Cs concentration in humans is betveen the concentrations found in vege-
90 table and animal products. As compared to Ca the sr level in
humans is approx. 80 times lower than in vegetable products and 137 13 times lower than in animals. The Cs/K ratio on the other
hand shows a tendency to increase along the human food chain. We
may conclude that herbivores are more subceptible to ccntami-90 nation with Sr than omnivores (and carnivores), whereas in
Cs the situation is reversed. The Cs concentrations are
lower in omnivorous man than in herbivorous lifestock, because 137 the vegetable fodder of the animals show higher Cs concet-
trations than the human vegetable diet.
90 The pyramid of numbers of Sr is different from that of C* indicating that nature discriminates against Sr relative to Ca.
137 The potassium pyramid is similar to that of the Cs pyramid.
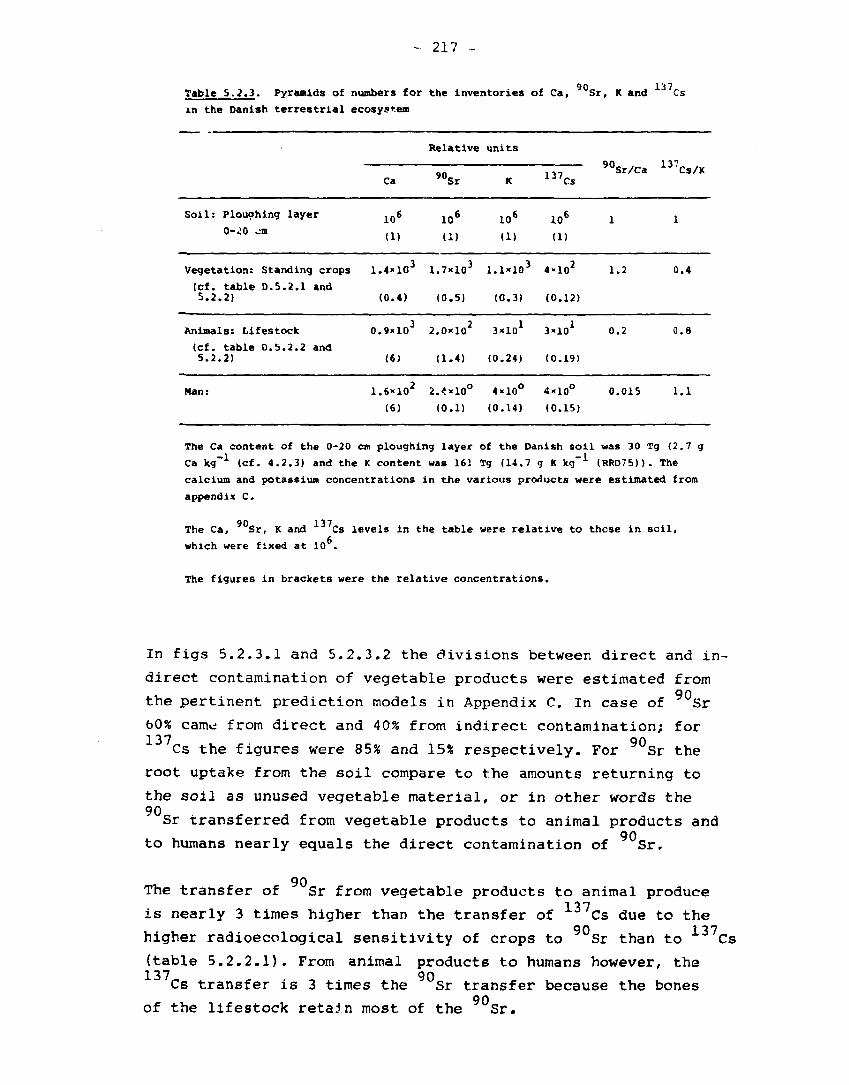
- 217 -
Table 5.2.3. Pyramids of numbers for the inventories of Ca, Sr, K and Cs
in the Danish terrestrial
Soil: Ploughing layer
0-JO on
Vegetation: Standing crops
(cf. table D.5.2.1 and 5.2.2)
Animals: Lifestock
(cf. table 0.5.2.2 and 5.2.2)
Man:
ecosystem
Ca
106
(1)
1.4xl03
(0.4)
0.9*103
(6)
1.6xl02
(6)
Relative
90Sr
106
(1)
1.7xl03
(0.5)
2.0xl02
(1.4)
2.<xl0°
(0.1)
units
K
106
(1)
l.lxlO3
(0.3)
3X101
(0.24)
4x10°
(0.14)
137CS
xo6
(1)
4*102
(0.12)
Sxio1
(0.19)
4x10°
(0.15)
90Sr/Ca
1
1.2
0.2
0.015
137CS/K
1
0.4
0.8
1.1
The Ca content of the 0-20 cm ploughing layer of the Danish soil was 30 Tg (2.7 g
Ca kg"1 (cf. 4.2.3) and the K content was 161 Tg (14.7 g K kg-1 (RRD75)). The
calcium and potassium concentrations in the various products were estimated from
appendix C.
The Ca, Sr, K and Cs levels in the table were relative to those in soil,
which were fixed at 10 .
The figures in brackets were the relative concentrations.
In figs 5.2.3.1 and 5.2.3.2 the divisions between direct and in
direct contamination of vegetable products were estimated from 90 the pertinent prediction models in Appendix C. In case of Sr
60% came from direct and 40% from indirect contamination; for
Cs the figures were 85% and 1555 respectively. For Sr the
root uptake from the soil compare to the amounts returning to
the soil as unused vegetable material, or in other words the 90 Sr transferred from vegetable products to animal products and
90 to humans nearly equals the direct contamination of Sr.
90 The transfer of Sr from vegetable products to animal produce
137 is nearly 3 times higher than the transfer of Cs due to the 90 137
higher radioecological sensitivity of crops to Sr than to Cs
(table 5.2.2.1). From animal products to humans however, the
Cs transfer is 3 times the Sr transfer because the bones 90
of the lifestock retain most of the Sr.

- 218 -
137 The transfer of Cs from vegetable products to humans is also
90 higher that of Sr, because grain products (white bread) as well 137 as potatoes show higher radioecological sensitivity to Cs than
90 l37 to Sr. The total transfer of "" Cs to humans is twice that of 90
Sr. This is a little higher than the ratio found in table 4.2.2,
because the diet composition applied in the present estimate was
that from 1975, whereas table 4.2.2 used the 1962 composition
(cf. D.4.2.1). 90
With the export of animal agricultural products 126 mCi Sr and 137 32 mCi Cs are leaving the ecosystem; these amounts are 0.3%
and 0.07% of the annual input of the two radionuclides and imma
terial as compared to radioactive decay and run-off to the sea.
90 137 The net uptake of Sr and Cs in the animal agricultural
system was,respectively, 12.4% and 7.8% of the inputs to the
systems; in humans the corresponding figures were 1.2% and 1.1%.
The turnover rates in the animal agricultural system are thus 90 approx. ten times higher than in the human system for Sr and
137 seven times higher for Cs. The production rate of the animal
system was 1.05 x lifestock per year while the human "production"
was only 0.013 x population per year. Hence the relative pro
ductivity of the animal sytem was nearly 80 times that of the
human system, which explains the lower turnover rate of radio
nuclides in the latter system.
In the models for the Danish terrestrial ecosystem we have neg
lected input from the marine environment, because it is difficult
to delimit the marine ecosystem. However, for the total human
diet the contribution of Sr from fish is nil and for Cs it
is in the order of 2-3%. The animal agriculture also receives
marine products through its use of fish meal; however compared
to the vegetable fodder the <
fish meal were less than 1%.
90 137 to the vegetable fodder the contributions of Sr and Cs from
We have also neglected the drinking water in our system. The
drinking water supply to the Danish livestock is approx. 10 -1 90
1 y . The annual contribution of Sr will be between 0.7-30
mCi y~ , depending upon whether the water is ground water or
stream water (table C.1.4.1),i.e. probably less than 1% of the

- 219 -
intake from vegetable products. For
be even lower (1.4).
137 Cs the contribution will
If all vegetable products for human consumption were imported 90 from a contamination-free area the Sr intake by humans would
be reduced by a factor of 2.7 and the Cs intake by a factor
of 1.7. The effective dose equivalent commitment (D.4.7.7) from 90 137 diet intake of Sr and Cs could be reduced by a factor of
two. The same reduction could be obtained if instead the animal
agricultural products for Danish human consumption were imported.
But animal products are much more expensive than vegetable prod
ucts.
5.3. Physiological and environmental radiotoxicity
havde Vytene ikke vtiet giftigt og kyaede a$ Hexen, da vale de blevne &onvandledt til led«, ftoiei, men Blom&ten. blev de dog, ved at hvile, pi hendei Hoved og ved hendei HjUt?.;
VI l/UPE SI/AMER
lb the cteatuiei hadn't been poi&onoui and kilned by the wiitch, they mould have been tulned intc ted totei; though, mind you, they did change into bloweii, ju.it f,\om testing on he* head and at het heatt.
THE UlLV SUANS
Exposure of humans to radiation may lead to the incidence of
stochastic and non-stochastic health effects. Non-stochastic
effects occur only if certain levels of dose are exceeded; these
levels are several orders of magnitude in excess of doses typi
cally received from radioactive contamination of the environment
under normal peaceful conditions. The important stochastic
effects are carcinogenesis in the exposed population and her
editary effects in its progeny. The probability of occurrence
of stochastic effects is assumed proportional to dose, without
threshold.
The toxicity of a substance or agent may be given by the so
called LD5ø(3o) value/ expressing the dose (e.g. in grams or
Joules pr. kg living weight of the exposed organism) which
within 30 days kills 50% of a population exposed to the dose.
LDe0.--» may be applied for non-stochastic effects of ionizing
radiation, but for stochastic effects the effective doseequiv-
alent commitment is preferable (cf. D.4.7.7).

- 220 -
The physiological radiotoxicity deals with the toxicity of radio
nuclides in the human diet ingested and in the air breathed by
humans.
The environmental radiotccicity is about the toxicity of radio
nuclides deposited on the Earth's surface (cf. the UNSCEAR model
in 1.1).
5.3.1. Physiological radiotoxicitv
We shall define the physiological radiotoxicity of a qiven sub
stance as the per caput effective dose-equivalent commitment to
an adult "standard man" received from the intake of one unit of
radioactivity of the substance. This intake could either be per
oral or by inhalation. As we have seen (1.7.2) the relative
toxicity of radionuclides depends upon the route of intake.
Strontium-90 is thus more hazardous than ' Pu if the intake
is peroral, while plutonium becomes the more toxic if inhalation
is the route of entry.
The physiological radiotoxicity from oral intake of a radio
nuclide is:
K x P,. x P.5 x w_ (Eq 5.3.1)
where K is a constant which convertes the diet intake to the
prober unit of activity
P-. is the transfer factor from diet to tissue of the radionuclide 34
P45 is the transfer factor from activity content in tissue to
dose to tissue of the radionuclide
w is ICRP's weighting factor (Ic77) for the tissue T.
If the radionuclide enters more than one tissue type the various
contributions to ths whole-body dose should be added in order to
calculate the physiological radiotocicity of the radionuclide.
In case of inhalation the expression becomes:
P14 x P45 x WT (Eq 5'3'2)

- 221 -
where P,. is the transfer factor from atmosphere to tissue. Ana
logous with peroral intake the dose contributions to various
tissues should be added in order to calculate the toxicity.
90 137 Let us calculate the physiological toxicity of Sr and Cs
in the Danish diet. In this calculation we will use Bq as the
unit of activity and assume intakes of 1 Bq of each of the two
radionuclides. We will calculate the effective dose equivalent
commitment from these intakes and consider the results as ex
pressions for the physiological toxicity (as to transfer factors
and weighting factors cf. 4.7.7):
90 A Sr: 0.0433[0.16 * 1.4 * 0.12 + 0.16 * 1.9 ' 0.03] * 10* =
15.6 nSv(Bq)-1
1 3 7Cs: 0.0211 ' 2.85 • 1.8 * 10~2 . 104 = 10.8 nSv(Bq)"1
90 90 1 The transfer factors for Sr are based upon the pCi Sr (gCa)
137 137 -1 ratios and for Cs on the pCi Cs(gK) ratios.
The annual intakes with Danish diet of Ca and K is 623 g and
1281 g respectively (table D.4.2.1.a),
90 One Becquerel equals 27 pCi. Hence the K factor for Sr becomes
||3 = 0.0433 pCi Bq"1 Y (gCa) ' l and for 1 3 7Cs: j ^ y = 0.0211
pCi • Bq"1 ' y (gK)"1.
The calculation shows that the physiological radiotoxicity of 9 0Sr in the Danish diet is 1.44 times that of 1 3 7Cs. If the
Faroese diet is considered the Ca and K amounts are 415 g and
1174 g, respectively (Table 4,2,4). The physiological toxicities fi93 1 90
t in increase to ^ j . 15,6 = 23 nSv (Bq)~x for Sr and to i ^ | . 10.8 = 11.8 nSv (Bq)"1 for 1 3 7Cs
The physiological radiotoxicity may thus be influenced by other
substances in the diet that the radionuclide itself/ as seen
above, e.g. by the chemical congeners to the radionuclides.

- 222 -
5.3.2. Environmental radiotoxicity
Recurring to the environmental radiotoxicity it becomes even
more evident that this quantity depends upon the interaction of
numerous factors, where the physiological toxicity of the radio
nuclide is only one - and not necessarily the most important.
In analogy with the physiological radiotocicity the per caput
environmental radiotoxicity is calculated as:
q x P23 x P34 x P45 x wT (Eq 5 3 3 )
where q is a constant which converts the deposition of activity
to the proper unit for the toxicity calculation
P_, is the transfer factor from Earth surface to human diet, in
other words the radioecological sensitivity of human diet for
the given radionuclide in the given environment.
In 4.7.7 the effective dose equivalent commitment has been 90 -2 calculated for depositions of 73 mCi Sr km and of 117 mCi
137 -2 90 Cs km .In Denmark the dose from Sr became 10.08 + 3.42 =
137 13.5 mrem and for Cs (from diet) 26 mrem. If we normalize to _2
1 Bq m of each of the two radionuclides we find the per caput
environmental radiotoxicity to be
13.5 * 104 ' 27 c- 0 ,n -2X-1 ^ 90 — 7 3 0 0 0 = 50 nSv (Bqm *) * for Sr
and
2 6 117000* 2 ? = 6 0 n S v ^ l " 1 " 2 ) " 1 for 1 3 7C S /
1 37 i.e. the environmental radiotoxicity of Cs in Denmark is
90 20 per cent higher than that of Sr. If we calculate the
radiotoxicities of the two radionuclides for the Paroese en-2 1 90 0 l
vironment we find 53 nSv(Bqm ) x for Sr and 181 nSv(Bqm ) 137 137
for Cs, i.e. in the Faroes Islands Cs is 3.4 times more 90 137
toxic than Sr. In the Greenland environment Cs is twice 90
as toxic as Sr.

- 223 -
We have seen that the per caput environmental radiotoxicity
depends upon the radioecological sensitivity (P->-» in Eq.
5.3.3). The collective environmental radiotoxicity further
more depends upon the diet yield per unit area. Although the 137 radioecological sensitivity of e.g. Cs in Faroese milk thus
is ten times higher than in Danish milk the collective dose
from milk per unit area in the Faroe Islands is lower than the
collective dose of milk produced per unit area in Denmark be
cause the Danish milk production per unit area is nearly fifty
times higher than the Faroese.
In order to calculate the collective environmental radiotoxi
city the per caput radiotoxicity is multiplied by the number
of people which may be supplied by the food production in a
unit area of the environment considered. Denmark is self-sup
plying with human diet and we furthermore export milk and meat-90 137 products. We may estimate the exportation of Sr and Cs
for human consumption from the information given in Tables 90
D.5.2.2, D.5.2.3 and 4.2.2. We find that Danish export of Sr 137 is 50% of our consumption while the export of Cs is twice
2 our consumption. In other words 1 km of Denmark supply
5 * 10^ * 1 5 "90 " 3 iy J^a = 1 7 4 p e o p l e w i t n ™Sr d i e t 43000
and
5 ' 10 * 2 "137 " - — 4 3 Q 0 Q — - - 233 people with "'Cs diet
We may now calculate the collective environmental radiotoxicity 90 137 2
of Sr and Cs of 1 km of Denmark:
90Sr: 174 ' 50 • 10~3 = 8.7 uman Sv (Bqm-2)"1 km"2
and
137Cs: 233 ' 60 * 10~3 = 14 uman Sv (Bqm"2)km"2
In the Faroe Islands 68* of the 90Sr and 94* of the Cs is
of local origin (cf. table 4.2.4).
- 224 -
Hence the Faroese environment can supply
°'68 ' 4 1()4 = 19.4 people km"2 with "90Sr diet' 1400
and
0.94 ' 4 ' 104 __ , . -2 ... "137„ ,. " TTQ^ = 27 people km with Cs diet
_2 The collective environmental radiotoxicity of 1 km of the
Faroe Islands becomes
53 ' 19.4 * 10"3 =1.03 uman Sv (BqnT2)"1 km-2 for 90Sr
and
27 * 181 * 10~3 = 4.9 yman Sv (BqirT2)-1 km-2 for 137Cs
The environmental radiotoxicity of the Faroese environment is
thus lower than of the Danish environment if collective doses
of Sr and Cs are considered, while the toxicity was high
er in the Faroe Islands with regard to per caput doses.
5.3.3. Comparison of radiotoxicities
Table 5.3.3. summarizes the various diet-derived radiotoxi-90 137 cities of Sr and Cs in Denmark and the Faroe Island. It
should be noted that the units of the figures in the three rows
differ; but the table demonstrates that toxicity is not an ab
solute, but strongly dependent upon the context in which we use
the concept. For a given contamination an inhabitant in the
Faroes will show higher individual doses than a Dane exposed
to the same contamination. The collective dose however will be
considerably higher in the Danish environment due to the higher
food production per unit area in Denmark. The environmental 90 137
toxicity of Sr is lover than that of Cs and the difference
between the two radionuclides is most pronounced for the collec
tive doses.
The calculations of the collective radiotoxicities in Table
5.3.3. are based on the average foodproduction per unit area
for the total areas of Denmark and the Faroe Islands, which is

- 225 -
Table 5.3.3. Radiotoxicities of Sr and Cs in Denmark and the
Faroe Islands
Radiotoxicity
Physiological: nSv per Bq ingested
Denmark
90Sr 1 3 7Cs
IS.6 10.8
Faroe Islands
90Sr 1 3 7Cs
23 11.8
Per caput
nSv per Bq m~2 deposited 50 60 53 181 Environmental
Collective
pmanSv km
per Bq m~2 deposited 8.7 14 1.03 4.9
the pertinent approach in case of global fallout. However, if
the contamination has a local nature, as e.g. in the case of
the releases from a nuclear installation, the results may
change. If, e.g., pure agricultural areas in the Faroe Islands
and in Denmark are compared the collective radiotoxicities is
not necessarily still higher in Denmark, because the lower pro
ductivity of Faroese agricultural areas may be more than com
pensated for by the higher radioecological sensitivities of the
Faroese agricultural products.
We have seen that a high radioecological sensitivity is not
necessarily tantamount to a high collective environmental radio
toxicity. There may even be a tendency to an inverse relation
ship between the radioecological sensitivity and the collective
environmental radiotoxicity, because a high radioecological
sensitivity often is found in agricultural areas with low pro
ductivity (Cham 70, Aa72a). In Jutland, where the mean yield
of wheat in a wheatfield is 485 tons km-2 (Da57-77) the radio
ecological sensitivity is 1.33 times higher than in a wheat-
field in the Islands, where the yield is 519 tons km , where
as the ratio between the collective environmental radiotoxi
cities is only 1.24.

- 226 -
The present definition of radiotoxicity infers that only fatal
cancers (apart from those of the skin) and the hereditary effect
in the first two generations are included in the health detri
ment (cf. D.4.7.7). If the total radiotoxicity of a radioac
tive substance should be evaluated one might furthermore in
clude fatal cancers of the skin, non-fatal cancers and subse
quent hereditary effects. This has not been done because a com
mon measure of the health detriment for these various effects
is not available. The total radiotoxicity of a substance as
I, which may give rise to non-fatal cancers of the thyroid
is thus underestimated as long as it is based on effective dose-
equivalent commitment only, and the same would be the case for 85 Kr, which irradiates the skin.
Although the effective dose-equivalent commitment may thus not
be a perfect description of the health detriment and hence of
the toxicity of a radioactive substance, we are, regarding the
definition of toxicity, in a far better position for radio
active substances than for most other toxic materials.
5.4. Applications
"Snik Mak'." &agde Soldaten, "vil du itlax ligt mig, hvad du vil med det, ellen jeg •ttafefee* min Sabel ud og huggex dit Hoved ai'."
fVKTøJBT
"Rubbithl i aid the ioldiei. "Telt me at once what you want to do with it - on I'll have out mij auo\d and cut <jou\ head cH".
THE TIMER-BOX
in the evaluation of the suitability of a potential nuclear
site numerous factors are taken into account. One of these -
but not necessarily the most weighty - are the factors which
influence the dose to humans from ingestion of radionuclides
released during the operation of the nuclear plant. These doses
may, as we have discussed in the preceeding section, be indi
vidual or collective; both types should be considered.

- 227 -
90 137 5,4.1. Other radionuclides compared with Sr and Cs
The present study has concentrated on Sr and Cs. Together
these nuclides have delivered nearly 90% of the internal effec
tive dose equivalent to humans as the result of ingestion of food
contaminated with the fallout radionuclides from nuclear weapons
testing.
We have seen that the environmental behaviour of the two nu-90
elides differs markedly. In the Danish environment Sr may thus
represent a radionuclide entering the foodchain by indirect as 137
well as direct contamination, whereas Cs may be characteristic for a contaminant that preferentially is incorporated
through direct contamination. Most radionuclides will be like 137
Cs in this respect.
We have furthermore seen that the direct contamination of crops
with various radionuclides strongly depends upon their ability
to translocate within the plants. Cesium-137 is a nuclide which
is highly translocated (VIII), and thus likely to be relatively
more abundant in seeds and fruits than most other radionuclides.
90 Throughout the study fallout radionuclides other than Sr and 137
Cs have also been considered. In grain we have thus examined 54 89 239 240
Mn, Sr and "'**HPu. The transfer factors of these radio
nuclides from deposition to cereals did not exceed those of 137
Cs (2.2.3, 2.2.4 and IX) and we have found that the local 54 89 239 240
variabilities of Mn, Sr and ' Pu were within the same range as the corresponding variabilities of Sr and Cs (cf. Table B.2.2.9).
In a recent study of lead in Danish cereal grain (So 78) we ob
served that stable Pb also shows a local variability in Danish
grain which is within the range of the various fallout radio
nuclides studied.
89 131 In the case of milk Sr and I have been determined in
countrywide collected samples when possible. Neither of these
radionuclides have shown higher transfer factors than those of 90Sr and 137Cs (3.2.3). The local variability of 89Sr in milk
was between that of Sr and Cs. In the case of I the

- 228 -
local variability was determined from a countrywide sampling
performed in the last 3 weeks of September 1962 (RRD62) of fresh
milk (Fig. A.1.4.2.1), dried milk (Fig. A.1.3.2) and untreated
milk (Fig. A.1.1.3.1). From this study the local variability 131 of I in Danish milk was estimated at 0.3-0.4, i.e. similar
to that of 137Cs in milk (Table B.3.2.3).
5.4.2. A hypothesis
Several radionuclides may be released from nuclear installations
under normal operations as well as in case of accidents. Some
of these radionuclides have hitherto not been present in quan
tities such that studies of their radioecological behaviour in
various environments have been feasible. However, it is poss
ible to evaluate a terrestrial environment radioecologically by
applying the radioecological sensitivities and variabilities of 90 137 yuSr and IJ/Cs only.
In the environmental terrestrial studies of other radionuclides
we have found no indications of transfer factors higher than 90 137 those found for Sr and Cs. We have not seen examples either
of local variabilities exceeding those observed for these two
radionuclides, and the local pattern in Denmark of the various
rad 137
90 radionuclides - and of lead, too - follows that of Sr and
Cs. The levels in the western part of the country is at most
2-3 times higher than those in eastern Denmark. The radioeco
logical sensitivities of agricultural products from Jutland are
seldom more than two times those from the Islands; the mean
ratios between the two halves of the country for grain, veg
etables and milk are 1.6 for Sr and 1.3 for Cs.
We may therefore conclude, that from a terrestrial radioecologi
cal point of view Jutland is less suited than the Islands for
nuclear installations, because the individual doses through the
terrestrial foodchains on the average are higher than those
received from the same releases in the Islands.
In the preceeding section (5.3) we discussed the importance of
the agricultural production at the site. This production would
determine the collective dose along with the radiobiological
sensitivity. The yields per unit area of arable land are usual-

129
ly 5-10X higher in the Islands than in Jutland*). Hence the dif
ference between collective doses at the two sites will be less
than the difference between individual doses, but Jutland will
still be the most sensitive area to radioactive contamination
of terrestrial foodchains.
However, nuclear installations also release radionuclides to
the marine environment. In this case it is not sufficient to 90 137 consider radioecologic«jl sensitivities of Sr and Cs only.
Neither of these radionuclides show especially high concen
tration factors in marine organisms (2.7.2, 3.5.2 and 3.6).
Whereas many activation products released with waste water from
nuclear reactors, e.g. Cr, Mn, Fe, Co and Zn may show
a substantial biomagnification in marine organisms, e.g. in 95 brown algae and in mussels (RRD77). Also fission products { Zr,
106n x j 4. ! ,239,240„ 241, . ,
Ru) and transuranic elements ( Pu, Am) nay show
concentrations in the marine biota which are orders of magnitude
higher than those in the surrounding seawater.
For some radionuclides e.g. radiocesium low salinities are tan
tamount to higher biomagnification than high salinities. As the
waters around Jutland on the average show higher mean salinities
than the waters around the Islands, the radioecological sensi
tivity of the marine environment in the western part of the
country may be lower than that of the eastern, assuming the
effective mean life of a given radionuclide to be the same in
the two environments. The per caput doses from consumption of
marine products would thus be higher in the Islands than in
Jutland. The catch of fish around the Islands is, however, an
order of magnitude less than the catch in the waters around
Jutland. Hence the collective dose from radionuclides with
waterborne releases may be higher for a nuclear plant in Jut
land than for a similar plant in the Islands. UNSCEAR (Un77)
has calculated that for present days nuclear reactors approx.
3.5% of the total effective dose equivalent commitment come from
the terrestrial foodchains, and approx. 4\ from water path ways.
*) In Jutland 68* of the total area are arable area of farms in the Islands 66% are arable.

- 230 -
5.4.3. Considerations in case of nuclear accidents
During the noraal operation of a nuclear power reactor only
•tinor releases of radionuclides take place. For light water
reactors (BHR and PWR) the airborne releases Mostly consist of
noble gases such as 133Xe, 85Kr and of l31r. The waterborne
releases are the activation products Mentioned above (5.4.2}
and radiocesiuM. The doses through the radioecological pathways
are genera}ly an order of magnitude lower than the doses from
inhalation and fro« external radiation fros the air or fron the
ground (Un77). Hence for dose assessaents the population den
sities around nuclear sites are usually sore important than the
agricultural production.
In the case of a very serious accident, where the fuel elements
in the reactor core melt and where the reactor containment is
ruptured, substantial amounts of Sr and especially of Cs
May be released to the environment along with Many other radio
nuclides, principally radioactive noble gasses and radioiodine.
The long tern doses and the contamination of land from such an
accident will largely depend upon the amounts of the longlived
and medium-longlived radionuclides released from the accident.
Strontium-90 t
radionuclides.
137 Strontium-90 and Cs are the most important in this group of
The time of the year influences the doses from the foodchain 137 (cf. D.4.7.8). In Denmark Cs is not taicen up by the roots
to any large extent. If the accident happens during the winter
the diet will therefore contain relative low concentrations of
Cs as compared to a summer accident. In the case of Sr
the difference will be less pronounced because the indirect 90 contamination of crops with Sr i s of the same order as the
137 direct. In any event the Cs levels will decrease more rapid-90
ly than the Sr levels. The doses from the food could be substantially reduced by discarding the first year's harvest.
To elucidate this a little further the radioecological sensi
tivity may be divided into an instant and a delayed sensitivity.
The instant radioecological sensitivity is the contribution to
the total radioecolcgical sensitivity which, according to the

- 231 -
p--^diction models, is delivered within the same year as the
contamination has occurred; the delayed radioecological sensi
tivity is the remainder.
As a high time variability among years (CV , J is tanta-p I years)
mount to primary dependence on direct (instant) fallout, it is
obvious to express instant radioecological sensitivity as a
function of the annual variability as shown in Fig. 5.4.3.
>-
>
100
£80 -LLl CO
<
y60 o o o LU , «
o £0 o < er (S CO
20
-
-
-
—
—
—
/fflO
I
v"V
A
/®k ' °o
•
i
1
V
D
. >
90Sr A
V D
0 0 1
»r*-y-*—r* 1 • / % = 5.56xCVp(yMrl
/ ' r =0.85
/ •
•
,137Cs A Grain, Jutland * Grain, the Islands • Vegetables and fruits, Denmark • Milk and meat. Denmark • Milk and meat. Faroe Islands
i I i
0.0 0.5 1.0 1.5 CVp{year)
2.0 2.5
Tia. 5.4.3. The instant radioecological sensitivity (cf. the text) as a
function of the timevariability <CVp( s)) determined 1962-19 i. The
tables in appendix B were used for the varabllities and appendix C de
livered the prediction models for the calculation of the instant radio-
ecological sensitivities.
The equation in Fig. 5,4,3, establish connection between varia
bility and radioecological sensitivity. From this equation, it
is possible after an accident to estimate the effect of dis
carding the first years harvest of a given crop grown in the
area contaminated by the accident. Let e.g. the crop be rye

- 232 -
90 from Jutland. In that case CV , . = 1 for Sr (table p(years) 9 Q B.2.2.7) and the dose commitment from Sr in rye would then
be reduced to approx 40% of the dose received if no remedial
measures had been taken (cf. also D.4.7.8) .
If the equation in Fig. 5.4.3 is applied to animal agricultural
products one should keep in mind that the fodder to the animals
delivering the products should be from the same year as the
products themselves. As this is only approximately the case the
observed instant radioecological sensitivity for the animal
produce in fig. 5.4.3 is generally lower than that calculated
from the time variabilities of the samples.
Fig. 5.4.3 shows that a substantial reduction in the doses 137 from Cs in Danish diet components could be obtained by dis-
90 carding the first years harvest. In the case of Sr the effect
is more modest. It would, e.g., have nearly no effect on the 90 Sr doses if the first years harvest of vegetables (cabbage,
carrots and potatoes) were discarded. In the Faroe Islands 90 the effect of discarding first years harvest on Sr as well
137 as on Cs doses would generally be less than in Denmark.
The longtime dose from an accident will however only to minor
degree come from the foodchain. The main contributor to the 137 dose will be the external radiation from the Cs deposited.
*) In case of milk and meat the products from May,.* to April,. ..
should be from fodder produced in the year,.* (cf. 3.2.1 and 3.4.1)

- 233 -
5.5. Conclusions
5.5.1, General
The public concern of pollution in general and of radioactivi
ty in particular has made radioactive contamination of the en
vironment a controversial issue. It is not easy to inform the
population in order to improve the understanding of these often
very complicated problems. The task is even harder because mis
comprehensions are by no means limited to laymen's circles. The
treatment of the toxicity concept in public debate is an ex
cellent example of present misunderstandings of pollution prob
lems. A large proportion of the public is reluctant to accept
nuclear energy as one way of energy production among several
others; to a considerable degree this may be due to three in
herent properties of ionizing radiation:-1) It cannot be de
tected directly with any of the human senses, 2) The equipment
used to measure radioactivity is extremely sensitive, which
means that even very low - and from a health point of view in
significant - amounts are measurable, and 3) It is - contrary
to most other pollutants - relatively easy to quantify the
health detriment of a given dose of ionizing radiation to the
population.
In this final chapter we ha^e especially dealt with the appli
cation of radioecological sensitivity and variability in the
evaluation of health detriment from environmental radioactive
contamination. We have furthermore demonstrated how the radio-
ecological sensitivity can oe applied for the calculation of
inventories and transfers of radionuclides in en ecosystem.
5.5.2. Inventories and transfers
90 137
The annual transfers of Sr and Cs from vegetable agricul
tural produce to animal produce are 80% and 100%, respectively,
of the inventories of the standing crop at summer. From animals
to man the corresponding figures are 1.5% and 30% of the ani
mal inventories, and from vegetable produce to humans 0.3% and
1.3% of the vegetable inventories.

- 234
90 137
The inventories of Sr were 3 times that of Cs for "veg
etation", 6 times for "animals" and 0.5 times for humans, as
suming steady state and equal fallout rates of the two radio
nuclides..
90 The producers are thus in general more sensitive to Sr than 137 to Cs contamination, and so are the consumers if they are
herbivorous. For humans as omnivores sensitivity to environ-137 mental (
tamination.
137 90 mental Cs contamination is greater than that of a Sr con-
The agricultural statistic of the Faroe Islands is less compre
hensive than the Danish statistics, and significant amounts of
human diet and animal fodder are imported to the Faroe Islands.
Hence it is not possible to calculate detailed models for the
Faroese ecosystem as we have done for the Danish. However, we 90 may estimate that the Sr inventories of Faroese vegetation
137 are half the Cs inventories, and that the domestic animals 90 in th-j Faroe Islands contain approx. 3 times more Sr than
137
Cs for the same environmental contamination of the two nu
clides.
137 The Cs inventory of the Faroese population is estimated to 90 be approx. 6 times the Sr inventory. This shows that the
Faroese terrestrical ecosystem behaves differently from the 90 137 Danish with regard to Sr and Cs contamination.
5«5.3. Radiotoxicities
We have considered physiological and environmental radiotoxi-90 city. We have shown that the first mentioned for Sr in Den-
137 mark is 50* higher than that of Cs. In the Faroes the phy-90 137
siological toxicity of Sr is two times that of Cs, if the
two radionuclides are ingested with Faroese diet. The environ
mental radiotoxicity of Cs is higher than that of Sr. In 137 the Faroes the per caput environmental radiotoxicity of Cs
is 3 times that in Denmark? but the collective environmental 137 radiotoxicity of Cs is 3 times higher in Denmark than in
the Faroes due to the higher agricultural production pr unit
area in Denmark.

- 235 -
The examples show that it is confusing or even misleading to
state that ore .substance is more toxic than another without
specifying the circumstances under which the two toxicities
are compared.
5.5.4. Applications 90 137 The radioecological sensitivities of Sr and Cs can be
used to classify an environment radioecologically. If the ter
restrial environmental samples from one environment show high
er radioecological sensitivities for both radionuclides than
the samples from another environment, our conclusion would be
that the former environment may result into higher individual
doses from ingestion of local food than the latter, also for 90 137 releases of radionuclides other than Sr and Cs.
As the collective doses pr unit area are proportional to the
foodproduction pr unit area and as the radioecological sensi
tivity often is inverse proportional to the crop yield, high
individual doses in an area are not necessarily tantamount to
high collective doses.
The so-called instant radioecological sensitivity may be re-90 137 lated to the time variability observed for Sr and Cs in
the various environmental samples collected since the beginning
at the sixties. The two quantities are proportional and the
time variability of a sample may thus be used for the estimation
of the instant radioecological sensitivity, which again is a
relative measure of the dose received within the same year
as the activity release. The time variabilities may thus be
applied to estimate the effect of discarding the first years
harvest or of changing the agricultural production in a con
taminated area.
5.5.5. Further studies
Because of its many relations to nearly all diciplines of sci
ence an environmental study will inevitably inspire further
studies. First of all it raises a number of basic problems
which should be dealt with in well-defined experimental studies.
This final section will, however, emphasize further environ-

- 236 -
mental studies, which the present ones are related to.
We have in Appendix C shortly mentioned dynamic modelling of
the environmental behaviour of radionuclides. Such models have
until now been of limited usefulness because the basic data,
e.g., on transfer coefficients between the various compart
ments, often have been poor. The present study has estimated a 90 137 number of transfer coefficient for Sr and Cs in the Danish
environment. It may be worthwhile to apply these data in a dy
namic model for the behaviour of these radionuclides in the
Danish environment. Sensitivity analyses are an important ap
plication of dynamic models. By such analyses one may identify
which data are of special importance and thus where future
research is waranted.
90 137 Although Sr and Cs have been studied comprehensively in
the terrestrial environment for the last 20 years there still
exist some uncertainty in assessing the long term transfer of
these radionuclides to humans and their diet; especially be
cause the migration down through the soil and any physical or
biochemical processes, which modify the availability of the
radionuclides for uptake into plants with time, have not been
finely settled. Hence it is important still to follow the be-on 13'
haviour of Sr and
produce and in humans.
90 137 haviour of Sr and Cs in soil as well as in terrestrial
In the very long term perspective other radionuclides might
dominate the environmental contamination arising from present
day's use of nuclear fission. Technetium-99 with a half-life
of 2.14 x 10⁵ years, 1 2 9I with 1.57 x 10⁷ years half-life and 239 240 241 the transuianic elements (e.g. ' Pu and Am) are such
nuclides. Our understanding of the environmental behaviour of
the transuranic elements in these years are rapidly improving, 99 129 whereas radioecological studies of Tc and I have only just
begun. None of these two radionuclides are especially hazardous,
but they seem to be transferred quite easily through foodchains
and research efforts are warranted for a better understanding
of their long-term behaviour in the environment.
Our knowledge of the behaviour of radionuclides in the terres-

- 237 -
trial environment is generally better than that of the marine
environment, especially the oceans. Ws can point out problems
such as the relatively high marine levels along the Greenland
eastcoast, and the future fate of the 0.8 MCi Cs hitherto (1979)
released to the sea from the reprocessing plant of Windscale.
The behaviour of radionuclides released into the deep sea, e.g.
from waste disposal, will also require further studies in the
coming years. Marine studies are expensive and international
cooperation is therefore a must for this research.
With a rapidly increasing world population other methods of
foodproduction than those at present in use are foreseen. Sea vegetation
may thus be an important part of the future diet of the world.
This should be taken into account in marine radioecological
studies, because sea plants show high concentration factors
for many environmental pollutants. Generally, in future radio-
ecological studies one should be vigilant to new path-ways to
humans.
A special application of the environmental contamination with
radionuclides is the use of the nuclides for identification
and dating purposes. Lake sediments may thus be age-determined 137 239 240 90 from their contents of Cs or ' Pu. From Sr analysis
of, e.g., a bone sample one may make out whether the sample
originates from before "the nuclear age". However, one should
be careful not to jump to conclusions. We have thus recently
seen that a human bone sample, which had been laying in a spruce 90
forest for 10 years contained considerly more Sr than expected from its age, presumably because the bone material had
90 accumulated Sr from the surroundings. Isotope ratios are
often useful for identification of sources of contamination.
Studies of 238Pu/239'240Pu ratios or of 134Cs/137Cs ratios may
thus show whether a given contamination arises from nuclear
power installations or from weapons testing. Measurements of
such ratios do not require quantitative analyses where the
chemical yields are known because we assume that isotopes of
the same element found in the environment at some distance from
the sources are of the same chemical form.
Although our knowledge of radioactive contamination of the en-

- 238 -
vironment in many respects is incomplete, it is nevertheless
considerably more comprehensive than our knowledge of non-radio
active pollutants. Primarily because the sensitivity to detec
tion and assessment of radioactive substances is generally far
superior to that of other pollutants. The many possible sources
of non-radioactive pollutants (local, regional and global) com
bined with no easy method to determine the age of a non-radio
active substance contribute to the difficulties in assessing
pathways to man. Reliable transfer factors between the various
environmental compartments are thus not easily available. It
should however be possible to improve the situation by using
more systematic and comprehensive sampling programs, e.g. simi
lar to those used for radioactive contamination in the present
study. By analysis of variance one could then get a better
understanding of the various mechanisms determining the non
radioactive environmental contamination. As an example of such
a procedure we have recently carried out a study of the lead
contamination of Danish cereal grain collected since 1962 at
the Danish State Experimental Farms (So78). We shall in future
studies include other previous collected environmental samples,
and we intend also to examine other metals than lead. We ex
pect that such a study, among other things,could show whether
the concept of radioecological sensitivity and variability
also could be applied to non-radioactive pollutants.

- 239 -
ACKNOWLEDGEMENTS
This work would never have been accomplished without the
excellent spirit of co-operation fostered at the Risø National
Laboratory, and in particular in the Health Physics Department,
which is headed by H.L. GJØRUP. From the very beginning of these
studies in 1957, my colleague J. LIPPERT has been a key figure
in the environmental studies carried out at Risø. He developed
and constructed an essential part of the equipment used for
the various radioactivity measurements, and is furthermore the
author of the STATDATA program used for treating the data.
Throughout the study HEINZ HANSEN and ARNA ANDERSEN have given
me their good advice. I am indebted to JOHN H. HARLEY, the late
director of the Environmental Measurements Laboratory (formerly
the Health and Safety Laboratory of the USAEC) , for his support
"• 1 encouragement ever since my visit to his laboratory in
1958.
This treatise is dedicated to my collaborators in the Health
Physics Department. I am especially indebted to my assistants
for their careful collection of the samples and for their
conscientious performance of the analyses. Mrs. JYTTE CLAUSEN
has been of invaluable help in the treatment of the data and
in the final editing.
The quotations heading the various sections in the main text
are from the original Danish text of HANS CHRISTIAN ANDERSEN's
Fairy Tales translated into English by R.P. KEIGWIN.

- 240 -
REFERENCES
1. Appended reprints: These are given the Roman numerals
I-XIII, the order being determined by their association
with the main text.
I Aarkrog A. (1960). Specific fallout activity in
precipitation as a function of sampling height.
Nature 18_8, 482-483.
II Aarkrog A. (1964). Variation in the ratio of
strontium-89 to strontium-90 in precipitation
samples with sampling height. Nature 204, 771.
III Aarkrog A. and Lippert J. (1967). Europium-155 in
debris from nuclear weapons. Science 157, 425-427.
IV Aarkrog A. (1971). Radioecological investigations
of plutonium in an arctic marine environment.
Health Phys. 20, 31-47.
V Aarkrog A. (1977). Environmental behaviour of
plutonium accidentally released at Thule, Greenland.
Health Phys. 32, 271-284.
VI Aarkrog A. (1969). On the direct contamination of 85 134 54
rye, barley, wheat and oats with Sr, Cs, Mn 141
and Ce. Radiat. Bot. !J, 357-366.
VII Aarkrog A. and Lippert J. (1971). Direct contami-* w -i ,lU 51, 59_ 58_ 65 _ 203„ nation of barley with Cr, Fe, Co, Zn, Hg
210 and Pb. Radiat. Bot. 11, 463-472.
VIII Aarkrog A. (1975). Radionuclide levels in mature
grain related to radiostrontium content and time
of direct contamination. Health Phys. £8, 557-562.
IX Aarkrog A. (1978). Variation of direct plutonium
contamination in Danish cereal grains. Health Phys.
35, 489-491
X Aarkrog A. (1971). Prediction models for strontium-90
and caesium-137 levels in the human food chain. Health
Phys. 20, 297-311.
XI Aarkrog A. (1968). Strontium-90 in shed deciduous
teeth collected in Denmark, the Faroes and Greenland
from children born in 1950-1958. Health Phys. 15,
105-114.

- 241 -
XII Aarkrog A. (1971). Prediction models for 3USr in
shed deciduous teeth and infant bone. Health Phys.
21, 803-809.
XIII Aarkrog A. (1963). Cesium-137 from fallout in human
milk. Nature 197, 667-668.
2. Risø Reports in the three series; Environmental Radio
activity in Denmark, Environmental Radioactivity in the
Faroes, and Environmental Radioactivity in Greenland.
References to a report in one of these series appear in
the text as RRDxx, RRFxx and RRGxx, respectively, where
xx stands for the year covered by the report (not the year
of its publication).
General reference to all the reports in one of the three
series is made by RRD59-76, RRF62-76, and RRG62-76,
respectively.
RRD57-58 Aarkrog A. and Lippert J. (1958). Environmental
radioactivity at Risø, April 1, 1957 - March 31,
1958. Risø Report No. 3, 106 pp.
RRD58-59 Aarkrog A. and Lippert J. (1959). Environmental
radioactivity at Risø, April 1, 1958 - March 31, 1959.
Risø Report No. 9, 50 pp.
RRD59 Aarkrog A. and Lippert J. (1960). Environmental
radioactivity at Risø 1959. Risø Report No. 14,
48 pp.
RRD60 Aarkrog A. and Lippert J. (1961). Environmental
radioactivity at Risø 1960. Risø Report No. 23,
51 pp.
RRD61 Aarkrog A, Lippert J., and Petersen J. (1962).
Environmental radioactivity in Denmark 1961. Risø
Report No. 41, 139 pp.
RRD62 Aarkrog A, Petersen J. and Lippert J. (1963).
Environmental radioactivity in Denmark in 1962.
Risø Report No. 63, 147 pp.
RRF62 Aarkrog A, Petersen J. and Lippert J. (1963).
Environmental radioactivity in the Faroes in 1962.
Risø Report No. 64, 29 pp.

- 242 -
RRG62 Aarkrog A, Petersen J. and Lippert J. (1963).
Environmental radioactivity in Greenland in 1962.
Risø Report No. 65, 28 pp.
RRD63 Aarkrog A. and Lippert J. (1964). Environmental
radioactivity in Denmark in 1963. Risø Report No.
112 pp.
RRF63 Aarkrog A. and Lippert J. (1964) . Environmental
radioactivity in the Faroes in 1963. Risø Report
No. 86, 27 pp.
RRG63 Aarkrog A. and Lippert J. (1964) . Environmental
radioactivity in Greenland in 1963. Risø Report
No. 87, 21 pp.
RRD64 Aarkrog A. and Lippert J. (1965). Environmental
radioactivity in Denmark in 1964. Risø Report No.
98 pp.
RRF64 Aarkrog A. and Lippert J. (1965) . Environmental
radioactivity in the Faroes in 1964. Risø Report
No. 108, 24 pp.
RRG64 Aarkrog A. and Lippert J. (1965) . Environmental
radioactivity in Greenland in 1964. Risø Report
No. 109, 26 pp.
RRD65 Aarkrog A. and Lippert J. (1966). Environmental
radioactivity in Denmark in 1965. Risø Report No.
99 pp.
RRF65 Aarkrog A. and Lippert J. (1966). Environmental
radioactivity in the Faroes in 1965. Risø Report
No. 131, 23 pp.
RRG65 Aarkrog A. and Lippert J. (1966). Environmental
radioactivity in Greenland in 1965. Risø Report
No. 132, 21 pp.
RRD66 Aarkrog A. and Lippert J. (1967). Environmental
radioactivity in Denmark in 1966. Risø Report
No. 154, 100 pp.
RRF66 Aarkrog A. and Lippert J. (1967). Environmental
radioactivity in the Faroes in 1966. Risø Report
No. 155, 23 pp.
RRG66 Aarkrog A. and Lippert J. (1967). Environmental
radioactivity in Greenland in 1966. Risø Report
No. 156, 21 pp.

- 243 -
RRD67 Aarkrog A. and Lippert J. (19C8). Environmental
radioactivity in Denmark in 1967. Risø Report
No. 180, 91 pp.
RRF67 Aarkrog A. and Lippert J. (1968). Environmental
radioactivity in the Faroes in 1967. Risø Report
No. 181, 25 pp.
RRG67 Aarkrog A. and Lippert J. (1968). Environmental
radioactivity in Greenland in 1967. Risø Report
No. 182, 19 pp.
RRD68 Aarkrog A. and Lippert J. (1969). Environmental
radioactivity in Denmark in 1968. Risø Report
No. 201, 81 pp.
RRF68 Aarkrog A. and Lippert J. (1969). Environmental
radioactivity in the Faroes in 1968. Risø Report
No. 202, 20 pp.
RRG68 Aarkrog A. and Lippert J. (1969). Environmental
radioactivity in Greenland in 1968. Risø Report
No. 203, 18 pp.
RRD69 Aarkrog A. and Lippert J. (1970). Environmental
radioactivity in Denmark in 1969. Risø Report
No. 220, 95 pp.
RRF69 Aarkrog A. and Lippert J. (1970). Environmental
radioactivity in the Faroes in 1969. Risø Report
No. 221, 22 pp.
RRG69 Aarkrog A. and Lippert J. (1970). Environmental
radioactivity in Greenland in 1969. Risø Report
No. 222, 19 pp.
RRD70 Aarkrog A. and Lippert J. (1971). Environmental
radioactivity in Denmark in 1970. Risø Report
No. 245, 95 pp.
RRF70 Aarkrog A. and Lippert J. (1971). Environmental
radioactivity in the Faroes in 1970. Risø Report
No. 246, 21 pp.
RRG70 Aarkrog A. and Lippert J. (1971). Environmental
radioactivity in Greenland in 1970. Risø Report
No. 247, 18 pp.
RRD71 Aarkrog A. and Lippert J. (1972). Environmental
radioactivity in Denmark in 1971. Risø Report
No. 265, 100 pp.

- 244 -
RRF71 Aarkrog A. and Lippert J. (1572). Environmental
radioactivity in the Faroes in 1971. Risø Report
No. 266, 20 pp.
RRG71 Aarkrog A. and Lippert J. (1972). Environmental
radioactivity in Greenland in 19)?l. Risø Report
No. 267, 18 pp.
RRD72 Aarkrog A. and Lippert J. (1973). Environmental
radioactivity in Denmark in 1972. Risø Report
No. 291, 99 pp.
RRF72 Aarkrog A. and Lippert J. (1973). Environmental
radioactivity in the Faroes in 1972. Risø Report
No. 292, 21 pp.
RRG72 Aarkrog A. and Lippert J. (1973). Environmental
radioactivity in Greenland in 1972. Risø Report
No. 293, 17 pp.
RRD73 Aarkrog A. and Lippert J. (1974). Environmental
radioactivity in Denmark in 1973. Risø Report No.
305, 96 pp.
RRF73 Aarkrog A. and Lippert J. (1974). Environmental
radioactivity in the Faroes in 1973. Risø Report
No. 306. 21 pp.
RRG73 Aarkrog A. and Lippert J. (1974). Environmental
radioactivity in Greenland in 1973. Risø Report
No. 307, 20 pp.
RR074 Aarkrog A. and Lippert J. (1975). Environmental
radioactivity in Denmark in 1974. Risø Report
No. 323, 113 pp.
RRF74 Aarkrog A. and Lippert J. (1975). Environmental
radioactivity in the Faroes in 1974. Risø Report
No. 324, 25 pp.
RRG74 Aarkrog A. and Lippert J. (1975). Environmental
radioactivity in Greenland in 1974. Risø Report
No. 325, 20 pp.
RRD75 Aarkrog A. and Lippert J. (1976). Environmental
radioactivity in Denmark in 1975. Risø Report-
No. 345, 122 pp.
RRF75 Aarkrog A. and Lippert J. (1976). Environmental
radioactivity in the Faroes in 1975. Risø Report
No. 346, 24 pp.

RRG75 Aarkrog A. and Lippert J. (1976) . Environmental
radioactivity in Greenland in 1975. Risø Report
No. 347, 19 pp.
RRD76 Aarkrog A. and Lippert J. (1977). Environmental
radioactivity in Denmark in 1976. Risø Report
No. 361, 114 pp.
RRF76 Aarkrog A. and Lippert J. (1977). Environmental
radioactivity in the Faroes in 1976. Risø Report
No. 362, 27 pp.
RRG76 Aarkrog A. and Lippert J. (1977) . Environmental
radioactivity in Greenland in 1976. Risø Report
No. 363, 20 pp.
RRD77 Aarkrog A., Bøtter-Jensen L., Dahlgaard H., Hansen
Heinz, Lippert J., Nielsen S.P. and Nilsson Karen
(1978). Environmental radioactivity in Denmark in
1977. Risø Report No 386, 133 pp.
3. Other references: The remaining references are arranged
alphabetically according to the principles used, e.g., in
HFALTH PHYSICS. In the text, the reference appears as the
first two (or more) letters of the first author's surname
and the year of publication. When reference is made to
several works by the same author in one year, a, b, c,
etc., are added. When reference is made to a series of
reports, the name of the institution is used instead of
an author's name, and the year of publication is replaced
by the period of publication.
90 Aa66a Aarkrog A. (1966). Relations between Sr levels in
the Danish environment. Excerptum. Acta Radiol. Suppl.
No. 254, 13-17.
Aa66c Aarkrog A. (1968). On the variation of the levels 90
of Sr and other fallout nuclides in the grain of
rye, barley, wheat and oats. In: Proceedings of the
1. International Congress of Radiation Protection,
Rome, Sept. 5-10, 1966. Edited by W.S. Snyder and
others. Part 2 (Pergamon, Oxford) 1065-1081. 90
Aa72a Aarkrog A. (1972). Are the rate factors in the Sr
prediction models constant. In: 2. International

- 246 -
Conference on strontium metabolism, Glasgow August
16-19, 1972. Conf-720818, 437-446.
Aa72b Aarkrog A. (1972). Direct contamination of barley
with 7Be, 22Na, 11:>Cd, 125Sb, 134Cs and 133Ba. In:
Aspects of Research at Risø. A collection of papers
dedicated to professor T. Bjerge on his seventieth
birthday. Risø Report No. 256, 163-175,
Aa75 Aarkrog A. (1975). Radiochemical determination of
plutonium in marine samples by ion exchange and
solvent extraction. In: IAEA Technical Reports
series No. 169, 91-96.
Ae58-74 AERE Atomic Energy Research Establishment (Harwell).
(1958-1974). General reference to the annual reports:
Radioactive fallout in air and rain.
Ag59 Agricultural Research Council, Radiobiological
Laboratory (U.K.) (1959). Strontium-90 in human
diet in the United Kingdom 1958. ARCRL-1, 75 pp.
Ag60 Agricultural Research Council, Radiobiological
Laboratory (U.K.) (1960). Strontium-90 in milk and
agricultural materials in the United Kingdom 1958-
1959. ARCRL-2, 91 pp.
Ag61 Agricultural Research Council, Radiobiological
Laboratory (U.K.) (1961). Strontium-90 in milk and
agricultural materials in the United Kingdom 1959-
1960. ARCRL-4, 81 pp.
Ag62 Agricultural Research Council, Radiobiological
Laboratory (U.K.) (1962). Annual Report 1961-62.
ARCRL-8, 95 pp.
Ag66 Agricultural Research Council, Radiobiological
Laboratory (U.K.) (1966). Annual Report 1965-66.
ARCRL-16, 73 pp.
A169 Aitchison J. and Brown J.A.C. (1969). The lognormal
distribution (Cambridge University Press, London)
176 pp.
A154 Alexander G.V., Nusbaum R.E. and MacDonald N.S. (1954)
Strontium and calcium in municipal water supplies
American water works. Assoc. J. 4j>, 643-654.
Am58 Ambrosen J. (1958). Fissions produkter fra atmosfæren
1. Jan. - 30. June, 1958. Forsvarets Forskningsråd
(København). Rapport no. 9, 6 pp.
An67a Andersen A.J. (1967). Investigations on the plant
- 247 -
uptake of fission products from contaminated soils
(I). Risø Report No. 170, 32 pp.
An67b Andersen A.J. (1967). Investigations on the plant
uptake of fission products from contaminated soils
(II). Risø Report No. 174, 19 pp.
An71 Andersen A.J. (1971). Influence of phosphorus and
nitrogen nutrition on uptake and distribution of
strontium and calcium in oat plants. Soil Sci. 35,
108-111.
An73 Andersen A.J. (1973). Plant accumulation of radio
active strontium with special reference to the
strontium-calcium relationship as influenced by
nitrogen. (Thesis). Risø Report No. 278, 56 pp.
7»n57 Anderson E.C., Schuch R.L., Fisher W.R. and
Langham W. (1957). Radioactivity of people and
foods. Science 12_5, 1273-1278.
An66 Anochin V.L., Svirezhev Ju.M., and Tjursukanov A.N.
(1967). Mathematical model for migration of radio-
strontium in soil. In: Radioecological concentration
processes. Proceedings of an international symposium
held in Stockholm, April 25-29, 1966. Edited by
Bertil Åberg and Frank P. Hungate (Pergamon, London)
43-51.
Ba64 Barber U.A. (1964). Influence of soil organic matter
en the entry of cesium-137 into plants. Nature 204,
1326-1327.
Ba66 Bartlett B.O. and Scott Russell R. (1966).
Prediction of future levels of long-lived fission
products in milk. Nature 209, 1062-1065.
Ba72 Bartlett B.O., Scott Russell R. and Jenkins W.
(1972). Improved relationship between the deposition
of strontium-90 and the contamination of milk in the
United Kingdom. Nature 23J3, 46-48.
Be64a Bengtsson L.G. (1964). Human beta bremsstrahlung
detection by means of thin and thick sodium iodide
crystals. In: Assessment of radioactivity in man.
Proceedings of a symposium held by the International
Atomic Energy Agency, International Labour Organi
zation and World Health Organization at Heidelberg,
May 11-16, 1964. Vol. 1 (IAEA, Vienna) 91-114.

- 248 -
Be64b Bengtsson L.G., Naversten Y., and Svensson K.G.
(1964). Maternal and infantile metabolism of cesium.
In: Assessment of radioactivity in man. Proceedings
of a symposium held by the International Atomic Energy
Agency, International Labour Organization and World
Health Organization at Heidelberg, May 11-16, 1964.
Vol. 2 (IAEA, Vienna) 21-32.
Be67 Bengtsson L.G. (1967). Time variation of cesium-137
and potassium in humans from southern Sweden. Acta
Radiol. Ther. Phys., 6_, 259-282.
Be72 Bennett B.G. (1972). Estimation of Sr-90 levels in
the diet. In: HASL-246, I/107-I/122. 239
Be74 Bennett B.G. (1974). Fallout Pu dose to man. In:
HASL-278 1/41-1/63.
Be76 Bennett B.G. (1976). Strontium-90 in human bone.
In: HASL-308 1/3-1/19.
Be77a Bennett B.G. and Evans C. (1977). Strontium-90
in the diet - results through 1976. In: HASL-321
1/39-1/58.
Be77b Bennett B.G. (1977). Strontium-90 in human bone.
In: HASL-328 I/69-I/84.
Be71 Berthelsen O. (1971). Vandhusholdningen. In:
Danmarks Natur, Vol. 11, (Politikens Forlag,
Copenhagen) 261-281.
Bo69 Boni A.L. (1969). Variations in the retention and 137 excretion of Cs with age and sex. Nature 222,
1188-1189.
Bo72 Borisov B.K. (1972). Strontium-90 metabolism in
the human foetus. In: 2. International Conference
on strontium metabolism, Glasgow, August 16-19, 1972.
CONF-720018, 469-475.
Bo60 Bowen V.T. and Sugihara T.T. (1960). Strontium-90
in the "mixed layer" of the Atlantic Ocean.
Nature 186, 71-72. 90
Br70 Brezik Z. (1970). Values of Sr in vertebrae and in
femoral diaphysis of adults in Czechoslovakia in
1968. In: HASL-217, I/2-I/8.
Bro66a Broecker W.S., Bonebakker E.P. and Rocco G.G. (1966).
The vertical distribution of cesium-137 and
strontium-90 in the oceans, 2. J. Geophys. Res. 71,
1999-2003.

- i!49 -
Bro66b Broecxer W.S., Rocco G.G. and Volchok K.L. (1966).
Strontium-90 fallout: Comparison of rates over ocean
and land. Science 152, 639-640.
Br69 Brolund Larsen J. and Klausen S. (1969). Foderplaner
for malkekøer. 11. Ed. (Landhusholdningsselskabet,
Copenhagen) 30 pp.
Bry66 Bryan G.W., Preston A., and Tempieton W.L. (1966).
Accumulation of radionuclides by aquatic organisms
of economic importance in the United Kingdom. In:
Disposal of radioactive wastes into seas, oceans
and surface waters. Proceedings of a symposium held
by the International Atomic Energy Agency at Vienna,
May 16-20, 1966 (IAEA, Vienna) 623-637.
Br58 Bryant F.J., Chamberlain A.C., Spicer G.S. and
Webb M.S.W. (1958). Strontium in diet. Br. Med. J.
5084, 1371-1375.
Br59 Bryant F.J., Morgan A., and Spicer G.S. (1959).
The determination of radiostrontium in biological
materials. AERE-R 3030, 37 pp.
Br61 Bryant F.J., and Loutit J.F. (1961). Human bone
metabolism deduced from strontium assays.
AERE-R-3718, 56 pp.
Ca70 Calapaj G.G. and Ongaro D. (1970). Observed ratios
of Sr/Ca and Cs/K in the food of nursing
mothers and in their milk. J. Dairy Res. 3_7, 1-7.
Ca76 Carlsson S. (1976). Cesium-137 in a dysoligotrophic
lake, a radioecological field study. Thesis
University of Lund. 108 pp.
Ca62 Carr T.E.F., Harrison G.E., Loutit J.F. and Sutton A.
(1962). Relative avialability of strontium in
cereals and milk. Nature 19£, 200-201.
Chad70 Chadwick R.C. and Chamberlain A.C. (1970). Field
loss of radionuclides from grass. Atmos. Environ. 4>,
51-56.
Cham60 Chamberlain A.C. (1960). Aspects of the deposition
of radioactive and other gases and particles.
Int. J. Air Pollut. 3, 63-88.
Cham70 Chamberlain A.C. (1970). Interception and retention
of radioactive aerosols by vegetation. Atmos. Environ.
4, 57-78.

- 250 -
Co56 Comar C.L.f Wasserman R.H. and Nold M.M. (1956).
Strontium calcium discrimination factors in the rat.
Proc. Soc. Exp. Biol. Med 92, 859-863.
Co57b Comar CL., Scott Russell R. and Wasserman R.H. (1957).
Strontium-calcium movement from soil to man.
Science 126, 485-492.
Co57a Comar CL., Bernard F.T., Kuhn III U.S.G.,
Wasserman R.H., Nold M.M. and Schooley J.C (1957).
Thyroid radioactivity after nuclear weapons tests.
Science 126, 16-18.
Co61a Comar C.L. (1961). Absorption, excretion and retention
of strontium by breast-fed and bottle-fed babies.
Lancet, 1, April 29, 950-951.
Co61b Comar C.L., Wasserman R.H. and Twardock A.R. (1961).
Secretion of calcium and strontium into milk.
Health Phys. 1_, 69-80.
Co66a Comar C.L. (1966) . Transfer of strontium-90 into
animal produce. In: Radioactivity and human diet.
Edited by R. Scott Russell (Pergamon, Oxford)
247-276.
Co66b Comar C.L. (1967) . Sar.e principles of strontium
metabolism: implications, applications, limitations.
In: Strontium metabolism. Proceedings of the
international symposium on some aspects of strontium
metabolism held at Chapelcross, Glasgow and
Strontian, May 5-7, 1966. Edited by J.M.A. Lenihan,
J.F. Loutit and J.H. Martin (Academic Press,
London) 17-31.
Co60 Cox G.W., Morgan A. and Tayler R.S. (1960).
Strontium-90 from fallout in diet and milk of a
dairy herd. J. Dairy Res. 22, 47-57.
Cr60 Crooks R.N., Osmond R.G.D., Fisher E.M.R., Owers M.J.
and Evett T.W. (1960). The deposition of fission
products from distant nuclear test explosions
results to the middle of 1960. AERE-R 3349, 14 pp.
Cz63 Czosnowska W. (1963). The Sr-90 level in urine of
population in Poland in 1962, Nukleonika 8, 779-782.
Da68 Dam F. and Elgstrpm A. (1968). Vore levnedsmidler.
8. rev. ed. by P.E. Andersen and F. Dam (Svegaard,
Sorø) 525 pp.

- 251 -
Da63-76 Danish Meteorological Institute (1963-1976). Total
amount of precipitation in mm. for Greenland 1962-75.
(Copenhagen).
Da57-77 Danmarks Statistik (1957-1977). General reference to:
Landbrugs Statistik. Statistiske Meddelelser.
(Copenhagen) .
Da70 Danmarks Statistik (1970). Statistiks årbog
(Copenhagen) .
Da66 Dansgaard H.r Clausen H.B. and Aarkrog A. (1966).
Evidence for bomb-produced silicon-32. J. Geophys.
Res. 71, 5474-5477.
Da58 Dansk-Færøsk Samfund (1958). Forørerne. Vol. 1-2.
Edited by N. Djurhuss, and others (Det Danske For
lag, Copenhagen) 408 pp + 311 pp.
Da56 Davies O.L. (ed.) (1956). The design and analysis
of industrial experiments. 2nd ed. (Oliver and
Boyd, London) 637 pp.
De70 Der Bundesminister fur Bildung und Wissenschaft.
(1970). Unweltradioaktivitat und Strahlenbelastung.
Zusammenfassender Bericht fiber die Umweltfiberwachung
1956 bis 1968. (Gersbach, Munchen) 109 pp.
De71-77 Der Bundesminister fur Bildung und Wissenschaft
Umwelt-Radioaktivitat und Strahlenbelastung
Jahresbericht 1970-75. (Gersbach, Munchen) .
De72 Der Bundesminister fur Bildung und Wissenschaft
(1972). Umweltradioaktivitat und Strahlenbelastung.
Jahresbericht 1971. (Gersbach, Munchen) 100-107.
De76 Der Bundesminister des Innern (1976). Umwelt
radioaktivitat und Strahlenbelastung Jahresbericht
1974 (Bonn) p. 106.
Du75 Dumstrei C. (1975). Nedbør fra Hoyvik 1962-74.
Meteorologisk Institut (Personal Communication).
Du70 Dutton J.W.R. (1970) . Determination of radiocesium
in sea and fresh waters. (Lowestoft, U.K.) Report
FRL-6, 9 pp.
Du71 Duursma E.K. and Gross M.G. (1971) . Marine sediments
and radioactivity. In: Radioactivity in the marine
environment. (National Academy of Science,
Washington D.C.) 147-160.

- 25 2 -
Eb64 Eberhardt L.L. (1964). Variability of the strontium-
90 and cesium-137 burden of native plants and
animals. Nature 204, 238-240.
Eb67 Eberhardt L.L. and Nakatani R.E. (1969). Modeling
the behaviour of radionuclides in some natural
systems. In: Symposium on radioecology. Proceedings
of the 2. national symposium held at Ann Arbor,
Mich., May 15-17, 1967. Edited by D.J. Nelson and
F.C. Evans. (U.S. Atomic Energy Commission,
Division of Biology and Medicine, Washington,
D.C.) CONF-670503, 740-750.
Ed75 Edgington D.N. and Robbins J.A. (1975). The behaviour
of plutonium and other long-lived radionuclides in
Lake Michigan 2. Patterns of deposition in the
sediments. In: Impacts of nuclear releases into the
aquatic environment. Proceedings of an international
symposium held by the International Atomic Energy
Agency at Otaniemi, Finland, June 30 - July 4, 1975.
(EAEA, Vienna) 245-260.
Ed59 Edvarson K., Low K. and Sisefsky J. (1959).
Fractionation phenomena in nuclear weapons debris.
Nature 184, 1771-1774.
Ek66 Ekman L.C. (1967). Mechanisms of uptake and
accumulation of radionuclides in terrestrial
animals. In: Radioecological concentration processes.
Proceedings of an international symposium held in
Stockholm April 25-29, 19é6. Edited by B. Åberg
and F.P. Hungate (Pergamon, London) 547-560.
En71 Engelmann R.J. (1971). Scavenging prediction using
ratios of concentrations in air and precipitation.
J. Appl. Meteorol. 10, 493-497.
Er77 Eriksson Å. (1977) . Fissionsprodukter i svensk
miljø. (Inst. f. Radiobiologi Lantbrukshøgskolan,
Uppsala) 97 pp.
Fe63 Federal Radiation Council (1963). Estimates and
evaluation of fallout in the United States from
nuclear weapons testing conducted through 1962.
NP-12879, Report No. 4. 33 pp.

- 253 -
Fe66 Feldt W. (196b). Radioactive contamination of North
Sea fish. In: Disposal of radioactive wastes into
seas, oceans and surface waters. Proceedings of a
symposium held by the International Atomic Energy
Agency at Vienna, May 16-20, 1966 (IAEA, Vienna)
739-752.
Fo71 Foster R.F., Ophel I.L. and Preston A. (1971).
Evaluation of human radiation exposure. In: Hadio-
activity in the marine environment (National
Academy of Science, Washington D.C.) 240-260.
Fr63 Frederiksson L. (1963). Studies on plant absorption
of Sr-90 and Cs-137 from some subtropical and
tropical soils. FOA-4-A-4319 (4623), 38 pp.
Fr66 Frederiksson L., Garner R.J. and Russell R.S.
(1966). Cesium-137. In: Radioactivity and human
diet. Edited by R. Scott Russell (Pergamon, Oxford)
317-352.
Fr61 Freiling E.C. (1961). Radionuclide fractionation in
bomb debris. Science 133, 1991-1998.
Fr57 Friedlander G. and Kennedy J.W. (1957). Nuclear and
Radiochemistry. (Wiley, New York) p. 261.
Ga63 Gale H.J., Humphreys D.L.O. and Fisher E.M.R. (1963) .
The weathering of cesium-137 in soil AERE-R-4241,
also as Nature 201, 257-261.
Ga66 Garner R.J. and Russell R.S. (1966). Isotopes of
iodine. In: Radioactivity and human diet. Edited by
R. Scott Russell (Pergamon, Oxford) 297-315.
Go71 Goldberg E.D., Broecker W.S., Gross M.G. and
Turekian K.K. (1971). Marine Chemistry, In: Radio
activity in the marine environment. (National
Academy of Science. Washington D.C.) 137-146.
Go58 Gorham E. (1958). Accumulation of radioactive
fallout by plants in the English lake district.
Nature 181, 1523-1524.
Gr60 Grummitt W.E. and Robertson E.R. (1960). Strontium-90
and cesium-137 in Canadian wheat (1957-59). CRER-1000,
23 pp.
Gu64 Gustafson P.F., Muniak S.E. and Brar S.S. (1964).
Concentrations of cesium-137, rhodium-102 and
manganese-54 in surface air. Nature 203, 470-472.

- 254 -
Ha57 Hald A. (1957). Statistical theory with engineering
applications (Wiley, New York) 783 pp.
Han60 Hansen I.G. (1960). Landøkonomisk Forsøgslaboratorium
Personal communication.
Han73 Hanson W.C. (1973). Fallout Sr-90 and Cs-137 in
Northern Alaskan ecosystems during 1959-1970, Thesis
COO-2122-12, 259 pp.
Ha62 Hardy E.P. and Alexander L.T. (1962). Rainfall and
deposition of strontium-90 in Clallam county.
Washington. Science 136, 881.
Hard72 Hardy E.P., Krey P.E. and Velchok H.L. (1972). Global
iventory and distribution of Pu-238 from SNAP-9A.
HASL-250, 32 pp.
Ha74a Hardy E.P. (1974). On Cs-137 and Sr-90 in bone. In
HASL-278, I/64-I/69.
Ha74b Hardy E.P. (1974). Depth distribution of global
fallout Sr-90, Cs-137, and Pu-239,240 in sandy loam
soil. In: HASL-286, 1/2-1/10.
Ha75 Hardy E.P. (1975) . Regional uniformity of cumulative
radionuclide fallout. In: HASL-288, 1/2-1/9.
Harl72 Harley J.H. (editor) (1972). HASL procedures manual.
HASL-300. 602 pp.
Ha64 Harrison G.E. (1964). Effect of doubling the oral
intake of calcium on the uptake of radioactive
strontium in rats. Int. J. Radiat. Biol. 8_, 177-186.
Ha58-78 HASL (1958-1978). General reference to: Environmental
quarterly. Quarterly reports from Health and Safety
Laboratory, U.S. Atomic Energy Commission, later U.S.
Energy Research and Development Administration and
latest Environmental Measurements Laboratory,
Department of Energy (New York).
Has58 HASL Health and Safety Lab., USAEC (1958).
Environmental contamination from weapon tests.
HASL-42, 370 pp.
Has60 Harley J.H. and Rivera J. (1960). Summary of available
data on strontium-90 content of foods and total diets
in the United States. HASL-90, 70 pp.
Ha67 Haug A. and Smidsrød O. (1967). Strontium, calcium
and magnesium in brown algae. Nature 215, 1167-1168.

- 255 -
Hau73 Haugsgaard Sørensen P. and Enggaard N. (1973).
Landbohøjskolen, Personal communication.
He66 Hermann F. (1966). Danmarks Fiskeri- og Havunder
søgelser, personal communication.
He68 Hermann F. (1968). Hydrografi. In: Danmarks Natur.
Vol. 3: Havet (Politikens Forlag, Copenhagen),
24-47.
He75 Hetherington J.A., Jefferies D.F. and Lovett M.B.
(1975). Some investigations into the behaviour of
plutonium in the marine environment. In: Impacts of
nuclear releases into the aquatic environment.
Proceedings of an international symposium held by
the International Atomic Energy Agency at Otaniemi,
Finland, June 30 - July 4, 1975 (IAEA, Vienna)
193-212.
He76 Hetherington J.A. (1976). Radioactivity in surface
coastal waters of the British Isles 1974. (Lowestoft,
U.K.) FRL-11, 35 pp.
He56-57 Heydorn K., Lippert J. and Theodorsson P. (1957).
The radioactivity in the Risø district measurements
up to 1st April, 1957. Risø Report No. 1, 157 pp.
Ho63 Hopkins B.J., Tuttle L.W., Pories W.J. and Strain W.H.
(1963). Strontium-90 in hair. Science 139.' 1064-1065.
Hu74 Huber O., Halter J. und Winiger P. (1974) .
17. Bericht der eidg. Kommission zur Oberwachung der
Radioaktivitet fur das Jahr 1973 zuhanden des
Bundesrates. Bull. Eidg. Gesundheitsamtes Nr. 2,
Beilage B, p. 178.
Hv61 Hvinden T. and Lillegraven A. (1961). Cesium-137 in
air, precipitation, drinking water, milk and beef
in Norway during 1959 and 1960. Nature 190, 402-404.
Ia64 IAEA. International Atomic Energy Agency (1964).
Directory of wholebody radioactivity monitors.
(IAEA, Vienna) p. 22 (Fig. IB) .
Ic59 ICRP. International Commission on Radiological
Protection (1959). Radiation protection. Recommendations
of the International Commission on Radiological
Protection. Report of Committee 2 on permissible dose
for internal radiation (Pergamon, New York). (ICRP
Publication, 2) 233 pp.

- 256 -
Ic66 ICRP. International Commission on Radiological
Protection (1966). Task group on lung dynamics
deposition and retention models for internal dosimetry
of the human respiratory tract. Health Phys. 12, 173-20 7.
Ic77 ICRP (1977). Recommendations of the International
Commission on Radiological Protection. (ICRP Pub
lication, 26). Ann. ICRP 1, No. 3, 1-53.
Je73 Jefferies D.F., Preston A. and Steele A.K. (1973).
Distribution of cesium-137 in 3ritish coastal waters.
Mar. Pollut. Bull. 4^ 118-122.
Je69 Jensen J.L. (1969). Vandet i naturen. In: Danmarks
Natur. Vol. 5: De ferske vande (Politikens Forlag,
(Copenhagen) 9-43.
Ji72 Jinks S.M. and Eisenbud M. (1972). Concentration
factors in the aquatic environment. Radiat. Data
Rep. 13, 243-247.
Ka50 Kamp Aa.H. (1950). Færøerne (Det Danske Forlag,
Copenhagen) 112 pp.
Ka73 Kanneworff E. and Nicolaisen W. (1973). The "Haps"
a frame-supported bottom corer. Ophelia 10_, 119-129.
Ka72 Kawase K. and Yokoyama E. (1972). Strontium-90 and
cesium-137 levels in soils of various types at
Niigata prefecture, Japan. J. Radiat. Res. 14,
40-48.
Ko66 Kolemainen S., Hasanen E. and Miettinen J.K. (1966). 137
Cs levels in fish of different limnilogical
types of lakes in Finland during 1963. Health Phys.
12# 917-922.
Ko59 Kornberg H.A. (1959). On the passage of pairs of
elements through food chains. HW-60127, 37 pp.
Kr73 Krey P.W., Beck H., Hardy E.P. and Raft P.D. (1973).
Fallout in a forest. In: HASL-276, I/27-I/39.
Ku57 Kulp J.L., Eckelmann W.R. and Schulert A.R. (1957)
Strontium-90 in man. Science 125, 219-225.
Ku58 Kulp J.L. and Slakter R. (1958). Current strontium-90
level in diet in United States. Science L28, 85-86.
Ku62 Kulp J.L. and Schulert A.R. (1961-62). Sr-90 in man
and his environment. Vol 1-2. N40-9934, 401 pp,
367 pp.

- 257 -
Ku78 Kupferman S.L., Bowen V.T., Livingston H.D. and
Aarkrog A. (1978). Radioactive effluent from
Windscale as a perturbation of the fallout tracer
experiment in the north Atlantic Ocean. Submitted
for publication in Earth Planet. Sci. Lett.
La69 Larsen K. (1969). De stillestående vande. 163-180.
In: Danmarks Natur. Vol. 5: De ferske vande
(Politikens Forlag, Copenhagen) 163-180.
Le65 Lee C C . and Sosulski F.W. (1965). Uptake of 85Sr by
cereal crops and varieties. Can. J. Plant Sci. 45,
13-17.
Le69 Lee C.C. and Sosulski F.W. (1969). Varietal
differences in the uptakes of Sr and Ca by wheat.
Can. J. Plant Sci. £9, 93-94.
Le72 Lerman A. and Taniguchi H. (1972). Strontium-90
diffusional transport in sediments of the great
lakes. J. Geophys. Res. 77, 474-481. 90
Le62 Levi H., Lindemann J. and Nielsen A. (1962). Sr
in human bone (Denmark 1958-61) . Health Phys. 8_,
555-558.
Li61 Liden K. (1961). Cesium-137 burdens in Swedish
laplanders and reindeer. Acta Radiol. 56, 237-740.
Li65 Lindell B. and Magi A. (1965). The occurrence of 137
Cs in Swedish food, especially dairy milk, and
in the human body after the nuclear test explosions
in 1961 and 1962. Ark. Fys. 29, 69-96.
Li63 Lippert J. (1963). Low level counting. Risø Report
No. 44, 73 pp.
Li68 Lippert J. (1968). Some applications for semiconductor
detectors in health physics. In: Proceedings of the
1st international congress of radiation protection,
held at Rome, September 5-10, 1966. Edited by
W.S. Snyder. Part 1 (Pergamon, Oxford) 271-277.
L175 Lippert J. (1975). Statdata a 36700 program for
handling and statistical treatment of measurement
results. Risø-M-1780, 75 pp.
Lo60 Lough S.A., Hamada G.H. and Comar C.L. (1960).
Secretion of dietary strontium-90 and calcium in
human milk. Proc. Soc. Exp. Biol. Med. 104, 194-198.

- 258 -
Lo7i Lawman F.G., Rice T.R. and Richards F.A. (1971).
Accumulation and redistribution of radionuclides
by marine organisms. In: Radioactivity in the marine
environment. (National Academy of Science, Washington
D.C.) 161-199.
Lu71 Lund E.W. and Dorph-Petersen K. (1971). Yield
relationships of agricultural crops, (in Danish)
Tidskr. Planteavl 75, 508.
Ha65 Mamuro T., Yoshikawa K. and Maki H. (1365).
Radionuclide fractionation in fallout particles.
Health Phys. 11, 199-209.
Ma72 Mattsson S. (1972). Radionuclides in lichen,
reindeer and man. Thesis. University of Lund,
various pagination.
Ma58a Mayneord W.V., Anderson W., Bentley R.E., Burton L.K.r
Crookall J.O. and Trott N.G. (1958). Radioactivity
due to fission products in biological material
Nature 182, 1473-1478.
Ma58b Mayneord W.V., Radley, J.M., and Turner, R.C. (1958).
The alpha-ray activity of humans and their
environment. In: Proceedings of the 2nd United
Nations international conference on the peaceful
uses of atomic energy held in Geneva, September 1-13,
1958. Vol. 23 United Nations, Geneva) 150-155.
Me73 Medical Research Council (1973). Assay of strontium-
90 in human bone in the United Kingdom results for
1970. Monitoring report No. 19, 24 pp.
Me56 Megaw W.J. and Chadwick R.C. (19b6). Some field
experiments on the release and deposition of fission
products and thoria AERE-HP/M-114.
Me74 Menzel R.G. (1974). Land surface erosion and rain
fall as sources of strontium-90 in streams.
J. Environ. Qual. 3_# 219-223.
Me69 Herten D. and Wort ley G. (1969). Reliability of
analytical data used for assessing the degree of
environmental contamination by radioactive materials.
In: Environmental contamination by radioactive
materials. Proceedings of a seminar organized by the
Food and Agriculture Organization of the United
Nations, the International Atomic Energy Agency, and

259 -
the World Health Organization and held in Vienna,
March 24-2 8, 1969 (IAEA, Vienna) 477-485.
Me59-77 Meteorologisk Institut (1959-1977). Ugeberetninger
om nedbør m.m. (Meteorologisk Institut, Copenhagen)
weekly.
Mi59 Middleton L.J. (1959). Radioactive strontium and
cesium in the edible parts of crop plants after
foliar contamination. Int. J. Radiat. Biol. 4_,
387-402.
Mid63 Middleton L.J. and Squire H.M. (1963). Further
studies of radioactive strontium and cesium in
agricultural crops after direct contamination.
Int. J. Radiat. Biol. 6_, 549-558.
Mie63 Miettinen J.K., Jokelainen A., Roine P., Liden K.
and Naversten Y. (1963). Cesium-137 and potassium
in people and diet - a study of Finnish lapps. Annales
Academiae Scientiarum Fennicae II. Chemica 120, 1-46.
Mi60 Milbourn G.M. (1960). The uptake of radioactive
strontium by crops under field conditions in the
United Kingdom. J. Agric. Sci. 5_5, 273-281.
Mi56 Miller C.E. and Marinelli L.D. (1956). Gamma-ray
activity of contemporary man. Science 124, 122-123.
Mi45 Mitchell H.H., Hamilton T.S., Steggerda F.R., and
Bean H.W. (1975). The chemical composition of the
adult human body and its bearing on the biochemistry
of growth. J. Biol. Chem. 158, 625-637.
Na63 National Institute of Radiological Sciences (1963).
Radioactivity survey data in Japan. No. 1, 32 pp.
Na75 National Institute of Radiological Sciences (1975).
Radioactivity survey data in Japan. No. 40, 32 pp.
Na76 National Council on Radiation Protection and Mea
surements, (1976) . Environmental radiation mea
surements. NCRP-Report No. 50. 246 pp.
Ne66 Nevstrueva M.A., Ramzaev P.V., Moiseer A.A.,
Ibatullin M.S., and Teplykh L.A. (1967). The nature 137 90
of Cs and Sr transport over the lichen-reindeer-man food chain. In: Radioecological concentration processes. Proceedings of an international symposium held in Stockholm April 25-29, 1966. Edited by B. Aberg and F.P. Hungate (Pergamon, Oxford). 209-215.

- 260 -
No72 Noshkin V.E. (1972). Ecological aspects of plutonium
dissemination in aquatic environments. Health Phys.
22, 537-549.
No73 Noyce J.R., Moore D.T., Beck J.N. and Kuroda P.K.
(1973). Behaviour of radiostrontium in rain and
air after the ninth Chinese atmospheric nuclear
test. Geophys. Res. 7_8, 1419-1426.
Od50 Odum H.T. (1950). The biogeochemistry of strontium.
Thesis. Yale University, 373 pp.
On62 Onstead CO., Oberhausen E. and Keary F.V. (1962).
Cesium-137 in man. Science 137, 508-510.
Os59 ' Osmond R.G., Owers M.J., Healy C. and Mead A.P.
(1959). The determination of radioactivity due to
cesium, strontium, barium and cerium in waters and
filters. AERE-R-2899, 39 pp.
Pa71 Pasternack B.S. and Harley N.H. (1971). Detection
limits for radionuclides in the analysis of multi-
component gamma ray spectrometer data. Nucl. Instrum.
Methods 9JL/ 53 3-540.
Pe63 Pedersen A. (1963). Landbrugets Plantekultur. Vol. 2.
2nd ed. (Den Kongelige Veterinær- og Landbohøjskole*
Copenhagen) 522 pp.
Pei60 Peirson D.H. Crooks R.N. and Fisher E.M.R. (1960).
Radioactive fallout in air and rain. AERE-R-3358,
52 pp.
Pei65 Peirson D.H. and Cambray R.S. (1965). Fission
product fall-out from the nuclear explosions of 1961
and 1962. Nature 2p_5, 433-440.
Pe73 Pennington W., Cambray R.S. and Fisher E.M. (1973). 137 Observations on lake sediments using fallout Cs
as a tracer. Nature 242, 324-326. 55 90 13 4 210
Per70 Persson B.G.R. (1970). Fe, Sr, Cs and ^xuPb
in the biosphere. Radiological health aspects of
the environmental contamination from radioactive
materials in northern Sweden. Thesis. University of
Lund, various pagination.
Pet62 Petersen J. (1962). Environmental Radioactivity at
Copenhagen. February 1961-August 1962. Risø Report
No. 51, 25 pp.
Po66 Polikarpov G.G. (1967). Regularities of uptake and
- 261 -
accumulations of radionuclides in aquatic organisms.
In: Radioecological concentration processes. Pro
ceedings of an international symposium held in
Stockholm, April 25-29, 1966. Edited by B. Aberg and
F.P. Hungate (Pergamon, Oxford) 819-825.
Ra75 Rasmussen L.B. and Andersen L.J. (19 75). Danmarks
Geologiske Undersøgelse. Personal information.
Re66 Reavey T.C. and Baratta E.J. (1966). Comparison of
Sr, J and Cs in milk and milk products.
Radiol. Health Data Rep. 7, 215-218.
Ri72 Rigsombudsmanden på Færøerne (1972). Årsberetning
1972.
Ri63a Rivera J. (1963). Strontium-calcium discrimination
by adults and infants. In: HASL-138, p. 235.
Ri63b Rivera J. (1963) . Stable strontium concentrations
in three bones of the human skeleton. In: HASL-140,
p. 303.
Ri64 Rivera J. (1964). Sr-90 distribution in two human
skeletons. HASL-144, p. 271.
Ri66 Rivera J. (1967). Predicting strontium-90 con
centrations in human bone. In: Strontium metabolism.
Proceedings of an international symposium held at
Chapelcross, Glasgow and Strontian, May 5-7, 1966.
Edited by J.M.A. Lenihan, J.F. Loutit and J.H. Martin
(Academic Press, London) 47-55.
Ru60 Rundo J. (1960). Radiocesium in human beings. Nature
188, 703-706.
Ru70 Rundo J. (1970). Fall-out cesium-137 in breast- and
bottle-fed infants. Health Phys. 18, 437-433.
Ru66a Russell R.S. (1966). Entry of radioactive materials
into plants. In: Radioactivity and human diet.
Edited by R. Scott Russell (Pergamon, Oxford)
87-104.
Ru66b Russell R.S. (1966). Entry of strontium-90 into
plants from the soil. In: Radioactivity and human
diet. Edited by R. Scott Russell (Pergamon, Oxford)
213-245.
Sc66 Schleien B., Gaeta N.A. and Friend A.G. (1966).
Determination of particle size characteristics of
old and fresh airborne fallout by graded filtration.
Health Phys. 12, 633-639.

- 262 -
Sc60 Schofield R.K. and Graham-Bryce I.J. (1960). Soil
Science. Diffusion of ions in soils. Nature 188,
1048-1049.
Sc72 Schultz V. and Whicker F.W. (1972). Ecological
aspects of the nuclear age. Selected readings in
radiation ecology. Tid-25978, 588 pp.
Se71 Seymour A.H. (1971). Introduction. In: Radioactivity
in the marine environment (National Academi of
Science, Washington D.C.) 1-5.
Sh75 Sherrill R.D. Sumerlin N.G., Beck J.N. and Kuroda
P.K. (1975). Variation of the ratio on cesium-137
to strontium-90 in the atmosphere. Health Phys. 28,
335-340.
Sh68 Shiraishi Y. and Ichikawa R. (1968). Fallout
cesium-137 in beer. J. Radiat. Res. 5J, 112-115.
Sm60 Small S.H. (1960). Wet and dry deposition of fallout
materials at Kjeller. Tellus _12, 308-314.
Sm63 Smith L.H., Rasmusson D.C. and Myers W.M. (1963). 89 Influence of genotype upon relationship of Sr to
calcium in grain of barley and wheat. Crop Sci. 3_,
386-389.
So69 Sokal R.R. and Rohlf F.J. (1969). Biometry (Freeman,
San Francisco) 776 pp.
So78 Solgaard P., Aarkrog A., Fenger J., Flyger H. and
Graabaek A.M. (1978) . Decrease in content of lead
in Danish cereals. Nature 272. 346-347.
Sp56 Spector W.S. (editor) (1956;. Handbook of Biological
Data. (Sauders, Philadelphia) p. 50.
Sp67 Spencer H., Samachson J., Hardy E.P. and Rivera J.
(1967). Effect of low and high calcium intake on 90
Sr metabolism in adult man. Int. J. Appl. Radiat.
Isot. 18, 605-614.
Sq66a Squire H.M. (1966). Long-term studies of strontium-
90 in soils and pastures. Radiat. Bot. <>, 49-67.
Sq66b Squire H.M. and Middleton L.J. (1966). Behaviour 137
of Cs in soils and pastures a long term experiment. Radiat. Bot. 6_, 413-423.
Ste65 Stewart H.F., Ward G.M. and Johnson J.E. (1965). 137
Availability of fallout Cs to dairy cattle from
different types of feed. J. Dairy Sci. 48, 709-713.

263 -
Str65 Straub C.P. and Gopala K.M. (1965). A comparison of 90 Sr component of human and cows milk. Pediatrics
.36, 732-735.
Su66 Sutton D.C. and Kelly J.J. (1966). Manganese-54:
Fractional distribution in wheat and occurrence in
other foods. Nature 202, 1081-1083.
Sw74 Swedjemark G.A. and Hagberg N. (1974). The content
of cesium-137 in Swedish reindeermeat 1973. In:
Statens Strålskyddsinstitut. Speciallaboratorierna,
Årsrapport 1973. SSI-1974-021, D1-D5.
Ta71 Talvitie N.A. (1971). Radiochemical determination of
plutonium in environmental and biological samples
by ion exchange. Analyt. Chem. £3, 1827.
Te77 Telegadas K. (1977). An estimate of maximum credible
atmospheric radioactivity concentrations from
nuclear tests. In: HASL-328, 1/39-1/68.
Th60 Thornthwaite C.W., Mather J.R. and Nakamura J.K.
(1960). Movement of radiostrontium in soils.
Science 13_1, 1015-1019.
Un58-77 UNSCEAR (1958-1977). General reference to the
UNSCEAR reports 1958, 1962, 1964, 1966, 1969, 1972,
and 1977. (United Nations, New York).
Un58 UNSCEAR (1958). Report of the United Nations
Scientific Committee on the Effects of Atomic
Radiation (New York) Supplement No. 17 (A/3838),
228 pp.
Un62 UNSCEAR (1962). Report of the United Nations Scientific
Committee on the Effects of Atomic Radiation (New York).
Supplement No. 16 (A/5216), 441 pp.
Un69 UNSCEAR (1969). Report of the United Nations
Scientific Committee on the Effects of Atomic Radiation
(New York). Supplement No. 13 (A/7613), 165 pp.
Un72 United Nations Scientific Committee on the Effects
of Atomic Radiation (1972). Ionizing radiation:
Levels and effects. Vol. 1 (New York) 197 pp.
Un77 UNSCEAR. United Nations Scientific Committee on the
Effects of Atomic Radiation (1977) . Sources and
effects of ionizing radiation. (New ifork) 725 pp.
Ve64 Vestergaard J. (1964) . Analysis of variance with
unequal numbers in groups. Gier system library No.
211. (A/S Regnecentral, København).

- 264 -
Vol73b
Vol74
Wa74
We 79
Wi67
Wi69
Vi71 Vibe C. (1971). Landfaunaen. In: Danmarks Natur.
Vol. 10: Grønland og Færøerne (Politikens Forlag,
Copenhagen) 399-4 20.
Voi71 Voipio A. and Salo A. (1971). On the balances of 90 137 Sr and Cs in the Baltic Sea. Nord. Hydrol. II,
57-63. (Revised 1978)
Vol71 Volchok H.L., Bowen V.T., Folsom T.R., Broecker W.S.,
Shuert E.A. and Bien G.S. (1971). Oceanic distribution
of radionuclides from nuclear explosions. In: Radio
activity in the marine environment (National Academy
of Science. Washington D.C.) 42-89.
Vol73a Volchok H.L. and Bowen V.T. (1973). Fallout radio
nuclides in oceanic water columns semi-annual
progress. Report to Geosecs 1 July 1972 - 1 July 1973,
21 pp. 90
Volchok H.L. (1973). Sr deposition in the Atlantic Ocean IV. In: HASL-268, 1/17-1/23.
90 Volchok H.L. (1974). Is there excess Sr fallout
in the oceans. In: HASL-286, 1/82-1/89.
Wardum H. (1974). (Færøernes Landbrugskonsulent)
Letter of March, 1974 Hoyvik.
Wegger I. (1979). Landbohøjskolen, Personal
communication
Wilson D.W., Ward G.M. and Johnson J.E. (1967). 137
Fallout Cs: Direct aerial transfer as an important
source of foliar deposition. Radiat. Bot. 1_, 312-319.
Wilson D.W., Ward G.M., and Johnson J.E. (1969). 137
A quantitative model of the transport of Cs
from fallout to milk. In: Environmental contamination
by radioactive materials. Proceedings of a seminar
organized by the Food and Agricultural Organization
of the United Nations, the International Atomic
Energy Agency and the World Health Organization, held
in Vienna, March 24-28, 1969 (IAEA, Vienna) 125-134.
Wo66 World Health Organization (1966). Methods of
radiochemical analysis. (WHO, Geneva) 163 pp.
Ya63 Yamagata N., Matsuda S. and Kodaira K. (1963).
Run-off of cesium-137 and strontium-90 from rivers.
Nature 200, 668-669.
Za73 Zander I. and Araskog R. (1973). Nuclear explosions
1945-1972 Basic Data, FOA-4 A-4505-A1, 56 pp.

- 265 -
DANSK RESUME
Det foreliggende arbejde har haft til hensigt at kvantificere
de radioøkologiske egenskaber af miljøprøver. Til dette formål
er benyttet "den radioøkologiske sensitivitet" og "variabilite
ten". Den førstnævnte størrelse er identisk med overførings-
faktoren fra deponeret radioaktivt globalt nedfald til den pågæl
dende miljøprøve, medens variabiliteten er den såkaldte partielle
variationskoefficient beregnet på grundlag af en variansanalyse.
De atmosfæriske kærnevåbenforsøg har siden sprængningen af det
første nukleare våben i 1945 kontamineret omgivelserne med en
række forskellige radionukleider. Til de længere levende stof-90 137
fer blandt disse hører Sr og Cs, der på grund af deres
kemiske slægtskab med henholdsvis calcium og kalium forholdsvis
let overføres fra det abiotiske miljø til levende organismer. 90 137
Målingerne af Sr og Cs koncentrationerne i luft, vand og
jord, som er beskrevet i kapitel 1, har dannet basis for be
regningen af overføringsfaktorerne fra det radioaktive nedfald
via fødekæden frem til mennesket, og de abiotiske miljøprøvers
variabilitet er benyttet ved vurderingen af de biologiske
prøvers kontaminationsveje.
Miljøfaktorer som klima, jordbundsforhold og landbrugspraksis
påvirker, som det omtales i kapitel 2, den radioøkologiske
sensitivitet såvel som variabiliteten af radionukleid koncen
trationerne i vegetabilske prøver. Afgrøder med et stort over
flade til vægtforhold og en langsom vækst udviser almindeligvis
større direkte kontamination end planter med de modsvarende
egenskaber. For Danmarks vedkommende spiller kornprodukterne
en særlig rolle, fordi rugbrød, hvori hele kærnen anvendes,
indgår som en væsentlig bestanddel af kosten. Den direkte kon
tamination af kornet er i dette tilfælde af speciel betydning,
hvorfor der er udført en række eksperimentelle kontaminations-
forsøg af kornplanter til belysning af forholdene. Indirekte
kontamination (rodoptagelse af radioaktive stoffer) er en 90
vigtig transportvej for specielt Sr til f.eks. grøntsager. 137 På Færøerne er jordbundsforholdene årsag til at også Cs
optages i betydelig grad via rødderne, hvilket resulterer i en
høj radioøkologisk sensitivitet af færøske afgrøder med hensyn

- 266 -
til Cs. Lav indtager en særstilling på grund af sin exceptio
nelt høje radioøkologiske sensitivitet.
Kapitel 3 omhandler den radioaktive forurening af dyrene og
deres produkter først og fremmest komælken. Et højt indhold 137
af græs i kvægfoderet resulterer i højere Cs niveauer i
mælken, end hvis foderet fortrinsvis er baseret på roer; 90
derimod er Sr niveauerne i mælken kun lidt påvirkelige af en 137
sådan ændring i fodersammensætningen . Den høje indirekte Cs
kontamination af det færøske græs betyder, at den radioøkologiske 137
sensitivitet af færøsk mælk med hensyn til Cs er væsentlig
større end af dansk mælk. De terrestriske dyr, som indgår i
den humane fødekæde udgøres primært af herbivorer, hvorfor
niveauerne i kødet er afhængige af plantefoderets radio
aktivitetsindhold; de extreme niveauer, som findes i lav af
spejles således i en høj radioøkologisk sensitivitet af rens
dyrkød. De marine dyr i fødekæden er hovedsageligt carnivorer; 137
men selv om der sker en opkoncentrering af et nukleid som Cs
gennem de marine fødekæder giver dette sig ikke udslag i
specielt høje niveauer i marine dyr, da radioaktivitetskoncen-
trationerne i havet er relativt lave og fordi havvandets for-137 holdsvis høje saltkoncentrationer begrænser Cs optagelsen
i havets organismer. Den radioøkologiske sensitivitet med hensyn 137
til Cs kan under danske forhold for visse marine fisk nærme
sig sensitiviteten af danske husdyr, dels fordi radioaktivitets-
niveauerne i danske farvande aftager relativt langsomt, og dels 137
fordi danske husdyr hovedsageligt kun modtager Cs via direkte
kontamination af vegetationen.
I det fjerde kapitel omtales den radioaktive forurening af men
nesket, dets kost og af modermælk. De vegetabilske produkter 90 i menneskets kost er almindeligvis de vigtigste Sr kilder,
137 mens Cs primært kommer fra de animalske produkter. Dog er
mælk og kornprodukter uanset deres oprindelse begge vigtige 90 137 kilder til såvel Sr som Cs i kosten. I dansk kost stammer
90 137
således ca. 70 % af kostens Sr og ca. 55 % af dens Cs fra
disse to kostgrupper. Færøsk og grønlandsk kost er karakterise
ret ved deres relativt høje radioøkologiske sensitivitet med 137 hensyn til Cs, hovedsageligt stammende fra de lokale terre-
stiske animalske produkter. Den danske, færøske og grønlandske

- 267 -
kost udviser næsten den samme radiookologiske sensitivitet med 90 hensyn til Sr. De effektive dosis ekvivalent commitmenter fra
radioaktivt nedfald fra kærnevåbenforsøg er beregnet til 1.6 mSv
for en dansker, 4.2 mSv for en færing og 1.6 mSV for en gren
lænder. Cæsium-137 bidrog med godt og vel halvdelen til disse
dosisekvivalenter. Den højere dosis til færinger skyldes den
større nedbørsmængde og dermed større nedfaldshastighed på Fær
øerne; men det skyldes tillige den større radioøkologiske sen
sitivitet af det færøske miljø.
Det samlede maksimale antal alvorlige sundhedsskader i den dan
ske, færøske og grønlandske befolkning, som følge af den radio
aktive forurening fra hidtidige atmosfæriske kærnevåbenforsøg,
skønnes at ligge i størrelsesordenen et hundrede fatale cancer
tilfælde og et tilsvarende antal alvorlige genetiske skader.
I femte og sidste kapitel vises hvorledes resultaterne i det 90 foregående kan benyttes til at opstille en model for Sr og
137
Cs omsætningen i det danske terrestriske økosystem under
ligevægtsbetingelser. Begrebet radiotoxicitet defileres, og
der opstilles kvantitative udtryk for en fysiologisk og en mil
jøbetinget radiotoxicitet. Det vises, at et stofs (radio)toxi-
citet er et relativt begreb, som afhænger af den sammenhæng,
hvori begrebet anvendes. Endelig demonstreres, at radioøkolo
gisk sensitivitet kan benyttes ved bedømmelsen af et miljøs eg
nethed som recipient for radioaktive udslip, samt at virkningen
af modforholdsregler i form af kassation af afgrøder eller om
lægning af landbrugsproduktionen kan estimeres udfra afgrødernes
tidsvariabilitet.

V
Sales distributors: Jul. Gjellerup, Sølvgade 87, DK-1307 Copenhagen K, Denmark
Available on exchange from: ISBN 87-550-0727-9 Risø Library, Risø National Laboratory, ISBN 87-550-0734-1 P. O. Box 49, DK-4000 Roskilde, Denmark ISSN 0106-2840
![Agricultural scenario JRODOS calculations · Agricultural scenario JRODOS calculations C. Turcanu ... 1993]) Radioecological regions ... May 1st and November 20th Three radionuclides:](https://static.fdocuments.us/doc/165x107/5b930e4009d3f27f5d8c6e62/agricultural-scenario-jrodos-calculations-agricultural-scenario-jrodos-calculations.jpg)