Environmental, Social and Governance Data plc Corporate responsibility summary 2017 1 Environmental,...
4
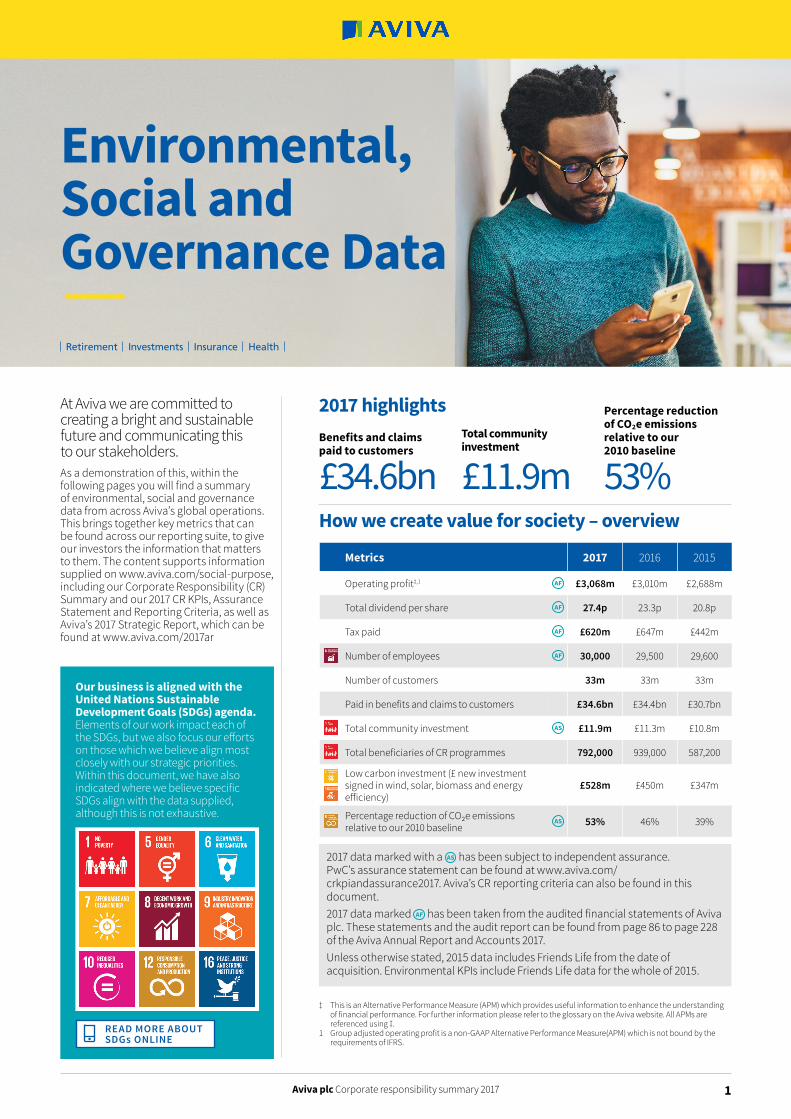
Aviva plc Corporate responsibility summary 2017 1 At Aviva we are committed to creating a bright and sustainable future and communicating this to our stakeholders. As a demonstration of this, within the following pages you will find a summary of environmental, social and governance data from across Aviva’s global operations. This brings together key metrics that can be found across our reporting suite, to give our investors the information that matters to them. The content supports information supplied on www.aviva.com/social-purpose, including our Corporate Responsibility (CR) Summary and our 2017 CR KPIs, Assurance Statement and Reporting Criteria, as well as Aviva’s 2017 Strategic Report, which can be found at www.aviva.com/2017ar 2017 highlights Benefits and claims paid to customers £34.6bn Total community investment £11.9m Percentage reduction of CO2e emissions relative to our 2010 baseline 53% 2017 data marked with a AS has been subject to independent assurance. PwC’s assurance statement can be found at www.aviva.com/ crkpiandassurance2017. Aviva’s CR reporting criteria can also be found in this document. 2017 data marked AF has been taken from the audited financial statements of Aviva plc. These statements and the audit report can be found from page 86 to page 228 of the Aviva Annual Report and Accounts 2017. Unless otherwise stated, 2015 data includes Friends Life from the date of acquisition. Environmental KPIs include Friends Life data for the whole of 2015. Metrics 2017 2016 2015 Operating profit ‡,1 AF £3,068m £3,010m £2,688m Total dividend per share AF 27.4p 23.3p 20.8p Tax paid AF £620m £647m £442m Number of employees AF 30,000 29,500 29,600 Number of customers 33m 33m 33m Paid in benefits and claims to customers £34.6bn £34.4bn £30.7bn Total community investment AS £11.9m £11.3m £10.8m Total beneficiaries of CR programmes 792,000 939,000 587,200 Low carbon investment (£ new investment signed in wind, solar, biomass and energy efficiency) £528m £450m £347m Percentage reduction of CO₂e emissions relative to our 2010 baseline AS 53% 46% 39% How we create value for society – overview Environmental, Social and Governance Data Our business is aligned with the United Nations Sustainable Development Goals (SDGs) agenda. Elements of our work impact each of the SDGs, but we also focus our efforts on those which we believe align most closely with our strategic priorities. Within this document, we have also indicated where we believe specific SDGs align with the data supplied, although this is not exhaustive. READ MORE ABOUT SDGs ONLINE ‡ This is an Alternative Performance Measure (APM) which provides useful information to enhance the understanding of financial performance. For further information please refer to the glossary on the Aviva website. All APMs are referenced using ‡. 1 Group adjusted operating profit is a non-GAAP Alternative Performance Measure(APM) which is not bound by the requirements of IFRS.
Transcript of Environmental, Social and Governance Data plc Corporate responsibility summary 2017 1 Environmental,...
Aviva plc Corporate responsibility summary 2017 1
Environmental, Social and Governance Data
At Aviva we are committed to creating a bright and sustainable future and communicating this to our stakeholders. As a demonstration of this, within the following pages you will find a summary of environmental, social and governance data from across Aviva’s global operations. This brings together key metrics that can be found across our reporting suite, to give our investors the information that matters to them. The content supports information supplied on www.aviva.com/social-purpose, including our Corporate Responsibility (CR) Summary and our 2017 CR KPIs, Assurance Statement and Reporting Criteria, as well as Aviva’s 2017 Strategic Report, which can be found at www.aviva.com/2017ar
2017 highlightsBenefits and claims paid to customers
£34.6bnTotal community investment
£11.9m
Percentage reduction of CO2e emissions relative to our 2010 baseline
53%
2017 data marked with a AS has been subject to independent assurance. PwC’s assurance statement can be found at www.aviva.com/crkpiandassurance2017. Aviva’s CR reporting criteria can also be found in this document.2017 data marked AF has been taken from the audited financial statements of Aviva plc. These statements and the audit report can be found from page 86 to page 228 of the Aviva Annual Report and Accounts 2017.Unless otherwise stated, 2015 data includes Friends Life from the date of acquisition. Environmental KPIs include Friends Life data for the whole of 2015.
Metrics 2017 2016 2015
Operating profit‡,1 AF £3,068m £3,010m £2,688m
Total dividend per share AF 27.4p 23.3p 20.8p
Tax paid AF £620m £647m £442m
Number of employees AF 30,000 29,500 29,600
Number of customers 33m 33m 33m
Paid in benefits and claims to customers £34.6bn £34.4bn £30.7bn
Total community investment AS £11.9m £11.3m £10.8m
Total beneficiaries of CR programmes 792,000 939,000 587,200
Low carbon investment (£ new investment signed in wind, solar, biomass and energy efficiency)
£528m £450m £347m
Percentage reduction of CO₂e emissions relative to our 2010 baseline
AS 53% 46% 39%
How we create value for society – overview
Environmental, Social and Governance Data
Our business is aligned with the United Nations Sustainable Development Goals (SDGs) agenda. Elements of our work impact each of the SDGs, but we also focus our efforts on those which we believe align most closely with our strategic priorities. Within this document, we have also indicated where we believe specific SDGs align with the data supplied, although this is not exhaustive.
READ MORE ABOUT SDGs ONLINE
‡ This is an Alternative Performance Measure (APM) which provides useful information to enhance the understanding of financial performance. For further information please refer to the glossary on the Aviva website. All APMs are referenced using ‡.
1 Group adjusted operating profit is a non-GAAP Alternative Performance Measure(APM) which is not bound by the requirements of IFRS.

Aviva plc Corporate responsibility summary 2017 2
Environmental, Social and Governance Data
Financial
1 As a percentage of those companies we invest in with whom we have voting rights. When exercising our right to vote in company meetings, we are interested in the principles of good governance and how these are achieved in practice to promote the best long-term prospects for the companies in which we invest. Our approach is set out in detail in our UK Corporate Governance and Corporate Responsibility voting policy, which can be found at www.avivainvestors.com/en-gb/institutional/about-us/responsible-investment.html
2 This includes a range of engagement activity undertaken by our Global Responsible Investment (GRI) team, fund managers and collaboratively with other investors. Engagement intensity ranges from a single letter to multiple meetings. Please contact [email protected] for further engagement details.
Metrics 2017 2016 2015
Low carbon investment (£ new investment signed in wind, solar, biomass and energy efficiency) £528m £450m £347m
Percentage of company meetings (AGMs and EGMs) at which Aviva Investors voted1 91.5% 91.8% 90.1%
Number of stewardship engagements on strategic, environmental, social and/or governance (ESG) issues2 989 1,240 1,094
Responsible investment
Corporate governance
Metrics 2017 2016 2015
Operating profit‡,1AF £3,068m £3,010m £2,688m
Cash remittances‡ £2,398m £1,805m £1,507m
Value of new business: Adjusted SII basis‡ £1,243m £992m n/a
Combined operating ratio‡ 96.6% 100.1% 95.0%
Operating expenses‡ £3,778m £3,408m £3,030m
Operating expense ratio‡ 52.7% 50.5% 49.8%
Net asset value per share‡ 423p 414p 390p
Operating earnings per share‡,2 54.8p 51.1p 49.7p
Total staff costs AF £1,942m £1,764m £1,628m
Tax paid AF £620m £647m £442m
Total dividend per share AF 27.4p 23.3p 20.8p
‡ This is an Alternative Performance Measure (APM) which provides useful information to enhance the understanding of financial performance. For further information please refer to the glossary on the Aviva website. All APMs are referenced using ‡.
1 Group adjusted operating profit is a non-GAAP Alternative Performance Measure(APM) which is not bound by the requirements of IFRS.2 Net of tax, non-controlling interests, preference dividends, coupon payments in respect of the direct capital instrument (DCI) and tier 1 notes (net of
tax). The calculation of earnings per share uses a weighted average of 4,041 million (2016: 4,051 million, 2015: 3,741 ,million) ordinary shares in issue, after deducting treasury shares.
Metrics 2017 2016 2015
Percentage of employees who have read, understood and accepted the business ethics code
AS 99% 98% 98%
Malpractice issues reported through ‘Right Call’ 41 25 25
Number of malpractice cases prosecuted 0 0 New indicator
Metrics 2017 2016 2015
Percentage of managed supply that has agreed to the supplier Code of Behaviour
AS 81%1 57% 43%*
Percentage of managed supply that has been engaged on Corporate Responsibility during the term of their contract with Aviva
AS 88% 84% 99%*
Signatory of prompt payment code (UK) Yes Yes Yes
Percentage of invoices paid within 30 days of submission (UK only) 89%2 73% New indicator
Suppliers
* Excludes Friends Life data.1 For 2017, we included within our definition of agreed to ‘abide by the Code of Behaviour’ those suppliers that did not sign up to our Code but were able
to evidence that they have at least an equivalent code of behaviour of their own.2 2017 data calculated based on the latest guidelines of the Prompt Payment Code.
Aviva is a long-standing member of the FTSE4Good Index and the Dow Jones Sustainability Index (run in partnership with RobecoSAM).
Performance indicators
88%of managed supply has been engaged on CR during the term of their contract with Aviva
Performance indicators
£528mLow carbon investment (£ new investment signed in wind, solar, biomass and energy efficiency)
Aviva plc Corporate responsibility summary 2017 3
Environmental, Social and Governance Data
Metrics 2017 2016 2015
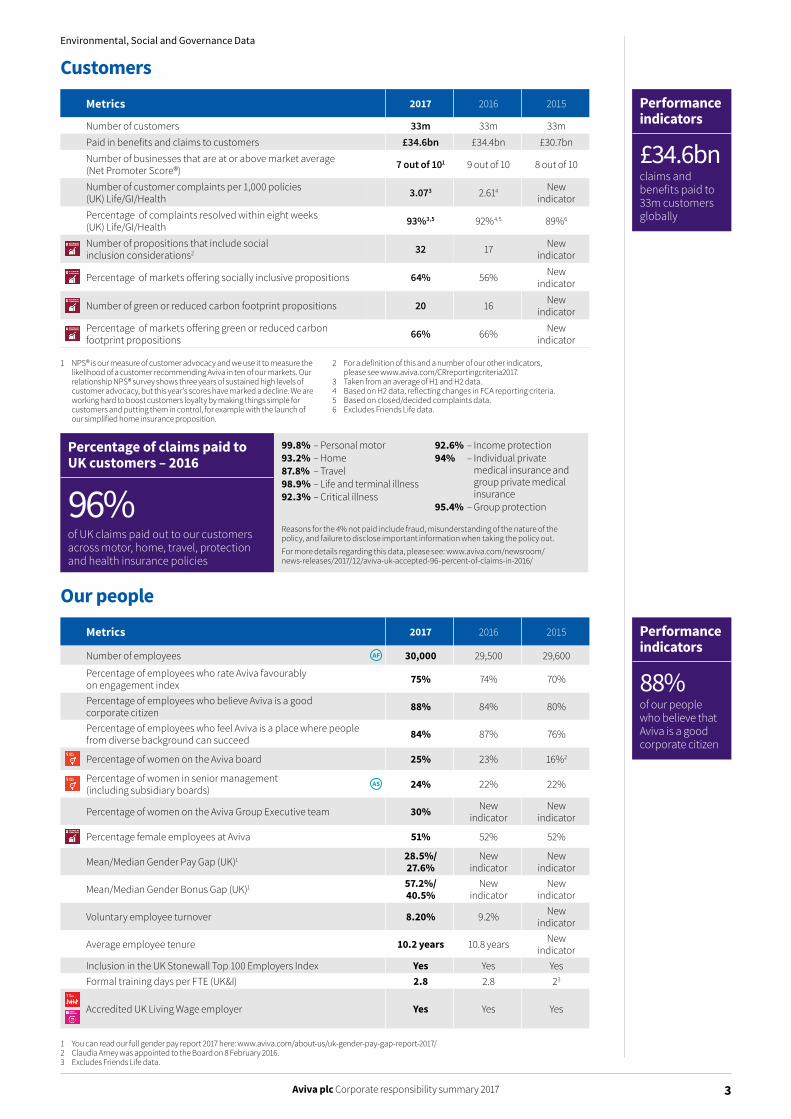
Number of customers 33m 33m 33mPaid in benefits and claims to customers £34.6bn £34.4bn £30.7bnNumber of businesses that are at or above market average (Net Promoter Score®) 7 out of 101 9 out of 10 8 out of 10
Number of customer complaints per 1,000 policies (UK) Life/GI/Health 3.073 2.614 New
indicatorPercentage of complaints resolved within eight weeks (UK) Life/GI/Health 93%3,5 92%4,5 89%6
Number of propositions that include social inclusion considerations2 32 17 New
indicator
Percentage of markets offering socially inclusive propositions 64% 56% New indicator
Number of green or reduced carbon footprint propositions 20 16 New indicator
Percentage of markets offering green or reduced carbon footprint propositions 66% 66% New
indicator
Customers
1 NPS® is our measure of customer advocacy and we use it to measure the likelihood of a customer recommending Aviva in ten of our markets. Our relationship NPS® survey shows three years of sustained high levels of customer advocacy, but this year’s scores have marked a decline. We are working hard to boost customers loyalty by making things simple for customers and putting them in control, for example with the launch of our simplified home insurance proposition.
2 For a definition of this and a number of our other indicators, please see www.aviva.com/CRreportingcriteria2017.
3 Taken from an average of H1 and H2 data.4 Based on H2 data, reflecting changes in FCA reporting criteria.5 Based on closed/decided complaints data.6 Excludes Friends Life data.
Performance indicators
£34.6bnclaims and benefits paid to 33m customers globally
Performance indicators
88%of our people who believe that Aviva is a good corporate citizen
Our people
Metrics 2017 2016 2015
Number of employees AF 30,000 29,500 29,600
Percentage of employees who rate Aviva favourably on engagement index 75% 74% 70%
Percentage of employees who believe Aviva is a good corporate citizen 88% 84% 80%
Percentage of employees who feel Aviva is a place where people from diverse background can succeed 84% 87% 76%
Percentage of women on the Aviva board 25% 23% 16%2
Percentage of women in senior management (including subsidiary boards)
AS 24% 22% 22%
Percentage of women on the Aviva Group Executive team 30% New indicator
New indicator
Percentage female employees at Aviva 51% 52% 52%
Mean/Median Gender Pay Gap (UK)1 28.5%/ 27.6%
New indicator
New indicator
Mean/Median Gender Bonus Gap (UK)1 57.2%/ 40.5%
New indicator
New indicator
Voluntary employee turnover 8.20% 9.2% New indicator
Average employee tenure 10.2 years 10.8 years New indicator
Inclusion in the UK Stonewall Top 100 Employers Index Yes Yes YesFormal training days per FTE (UK&I) 2.8 2.8 23
Accredited UK Living Wage employer Yes Yes Yes
1 You can read our full gender pay report 2017 here: www.aviva.com/about-us/uk-gender-pay-gap-report-2017/2 Claudia Arney was appointed to the Board on 8 February 2016.3 Excludes Friends Life data.
99.8% – Personal motor 93.2% – Home 87.8% – Travel 98.9% – Life and terminal illness 92.3% – Critical illness
92.6% – Income protection94% – Individual private
medical insurance and group private medical insurance
95.4% – Group protection
Reasons for the 4% not paid include fraud, misunderstanding of the nature of the policy, and failure to disclose important information when taking the policy out.For more details regarding this data, please see: www.aviva.com/newsroom/news-releases/2017/12/aviva-uk-accepted-96-percent-of-claims-in-2016/
Percentage of claims paid to UK customers – 2016
96%of UK claims paid out to our customers across motor, home, travel, protection and health insurance policies
https://www.aviva.com/newsroom/news-releases/2017/12/aviva-uk-accepted-96-percent-of-claims-in-2016/

Aviva plc Corporate responsibility summary 2017 4
Environmental, Social and Governance Data
ClimateWise – We wereranked 3rd, our ClimateWisescore for 2017 was 77%
AAAODP GLOBAL
CLIMATE INDEX
2017
Performance indicators
2,400local community projects supported
Environment
Environmental data covers 100% of Aviva staff including 100% of joint ventures. In 2017 this was 42,431 employees.1 Changes to annual electricity emission factors is at 6.2% – our reporting criteria states that if this is above 5% we restate for a relative comparison.
Absolute figures have not been affected.2 We have restated our 2016 waste figures to account for an overstatement in one market and an understatement in another market. We identified such
instances through a further review of the data reported. Before this restatement, the 2016 figure was 4,994.
Metrics 2017 2016 2015
Percentage reduction of CO2e relative to our 2010 baseline AS 53% 46% 39%
CO2e emissions (tonnes) – absolute AS 68,500 79,410 88,698
CO2e emissions (tonnes) – relative1 AS 68,500 74,483 n/a
Percentage of CO2e emissions from our operations offset annually
AS 100% 100% 100%
Water consumption (m3) – absolute AS 343,621 373,402 449,913
Waste generated (tonnes) – absolute AS 4,575 4,4312 5,821
Recycling rate 72% 80% 80%
Waste to landfill (tonnes) 441 635 2,408
Paper used (tonnes) 4,136 2,674 2,766
Total energy used (MWh) 159,051 183,263 195,923
Total electricity used/Carbon Disclosure Project (CPD) electricity use (MWh) 101,247 118,192 124,600
Electricity from renewable sources 61% 61% 62%
Scope 1 GHG emissions globally (tonnes) 17,915 19,210 19,112Scope 2 GHG emissions globally (tonnes) 31,280 41,008 49,595Scope 3 GHG emissions globally (tonnes) 19,305 19,193 19,991Business mileage (road) (millions kms) 40.56 37.04 37.04Business mileage (air) (millions kms) 63.92 62.29 56.51Business mileage (rail) (millions kms) 28.56 32.17 29.64
Metrics 2017 2016 2015
Number of human rights concerns reported through Right Call 0 0 New indicator
Human rights due diligence assessments completed (Yes or No) Yes Yes New indicator
Number of engagements where Aviva Investors has raised specific human rights issues1 65 34 New
indicator
Human rights
1 Human rights engagements cover a multitude of topics including child labour, working conditions, minority rights and indigenous peoples’ rights. For the year under review we have engaged primarily with companies in the extractive sector and palm oil producers.
1 We have restated figures reported since 2015 to include the total number of employees rather than the full time equivalent (FTE) number quoted in the annual report and accounts.
2 Year by year beneficiary numbers fluctuate depending on the different types and phasing of community investment projects. This is why we state a 2020 target of 2.5 million, which we remain on track to beat.
Strengthening communities
Metrics 2017 2016 2015
Amount of community investment AS £11.9m £11.3m £10.8m
Number of employee hours spent volunteering 48,400 41,700 40,800
Percentage of employees volunteering1 13% 13% 9%
Total number of local community projects supported 2,400 1,600 700
Total beneficiaries of CR programmes 792,0002 939,000 587,200
Donations made by employees and customers £2.0m £2.3m £1.8m
Ranked among the top 6% of asset owners in the world in relation to managing climate risk
Sustainability rankings