ENVIRONMENTAL SCAN MARCH 12, 2015 JAY GANDHI, DIRECTOR OF ADMINISTRATIVE AND INFORMATION MANAGEMENT...
26
ENVIRONMENTAL SCAN MARCH 12, 2015 JAY GANDHI, DIRECTOR OF ADMINISTRATIVE AND INFORMATION MANAGEMENT SERVICES JON DAVIDSON, DIRECTOR OF UNDERGRADUATE ADMISSIONS BRAD MAKI, DIRECTOR OF GRADUATE ADMISSIONS VAHID LOTFI, SENIOR VICE PROVOST LORI VEDDER, DIRECTOR OF FINANCIAL AID DEB WHITE, DIRECTOR OF EXTENDED LEARNING
-
Upload
darren-robertson -
Category
Documents
-
view
213 -
download
0
Transcript of ENVIRONMENTAL SCAN MARCH 12, 2015 JAY GANDHI, DIRECTOR OF ADMINISTRATIVE AND INFORMATION MANAGEMENT...

ENVIRONMENTAL SCAN
MARCH 12, 2015
JAY GANDHI, DIRECTOR OF ADMINISTRATIVE AND INFORMATION MANAGEMENT SERVICES
JON DAVIDSON, DIRECTOR OF UNDERGRADUATE ADMISSIONS
BRAD MAKI, DIRECTOR OF GRADUATE ADMISSIONS
VAHID LOTFI, SENIOR VICE PROVOST
LORI VEDDER, DIRECTOR OF FINANCIAL AID
DEB WHITE, DIRECTOR OF EXTENDED LEARNING
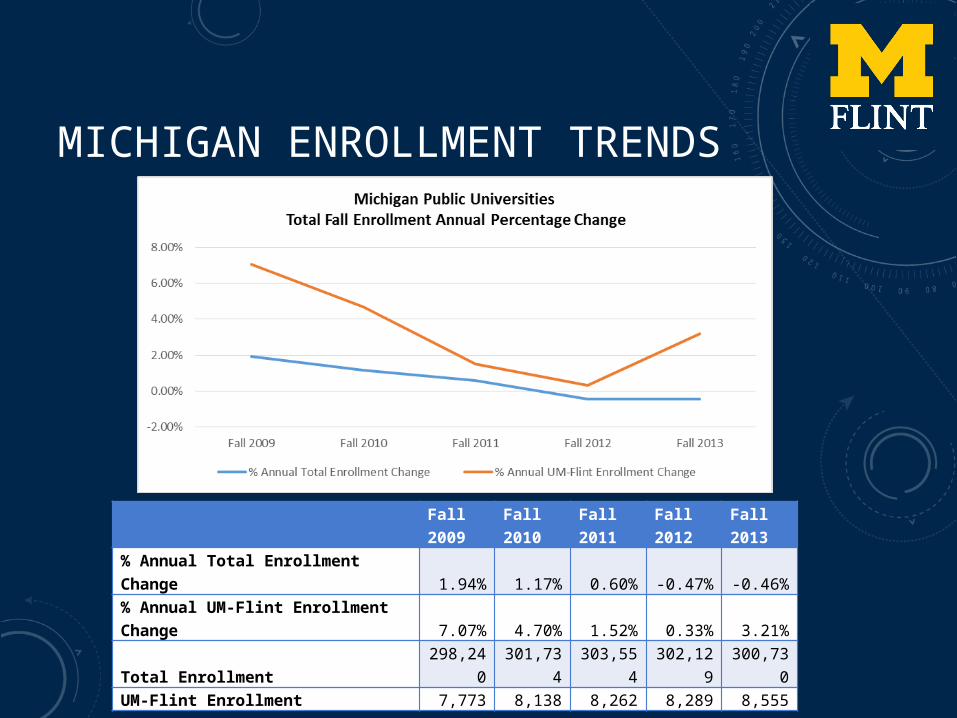
MICHIGAN ENROLLMENT TRENDS
Fall 2009 Fall 2010 Fall 2011 Fall 2012 Fall 2013% Annual Total Enrollment Change 1.94% 1.17% 0.60% -0.47% -0.46%% Annual UM-Flint Enrollment Change 7.07% 4.70% 1.52% 0.33% 3.21%Total Enrollment 298,240 301,734 303,554 302,129 300,730UM-Flint Enrollment 7,773 8,138 8,262 8,289 8,555

UM-FLINT TEN-YEAR TREND
2005 2006 2007 2008 2009 2010 2011 2012 2013 2014 -
1,000
2,000
3,000
4,000
5,000
6,000
7,000
8,000
9,000
6,422 6,527 6,883
7,260 7,773
8,138 8,262 8,289 8,555 8,574
5,670 5,600 5,824 6,155
6,581 6,874 6,959 6,984 7,143 7,078
752 927 1,059 1,105 1,192 1,264 1,303 1,305 1,412 1,496
Overall Undergrad Graduate33.5 % increase since 2005

UNDERGRADUATE ENROLLMENT TRENDS
2005 2006 2007 2008 2009 2010 2011 2012 2013 2014 -
1,000
2,000
3,000
4,000
5,000
6,000
7,000
8,000
5,670 5,600 5,824 6,155
6,581 6,874 6,959 6,984 7,143 7,078
24.8% increase since 2005

DECREASING PRODUCTION OF HIGH SCHOOL GRADUATES NATIONWIDE
• Michigan among most affected nationwide
• Anticipated contraction of 20% by 2020 in Michigan
Source: WICHE Knocking at the College Door
•
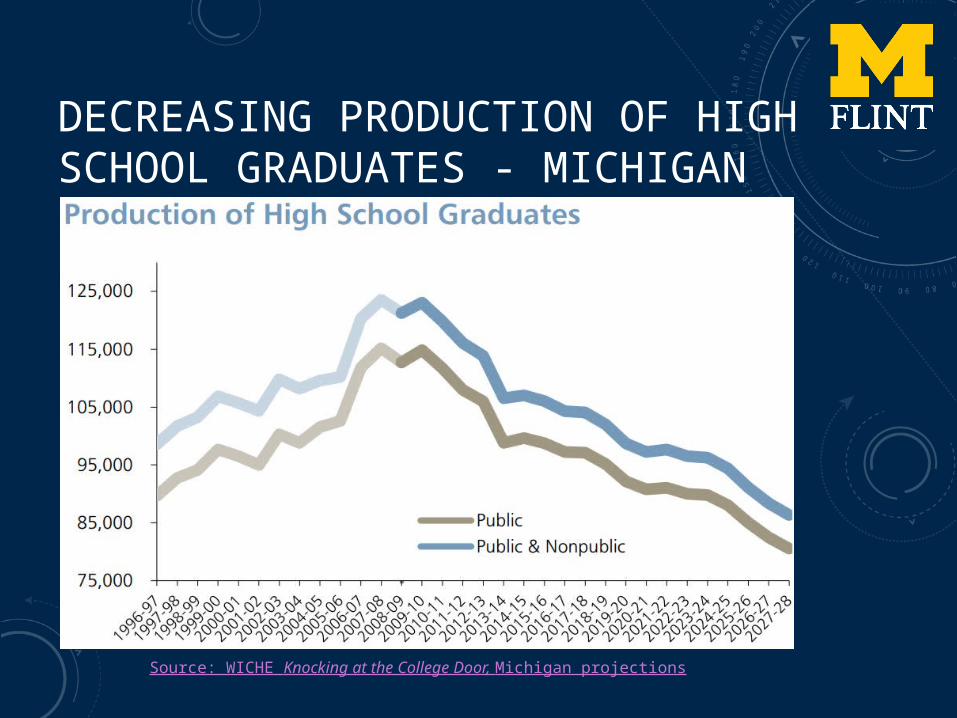
DECREASING PRODUCTION OF HIGH SCHOOL GRADUATES - MICHIGAN
Source: WICHE Knocking at the College Door, Michigan projections

DECREASING PRODUCTION OF HIGH SCHOOL GRADUATES – GENESEE COUNTY
10.6% drop 2010 – 201425.3% drop 2010 – 2020

DECLINE IN COMMUNITY COLLEGE ENROLLMENT
• 17.7% drop overall• 26.5% drop Mott CC
• Transfer students make up 66% of new undergraduates each year• Approximately 45% of transfer students come from Mott Community College

POPULATION SHIFTS
2010 Population
2013 Population Estimate
Change 2010 to 2013
% 18 years or younger
12th grade change 2010-2014
12th grade change 2014-2020 (est.)
Total UG students Fall 14
% resident undergra
Genesee 425,790 415,376 -2.5% 23.7% -10.6% -16.5% 3,686 56.3%Lapeer 88,319 88,389 0.1% 22.5% -4.2% -13.1% 498 7.6%Oakland 1,205,508 1,231,640 2.1% 22.5% -2.3% -9.4% 462 7.1%Livingston 180,967 184,443 1.9% 23.7% 8.5% -13.2% 350 5.3%Wayne 9,883,640 9,898,193 0.1% 24.3% -9.6% -13.6% 247 3.8%Shiawassee 70,648 68,900 -2.5% 22.6% -7.5% -8.8% 168 2.6%Macomb 840,978 854,769 1.6% 22.1% -9.4% -1.9% 166 2.5%St. Clair 163,040 160,469 -1.6% 22.3% -1.0% -15.6% 149 2.3%Ingham 280,891 282,234 0.5% 20.4% -4.0% -3.3% 141 2.2%Saginaw 200,169 196,542 -1.8% 22.2% -15.6% -9.3% 108 1.7%Michigan 9,883,640 9,898,193 0.1% 22.7%USA 308,745,538 316,497,531 2.4% 23.3%
Sources: U.S. Census, Michigan CEPI Counts

UM-FLINT GRADUATE ENROLLMENT
2005 2006 2007 2008 2009 2010 2011 2012 2013 2014 -
200
400
600
800
1,000
1,200
1,400
1,600
752
927
1,059 1,105
1,192 1,264 1,303 1,305
1,412 1,496
99% increase in headcount since 2005!

POPULATION SHIFTS
2010 Population
2013 Population Estimate
Change 2010 to 2013
% 25+ w/Bach. Degree
Total GR students Fall 14
% resident GR
Genesee 425,790 415,376 -2.50% 18.9% 384 33.0%
Oakland 1,205,508 1,231,640 2.10% 43.1% 173 14.9%
Wayne 9,883,640 9,898,193 0.10% 21.3% 58 5.0%
Washtenaw 344,791 354,240 2.70% 51.3% 55 4.7%
Saginaw 200,169 196,542 -1.80% 19.1% 49 4.2%
Livingston 180,967 184,443 1.90% 32.9% 45 3.9%
Kent 602,622 621,700 3.10% 31.7% 42 3.6%
Macomb 840,978 854,769 1.60% 22.5% 41 3.5%
Lapeer 88,319 88,389 0.10% 17.0% 39 3.4%
Ingham 280,891 282,234 0.50% 36.5% 27 2.3%
Michigan 9,883,640 9,898,193 0.10% 25.9% USA 308,745,538 316,497,531 2.40% 28.8%
Sources: U.S. Census, Michigan CEPI Counts

GRADUATE ENROLLMENT

GRADUATE ENROLLMENT
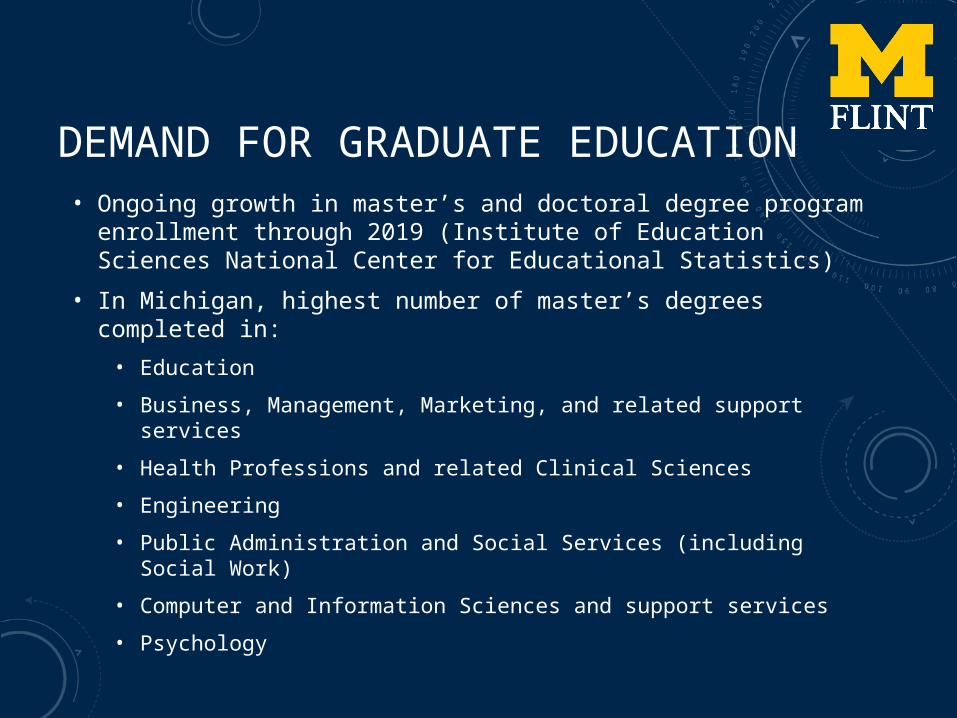
DEMAND FOR GRADUATE EDUCATION• Ongoing growth in master’s and doctoral degree program enrollment
through 2019 (Institute of Education Sciences National Center for Educational Statistics)
• In Michigan, highest number of master’s degrees completed in:
• Education
• Business, Management, Marketing, and related support services
• Health Professions and related Clinical Sciences
• Engineering
• Public Administration and Social Services (including Social Work)
• Computer and Information Sciences and support services
• Psychology

INTERNATIONAL ENROLLMENT
2005 2006 2007 2008 2009 2010 2011 2012 2013 2014 -
100
200
300
400
500
600
700
54 62
125 160 167
209
254
348
543
663

INTERNATIONAL ENROLLMENTCOUNTRIES OF ORIGIN FALL 2014
1. Saudi Arabia
2. India
3. China
4. South Korea
5. Nigeria

INTERNATIONAL STANDING AND DEMAND
• United States is the top destination for international students
• State of Michigan ranks 9th for number of International students

INTERNATIONAL STANDING AND DEMAND
• Growth fueled by China, Saudi Arabia, Vietnam
• Emerging markets in Oman, Iraq, Kuwait, Iran, and Brazil due to government scholarship programs

AFFORDABILITY AND STATE FUNDING
“Michigan is seeing very moderate increases in State Appropriations from FY 11-12 to FY 14-15.”Source: President’s Council State Universities of Michigan
“Michigan has seen 5th largest decline in state funding from 2009-14…Today, state funding covers about 22 percent of the cost of an education (vs. 70 percent in 1985)” Source: President’s Council State Universities of Michigan
2005-2010

AFFORDABILITY AND STATE FUNDINGThe latest reduction in appropriations occurred in 2012-13 when a 15% cut across-the-board was assessed to the public universities in Michigan. To date these funds have not been fully restored, as tuition and fees become the driving source of general fund revenue.
Boulus, Michael A. Michigan’s Public Universities Moving Michigan into the Knowledge Economy, February 12, 2013.

AFFORDABILITY AND STATE FUNDING CONT.
As state disinvestment continues, an article by the Young Invincibles (YI) demonstrates how states fair using a scoring system that takes into account the relationship between state budgets and college affordability.

ONLINE LEARNING TRENDING AS A STRATEGY
• 70.8% of chief academic leaders say online learning is critical to long-term strategy.
• Online enrollments have increased at rates far in excess of those of overall higher education.
IPEDS: 73.7% of the 1.2% overall student enrollment growth was distance students
(2013)
• Decreasing online growth rates since 2009

ONLINE LEARNING TRENDING AS A STRATEGY
Public 4-year: 7.2% growth 2012 to 2013

UM-FLINT: STUDENTS TAKINGONLINE COURSES ONLY
Fall 2007 Fall 2008 Fall 2009 Fall 2010 Fall 2011 Fall 2012 Fall 2013 Fall 20140
200
400
600
800
1,000
1,200
415
522 502
610690
857
9761,006
38 54 80 106186
235291
338
UndergraduateGraduate
2007 2008 2009 2010 2011 2012 2013 2014
Undergrad 6.72% 8.01% 7.21% 8.87% 9.92% 12.27% 13.66% 14.21%
Graduate 3.4% 4.43% 6.38% 8.39%
14.27% 18.01% 20.61% 22.59%

UM-FLINT ONLINE COURSE ENROLLMENT GROWTH RATES
2007-08 2008-09 2009-10 2010-11 2011-12 2012-13 2013-14 2014-15-10.00%
-5.00%
0.00%
5.00%
10.00%
15.00%
20.00%
9.53%11.97%
13.48%11.95% 12.66%
8.49%11.66%
-0.85%
Annual Online Enrollment Growth
Year
-to-Y
ear G
row
th R
ate

SEM DATA TEAMRoy Barnes, Associate Dean, College of Arts and SciencesJay Gandhi, Director of Administrative and Information Management ServicesDan Adams, Director of International CenterKaren Arnould, RegistrarJon Davidson, Director of Undergraduate AdmissionsBrad Maki, Director of Graduate AdmissionsAimi Moss, Director of Student Success CenterFawn Skarsten, Director of Institutional AnalysisLori Vedder, Director of Financial AidDeb White, Director of Extended Learning