Environmental Review of the Proposed Fly Ash Beneficiation...
144
Environmental Review of the Proposed Fly Ash Beneficiation/ STAR Project at the Morgantown Generating Station March 2012 PPSE-M-04 DNR Publication No. 12-382012-556
Transcript of Environmental Review of the Proposed Fly Ash Beneficiation...

Environmental Review of the
Proposed Fly Ash Beneficiation/ STAR Project at the Morgantown
Generating Station
March 2012
PPSE-M-04 DNR Publication No. 12-382012-556

Environmental Review of the Proposed Fly Ash Beneficiation/STAR Project at the Morgantown
Generating Station
Prepared Under the Direction Of:
Shawn Seaman Power Plant Research Program
Prepared By:
Brandie Sebastian, Robert Keating, P. Diane Mountain, and Robert Sawyer Environmental Resources Management, Inc., Annapolis, Maryland
Daniel Goldstein
Environmental Resources Management, Inc., Richmond, Virginia
Anand Yegnan Environmental Resources Management, Inc., Exton, Pennsylvania
Frederick S. Kelley
Versar, Inc., Columbia, Maryland
Peter D. Hall Metametrics, Inc., Charlottesville, Virginia
Prepared For:
The Power Plant Research Program Maryland Department of Natural Resources
Annapolis, Maryland
March 2012

(This Page Intentionally Left Blank)
FOREWORD
This report was prepared under the direction of Shawn Seaman at the Maryland Department of Natural Resources, Power Plant Research Program (PPRP). Under the contract to PPRP, the following individuals were responsible for conducting the work associated with this environmental review:
Brandie Sebastian, Robert Keating, and P. Diane Mountain,
Environmental Resources Management, Inc., Annapolis, Maryland, under Contract No. K00B0400122;
Robert Sawyer, Environmental Resources Management, Inc.,
Annapolis, MD; Daniel Goldstein, Environmental Resources Management, Inc., Richmond, Virginia; and Anand Yegnan, Environmental Resources Management, Inc., Exton, Pennsylvania, under Contract No. K00B0400079;
Frederick S. Kelley, Versar, Inc., Columbia, Maryland, under Contract
No. K00B0200109; and
Peter D. Hall, Metametrics, Inc., Charlottesville, Virginia, under
Contract No. PR97-056-001.
MD PPRP i Morgantown STAR ERD - Case No. 9229
ABSTRACT
The Maryland Public Service Commission (PSC) granted a Certificate of Public Convenience and Necessity (CPCN) to Mirant Mid-Atlantic, LLC (Mirant) authorizing the modification of the Morgantown Generating Station in Charles County, Maryland via the construction of a fly ash beneficiation project to thermally process fly ash into a low-carbon material suitable for beneficial reuse on January 31, 2011. PPRP, coordinating with other State agencies, performed this environmental review of the proposed project as part of the PSC licensing process, pursuant to Section 3-304 of the Natural Resources Article of the Annotated Code of Maryland (PSC Case No. 9229). The results of the State’s evaluations are contained in this Environmental Review Document (ERD). PPRP evaluated the potential impacts to environmental and cultural resources of the proposed facility and established recommended licensing conditions for constructing and operating the proposed facility, pursuant to Section 3-306 of the Natural Resources Article.
The proposed project includes the installation of a proprietary technology called a Staged Turbulent Air Reactor (STAR) equipped with baghouses and a wet flue gas desulfurization (FGD) system, new raw fly ash and product ash storage domes, and associated equipment for the handling and transferring of fly ash. The STAR Facility is designed to process up to 360,000 tons of fly ash per year, which includes fly ash produced primarily by the Morgantown and Chalk Point generating stations, thereby diverting the fly ash from its current disposal practices.

MD PPRP i Morgantown STAR ERD - Case No. 9229
TABLE OF CONTENTS
EXECUTIVE SUMMARY ES-1
1.0 INTRODUCTION 1-1
1.1 PURPOSE 1-1
1.2 LICENSING STATUS 1-2
1.3 BACKGROUND ON BENEFICIAL REUSE OF FLY ASH IN THE CEMENT INDUSTRY 1-3
1.4 REPORT ORGANIZATION 1-3
2.0 PROJECT DESCRIPTION 2-1
2.1 SITE DESCRIPTION 2-1
2.2 EXISTING FACILITY 2-1
2.3 REVIEW OF OTHER RECENT PROJECTS AT MORGANTOWN 2-2
2.4 PROPOSED PROJECT COMPONENTS AND DESCRIPTION 2-5 2.4.1 Ash Handling and Storage 2-7 2.4.2 Proposed Project Water Requirements and Discharges 2-8
3.0 EXISTING SITE CONDITIONS 3-1
3.1 CLIMATE AND AIR QUALITY 3-1 3.1.1 Weather and Climate 3-1 3.1.2 Ambient Air Quality 3-3
3.2 WATER RESOURCES 3-5 3.2.1 Ground Water 3-5 3.2.2 Surface Water 3-6 3.2.3 Potable Water Supply and Wastewater Treatment 3-8 3.2.4 Storm Water Management 3-8
3.3 BIOLOGICAL RESOURCES 3-8 3.3.1 Vegetation Resources 3-9 3.3.2 Wildlife 3-11 3.3.3 Threatened and Endangered Species 3-12

MD PPRP ii Morgantown STAR ERD - Case No. 9229
3.3.4 Aquatic Resources and Wetlands 3-14
3.4 REGIONAL SOCIOECONOMIC SETTING 3-14 3.4.1 Population Trends 3-14 3.4.2 Employment and Income Trends 3-15 3.4.3 Land Use and Zoning 3-17 3.4.4 Transportation 3-20 3.4.5 Cultural Resources 3-21 3.4.6 Public Services and Safety 3-22
4.0 AIR QUALITY IMPACTS 4-1
4.1 IMPACT ASSESSMENT BACKGROUND AND METHODOLOGY 4-1
4.2 DESCRIPTION OF PROPOSED PROJECT 4-2 4.2.1 Proposed Ash Beneficiation Facility 4-2 4.2.2 Existing Fly Ash Handling Facilities 4-6
4.3 PROPOSED PROJECT SOURCE CHARACTERIZATION 4-7 4.3.1 Potential Emissions from the Project 4-7 4.3.2 Potential Emission from the Entire STAR Facility 4-9 4.3.3 Potential Emission from the STAR Process Reactor 4-10 4.3.4 Potential Emission from Material Handling Operations 4-16 4.3.5 Mercury Emissions 4-20 4.3.6 Hazardous Air Pollutant Emissions 4-22 4.3.7 Toxic Air Pollutant Emissions 4-24 4.3.8 Greenhouse Gas Emissions 4-25 4.3.9 Construction Emissions 4-26
4.4 APPLICABLE REQUIREMENTS REVIEW 4-28 4.4.1 Federal Permitting Requirements 4-29 4.4.2 Federal Non-Permitting Requirements 4-35 4.4.3 State Requirements 4-39
4.5 AIR QUALITY IMPACT MODELING 4-42 4.5.1 Impact Assessment Background and Objective 4-42 4.5.2 Short-term NAAQS Analysis 4-44 4.5.3 Nutrient Loading to Chesapeake Bay 4-50 4.5.4 Visible Plume Analysis 4-52
4.6 SUMMARY OF AIR QUALITY EVALUATIONS 4-58
5.0 ANALYSIS OF OTHER ENVIRONMENTAL IMPACTS 5-1

MD PPRP iii Morgantown STAR ERD - Case No. 9229
5.1 IMPACTS TO WATER RESOURCES 5-1 5.1.1 Ground Water Usage 5-1 5.1.2 Surface Water – Lower Potomac River 5-1 5.1.3 Storm Water 5-2 5.1.4 Wastewater 5-3 5.1.5 Construction Dewatering 5-3
5.2 IMPACTS TO BIOLOGICAL RESOURCES 5-3 5.2.1 Vegetation Resources 5-4 5.2.2 Wildlife 5-4 5.2.3 Threatened and Endangered Species 5-4 5.2.4 Aquatic Resources and Wetlands 5-4
5.3 SOCIOECONOMIC IMPACTS 5-5 5.3.1 Employment and Income 5-5 5.3.2 Population and Housing 5-5 5.3.3 Land Use 5-5 5.3.4 Transportation 5-6 5.3.5 Fiscal Impacts 5-10 5.3.6 Visual Quality 5-11 5.3.7 Cultural Impacts 5-13 5.3.8 Noise Impacts 5-15
6.0 SUMMARY 6-1
6.1 AIR QUALITY 6-1
6.2 WATER RESOURCES 6-2
6.3 BIOLOGICAL RESOURCES 6-3
6.4 SOCIOECONOMIC IMPACTS 6-3
7.0 REFERENCES 7-1
LIST OF FIGURES on or following page
Figure 2-1 Site Location 2-1 Figure 2-2 Morgantown Aerial Photograph with the STAR Facility 2-8 Figure 3-1 Five-Year Annual Wind Rose for 1991 to 1995 at Reagan National
Airport (DCA), VA (Station No. 13743) 3-2 Figure 3-2 Location of Pollutant Monitoring Stations In and Around Charles County 3-4

MD PPRP iv Morgantown STAR ERD - Case No. 9229
Figure 4-1 Process Flow Diagram for Proposed Ash Beneficiation Project 4-5 Figure 4-2 Process Flow Diagram for Existing Fly Ash Handling Facility 4-7 Figure 4-3 Map Showing Location of STAR Process Reactor 4-47 Figure 4-4 Receptors in the Vicinity of Morgantown Facility 4-48 Figure 4-5 Contour plot Showing Maximum Predicted 1-hour SO2 Concentrations 4-49 Figure 4-6 Contour Plot Showing Maximum Predicted 1-hour NOX Concentrations 4-50 Figure 4-7 Contour Plot Showing the Deposition of Sulfur Within the Chesapeake Bay 4-52 Figure 4-8 Receptors Used in Visible Plume Modeling Analysis 4-55 Figure 5-1 Designated Truck Route between Chalk Point and Morgantown 5-8
LIST OF TABLES
Table 2-1 Annual Fly Ash Production at the Morgantown and Chalk Point Generating Stations from 2006 – 2009 2-7
Table 3-1 Summary of Monitoring Data for Ozone and PM2.5 Near Morgantown 3-5 Table 3-2 Projected Population Distribution by Election District 3-15 Table 3-3 Projected Employment Growth in Southern Maryland, 2000-2030 3-16 Table 3-4 Summary Table of Protected Agricultural Lands 3-19 Table 3-5 Recreational and Resource Land by Owner (in Acres) 3-19 Table 4-1 Potential Emissions Summary (lb/hr) 4-9 Table 4-2 Potential Emissions Summary (tons/year) 4-9 Table 4-3 Potential Fuel Combustion Emissions Summary (lb/hr) 4-10 Table 4-4 Potential Material Handling Operations Emissions Summary (tons/year) 4-17 Table 4-5 Hazardous Air Pollutant Emissions Summary 4-24 Table 4-6 Toxic Air Pollutant Compliance Demonstration 4-27 Table 4-7 Construction Emissions 4-28 Table 4-8 Potential Emissions from the Proposed Morgantown STAR Facility and PSD Significant Emissions Thresholds (Annual Average Heat Input - 100 MMBtu/hr) 4-31 Table 4-9 Potential Emissions from the Proposed Morgantown STAR Facility and NA-NSR Significant Emissions Thresholds (Annual Average Heat Input – 100 MMBtu/hr) 4-34 Table 4-10 Summary of NAAQS 4-43 Table 4-11 Summary of Source Information for the Morgantown STAR Facility 4-46 Table 4-12 Summary of AERMOD Predicted Impacts for Comparison with Short-Term NAAQS 4-49 Table 4-13 Predicted Estimate of Nutrient (Sulfur) Loading to Chesapeake Bay Due to the Proposed STAR Facility 4-51 Table 4-14 Summary of Predicted Plume Heights and Lengths 4-57

MD PPRP v Morgantown STAR ERD - Case No. 9229
LIST OF APPENDICES
Appendix A Initial Recommended Licensing Conditions – PSC Case No. 9229 Appendix B Air Emissions Calculations – PSC Case No. 9229 Appendix C Select Responses to PPRP Data Requests – PSC Case No. 9229 Appendix D Final Licensing Conditions – PSC Case No. 9229

(This Page Intentionally Left Blank)

MD PPRP ES-1 Morgantown STAR ERD - Case No. 9229
EXECUTIVE SUMMARY
Mirant Mid-Atlantic, LLC (Mirant) has proposed to modify the Morgantown Generating Station by installing a fly ash beneficiation project to thermally process fly ash into a low-carbon material suitable for beneficial reuse. The proposed project implements a proprietary technology called a Staged Turbulent Air Reactor (STAR), and is referred to as the STAR Facility. The proposed project is designed to process approximately 360,000 tons of fly ash per year, which includes fly ash produced primarily by the Morgantown and Chalk Point generating stations, thereby diverting the fly ash from its current disposal practices.
The Maryland Department of Natural Resources Power Plant Research Program (PPRP), coordinating with other State agencies, has prepared this Environmental Review Document (ERD). This report is the product of a consolidated review by Maryland State agencies of Mirant’s application for a Certificate of Public Convenience and Necessity (CPCN) to the Maryland Public Service Commission (PSC).
Mirant filed its original CPCN application with the PSC on March 26, 2010, which presented design parameters and operating conditions for the project that would require Prevention of Significant Deterioration (PSD) review for sulfur dioxide (SO2) emissions and Non-Attainment New Source Review (NA-NSR) for particulate matter (PM) less than 2.5 microns in diameter (PM2.5) emissions, as a precursor to SO2. On July 20, 2010, Mirant filed a supplement to amend the air quality portion of its original CPCN application to enable the project to qualify as a minor modification of the Morgantown Generating Station under the Clean Air Act. On November 4, 2010, Mirant filed another amendment to incorporate significant updates that resulted from eight Data Requests. The State’s analysis reflects the information received in Mirant’s original CPCN application, the application amendments, direct testimony, and the responses to the eight Data Requests. The results of the review by PPRP and other agencies resulted in recommended licensing conditions for consideration by the PSC (included in Appendix A to this report). During the course of the proceedings in this case, revisions were made to the initial recommended licensing conditions for clarification and to address technological difficulties with certain sampling and analysis requirements of the initial conditions. The final licensing conditions, as adopted by the PSC in its Final Order on January 31, 2011, are attached to this ERD as Appendix D.
MD PPRP ES-2 Morgantown STAR ERD - Case No. 9229
The proposed Morgantown STAR Facility will emit PSD pollutants (PM less than 10 microns in diameter (PM10), carbon monoxide (CO), nitrogen dioxide (NO2), SO2, sulfuric acid mist (SAM) and lead) and NA-NSR pollutants (ozone and PM2.5). Additional fugitive emissions of PM, PM10, and PM2.5 will result from the project fly ash material handling operations including: fly ash transfers, paved road truck traffic, bin vent emissions, and fly ash storage emissions. Under the operational parameters provided in the CPCN application amendment, including the use of air pollution control equipment (baghouse and wet FGD scrubber), a throughput of 360,000 tons per year of fly ash, and an annual average heat input of 100 MMBtu/hr, the proposed project will emit below the major source modification applicable thresholds under PSD and NA-NSR.
As a means of demonstrating compliance with the PSD and NA-NSR major modification emissions limits, Mirant has proposed to install CEMS that meet the accuracy and quality assurance requirements in 40 CFR 60 Appendix B. Installation of CEMS will allow Mirant operational flexibility of the STAR process reactor given the expected variability of the sulfur content in the fly ash, as well as make adjustments in the heat input of the reactor and the control settings of the FGD system, while providing for a method to continuously monitor emissions and evaluate compliance with proposed emission limits. In addition to CEMS, Mirant shall also restrict its annual fly ash throughput for the STAR Facility to 360,000 tpy on a consecutive 12-month period, rolling monthly. The project will not be subject to any NESHAP or NSPS requirements. The project will be subject to MDE-ARMA requirements for general sources and will need to modify its Title V Operating Permit to address the newly proposed STAR Facility at the time of renewal.
The Mirant STAR Facility has the potential to emit small quantities of mercury, which is a trace metal contained in the raw feed fly ash. PPRP and MDE-ARMA conducted an independent evaluation of the potential mercury emissions from the STAR process reactor. In an effort to reduce Maryland’s contribution to the mercury deposition impacts in the northeast United States, MDE-ARMA requires the STAR Facility to remain below a mercury emissions limit of 5 lb per consecutive 12-month period, rolling monthly. The STAR Facility will be subject to additional MDE-ARMA enforceable conditions including additional testing, recordkeeping, and reporting requirements to assure compliance with the mercury emission limit.
The storm water generated during the construction and normal operation will be managed under the facility’s existing NPDES permit, which will be revised to reflect the new STAR Facility. Mirant will also be required to update the Storm Water Pollution Prevention Plan (SWPPP) to

MD PPRP ES-3 Morgantown STAR ERD - Case No. 9229
incorporate changes to impervious surfaces associated with the construction of the STAR Facility. Mirant will be preparing a grading, sediment, and erosion control plan, in accordance with the County, for the construction phase of the project.
The majority of construction on the Morgantown site will only affect previously disturbed land. Although aquatic resources and wetlands occur in the vicinity of the proposed project area, no impacts to these resources would occur provided erosion, sedimentation, and runoff control measures are implemented. In addition, the area is not known to support any federal or State-listed threatened and endangered species.
During construction, the project would be a minor trip generator when construction workers are commuting to and from the Project site. Once operational, the project will result in a small increase in truck traffic to and from Morgantown for the hauling of unprocessed fly ash from other Mirant generating stations and for the trucking of processed fly ash to customers. There will be limited visual impacts and no adverse effects on archeological and historic resources in the vicinity of the facility. Overall, the project will not result in a significant impact on socioeconomic, aesthetic, and cultural resources in the vicinity of the facility.
If Mirant constructs and operates the proposed project under the final licensing conditions found in Appendix D, the State does not expect unacceptable adverse impacts to environmental, socioeconomic, and cultural resources from the Morgantown STAR Facility.

(This Page Intentionally Left Blank)

MD PPRP 1-1 Morgantown STAR ERD - Case No. 9229
1.0 INTRODUCTION
1.1 PURPOSE
Mirant Mid-Atlantic, LLC (Mirant) submitted an application to the Maryland Public Service Commission (PSC) for a Certificate of Public Convenience and Necessity (CPCN) to authorize the modification of the Morgantown Generating Station (Morgantown) in Charles County, Maryland on March 26, 2010. The proposed modification will enable Mirant to install a coal combustion by-product fly ash beneficiation facility that will thermally process fly ash from the Morgantown and Chalk Point generating stations in order to create product fly ash suitable for beneficial reuse. The proposed project includes a Staged Turbulent Air Reactor (STAR) equipped with baghouses and a wet flue gas desulfurization (FGD) system, new raw fly ash and product ash storage domes, and associated equipment for the handling and transferring of fly ash (collectively referred to herein as the STAR Facility).
Mirant’s original CPCN application presented design parameters and operating conditions for the project that would require Prevention of Significant Deterioration (PSD) review for sulfur dioxide (SO2) emissions and Non-Attainment New Source Review (NA-NSR) for particulate matter (PM) less than 2.5 microns in diameter (PM2.5) emissions, as a precursor to SO2. On July 20, 2010, Mirant filed a supplement to amend the air quality portion of its original CPCN application to enable the project to qualify as a minor modification of the Morgantown Generating Station under the Clean Air Act. The State’s analysis reflects the information received in Mirant’s original CPCN application, the application amendment, direct testimony, and the responses to eight Data Requests (selected responses are included as Appendix C).
The Department of Natural Resources (DNR) Power Plant Research Program (PPRP), in coordination with other State agencies, performed this environmental review as part of the PSC licensing process in PSC Case No. 9229. The results of the State’s evaluations are documented in this Environmental Review Document (ERD). Before modifications of the facility can be undertaken, the PSC must grant a CPCN to Mirant. PPRP’s review was conducted to evaluate the potential impacts of the proposed modification on the State’s environmental and cultural resources, pursuant to Section 3-304 of the Natural Resources Article of the Annotated Code of Maryland.

MD PPRP 1-2 Morgantown STAR ERD - Case No. 9229
PPRP used the analysis of potential impacts as the basis for establishing recommended licensing conditions for operating the facility with the proposed modifications, pursuant to Section 3-306 of the Natural Resources Article. PPRP’s recommendations were made in collaboration with other programs within DNR as well as the Departments of Agriculture, Business and Economic Development, Environment, Planning, and Transportation, and the Maryland Energy Administration. The initial recommended licensing conditions are included as Appendix A to this report.
1.2 LICENSING STATUS
The State of Maryland presented testimony before the PSC as part of the licensing process for the Morgantown STAR Project. The draft version of this ERD was filed as supporting documentation for that testimony along with the initial recommended licensing conditions presented in Appendix A. Evidentiary hearings were held at the PSC on November 9 and 10, 2010 and an evening public hearings was held in Hughesville, Maryland on November 10, 2010. Just prior to the evidentiary hearings, Mirant filed a revised CPCN application with the PSC that incorporated the July 2010 application supplement to amend and information provided in select responses to PPRP data requests. The filing of this amended application lead to the scheduling of a second public hearing on December 13, 2010, in order to allow the public adequate time to review and comment on the new information presented therein.
Prior to and following the conclusion of the evidentiary hearings, Mirant suggested changes to certain recommended licensing conditions, most of which were for clarification and refinement to the conditions, while others were based on technical difficulties associated with some of the sampling and analyses required by the initial recommended licensing conditions. Meetings were held between PPRP, Mirant, and MDE to discuss and some of the initial conditions were revised accordingly. On December 22, 2010, PPRP filed the final recommended licensing conditions of the State agencies, which were ultimately adopted by the PSC in Final Order No. 83827, issued on January 31, 2011, as conditions of the CPCN (attached as Appendix D).
On December 3, 2010, Mirant Corporation merged with RRI Energy, Inc. to form GenOn Energy, Inc. Accordingly, on January 25, 2011, the applicant in PSC Case 9229 was officially changed from Mirant Mid-Atlantic, LLC to GenOn Mid-Atlantic, LLC.

MD PPRP 1-3 Morgantown STAR ERD - Case No. 9229
1.3 BACKGROUND ON BENEFICIAL REUSE OF FLY ASH IN THE CEMENT INDUSTRY
One of the most common options for the beneficial reuse of fly ash is as an ingredient in the cement industry. Coal combustion by-product fly ash has many chemical properties in common with Portland cement. Its composition includes constituents such as silica, alumina, iron, and other oxides. Accordingly, fly ash can be used as a pozzolanic substitute for, or amendment to, Portland cement in concrete mixes. According to the Portland Cement Association, the benefits of using fly ash in concrete mixes include increased concrete workability, especially for pumping applications, a reduction in concrete permeability, an increased resistance to sulfate attack and alkali-silica reaction, which improves durability (PCA, 2010). The American Coal Ash Association (ACAA) describes fly ash as being nearly identical in composition to volcanic ash, which was used to create concrete structures that have been standing for over 2,000 years (ACAA, 2008). According to the ACAA, over half of the concrete produced in the U.S. uses some quantity of fly ash in place of natural pozzolans, and builders routinely use 40 percent fly ash mixes, which can increase to 70 percent or more in massive walls, girders, dams, and foundations.
According to the American Society for Testing and Materials (ASTM) Standard C618-08, “Standard Specification for Coal Fly Ash and Raw or Calcined Natural Pozzolan for Use in Concrete,” fly ash must have a loss-on-ignition (LOI) content of no more than 6 percent by weight to be suitable for use in concrete. According to Mirant, an LOI of less than 3 percent allows for the greatest commercial use. The typical LOI values are 6 percent for fly ash generated at Morgantown, 10 percent for fly ash from Chalk Point, and 15 percent for fly ash from Dickerson (Mirant’s response to PPRP Data Request No. 3, Question 3-18, received July 14, 2010). The purpose of thermally processing the fly ash in the STAR Facility is to reduce the LOI and create a marketable material.
1.4 REPORT ORGANIZATION
This report synthesizes the evaluations that PPRP has conducted. The information is organized into the following sections:
Section 2 provides a description of the existing facility and details the components of the proposed project;
Section 3 describes the existing environmental and socioeconomic conditions;

MD PPRP 1-4 Morgantown STAR ERD - Case No. 9229
Section 4 describes the air impacts associated with the project and the relevant regulatory requirements;
Section 5 describes other environmental impacts associated with the project as well as the socioeconomic impacts that the facility will pose on the surrounding area; and
Section 6 summarizes the findings of the report.
MD PPRP 2-1 Morgantown STAR ERD - Case No. 9229
2.0 PROJECT DESCRIPTION
2.1 SITE DESCRIPTION
The Morgantown Generating Station is located on the southern edge of Charles County, Maryland. The site is situated on the Potomac River just south of US 301 at the Governor Harry W. Nice Memorial Bridge (also known as the Potomac River Bridge) near the town of Newburg, Maryland in Charles County (see Figure 2-1). Morgantown is located on a 427-acre site, of which approximately 166 acres are owned by the Potomac Electric Power Company (PEPCO) and are used for electric substations and transmission lines. The facility was commissioned in 1970 by PEPCO and has been in continuous operation since construction.
As shown on Figure 2-1, the northern boundary of the Morgantown site is US 301, the western boundary is the Potomac River, and Pasquahanza Creek borders the site on the south. A railroad spur owned by CSX Transportation (CSXT) terminates at the site, and US 301 is the primary access route.
2.2 EXISTING FACILITY
The existing generating facility consists of two, base loaded, 620-MW coal-and residual oil-fired boilers (Units 1 and 2), six No. 2 oil-fired peaking combustion turbines (2x20 MW Frame 5 and 4x65 MW Frame 7), two auxiliary boilers, associated fuel handling and storage facilities, and electric transmission facilities. The gross winter capacity of the Morgantown facility is 1,506 MW. Coal is currently delivered to Morgantown by CSXT unit trains and the recently constructed coal barge unloading system. Fuel oil is delivered to the generating facility by truck, barge, and pipeline.
Current air quality control systems at Morgantown Units 1 and 2, as mandated by prior legislation, consist of a hot-side electrostatic precipitator (ESP) to control particulate emissions, and low-NOX burners (LNBs), separated overfire air (SOFA), and selective catalytic reduction (SCR) systems to control nitrogen oxides (NOX) emissions. A flue gas desulfurization (FGD) system for the control of sulfur dioxide (SO2) emissions and controls for sulfuric acid mist (SAM) emissions have been installed on each Morgantown Unit and were recently placed into service. These pollution control systems were the subject of previous CPCN

Figure 2-1
Site Location
Morgantown Generating Station
SITE LOCATION
LEGEND
REFERENCE Mirant’s CPCN Application (Mirant, 2010)

MD PPRP 2-2 Morgantown STAR ERD - Case No. 9229
proceedings, described below in Section 2.3. Exhaust gases are vented from the coal-fired units through a single, dual-flue 400-foot stack. Two 700-foot stacks also exist at the generating station that were previously used to vent exhaust gases from Units 1 and 2 and were retained as boiler protection devices to prevent a high vacuum excursion to the existing furnaces.
Fly ash created during the combustion of coal in Morgantown Units 1 and 2 is collected in the ESP and then routed to two existing storage silos. Fly ash is currently discharged from the storage silos via three Allen Shermon Hoff wet ash unloaders into dump trucks and a Midwest Vacupac dry ash unloader into dry tanker trucks, which, until recently, transported it to the Faulkner facility in Charles County, Maryland for disposal. Upon the closure of the Faulkner facility, Mirant will begin disposing of fly ash from Morgantown at the Brandywine facility in Prince George’s County. Fly ash from Chalk Point will continue to be disposed of at the Brandywine facility as well, until the STAR Facility is fully operational. Once the STAR Facility is operational, it is Mirant’s goal to process and beneficially reuse all of the fly ash produced by Morgantown and Chalk Point; however, any fly ash that cannot be processed or any product ash that cannot be sold for beneficial reuse will be disposed of at the Brandywine facility or other facilities available and permitted at that time for the receipt of coal combustion by-products (Mirant’s response to PPRP Data Request No. 3, Question 3-20, received on July 14, 2010).
2.3 REVIEW OF OTHER RECENT PROJECTS AT MORGANTOWN
In addition to the STAR Project being addressed here under Case 9229, several other projects have recently been approved and/or constructed at Morgantown as part of the company’s plan to comply with the 2006 Maryland Healthy Air Act (HAA).
Coal Blending/Gypsum Loadout Project (Case 9148)— In July 2008, Mirant submitted an application to the PSC for a modification at Morgantown that included the installation of coal blending and gypsum loadout facilities. The coal blending facilities were proposed to allow for the mixing of different types of coals to better match the specifications of the boilers and air quality control equipment recently installed or being constructed. The project was intended to allow for fuel flexibility that will assist Mirant in complying with State-mandated SO2 emission reduction requirements. The main components of the coal blending facilities include new stackout facilities in the existing South coal yard, underground reclaim facilities in both the existing South and North coal yards, reclaim transfer points to integrate the reclaim from the South and North coal

MD PPRP 2-3 Morgantown STAR ERD - Case No. 9229
yards, a refurbished and upgraded emergency reclaim system, and enclosed transfer locations with dust suppression. In addition to the coal blending portion of the modification proposal, Mirant also proposed the installation of a new gypsum barge loadout facility to handle the gypsum created during the operation of the Morgantown Units 1 and 2 FGD systems, as well as gypsum originating from the Chalk Point Generating Station, which would be transported to the Morgantown site by railcar. The primary purpose of the loadout facilities was to assist in the long-term beneficial use of Mirant’s gypsum. On November 24, 2008, an Agreement of Stipulation and Settlement was reached by the parties and was filed with the PSC along with final recommended licensing conditions. On February 2, 2009, the PSC issued a Final Order granting the modification request. Shortly thereafter, construction began and was scheduled to be completed by the end of 2010.
Barge Unloading Project (Case 9031)—In September 2004, Mirant proposed to construct a new coal barge unloading facility at Morgantown to enable the facility the flexibility to bring in different (specifically, lower sulfur) coals from different suppliers. During 2004 and 2005 and in coordination with other State agencies, PPRP performed a thorough environmental review of the proposed facility and recommended to the PSC approval of the barge unloading project in Case 9031, subject to a series of licensing conditions. On September 19, 2005, the PSC issued a Final Order in the case. Subsequent to the September 19, 2005 Order, Mirant requested approval to modify the design of the project from a fixed to a traveling unloader, which would necessitate modifying the pier design, and installing an additional coal transfer point. PPRP, again in coordination with other State agencies, reviewed the project amendment and recommended approval of the amendment request to the PSC in December 2006. The PSC issued a Final Order granting the modification request on July 20, 2007. On March 31, 2008, Mirant requested an additional modification to the approved barge unloading facility design. The changes would include a reduction in the number of pilings from 130 to no more than 100 pilings to support the dock and slight adjustments in the length and width of the dock platform. These modifications were not objected to by the PSC or any other party in PSC Case No. 9148. The barge unloader facilities were constructed and became operational in 2009.
Air Pollution Control (APC) Project (Case 9085)—In November 2006, Mirant submitted a CPCN application to install air pollution control equipment at Morgantown in response to the HAA. The project components consisted of air quality control systems, including wet FGD systems and SAM controls, and associated enhancements of the facility necessary for the operation of the systems. The proposed project also included an upgrade of the pulverizers at Morgantown Unit 2 to provide
MD PPRP 2-4 Morgantown STAR ERD - Case No. 9229
Mirant greater flexibility to utilize a wider variety of coals. The APC project was proposed to substantially decrease emissions of SO2, fine particulate matter (PM2.5), and other air emissions from Morgantown Units 1 and 2, including mercury. To allow for additional mercury control, the project was designed with an allocation of space for the future installation of activated carbon injection equipment and fabric filter baghouses, if needed. In August 2007, a Non-unanimous Agreement of Stipulation Settlement was reached by all parties with the exception of Swan Point Property Owners Association, an intervener in the case, and was filed with the PSC. This agreement stated that a CPCN should be issued subject to PPRP’s recommended licensing conditions, including revisions made during the agreement process. One of these revisions allowed for the inclusion of an emergency fire pump as part of the project. A proposed order was issued by the PSC on August 21, 2007 adopting all of the recommended conditions in the agreement. This order was appealed by Swan Point on August 28, 2007. However, after additional negotiation, briefing, and oral argument, the PSC issued a Final Order, which became effective on October 22, 2007 granting the CPCN with all recommended licensing conditions found in the Non-unanimous Agreement, as well as an additional condition requiring sediment sampling. Construction of this project has been completed and the project became operational in late 2009.
Selective Catalytic Reduction (SCR) Systems—In September 2004, Mirant entered into a Consent Decree with the U.S. EPA, the State of Maryland, and the Commonwealth of Virginia (United States, et al. v. Mirant Potomac River, LLC; Civil Action No: 1:04CV1136) which requires Mirant to install and operate SCR for NOX control systems on Morgantown Units 1 and 2. The Consent Decree required the first of the SCR devices to be installed and operating on Unit 1 no later than May 1, 2007. Operation of the SCR systems reduces NOX emissions substantially, but also has the potential to increase emissions of particulate matter, SAM, and ammonia. Because of the potential for emissions increases, the project would normally require a CPCN prior to construction. However, in the interest of time and to meet the terms of the Consent Decree, Mirant entered into an enforceable agreement with the Maryland Department of the Environment (MDE) to construct the SCR on Unit 1 under the conditions that there would be no increase in PM emissions and that ammonia “slip” emissions would not exceed 3 parts per million (ppm). The SCR on Unit 1 was constructed and became operational in 2007; the SCR on Unit 2 was constructed and became operational during 2008.
Unit 1 Pulverizer— To accommodate the use of lower sulfur coals at Morgantown that are “harder” than the (Northern Appalachian) coals allowed by the original facility design, Mirant proposed to upgrade the

MD PPRP 2-5 Morgantown STAR ERD - Case No. 9229
existing, 1960s vintage pulverizers at Units 1 and 2 that were designed for softer coals. Mirant previously requested permission to conduct the Unit 1 pulverizer upgrade during the February 2007 scheduled outage for the Unit 1 SCR installation. MDE and PPRP reviewed the request and agreed, in a letter dated December 13, 2006 to the PSC, that the project could proceed subject to conditions to ensure that there would be no emissions increases or other substantive impacts. That is, Mirant was prohibited from burning coals that could not previously be accommodated by the pulverizers and was prohibited from increasing the amount of coal to be burned in the unit (either on a ton per hour or million Btu per hour basis) without obtaining CPCN authorization for those activities. As part of Case 9085, Mirant requested approval to complete the pulverizer upgrade at Unit 2, and to burn coals (e.g., Central Appalachian or South American) that the original pulverizers could not previously accommodate.
2.4 PROPOSED PROJECT COMPONENTS AND DESCRIPTION
The new fly ash beneficiation facility will consist of a proprietary ash beneficiation process known as STAR technology developed by The SEFA Group, Inc. (SEFA). Currently, SEFA has one other facility of this kind, located at the McMeekin Generating Station in Columbia, South Carolina. The South Carolina STAR Facility is approximately one-third the size and one-half the throughput of the proposed Morgantown STAR Facility. The South Carolina STAR Facility was permitted under the South Carolina Department of Health and Environmental Control in October 2007 and is currently in operation.
In addition to the STAR Facility, the proposed modification at Morgantown consists of the installation of air quality control systems, including baghouses and a wet FGD system, a new 125-foot stack, and new ash handling and storage facilities. The proposed project components will be located on approximately 3.5 acres of the Morgantown site. The STAR process reactor will be constructed east of Morgantown Unit 1 between the north coal yard and the existing CSXT spur. Propane, used as a supplemental fuel in the STAR process reactor, will be stored in four 1,000 gallon tanks located just north of the STAR Facility office building and adjacent to the STAR process reactor. Processed material storage and loadout facilities (described in Section 2.4.1 below) will be located adjacent to the existing parking area north of the Morgantown site entrance roadway and railroad spur.
MD PPRP 2-6 Morgantown STAR ERD - Case No. 9229
The proposed project involves installation of the following components:
Pneumatic ash transfer system that connects the existing ash storage silos to the new STAR Facility processing area;
1,500-ton capacity reactor fly ash feed silo, equipped with silo bin vent filters, to store fly ash from the Morgantown, Chalk Point, and Dickerson generating stations prior to processing;
140-MMBtu/hr STAR process reactor designed to thermally process fly ash as a primary fuel, with up to 65 MMBtu/hr of propane as a supplemental fuel;
STAR Facility baghouse;
STAR Facility wet, limestone FGD system;
1,500-ton capacity fly ash product silo and bin vents;
30,000-ton capacity fly ash product storage dome and bin vents;
Product loadout facilities;
Office and process controls; and
A process heat exchanger.
The ash beneficiation process involves thermal processing of the fly ash from primarily Morgantown and Chalk Point to oxidize residual carbon that does not oxidize during combustion in the Morgantown or Chalk Point boilers. No physical changes to existing boiler units are proposed. During initial start-up of the STAR Facility, combustion air is heated by a start-up burner firing auxiliary fuel (propane gas). Propane and fly ash are then co-fired until the reactor reaches the point of fly ash auto-ignition, which occurs at a temperature of approximately 1,400 degrees Fahrenheit (oF). Once the necessary temperature is achieved, the residual carbon in the fly ash begins to react, becoming the fuel source for the self-sustaining STAR process. Under certain conditions, supplemental propane fuel may be co-fired with the residual carbon in the fly ash. Process controls will be in place to meter the addition of raw fly ash from the feed silo, as needed. Product fly ash, with a low-LOI, is entrained with the combustion air and it exits at the top of the reactor in the flue gas. From the reactor, the product ash enters a hot cyclone, which is capable of returning particles to the reactor when necessary for temperature and quality control. The exhaust from the cyclone is cooled as it passes through a series of process heat exchangers to a temperature between 300 and 400oF and is then routed through a baghouse, where the product ash is removed. Exhaust gases from the baghouse are directed into the STAR wet FGD system to reduce SO2 emissions prior to being vented to the atmosphere through a stack at a height of 125 feet.

MD PPRP 2-7 Morgantown STAR ERD - Case No. 9229
The proposed ash handling and storage associated with the STAR Facility and the operational water requirements are described in Sections 2.4.1 and 2.4.2 below, respectively. Air emission sources and air pollution control features of the proposed project are detailed in Section 4.2.
2.4.1 Ash Handling and Storage
The STAR Facility will process up to 360,000 tons of fly ash per consecutive 12-month period, rolling monthly. This processing capacity can accommodate all of the fly ash produced at Morgantown, as well as the total amount of fly ash produced at Mirant’s Chalk Point Generating Station. Annual fly ash production quantities for Morgantown and Chalk Point are presented in Table 2-1. Fly ash from Chalk Point will be brought to the Morgantown site via fully-enclosed tanker trucks. Mirant also intends to process fly ash from its Dickerson Generating Station on an as-needed basis (Mirant’s response to Data Request No. 2, Question 2-7, received on June 23, 2010).
Table 2-1 Annual Fly Ash Production at the Morgantown and Chalk Point Generating Stations from 2006 – 2009
Tons of Fly Ash Produced per Year Generating Station
2006 2007 2008 2009
Morgantown 178,317 170,243 166,091 166,913
Chalk Point 118,372 124,333 117,533 112,256
TOTAL 296,689 294,576 283,624 279,169
Source: Mirant’s response to PPRP Data Request No. 2, Question 2-5, received June 23, 2010.
The existing fly ash handling and storage systems will be retained and linked to the new STAR Facility feed silo by way of new pneumatic conveyors. The 1,500-ton feed silo will be 42 feet in diameter and 45 feet tall (Mirant’s response to PPRP Data Request No. 3, Question 3-19, received on July 14, 2010) and will store fly ash from Morgantown and Chalk Point, and any other off-site sources, such as Dickerson, prior to entering the STAR Facility for thermal processing.
From the STAR Facility baghouse, located east of Morgantown Unit 1 between the north coal yard and the existing CSXT spur, the product ash is pneumatically conveyed to either a new 1,500-ton capacity product

MD PPRP 2-8 Morgantown STAR ERD - Case No. 9229
storage silo for product loadout or to a new 30,000-ton capacity product storage dome, where it will be stored until it can be loaded and trucked off-site. Processed material storage and loadout facilities will be located adjacent to the existing parking area north of the Morgantown site entrance roadway and railroad spur. The product silo will be 39 feet in diameter and 61 feet tall and the product storage dome will be 120 feet in diameter and reaches a height of 81 feet above grade before the rounded dome top begins, which stretches to a total height of 127 feet (Mirant’s response to Data Request No. 3, Question 3-19, received on July 14, 2010). The product storage dome has been sized to account for the seasonality of product ash sales, which are highest during the summer months when construction activities and, therefore, the demand for concrete peaks (Mirant’s response to PPRP Data Request No. 4, Question 4-10, received on August 18, 2010). The proposed STAR Facility, including the process reactor and storage silos and dome are illustrated in Figure 2-2.
Although Mirant intends to process and sell for beneficial reuse all fly ash produced by Morgantown and Chalk Point, if unforeseen circumstances arise, such as the inability to sell product ash once the storage dome reaches capacity or the inability to process ash in the STAR Facility, Mirant intends to send raw or product fly ash to the Brandywine facility or other facilities available and permitted to receive and dispose of fly ash (Mirant’s response to PPRP Data Request No. 3, Question 3-20, received on July 14, 2010). The management of fly ash at Morgantown will be subjected to existing MDE coal combustion by-product regulations under COMAR 26.04.10.01.
2.4.2 Proposed Project Water Requirements and Discharges
According to Mirant’s CPCN application (Mirant, 2010), the operation of the STAR Facility will require the use of additional surface water at Morgantown for the STAR FGD make-up and NOX process/quench water. This process water will be supplied from the existing Morgantown Units 1 and 2 FGD reverse osmosis (RO) system both directly and from a line off of the reagent preparation building. The NOX process/quench water is used to maintain the STAR thermal reaction temperature and to avoid slag formation and limit NOX emissions (Mirant’s response to PPRP Data Request No. 3, Question 3-17, received on July 14, 2010). In addition to the process water requirements, additional surface water will be needed intermittently for process equipment washdown, which will be sourced from raw Potomac River water and will be pulled from the existing River water intake pumps.
The proposed quantities of water required for the operation of the STAR Facility are as follows:

Figure 2-2
Morgantown Aerial Photograph with the
STAR Facility
Morgantown Generating Station
SITE LOCATION
REFERENCE Mirant’s CPCN Application (Mirant, 2010)
MD PPRP 2-9 Morgantown STAR ERD - Case No. 9229
STAR FGD process make-up water – 23.5 to 50 gallons per minute (gpm), with an average bleed rate of 30 gpm
NOX process/control quench water – 24 gpm
Process equipment washdown water – up to 50 gpm (intermittent)
Although water use associated with the proposed project will be sourced mainly from the Potomac River, Mirant is also proposing to use additional ground water. The operation of the STAR Facility will require 12 to 13 full-time equivalent employees, which necessitates the installation of approximately three new toilets, one shower, and six sinks. The new sanitary facilities are expected to use up to 15 gpm of ground water.
New wastewater streams will be generated due to the operation of the STAR Facility. Wastewater from intermittent equipment washdown, up to 50 gpm, will be collected in sumps and routed to Morgantown’s existing storm water collection system. Wastewater generated from the new bathroom/shower facilities will be routed to the site’s existing sanitary wastewater/sewage treatment facility. The STAR FGD wastewater, which will contain calcium carbonate, calcium sulfite, and calcium sulfate, will be rerouted back to the Morgantown Units 1 and 2 FGD scrubber vessel sump, where it will combine with the main system reagent and then be re-circulated in the scrubber vessel. Blowdown from the Units 1 and 2 FGD system will continue to be directed to the gypsum dewatering system and then to the FGD wastewater treatment system. The STAR FGD system is expected to result in an increase of 7,265 tons of gypsum per year, which is in addition to the Morgantown FGD system’s projected production of more than 700,000 tons of gypsum per year (Mirant’s response to PPRP Data Request No. 4, Question 4-12, received on August 18, 2010).

(This Page Intentionally Left Blank)

MD PPRP 3-1 Morgantown STAR ERD - Case No. 9229
3.0 EXISTING SITE CONDITIONS
3.1 CLIMATE AND AIR QUALITY
3.1.1 Weather and Climate
The discussion of climatology of the area is based primarily on data from Ronald Reagan Washington National Airport (DCA), which is the closest National Weather Service (NWS) station to the Morgantown site. The closest meteorological station to the site with upper air data is the NWS station at Sterling, Virginia. DCA climate data cited in this section is from the National Oceanic and Atmospheric Administration (NOAA, 1995), unless otherwise specified. DCA is located approximately 35 miles north of the Morgantown facility, and is considered representative of the area.
The climate in the vicinity of the Morgantown site is temperate with four defined seasons. According to the Maryland State Climatology Office (2006) the mean annual temperature in Maryland ranges from about 48°F in the Charles County area to 58°F in the lower Chesapeake Bay area. The average frost penetration in Charles County is approximately 5 inches or less, although in extremely cold winters, maximum frost penetration may be double the average depth. Summer is characterized by considerable warm weather including at least several hot, humid periods. The average length of the freeze-free season, based on a minimum temperature higher than 32°F, is approximately 230 days. The extreme temperatures in Maryland range from -40 to +109°F, each extreme occurring, on average, once every 75 to 100 years. Lowest yearly temperatures tend to occur in January, while highest temperatures occur in July and August.
The average annual precipitation in Charles County ranges between 40 and 46 inches. Distribution is quite uniform throughout the year on a state-wide basis, averaging between 2 and 4 inches each month except for a late spring and summer maximum of 4 to 5-1/2 inches. Thunderstorms are relatively common, occurring about 29 days during an average year. Thunderstorms have occurred throughout the year, but about 58 percent occur from June through August. Tornadoes are much rarer. In the Morgantown vicinity, there is a two percent chance of occurrence for tropical storms of hurricane strength. Tropical storms have generally approached the area during the period of late August to late October.
The average annual wind speed at DCA is 9.4 miles per hour. Based on wind data at DCA from 1991-1995, prevailing winds are from the south.
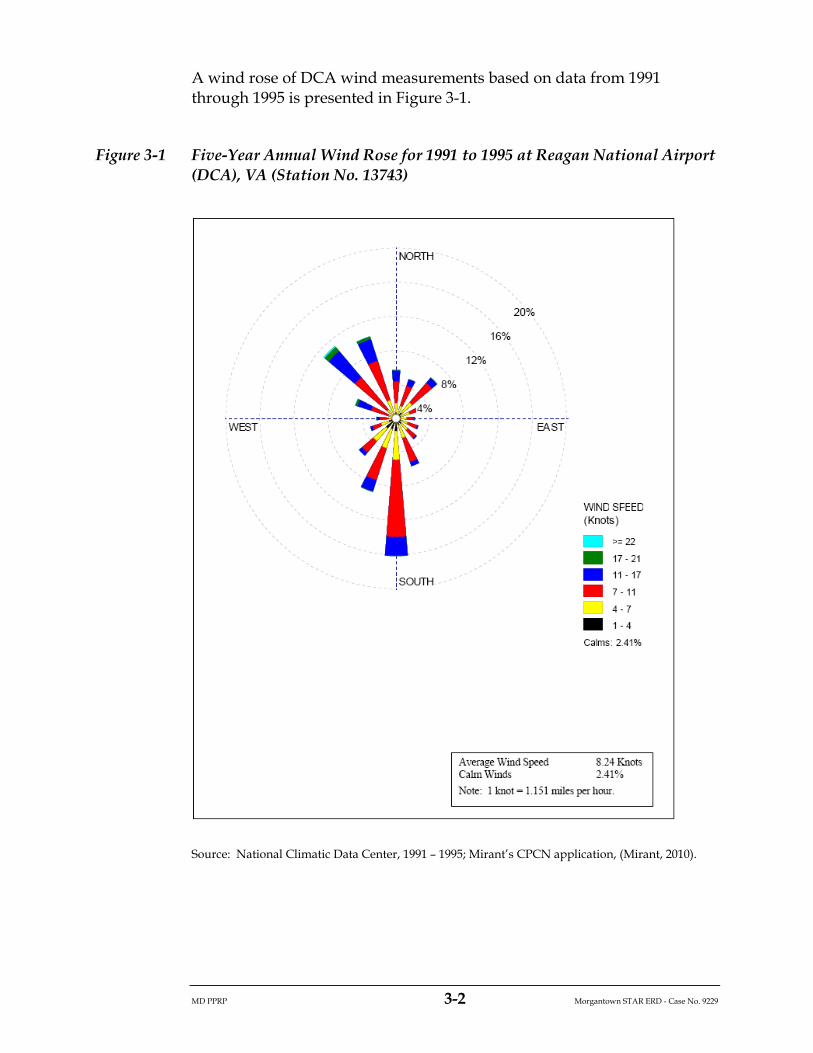
MD PPRP 3-2 Morgantown STAR ERD - Case No. 9229
A wind rose of DCA wind measurements based on data from 1991 through 1995 is presented in Figure 3-1.
Figure 3-1 Five-Year Annual Wind Rose for 1991 to 1995 at Reagan National Airport (DCA), VA (Station No. 13743)
Source: National Climatic Data Center, 1991 – 1995; Mirant’s CPCN application, (Mirant, 2010).

MD PPRP 3-3 Morgantown STAR ERD - Case No. 9229
3.1.2 Ambient Air Quality
3.1.2.1 Existing Ambient Air Quality Standards and Designations
MDE monitors concentrations of the “criteria” pollutants (NOX, SO2, PM, ozone, CO, and lead) at various locations across the United States near ground level. If monitoring indicates that the concentration of a pollutant exceeds the National Ambient Air Quality Standard (NAAQS) in any area of the country, that area is labeled a “nonattainment area” for that pollutant, meaning that the area is not meeting the ambient standard. Conversely, any area in which the concentration of a criteria pollutant is below the NAAQS is labeled an “attainment area” indicating that the NAAQS is being met.
The attainment/nonattainment designation is made by states and EPA on a pollutant-by-pollutant basis. Therefore, the air quality in an area may be designated attainment for some pollutants and nonattainment for other pollutants at the same time. For example, many cities are designated nonattainment for ozone, but are in attainment for the other criteria pollutants.
Since the late 1980s, the NAAQS for PM covered “PM10,” which represents PM less than 10 microns in diameter. In 1997, EPA revised the NAAQS for PM and added a standard for a new form of PM known as PM2.5, PM less than 2.5 microns in diameter. PM2.5, or “fine particulates,” are of concern because the particles’ small size allows them to be inhaled deeply into the lungs. In December 2004, EPA published its designations of PM2.5 nonattainment areas.
EPA and states make attainment designations based on air quality surveillance programs that measure pollutants in a network of nationwide monitoring stations known as the State and Local Air Monitoring Stations (SLAMS), National Air Monitoring Stations (NAMS), and Photochemical Monitoring Stations (PAMS) (EPA, 1998).
3.1.2.2 Local Air Quality
At the time of this case, all of the State of Maryland, including Charles County, is in attainment of the NAAQS for all criteria pollutants with the exception of ozone and PM2.5. Recently, EPA finalized two new short-term NAAQS, one for SO2 and the other for nitrogen dioxide (NO2), which could change the nonattainment area designation for some states in Maryland.

MD PPRP 3-4 Morgantown STAR ERD - Case No. 9229
Some counties in Maryland are designated ozone attainment areas and some are nonattainment areas; however, because ozone is a regional issue, EPA treats the northeastern United States, from northern Virginia to Maine, as an ozone nonattainment area known as the Northeast Ozone Transport Region. Charles County is a designated “moderate” ozone nonattainment area (on a scale that ranges from worst to best air quality of extreme – severe – serious – moderate – marginal).
Figure 3-2 illustrates ambient air quality monitoring stations in and adjoining to Charles County, operated under the SLAMS network. The monitoring data are maintained by EPA’s AIRS database and are available from the EPA website (EPA, 2010). Ambient monitored concentrations recorded at State-run monitoring stations near the Morgantown facility have been identified and are summarized in Table 3-1. The data summarized in this table represent maximum recorded values for ozone, PM2.5, SO2, and NOX for the time period 2006–2008. Table 3-1 displays data from monitoring stations with rural, suburban, urban and center city designations. Including data from different stations provides a broader range of existing conditions than selecting a single station.
Figure 3-2 Location of Pollutant Monitoring Stations In and Around Charles County
Location of Monitoring Stations surrounding the Morgantown Generating Station
0 10 20 30 40
Kilometers
MorgantownGenerating Station

MD PPRP 3-5 Morgantown STAR ERD - Case No. 9229
Table 3-1 Summary of Monitoring Data for Ozone and PM2.5 Near Morgantown
O3 O3 NO2 NO2 SO2 SO2 SO2 SO2 PM2.5 PM2.5
ppm ppm µg/m3 µg/m3 µg/m3 µg/m3 µg/m3 µg/m3 µg/m3 µg/m3
1-hr 8-hr 1-hr Annual 1-hr 3-hr 24-hr Annual 24-hr Annual
- - - 1 - 25 5 1 5 1
0.12 0.08 189 100 196 1300 365 80 150 50
County (l)
U.S. Geodetic Survey, Off Rt.2, Corbin
VA Rural Caroline Co 39.22 0.109 0.09 37.60 5.64 - - - - - -
Cub Run Lee Rd Chant.(Cubrun Treat Plant
VA Rural Fairfax Co 73.19 0.110 0.098 148.51 15.04 112.46 65.39 31.39 7.85 - -
Mt.Vernon 2675 Sherwood Hall Lane
VA Suburban Fairfax Co 43.55 0.143 0.125 - - - - - - - -
Sta. 46-B9, Lee Park, Telegraph Road
VA Suburban Fairfax Co 47.37 0.126 0.109 - - - - - - 46.4 12.71
6507 Columbia Pike VA Suburban Fairfax Co 55.64 0.127 0.102 122.19 28.20 162.16 120.31 60.16 13.08 42.8 13.26
517 N Saint Asaph St, Alexandria Health
VAUrban And Center City
Alexandria city 50.57 0.138 0.118 137.23 37.60 206.62 175.23 94.16 10.46 - -
NAAQS:
Location
Pollutant:
Units:
Averaging Time:
SIL:
(1) Approximate distance in kilometers from the project site to monitor site.
Source of monitored concentrations: EPA AIRS web site
3.2 WATER RESOURCES
3.2.1 Ground Water
The major aquifers beneath Morgantown include the Aquia, Magothy, and Patapsco, which are tapped by large volume municipal and industrial ground water production wells. In the case of the Aquia and Magothy formations, the term aquifer applies to the entire formation. The Patapsco has been further delineated into the upper and lower aquifer.
Ground water is used at Morgantown for boiler makeup, potable supply, and sanitary facilities. The Morgantown facility is currently authorized by MDE to withdraw ground water from four wells in the Potomac Group Sands for boiler makeup and miscellaneous operations [MDE Water Appropriation and Use Permit No. CH1967G011(10)]. The water appropriation limit allows for a daily usage of 700,000 gallons per day [0.7 million gallons per day (mgd)] on average of ground water, or the equivalent of 255 million gallons per year withdrawal. The annual water withdrawal at Morgantown (from June 2009 to June 2010) was approximately 205 million gallons, which translates to an average of about 561,000 gallons per day (Mirant’s response to PPRP Data Request No. 3, Question 3-15, received on July 14, 2010).
MD PPRP 3-6 Morgantown STAR ERD - Case No. 9229
The Morgantown facility also has authorization from MDE to withdraw ground water from one well in the Aquia Formation for potable supply and sanitary facilities at the Mirant combustion turbine yard [MDE Water Appropriation and Use Permit No. CH1986G015(08)]. The water appropriation limit allows for a daily usage of 200 gallons per day on average of ground water, or the equivalent of 73,000 gallons per year withdrawal. According to Mirant’s response to PPRP Data Request No. 5, Question 5-4 (received on September 8, 2010), the water withdrawal amounts for this permit are below the amounts required by MDE to be monitored and reported.
3.2.2 Surface Water
The Morgantown facility is located on the banks of the Potomac River (River), at a point where the river is approximately 1.5 miles wide. The average annual freshwater discharge is approximately 13,400 cubic feet per second (cfs), with a spring tidal flow of 220,000 cfs downstream during the ebb stage and upstream during the flood stage. Water depths in the River vary from approximately 82 feet midway in the channel to 10 feet at the channel edge. At the Morgantown facility, a dredged channel stretches a distance of 1,200 feet perpendicularly from the power plant and varies in width from 200 to 260 feet. It was originally dredged to a depth of 50 feet; however, a more recent hydrographic survey performed by Mirant shows that the channel is currently at a maximum depth of 40 feet.
Since 1985, continuous monitoring of selected water quality parameters, namely clarity, dissolved oxygen, salinity, temperature, and pH, has taken place in the Lower Potomac River at the Governor Harry W. Nice Memorial Bridge (http://mddnr.chesapeakebay.net). Water quality parameters for 2009 were typically within the minimum and maximum range of measured values, and were for the most part similar to the mean value calculated from data recorded during 1985 to 2009. Water clarity decreases in the spring and summer months most likely due to increased algae abundance. Dissolved oxygen also decreases in the summer months mainly because of the warmer water temperatures, which decrease the amount of oxygen that can be dissolved, and an increased abundance of algal blooms. Salinity is highly variable, but typically decreases in the spring months (April to June) due to increased freshwater flow. Water temperatures are higher in the summer months due to higher air temperatures and pH is relatively consistent through the year.
The Maryland DNR Chesapeake Bay Tributary Strategies, Lower Potomac River Team website (http://www.dnr.state.md.us/Bay/tribstrat/low_pot/lp_status_trends.h

MD PPRP 3-7 Morgantown STAR ERD - Case No. 9229
tml) shows water quality status for 2006 – 2008, as well as trends in water quality from 1995 to 2008. Total nitrogen in the Lower Potomac River near the Morgantown site has a status of “poor” for 2006 – 2008 with no discernable trend; however, the majority of the Lower Potomac River has a status of “fair” and has been improving overall. Water clarity also has a status of “poor” near the Morgantown site with no discernable trend; however, the majority of the Lower Potomac River has been given a “fair” status with some areas of improvement since 1995. Abundance of algae has a status of “poor” with no trend, but upstream areas have a “good” and “improving” status. Summer dissolved oxygen has a “fair” status near Morgantown, with downstream locations showing a status of “poor”. Upstream from Morgantown, the summer dissolved oxygen is generally “good” with no trends for improvement or degradation.
In 2006, the Potomac River was designated as an American Heritage River (Charles County, 2006). The Potomac River has been subdivided into upper, middle and lower basins. The 60-mile stretch of the Lower Potomac, which extends from the mouth of the river at the Chesapeake Bay to the U.S. 301 Bridge near Morgantown, is a broad tidal estuary. The area of Charles County along the River is mainly considered part of the Lower Tidal Potomac River Basin watershed. In the vicinity of the site, the river’s salinity rises and there is an associated increase in the presence of blue crabs and oysters (Mirant, 2010).
The two generating units at Morgantown use once-through cooling, in which water is continuously drawn from the Potomac River, used for process cooling, and then continuously returned to the River. Morgantown has a surface water appropriations permit [CH1956S003(09)] from MDE Water Management Administration (WMA) that allows for the withdrawal of 1,500 mgd from the Potomac River for cooling and process water, which equates to 547,500 million gallons per year. The annual water withdrawal at Morgantown (from June 2009 to June 2010) under that permit was about 386,712 million gallons, which translates to an average of approximately 1,060 gallons per day (Mirant’s response to PPRP Data Request No. 3, Question 3-15, received on July 14, 2010).
The Morgantown facility also has authorization from MDE-WMA to use Potomac River water for supplying the new FGD system, permitted under PSC Case No. 9085 [MDE Water Appropriation and Use Permit No. CH1967S111(02)]. The water appropriation limit allows for a daily usage of 3.44 mgd on average of River water, or the equivalent of 1,256 million gallons per year withdrawal. The annual water usage under this permit (from June 2009 to June 2010) was approximately 404 million gallons, which translates to an average of about 1.11 mgd (Mirant’s response to PPRP Data Request No. 3, Question 3-15, received on July 14, 2010).

MD PPRP 3-8 Morgantown STAR ERD - Case No. 9229
3.2.3 Potable Water Supply and Wastewater Treatment
Potable water is obtained from on-site wells under MDE Water Appropriation and Use Permit No. CH1986G015(08), described in Section 3.2.1. Sanitary wastewater is treated at an existing on-site sewage treatment plant.
3.2.4 Storm Water Management
The Morgantown facility currently discharges site storm water runoff to the Potomac River and to Pasquahanza Creek under the facility’s existing NPDES Permit No. MD000674 (State Discharge Permit No. 07-DP-0841). This permit regulates the discharge of biochemical oxygen demand (BOD5), total suspended solids (TSS), fecal coliform, total copper, total iron, oil and grease, pH, and thermal discharge. The NPDES permit for Morgantown was revised on October 2009 to include annual limits on nutrient discharges from the system treating wastewater from the FGD process. According to Mirant’s CPCN application (Mirant, 2010), the Morgantown facility has a good record of compliance with its NPDES permit conditions.
The facility’s existing Storm Water Pollution Prevention Plan (SWPPP) details methods that minimize discharges of potential contaminants from the Morgantown facility storm water runoff. All storm water runoff from industrial areas is collected and treated in storm water detention basins prior to discharge. The existing SWPPP employs Best Management Practices (BMPs) to minimize potential pollutant loading.
3.3 BIOLOGICAL RESOURCES
Biological resources include all plants and animals living in an area as well as the habitats they occupy; although some animals, such as migratory birds, may only be present seasonally. Plant species are collectively referred to as vegetation, whereas animals are referred to as wildlife. Habitat refers to the resources and environmental conditions present in an area that enable a species to persist in that area. Although the existence and preservation of biological resources are intrinsically valuable, biological resources also provide aesthetic, recreational, and socioeconomic values to society. This environmental review focuses on species or vegetation types that are important to the function of the ecosystem, of special societal importance, or are protected under federal or state regulations.

MD PPRP 3-9 Morgantown STAR ERD - Case No. 9229
The Morgantown Generating Station is located on a site of approximately 427 acres along the Potomac River in Charles County, Maryland. Mirant obtained the site from PEPCO, which still retains ownership of certain electrical substations and transmission lines and equipment located on approximately 166 acres of the site. Approximately half of the Morgantown Generating Station is found within the Chesapeake Bay Critical Area, which is defined as all land within 1,000 feet of mean high water (MHW) or the landward edge of tidal wetlands and all waters of and lands under the Chesapeake Bay and its tributaries. Any development within this area is required to minimize adverse impacts on water quality and conserve fish, wildlife, and plant habitats.
The following descriptions of existing biological resources at the site were drawn mainly from Mirant’s CPCN application (Mirant, 2010), as well as documentation from previous CPCN proceedings undertaken for the facility and a PPRP site visit to the facility conducted on August 25, 2010.
3.3.1 Vegetation Resources
The Morgantown site has been developed in most areas, with facility infrastructure, buildings, transmission lines, rail lines, and roads and parking areas occupying 70 percent of the site. Areas that have not been developed are distributed throughout the site, but occur mostly along the periphery, and include upland and wetland habitats. According to the Critical Area Inventory of the Morgantown Generating Station (PEPCO, 1991), vegetation on the site include upland communities of mixed hardwood forest, planted pines, mowed fields, and occasional areas of upland shrubs, and wetland communities of submerged aquatics, tidal marsh, rip-rap, freshwater marsh, wet meadow, and mixed wetland hardwood/coniferous forest.
3.3.1.1 Upland Communities
Upland vegetation occurs throughout much of the interior of the site, but wooded areas are found mainly along the perimeter.
Mixed hardwood forest. Areas of upland mixed hardwood forest are found adjacent to the tidal marsh of Pasquahanza Creek. The canopy is dominated by southern red oak (Quercus falcata), with a variety of subdominant species including northern red oak (Q. rubra), pin oak (Q. palustris), black gum (Nyssa sylvatica), American holly (Ilex opaca), persimmon (Diospyros virginiana), black cherry (Prunus serotina), dogwood (Cornus florida), post oak (Q. stellata), bitternut hickory (Carya cordiformis), yellow poplar (Liriodendron tulipifera), white oak (Q. alba), chestnut oak (Q. prinus), and red maple (Acer rubrum). Understory

MD PPRP 3-10 Morgantown STAR ERD - Case No. 9229
species include highbush blueberry (Vaccinium corymbosum), devil’s walking stick (Aralia spinosa), sassafras (Sassafras albidum), spicebush (Lindera benzoin), and wax myrtle (Myrica cerifera), with sparse groundcover comprised of partridge berry (Mitchella repens), sedges (Carex spp.), and spotted wintergreen (Chimaphila maculata).
Upland planted pines. A stand of planted Virginia pine (Pinus virginiana) is located directly south of the gas turbines at Morgantown. The sparse groundcover layer includes sensitive fern (Onoclea sensibilis), netted chain fern (Woodwardia areolata), marsh fern (Thelypteris thelypteroides), broomsedge (Andropogon virginicus), and partridge pea (Chamaecrista fasciculata).
Mowed fields. Mowed and open field areas are found throughout the Morgantown facility. These areas have been historically cleared, graded, and planted with grasses. Common species observed within the open field portions of the Site include a variety of grasses and sedges of the genera Dichanthelium, Cyperus, Panicum, Andropogon, and Setaria, as well as common weedy species.
3.3.1.2 Wetland Communities
Wetland vegetative communities at the site are associated primarily with the shores the Potomac River and along Pasquahanza Creek, which forms the southern boundary of the site.
Submerged aquatic vegetation. Areas of submerged aquatic vegetation (SAV) dominated by the exotic species Eurasian watermilfoil (Myriophyllum spicatum) and Elodea (Elodea sp.) occur within Pasquahanza Creek. Additional species include wild celery (Vallisneria americana), curly pondweed (Potamogeton crispus), and horned pondweed (Zanichellia palustris).
Tidal marsh. Tidal marsh habitat dominated by saltmarsh cordgrass (Spartina alterniflora) occurs along the southern boundary of the Morgantown site adjacent to Pasquahanza Creek. Additional species associated with the tidal marsh habitat include tall cordgrass (Spartina cynosuroides), swamp rose mallow (Hibiscus moscheutos), seashore mallow (Kosteletzkya virginica), tidemarsh amaranth (Acnida cannabina), saltmarsh aster (Aster tenuifolia), saltmarsh camphor-weed (Pluchea purpurascens), saltgrass (Distichlis spicata), saltmeadow cordgrass (Spartina patens), alkali bulrush (Scirpus robustus), halberdleaf saltbush (Atriplex patula), and common reed (Phragmites australis).
Rip-rap. The shoreline of the Potomac River has been altered through the addition of rip-rap and bulkheads. The shoreline vegetation is dominated by false indigo bush (Amporpha fruticosa) with additional

MD PPRP 3-11 Morgantown STAR ERD - Case No. 9229
species including groundsel tree (Baccharis halimifolia), low-tide bush (Iva frutescens), spanish needles (Bidens bipinnata), bearded beggar-ticks (Bidens artistosa), goldenrods (Solidago spp.), trailing wild bean (Strophostyles helvola), morning glory (Ipomea lacunosa), coastal searocket (Cakile edentula), rough cocklebur (Xanthium strumarium), clematis (Clematis dioscoreifolia), Korean bushclover (Lespedeza stipulacea), common reed (Phragmites australis), goose-foot (Chenopodium polyspermum), jimson-weed (Datura stramonium), eastern gama grass (Tripsacum dactyloides), and Virginia wild rye (Elymus virginicus).
Freshwater marsh. The ditch system that bisects the site is classified as a freshwater marsh, vegetated with common reed (Phragmites australis), cattails (Typha angustifolia and T. latifolia), wood reed-grass (Cinna arundinacea), sedges (Cyperus spp.), swamp spikerush (Eleocharis palustris), Canada rush (Juncus canadensis), soft rush (J. effusus), white cutgrass (Leersia virginica), green bulrush (Scirpus atrovirens), red wool-grass (Scirpus rubricosus), soft-stem bulrush (Scirpus validus), and several species of smartweed (Polygonum spp.).
Wet meadow. Areas of wet meadow occur southwest of the gas turbines, in low areas of the transmission line right-of-way (ROW), and between the coal pile and gas turbine areas. Vegetation is dominated by various grasses and asters, as well as common reed (Phragmites australis), beggar-ticks (Bidens spp.), Elliott’s goldenrod (Solidago elliottii), grass-leaf goldenrod (Solidago graminifolia), sedges (Cyperus spp.), and rushes (Juncus spp.).
Mixed wetland hardwood/coniferous forest. Areas of mixed wetland hardwood/ coniferous forest are located adjacent to Pasquahanza Creek between the U.S. Route 301 and the settling ponds. Canopy species include red maple (Acer rubrum), sweetgum (Liquidambar styraciflua), black willow (Salix nigra), southern red oak (Quercus falcata), black gum (Nyssa sylvatica), Virginia pine (Pinus virginiana), red cedar (Juniperus virginiana), and sycamore (Platanus occidentalis). Understory species include wax myrtle (Myrica cerifera), groundsel tree (Baccharis halimifolia), blueberry (Vaccinium sp.), sensitive fern (Onoclea sensibilis), royal fern (Osmunda regalis), marsh fern (Thelypteris thelypteroides), common reed (Phragmites australis), false nettle (Boehmeria cylindrica), and poison ivy (Toxicodendron radicans).
3.3.2 Wildlife
From field surveys conducted in association with the Critical Area Intensively Developed Overlay Zone Conservation Plan (PEPCO, 1991), wildlife species known to occur in the vicinity of Morgantown include a
MD PPRP 3-12 Morgantown STAR ERD - Case No. 9229
variety of species common to the deciduous forests of Maryland. The presence of riparian forests adjacent to the Potomac River and Pasquahanza Creek provides a suitable habitat for a variety of mammal and bird species.
3.3.2.1 Mammals
Mammals observed during previous field studies include species common to Maryland forests, including white-tailed deer (Odocoileus virginianus), raccoon (Procyon lotor), and eastern cottontail rabbit (Sylvilagus floridanus). Additional species expected to occur in the vicinity include gray squirrel (Sciurus carolinensis), muskrat (Ondatra zibethica), opossum (Didelphis virigniana), woodchuck (Marmota monax), Eastern chipmunk (Tamias striatus), deer mouse (Peromyscus maniculatus), white-footed mouse (Peromyscus leucopus), and a variety of moles and shrews. No mammals were observed at the site during a PPRP site visit on August 25, 2010.
3.3.2.2 Birds
Birds observed during previous field studies include belted kingfish (Ceryle alcyon), turkey vulture (Cathartes aura), double-crested cormorant (Phalacrocorax auritus), blue heron (Ardea herodias), mallard (Anas platyrynchos), scaups (Aythya sp.), red-shouldered hawk (Buteo lineatus), and several species of gulls (Larus sp.). Additional species anticipated include northern mockingbird (Mimus polyglottos), mourning dove (Zenaida macroura), American robin (Turdus migratorius), house sparrow (Passer domesticus), little blue heron (Egretta caerulea), brown thrasher (Toxostoma rufum), American crow (Corvus brachyrynchos), red-winged blackbird (Agelaius phoeniceus), barred owl (Strix varia), red-bellied woodpecker (Melanerpes carolinus), hairy woodpecker (Picoides villosus), and blue jay (Cyanocitta cristata). An area of the Potomac River approximately two to three miles south of the site is a waterfowl staging area. Habitat for Forest Interior Dwelling (FID) species of birds occurs along the edges of the site because it is contiguous with a greater expanse of forest from off of the property. Additional species of birds observed during a PPRP site visit on August 25, 2010 included osprey (Pandion haliaetus), Canada goose (Branta canadensis), and ring-billed gull (Larus delawarensis).
3.3.3 Threatened and Endangered Species
Threatened and endangered species of Maryland are protected by the U.S. Fish and Wildlife Service (USFWS) under the Endangered Species Act of 1973 and by the Maryland DNR under the Maryland Nongame and Endangered Species Conservation Act of 1975. In 1994, Maryland DNR’s

MD PPRP 3-13 Morgantown STAR ERD - Case No. 9229
Wildlife and Heritage Service (WHS) published “Rare, Threatened, and Endangered Plants of Maryland”, which listed both federal and State protected plant species as well as 770 additional species that are considered candidates for State listing (DNR, 1994). However, candidate species do not receive the same protections afforded to the State’s threatened and endangered species. In its application for CPCN, Mirant provided a copy of Current and Historical Rare, Threatened, and Endangered Species of Charles County, Maryland, which was obtained from the WHS in December 2007 (Mirant, 2010, Table 2.3-4). In April 2010, WHS updated the list for Charles County, which included several changes, most notably, the delisting of bald eagle as a State-threatened species.
3.3.3.1 Listed Animals
Twenty-six listed animal species, including 18 invertebrates, are currently listed as rare, threatened, or endangered in Charles County, Maryland (as of April 2010). Of these, six are State-listed endangered, three are State-listed threatened, and three are considered in need of conservation. Only one species, the dwarf wedge mussel (Alasmidonta heterodon), is federally listed as endangered. No listed animal species were reported by previous field surveys (Mirant, 2010).
As indicated in its application for a CPCN, Mirant requested an environmental review of the site from WHS in September 2006. The environmental review process is the primary method used to ensure that proposed projects do not jeopardize the continued existence of listed species of plants and wildlife. In correspondence received February 2007, the WHS indicated no State or federal records for rare, threatened, or endangered species within the project site, although species could be present if appropriate habitat was available. The project is limited to previously disturbed industrial areas, which do not provide suitable habitat for threatened or endangered species. Environmental review by the WHS and USFWS was also requested in 1989 in association with the Critical Area Intensively Developed Overlay Zone Conservation Plan. The USFWS responded that, with the exception of occasional transient individuals, no federally listed species were known to exist in the Project impact area. DNR identified a peregrine falcon (Falco peregrinus) nest site within ¼ mile of the site, and also identified the open water areas adjacent to the Project site as Historic Waterfowl Staging and Concentration Areas (Mirant, 2010).
MD PPRP 3-14 Morgantown STAR ERD - Case No. 9229
3.3.3.2 Listed Plants
Ninety-two plant species are currently listed as rare, threatened, or endangered in Charles County, Maryland (as of April 2010). Of these, 35 are State-listed endangered, 18 are State-listed threatened, and 9 are considered extirpated within the state. The remaining 30 species are not threatened or endangered, but are classified by the State according to their degree of rarity. Only one plant species found in Charles County, the sensitive joint-vetch (Aeschynomene virginica), is federally listed as endangered. No listed plant species were reported by previous field surveys, and earlier WHS and USFWS environmental reviews did not identify any listed species of plants at the site (Mirant, 2010).
3.3.4 Aquatic Resources and Wetlands
The Morgantown Generating Station is located along the eastern shore of the Potomac River in Charles County, Maryland. The river is tidal in this region, with brackish waters of 1 to 10 parts per thousand salinity (Lippson and Lippson, 2006). Pasquahanza Creek is a small creek that drains to the Potomac River and forms the southern boundary of the site. As indicated in Section 3.3.1.2, several types of wetlands occur along the margins of the river and creek. The aquatic habitats and wetlands are influenced by the brackish salinity and exhibit an estuarine ecology. Fish species occurring in the river and tidal portions of the creek are likely to be tolerant of a broad range of salinities (e.g., mummichog and killifish), and seasonally, would include anadromous species that migrate from downstream regions to spawn the brackish waters (e.g., striped bass, white perch). Blue crabs (Callinectes sapidus) are also likely to be most abundant in the river from spring to fall, and are an important commercial fishery to the region.
3.4 REGIONAL SOCIOECONOMIC SETTING
Charles County is part of Southern Maryland, bordering the Potomac River to the south and west, St. Mary’s County to the east, and Prince George’s County to the north. Washington, D.C. is 18 miles to the north. Within Charles County, the Morgantown Generating Station is located in the Tompkinsville election district, which also includes the communities of Morgantown, Cobb Island and Swan Point.
3.4.1 Population Trends
The eleventh most populous county in Maryland, Charles County had an estimated population of 144,950 in 2010, an increase of 20 percent from

MD PPRP 3-15 Morgantown STAR ERD - Case No. 9229
2000 (MDP, 2008). The county’s population is projected to grow to more than 204,000 by 2030. Population is most heavily centered near routes leading to Washington, D.C., most notably US 301. More than one-half (75,924) of the county’s 2010 population was concentrated in the Waldorf election district, and another 30 percent was located in Bryantown (14,372), Pomonkey (15,483) and La Plata (15,858). In comparison, population in the Tomkinsville election district was estimated to be 4,334 in 2010, up from 3,682 in 2000 (CCCC, 2006).
Table 3-2 Projected Population Distribution by Election District
Change 2005-2025
Election district
2000 2005 2010 2015 2020 2025 Number Percent
La Plata 12,053 14,526 15,858 18,121 20,384 23,779 9,253 64%
Hill Top 1,912 2,047 2,119 2,288 2,456 2,716 669 33%
Nanjemoy 3,169 3,323 3,406 3,478 3,550 3,687 364 11%
Allens Fresh 4,641 4,929 5,084 5,311 5,538 5,889 960 19%
Tomkinsville 3,682 4,046 4,334 4,503 4,971 5,408 1,362 34%
Waldorf 62,538 72,509 75,924 83,430 90,935 98,188 25,679 35%
Pomonkey 11,857 13,333 15,483 16,892 18,001 19,876 6,543 49%
Bryantown 12,616 13,646 14,372 15,991 17,609 19,630 5,984 44%
Hughesville 4,844 5,879 6,771 7,856 8,940 9,777 3,898 66%
Marbury 3,234 3,764 4,049 4,423 4,797 4,964 1,200 32%
Total 120,546 138,002 147,400 162,293 177,181 193,914 55,912 41%
Source: Charles County Department of Planning and Growth Management
Growth in the county is managed by policies that direct new development to locations where services can be provided efficiently, primarily areas already served or proposed to be served by public water and sewer. As a result and as shown in Table 3-2, most future population growth is expected to occur in the Waldorf and Pomonkey election districts and, to a certain extent, in the Bryantown and Marbury election districts. Waldorf’s population is forecast to increase 35 percent between 2005 and 2025, while a 64 percent increase in population is projected for La Plata. Over the same period, population is expected to grow by 49 and 44 percent in the Pomonkey and Bryantown election districts.
3.4.2 Employment and Income Trends
There is a net outflow of commuter traffic from Charles County. In 2000, more than three commuters living in Charles County traveled to
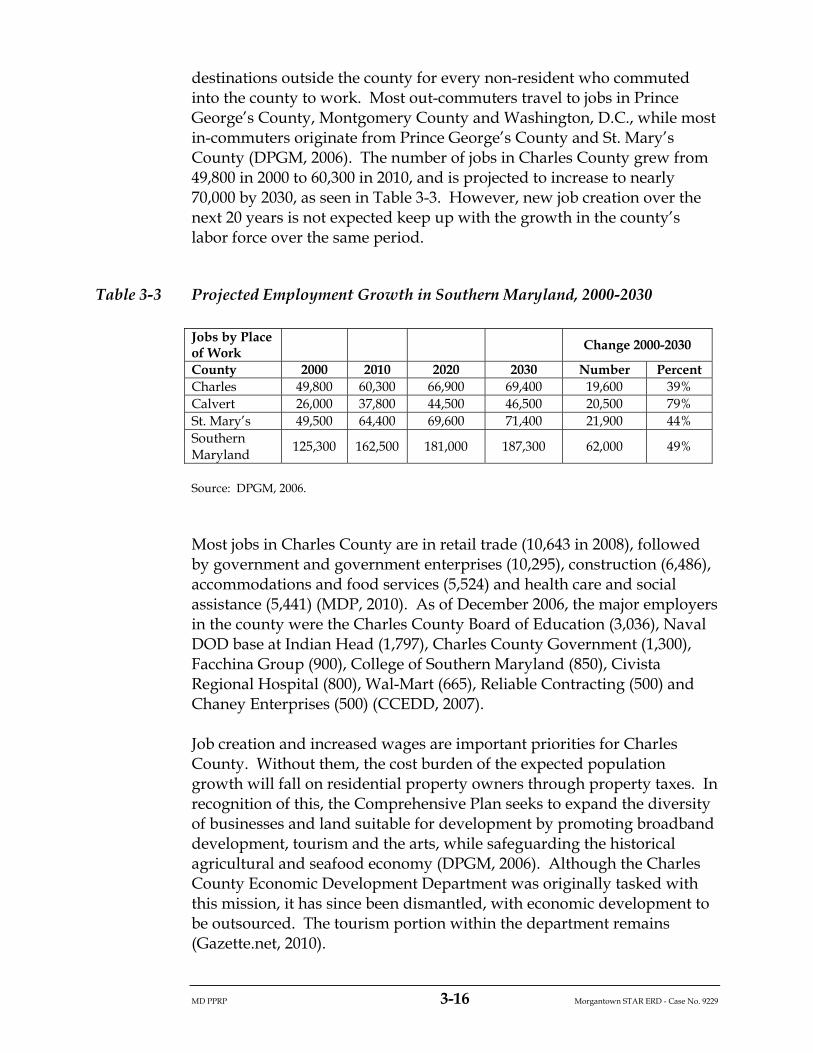
MD PPRP 3-16 Morgantown STAR ERD - Case No. 9229
destinations outside the county for every non-resident who commuted into the county to work. Most out-commuters travel to jobs in Prince George’s County, Montgomery County and Washington, D.C., while most in-commuters originate from Prince George’s County and St. Mary’s County (DPGM, 2006). The number of jobs in Charles County grew from 49,800 in 2000 to 60,300 in 2010, and is projected to increase to nearly 70,000 by 2030, as seen in Table 3-3. However, new job creation over the next 20 years is not expected keep up with the growth in the county’s labor force over the same period.
Table 3-3 Projected Employment Growth in Southern Maryland, 2000-2030
Jobs by Place of Work Change 2000-2030
County 2000 2010 2020 2030 Number Percent Charles 49,800 60,300 66,900 69,400 19,600 39% Calvert 26,000 37,800 44,500 46,500 20,500 79% St. Mary’s 49,500 64,400 69,600 71,400 21,900 44% Southern Maryland
125,300 162,500 181,000 187,300 62,000 49%
Source: DPGM, 2006.
Most jobs in Charles County are in retail trade (10,643 in 2008), followed by government and government enterprises (10,295), construction (6,486), accommodations and food services (5,524) and health care and social assistance (5,441) (MDP, 2010). As of December 2006, the major employers in the county were the Charles County Board of Education (3,036), Naval DOD base at Indian Head (1,797), Charles County Government (1,300), Facchina Group (900), College of Southern Maryland (850), Civista Regional Hospital (800), Wal-Mart (665), Reliable Contracting (500) and Chaney Enterprises (500) (CCEDD, 2007).
Job creation and increased wages are important priorities for Charles County. Without them, the cost burden of the expected population growth will fall on residential property owners through property taxes. In recognition of this, the Comprehensive Plan seeks to expand the diversity of businesses and land suitable for development by promoting broadband development, tourism and the arts, while safeguarding the historical agricultural and seafood economy (DPGM, 2006). Although the Charles County Economic Development Department was originally tasked with this mission, it has since been dismantled, with economic development to be outsourced. The tourism portion within the department remains (Gazette.net, 2010).

MD PPRP 3-17 Morgantown STAR ERD - Case No. 9229
The 1992 comprehensive rezoning of the county set aside land for commercial and industrial use and, since 1997, the business park land inventory has increased by approximately 600 acres. However, there are few improved business parks larger than 20 acres. Morgantown Generating Station is one of the county’s Employment and Industrial Parks, but is limited to further development because of its location. Broadband needs in Southern Maryland are also underserved (CCG, 2005).
The Charles County Department of Tourism remains focused toward enhancing tourist attractions. In 2008, tourism translated directly and indirectly to approximately 6,655 jobs (MDP, 2010). The unaudited 2007 Hotel/Motel and Admissions & Amusement tax revenue for Charles County amounted to $1,686,283 and the total local tourism tax revenue was $4,200,000 for 2005 (MTDB, 2007). More than $91 million in travel and tourism dollars were expended in Charles County in 2006, generating $22.55 million in payrolls and $4.45 million in local tax receipts (MOTD, 2007).
3.4.3 Land Use and Zoning
Over the past three decades, Charles County has urbanized, and assets such as natural areas, open spaces and shorelines have been threatened by sprawl. Since 1990, development has been guided by the Charles County Comprehensive Plan. Updated in 1997 and 2006, the Plan meets the State of Maryland’s mandate requiring local planning to manage future development. It provides a framework for developing Charles County through the year 2025 and includes capital improvement programs; the Chesapeake Bay Critical Area Program; Comprehensive Water and Sewer plans; Land Preservation, Parks and Recreation plans; subdivision regulations, Waldorf and Bryans Road-Indian Head sub-area plans; and zoning ordinances (DPGM, 2006). Other plans adopted as part of the Comprehensive Plan include the Hazard Mitigation Plan, the Historic Preservation Plan, the Solid Waste Management Plan and the Southern Maryland Heritage Area Heritage Tourism Management Plan. The Morgantown Generating Facility predates the County’s comprehensive planning process.
To preclude new developments from having detrimental effects upon public safety and health, the Charles County Zoning Ordinance has incorporated an Adequate Public Facilities standard which fosters development where public services already exist and mandates developer provided public services where current services or planned services are inadequate (DPGM, 2007). An Adequate Public Facilities Study

MD PPRP 3-18 Morgantown STAR ERD - Case No. 9229
concluding the sufficiency of water, schools and roads must accompany any site plan, subdivision or zoning permit.
The Charles County Chesapeake Bay Critical Area Program embodies the Maryland Critical Area Act passed in 1984. The focus of the program is to restrict and regulate development within 1,000 feet of the Mean High Water Line of the Chesapeake Bay and tributaries. The Critical Area Program is superimposed over the Chesapeake Bay Critical Area and is broken into three classifications based upon existing uses at the time the program was adopted: Intensely Developed Area (IDA), Limited Development Area (LDA) and Resource Conservation Area (RCA). An IDA is an area of at least 20 adjacent acres where little natural habitat occurs and where the predominant existing development is residential, institutional, commercial and/or industrial. An LDA comprises intermediate development intensity in areas that have some natural habitat and where the run-off condition has not been jeopardized. An RCA is primarily undeveloped natural habitat (DPGM, 2001). Any new development or redevelopment in an IDA must manage storm water practices to reduce post-development phosphorus loads to at least 10 percent below pre-development amounts. An area encompassing the Morgantown Power Generating Plant, Potomac Heights, Mattawoman Woods and a part of Clifton on the Potomac fronting US Route 301 is classified as an IDA (DPGM, 2001).
The Critical Area land mass in Charles County is approximately 30,424 acres, or 10 percent of the total county land. Of the 30,424 acres, 27,929 acres (91.7 percent) are in the RCA, including 5,347 acres of tidal wetlands. Another 2,271 acres (7.2 percent) are classified as LDA, and 278 acres (0.9 percent) are IDA. Critical Area development is restricted by a growth allocation that specifies the number of acres that can be converted from RCA to LDA and IDA or from LDA to IDA. Of the 1,129.1 acres Charles County is permitted to convert from RCA to LDA or IDA, 33.62 acres shared with Indian Head (which has its own Critical Area program), 1.43 acres to the Cobb Island Volunteer Fire Department (for redevelopment), 164.23 acres to the Villages at Swan Point (a waterfront residential development with commercial components in Newburg) and with the remaining 928.73 acres of growth allocation unassigned (DPGM, 2010).
Charles County is among Maryland counties with the least amount of protected agricultural land under permanent easement (CCCC, 2002). Table 3-4 provides a breakdown of the type and acreage of protected agricultural lands in the County. In 2006, there were 15,504 acres of agricultural and forest land permanently protected from development, and 17,932 acres in Agricultural Land Preservation Districts. Another 9,873 acres is held under a 10-year Tobacco Buyout Affirmative
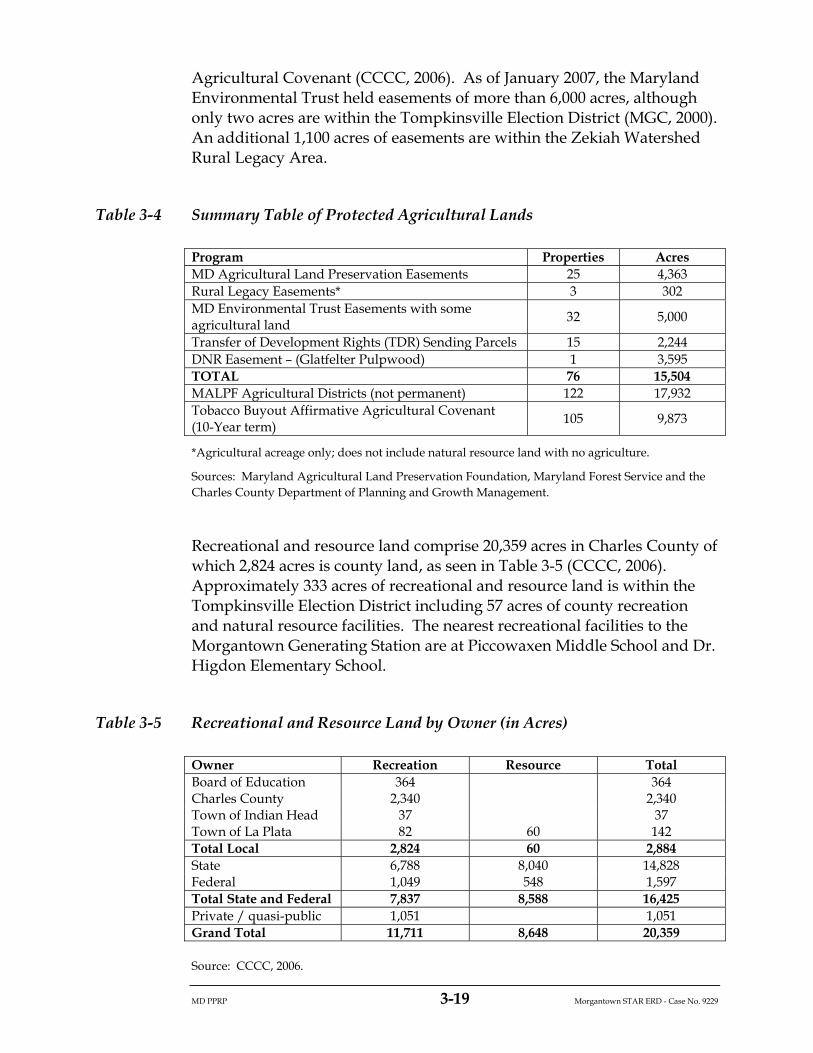
MD PPRP 3-19 Morgantown STAR ERD - Case No. 9229
Agricultural Covenant (CCCC, 2006). As of January 2007, the Maryland Environmental Trust held easements of more than 6,000 acres, although only two acres are within the Tompkinsville Election District (MGC, 2000). An additional 1,100 acres of easements are within the Zekiah Watershed Rural Legacy Area.
Table 3-4 Summary Table of Protected Agricultural Lands
Program Properties Acres MD Agricultural Land Preservation Easements 25 4,363 Rural Legacy Easements* 3 302 MD Environmental Trust Easements with some agricultural land
32 5,000
Transfer of Development Rights (TDR) Sending Parcels 15 2,244 DNR Easement – (Glatfelter Pulpwood) 1 3,595 TOTAL 76 15,504 MALPF Agricultural Districts (not permanent) 122 17,932 Tobacco Buyout Affirmative Agricultural Covenant (10-Year term)
105 9,873
*Agricultural acreage only; does not include natural resource land with no agriculture.
Sources: Maryland Agricultural Land Preservation Foundation, Maryland Forest Service and the Charles County Department of Planning and Growth Management.
Recreational and resource land comprise 20,359 acres in Charles County of which 2,824 acres is county land, as seen in Table 3-5 (CCCC, 2006). Approximately 333 acres of recreational and resource land is within the Tompkinsville Election District including 57 acres of county recreation and natural resource facilities. The nearest recreational facilities to the Morgantown Generating Station are at Piccowaxen Middle School and Dr. Higdon Elementary School.
Table 3-5 Recreational and Resource Land by Owner (in Acres)
Owner Recreation Resource Total Board of Education 364 364 Charles County 2,340 2,340 Town of Indian Head 37 37 Town of La Plata 82 60 142 Total Local 2,824 60 2,884 State 6,788 8,040 14,828 Federal 1,049 548 1,597 Total State and Federal 7,837 8,588 16,425 Private / quasi-public 1,051 1,051 Grand Total 11,711 8,648 20,359
Source: CCCC, 2006.

MD PPRP 3-20 Morgantown STAR ERD - Case No. 9229
3.4.4 Transportation
There are approximately 1,100 miles of highways in Charles County. The primary north-south artery is US 301 which enters from Virginia at the Governor Harry W. Nice Memorial Bridge and from Prince George’s County near Mattawoman. Another major north-south artery is MD 5 which traverses Charles County from Prince George’s County to St. Mary’s County.
The Morgantown Generating Station is accessed from US 301, a paved, four-lane highway with 12-foot lanes, just north of the toll plaza for the Governor Harry W. Nice Memorial Bridge. The average annual daily traffic (AADT) on US 301 at the toll plaza was 18,752 in 2009, and 21,834 at the intersection of MD 257 (SHA, 2010).
Traffic congestion is an on-going concern to the county, although most congestion issues are in the northern part of the county, particularly in Waldorf where commuter traffic volumes are highest. The safety and efficiency of many state highways has also been degraded by turning movements for commercial developments along these thoroughfares (CCCC, 2006).
Truck traffic from sand and gravel operations have also contributed to traffic volumes in the county. In January 2010, there were 34 permits issued to 11 operators in Charles County (MDE, 2010). To address the inevitable conflicts between population growth and truck traffic from surface mining operations, Charles County has amended zoning regulations to restrict the number of truckloads hauling materials from surface mining sites.
MD 257 (Rock Point Road) is a Maryland Scenic Byway and part of the Religious Freedom Tour (SHA, 2007). A Corridor Management Plan to promote, preserve and develop the byway was adopted by Charles County and St. Mary’s County commissioners in October 2008. The Religious Freedom Byway was designated a National Scenic Byway by the Federal Highway Administration on October 16, 2009.
The only major highway project on the books in the Morgantown area is a long-range planning study to increase the capacity of the Governor Harry W. Nice Memorial Bridge. Currently, the Maryland Transportation Authority is conducting studies to determine alternatives, investigate environmental and community impacts of the bridge, and gather public input. Project planning studies for the Nice Bridge Improvement Project are scheduled to continue through 2011 (MDTA, 2010).

MD PPRP 3-21 Morgantown STAR ERD - Case No. 9229
Charles County and the Morgantown Generating Facility are served by the Pope’s Creek Secondary, part of the CSX rail system. The tracks parallel US 301 through Waldorf and La Plata, terminating at the Morgantown Generating Station. At Brandywine in Prince George’s County, the CSX Herbert Secondary connects the Chalk Point Generating Station to the Pope’s Creek line. At White Plains, the CSX main line links to a dormant U.S. Government railway that leads to the Naval Surface Warfare Center Indian Head Division.
3.4.5 Cultural Resources
A wealth of historical resources is located throughout Charles County. Over 3,000 properties predate 1950. Waverly is a National Register property which is situated downriver from Morgantown. There are subterranean and sub aquatic archaeological sites from colonial times as well as from pre-historic Native American occupation. However, many heritage resources are threatened by growth.
The Charles County Historic Preservation Plan (CCCC, 2004) is the primary County document for enumerating preservation goals and strategies to foster conservancy and bolster tourism. These goals have been addressed in the Southern Maryland Heritage Area Tourism Management Plan, the Maryland State Highway Administration Scenic Byways program, the Chesapeake Bay Gateways Network, the National Park Service National Underground Network to Freedom, the Southern Maryland Travel and Tourism Committee Bicycle Routes program, and efforts of the State of Maryland and Charles County, as well as quasi-public and private concerns.
The Southern Maryland Heritage Area Tourism Management Plan (SMHA, 2003) is a major blueprint for highlighting the region’s cultural heritage. It defines five key resources – archaeological, architectural, cultural, historic, area natural and environmental – that puts Southern Maryland’s history and character into context. It identifies a Certified Heritage Area (CHA) of eleven distinct clusters containing a concentration of heritage resources, existing or proposed interpretive facilities, and significant lands protected by federal, State and County ownership or easements. These clusters are connected by corridors comprising scenic byways, trials and waterways. The plan identifies key themes to guide visitors through Southern Maryland’s history and identity and, importantly, stewardship principles for sustaining and enhancing the region’s heritage tourism initiative. Following the recommendations of the Southern Maryland Heritage Area Tourism Management Plan, the Maryland Heritage Areas Authority (MHAA) certified the Southern Maryland Heritage Area in July 2003, pending provision of additional

MD PPRP 3-22 Morgantown STAR ERD - Case No. 9229
performance measurement benchmarks. These conditions were satisfied in December 2004.
Many of the Southern Maryland heritage initiatives involve transportation. Southern Maryland Heritage Driving Tours wander throughout Charles, St. Mary’s and Calvert counties employing various themes to direct tourists to interpretive sites, museums and festivals. There are also four Charles County bicycle routes that have been identified by the Southern Maryland Travel and Tourism Committee.
There are many federal heritage initiatives in Charles County. Created by the Chesapeake Bay Initiative Act of 1998, the Chesapeake Bay Gateways Network (CBGN) is a system of parks, refuges, museums, historic sites and water trails within the Chesapeake watershed region. Charles County hosts a gateway at the Smallwood State Park on the Nanjemoy Peninsula upriver from Morgantown, and the Potomac River Water Trail follows the Maryland and Virginia shorelines from Washington, D.C. to the Chesapeake Bay. The Potomac Heritage National Scenic Trail, administered by the National Park Service, is an evolving network hiking trails between Chesapeake Bay and the Allegheny Highlands, and includes the Potomac Heritage Trail (PHT) route in tidal Maryland. The Captain John Smith Chesapeake National Historic Trail incorporates the routes of Captain Smith’s two journeys about the Bay in 1608 and includes tributaries of the Potomac River in Charles County. The Thomas Stone National Historic Site, located north of Port Tobacco, honors the life and work of Thomas Stone, signer of the Declaration of Independence. The Potomac River, from its confluence with the Chesapeake Bay to the Fort Washington Park, is listed on the National Rivers Inventory for its scenic, recreational and cultural values. Other federal, State, County, local and private cultural resources in Charles County are too numerous to mention.
Across the Potomac River in Virginia’s Northern Neck is the Route 3 Historic Corridor. Cultural resources within the corridor include the George Washington Birthplace National Monument, “Stratford”, the Lee family plantation, and Westmoreland State Park. Wayside Park and Barnesfield Park are recreational parks in King George County across the river from Morgantown. Further upriver around Mathias Point is the Caledon Natural Area which offers one of the largest concentrations of bald eagles along the Atlantic Coast (Virginia Tourism Corporation, 2010).
3.4.6 Public Services and Safety
The Mattawoman Wastewater Treatment Plant services the Development District and is the primary treatment facility in the county. In addition, there are two municipal sewer systems in Indian Head and La Plata.
MD PPRP 3-23 Morgantown STAR ERD - Case No. 9229
There are five public community systems located at Cobb Island, Clifton-on-the-Potomac, Jude House/Bel Alton School, Mt. Carmel Woods and Swan Point, and there are two private community systems located at Hughesville and Potomac Heights, which discharge into the Mattawoman Wastewater Treatment Plant. Institutional/Governmental wastewater systems are found at Board of Education-operated facilities, the College of Southern Maryland, the Naval Surface Warfare Center, and the Southern Maryland Correctional Institutional (CCCC, 2006).
Except for a limited supplementary source from the Washington Suburban Sanitary Commission, ground water is the only source of potable water for Charles County. Water is provided through 34 municipal/public systems, 33 private community systems and three institutional/governmental systems. Almost half of the population of Charles County is served by the municipal/public systems (CCCC, 2006). The Morgantown Generating Station is within one of the county’s service areas.
Solid waste management is guided by the County’s 10-year Comprehensive Solid Waste Management Plan (CCCC, 2001). Most of the solid waste generated in the county is landfilled at the Charles County Landfill, located on Billingsley Road in Waldorf. Approximately 30 percent of solid waste is exported to landfills in Virginia and Pennsylvania. The Billingsley Road landfill is not expected to reach capacity until after 2025. The Plan estimates that 112,000 to 122,000 tons of waste is generated annually in Charles County. Nearly 60 percent of this amount is household waste and half of that waste is yard refuse. The county generates another 27 percent from commercial and industrial sources (CCCC, 2006).
There are 21 elementary schools, eight middle schools and six high schools in Charles County (CCBOE, 2010). The St. Charles High School, with a capacity of 1,600 students, is scheduled to open in 2013. The Dr. Thomas L. Higdon Elementary School and the Piccowaxen Middle School are the nearest schools to the Morgantown Generating Station.
There are 18 fire and fire/emergency medical services stations in Charles County plus one Mobile Intensive Care Unit. The Newburg Volunteer Rescue Squad and Fire Department, Station 14/61, is less than three miles from the Morgantown Generating Station. The company’s apparatus consist of two engines, two ambulances, two brush trucks, two utility vehicles and a boat (Warring, 2010). The Cobb Island Volunteer Fire Department & Emergency Medical Service and the Bel Alton Volunteer Fire Department are the general vicinity. Based on data for the fiscal year 2010, the Newburg Volunteer Rescue Squad and Fire Department

MD PPRP 3-24 Morgantown STAR ERD - Case No. 9229
responded to 417 fire and 658 emergency medical service incidents from June 2009 to July 2010 (CCDES, 2010). The Charles County Dive Team Company 13, which has its administrative offices in Waldorf, facilitates water rescue and recovery.
Law enforcement is administered by the Charles County Sheriff’s Office and the Maryland State Police headquartered in La Plata. The primary enforcement responsibility falls to the Charles County Sheriff’s Office, which provides both full service policing services, court related services and operates the Charles County Detention Center, a 135,000 square feet facility with 203 cells (CCSO, 2009). As of 2008, there were more than 600 sworn corrections and civilian personnel in the Charles County Sheriff’s Office. There are also 28 uniformed personnel assigned to the Maryland State Police Barrack H La Plata, with 20 assigned as road personnel (Wilson, 2010). La Plata is served by a police department with 16 officers (Gittings, 2010).
Emergency management is under the direction of the Department of Emergency Services, based in La Plata. Charles County completed a Hazard Mitigation Plan in 2006 (Greenhorne & O’Mara, 2006). It is a strategic document that evaluates potential exposure to natural hazards and prescribes measures to avoid future damage or loss of life. The county’s Emergency Operations Plan (EOP) was revised in August 31, 2007. The EOP is a comprehensive plan of preparedness for response and recovery from emergencies ranging from nuclear and radiological accidents, hurricanes and tropical storms, earthquakes, dam failure and civil disturbance (CCCC, 2007). The plan is implemented through the Office of Emergency Preparedness (OEP). The Charles County Chemical Emergency Response and Preparedness Plan is a preparedness, prevention and mitigation document addressing threats to the public due to hazardous materials incidents (CCCC, 2009).
The Morgantown Generating Station is on Charles County’s list of SARA Title III facilities, which is addressed in the SARA Hazardous Materials Plan Annex of the Emergency Operations Plan. Between the Governor Harry W. Nice Memorial Bridge and the Prince George’s County line, US 301 is one of five Hazardous Materials transportation routes in the county, and the closest one to the Morgantown Generating Station.
Civista Medical Center, the only hospital in Charles County, is a 130-bed general medical and surgical facility offering complete inpatient services (Civista Health, 2010). Two hospitals in Prince George’s County, Southern Maryland Hospital and the Fort Washington Medical Center, and one in St. Mary’s County, St. Mary’s Hospital, also provide medical services to Charles County residents.

MD PPRP 4-1 Morgantown STAR ERD - Case No. 9229
4.0 AIR QUALITY IMPACTS
4.1 IMPACT ASSESSMENT BACKGROUND AND METHODOLOGY
As part of the CPCN application process, PPRP, in conjunction with the Maryland Department of the Environment’s Air and Radiation Management Administration (MDE-ARMA), evaluates potential impacts to air quality resulting from emissions of projects to be licensed in Maryland under COMAR 20.80. This evaluation includes emissions investigations and other studies, including air dispersion modeling assessments, to ensure that impacts to air quality from the proposed projects are acceptable. PPRP and MDE-ARMA also conduct a complete air quality regulatory review for two purposes: 1) to assist in the impact assessment, because air quality regulatory standards and emissions limitations define levels to protect against adverse health, welfare, and environmental effects; and 2) to ensure that the proposed project will meet all applicable regulatory requirements.
To conduct the air quality assessment of the proposed Morgantown STAR Facility, PPRP and MDE-ARMA evaluated projected potential air pollutant emissions to ensure that the project will meet applicable regulatory thresholds and limits. The proposed project was also evaluated to determine whether its emissions would have any significant impacts on the existing ambient air quality in the region. This was completed through air dispersion modeling that predicts the ambient air concentrations resulting from source emissions.
The Air Quality Impacts section of this document provides a detailed description of the proposed project (Section 4.2), summarizes the assessments PPRP has conducted to verify projected potential emissions from the proposed Morgantown STAR Facility (Section 4.3); determines applicable federal and State air quality regulatory requirements (Section 4.4); and assess impacts to air quality from potential air emissions as a result of the Morgantown STAR Facility (Section 4.5). The results of the technical and regulatory evaluations discussed in this section were used by PPRP and MDE-ARMA to develop the initial recommended licensing conditions found in Appendix A and the final licensing conditions in Appendix D. Supporting tables to the potential emissions calculations performed by PPRP are provided in Appendix B. Selected responses to PPRP Data Requests are included in Appendix C.

MD PPRP 4-2 Morgantown STAR ERD - Case No. 9229
4.2 DESCRIPTION OF PROPOSED PROJECT
As described in Section 2.4, the proposed modification of the Morgantown facility involves the installation of an ash beneficiation facility, using proprietary STAR technology, to process fly ash into a low-carbon mineral admixture material suitable for commercial use. The STAR Facility will process approximately 360,000 tons of fly ash per consecutive 12-month period, rolling monthly from, at minimum, fly ash combusted from boiler Units 1 and 2 from the Morgantown Generating Station as well as boiler Units 1 and 2 from Mirant’s Chalk Point Generating Station. The ash beneficiation process involves thermal processing of the ash to oxidize residual carbon that does not oxidize during combustion in the Morgantown or Chalk Point boilers. To support the thermal processing involved with the ash beneficiation process, the project also includes the installation of new combustion equipment. No physical changes to existing boiler units are proposed. The State has reviewed and evaluated the air emissions sources associated with the proposed operations. This evaluation assumes that the proposed project is not part of any other recently proposed and licensed projects, including the Barge Unloader (Case 9031), the Healthy Air Act FGD systems project (Case 9085), or the Coal Blending/Gypsum Loadout facilities (Case 9148).
The new ash beneficiation facility consists of a proprietary ash beneficiation process known as STAR technology developed by SEFA. Currently, there is only one other facility of this kind, which is located at the McMeekin Generating Station in Columbia, South Carolina. The South Carolina STAR Facility is approximately one-third the size and processes one-half the throughput of the proposed Morgantown STAR Facility at 50 MMBtu/hr and 173,900 tons of fly ash per year, respectively.
The proposed STAR Facility will result in new equipment and emission points. To avoid major modification, the project is designed to process approximately 360,000 tons of fly ash per consecutive 12-month period, rolling monthly (from the Morgantown, Chalk Point, and Dickerson generating stations), and will involve the use of Morgantown’s existing fly ash handling system to transfer raw fly ash to the new STAR Facility ash processing area.
4.2.1 Proposed Ash Beneficiation Facility
The STAR Facility will thermally process high-carbon fly ash produced on-site at Morgantown (conveyed directly from the Morgantown electrostatic precipitators and fly ash storage silos), or fly ash produced off-site and transported by truck to Morgantown for processing. The
MD PPRP 4-3 Morgantown STAR ERD - Case No. 9229
high-carbon fly ash will be the raw feed material and the primary fuel for the reactor’s proposed 140 MMBtu/hr thermal processing unit. The ash beneficiation project components include:
Pneumatic ash transfer system from existing storage silos to new STAR processing area, including various transfer vessels;
STAR process reactor fly ash feed silo and silo bin vent filters capable of accepting off-site material;
140-MMBtu/hr STAR process reactor and components with supplemental propane firing of up to 65 MMBtu/hr (three at 15 MMBtu/hr plus a duct burner at 20 MMBtu/hr);
STAR process fabric filter baghouse where solid particulate concentration of the effluent from the baghouse shall be no greater than 50 mg/Nm3;
Wet FGD scrubber system where SO2 outlet emissions shall be reduced by 98.3 percent, or have an outlet loading of 9 lb/hr, whichever is less stringent;
Product silo and storage dome, along with associated bin vents;
Product loadout facilities; and
Process controls, including Continuous Emissions Monitoring System (CEMS).
The project will also include equipment to facilitate truck unloading of fly ash from off-site sources to the STAR process reactor feed bin.
In the evaluation of emissions sources, the proposed ash beneficiation facilities will consist of six primary operations that will result in both fugitive and point source emissions:
The transfer operations associated with feeding raw fly ash to the STAR process reactor for processing and from transferring processed fly ash to storage and loadout equipment.
The unloading operations associated with the delivery of fly ash from off-site sources to the STAR process reactor feed bin;
The loadout operations associated with loading product ash from product storage to truck;
The truck traffic associated with raw fly ash deliveries to Morgantown from off-site for processing as well as the transport of processed fly ash from Morgantown off-site;
The operation of the STAR process reactor; and

MD PPRP 4-4 Morgantown STAR ERD - Case No. 9229
Operating the ash and product silos and storage dome and associated bin vents.
For the purpose of evaluating emissions from the ash beneficiation facility, a process flow diagram for the project is presented in Figure 4-1. The diagram shows each emission point associated with the project. As shown, fly ash will be pneumatically conveyed from Morgantown’s existing storage silos or delivered by truck to a reactor feed bin, and then fed to the STAR process reactor for thermal processing. During start-up, the combustion air is heated with a start-up burner firing auxiliary fuel (propane fuel). Propane and fly ash are then co-fired until the reactor reaches fly ash auto-ignition temperatures of approximately 1,400oF. Upon auto-ignition, the residual carbon in the fly ash reacts with combustion air and becomes the heat source for the self-sustaining process. Under certain conditions, supplemental propane fuel may be co-fired with the residual carbon in the fly ash. The processed fly ash is entrained with the combustion air and exits the top of the reactor vessel. After passing through a hot cyclone and a series of process heat exchangers, the cooled flue gas (between 300 and 400 oF) then enters a baghouse for removal of the product ash. The product ash is then pneumatically conveyed from the baghouse to a storage silo for product loadout, or conveyed to a product storage dome. The ash storage dome and silos are equipped with bin vent baghouses (fabric filters) to control PM emissions. The exhaust gases exiting the baghouse will then be directed to a new FGD system to reduce SO2 emissions prior to being vented to the atmosphere through a stack at a height of 125 feet. The emission points associated with batch drop transfer operations and silo bin vents from the proposed operation include:
PA1 – Enclosed transfer of fly ash from ESPs to the existing two fly ash silos;
PA2 – Enclosed transfer of fly ash from the fly ash silos to the ash reactor feed bin;
PA3 – Enclosed transfer of fly ash from the ash reactor feed bin to the STAR process reactor;
PA4 – Enclosed transfer of processed fly ash from baghouse to the product storage dome;
PA5 – Enclosed transfer of product from the storage dome to product load out silo;
PA6 – Enclosed transfer of product from product load out silo to product trucks;

MD PPRP 4-5 Morgantown STAR ERD - Case No. 9229
PA7 – Enclosed transfer of product from baghouse to an existing Morgantown storage silo (emergency operation only);
CA1 – Transfer of raw fly ash delivered from off-site truck to the ash reactor feed bin;
V1 – Bin vent from existing silo 1;
V2 – Bin vent from existing silo 2;
V3 – Bin vent from new reactor feed bin;
V4 – Bin vent from new product load out silo; and
V5 – Bin vent from new product storage dome.
Figure 4-1 Process Flow Diagram for Proposed Ash Beneficiation Project
SiloSilo
SiloSilo
Ash Feed Bin
PA1 PA1
PA2
STAR Reactor
PA3
Storage Dome
BagHouse
FGD
PA4
Product Load out
Silo
PA5
PA6
PA7
Fly Ash Delivery
CA1
V2V1
V5
V3
V4
TruckLoad out
Fly Ash From ESP
Emergency Ash Return
FGD Flue Gas

MD PPRP 4-6 Morgantown STAR ERD - Case No. 9229
4.2.2 Existing Fly Ash Handling Facilities
The existing fly ash handling operations at Morgantown consists of fly ash collection at the ESPs, transporting the collected fly ash to two existing storage silos, and fly ash loading to trucks from the silos for transport to off-site landfills. Currently, the silos discharge to dump trucks through three Allen Shermon Hoff wet ash unloaders and to dry tanker trucks via a Midwest Vacupac dry ash unloader. Emissions from these existing operations include: fugitive particulate emissions from ash transfer operations (batch drop); truck traffic associated with ash transport to off-site landfills; and point source particulate emissions from silo bin vents. The emission points associated with batch drop transfer operations and silo bin vents include the following:
EA1 – Transfer of fly ash to the existing two silos;
EA2 – Allen Sherman Hoff wet ash unloader;
EA3 – Midwest Vacupac dry ash unloader;
V1 –Bin vent filter on existing silo 1; and
V2 –Bin vent filter on existing silo 2.
Although these emissions sources are part of the fly ash material handling at the Morgantown Generating Station, because the sources are existing operations, these sources are not included in the total project potential emissions. A process flow diagram of existing facility transfer sources is shown in Figure 4-2.

MD PPRP 4-7 Morgantown STAR ERD - Case No. 9229
Figure 4-2 Process Flow Diagram for Existing Fly Ash Handling Facility
4.3 PROPOSED PROJECT SOURCE CHARACTERIZATION
4.3.1 Potential Emissions from the Project
The primary emissions associated with the proposed STAR Facility will consist of point source emissions from a proposed 125-foot exhaust stack from the operation of the STAR process reactor ash beneficiation process. The STAR process reactor will be a source of the following pollutants: SO2, NOX, carbon monoxide (CO), PM, PM10, PM2.5, volatile organic compounds (VOCs), SAM, and lead resulting from the combustion of fly ash and combustion of propane fuel during periods of STAR process reactor start-up or shutdown.
In addition to emissions from the STAR process reactor, the proposed STAR Facility will be a source of fugitive PM, PM10, and PM2.5 emissions resulting from the following activities:
The transfer operations associated with feeding raw fly ash to the STAR process reactor for processing and from transferring processed fly ash to storage and loadout equipment.
The unloading operations associated with the delivery of fly ash from off-site sources to the STAR process reactor feed bin;
SiloSilo
SiloSilo
EA1 EA1
EA2/EA3
V2V1
TruckLoad out
Fly Ash From ESP

MD PPRP 4-8 Morgantown STAR ERD - Case No. 9229
The loadout operations associated with loading product ash from product storage to truck;
The truck traffic associated with raw fly ash deliveries to Morgantown from off-site for processing as well as the transport of processed fly ash from Morgantown off-site; and
Operating the ash and product silos and storage dome and associated bin vents.
PM, PM10, and PM2.5 emissions presented throughout this ERD represent total particulate, inclusive of filterable and condensable particulate emissions.
Because fly ash contains small quantities of naturally occurring metals and organics, the project, from both the STAR process reactor combustion and material handling activities, will also be a source of hazardous air pollutants (HAPs) or toxic air pollutants (TAPs) (see Sections 4.3.6 and 4.3.7, respectively).
Mirant presented estimates of emissions from the project, along with the assumptions made to determine those emissions estimates, in its CPCN application (Mirant, 2010), its CPCN application amendment (dated July 20, 2010), and responses to PPRP Data Requests. As part of Mirant’s response to PPRP Data Request No. 1, Question 1-3 (received on May 27, 2010), Mirant provided stack test results concerning the project (TRC, 2009). Sampling was conducted at the South Carolina SEFA STAR Facility while the reactor was processing a sample of fly ash from the Morgantown Generating Station. The 2009 TRC Emission Test Report summarizes the results and conditions of the stack testing. In addition to the 2009 TRC Report, Mirant used information from vendor guarantees, EPA guidance, and information obtained from SEFA to estimate emissions for the proposed STAR Facility.
PPRP and MDE-ARMA used the information provided in Mirant’s submissions to estimate and verify projected emissions. A summary of the potential short-term emissions in pounds per hour (lb/hr), and annual emissions in tons per year (tpy), is presented in Tables 4-1 and 4-2, respectively, for all STAR Facility activities. Appendix B provides PPRP’s detailed calculations for the STAR Facility potential emissions estimates.
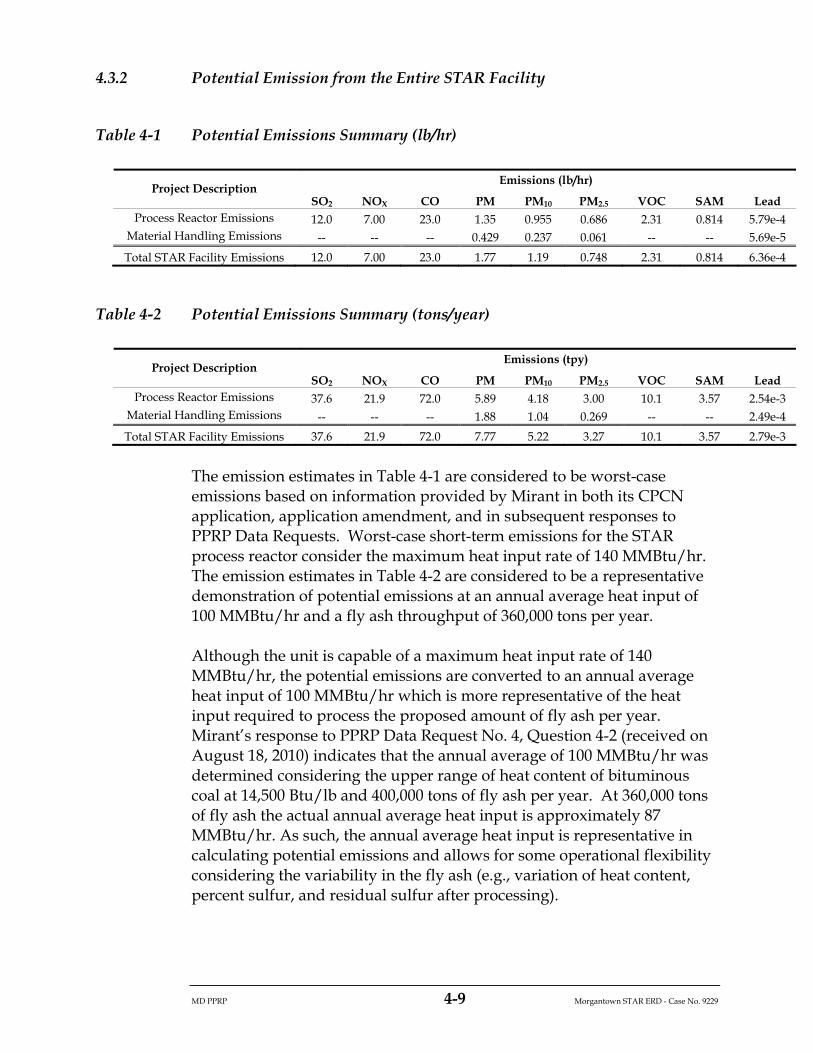
MD PPRP 4-9 Morgantown STAR ERD - Case No. 9229
4.3.2 Potential Emission from the Entire STAR Facility
Table 4-1 Potential Emissions Summary (lb/hr)
Emissions (lb/hr) Project Description
SO2 NOX CO PM PM10 PM2.5 VOC SAM Lead Process Reactor Emissions 12.0 7.00 23.0 1.35 0.955 0.686 2.31 0.814 5.79e-4
Material Handling Emissions -- -- -- 0.429 0.237 0.061 -- -- 5.69e-5
Total STAR Facility Emissions 12.0 7.00 23.0 1.77 1.19 0.748 2.31 0.814 6.36e-4
Table 4-2 Potential Emissions Summary (tons/year)
Emissions (tpy) Project Description
SO2 NOX CO PM PM10 PM2.5 VOC SAM Lead Process Reactor Emissions 37.6 21.9 72.0 5.89 4.18 3.00 10.1 3.57 2.54e-3
Material Handling Emissions -- -- -- 1.88 1.04 0.269 -- -- 2.49e-4
Total STAR Facility Emissions 37.6 21.9 72.0 7.77 5.22 3.27 10.1 3.57 2.79e-3
The emission estimates in Table 4-1 are considered to be worst-case emissions based on information provided by Mirant in both its CPCN application, application amendment, and in subsequent responses to PPRP Data Requests. Worst-case short-term emissions for the STAR process reactor consider the maximum heat input rate of 140 MMBtu/hr. The emission estimates in Table 4-2 are considered to be a representative demonstration of potential emissions at an annual average heat input of 100 MMBtu/hr and a fly ash throughput of 360,000 tons per year.
Although the unit is capable of a maximum heat input rate of 140 MMBtu/hr, the potential emissions are converted to an annual average heat input of 100 MMBtu/hr which is more representative of the heat input required to process the proposed amount of fly ash per year. Mirant’s response to PPRP Data Request No. 4, Question 4-2 (received on August 18, 2010) indicates that the annual average of 100 MMBtu/hr was determined considering the upper range of heat content of bituminous coal at 14,500 Btu/lb and 400,000 tons of fly ash per year. At 360,000 tons of fly ash the actual annual average heat input is approximately 87 MMBtu/hr. As such, the annual average heat input is representative in calculating potential emissions and allows for some operational flexibility considering the variability in the fly ash (e.g., variation of heat content, percent sulfur, and residual sulfur after processing).

MD PPRP 4-10 Morgantown STAR ERD - Case No. 9229
The STAR Facility potential emissions were evaluated in two categories: point source emissions from the exhaust stack of the STAR process reactor and fugitive emissions from the various material handling operations.
4.3.3 Potential Emission from the STAR Process Reactor
Potential emissions from the STAR process reactor were evaluated considering the combustion of fly ash in the reactor. In addition to fly ash combustion, the combustion of propane is proposed by the applicant. Propane will be used as an auxiliary fuel during start-up or shutdown of the STAR process reactor.
In a start-up mode, the STAR process reactor is warmed with initial firing of propane to a reactor temperature of approximately 1,400 oF. Propane and fly ash are then co-fired until a stable reaction with the fly ash occurs. At this point, propane is no longer used and the reactor solely combusts fly ash. Table 4-3 shows a comparison summary of the short-term emissions from the STAR process reactor firing fly ash and that expected when firing propane fuel. Appendix B provides PPRP’s detailed calculations for combustion emissions estimates.
Table 4-3 Potential Fuel Combustion Emissions Summary (lb/hr)
Emissions (lb/hr) Activity
SO2 NOX CO PM PM10 PM2.5 VOC SAM Fly Ash Combustion 12.0 7.00 23.0 1.35 0.955 0.686 2.31 0.814 Propane Combustion 0.072 3.25 5.39 0.503 0.503 0.503 0.718 0.072
Table 4-3 demonstrates that emissions from propane firing are less than firing fly ash during normal operations on a short-term basis for all pollutants of concern. Although during start-up or shutdown there is a period of co-firing fly ash and propane, normal operations of firing fly ash is considered the worst case scenario because the throughput rate of fly ash during co-firing will be less than the throughput rate of fly ash during normal operations. As a result, the following conclusions can be reached:
Emissions during start-up or shutdown are less than emissions during normal operations and as a result, project annual emissions are inclusive of start-up and shutdown; and
No restriction on propane firing is necessary for the project to remain below any annual emissions restrictions.
Maximum propane emissions from the proposed STAR Facility were calculated by PPRP including, but not limited to, the following
MD PPRP 4-11 Morgantown STAR ERD - Case No. 9229
information and assumptions provided by Mirant and additional sources (e.g., EPA emission factor sources):
Maximum propane heat input rate of 65 MMBtu/hr;
NOX emissions factor vendor guarantee of 0.05 lb/MMBtu; and
AP-42 Section 1.5 – Liquefied Petroleum Gas Combustion.
Assumptions and sources for emissions factors regarding specific pollutant calculations are discussed individually in the following sections.
4.3.3.1 SO2 Emissions
SO2 emissions are generated from sulfur present in the ash that is oxidized during the fly ash combustion in the STAR process reactor. These SO2 emissions are a function of the amount of fly ash processed through the reactor, the sulfur content of the fly ash, the amount of sulfur remaining in the product ash exiting the STAR process reactor, and the SO2 air pollution control equipment removal efficiency, in this case the STAR FGD system. The SO2 emissions are then converted to an emissions rate (lb/MMBtu) and adjusted to the annual average heat input of 100 MMBtu/hr.
The potential SO2 emissions from the proposed STAR process reactor were calculated using the equations noted in Appendix B, and the following data and assumptions:
Annual fly ash throughput of 360,000 tpy;
Annual average heat input of 100 MMBtu/hr;
Maximum fly ash sulfur content of 0.46 percent by weight, as provided by Mirant in Table 10.2A-4 of the CPCN application amendment (dated July 20, 2010);
Residual sulfur content of 0.03 percent by weight in the fly ash product per the TRC Emissions Test Report (TRC, 2009); and
SO2 FGD emissions factor vendor guarantee of 98.3 percent control.
In the original CPCN application, submitted March 26, 2010, Mirant estimated potential SO2 emissions of 175 tpy. In addition, SO2 emissions at the maximum heat input rate of 140 MMBtu/hr are greater than the potential emissions presented in Tables 4-2 and 4-3. However, the CPCN application amendment submitted on July 20, 2010, demonstrates that the potential SO2 emissions were reduced to less than 40 tpy, as presented in Tables 4-2 and 4-3, based on the annual average heat input of 100 MMBtu/hr.
MD PPRP 4-12 Morgantown STAR ERD - Case No. 9229
Mirant re-evaluated the operational parameters of the STAR Facility to reduce emissions from all pollutants below major source modification thresholds. To accomplish this decrease in emissions, Mirant made the following modifications to the proposed project:
The FGD scrubber vessel and recycle pumps were both increased in volume. This achieved an improved emissions vendor guarantee of reducing SO2 emissions 98.3 percent from the FGD scrubber (compared to the original 95 percent control vendor guarantee);
The throughput of fly ash to the STAR Facility was reduced from 400,000 tpy to 360,000 tpy; and
The residual percent sulfur in the fly ash was increased from 0 to 0.03 percent. Mirant originally was more conservative assuming no residual sulfur in the fly ash. However, the TRC Emissions Test Report (TRC, 2009) provided information that a percentage of the sulfur is retained in the final product. The median value of the three test runs of 0.03 percent was chosen.
These changes in design and operational parameters assisted Mirant in projecting compliance with the SO2 (and PM2.5 precursor) limit of 40 tpy. As a means of demonstrating compliance with the major modification emissions limits, Mirant will install CEMS for SO2. Installation of CEMS will allow Mirant operational flexibility of the STAR process reactor given the expected variability of the sulfur content in the fly ash, as well as make adjustments in the heat input of the reactor and the control settings of the FGD system, while providing for a method to continuously monitor emissions and evaluate compliance with proposed emission limits. In addition to CEMS, Mirant shall restrict fly ash throughput through the STAR Facility to 360,000 tpy on a consecutive 12-month period, rolling monthly.
The applicability determination as a result of PPRP and MDE-ARMA’s evaluation of the potential emissions, the change in emissions, and proposed compliance demonstration are addressed in Section 4.4.1.1.
4.3.3.2 NOX Emissions
NOX emissions are the result of combustion of fly ash in the reactor. Emissions from the proposed STAR process reactor are based on performance testing results conducted at the South Carolina STAR Facility. In Mirant’s response to PPRP Data Request No. 1, Question 1-3 (received on May 27, 2010), a letter from SEFA was provided regarding the NOX predicted performance. The letter notes that the Morgantown STAR process reactor unit would perform similarly and the emissions

MD PPRP 4-13 Morgantown STAR ERD - Case No. 9229
would be representative of those achieved at the South Carolina STAR Facility.
The potential NOX emissions from the proposed STAR Facility were calculated using the equations noted in Appendix B, and the following data and assumptions:
Annual average heat input of 100 MMBtu/hr; and
NOX emissions factor of 0.05 lb/MMBtu based on stack testing at the South Carolina STAR Facility.
NOX emission rates are directly related to the STAR process reactor heat input and the emission factor of 0.05 lb/MMBtu based on NOX testing at the South Carolina STAR Facility. It has been demonstrated that NOX concentrations have been achieved at or below 20 ppmv, which equates to less than 0.05 lb/MMBtu NOX. The lower emissions were achieved with proper tuning of air flows and water sprays in the combustion zone of the STAR process reactor.
However, NOX emissions at the maximum heat input rate of 140 MMBtu/hr are greater than the potential emissions presented in Tables 4-2 and 4-3. The adjustment of emissions based on 100 MMBtu/hr assisted Mirant in demonstrating compliance with the NOX major source modification limit of 25 tpy. As a means of demonstrating compliance with the major modification emissions limits, Mirant will install CEMS for NOX. In addition to CEMS, Mirant shall restrict fly ash throughput for the STAR Facility to 360,000 tpy on a consecutive 12-month period, rolling monthly.
The applicability determination resulting from PPRP and MDE-ARMA’s evaluation of the project’s potential emissions is addressed in Sections 4.4.1.1 and 4.4.1.2.
4.3.3.3 CO Emissions
CO emissions are the result of combustion of fly ash in the reactor. Emissions from the proposed STAR process reactor are based on the results from the stack test event using Morgantown fly ash at the South Carolina STAR Facility. The short-term emissions rate of CO (lb/hr) was divided by the actual heat input (MMBtu/hr) of the reactor during the stack test to determine an emissions rate, in lb/MMBtu.
The potential CO emissions from the proposed STAR process reactor were calculated using the equations noted in Appendix B, and the following data and assumptions:

MD PPRP 4-14 Morgantown STAR ERD - Case No. 9229
Annual average heat input of 100 MMBtu/hr; and
CO emissions factor of 0.16 lb/MMBtu calculated using results from the TRC Emissions Test Report (TRC, 2009).
CO emission rates are directly related to the STAR process reactor heat input and the emission factor of 0.16 lb/MMBtu based on the TRC Emissions Test Report. However, CO emissions at the maximum heat input rate of 140 MMBtu/hr are greater than the potential emissions presented in Tables 4-2 and 4-3. The adjustment of emissions based on 100 MMBtu/hr assisted Mirant in demonstrating compliance with the CO major source modification limit of 100 tpy. As a means of demonstrating compliance with the major modification emissions limits, Mirant will install CEMS for CO. In addition to CEMS, Mirant shall restrict fly ash throughput for the STAR Facility to 360,000 tpy on a consecutive 12-month period, rolling monthly.
The applicability determination as a result of the PPRP and MDE-ARMA’s evaluation of the potential emissions are addressed in Section 4.4.1.1.
4.3.3.4 VOC Emissions
VOC emissions are the result of combustion of fly ash in the reactor. In Mirant’s response to PPRP Data Request No. 4, Question 4-8 (received on August 18, 2010), Mirant noted that the VOC emissions were based on 10 percent of the CO Emissions factor. The 1/10 ratio of VOC to CO emissions factor is consistent with the AP-42 factor for coal-fired units, and is reasonable to estimate VOC emissions from the STAR process reactor.
The potential VOC emissions from the proposed STAR process reactor were calculated using the equations noted in Appendix B and the following data and assumptions:
Annual fly ash throughput of 360,000 tpy;
Annual average heat input of 100 MMBtu/hr; and
VOC emission factor of 0.0165 lb/MMBtu per 10 percent ratio of CO emissions factor consistent with emissions factors provided in AP-42 Section 1.1 – Bituminous and Subbituminous Coal Combustion.
Although VOC emissions at the maximum heat input rate of 140 MMBtu/hr are greater than the potential emissions presented in Tables 4-2 and 4-3, VOC emissions at 360,000 tons of fly ash per year are below major modification emissions limits as discussed in Section 4.4.1.2. Additionally, the STAR Facility will comply with the State general source

MD PPRP 4-15 Morgantown STAR ERD - Case No. 9229
VOC emissions standard by reducing emissions by 85 percent or more as discussed in Section 4.4.3.3.
4.3.3.5 Particulate Matter Emissions
PM emissions are the result of combustion of fly ash in the reactor. Additionally, fugitive PM emissions occur as a result of multiple fly ash material handling activities. These emissions are discussed in more detail in Section 4.3.4. PM emissions are directly related to the flow of the exhaust and the efficiency of the control technologies at the varying particle sizes. The control technologies associated with this process include a baghouse and a wet FGD scrubber system.
The potential PM, PM10, and PM2.5 emissions (inclusive of condensable and filterable particulate emissions) from the proposed STAR process reactor were calculated using the equations noted in Appendix B, and the following data and assumptions:
Annual fly ash throughput of 360,000 tpy;
PM emissions factor of 0.05 gr/dscf based on grain loading performance of the baghouse per Mirant Data Request No. 1, Question 1-1(j) (received on May 27, 2010);
STAR exhaust flow rate of 22,420 dscfm based on the annual average heat input of 100 MMBtu/hr;
PM FGD control efficiency of 90 percent estimated based on a control efficiency range of 70-99 percent control provided in EPA’s Air Pollution Control Fact Sheet for FGD systems; and
PM10/PM2.5 fractional FGD control efficiencies per AP-42 Section 1.1 – Bituminous and Subbituminous Coal Combustion.
Although PM emissions at the maximum heat input rate of 140 MMBtu/hr are greater than the potential emissions presented in Tables 4-2 and 4-3, direct PM, PM10, and PM2.5 emissions at 360,000 tons of fly ash per year are below major modification emissions limits as discussed in Sections 4.4.1.1 and 4.4.1.2.
4.3.3.6 SAM Emissions
SAM emissions are generated from the release of sulfuric acid from the combustion process in the STAR process reactor. Emissions are determined by adjusting the manufactured SO3 by the removals in the baghouse and the wet FGD scrubber. SAM emissions are calculated by applying Technology Impact Factors that describe the fraction of sulfuric

MD PPRP 4-16 Morgantown STAR ERD - Case No. 9229
acid that penetrates each downstream equipment component per the guidance document titled Estimated Total Sulfuric Acid Emissions from Stationary Power Plants (EPRI, 2007). This document was an update to a study done by Southern Company in 2005.
The potential SAM emissions from the proposed STAR process reactor were calculated using the equations in the reference document and as noted in Appendix B, and the following data and assumptions:
Annual fly ash throughput of 360,000 tpy;
Annual average heat input of 100 MMBtu/hr;
Maximum fly ash sulfur content of 0.46 percent by weight as provided by Mirant in Table 10.2A-4 of the CPCN application amendment (dated July 20, 2010);
Residual sulfur content of 0.03 percent by weight in the fly ash product from the STAR process reactor per the TRC Emissions Test Report (TRC, 2009);
SO2 FGD emissions factor vendor guarantee of 98.3 percent; and
Calculations and emissions factors for calculating SAM emissions per guidance from EPRI - Southern Company (2005) update (EPRI, 2007).
Although SAM emissions at the maximum heat input rate of 140 MMBtu/hr are greater than the potential emissions presented in Tables 4-2 and 4-3, SAM emissions at 360,000 tons of fly ash per year are below major modification emissions limits as discussed in Section 4.4.1.1.
4.3.4 Potential Emission from Material Handling Operations
Material handling operations generate fugitive PM from material transfer points, wind erosion from material piles, and release of road dusts from truck traffic (during delivery and pickup of materials). The proposed Mirant STAR Facility will be a source of fugitive PM, PM10, and PM2.5 emissions resulting from fly ash handling during unloading, conveying, processing, and loading processes. Mirant proposes to use a combination of existing and new equipment for the material handling operations associated with the STAR Facility. The material handling emissions sources are defined in Figures 4-1 and 4-2. The fugitive PM emissions associated with material handling can be summarized into the following activities:
Fly ash transfer/material handling emissions;
Paved road emissions;

MD PPRP 4-17 Morgantown STAR ERD - Case No. 9229
Bin vent emissions; and
Storage emissions.
Because fly ash material handling activities already occur at the Morgantown Generating Station, the material handling emissions need to be adjusted to only account for the additional material handling fugitive emissions. Therefore, Table 4-4 provides a summary of the emission increases as a result of the changes associated with fly ash material handling operations from the STAR Facility.
Assumptions and sources for emission factors regarding each specific activity category are discussed individually in the following sections. Appendix B provides PPRP’s detailed calculations for PM, PM10, and PM2.5 emissions estimates.
Table 4-4 Potential Material Handling Operations Emissions Summary (tons/year)
Emissions (tpy) Activity PM PM10 PM2.5
Existing Operations: Fly Ash Transfer Emissions 0.008 0.004 0.001
Paved Road Emissions 3.64 0.709 0.106 Bin Vent Emissions 4.51 2.13 0.323 Storage Emissions -- -- --
Total Existing Operations 8.15 2.84 0.429 Proposed Operations:
Fly Ash Transfer Emissions 0.007 0.003 0.001 Paved Road Emissions 3.09 0.603 0.090
Bin Vent Emissions 6.76 3.20 0.484 Storage Emissions 0.173 0.082 0.124
Total Proposed Operations 10.0 3.88 0.700
Project Material Handling Operation Emissions 1.88 1.04 0.269
4.3.4.1 Fly Ash Transfer Emissions
Fugitive PM emissions from the material transfer operations of fly ash result from the movement of fly ash to storage silos, STAR process reactor feed bins, transfer operations to the STAR process reactor, movement of the final ash product to the fly ash storage dome, ash loadout to trucks, and movement of off-site ash to the reactor feed bin. The material will be enclosed and pneumatically conveyed throughout the whole process, which offers 99 percent control efficiency. Fugitive PM emissions vary

MD PPRP 4-18 Morgantown STAR ERD - Case No. 9229
based on the control of the conveyors, the moisture content of the fly ash, and meteorological wind data for the area of concern.
The potential annual emissions from the proposed STAR Facility fly ash transfers were calculated using the equations noted in Appendix B and the following data and assumptions:
AP-42 Section 13.2.4 – Aggregate Handling and Storage;
Fugitive Dust Background Document and Technical information Document for Best Available Control Measures – EPA-450/2-92-004;
Particle size multipliers for coal handling: PM – 0.74, PM10 – 0.35, PM2.5 – 0.11 (AP-42 Section 13.2.4, Equation 1);
Fly ash throughput up to 360,000 tpy (Mirant);
Moisture content of fly ash of 10 percent (Mirant);
Annual mean wind speed of 9.5 mph (Reagan National Airport);
Daily mean wind speed of 19 mph (Reagan National Airport); and
Enclosed transfers with a 99 percent control efficiency.
The control efficiencies cited above are believed to be reasonable values based on guidance in EPA’s “Fugitive Dust Background Document and Technical information Document for Best Available Control Measures (EPA-450/2-92-004).” In particular, these estimated control efficiencies seem appropriate based on reductions in emissions that should be achievable, when considering wind speeds expected at the facility. All conveyors were considered covered and enclosed, resulting in no additional fugitive dust emissions between transfer points.
4.3.4.2 Paved Road Emissions
Fugitive PM emissions from paved roads results from fly ash material that is emitted when truck tires drive over paved roads with fly ash particles. The emissions are based on the weight of the vehicle, the number of trips the vehicles make per day, and the distance traveled. Natural events such as rain help to reduce PM emissions as well as regularly scheduled watering of paved roads can reduce fly ash fugitive paved road emissions by approximately 60 percent.
The potential annual emissions from the proposed STAR Facility truck traffic on paved roads were calculated using the equations noted in Appendix B, and the following data and assumptions:
AP-42 Section 13.2.1 – Paved Roads;

MD PPRP 4-19 Morgantown STAR ERD - Case No. 9229
Particle size multipliers for paved roads: PM – 0.082, PM10 – 0.016, PM2.5 – 0.0024 (AP-42);
Average time with 0.01 inches precipitation: 114 days/year (Reagan National Airport);
Road surface silt loading: 1 g/m2 (Golder 2001 Port Transportation Study);
Average vehicle weight: 26.25 tons (based on truck weights of 32.5 tons full and 20 tons empty, respectively);
Miles traveled per truck: 0.5 - 1 miles/truck (Mirant);
Truck trips per day: 27 – 50 (Mirant); and
Water sprays with a minimum 60 percent control efficiency.
Furthermore, according to the Background Document for AP-42 Section 13.2.1, the control efficiency from water sprays achieved emissions reductions from 30 to 70 percent. As such, the water sprays control efficiency cited above was verified as a reasonable estimate for paved road emissions.
4.3.4.3 Bin Vent Emissions
During the material transfer of fly ash from the fly ash silos, the STAR process reactor, the product loadout silo, and storage dome there is the potential for fugitive PM emissions. To reduce emissions Mirant plans to install fabric filter vents to capture fugitive emissions from the transfer of fly ash to these storage areas, processing, and shipping points.
The potential annual emissions from the proposed STAR Facility bin vent fabric filters were calculated using the equations noted in Appendix B, and the following data and assumptions:
AP-42 Section 13.2.4 – Aggregate Handling and Storage;
PM emissions factor of 0.05 gr/dscf based on grain loading performance of the baghouse per Mirant’s Response to Data Request No. 1, Question 1-1(j) (received on May 27, 2010);
Particle size multipliers for coal handling: PM – 0.74, PM10 – 0.35, PM2.5 – 0.053 (AP-42 Section 13.2.4); and
Associated air flows per emissions source (Mirant).
The particulate size multipliers from AP-42 Section 13.2.4 for coal handling were used to determine the scalable emissions associated with PM10 and PM2.5, respectively (e.g., PM10 = 0.35/0.74*PM).
MD PPRP 4-20 Morgantown STAR ERD - Case No. 9229
4.3.4.3 Storage Emissions
When the fly ash is transferred to the storage dome, fugitive emissions can occur from the storage piles. Local meteorological data, such as wind speeds and rainfall, often factor into the emissions associated with storage piles. However, the fly ash is protected by wind and rain under a 30,000 ton cover as well as enclosed conveyor systems during transfer. The storage dome will prevent and lower wind erosion emissions.
The potential annual emissions from the proposed STAR Facility fly ash storage emissions were calculated using the equations noted in Appendix B, and the following data and assumptions:
AP-42 Section 13.2.4 – Aggregate Handling and Storage;
Fugitive Dust Background Document and Technical information Document for Best Available Control Measures – EPA-450/2-92-004 - Equation 2-12 - etsp = 1.7* (s/1.5)*(365-p/235)*(f/15);
Particle size multipliers for coal handling: PM – 0.74, PM10 – 0.35, PM2.5 – 0.053 (AP-42 Section 13.2.4);
Silt content of fly ash: 80 percent (AP-42 Section 13.2.4);
Percentage of time wind speed exceeds 5.4 m/s: 24.9 percent (Reagan National Airport);
Storage of fly ash of 30,000 tons (Mirant); and
Enclosed transfers with a 99 percent control efficiency.
The particulate size multipliers for coal handling were used to determine the scalable emissions associated with PM10 and PM2.5, respectively. Rainfall was not considered in storage emissions because the storage occurs within an enclosed dome.
4.3.5 Mercury Emissions
The Mirant STAR Facility has the potential to emit small quantities of mercury. Mercury is a trace metal contained in the raw feed fly ash that is emitted through the STAR process reactor stack as well as through fugitive PM emissions from material handling. PPRP and MDE-ARMA reviewed the mercury concentrations of the proposed fly ash feed and estimated emissions from Mirant’s CPCN application. Furthermore, due to the current mercury deposition impacts in the northeast United States waterways, PPRP and MDE-ARMA conducted an independent evaluation of the potential mercury emissions from the STAR process reactor.

MD PPRP 4-21 Morgantown STAR ERD - Case No. 9229
From sample results from the TRC Emissions Test Report (TRC, 2009), the mercury concentrations of three samples of unprocessed fly ash from Morgantown were 0.26 ppm, 0.27 ppm, and 0.26 ppm. The corresponding processed fly ash samples were measured at 0.25 ppm, 0.21 ppm, and 0.24 ppm. Based on this data, PPRP and MDE-ARMA confirmed that the majority of the mercury in the fly ash entering the STAR Facility will remain in the processed fly ash and not be emitted.
Emissions from the proposed STAR process reactor are based on the results from the stack test event using Morgantown fly ash at the South Carolina STAR Facility. The stack test report (TRC, 2009) provided an average mercury emissions factor of 1.78x10⁻⁵ lb mercury/ton fly ash processed. However, the stack testing at the South Carolina facility did not consider the following:
An installed wet FGD system for air pollution control; and
The mercury concentration of fly ash from the Chalk Point Generating Station.
To account for a wet FGD system installed on the proposed STAR process reactor, an additional 51 percent control of mercury emissions was assumed. The mercury removal estimate of 51 percent is supported by a sample test from EPA’s, “Control of Mercury Emissions from Coal Fired Electric Utility Boilers an Update,” February 18, 2005 (EPA, 2005).
Because the Morgantown STAR Facility will primarily combust fly ash from the Morgantown and Chalk Point Generating Stations, the stack test emissions factor was normalized considering a composite of fly ash from Morgantown and Chalk Point. The ratio of Morgantown to Chalk Point fly ash was assumed to be 60 percent to 40 percent, respectively, based on the 2006-2009 throughput values provided by Mirant in response to PPRP Data Request No. 2, Question 2-5 (received on June 23, 2010). The mercury concentration from Morgantown fly ash (0.263 ppm) was determined using data from the TRC Emissions Test Report. The mercury concentration of Chalk Point fly ash (0.486 ppm) was determined from Mirant’s Response to PPRP Data Request No. 6, Question 6-7 (received on September 23, 2010).
The STAR Facility is expected to receive fly ash from Dickerson only from time to time (based on Mirant’s Response to PPRP Data Request No. 2, Question 2-7, received on June 23, 2010) and the mercury concentration of the Dickerson fly ash was sampled at 0.31 ppm (based on Mirant’s Response to PPRP Data Request No. 6, Question 6-7, received on September 23, 2010). As such, it was determined that the fly ash from

MD PPRP 4-22 Morgantown STAR ERD - Case No. 9229
Dickerson would have characteristics similar to the Morgantown-Chalk Point normalized value.
Based on the previously discussed adjustments, a throughput of 360,000 tons of fly ash per year, and equations noted in Appendix B, PPRP and MDE-ARMA calculated the potential mercury emissions for the STAR Facility at 4.20 lb/year. In an effort to reduce Maryland’s contribution to the mercury deposition impacts in the northeast United States, MDE-ARMA requires the STAR Facility to remain below a mercury emissions limit of 5 lb per consecutive 12-month period, rolling monthly. The STAR Facility will be subject to additional MDE-ARMA enforceable conditions including:
Conducting performance stack testing for mercury on an annual basis;
Analyzing samples of the unprocessed fly ash entering the STAR reactor and the processed fly ash exiting the STAR reactor on a monthly basis;
Submitting emissions and sampling reports on a quarterly basis; and
Additional recordkeeping and reporting requirements to assure compliance with the mercury emission limit.
Applicable mercury-related requirements are included in the final licensing conditions for the project (Appendix D). Mercury emissions are also evaluated within the following Hazardous Air Pollutant (HAP) and Toxic Air Pollutant (TAP) sections.
4.3.6 Hazardous Air Pollutant Emissions
The Mirant STAR Facility has the potential to emit small quantities of HAPs. These HAPs consist of metals contained in the raw feed fly ash that will be emitted as STAR process reactor emissions and material handling fugitive PM. PPRP and MDE-ARMA reviewed the HAPs concentrations provided in Mirant’s application for the material handling fugitive emissions. The HAPs process emissions were based on the TRC stack testing from February 2009 conducted on Mirant fly ash processed in the South Carolina SEFA STAR process reactor (TRC, 2009). However, the stack testing at the South Carolina facility did not include a wet FGD system air pollution control. As such, Mirant assumed an additional 51 percent control of mercury emissions and 93 percent control of selenium emissions.
The previously described mercury removal estimate of 51 percent is supported by a sample test from EPA’s, “Control of Mercury Emissions from Coal Fired Electric Utility Boilers an Update”, February 18, 2005
MD PPRP 4-23 Morgantown STAR ERD - Case No. 9229
(EPA, 2005). The 93 percent control of selenium emissions is supported by the Electric Power Research Institute’s “Electric Utility Trace Substances Synthetic Report”, November 1994 (EPRI, 1994). In this report, Figure B-15a shows 99 percent removal of selenium emissions from the use of an FGD in combination with fabric filters. Selenium behaves in a similar way as sulfur and can be neutralized and absorbed by alkaline substances; therefore, a control efficiency of 93 percent was determined to be conservative.
PPRP has reviewed the HAPs emissions calculated by Mirant, which normalized the stack testing results for the different fly ash units (the active South Carolina and proposed Mirant STAR process reactors) by dividing the lb HAP/hr by the particulate matter emissions lb PM/hr to get a lb HAP/lb PM emissions factor. This emission factor lb HAP/lb PM was applied to the process emissions from the Morgantown STAR Facility.
However, the stack test report also supplied the emissions from the South Carolina STAR Facility as lb HAP/ton of fly ash processed. It was determined by PPRP that lb HAP/ton of fly ash represents the most direct way of calculating HAP emissions from the proposed STAR process reactor. Therefore, PPRP’s calculation methodology for HAP emissions was determined using the lb HAP/ton of fly ash values from the TRC Emissions Test Report.
Presented below in Table 4-5 are HAP emission estimates based on the lb HAP/ton of fly ash processed calculated by PPRP. The HAPs emissions in Table 4-5, indicate that no individual HAP will be emitted in quantities greater than 5.90E-02 tpy. The total emissions of all the HAPs from the project will be 0.158 tpy.
HAPs must be aggregated facility-wide to determine whether the project exceeds major source applicability. The thresholds for being considered a major source for HAPs are 10 tpy for any individual HAP and 25 tpy for facility-wide total HAPs. As illustrated in Table 4-5, the HAP emissions from the project do not exceed major source applicability thresholds.

MD PPRP 4-24 Morgantown STAR ERD - Case No. 9229
Table 4-5 Hazardous Air Pollutant Emissions Summary
TAP ClassConcentration in Fly Ash (ppm)(2)
lb/hr TPY lb/hr TPY lb/hr TPYArsenic I 160 6.86E-05 3.01E-04 5.88E-04 2.57E-03 6.56E-04 2.87E-03Berylium I 7.8 3.35E-06 1.47E-05 1.08E-04 4.73E-04 1.11E-04 4.88E-04Cadmium I 4.5 1.93E-06 8.46E-06 2.91E-05 1.27E-04 3.10E-05 1.36E-04Nickel I 78 3.35E-05 1.47E-04 2.04E-03 8.95E-03 2.08E-03 9.09E-03
Antimony II 25 1.07E-05 4.70E-05 1.59E-04 6.97E-04 1.70E-04 7.44E-04Barium II 700 3.00E-04 1.32E-03 4.93E-03 2.16E-02 5.23E-03 2.29E-02Chromium II 120 5.15E-05 2.25E-04 2.01E-03 8.82E-03 2.07E-03 9.05E-03Cobalt II 29 1.24E-05 5.45E-05 3.83E-04 1.68E-03 3.95E-04 1.73E-03Copper II --- --- --- 1.57E-03 6.88E-03 1.57E-03 6.88E-03
Lead(5) II 109 4.68E-05 2.05E-04 5.79E-04 2.54E-03 6.26E-04 2.74E-03Manganese II 130 5.58E-05 2.44E-04 1.39E-03 6.10E-03 1.45E-03 6.35E-03
Mercury(6) II 0.35 1.50E-07 6.59E-07 3.58E-04 2.10E-03 3.59E-04 2.10E-03
Phosphorus(7) II --- --- --- 1.35E-02 5.90E-02 1.35E-02 5.90E-02Selenium II 25 1.07E-05 4.70E-05 2.80E-03 1.23E-02 2.82E-03 1.23E-02Silver II --- --- --- 3.61E-04 1.58E-03 3.61E-04 1.58E-03Thallium II 310 1.33E-04 5.82E-04 8.59E-05 3.76E-04 2.19E-04 9.59E-04Vanadium II 310 1.33E-04 5.82E-04 --- --- 1.33E-04 5.82E-04Zinc II 150 6.43E-05 2.82E-04 4.23E-03 1.85E-02 4.30E-03 1.88E-02
TOTAL 0.036 0.158
(1) Table PM Summary Fly Ash Operations, based on PM Net Emission Increase Total from Material Handling(2) Trace Metal Concentrations based on coal analysis supplied by Mirant
(5) Lead concentration Fly Ash PPM was estimated based on Mirant's calculations.
(7) Phosphorus (white) was the screening level taken from MDE's 2009 TAPs screening level database.
(3) TPY Material Handling Calculation = HAP PPM / 10^6 * PM TPY = HAP TPY, lb/hr conversion uses 2000 lb/ton and 8760 hours/year
(4) Process Emissions are based on TRC stack testing conducted on the FAB unit in South Carolina. See Process HAPs emissions Table.
Material Handling(3) Process Handling(4) TOTAL
(6) Mercury based on Morgantown 60% supply and Chalk Point 40% supply. Used to created a weight average PPM.
4.3.7 Toxic Air Pollutant Emissions
The pollutants identified as HAPs would also be considered TAPs in the State of Maryland. TAPs require a screening analysis in accordance with COMAR 26.11.15 to ensure that there are no unacceptable impacts from TAP emissions. MDE exempts fuel burning sources from TAP requirements based on COMAR 26.11.15.03(a)(1). The STAR Facility is not considered a fuel burning source as defined in COMAR 26.11.09.01, as any boiler or furnace that has the primary function of heating air, water, or any other medium through indirect heat transfer from the burning of fuels; or a stationary internal combustion engine or turbine that generates energy. Based on the definition of fuel burning, the STAR process reactor is not considered a fuel burning source by processing fly ash; therefore, the project is not exempt from TAP regulations.
MD PPRP 4-25 Morgantown STAR ERD - Case No. 9229
For the TAP analysis, risk screening levels for each TAP are determined based on threshold limit values (TLVs) for occupational exposure (in µg/m3). COMAR 26.11.16.02 provides a table of allowable emission rates for TAPs, based on different ranges of screening levels.
Potential sources of TAP emissions are the STAR process reactor emissions and the material handling fugitives. Table 4-6 presents emissions estimates for TAPs from this project, screening levels, and their associated allowable emission rates. As discussed in Section 4.3.5, the calculations for TAP process emissions are based on lb HAP/ton of fly ash processed emission factors based on the TRC stack testing from February 2009 conducted on Mirant fly ash processed in the South Carolina SEFA STAR process reactor (TRC, 2009).
The results summarized in Table 4-6 based on PPRP’s emission calculation approach, demonstrates that the majority of TAP emissions from the STAR process reactor process are below the applicable TAP thresholds. However, using the lb HAP/ton fly ash emission factors, the following pollutants required further evaluation (e.g., conservative SCREEN3 modeling) to demonstrate compliance with TAP screening levels: arsenic, beryllium, mercury, phosphorus, and silver. The completion of the TAP screening analysis demonstrated that each of those TAPs passed SCREEN3 modeling for both 8-hour and annual ambient concentrations.
The TAP regulations require a T-BACT demonstration of control strategies for the equipment. The TAPs from the STAR process reactor include particulate matter containing non-volatile TAPs and TAPs that are potentially volatile (mercury and selenium). The proposed and available control technologies for PM are project design, fully enclosed transfer material handling equipment, fabric filters, STAR process reactor baghouse and the wet limestone scrubber. Together the baghouse and wet limestone scrubber represent the highest degree of control achievable for particulate and volatile TAPs and are considered Best Available Control Technology for Toxics (T-BACT).
4.3.8 Greenhouse Gas Emissions
Mirant provided revised estimated greenhouse gas (GHG) emissions in its responses to PPRP Data Request No. 1, Question 1-1(g) (received on May 27, 2010) and PPRP Data Request No. 3, Question 3-10 (received on July 14, 2010). PPRP and MDE-ARMA have reviewed information presented by Mirant and evaluated the GHG emissions from the project. The potential GHG emissions, represented as carbon dioxide equivalent (CO2e), from the proposed Morgantown STAR Facility were calculated by PPRP using information and assumptions provided by Mirant as well as
MD PPRP 4-26 Morgantown STAR ERD - Case No. 9229
equations and associated emissions factors of the EPA Mandatory Reporting Rule of Greenhouse Gas Emissions (40 CFR Part 98).
The total GHG emissions include CO2e emissions from both ash processing and propane firing (during start-ups) within the STAR Facility reactor. Using Equation C-3 of 40 CFR 98 and based on a projected throughput of 360,000 tons of fly ash per year and a annual average carbon content percent weight of 7.73 percent, the CO2e emissions from processing ash are estimated at 92,853 metric tons per year. It is worth noting that per 40 CFR 98.33, methane (CH4) and nitrous oxide (N2O) emissions are not considered part of the ash processing CO2e emissions, because fly ash is not a listed fuel in Table C-2 of 40 CFR 98.
The CO2e emissions from firing propane are based on an estimated annual propane consumption of 93,000 gallons, given the number of projected annual start-ups. These projected start-up conditions include: 16 cold starts (3,000 gallons of propane per cold start) and 30 warm starts (1,500 gallons of propane per warm start). Using equation C-8 and the correct emissions factors from 40 CFR 98 for CO2, CH4, and N2O, respectively, the CO2e emissions from propane firing are estimated at 522 metric tons per year.
4.3.9 Construction Emissions
Mirant provided estimated construction emissions in responses to PPRP Data Request No. 1, Question 1-1(i) (received on May 27, 2010) and PPRP Data Request No. 3, Question 3-14 (received on July 14, 2010). Construction activities will generate PM emissions from ground excavation, grading, cut-and-fill operations, and related activities. Fugitive dust emissions will be produced from trucks traveling over the unpaved roads. Minimal emissions of VOC, CO, SO2, and NOX will result from the exhaust from the use of the following construction equipment: wheel loader, crane, excavator, dump truck, forklift, welding machine, and a backhoe loader.
PPRP and MDE-ARMA independently evaluated the construction emissions from the proposed project. For calculating construction emissions PPRP and MDE-ARMA used the same reference document as Mirant; however, Mirant used the generic emissions factors for construction equipment. In lieu of this approach, construction emissions were calculated by PPRP using more refined equations specific to the type, size, and load factors of the equipment. Specifically, the emissions associated with construction equipment were estimated using the construction hours provided by Mirant and the equations and factors from the following EPA guidance documents:

MD PPRP 4-27 Morgantown STAR ERD - Case No. 9229
Table 4-6 Toxic Air Pollutant Compliance Demonstration
Screen3 Modeling
TAP TAP Class1-hour
(ug/m3)8-hour
(ug/m3)Annual (ug/m3) lbs/hr lbs/yr lbs/hr lbs/yr lbs/hr lbs/yr
8-hour (ug/m3)
Annual (ug/m3) Pass (Y/N)
Arsenic I 0.1 0.0012 3.58E-04 0.44 6.56E-04 5.7 NO NO 0.0007 0.000086 YESBeryllium I 0.0005 0.0024 1.79E-06 0.88 1.11E-04 1.0 NO NO 0.0001 0.000014 YESCadmium I 0.02 0.0036 7.17E-05 1.31 3.10E-05 0.3 YES YES 0.0087 0.0007Nickel I 1 3.58E-03 2.08E-03 18.2 YES 0.5792
Antimony II 5 1.79E-02 1.70E-04 YES 0.0474Barium II 5 1.79E-02 5.23E-03 YES 1.4597Chromium II 5 1.79E-02 2.07E-03 YES 0.5762Cobalt II 0.2 7.17E-04 3.95E-04 YES 0.1103Copper II 2 7.17E-03 1.57E-03 YES 0.4380Lead II 0.5 1.79E-03 6.26E-04 YES 0.1747Manganese II 2 7.17E-03 1.45E-03 YES 0.4042Mercury II 0.3 0.1 3.58E-04 3.59E-04 NO 0.0004 YES
Phosphorus(5) II 1.01 3.62E-03 1.35E-02 NO 0.0148 YESSelenium II 2 7.17E-03 2.82E-03 YES 0.7855Silver II 0.1 3.58E-04 3.61E-04 NO 0.0004 YESThallium II 1 3.58E-03 2.19E-04 YES 0.0611Vanadium II 0.5 1.79E-03 1.33E-04 YES 0.0371Zinc II 1000 500 1.79E+00 4.30E-03 YES 1.1989
(1) Screening levels were taken from MDE's 2009 TAPs screening level database.
(3) Actual Emissions based on emissions from material handling and from the STAR process reactor
(5) Phosphorus (white) was the screening level chosen from MDE's 2009 TAPs screening level database.
(2) COMAR 26.11.16.02, Allowable Emissions were calculated by the 8-hr screening level divided by 279, since 8 hour screening levels were all less than 1 hour screening levels.
(4) Ambient concentrations for Form 5A: For compounds passing by the allowable rate, concentrations are determined by multiplying the screening value concentration by the ratio of the actual to allowable emission rate.
Compliance, Below 26.11.16.02?Screening Level(1) Allowable Emission(2) Actual Emissions(3)
Ambient Conc. (ug/m3)(4)

MD PPRP 4-28 Morgantown STAR ERD - Case No. 9229
AP-42 Section 13.2.2 – Unpaved Roads;
Exhaust and Crankcase Emission Factors for Nonroad Engine Modeling-Compression-Ignition (EPA, 2004a); and
Median Life, Annual Activity and Load Factor Values for Nonroad Engine Emissions Modeling (EPA, 2004b).
Based on the results presented in Table 4-7, PPRP and MDE-ARMA have determined that emissions of VOC, CO, NOX, SO2, PM, PM10, and PM2.5
from equipment exhaust and unpaved road truck travel will be minimal.
Table 4-7 Construction Emissions
Total Emissions (tpy) Equipment Type
VOC CO NOX SO2 TSP PM10 PM2.5 Wheel Loader 0.027 0.250 0.32 0.013 0.012 0.012 0.012
Crane 0.043 0.108 0.55 0.022 0.012 0.012 0.012 Excavator 0.018 0.213 0.42 0.017 0.011 0.011 0.011
Dump Truck 0.021 0.252 0.50 0.020 0.013 0.013 0.013 Forklift 0.021 0.206 0.24 0.010 0.014 0.014 0.014
Welding Machine 0.006 0.047 0.06 0.002 0.004 0.004 0.004 Backhoe Loader 0.009 0.026 0.05 0.002 0.003 0.003 0.003
TOTAL EQUIPMENT
EMISSIONS 0.146 1.10 2.14 0.087 0.071 0.071 0.069
TOTAL UNPAVED ROAD
EMISSIONS - - - - 0.934 0.267 0.027
TOTAL CONSTRUCTION
EMISSIONS 0.146 1.10 2.14 0.087 1.00 0.338 0.095
Mirant also presented potential HAP emissions as a result of construction activities, specifically combustion of diesel fuel. Total HAP emissions from construction activities are estimated at 0.017 tpy. PPRP and MDE-ARMA have reviewed the information presented by Mirant and have determined that emission of HAPs from construction activities will be minimal.
4.4 APPLICABLE REQUIREMENTS REVIEW
This section outlines the federal and State air quality requirements to which the Mirant STAR Facility will potentially be subject.

MD PPRP 4-29 Morgantown STAR ERD - Case No. 9229
The Morgantown Generating Station itself is subject to State and federal programs not affected by this case. These requirements are addressed in Morgantown’s Title V Operating Permit issued by MDE (No. 24-017-00014).
4.4.1 Federal Permitting Requirements
EPA has defined concentration-based NAAQS for several pollutants, which are set at levels considered to be protective of public health and welfare. Specifically, the NAAQS have been defined for six “criteria” pollutants—particulate matter (PM10 and PM2.5), SO2, NO2, CO, ozone, and lead. Air emissions limitations and pollution control requirements are generally more stringent for sources located in areas of the country that do not currently attain a standard for a particular pollutant (known as “nonattainment” areas).
Morgantown Generating Station is located in Charles County, Maryland. The air quality in Charles County, which is designated as Area V (COMAR 26.11.01.03) by MDE-ARMA, is currently in attainment of the NAAQS for all pollutants with the exception of ozone and PM2.5. Because of the severity of the ozone pollution in Charles County, the County is designated a “moderate” ozone nonattainment area for the 8-hour ozone standard. Emissions of the two pollutants that are the primary precursors to ozone, VOCs and NOX, are regulated more stringently in ozone nonattainment areas to ensure that air quality is not further degraded (i.e., the ambient air concentrations of ozone do not continue to increase as new sources of emissions are constructed).
Potential emissions from new and modified sources in attainment areas are evaluated through the PSD program (COMAR 26.11.06.14). The goal of the PSD program is to ensure that emissions from major sources do not degrade air quality. Triggering PSD requires pollution control known as Best Available Control Technology (BACT), modeling against the NAAQS, and additional impact assessments.
Potential emissions from new and modified sources in nonattainment areas are evaluated through the NA-NSR program (COMAR 26.11.17). The goal of the NA-NSR program is to allow construction of new emission sources and modifications to existing sources, while ensuring that progress is made towards attainment of the NAAQS. Triggering NA-NSR indicates that a project could adversely impact air quality, which means that impacts must be managed. NA-NSR requires that major sources of nonattainment pollutants limit emissions of pollutants through the implementation of the most stringent levels of pollution control, known as Lowest Achievable Emission Rate (LAER). In addition, NA-NSR requires
MD PPRP 4-30 Morgantown STAR ERD - Case No. 9229
pollutant “offsets” to be obtained for every ton of regulated pollutant emitted.
In May 2008, EPA finalized NSR regulations for PM2.5 that address direct PM2.5 emissions and emissions of PM2.5 precursors SO2 and NOX. Ammonia and VOC are also PM2.5 precursors; however, they are not addressed for PM2.5 NSR purposes unless a state elects to regulate these pollutants.
Because the Morgantown STAR Facility will be located in a nonattainment area for ozone and PM2.5 and an attainment area for the other pollutants, PPRP and MDE-ARMA assessed applicability with both NA-NSR and PSD to ensure that no adverse impacts would be caused by the proposed project. The results of these evaluations for the proposed project are discussed in Sections 4.4.1.1 and 4.4.1.2.
In May 2010, EPA finalized the GHG Tailoring Rule (40 CFR Parts 51, 52, 70 and 71) as an effort to “tailor” the PSD and Title V permit rules to better fit the relative magnitude of GHG emissions from stationary sources. Applicability with the GHG Tailoring Rule is discussed in Section 4.4.1.3.
Other federal and State air quality regulations may apply to the proposed project. These regulations apply either as a result of the type of emission source that is to be constructed or as a result of a specific pollutant emitted. These regulations, discussed in Sections 4.4.2 and 4.4.3, specify limits on pollutant emissions, and impose recordkeeping and reporting requirements.
4.4.1.1 Applicability of PSD Permitting Regulations
The Morgantown facility is an existing major source, as defined in PSD regulations; therefore, any modifications at the facility must be evaluated to determine whether the resulting emission changes would constitute a “major modification” under PSD (40 CFR §52.21(b)(2)) referenced in COMAR 26.11.06.14). The PSD applicability analysis is conducted for pollutants for which the air quality in the vicinity of the plant is designated attainment, which in Charles County includes SO2, NOX, CO PM/PM10, SAM, and lead.
The project will not create an emissions increase from other Morgantown stationary sources or increase the capacity to burn more coal in the Morgantown boiler Units 1 and 2. Therefore, only the emissions from the proposed project equipment, which includes new equipment for the ash beneficiation process, as well as the use of existing and new material
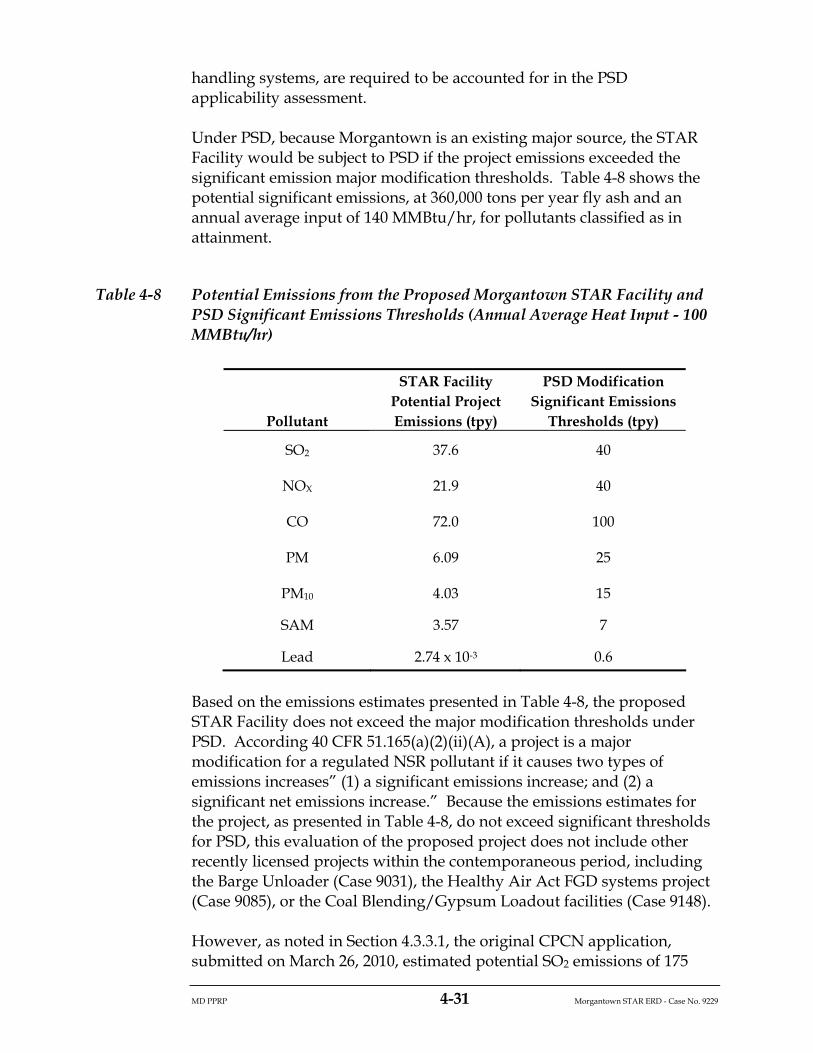
MD PPRP 4-31 Morgantown STAR ERD - Case No. 9229
handling systems, are required to be accounted for in the PSD applicability assessment.
Under PSD, because Morgantown is an existing major source, the STAR Facility would be subject to PSD if the project emissions exceeded the significant emission major modification thresholds. Table 4-8 shows the potential significant emissions, at 360,000 tons per year fly ash and an annual average input of 140 MMBtu/hr, for pollutants classified as in attainment.
Table 4-8 Potential Emissions from the Proposed Morgantown STAR Facility and PSD Significant Emissions Thresholds (Annual Average Heat Input - 100 MMBtu/hr)
Pollutant
STAR Facility Potential Project Emissions (tpy)
PSD Modification Significant Emissions
Thresholds (tpy)
SO2 37.6 40
NOX 21.9 40
CO 72.0 100
PM 6.09 25
PM10 4.03 15
SAM 3.57 7
Lead 2.74 x 10⁻³ 0.6
Based on the emissions estimates presented in Table 4-8, the proposed STAR Facility does not exceed the major modification thresholds under PSD. According 40 CFR 51.165(a)(2)(ii)(A), a project is a major modification for a regulated NSR pollutant if it causes two types of emissions increases” (1) a significant emissions increase; and (2) a significant net emissions increase.” Because the emissions estimates for the project, as presented in Table 4-8, do not exceed significant thresholds for PSD, this evaluation of the proposed project does not include other recently licensed projects within the contemporaneous period, including the Barge Unloader (Case 9031), the Healthy Air Act FGD systems project (Case 9085), or the Coal Blending/Gypsum Loadout facilities (Case 9148).
However, as noted in Section 4.3.3.1, the original CPCN application, submitted on March 26, 2010, estimated potential SO2 emissions of 175

MD PPRP 4-32 Morgantown STAR ERD - Case No. 9229
tpy. In the July 20, 2010 CPCN application amendment, Mirant re-evaluated the operational parameters of the STAR Facility to reduce emissions from all pollutants below major source modification thresholds. To accomplish this decrease in emissions, Mirant made the following modifications to the proposed project:
An improved wet FGD scrubber with an improved emissions vendor guarantee of reducing SO2 emissions 98.3 percent compared to the original 95 percent control vendor guarantee;
The throughput of fly ash to the STAR Facility was reduced from 400,000 tpy to 360,000 tpy; and
The residual percent sulfur in the fly ash was increased from 0 to 0.03 percent based on data from the TRC Emissions Test Report (TRC, 2009).
These changes in design and operational parameters assisted Mirant in projecting compliance with the SO2 limit of 40 tpy. However, under the proposed operating conditions, the adjustment of emissions based on 100 MMBtu/hr (instead of the maximum short-term rating of 140 MMBtu/hr) assisted Mirant in projecting compliance with the SO2 and CO major source modification limits of 40 tpy and 100 tpy, respectively.
As a means of demonstrating compliance with the PSD major modification emissions limits, Mirant has proposed to install CEMS that meet the accuracy and quality assurance requirements in 40 CFR 60 Appendix B. Installation of CEMS will allow Mirant operational flexibility of the STAR process reactor given the expected variability of the sulfur content in the fly ash, as well as make adjustments in the heat input of the reactor and the control settings of the FGD system, while providing for a method to continuously monitor emissions and evaluate compliance with proposed emission limits. According to Mirant’s response to PPRP Data Request No. 4, Question 4-3 (received on August 18, 2010), the CEMS data will be recorded hourly and will be summarized monthly to produce 12-month rolling averages. The emissions data will be provided to MDE-ARMA quarterly as part of Mirant’s on-going reporting requirements for the Morgantown Generating Station. Specific requirements related to compliance of the CEMS are included in the final licensing conditions for the project provided in Appendix D.
In addition to CEMS, to maintain compliance with the PSD major modification emissions limits, Mirant shall restrict annual fly ash throughput for the STAR Facility to 360,000 tpy based on a consecutive 12-month period, rolling monthly.

MD PPRP 4-33 Morgantown STAR ERD - Case No. 9229
4.4.1.2 Applicability of NA-NSR Permitting Regulations
As mentioned previously, Charles County, in which the Morgantown facility is located, is a nonattainment area for ozone and PM2.5. Because the area is in nonattainment for ozone, the Morgantown STAR Facility was evaluated to determine whether the NOX or VOC emissions from the project exceed a significant emissions increase of 25 tpy, the trigger level for NA-NSR applicability. Additionally, emissions from the project were evaluated to determine if the project caused a significant increase in emissions of 10 tpy of PM2.5 directly, or if the project has the potential to emit PM2.5 as a precursor (SO2 and NOX) in excess of 40 tpy.
On May 16, 2008, EPA promulgated final rules for the implementation of the NSR for PM2.5. Under the final rule, major sources of PM2.5 will be subject to the requirements of NSR after July 16, 2008. If a state has a SIP-approved NA-NSR program, which is the case for Maryland, the requirements of 40 CFR Part 51, Appendix S, will be in effect during an interim period in which states develop PM2.5-specific NA-NSR requirements and the time in which EPA approves the revised SIP submitted by the state to incorporate the requirements of the final rule. The key provisions of Appendix S require LAER for all major PM2.5 sources and require major sources to obtain emission offsets for any increases of direct PM2.5 and its precursors (if above the significant emission thresholds).
Table 4-9 shows the potential significant emissions, at 360,000 tons per year fly ash throughput and an annual average heat input of 100 MMBtu/hr, for pollutants classified as nonattainment.
Based on the emissions estimates presented in Table 4-9, the proposed STAR Facility does not exceed the major modification NA-NSR thresholds. According COMAR 26.11.17.02F(1): “A project is a major modification for a regulated NSR pollutant if it causes a significant emissions increase and a significant net emissions increase. The project is not a major modification if it does not cause a significant emissions increase.” Because the emissions estimates for the project, as presented in Table 4-9, do not exceed significant thresholds for NA-NSR, this evaluation of the proposed project does not include other recently licensed projects within the contemporaneous period, including the Barge Unloader (Case 9031), the Healthy Air Act FGD systems project (Case 9085), or the Coal Blending/Gypsum Loadout facilities (Case 9148).

MD PPRP 4-34 Morgantown STAR ERD - Case No. 9229
Table 4-9 Potential Emissions from the Proposed Morgantown STAR Facility and NA-NSR Significant Emissions Thresholds (Annual Average Heat Input – 100 MMBtu/hr)
Pollutant
STAR Facility Potential Project Emissions (tpy)
NA-NSR Modification
Significant Emissions Thresholds (tpy)
NOX 21.9 25
VOC 7.23 25
PM2.5 (direct) 2.42 10
PM2.5 (precursors SO2 and NOX)
37.6 (SO2) 21.9 (NOX)
40
In Mirant’s response to PPRP Data Request No. 1, Question 1-1(a) (received on June 14, 2010), Mirant provided a NA-NSR applicability analysis that concluded that the STAR Facility project would be a major source for PM2.5 (because SO2 exceeded the precursor threshold). However, the changes in design and operational parameters in the July 20, 2010 CPCN application amendment assisted Mirant in projecting compliance with the SO2 limit of 40 tpy.
However, under the proposed operating conditions, the adjustment of emissions based on 100 MMBtu/hr (instead of the maximum short-term rating of 140 MMBtu/hr) assisted Mirant in projecting compliance with both the NOX (as an ozone precursor) and SO2 (as a PM2.5 precursor) major source modification limits of 25 tpy and 40 tpy, respectively.
As noted in the PSD discussion, to demonstrate compliance with the emissions limits, Mirant will install CEMS for NOX and SO2 that meet the accuracy and quality assurance requirements in 40 CFR 60 Appendix B to allow for flexibility in other operational parameters (e.g., heat input, FGD control efficiency). In addition to CEMS, to maintain compliance with the NA-NSR major modification emissions limits, Mirant shall restrict annual fly ash throughput for the STAR Facility to 360,000 tpy based on a consecutive 12-month period, rolling monthly.
4.4.1.3 Applicability of GHG Permitting Regulations
According to the PSD and Title V GHG Tailoring Rule finalized by EPA on May 13, 2010, if a permit is not received by January 2, 2011, the project will be subject to PSD review and Title V Permit requirements for GHG if
MD PPRP 4-35 Morgantown STAR ERD - Case No. 9229
the project is a major modification of a PSD criteria pollutant and if the modification CO2e emissions are greater than 75,000 tpy. If the permit is not received by July 1, 2011, modifications of existing facilities increasing GHG emissions by 75,000 tpy CO2e will be subject to PSD permitting requirements, regardless of whether they significantly increase emissions of any other pollutant. These requirements will include any GHG applicable requirements (e.g., GHG BACT requirements from a PSD source) and associated monitoring, recordkeeping and reporting.
Because the STAR Facility will not exceed significant emissions major modification thresholds for any traditional criteria pollutants, the project is a minor modification and will not be subject to PSD permitting requirements for GHGs under the January 2, 2011 deadline. Because the STAR Facility project is expected to be permitted prior to the July 1, 2011 deadline, the project is not subject to the GHG Tailoring Rule.
4.4.2 Federal Non-Permitting Requirements
Because the Morgantown STAR Facility is a minor modification under the PSD and NA-NSR, the Project is not subject to any major source emission control requirements (BACT or LAER). Further, based on the type of air emission source and the level of potential HAP emissions from the project (maximum individual HAP emission rate of 0.0102 tpy and total HAP emission rate of 0.0159 tpy) there are no National Emissions Sources of Hazardous Air Pollutants (NESHAP) standards applicable to this facility.
According to the Mirant CPCN application, the project is not subject to any New Source Performance Standards (NSPS) under 40 CFR Part 60. However, PPRP and MDE-ARMA evaluated the applicability of the STAR Facility against the following NSPS:
NSPS Subpart Db – Standards of Performance for Industrial-Commercial-Institutional Steam Generating Units; and
NSPS Subpart CCCC – Standards of Performance for Commercial and Industrial Solid Waste Incineration Units for Which Construction is Commenced After November 30, 1999 or for Which Modification or Reconstruction is Commenced on or After June 1, 2001
The applicability determination of these NSPS requirements are discussed in Sections 4.4.2.1 and 4.4.2.2 below. Applicability with the EPA Mandatory GHG Reporting Rule (40 CFR Part 98) is discussed in Section 4.4.2.3.

MD PPRP 4-36 Morgantown STAR ERD - Case No. 9229
4.4.2.1 NSPS Subpart Db – Standards of Performance for Industrial-Commercial-Institutional Steam Generating Units
NSPS Subpart Db applies to each steam generating unit that commences construction, modification, or reconstruction after June 19, 1984, and that has a heat input capacity from fuels combusted in the steam generating unit of greater than 100 MMBtu/hr.
Although the STAR process reactor (rated at 140 MMBtu/hr) is greater than 100 MMBtu/hr, Mirant confirmed in its response to PPRP Data Request No. 3, Question 3-9 (received on July 14, 2010) that the STAR process reactor would not recover thermal energy in the form of steam or hot water. Mirant also confirmed that the STAR Facility reactor would not transfer heat indirectly to a process material; rather, combustion gases come in direct contact with the process material fly ash. As such, PPRP and MDE-ARMA have concluded that the STAR Facility reactor is not a steam generating unit and the Morgantown STAR Facility is not subject to NSPS Subpart Db.
It should be noted that in the Federal Register of June 4, 2010, EPA proposed, under Section 112 of the Clean Air Act, NESHAP for Industrial, Commercial, and Institutional Boilers and Process Heaters (40 CFR 63 Subpart DDDDD, referred to as the Boiler Maximum Achievable Control Technology (MACT) standard) and presently intends to issue the final rule in December 2010. Because the project is a not a major modification, the Morgantown STAR Facility is not subject to this Boiler MACT. However, based on the preamble and definitions of the proposed rule, and the description of the sources described above, the STAR process reactor does not meet the definitions of a boiler or process heater, therefore NESHAP Subpart DDDDD is not applicable to the STAR Facility regardless of the type of modification.
4.4.2.2 NSPS Subpart CCCC – Standards of Performance for Commercial and Industrial Solid Waste Incineration Units for Which Construction is Commenced After 30 November 1999 or for Which Modification or Reconstruction is Commenced on or After 1 June 2001
In the Federal Register of June 4, 2010, EPA proposed, under Section 129 of the Clean Air Act, NSPS for Commercial and Industrial Solid Waste Incinerators (CISWI) (40 CFR 60 Subpart CCCC). The final rule was published on March 21, 2011 but was delayed by EPA in the Federal Register dated May 18, 2011. Concurrently, In the June 4, 2010 Federal Register, EPA proposed, under the Resource Conservation and Recovery Act (RCRA), a rule for “Identification of Non-Hazardous Secondary Materials That Are Solid Wastes” when burned in combustion units, as

MD PPRP 4-37 Morgantown STAR ERD - Case No. 9229
opposed to being “fuels” or “ingredients” when combusted. The final rule was published in the Federal Register on March 21, 2011.
An emission source is subject to the proposed CISWI Rule if it would combust solid or liquid materials defined to be commercial or industrial solid waste under the proposed EPA Solid Waste Identification Rule. There is no de minimis threshold for applicability based on a minimum facility size or processing rate. However, under the proposed Solid Waste Identification Rule, if a material is determined not to be a solid waste material, it is then classified as being either a “fuel” or a process “ingredient” when combusted. For such non-waste “fuels” or “ingredients,” combustion of the material would not be regulated under the CISWI Rule.
The criteria by which a given material can be demonstrated to be an ingredient, and not solid waste, are summarized below:
The material satisfies both of the following conditions: (1) has not been previously “discarded” (e.g., landfilled) and (2) meets specified “legitimacy criteria” for ingredients, as detailed in the proposed Rule, or
If the material was previously discarded, it must satisfy both of the following conditions: (1) be “processed” into a non-waste material, and (2) meet the “legitimacy criteria” for an ingredient.
The legitimacy criteria for an ingredient, as given in the proposed Solid Waste Identification Rule, are summarized below. All of the following legitimacy criteria must be met:
Is the material managed as a “valuable commodity?”
Does the material “provide a useful contribution” to the production or manufacturing process?
Is the ingredient material used to produce a valuable product or intermediate?
Does use of the ingredient material result in products that have contaminant levels comparable to those found in traditional products that are manufactured without use of the ingredient material?
The preamble to the proposed Solid Waste Identification Rule notes that if coal fly ash is handled as a commodity within continuous commerce when it is marketed to cement kilns as an alternative ingredient, coal fly ash would not be considered a waste if it met the legitimacy criteria [75 Federal Register 107]. Additional insight from EPA is provided in the preamble to the proposed Solid Waste Identification Rule. EPA clearly
MD PPRP 4-38 Morgantown STAR ERD - Case No. 9229
states: “With respect to CCRs [Coal Combustion Residuals, including fly ash], we believe the primary purpose of their use is as an ingredient [rather than as a fuel]; thus, provided the CCRs satisfy the legitimacy criteria for ingredients and are not discarded in the first instance [e.g., landfilled], they would not be considered a solid waste [75 Fed. Reg. 107, p. 31868 (June 4, 2010)].” This appears to be a clear indication by EPA that, under the proposed Rule, EPA would consider high-carbon fly ash that was not previously landfilled and meets the Rule’s legitimacy criteria to be a valid ingredient in a process, not a solid waste.
Mirant’s response to PPRP Data Request No. 5, Question 5-1, (received on September 8, 2010) asserts that the fly ash meets all of the legitimacy criteria for an ingredient as outlined above. However, more detail (i.e., including technical data, analysis) is required to demonstrate that the unprocessed fly ash satisfies the requirements of an “ingredient.”
Therefore, based on the definitions and guidance of the proposed rule, if the fly ash used in the STAR Facility process meets the legitimacy criteria, as asserted by Mirant, the unprocessed fly ash would be classified as an “ingredient” and not a “solid waste.” As a result, NSPS Subpart CCCC, as proposed, would not be applicable to the Morgantown STAR Facility.
4.4.2.3 Greenhouse Gas Mandatory Reporting Rule
On September 22, 2009, the EPA issued a final rule for mandatory reporting of GHG emissions from stationary sources in the United States. Under this rule, any facility that operates a source category that is listed in 40 CFR 98.2(a)(1) and (2) must report annual GHG emissions. Even if a facility does not operate as a listed source category, it is required to report annual GHG emissions from stationary combustion sources that meet the following requirements, as presented in 40 CFR 98.2(a)(3):
The facility has an aggregate maximum rated heat input capacity from stationary fuel combustion units of 30 MMBtu/hr or greater; and
The facility actually emits 25,000 metric tons per year of CO2e or more in combined emissions from all stationary fuel combustion sources.
The proposed STAR process reactor is rated at 140 MMBtu/hr, greater than the 30 MMBtu/hr threshold. In addition, as noted in Section 4.3.8, the project is expected to emit greater than 25,000 metric tons per calendar year CO2e. As such, the Morgantown STAR Facility is projected to be subject to the GHG Mandatory Reporting Rule requirements as described in 40 CFR Part 98.

MD PPRP 4-39 Morgantown STAR ERD - Case No. 9229
4.4.3 State Requirements
In addition to the facility-wide requirements already addressed in Mirant’s Title V Operating Permit for Morgantown, which will also apply to the Morgantown STAR Facility, the proposed STAR Facility will be subject to specific State air quality requirements from the Code of Maryland Regulations (COMAR) Title 26, Subtitle 11. Applicable COMAR requirements are included in the final licensing conditions for the project (Appendix D).
4.4.3.1 Control of Incinerators
PPRP and MDE-ARMA evaluated the applicability of the STAR Facility against the State of Maryland Incinerator requirements (COMAR 26.11.08). According to this section, the definition of "incinerator" means a furnace or combustion unit that uses controlled flame combustion for the thermal destruction of municipal solid waste, industrial waste, special medical waste, or sewage sludge. "Incinerator" does not mean a hazardous waste incinerator.
However, the definition of solid waste, as described in COMAR 26.13.02 states that: “Materials are not solid wastes when they can be shown to be recycled by being used or reused as ingredients in an industrial process…” Furthermore, “fly ash waste” is a listed as a material not considered hazardous waste per COMAR 26.13.02.04-1. Consistent with federal regulation determinations that the fly ash will be used an ingredient to create a substitute to Portland cement, the fly ash is not considered a solid waste. As a result, PPRP and MDE-ARMA concluded that the facility is not subject to the COMAR 26.11.08 Incinerator requirements.
4.4.3.2 Control of Fuel Burning Equipment, Stationary Internal Combustion Engines, and Certain Fuel Burning Installations
PPRP and MDE-ARMA evaluated the applicability of the STAR Facility against the State of Maryland fuel burning requirements (COMAR 26.11.09). According to this section, the definition of "Fuel Burning Equipment" means any boiler or furnace that has the primary function of heating air, water, or any other medium through indirect heat transfer from the burning of fuels. Because the fly ash is heated through direct heat transfer in the STAR process reactor and the reactor is not a boiler or furnace, the STAR process reactor is not subject to the State of Maryland fuel burning requirements under COMAR 26.11.09.

MD PPRP 4-40 Morgantown STAR ERD - Case No. 9229
4.4.3.3 General Source State Requirements
The proposed STAR Facility is not subject to the fuel burning equipment regulations under COMAR 26.11.09 or any other source-specific regulations. As such, the Morgantown STAR Facility is subject to, but not limited to, the following general source regulations:
COMAR 26.11.06.02C – Visible Emissions from General Sources – Prohibits Mirant from causing or permitting the discharge of emissions from any installation or building (i.e., confined, non-fuel burning equipment sources), other than water in an uncombined form, which are greater than 20 percent opacity;
COMAR 26.11.06.03B – Particulate Matter from Confined Sources – Prohibits Mirant from discharging into the outdoor atmosphere from any confined source (e.g., the storage silos), particulate matter in excess of 0.05 grains per dry standard cubic feet (gr/dscf) or 114 milligrains per dry standard cubic meter (mg/dscm); and
COMAR 26.11.06.03C – Particulate Matter from Unconfined Sources – Prohibits Mirant from causing or permitting emissions from an unconfined (i.e., fugitive) source without taking reasonable precautions to prevent particulate matter from becoming airborne.
COMAR 26.11.06.05B(1) – Sulfur Dioxide Emissions from General Sources – Prohibits Mirant from causing or permitting the discharge of emissions in the atmosphere gases containing more than 500 ppm of SO2;
COMAR 26.11.06.05B(2) – Sulfuric Acid Emissions from General Sources – Prohibits Mirant from causing or permitting the discharge of emissions into the atmosphere gases containing sulfuric acid, sulfur trioxide, or any combination of them greater than 35 milligrams per cubic meter of emissions of gases reported as sulfuric acid; and
COMAR 26.11.06.06B(2)(c) – VOC Emissions from General Sources – Prohibits Mirant from causing or permitting the discharge of VOC emissions from any installation in excess of 20 lb/day unless the discharge is reduced by 85 percent or more overall.
Specifically regarding the standard identified in COMAR 26.11.06.06B(2)(c), the STAR process reactor will reduce VOC emissions by 85 percent or more overall through thermal reduction. In the response to PPRP Data Request No. 7, Question 7-1 (received on October 14, 2010), Mirant provided EPA’s Air Pollution Control Technology Fact Sheet, Thermal Incinerators, EPA 452/F-03-022. According to the EPA Fact Sheet, thermal destruction of organics typically occurs at 1,100 – 1,200oF. Furthermore, design efficiencies of thermal incinerators range from 98 to
MD PPRP 4-41 Morgantown STAR ERD - Case No. 9229
99.99 percent and above. The STAR process reactor will operate at temperatures similar to those of a thermal incinerator (1,400oF or greater). Based on the operating conditions of the STAR process reactor and the information provided in the EPA Fact Sheet, the STAR process reactor will reduce VOC emissions by 85 percent or more overall.
Additionally, the STAR Facility is subject to, but not limited to, the following State of Maryland regulations:
COMAR 26.11.01.04A-C – Testing and Monitoring – Requires Mirant to conduct additional stack tests as required by MDE-ARMA to determine compliance with COMAR Title 26, Subtitle 11. This testing will be done at a reasonable time. Mirant shall follow test methods described in COMAR 26.11.01.04C to determine compliance;
COMAR 26.11.01.05-1 – Emission Statements – Requires Mirant to submit a certified, facility-wide emission statement to MDE-ARMA by April 1 of each year;
COMAR 26.11.01.07C-F – Malfunctions and Other Temporary Increase of Emissions – Requires Mirant to report the onset and the termination of the occurrence of excess emissions, inclusive of periods of start-up and shutdown, expected to last or actually lasting for one hour or more to MDE-ARMA by telephone;
COMAR 26.11.03.19 – Permits, Approval, and Registration – Requires Mirant to update the existing Morgantown Part 70 Operating Permit (No. 24-017-00014) to include applicable STAR Facility requirements in the application for the next renewal of the Part 70 Operating Permit;
COMAR 26.11.06.03D – Particulate Matter From Materials Handling and Construction – Prohibits Mirant from causing or permitting any material to be handled, transported, or stored, or a building, its appurtenances, or a road to be used, constructed, altered, repaired, or demolished without taking reasonable precautions to prevent particulate matter from becoming airborne;
COMAR 26.11.06.08 – Nuisance – Prohibits Mirant from operating or maintaining any source in such a manner that a nuisance is created;
COMAR 26.11.06.09 – Odors – Prohibits Mirant from causing or permitting the discharge into the atmosphere of gases, vapors, or odors beyond the property line in such a manner that a nuisance or air pollution is created; and
COMAR 26.11.15.03A(2) – Toxic Air Pollutants (TAPs) – Requires Mirant to comply with the requirements for the assessment of TAPs set forth in COMAR 26.11.15 and 26.11.16.

MD PPRP 4-42 Morgantown STAR ERD - Case No. 9229
4.4.3.4 Continuous Compliance
The Morgantown STAR Facility is subject to federally enforceable emissions limits to avoid triggering major source modification requirements under PSD for SO2 and CO and NA-NSR for ozone (exceeds NOX precursor limit) and PM2.5 (exceeds SO2 precursor limit). Per COMAR 26.11.02.02H, MDE-ARMA may include terms and conditions in any permit to ensure continuous compliance. In order to assure compliance with the emissions limits, the permit contains provisions to ensure that a resulting emissions limit has been demonstrated to be quantifiable, accountable, enforceable, and based on replicable procedures. As such, the Morgantown STAR Facility is subject to additional regulations outlined in the final licensing conditions in Appendix D.
4.5 AIR QUALITY IMPACT MODELING
4.5.1 Impact Assessment Background and Objective
4.5.1.1 Regulatory Background
The NAAQS are concentrations in the ambient air that have been established by the EPA at concentrations intended to protect human health and welfare, with an adequate margin of safety. There are two types of NAAQS: primary and secondary. Primary standards set limits to protect public health, including the health of "sensitive" populations such as asthmatics, children, and the elderly. Secondary standards set limits to protect public welfare, including protection against decreased visibility, damage to animals, crops, vegetation, and buildings. The NAAQS are mathematically defined as concentrations in the ambient air in units of measure including ppm by volume and micrograms per cubic meter of air (µg/m3). The NAAQS for the criteria pollutants NO2, SO2, CO, lead, PM10, PM2.5, and ozone are shown in Table 4-10.
In a CPCN project, if the emissions from the major source exceed the significant modification thresholds for any regulated pollutant, the impacts from the project are required to be evaluated for comparison with ambient air quality thresholds established by EPA. If the impacts from a project exceed the significant impact levels (SILs), then the cumulative impacts of all the sources at the facility and surrounding facilities (within 50 kilometers) are required to be modeled and compared against the NAAQS and the PSD increment thresholds.

MD PPRP 4-43 Morgantown STAR ERD - Case No. 9229
Table 4-10 Summary of NAAQS
Pollutant Averaging Time Primary NAAQS
Secondary NAAQS
PSD Increment
Monitoring de minimis
Significant Impact Level
NO2 Annual 100 (0.053 ppm)
100 (0.053 ppm)
25 14 1
1-hour 189 (0.100 ppm)
189 (0.100 ppm)
- - 7.5 (4 ppb)*
Annual 80 (0.03 ppm)
__ 20 __ 1
24-hr 365 (0.14 ppm)
__ 91 13 5
3-hr 1300 (0.5 ppm)
512 __ 25
1-hr 196 (75 ppb)
__ __ 7.9 (3 ppb) *
8-hr 10,000 (9 ppm)
__ __ 575 500
1-hr 40,000 (35 ppm)
__ __ __ 2000
Lead Rolling 3-month average
0.15 0.15 __ 0.1 __
1-hr 235 (0.12 ppm)
235 (0.12 ppm)
__ 100 tpy VOC __
8-hr 147 (0.075 ppm)
147 (0.075 ppm)
__ __
* - Interim SILsAll concentrations are in ug/m3 unless otherwise mentioned
SO 2
CO
Ozone
4.5.1.2 Overall Objectives of Air Quality Analysis
The original CPCN application submitted by Mirant triggered the requirements of PSD for SO2. Mirant included an analysis of the resulting ambient impacts due to these emissions in their original CPCN application. In July 2010, Mirant submitted a supplement to amend its CPCN application, which restricted the SO2 emissions increase from the project to less than the PSD major source thresholds. Therefore, an analysis of air quality impacts from the project was not required to be conducted. In June 2010, EPA finalized the 1-hour NAAQS for SO2, which is far more stringent than the NAAQS for other averaging periods. Earlier in February 2010, EPA finalized the 1-hour NAAQS for NOx, which is also more stringent than the annual NAAQS. PPRP and MDE-ARMA were concerned that the emissions from the project could potentially have an impact on the 1-hour SO2 and NO2 NAAQS, given the revised lower concentrations. Therefore, PPRP and MDE-ARMA evaluated if the impacts of the emissions from the project sources alone would cause an exceedance of the short-term (i.e., 1-hour) NAAQS for either SO2 or NOX in the vicinity of the facility.

MD PPRP 4-44 Morgantown STAR ERD - Case No. 9229
Over the years, PPRP has been involved with evaluating impacts of regional air emissions sources on water quality in the Chesapeake Bay. In this analysis, the impacts of the SO2 and NO2 emissions from the STAR Facility on nutrient loading to the Chesapeake Bay was evaluated. Finally, the SO2 emissions from the project are proposed to be controlled using a wet gas scrubber system, which could potentially cause a visible plume in the vicinity of the facility. In this modeling analysis, the potential for formation of a visible plume due to the operations of the scrubber was also evaluated.
4.5.2 Short-term NAAQS Analysis
In this modeling analysis, the impacts of the short-term increase in emissions of NOX and SO2 from the project were compared with the newly finalized 1-hour NAAQS for both pollutants. As discussed earlier, only the emissions from the project were modeled to evaluate if the project alone could cause a potential NAAQS exceedance. On August 23, 2010, EPA issued an interim guidance memo, which provided recommendations on the approach to be taken for projects which trigger the requirements of PSD for SO2. The guidance did not address any requirements for minor source permit applications such as the STAR project. However, the guidance includes an interim SIL, which should be used as a screening level for evaluating project only impacts. Earlier, on June 28, 2010, EPA issued a similar interim guidance memo for modeling NOX impacts from major PSD projects, which also included a SIL for 1-hour NOX. The SIL for SO2 and NOX are included here for reference only.
4.5.2.1 Modeling Methodology
The impacts of the emissions from the project on SO2 NAAQS were evaluated using EPA’s regulatory dispersion model, AERMOD (version 09292). All the input parameters used in this analysis were developed by Mirant as a part of the analysis conducted in the original CPCN application for compliance with PSD regulation and supplied to PPRP and MDE-ARMA for review. In this analysis, PPRP and MDE-ARMA verified the input parameters; methodology used in preparing these modeling inputs, and used it in determining the potential impacts on NAAQS for SO2.
Meteorological Data
The most recent version of the AERMOD meteorological processor, AERMET (version 06341) was used to process the surface meteorological data with upper air data. In this analysis, Mirant used surface and upper air data from Ronald Reagan National Airport (DCA, Wban: 13743) and

MD PPRP 4-45 Morgantown STAR ERD - Case No. 9229
Sterling, VA (Wban: 93734), respectively, for the time period 1991-1995. Land use characteristics are important in AERMET, as they are used to develop boundary layer micrometeorological variables needed by AERMOD. AERMET also requires that the land use surrounding the meteorological data collection site be characterized and input into the model. Land use is characterized by identifying the surface roughness, Bowen ratio, and albedo of the surrounding land cover. These micrometeorological parameters are used by AERMET, along with the standard surface meteorological data, to determine the stability state of the boundary layer of the atmosphere. Mirant outlined the micrometeorological variables chosen for the area surrounding both DCA and project site in its modeling protocol. Mirant assigned the values of surface roughness, Bowen ratio, and albedo on a wind direction specific basis, using twelve 30-degree wind direction sectors. The values for these parameters were also chosen on a monthly basis. Following the meteorological data with project site land use parameters resulted in more conservative results, meteorological data with site land use parameters is found adequate to other subsequent air quality model evaluations for the STAR Facility.
PPRP and MDE-ARMA independently reviewed the meteorological data prepared by Mirant and determined that the meteorological data was adequate and complete for use in this analysis.
Source Characterization
The STAR Facility will involve the combustion of fly ash generated during the combustion of coal primarily at the Morgantown and Chalk Point Generating Stations. The process will involve the following emission sources:
140 MMBtu/hr STAR process reactor and associated components. The reactor will also be capable of firing up to 65 MMBtu/hr of propane for process start-up or shutdown; and
Material handling systems to transfer and store fly ash.
In this analysis, PPRP and MDE-ARMA evaluated the impacts of the SO2 and NOx emissions from the STAR process only. The only source of SO2 and NOx emissions in this project is the STAR process reactor. The stack parameters and emission rates associated with burning 100 percent raw fly ash (worst-case scenario for ambient impacts) in the boiler is shown in Table 4-11. The location of the STAR process reactor is shown in Figure 4-3.

MD PPRP 4-46 Morgantown STAR ERD - Case No. 9229
Table 4-11 Summary of Source Information for the Morgantown STAR Facility
Model ID UTM Coordinates
(Zone 18) Stack
Height Stack
Diameter Exhaust
Temperature Exit
Velocity SO2
Emissions NOx
Emissions
East (m) North (m) (ft) (ft) (F) (ft/s) (lb/hr) lb/hr
SEFAS1 327,465 4,247,449 125 4 140 49.11 11.87 7
(b) Metric Units
Model ID UTM Coordinates
(Zone 18) Stack
Height Stack
Diameter Exhaust
Temperature Exit
Velocity SO2
Emissions NOx
Emissions
East (m) North (m) (m) (m) (K) (m/s) (g/s) (g/s)
SEFAS1 327,465 4,247,449 38.1 1.22 333.15 14.97 3.62 2.13
Receptor Grid
The receptor grid used in this modeling analysis was developed by Mirant as a part of the original CPCN application. The receptor grid extended up to 20 kilometers from the facility. For this minor modification air quality modeling analysis, PPRP and MDE-ARMA independently created a receptor grid extending up to 5 kilometers from the Morgantown facility. The receptor spacing was set at 50 m along the fence line and up to a distance of 500 m from fence line; 100 m spacing from 500 m to 2.5 kilometers; and 200 m spacing from 2.5 to 5 kilometers from the facility. A total of 3,587 receptors were included in this modeling analysis. Terrain elevations were assigned to each receptor, and a hill scale was calculated with the AERMAP (version 09040) terrain processor. AERMAP is a companion program to AERMOD that utilizes digitized USGS digital elevation model (DEM) data files to assign elevations and hill scales to receptors. The hill scale assigned to each receptor is used by AERMOD to determine the appropriate terrain algorithm to use for the receptor. The location of receptors in the vicinity of the Morgantown facility is shown in Figure 4-4.

MD PPRP 4-47 Morgantown STAR ERD - Case No. 9229
Figure 4-3 Map Showing Location of STAR Process Reactor

MD PPRP 4-48 Morgantown STAR ERD - Case No. 9229
Figure 4-4 Receptors in the Vicinity of Morgantown Facility
4.5.2.2 Results and Discussion
PPRP and MDE-ARMA modeled the impacts of the short-term emissions of SO2 and NOX from the project for comparison with the 1-hour NAAQS for both pollutants. Table 4-12 summarizes the maximum predicted 1-hour values for both pollutants. In addition, the 99th percentile value (8th high) and the 98th percentile value (4th high) for NOX and SO2, respectively, are reported in Table 4-12. It can be seen from Table 4-12 that the maximum predicted impacts over five years of meteorological data does not exceed the NAAQS for NOX or SO2. Figures 4-5 and 4-6 display the contour plot showing the distribution of the maximum predicted model impacts associated with NOX and SO2, respectively. In both cases, the maximum values are predicted close to the property line and the model concentrations decrease rapidly with distance from the property line.

MD PPRP 4-49 Morgantown STAR ERD - Case No. 9229
Table 4-12 Summary of AERMOD Predicted Impacts for Comparison with Short-Term NAAQS
Pollutant AERMOD Predicted Impacts
Maximum Concentration
(ug/m3) NAAQS (ug/m3) 1991 1992 1993 1994 1995
SO2 110.83 196.3 104.64 106.52 110.83 81.89 62.03
NOX 65.02 188.1 61.39 62.49 65.02 48.05 36.39
Figure 4-5 Contour plot Showing Maximum Predicted 1-hour SO2 Concentrations

MD PPRP 4-50 Morgantown STAR ERD - Case No. 9229
Figure 4-6 Contour Plot Showing Maximum Predicted 1-hour NOX Concentrations
4.5.3 Nutrient Loading to Chesapeake Bay
An issue that is of on-going interest and concern to PPRP is the impact of atmospheric nitrogen on water quality in the Chesapeake Bay. Through the processes of wet and dry deposition, both onto the water surface and onto land areas within the Bay watershed, a significant quantity of nitrogen can reach the Bay from airborne sources of NOX and SO2. Although nitrogen is one of the essential nutrients for phytoplankton production in estuaries and coastal waters, too much nitrogen, combined with an abundance of other nutrients, can become a problem. Phytoplankton blooms, resulting from a high availability of nutrients, can reduce the amount of available oxygen due to bacterial decomposition of excess phytoplankton. Frequent phytoplankton blooms can result in hypoxia (a reduced supply of oxygen) or anoxia (a complete lack of oxygen) in the affected water body. These conditions can affect living resources in the water body, and reduce its value as a natural resource and as a source of livelihood and recreation. The Chesapeake Bay is the

MD PPRP 4-51 Morgantown STAR ERD - Case No. 9229
largest of the 130 estuaries in the United States, and has experienced periods of anoxia and degraded water and living resource quality increasingly this century due largely to manmade pollution. The proposed STAR project is located within the Chesapeake Bay watershed area.
PPRP has conducted deposition modeling to calculate nitrogen and sulfate loading in the vicinity of the proposed site. The model used for this deposition analysis was CALPUFF, a Lagrangian puff model that has been previously used in Maryland for addressing nutrient loading and secondary aerosol impacts. CALPUFF is an EPA guideline model that is capable of simulating the transport, dispersion, and atmospheric transformation of SO2 and NOX emissions, and the subsequent impacts on secondary aerosols as well as wet and dry deposition of sulfur and nitrogen containing species.
One year of three-dimensional meteorological data (MM5 data) for the year 2002 was used in this analysis. This MM5 data set was based on the Penn State/NCAR mesoscale model (MM5) runs conducted by the University of Maryland. The MM5 data was processed through the meteorological pre-processor available with the CALPUFF model- CALMET. A receptor grid was developed for the Morgantown facility that extended from the power plant to the edges of the Chesapeake Bay watershed (an area approximately 500 by 700 kilometers). Similar to the previous analyses conducted by PPRP, the quantity of nitrogen (i.e., nutrient load), which is deposited to the water bodies and which reaches the Bay is determined using USGS Spatially Referenced Regressions on Watershed Attributes (SPARROW) model. SPARROW (Version 2.0) of with land use characteristics for the year 1992 was used to calculate the mass sulfur loading to the Chesapeake Bay due to deposition within the watershed and subsequent transport to the Bay, and due to deposition directly on the Bay waters. A summary of CALPUFF sulfur deposition results is shown in Table 4-13. The total sulfur deposition within the Chesapeake Bay watershed is predicted to be approximately 8,300 kg, out of which nearly 25 percent is delivered to the Chesapeake Bay.
Table 4-13 Predicted Estimate of Nutrient (Sulfur) Loading to Chesapeake Bay Due to the Proposed STAR Facility
Total Loading (kg S)
Total Delivered (kg S)
Dry 3,073 721Wet 5,244 1,448T otal 8,322 2,170

MD PPRP 4-52 Morgantown STAR ERD - Case No. 9229
Figure 4-7 displays a contour plot showing the distribution of the nutrient load resulting from the STAR Facility within Maryland and the Chesapeake Bay watershed. As seen from the figure, the deposition load is high close to the source and decreases rapidly with distance from the source.
Figure 4-7 Contour Plot Showing the Deposition of Sulfur Within the Chesapeake Bay
4.5.4 Visible Plume Analysis
The wet FGD system used to control SO2 emissions from the STAR project will result in an increased quantity of water vapor to be discharged through the FGD stack. The water vapor has the potential to form a visible plume when atmospheric conditions favor condensation of vapor into water droplets. An analysis of the visible plume impacts resulting from the installation of the wet FGD system on the coal-fired boilers was conducted as a part of the CPCN case associated with the scrubber
MD PPRP 4-53 Morgantown STAR ERD - Case No. 9229
installation (PSC Case 9085). In that case, the concern was the impact of the visible plume on the Governor Harry W. Nice Memorial Bridge, which was at approximately the same height as the stack exhaust height. As a part of the environmental review for this project, PPRP and MDE-ARMA were interested in evaluating the formation of a visible plume resulting from the STAR project scrubber at locations in the vicinity of the facility including the Governor Harry W. Nice Memorial Bridge. The following section describes the methodology used by PPRP and MDE-ARMA and the results associated with this analysis.
The formation of a visible plume in the vicinity of a scrubber is dependent on atmospheric conditions, primarily ambient temperature and relative humidity. These parameters determine how much capacity the atmosphere has to hold water in vapor form. When the atmosphere contains just enough water to reach this capacity, it is considered to be saturated. If more water is added, via natural or other causes, the excess vapor condenses and visible fog is formed. Most of the time, the actual amount of water present in the atmosphere is less than the saturation level. When water vapor in the scrubber plume, added to the water vapor already present, exceeds the saturation level, a visible plume is formed.
4.5.4.1 Modeling Methodology
The CALPUFF model includes a module which simulates the formation of visible plume resulting from emission sources such as cooling towers and wet gas scrubbers. A special option in the CALPUFF model, the “Fog” option, can enable the model to be used to predict plume induced fogging or icing events. The inputs required for predicting the formation of fog is processed through a preprocessor available with CALPUFF – FGEMISS. The FGEMISS preprocessor was used to create a specialized input file for CALPUFF containing information on hourly plume water vapor emission rate. The plume water emission rate was calculated based on the exhaust flow rate (acfm) and the moisture content of the exhaust gas (percent). The water emission rate was determined to be approximately 22,000 lb/hr.
The existing scrubber system on the coal-fired units at Morgantown will potentially contribute to the formation of a visible plume on the Governor Harry W. Nice Memorial Bridge as was discussed in the ERD for PSC Case No. 9085. Due to this potential contribution, one of the conditions of that CPCN involved the design and installation of a fog monitoring and warning system on the Governor Harry W. Nice Memorial Bridge. That system could be used in the event of a unique atmospheric event that would result in a visible plume from the STAR Facility potentially heading toward the Governor Harry W. Nice Memorial Bridge. The

MD PPRP 4-54 Morgantown STAR ERD - Case No. 9229
height of the existing Morgantown FGD stack is approximately 122 meters, which is significantly greater than that associated with the STAR Facility (38 meters). Additionally, the water vapor emission rate from the proposed STAR scrubber is less than 2 percent of that from the existing Morgantown scrubber. Therefore, based on these factors the plumes associated with both these scrubbers are not expected to interact nor have an increase in combined impacts. Consequently, the impacts from the cumulative impacts of the two scrubbers on visible plume is not evaluated in this modeling analysis.
The Fog module within CALPUFF could be run in two modes – receptor and plume modes. The receptor mode predicts the formation of visible plume at specific receptor locations, while the plume model predicts the characteristics of the visible plume including length and height. Though the concern in this case is impacts at locations in the vicinity of the facility; therefore, the model was run in both the plume and receptor modes. Receptors were placed at locations in the immediate vicinity along concentric rings at varying distances from the facility and along the Governor Harry W. Nice Memorial Bridge. Postprocessors were then applied to analyze the files produced by CALPUFF and to summarize visible plume height and length statistics, and to estimate the frequency of possible fogging and icing events locally at discrete receptors. The location of receptors used in the visible plume modeling is shown in Figure 4-8.
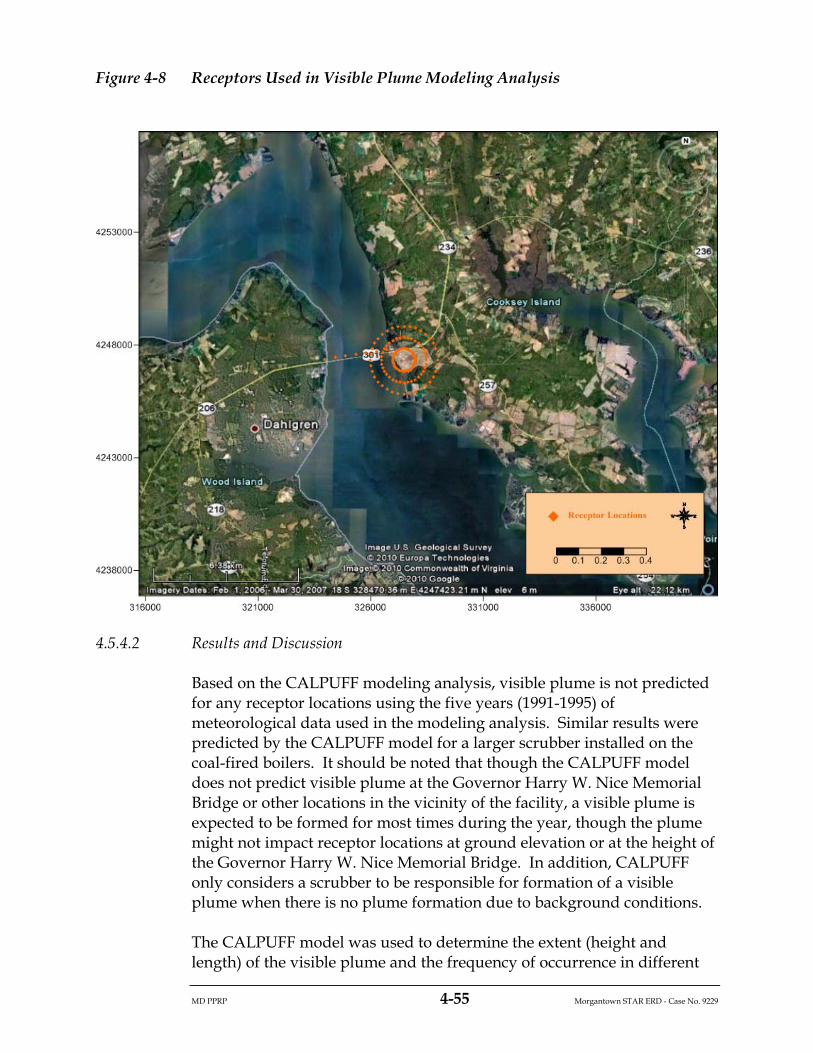
MD PPRP 4-55 Morgantown STAR ERD - Case No. 9229
Figure 4-8 Receptors Used in Visible Plume Modeling Analysis
4.5.4.2 Results and Discussion
Based on the CALPUFF modeling analysis, visible plume is not predicted for any receptor locations using the five years (1991-1995) of meteorological data used in the modeling analysis. Similar results were predicted by the CALPUFF model for a larger scrubber installed on the coal-fired boilers. It should be noted that though the CALPUFF model does not predict visible plume at the Governor Harry W. Nice Memorial Bridge or other locations in the vicinity of the facility, a visible plume is expected to be formed for most times during the year, though the plume might not impact receptor locations at ground elevation or at the height of the Governor Harry W. Nice Memorial Bridge. In addition, CALPUFF only considers a scrubber to be responsible for formation of a visible plume when there is no plume formation due to background conditions.
The CALPUFF model was used to determine the extent (height and length) of the visible plume and the frequency of occurrence in different
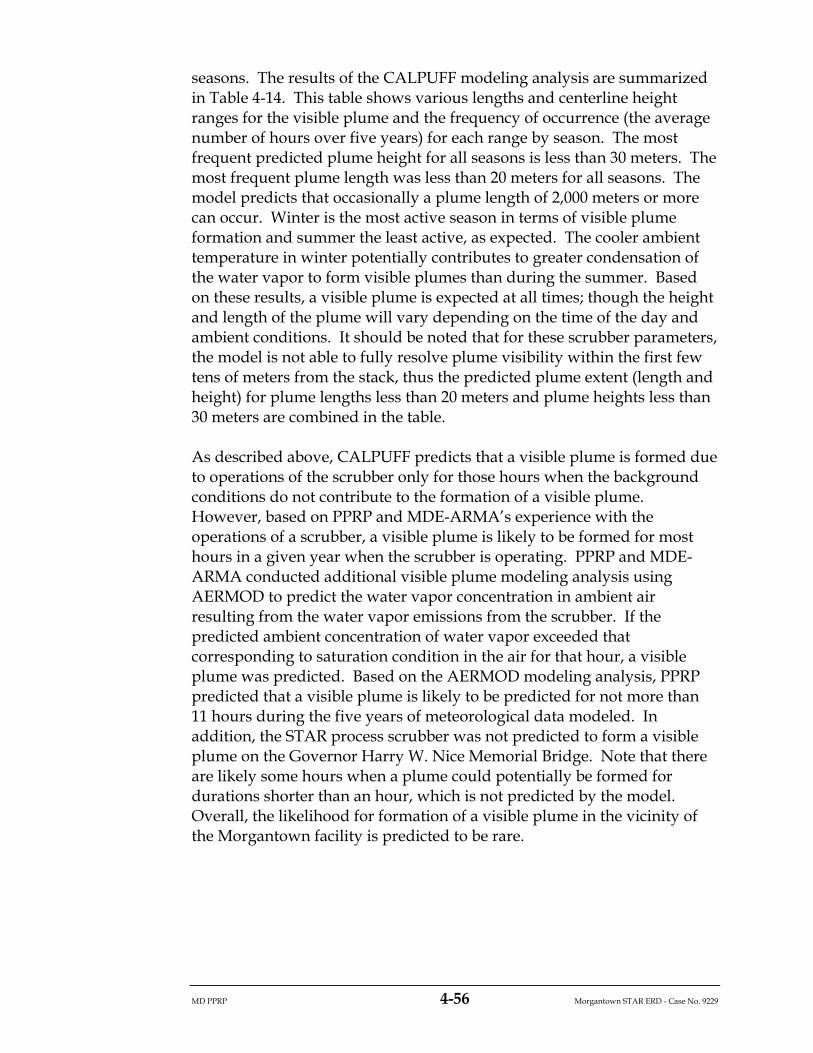
MD PPRP 4-56 Morgantown STAR ERD - Case No. 9229
seasons. The results of the CALPUFF modeling analysis are summarized in Table 4-14. This table shows various lengths and centerline height ranges for the visible plume and the frequency of occurrence (the average number of hours over five years) for each range by season. The most frequent predicted plume height for all seasons is less than 30 meters. The most frequent plume length was less than 20 meters for all seasons. The model predicts that occasionally a plume length of 2,000 meters or more can occur. Winter is the most active season in terms of visible plume formation and summer the least active, as expected. The cooler ambient temperature in winter potentially contributes to greater condensation of the water vapor to form visible plumes than during the summer. Based on these results, a visible plume is expected at all times; though the height and length of the plume will vary depending on the time of the day and ambient conditions. It should be noted that for these scrubber parameters, the model is not able to fully resolve plume visibility within the first few tens of meters from the stack, thus the predicted plume extent (length and height) for plume lengths less than 20 meters and plume heights less than 30 meters are combined in the table.
As described above, CALPUFF predicts that a visible plume is formed due to operations of the scrubber only for those hours when the background conditions do not contribute to the formation of a visible plume. However, based on PPRP and MDE-ARMA’s experience with the operations of a scrubber, a visible plume is likely to be formed for most hours in a given year when the scrubber is operating. PPRP and MDE-ARMA conducted additional visible plume modeling analysis using AERMOD to predict the water vapor concentration in ambient air resulting from the water vapor emissions from the scrubber. If the predicted ambient concentration of water vapor exceeded that corresponding to saturation condition in the air for that hour, a visible plume was predicted. Based on the AERMOD modeling analysis, PPRP predicted that a visible plume is likely to be predicted for not more than 11 hours during the five years of meteorological data modeled. In addition, the STAR process scrubber was not predicted to form a visible plume on the Governor Harry W. Nice Memorial Bridge. Note that there are likely some hours when a plume could potentially be formed for durations shorter than an hour, which is not predicted by the model. Overall, the likelihood for formation of a visible plume in the vicinity of the Morgantown facility is predicted to be rare.
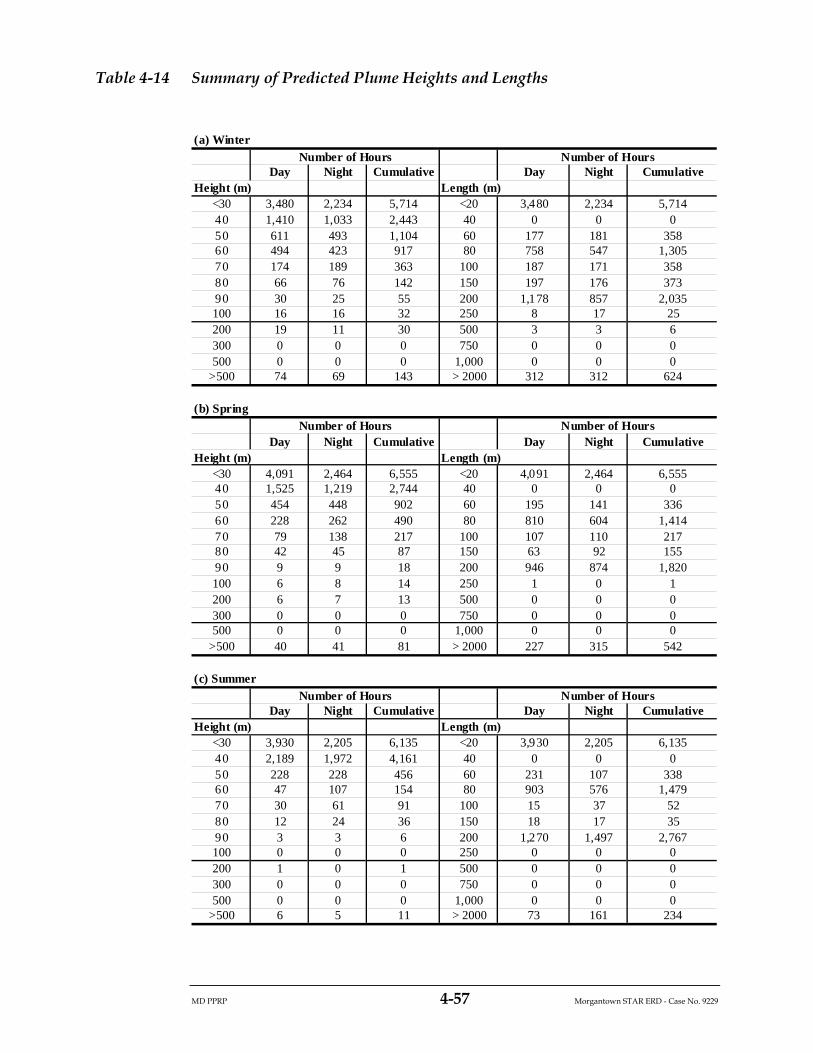
MD PPRP 4-57 Morgantown STAR ERD - Case No. 9229
Table 4-14 Summary of Predicted Plume Heights and Lengths
(a) Winter
Day Night Cumulative Day Night CumulativeHeight (m) Length (m)
<30 3,480 2,234 5,714 <20 3,480 2,234 5,71440 1,410 1,033 2,443 40 0 0 050 611 493 1,104 60 177 181 35860 494 423 917 80 758 547 1,30570 174 189 363 100 187 171 35880 66 76 142 150 197 176 37390 30 25 55 200 1,178 857 2,035100 16 16 32 250 8 17 25200 19 11 30 500 3 3 6300 0 0 0 750 0 0 0500 0 0 0 1,000 0 0 0
>500 74 69 143 > 2000 312 312 624
(b) Spring
Day Night Cumulative Day Night CumulativeHeight (m) Length (m)
<30 4,091 2,464 6,555 <20 4,091 2,464 6,55540 1,525 1,219 2,744 40 0 0 050 454 448 902 60 195 141 33660 228 262 490 80 810 604 1,41470 79 138 217 100 107 110 21780 42 45 87 150 63 92 15590 9 9 18 200 946 874 1,820100 6 8 14 250 1 0 1200 6 7 13 500 0 0 0300 0 0 0 750 0 0 0500 0 0 0 1,000 0 0 0
>500 40 41 81 > 2000 227 315 542
(c) Summer
Day Night Cumulative Day Night CumulativeHeight (m) Length (m)
<30 3,930 2,205 6,135 <20 3,930 2,205 6,13540 2,189 1,972 4,161 40 0 0 050 228 228 456 60 231 107 33860 47 107 154 80 903 576 1,47970 30 61 91 100 15 37 5280 12 24 36 150 18 17 3590 3 3 6 200 1,270 1,497 2,767100 0 0 0 250 0 0 0200 1 0 1 500 0 0 0300 0 0 0 750 0 0 0500 0 0 0 1,000 0 0 0
>500 6 5 11 > 2000 73 161 234
Number of HoursNumber of Hours
Number of Hours
Number of Hours Number of Hours
Number of Hours

MD PPRP 4-58 Morgantown STAR ERD - Case No. 9229
(d) Fall
Day Night Cumulative Day Night CumulativeHeight (m) Length (m)
<30 3,782 2,073 5,855 <20 3,782 2,073 5,85540 1,801 1,632 3,433 40 0 0 050 392 403 795 60 157 133 29060 268 275 543 80 791 517 1,30870 76 108 184 100 94 125 21980 36 43 79 150 46 81 12790 7 9 16 200 1,190 1,300 2,490100 3 2 5 250 0 1 1200 5 5 10 500 1 1 2300 0 0 0 750 0 0 0500 0 0 0 1,000 0 1 1
>500 40 37 77 > 2000 309 318 627
Number of HoursNumber of Hours
4.6 SUMMARY OF AIR QUALITY EVALUATIONS
The proposed Morgantown STAR Facility combustion emissions from the exhaust stack of the ash beneficiation process reactor will emit PSD pollutants (PM10, CO, NO2, SO2, SAM and lead) and NA-NSR pollutants (ozone and PM2.5). Additional fugitive emissions of PM, PM10, and PM2.5 result from the project fly ash material handling operations including: fly ash transfers, paved road truck traffic, bin vent emissions, and fly ash storage emissions.
Under the operational parameters provided in the CPCN application amendment, submitted by Mirant on July 20, 2010, including the use of air pollution control equipment (baghouse and wet FGD scrubber), a throughput of 360,000 tons per year of fly ash and an annual average heat input of 100 MMBtu/hr, the proposed project will emit below the major source modification applicable thresholds under PSD and NA-NSR.
Based on information provided by Mirant in its CPCN application, CPCN application amendment, and responses to PPRP Data Requests, potential emissions are capable of achieving levels below the major source modification applicability thresholds for PSD and NA-NSR review. However, under the proposed operating conditions, the adjustment of emissions based on 100 MMBtu/hr (instead of the maximum short-term rating of 140 MMBtu/hr) assisted Mirant in demonstrating compliance with the SO2 and CO major source modification limits for SO2, CO, ozone (NOX precursor) and PM2.5 (SO2 precursor).
As a means of demonstrating compliance with the PSD and NA-NSR major modification emissions limits, Mirant has proposed to install CEMS that meet the accuracy and quality assurance requirements in 40 CFR 60

MD PPRP 4-59 Morgantown STAR ERD - Case No. 9229
Appendix B. Installation of CEMS will allow Mirant operational flexibility of the STAR process reactor. In addition to CEMS, Mirant shall also restrict the annual fly ash throughput for the STAR Facility to 360,000 tpy based on a consecutive 12-month period, rolling monthly.
The project will not be subject to any NESHAP or NSPS requirements. The project will be subject to MDE-ARMA requirements for general sources, and will need to modify its Title V Operating Permit to address the newly proposed STAR Facility at the time of renewal.
Specific requirements related to operational limitations and monitoring, recordkeeping, and report, as a means of demonstrating compliance with the proposed emissions limits, are included in the final licensing conditions for the project provided in Appendix D.

(This Page Intentionally Left Blank)

MD PPRP 5-1 Morgantown STAR ERD - Case No. 9229
5.0 ANALYSIS OF OTHER ENVIRONMENTAL IMPACTS
5.1 IMPACTS TO WATER RESOURCES
5.1.1 Ground Water Usage
As described in Section 2.4.2, the operation of the STAR Facility will require the installation of new sanitary facilities to accommodate the addition of 12 to 13 full-time employees. These new facilities are expected to use up to 15 gpm of water, or a maximum of 21,600 gallons per day (or 0.021 mgd). MDE Water Appropriation and Use Permit No. CH1967G011(10) allows for the use of up to 0.70 mgd for boiler makeup and miscellaneous operations at Morgantown. Since 1975, the average daily ground water withdrawal has varied from approximately 0.80 mgd in the mid- to late-1970s (the original appropriation amount was 0.82 mgd) to less than 0.58 mgd in 2004. Most recently, from June 2009 to June 2010, the annual water withdrawal at Morgantown was approximately 0.56 mgd.
In its CPCN application, Mirant indicated that the water requirements of the proposed project can be accommodated under the existing water allocations for the Morgantown facility and Mirant intends to amend the Morgantown ground water appropriation permit to add the STAR Facility to the descriptions of allowable water use (Mirant, 2010). Accordingly, PPRP recognizes that the proposed water use for new sanitary facilities can be accommodated under the existing ground water allocation permit for the Morgantown site. PPRP recommended a licensing condition (see final licensing conditions in Appendix D) that would require Mirant to submit a modified or amended water appropriation permit application to MDE-WMA if any changes to the existing appropriation are required.
5.1.2 Surface Water – Lower Potomac River
According to Mirant’s CPCN application, there will be no new discharges to surface waters during construction or operation of the proposed project. Changes to storm water flows will be handled by the existing storm water collection system at the Morgantown facility, as described in Section 5.1.3. Therefore, there is no expected change in water quality due to the construction and operation of the proposed STAR Facility.
As described in Section 2.4.2, the operation of the STAR Facility will require the use of additional surface water from the existing RO system at

MD PPRP 5-2 Morgantown STAR ERD - Case No. 9229
Morgantown for STAR FGD make-up and NOX process/quench water. The RO system has a current water appropriation limit of 3.44 mgd on average from the Potomac River. The annual water usage under this permit (from June 2009 to June 2010) was approximately 1.11 mgd. According to Mirant’s CPCN application, the maximum STAR process water requirement is 74 gpm, which equates to about 0.11 mgd (Mirant, 2010).
Additionally, raw Potomac River water will be needed for process equipment washdown. The maximum water usage amount will be up to 50 gpm, which equals a theoretical maximum of 0.072 mgd; however, equipment washdown will only occur intermittently. The current appropriation allows for the withdrawal of 1,500 mgd from the Potomac River for cooling and process water and the annual water withdrawal at Morgantown from June 2009 to June 2010 under this appropriation was approximately 1.06 mgd.
Mirant indicated that the water requirements of the proposed project can be accommodated under the existing water allocations for the Morgantown facility and Mirant intends to amend the Morgantown water appropriation permits to add the STAR Facility to the descriptions of allowable water use (Mirant, 2010). Accordingly, PPRP recognizes that the proposed water use for the operation and washdown of the proposed STAR Facility can be accommodated under the existing Potomac River water allocation permits for the Morgantown site. PPRP recommended a licensing condition (see final licensing conditions in Appendix D) that would require Mirant to submit a modified or amended water appropriation permit application to MDE-WMA if any changes to the existing appropriation are required.
5.1.3 Storm Water
There will be additional impervious areas associated with the STAR Facility, which include a paved loadout area, a new parking area, and an entrance road. Storm water generated on these new impervious areas will be routed to the Morgantown facility’s existing storm water collection system, which has adequate capacity to handle additional storm water flows generated by the new facilities. Mirant intends to develop a County grading, sediment, and erosion control plan to address all areas of disturbance associated with project construction. This plan will establish BMPs for construction to minimize sediment transport in storm water runoff. Control methods will comply with County requirements and the plan will be submitted to the County for review and approval.

MD PPRP 5-3 Morgantown STAR ERD - Case No. 9229
In addition, Mirant intends to amend its existing NPDES permit to include a description of the STAR Facility and will be updating the SWPPP to include descriptions of the proposed STAR Facility and the BMPs associated with controlling storm water (Mirant, 2010). As the proposed project improves the existing fly ash handling system to include enclosed conveyors, it may be expected that less pond solids will be generated in the existing storm water collection system. PPRP recommended licensing conditions that require Mirant to implement BMPs for sediment control, as well as update its SWPPP for Morgantown. These are presented as final licensing conditions in Appendix D.
5.1.4 Wastewater
New wastewater streams associated with the construction and operation of the STAR Facility, including those generated from equipment washdown, new sanitary facilities, and storm water runoff, will be handled by the existing storm water and waste water treatment facilities at Morgantown. It is Mirant’s intention to updated its NPDES permit and SWPPP to reflect STAR Facility information, which is reflected in the final licensing conditions for this project (see Appendix D). As such, no adverse water quality impacts with respect to wastewater are expected.
5.1.5 Construction Dewatering
Sections 4.2.1 and 4.3.2 of Mirant’s CPCN application (Mirant, 2010) indicate that construction of the project foundations will not require dewatering, since the excavations will be shallow at approximately 5 feet below grade or less. In its response to PPRP Data Request No. 3, Question 3-16 (received on July 14, 2010), Mirant reaffirms that no dewatering will be necessary for the construction of the STAR Facility due to the use of rock column piers, which do not require deep excavations.
5.2 IMPACTS TO BIOLOGICAL RESOURCES
Impacts to biological resources from the construction of the STAR process reactor would not likely be significant, as the site has already been affected heavily by industrial development. The areas affected by construction consist entirely of previously disturbed lands. The STAR Facility will require approximately 3.5 acres and will be installed within two areas of the facility’s existing property limits. The STAR process reactor will be located east of Boiler No. 1 between the north coal yard and the existing rail loop. Product storage and loadout facilities will be located adjacent to the existing parking area north of the facilities entrance roadway and rail loop.

MD PPRP 5-4 Morgantown STAR ERD - Case No. 9229
Areas that would be affected directly by project construction are entirely outside of the Critical Area. Although an elevated ash handling system connecting the STAR Facility to the Morgantown existing ash silos would cross a portion of the Critical Area, this infrastructure would run along an existing elevated pipe support system, thus, precluding the need for any additional pipe supports within the Critical Area.
5.2.1 Vegetation Resources
Areas that would be directly affected by project construction have been previously cleared of vegetation and graded. No off-site construction laydown areas are anticipated for the project. Since all of the area to be used for the construction has been previously developed, construction will not cause adverse ecological impacts to vegetation resources.
5.2.2 Wildlife
The areas that would be affected by project construction do not contain important wildlife species and are not considered important wildlife habitats because of their disturbed nature. Noise from construction activities would not adversely affect wildlife in the vicinity of the site. The Morgantown facility currently has noise associated with its operation, nearby roads, and the railroad. Wildlife that presently occur in the vicinity of the site are likely to be acclimated to noise from facilities operations. No noise-sensitive wildlife is known to occur on-site or in the vicinity of the site. Fugitive dust generated by construction activities will be minimized through the use of BMPs. Consequently, localized fugitive dust would not adversely affect ecological resources in the vicinity of the project site.
5.2.3 Threatened and Endangered Species
No threatened or endangered species have been documented at the Morgantown Generating Station and in the immediate vicinity of the proposed project site; thus, no significant impacts to federal or State-listed terrestrial plants or animals are anticipated.
5.2.4 Aquatic Resources and Wetlands
There would be no significant impacts to aquatic resources of the Potomac River and Pasquahanza Creek, and wetlands associated with them provided that erosion, sedimentation, and runoff control measures are implemented. The proposed project would have no impact on the surface water bodies in the vicinity of the Morgantown property as no additional surface water withdrawals would be necessary.

MD PPRP 5-5 Morgantown STAR ERD - Case No. 9229
5.3 SOCIOECONOMIC IMPACTS
5.3.1 Employment and Income
Construction of the project would create as many as 100 jobs during the peak construction period. Over the 12-month project schedule, an average of 40 to 50 construction workers would be on-site. Construction is expected to commence in late 2010, upon receipt of a CPCN, with completion scheduled for early 2012. Mirant estimates the cost for the STAR Facility to be $50 million with $30 million budgeted for construction. Operating the STAR Facility would necessitate the hiring of 12 to 13 full-time employees.
The project would generate employment opportunities as well as additional economic benefits resulting from purchases of goods and services during both the construction and operation phases of the project. The labor force in the region, including the Washington, D.C. and surrounding areas, is expected to adequately fill the labor needs of the project. Most of the construction wages are likely to be spent in the Washington Metropolitan area, and multiplier effects are expected to create additional employment and earnings.
5.3.2 Population and Housing
Skilled labor would comprise the majority of the construction workforce and most would commute to the project site from outside the Morgantown area. Although labor market conditions and low unemployment could affect labor availability and hiring, most construction jobs are expected to be filled by construction workers living within daily commuting distance of the project. Workers commuting from long distances would likely lodge at temporary quarters such as hotels or motels. As a result, few effects on population and housing are anticipated from construction activities. No adverse population or housing effects from in-migrating labor are expected from additional operation and management employment at Morgantown.
5.3.3 Land Use
The proposed project is a modification to the Mirant Generating Station and would be contiguous to existing structures on lands that have been previously disturbed. Because the project area is already zoned IH – Heavy Industrial – and is in an Employment and Industrial Park District, no rezoning or change of land use will result from the project. Although issuance of a CPCN preempts local zoning laws, PPRP recommended licensing conditions requiring Mirant to design the facility in substantial

MD PPRP 5-6 Morgantown STAR ERD - Case No. 9229
conformity with the site plan drawings that have been reviewed by the Charles County Department of Planning and Growth Management, and to obtain appropriate Building and Site Grading permits from the County. These conditions are included in the final licensing conditions provided in Appendix D. No lands outside the Morgantown property would be pre-empted from other uses during construction of the project.
Approximately one-half of the Morgantown site lies with the Chesapeake Bay Critical Area and much of the area has already been developed. Only 30 percent of the entire site is undeveloped and contains some wetland and upland habitats. The county’s Comprehensive Plan designates the Critical Area within the Morgantown site as an Intensely Developed Area (IDA). Although part of the ash handling system connecting the STAR Facility to the Morgantown ash silos passes over the Critical Area, it would be supported by an existing elevated pipe support system, eliminating the need for additional supports and footers. As a result, the project would have no direct effect on the Critical Area.
No indirect effects upon surrounding land uses are expected from operation of the STAR Facility.
5.3.4 Transportation
The project would be a minor trip generator during peak construction activities when up to 90 workers are commuting to the project site. The additional passenger car traffic is not expected to significantly increase congestion near the entrance to the site. Once operational, the traffic from the additional operation and maintenance (O&M) workforce would have no adverse effect upon local roads and intersections.
Eighteen wheel semi-trucks would transport product ash to markets, but these would essentially replace dump trucks that haul unprocessed fly ash to landfills in Charles County. Currently, between 36 and 40 dump trucks haul fly ash between 6:00 a.m. and 2:00 p.m. five days per week from Morgantown to the Faulkner and Brandywine facilities. Accounting for return trips, between 72 and 80 round trip truck trips are generated by fly ash disposal. These trips would be replaced by approximately 50 fully enclosed pneumatic tanker trucks, with a gross vehicle weight of 80,000 pounds, hauling processed fly ash to markets, or 100 round trip truck trips on average per day. There are currently three bridges in Charles County with weight restrictions, but all allow combination vehicles of up to 80,000 pounds gross vehicle weight.
Trucks would operate between 3:00 a.m. and 3:00 p.m. five days per week. Dispatch of processed fly ash to customers – primarily ready-mix plants –
MD PPRP 5-7 Morgantown STAR ERD - Case No. 9229
would be determined by local demand since the cost of shipping prohibits profitable distribution over long distances. (Mirant estimates that the average distance to markets would be 50 miles.) As a result, truck routes would vary from day to day and the number of truck trips would generally exhibit a seasonal variation, with higher volumes in the summer months. During periods of low demand, product ash would be stockpiled in a 30,000-ton enclosed storage dome or, if the storage dome is at capacity, unprocessed ash would be stored in the feed ash silos. Unprocessed fly ash would be hauled to landfills if the feed ash silos are full. Processed fly ash would be loaded at a site alongside the site access driveway outside the plant gate to the Morgantown Generating Station.
Unprocessed fly ash from Mirant’s Chalk Point Generating Station would be an additional feedstock source for the Morgantown STAR Facility and would be transported via fully enclosed pneumatic tanker trucks. Mirant estimates that as many as 27 trucks per day would haul ash to the site for processing, resulting in an additional 54 truck trips between the two power plants beginning between 2:00 – 4:00 a.m. and ending between 1:00 – 3:00 p.m. The proposed truck route between Chalk Point and Morgantown is shown in Figure 5-1. Mirant also expects to import and process fly ash from the Dickerson Generating Station in western Montgomery County from time to time to supplement feedstock supplies from Chalk Point and Morgantown. PPRP recommended a licensing condition, which became part of the final licensing conditions for the STAR Facility, that instructs Mirant to require all trucks transporting unprocessed fly ash from Chalk Point to Morgantown to follow, when available, the specific truck route shown in Figure 5-1 and for trucks returning to Chalk Point from Morgantown to follow the reverse of the same route. The condition also recommends that trucks transporting processed fly ash from Morgantown to customers follow designated truck routes wherever possible.

MD PPRP 5-8 Morgantown STAR ERD - Case No. 9229
Figure 5-1 Designated Truck Route between Chalk Point and Morgantown
All trucks hauling unprocessed and product ash would access the Morgantown site via the site access drive that intersects US 301 near the toll plaza for the Governor Harry W. Nice Memorial Bridge. Orland Park Road intersects the southbound lanes of US 301 at the same location creating a four-leg intersection. Both minor approaches are controlled by stop signs and there are auxiliary lanes on both northbound and southbound US 301 to facilitate turning movements onto the site access driveway. The closest signalized intersection with US 301 is at MD 257 and Edge Hill Road, more than one mile to the north. That intersection is controlled by a half signal for traffic exiting MD 257 onto southbound US 301, and for left turns from US 301 onto eastbound MD 257.
Mirant sponsored a Traffic Impact Study (TIS) to assess the effects of truck traffic on these intersections (The Traffic Group, 2010a). Intersection turning movement counts were collected in October 2010 to characterize existing traffic conditions before traffic volumes were projected at a three

MD PPRP 5-9 Morgantown STAR ERD - Case No. 9229
percent annual rate to 2012 – the anticipated start of operations – and truck traffic from fly ash operations were applied.
Highway Capacity Manual (HCM) and Critical lane Volume (CLV) methodologies indicated that both the intersection of US 301 and MD 257 and US 301, Orland Park Road and the site access driveway operate acceptably under existing conditions during the peak hour (7:00 – 8:00am). Projecting baseline traffic to 2012 and adding 25 percent of the additional truck traffic to the morning peak hour resulted in continued acceptable operation at both intersections. In particular, the site access driveway exhibits Level of Service “A” in the peak period, and the left turn lane from US 301 into the site is projected to have sufficient length to accommodate turning movements even when larger vehicles are used to haul fly ash.
As currently configured, the project would generate an additional 14 truck trips in the peak hour. As such, the project may be subject to an Adequate Public Facilities Study (APFS). The Adequate Public Facilities requirement is an element of the Charles County Zoning Ordinance. The Planning Commission considers the APFS as part of the County’s site plan approval.
Although the site development plan was approved by the Maryland State Highway Administration (SHA) in July 2010, neither the SHA, the Maryland Transportation Authority (MDTA), nor the Charles County Department of Planning and Growth Management have reviewed the TIS. As a result, PPRP recommended a condition requiring Mirant, prior to construction, to submit to the Charles County Department of Planning and Growth Management, MDTA, and SHA its TIS for the STAR Facility for an Adequate Public Facilities analysis (see final licensing conditions in Appendix D). If entrance modifications to the Morgantown site access driveway are determined to be necessary, the condition requires Mirant to obtain an access permit from the SHA and to complete any modifications when required by SHA.
Mirant also submitted a draft TIS for its Chalk Point facility (The Traffic Group, 2010b) addressing truck traffic associated with the transport of unprocessed fly ash to Morgantown, which showed that the proposed operational changes would have a minimal impact on site access and upon the intersection of Eagle Harbor Road and MD 381. That the impact is minimal is not unexpected. Open bed dump trucks currently haul unprocessed fly ash to a landfill in Brandywine. These transfers generate approximately 60 truck trips per day and would be replaced by approximately 54 truck trips in enclosed tankers between Chalk Point and Morgantown. At most, six of these truck trips would occur during the

MD PPRP 5-10 Morgantown STAR ERD - Case No. 9229
peak hour. As a result, PPRP concurs that the proposed project would not affect traffic in the vicinity of Chalk Point.
Mirant has stated that fly ash will be transported in enclosed pneumatic 18-wheel semi-trailer tanker trucks. With a height of 12’ – 7” and an axle track of nearly 6 feet, the vehicles conform to the specifications of the U.S. Department of Transportation (DOT), which governs the use of the interstate system. DOT vehicle limits are 8.5 feet wide, 13.5 feet high and 80,000 pounds gross vehicle weight (GVW). As such, the trucks would not be considered oversize or overweight, nor would they require permits to haul fly ash on Maryland highways.
While Mirant has assumed the location of anticipated product deliveries would be in Maryland, and thus all outbound truck traffic hauling processed fly ash would travel north on US 301, Morgantown is clearly within range of Ready-Mix and other cement markets in Northern Virginia. Deliveries to the south would slightly increase truck traffic over the Governor Harry W. Nice Memorial Bridge. Vehicles and loads exceeding 12 feet in width and 16 feet in height, or over 60 tons GVW are prohibited from crossing the bridge without a permit. As the project is currently configured, trucks would not require permits to cross the bridge nor is truck traffic from the STAR Facility expected to affect service levels over the Potomac River.
5.3.5 Fiscal Impacts
Fiscal impacts from the project would be in the form of tax revenues and government expenditures on public services beginning in late 2010 and concluding in early 2012. During construction, revenues from taxes on construction worker wages, income taxes on indirect employment incomes, and sales taxes on consumption expenditures would accrue to Maryland and affected counties. Tax revenues would be distributed among all counties where employed workers, both direct and indirect, reside, but with an average of 40 to 50 workers on-site and a peak construction workforce of about 90, revenue impacts would be minimal. Most of the construction labor force is expected to be drawn from Charles, Prince George’s, St. Mary’s and other nearby counties including those in northern Virginia.
Income and sales tax revenues would continue to be generated by the project when it is operational but at a lower level, given the 12 to 13 additional employees required to operate the project. Sales tax revenues would also accrue from Mirant’s purchases of goods and services from Maryland firms and from personal consumption expenditures by direct (O&M) and indirect employment. Property tax revenues paid by Mirant
MD PPRP 5-11 Morgantown STAR ERD - Case No. 9229
to Charles County would increase after improvements to real property are made, but the STAR Facility would have only a minor impact on country property tax revenues.
Incremental State and county tax revenues from the project are expected to more than offset public expenditure costs, particularly since no population effects are anticipated either from construction or operation of the facility. Mirant would not require an extraordinary level of public services to construct and operate the STAR Facility.
5.3.6 Visual Quality
The landscape around the Morgantown property consists of flat to slightly rolling terrain, with most of the surrounding land in cropland or forest. From a visual perspective, construction activities could create temporary visual disturbances from wind-blown dust during earth moving activities, but these events would be minimized by good construction practices. As a result, the most visible element during construction is likely to be automobile and truck traffic entering or exiting the site, which would be similar to normal plant operations.
The proposed facility would require approximately 3.5 acres and would be constructed within two areas of the Morgantown Generating Station’s existing property limits. In a previously disturbed area east of Boiler No. 1 between the north coal yard and the existing rail loop, the facility would comprise an ash reactor feed bin, STAR process reactor, a 125-foot FGD exhaust stack, baghouse and two existing ash storage silos associated with the two Morgantown coal-fired units. An elevated conveyer system would transport fly ash from the ash storage silos to the feed bin. Product ash storage and load-out facilities would be located outside perimeter fencing near the existing site entrance and would comprise a 155-foot product ash storage dome, off-site silo and load-out silo. The two areas would be connected via an enclosed elevated conveyer system.
The most prominent components would be the reactor vessel, about 105 feet above grade, the FGD exhaust stack and the ash storage dome. However, the reactor and FGD stack would be adjacent to the north coal yard, the base load generating units, a 400-foot FGD stack and 700-foot exhaust stacks, and would not be easily distinguished within the industrial landscape that defines the Morgantown Generating Station. Located near the perimeter of the Mirant’s property line, the processed ash storage dome would be more visible, particularly to traffic on US 301 and some parts of the Potomac River just downstream from the Governor Harry W. Nice Memorial Bridge. Foreground views of this general area currently include petroleum storage tanks with the north coal pile,
MD PPRP 5-12 Morgantown STAR ERD - Case No. 9229
generating units, stacks and other structures in the background. Because views are already severely compromised, the marginal visual effect of the storage dome and load-out facilities would be minimal.
Two operational elements, outdoor lighting and the steam plume from the new stack, would add to the visual setting of the Morgantown facility. Outdoor lighting is required on all new and modified project components to satisfy operational requirements and OSHA requirements for worker safety. As all project components are less than 200 feet AGL, FAA requirements for obstruction marking and lighting do not apply. PPRP recommended a licensing condition requiring Mirant to develop a lighting distribution plan to mitigate intrusive night lighting and avoid undue glare onto adjoining properties. The condition, which became part of the final licensing conditions for the project (see Appendix D), requires the plan to conform to Article XVIII of the Charles County Zoning Ordinance, as described in §297-306 and for Mirant to coordinate development of the plan with PPRP and the Charles County Department of Planning and Growth Management to ensure that adjoining properties will not be adversely impacted by the proposed lighting.
The predominant visual externality from wet scrubber operations associated with the STAR Facility would be the plume from the 125-foot FGD stack. Composed primarily of water vapor, the plume would be visible at virtually all times the FGD system is in operation. Although continuously variable in appearance, the plume would generally have a dispersive cone shape with both horizontal and vertical dimensions.
While the impact is primarily visual, the vapor plume is a concern to MDTA because the increased moisture content of the air could potentially induce fogging or icing on the nearby Governor Harry W. Nice Memorial Bridge. The Federal Highway Administration reports that of the nearly 6.5 million vehicle accidents each year, about one-quarter are weather-related. Although most weather-related accidents occur on wet pavement and during rainfall, about three percent occur in the presence of fog. In 2005, there were 39,189 fatal accidents in the United States, 486 where fog was involved. Of the 577 fatal accidents in Maryland over the same period, fog was a factor in two of them (FHWA, 2007), although there were no fatal accidents due to fog on US 301 in the vicinity of the Morgantown Generating Station. For the reporting period of January 1, 2003 to December 31, 2005, there were 63 crashes reported along US 301 between the Virginia line and MD 234. Fog was the probable cause for one of these accidents and ice/snow for none (Simpson, 2007). As discussed in Section 4.5.4, a fog monitoring and warning system was installed on the bridge in November 2009 in response to potential fogging and icing events from existing scrubber operations at Morgantown.

MD PPRP 5-13 Morgantown STAR ERD - Case No. 9229
Section 4.5.4 describes PPRP and MDE-ARMA’s visual plume analyses for the proposed STAR Facility stack. PPRP employed the CALPUFF model to determine the extent of the visible plume and the frequency of occurrence in different seasons. Model simulations suggest that, for the majority of the time, plume heights would be no more than 60 meters and lengths would be less than 250 meters, with the most frequently predicted plume height and length for all seasons being less than 30 meters and less than 20 meters, respectively. With nearly 400 meters between the stack and the nearest fence line, a visible plume is expected to disperse within the property lines of the Morgantown Generating Station during normal meteorological conditions. The model predicts that occasionally a plume length of 2,000 meters or more can occur. Plumes are expected to exhibit a seasonal variability, with higher and longer plumes occurring in the fall and winter months. PPRP notes that while visible plumes may occur in the vicinity of the Morgantown facility, they will likely be rare and are not predicted to impact the Harry W. Nice Memorial Bridge.
Because the plume would continuously vary in its horizontal and vertical dimensions, the extent to which it would be visible from surrounding areas cannot be easily summarized, particularly since it would, at most times, be confined within an industrial landscape of encompassing boiler buildings, 700-foot stacks and a 400-foot FGD stack and vapor plume. The plume may be visible to motorists traveling over the Governor Harry W. Nice Memorial Bridge, but would be less visible to residences on the north side of Lower Cedar Point, from the Clifton on the Potomac subdivision to the north of US 301, or from the Virginia shoreline of the Potomac River when ambient viewing conditions are unobstructed by fog, haze or precipitation. Inland from the shoreline, views would be even more limited or non-existent.
5.3.7 Cultural Impacts
Drawings of proposed project components indicate the historic Lee family cemetery, located on the Mirant property, would not be physically disturbed by construction or operation of the STAR process reactor or load-out facilities. In the event that archeological sites or relics are found during excavation in the project area, PPRP recommended a licensing condition requiring Mirant, in consultation with the Maryland Historical Trust (MHT), to develop and implement a plan for avoidance and protection, data recovery or destruction without recover of such relics or sites (see final licensing conditions in Appendix D).
Historic properties near the Morgantown Generating Station include Pasquahanza, Waverley and Lower Cedar Point. No historic property outside the boundaries of the Morgantown Generating Station would be

MD PPRP 5-14 Morgantown STAR ERD - Case No. 9229
directly affected by construction or operation of the project. Although some properties are just south of the plant, construction worker and truck traffic would enter the site from US 301 to the north. The STAR process reactor and load-out facilities would not be visible from historic properties downriver from the Morgantown Generating Station.
When visible, the vapor plume could potentially have an adverse effect on aesthetics, particularly where there is extensive vertical and/or horizontal drift. As aesthetics are an important component of the cultural landscape, the plume could detract from some of the cultural components that comprise Southern Maryland and the Northern Neck of Virginia. The plume would sometimes be visible from nearby properties listed in the Maryland Inventory of Historic Places (MIHP), particularly the Lee family cemetery (CH-181) and the Governor Harry W. Nice Memorial Bridge (CH-376). The cemetery is northwest of most structures associated with the Morgantown Generating Station although it is adjacent to a pump house. As such, the setting for the cemetery is already severely compromised. The Governor Harry W. Nice Memorial Bridge was added to the MIHP during a statewide survey of historic bridges sponsored by the Maryland State Highway Administration. It is the only metal cantilever bridge in Maryland and is significant for its association with transportation and commerce. As the bridge’s setting does not contribute to its significance, the plume would have no adverse effect.
The plume would sometimes be visible from US 301 as it passes over the Potomac River. Here, US 301 is a designated corridor in the Southern Maryland’s Heritage Tourism Management Plan. However, views in the direction of Morgantown are already compromised by other activities on-site. That scenic quality is reduced along US 301 in Charles County is clearly acknowledged in the SMHA Tourism Management Plan. The vapor plume would not be visible from any of the heritage clusters designated by the plan.
The plume would be partly visible from the some areas of the Potomac River, but only in the vicinity of the plant. The Potomac River Water Trail, following the Maryland and Virginia shorelines from Washington D.C. to the river’s confluence with the Chesapeake Bay is a component of the Chesapeake Bay Gateways Network (CBGN), a system of parks, refuges, museums, historic sites and water trails within the Chesapeake watershed region. A CBGN gateway in Charles County, at the Smallwood State Park on the Nanjemoy Peninsula is considerably upriver and out of site from the facility. The Potomac River is also part of the Captain John Smith Chesapeake National Historic Trail, which commemorates his voyages on the Chesapeake Bay and its tributaries during 1607-1609 although no trail components are associated with the Morgantown site.
MD PPRP 5-15 Morgantown STAR ERD - Case No. 9229
In summary, given its scale relative to existing operations at Morgantown and small visual footprint, it is unlikely that the aesthetic landscape would be adversely affected by the proposed project.
5.3.8 Noise Impacts
The proposed ash beneficiation project will generate additional noise; however, impacts at the property boundary are expected to be minor. Maryland and Charles County have established regulations that limit the amount of noise that most activities are allowed to create, as measured at the receiving property. The allowable noise level under State regulations varies according to the time of day and the land use of the receiving property. At adjoining or nearby residential property, the noise limit is 65 A-weighted decibels (dBA) during daytime hours, defined as 7 AM until 10 PM. The nighttime noise limit is 55 dBA at all types of receiving property (residential, commercial, and industrial). Charles County regulations are similar, although they impose lower nighttime limits for residential properties (50 dBA).
For construction activities, State regulations establish a higher limit: 90 dBA at the receiving property during daytime hours (the nighttime limit remains 55 dBA). Pile driving between the hours of 8 AM and 5 PM is exempt from the State noise regulatory limits. Traffic on public roads is also exempt (at all times).
5.3.8.1 Surrounding Land Use and Receptors
The Morgantown Generating Station is situated on a large site that provides buffer zones between the power plant industrial activities and surrounding residents. Distance is a significant factor in predicting noise impacts since sound energy dissipates with increasing distance to receptors. The nearest residence is approximately 2,580 feet from the proposed ash beneficiation equipment, across Pasquahanza Creek on the southern border of the Morgantown site. To the north, the nearest residence is located about one-half mile away, and to the east, about three-fourths of a mile away. Residences to the west across the Potomac River in Virginia are even more distant, since the estuary is approximately 1.5 miles wide at that point, and the Naval District Washington West Area Dahlgren is located directly across the river from the Morgantown facility. Existing noise levels at the northern property boundary are heavily influenced by vehicle traffic on US 301, which borders the Morgantown site.
MD PPRP 5-16 Morgantown STAR ERD - Case No. 9229
The noise impact discussion below focuses on impacts to the nearest residence, which is located to the south, because potential impacts to other receptors would be less significant.
5.3.8.2 Characteristics of Proposed Equipment
The STAR process reactor and storage and loadout facilities will consist of the process reactor and associated components, conveyers, material silos, and transfer bins and vessels. The material handling conveyor system and storage system will be enclosed, reducing noise emissions from this equipment, but the STAR process equipment will be open to the environment and associated noise emissions will contribute to overall noise. However, the proposed equipment will be similar in character to the existing site noise associated with fly ash handling and will not contribute to a noticeable increase in overall noise emissions from the facility, as experienced at nearby receptor locations.
Mirant has stated that the proposed equipment will increase noise levels at the property boundary by a minimal amount (if at all). To verify this statement, PPRP performed calculations to determine the potential increase in noise at the property boundary using a conservative assumption for noise levels of the proposed equipment at its designated location. Based on previous experience with material handling and conveyance, as well as fan noise, we assumed a conservatively high sound power level of 123.6 dB for the proposed equipment. Given this assumption, the ash beneficiation process could raise noise levels by less than 3 dBA at the southern property boundary. It should be noted that the calculation methodology used by PPRP does not take into account any attenuation provided by vegetation or structures between the new ash beneficiation equipment and the off-site receptors; therefore, actual noise impacts will likely be significantly smaller than 3 dBA.
PPRP recommended that the CPCN conditions require that construction and operation of the proposed facility comply with State and County noise limits (see final licensing conditions in Appendix D). The information provided by Mirant in its CPCN application, as well as PPRP’s basic quantitative analysis, supports the conclusion that the facility, as designed, will meet this requirement.
MD PPRP 6-1 Morgantown STAR ERD - Case No. 9229
6.0 SUMMARY
6.1 AIR QUALITY
The proposed Morgantown STAR Facility will emit PSD pollutants (PM10, CO, NO2, SO2, SAM and lead) and NA-NSR pollutants (ozone and PM2.5). Additional fugitive emissions of PM, PM10, and PM2.5 will result from the project fly ash material handling operations including: fly ash transfers, paved road truck traffic, bin vent emissions, and fly ash storage emissions.
Under the operational parameters provided in the CPCN application amendment, submitted by Mirant on July 20, 2010, including the use of air pollution control equipment (baghouse and wet FGD scrubber), a throughput of 360,000 tons per year of fly ash, and an annual average heat input of 100 MMBtu/hr, the proposed project will emit below the major source modification applicable thresholds under PSD and NA-NSR. However, under the proposed operating conditions, the adjustment of emissions based on 100 MMBtu/hr (instead of the maximum short-term rating of 140 MMBtu/hr) assisted Mirant in demonstrating compliance with the SO2 and CO major source modification limits for SO2, CO, ozone (NOX precursor) and PM2.5 (SO2 precursor).
As a means of demonstrating compliance with the PSD and NA-NSR major modification emissions limits, Mirant has proposed to install CEMS that meet the accuracy and quality assurance requirements in 40 CFR 60 Appendix B. Installation of CEMS will allow Mirant operational flexibility of the STAR process reactor given the expected variability of the sulfur content in the fly ash, as well as make adjustments in the heat input of the reactor and the control settings of the FGD system, while providing for a method to continuously monitor emissions and evaluate compliance with proposed emission limits. In addition to CEMS, Mirant shall also restrict annual fly ash throughput for the STAR Facility to 360,000 tpy based on a consecutive 12-month period, rolling monthly.
The project will not be subject to any NESHAP or NSPS requirements. The project will be subject to MDE-ARMA requirements for general sources, and will need to modify its Title V Operating Permit to address the newly proposed STAR Facility at the time of renewal.
The Mirant STAR Facility has the potential to emit small quantities of mercury, which is a trace metal contained in the raw feed fly ash. PPRP and MDE-ARMA conducted an independent evaluation of the potential

MD PPRP 6-2 Morgantown STAR ERD - Case No. 9229
mercury emissions from the STAR process reactor. In an effort to reduce Maryland’s contribution to the mercury deposition impacts in the northeast United States, MDE-ARMA requires the STAR Facility to remain below a mercury emissions limit of 5 lb/year. The STAR Facility will be subject to additional MDE-ARMA enforceable conditions including additional testing, recordkeeping, and reporting requirements to assure compliance with the mercury emission limit.
Specific requirements related to operational limitations and monitoring, recordkeeping, and report, as a means of demonstrating compliance with the proposed emissions limits, are included in the final licensing conditions for the project provided in Appendix D.
6.2 WATER RESOURCES
The equipment proposed by Mirant to be installed for the STAR Project will require an increase in surface and ground water usage for everyday operation. The main water usage will be associated with the STAR process reactor process/quench water, the operation of the STAR FGD system, equipment washdown, and new sanitary facilities and can be accommodated under the existing surface and ground water appropriations at the Morgantown facility. Wastewater generated from the STAR FGD system will be routed to and re-circulated in the existing Units 1 and 2 FGD system and will be subsequently treated in the existing gypsum dewatering and wastewater treatment facility. Wastewater created from the washdown of equipment will be collected in sumps and then directed to Morgantown’s existing storm water collection system. Sanitary wastewater will be treated in the existing sanitary wastewater/sewage treatment facility. Therefore, the construction of the project using the equipment as proposed is not expected to cause any adverse impacts on water quality.
With respect to storm water, which will be generated from the construction and operation of the STAR process reactor, ash handling and storage equipment, and associated facilities will be routed to and treated by the existing storm water system on the Morgantown site. As this system is currently in operation and has the capacity to handle additional storm water, the impacts to surface waters in the vicinity of the facility are likely negligible. The primary impacts to surface waters will be erosion and sedimentation associated with construction activities. These impacts will be controlled and minimized through proper design and placement of runoff-control features and impacts to the surface waters will be minimal. No dewatering will be required for the excavation of the STAR Project foundations, since these excavations will be relatively shallow.

MD PPRP 6-3 Morgantown STAR ERD - Case No. 9229
6.3 BIOLOGICAL RESOURCES
Impacts to biological resources from the construction of the STAR Facility at the Morgantown Generating Station will not likely be significant. The site for the proposed facility is within an industrial area that has already been graded and cleared of vegetation. In the absence of vegetation resources and natural habitats, the area is not suitable for most wildlife species, and those present are likely to be generally occurring. The area is not known to support any federal or State-listed threatened and endangered species. Although aquatic resources and wetlands occur in the vicinity of the proposed project area, no impacts to these resources would occur provided erosion, sedimentation, and runoff control measures are implemented; the project does not entail new locations of water withdrawal from proximate surface waters.
6.4 SOCIOECONOMIC IMPACTS
Construction of the project would create as many as 100 jobs during the peak construction period although, over the 12-month project schedule, an average of 40 to 50 construction workers would be on-site. Once operational, employment would be 12 to 13 employees. The total cost of the project would be $50 million, with $30 million budgeted for construction. Although labor market conditions and low unemployment could affect labor availability and hiring, most construction workers are expected to live within daily commuting distance of the project. As a result, few effects on population and housing are anticipated from construction activities or from operating the facility.
Fiscal impacts from the project would be in the form of tax revenues and government expenditures on public services; however, revenue impacts would be minimal. The STAR Facility would have only a minor impact on Charles County property tax revenues. Incremental State and county tax revenues from the project are expected to more than offset public expenditure costs since Mirant would not require an extraordinary level of public services to construct and operate the STAR Facility.
The project would be contiguous to existing structures on lands that have been previously disturbed and are zoned IH – Heavy Industrial. No lands outside the Morgantown property would be pre-empted from other uses during construction of the project. Although part of the ash handling system connecting the STAR Facility to the Morgantown ash silos passes over the Critical Area, the project would have no direct effect on the Critical Area. No indirect effects on surrounding land uses are expected from operation of the STAR Facility.

MD PPRP 6-4 Morgantown STAR ERD - Case No. 9229
The project would be a minor trip generator during peak construction activities. Once operational, the traffic from the additional O&M workforce would have no adverse effect upon local roads and intersections. Unprocessed fly ash from Mirant’s Chalk Point Generating Station would be transported via fully enclosed pneumatic tanker trucks, up to 27 trucks per day, to Morgantown. The final licensing conditions require all trucks to use Mirant’s proposed truck route, when available, to haul unprocessed fly ash from Chalk Point to Morgantown and when returning to Chalk Point after delivery. Eighteen wheel semi-trucks would transport product ash to markets, but these would essentially replace dump trucks that currently haul unprocessed fly ash to disposal facilities in Charles County.
A Traffic Impact Study (TIS) was undertaken to assess the effects of future truck traffic due to trucks hauling unprocessed and product ash. The TIS found that both study intersections will operate acceptably and that auxiliary lanes had adequate length to accommodate turning movements entering and exiting the Morgantown site. Neither the SHA, MDTA, nor the Charles County Department of Planning and Growth Management have reviewed the TIS. As a result, the final licensing conditions require Mirant, prior to construction, to submit the TIS for the STAR Facility to the Charles County Department of Planning and Growth Management, MDTA, and the SHA for an Adequate Public Facilities analysis.
The most prominent visual components of the project would be adjacent to the existing Morgantown facility, and would not be easily distinguished within the industrial landscape. A vapor plume from the stack would be visible at virtually all times the FGD system is in operation, but usually the plume would disperse within the property lines of the Morgantown Generating Station. When visible, the vapor plume could potentially have an adverse effect on aesthetics, particularly on those occasions when there is extensive vertical and/or horizontal drift. In particular, the plume would sometimes be visible from nearby MIHP properties and from US 301, a designated corridor in the Southern Maryland’s Heritage Tourism Management Plan. However, given its scale relative to existing operations at Morgantown and small visual footprint, it is unlikely that the aesthetic landscape would be adversely affected by the proposed project.
With respect to cultural resources, an on-site family cemetery would not be physically disturbed by construction or operation of the STAR process reactor or load-out facilities. In the event that archeological sites or relics are found during excavation in the project area, the final licensing conditions for this project require Mirant to develop and implement a plan for avoidance and protection, data recovery or destruction. No historic

MD PPRP 6-5 Morgantown STAR ERD - Case No. 9229
property outside the boundaries of the Morgantown Generating Station would be directly affected by construction or operation of the project.

(This Page Intentionally Left Blank)

MD PPRP 7-1 Morgantown STAR ERD - Case No. 9229
7.0 REFERENCES
ACAA, 2008. American Coal Ash Association (ACAA) website. “Fly Ash”. Copyright 2008. http://acaa.affiniscape.com/displaycommon.cfm?an=1&subarticlenbr=149
AP-42, Fifth Edition, "Compilation of Air Pollutant Emission Factors, Volume 1: Chapter 1 Section 1: Bituminous and Subbituminous Coal Combustion", U.S. EPA, September 1998.
AP-42, Fifth Edition, "Compilation of Air Pollutant Emission Factors, Volume 1: Chapter 1 Section 5: Liquefied Petroleum Gas Combustion", U.S. EPA, July 2008.
AP-42, Fifth Edition, "Compilation of Air Pollutant Emission Factors, Volume 1: Chapter 13 Section 2.1: Paved Roads", U.S. EPA, November 2006.
AP-42, Fifth Edition, "Compilation of Air Pollutant Emission Factors, Volume 1: Chapter 13 Section 2.2: Unpaved Roads", U.S. EPA, November 2006.
AP-42, Fifth Edition, "Compilation of Air Pollutant Emission Factors, Volume 1: Chapter 13 Section 2.4 : Aggregate Handling and Storage", U.S. EPA, November 2006.
Bionomics Industries, Proposal for Mirant FGD Scrubber System R3, May 2010.
CCBOE, 2010. Charles County Board of Education (CCBOE). Charles County Public Schools. http://www2.ccboe.com/. Accessed July 26, 2010.
CCCC, 2001. County Commissioners of Charles County (CCCC). Comprehensive Solid Waste Management Plan 2000-2010. Adopted April 23, 2001.
CCCC, 2002. County Commissioners of Charles County (CCCC). Report of the Charles County Rural Commission. Rural Commission Committee and Staff. Submitted to the Charles County Commissioners and Charles County Planning Commission. September 2002.
MD PPRP 7-2 Morgantown STAR ERD - Case No. 9229
CCCC, 2004. County Commissioners of Charles County (CCCC). Charles County Historic Preservation Plan. July 2004.
CCCC, 2006. Charles County Land Preservation, Parks and Recreation Plan. Adopted June 2006. La Plata, Maryland.
CCCC, 2007. County Commissioners of Charles County (CCCC). Charles County Emergency Operations Plan. Revised August 31, 2007
CCCC, 2009. County Commissioners of Charles County (CCCC). Charles County Chemical Emergency Response and Preparedness Plan. December, 2009
CCDES, 2010. Charles County Department of Emergency Services (CCDES). Newburg Volunteer Rescue Squad and Fire Department. http://www.nvrsfd.com/content/history/. Accessed July 26, 2010.
CCEDD, 2007. Charles County Economic Development Department (CCEDD). Economic Development 2007 Report: 2007 Midyear Charles County Economic Report. 2007.
CCG, 2005. CCG Consulting Inc. Southern Maryland Broadband Study. September 2005.
CCSO, 2009. Charles County Sheriff’s Office (CCSO). 2008 Annual Report. La Plata, Maryland.
Charles County, 2006. Economic Development: Charles County, MD. Volume 1, Issue 1. 2006 Report. LaPlata, Maryland.
Civista Health, 2010. Website. www.civista.org.
DNR, 1994. Department of Natural Resources (DNR). Rare, threatened and endangered plants of Maryland. Prepared by Maryland Natural Heritage Program, Department of Natural Resources. 1994.
DPGM, 2001. Charles County Department of Planning and Growth Management (DPGM). Charles County Chesapeake Bay Critical Area Program. La Plata, Maryland. Revised and Readopted June 2001.
DPGM, 2006. Charles County Department of Planning and Growth Management (DPGM). Charles County Comprehensive Plan. April 24, 2006.
MD PPRP 7-3 Morgantown STAR ERD - Case No. 9229
DPGM, 2007. Charles County Department of Planning and Growth Management (DPGM). Adequate Public Facilities Manual. Prepared by Planning Division. La Plata, Maryland. Adopted July 7, 1997, Revised June 23 2007.
DPGM, 2010. Charles County Department of Planning and Growth Management (DPGM). E-mail communication from staff member Aimee S. Dailey, July 7, 2010.
EPA, Air Pollution Control Technology Fact Sheet, Flue Gas Desulfurization (FGD) Systems, EPA 452/F-03-034.
EPA, Air Pollution Control Technology Fact Sheet, Thermal Incinerators, EPA 452/F-03-022.
EPA, 2010. U.S. EPA AIRS database. Available online: www.epa.gov/air/data/.
EPA, 2005. Control of Mercury Emissions from Coal Fired Electric Utility Boilers an Update. February 18, 2005.
EPA, 2004a. Exhaust and Crankcase Emission Factors for Nonroad Engine Modeling-Compression-Ignition, EPA 420-P-04-009, April 2004. http://www.epa.gov/oms/models/nonrdmdl/nonrdmdl2004/420p04009.pdf.
EPA, 2004b. Median Life, Annual Activity and Load Factor Values for Nonroad Engine Emissions Modeling, EPA 420-P-04-005, April 2004. http://www.epa.gov/oms/models/nonrdmdl/nonrdmdl2004/420p04005.pdf.
EPA, 1998. U.S. EPA Office of Air Quality Planning and Standards. SLAMS/NAMS/PAMS Network Review Guidance. EPA-454/R-98-0003; http://www.epa.gov/ttn/amtic/files/ambient/criteria/reldocs/netrev98.pdf.
EPA, 1992. Utility Air Regulatory Group, “Fugitive Dust Background Document and Technical Information Document for Best Available Control Measures,” EPA 450/2-92-004, 1992.
EPRI, 2007. Electric Power Research Institute. “Estimating Total Sulfuric Acid Emissions from Stationary Power Plants, Technical Update to 2005 Southern Company,” March 2007.
MD PPRP 7-4 Morgantown STAR ERD - Case No. 9229
EPRI, 2004. Electric Power Research Institute. “Electric Utility Trace Substances Synthetic Report,” November 1994.
FHWA, 2007. Fatality Analysis Reporting System 2005. Federal Highway Administration. National Highway Traffic Safety Administration. National Center for Statistics and Analysis. Washington, D.C.
Gazette.net, 2010. “Charles County axes economic development department, jobs”. May 21, 2010. http://www.gazette.net/stories/05212010/businew173941_32559.php.
Gittings, 2010. Personal communication from Cassin B. Gittings, Police Chief, La Plata Police Department, La Plata, Maryland. July 27, 2010.
Greenhorne & O’Mara, 2006. Charles County Hazard Mitigation Plan. Greenhorne & O’Mara, Inc. March 2006.
Lippson, A. J. and R. L. Lippson, 2006. Life in the Chesapeake Bay, 3rd edition. Baltimore: The Johns Hopkins University Press.
Maryland State Climatology Office, 2006. Maryland State Climatology Website: http://www.atmos.umd.edu/~climate/. 2006.
MDE, 2010. Maryland Department of Environment (MDE). Charles County Surface Mines. 2010.
MDE, 2009. Maryland Department of Environment (MDE). TAPs Screening Level Database. http://www.mde.state.md.us/Permits/AirManagementPermits/Toxic_Air/index.asp
MDP, 2008. Maryland Department of Planning (MDP), Maryland State Data Center. Demographic and Socio-Economic Outlook. Population and Households Projections. December, 2008. http://www.mdp.state.md.us/msdc/S3_Projection.shtml Accessed July 2010.
MDP, 2010. Maryland Department of Planning (MDP). Total Full and Part-Time Jobs (by place of work) by Type and Industry, 2001 – 2008. From U.S. BEA Table CA-25N, May 2010.
MDTA, 2010. Maryland Transportation Authority (MDTA). Governor Harry W. Nice Memorial Bridge Improvement Project, April 2010. http://www.mdta.maryland.gov/Nicebridge/nice_index.html.

MD PPRP 7-5 Morgantown STAR ERD - Case No. 9229
MGC, 2000. Maryland Greenways Commission (MGC). Charles County Greenways, Water Trails and Protected Lands. Chesapeake and Coastal Watershed Service, Waterway and Greenways Division, Maryland Greenways Commission, Watershed Management and Analysis Division, Maryland Department of Natural Resources. August 2000.
Mirant, 2010. Application for CPCN Authorizing Modification of the Morgantown Generating Station. Prepared for Mirant Mid-Atlantic, LLC. March 2010.
MTDB, 2007. Maryland Tourism Development Board (MTDB). FY 2007 Tourism Development Annual Report. The Maryland Tourism Development Board and Office of Tourism. 2007.
MOTD, 2007. Maryland Office of Tourism Development (MOTD). The Economic Impact of Travel on Maryland Counties 2006. Prepared for the Maryland Office of Tourism Development by the Research Department of the Travel Industry Association Washington D.C. November 2007.
NOAA, 1995. “Local Climate Data Annual Summaries for 1995, Part I Eastern Region,” as published by the National Oceanic and Atmospheric Administration, National Environmental Satellite, Data, and Information Service, and National Climatic Data Center.
PCA, 2010. Portland Cement Association (PCA) website. “Concrete Technology.” Copyright 2010. http://www.cement.org/tech/cct_durability_fly_ash.asp
PEPCO, 1991. Potomac Electric Power Company (PEPCO). Morgantown Generating Station Potomac Electric Power Company Critical Area Intensively Developed Overlay Zone Conservation Plan. 1991.
SHA, 2007. State Highway Administration (SHA). Maryland Scenic Byways: Southern Region. Religious Freedom Tour.
SHA, 2010. State Highway Administration (SHA). 2009 Calendar Year Highway Location Reference, All Intersections: Charles County. State Highway Administration of Maryland, Highway Information Services Division, Data Support Group. June 17, 2010.
SMHA, 2003. The Southern Maryland Heritage Area (SMHA). Heritage Tourism Management Plan. Prepared for the Southern Maryland Heritage Area, Tourism Management Plan Steering Committee. Redman/Johnston Associates. April 2003.

MD PPRP 7-6 Morgantown STAR ERD - Case No. 9229
Simpson, 2007. Personal communication from Dennis N. Simpson, Deputy Director, Division of Capital Planning, Maryland Transportation Authority.
The Traffic Group, 2010a. Traffic Impact Analysis. Mirant Morgantown Generating Facility, Charles County, Maryland. Prepared for The SEFA Group. Prepared by The Traffic Group. October 15, 2010.
The Traffic Group, 2010b. Traffic Impact Analysis. Mirant Chalk Point, Prince George’s County, Maryland. Prepared for The SEFA Group. Prepared by The Traffic Group. October 15, 2010.
TRC, 2009. Emission Test Report, Coal Combustion By-Product (CCB) Fly Ash Beneficiation (FAB) Reactor. Prepared for The SEFA Group, Inc., Columbia, SC. February 2009.
Virginia Tourism Corporation, 2010. Barnesfield Park and Caledon Natural Area. http://www.virginia.org/site/content.asp?SrchLocality=King+George&formTarget=_parent&MGrp=1&MCat=13&Rgn=10000&MItm=0&DescripOnly=No. Accessed July 23, 2010.
Warring, 2010. Personal communication from Francis Warring, President, Newburg Volunteer Rescue Squad and Fire Department. July 26, 2010.
Wilson, 2010. Personal communication from Sergeant Wilson, Maryland State Police, Barrack H La Plata. July 27, 2010.