Environmental regulation of cloud and star formation in ... · 6 Observatoire de Paris, LERMA, PSL,...
13
arXiv:1509.06567v1 [astro-ph.GA] 22 Sep 2015 Mon. Not. R. Astron. Soc. 000, 000–000 (0000) Printed 7 March 2018 (MN L A T E X style file v2.2) Environmental regulation of cloud and star formation in galactic bars F. Renaud 1⋆ , F. Bournaud 2 , E. Emsellem 3,4 , O. Agertz 1 , E. Athanassoula 5 , F. Combes 6 , B. Elmegreen 7 , K. Kraljic 5 , F. Motte 2 and R. Teyssier 8 1 Department of Physics, University of Surrey, Guildford, GU2 7XH, UK 2 Laboratoire AIM Paris-Saclay, CEA/IRFU/SAp-CNRS/INSU, Universit´ e Paris Diderot, F-91191 Gif-sur-Yvette Cedex, France 3 European Southern Observatory, 85748 Garching bei Muenchen, Germany 4 Universit´ e Lyon 1, Observatoire de Lyon, CRAL et ENS, 9 Av Charles Andr´ e, F-69230 Saint-Genis Laval, France 5 Aix Marseille Universit´ e, CNRS, LAM (Laboratoire d’Astrophysique de Marseille), 13388 Marseille, France 6 Observatoire de Paris, LERMA, PSL, CNRS, Sorbonne Univ. UPMC and College de France, F-75014, Paris, France 7 IBMT. J. Watson Research Center, 1101 Kitchawan Road, Yorktown Heights, New York 10598, USA 8 Institute for Theoretical Physics, University of Z¨ urich, CH-8057 Z¨ urich, Switzerland Accepted 2015 September 22. Received 2015 September 7; in original form 2015 August 10 ABSTRACT The strong time-dependence of the dynamics of galactic bars yields a complex and rapidly evolving distribution of dense gas and star forming regions. Although bars mainly host re- gions void of any star formation activity, their extremities can gather the physical conditions for the formation of molecular complexes and mini-starbursts. Using a sub-parsec resolu- tion hydrodynamical simulation of a Milky Way-like galaxy, we probe these conditions to explore how and where bar (hydro-)dynamics favours the formation or destruction of molec- ular clouds and stars. The interplay between the kpc-scale dynamics (gas flows, shear) and the parsec-scale (turbulence) is key to this problem. We find a strong dichotomy between the leading and trailing sides of the bar, in term of cloud fragmentation and in the age distribution of the young stars. After orbiting along the bar edge, these young structures slow down at the extremities of the bar, where orbital crowding increases the probability of cloud-cloud colli- sion. We find that such events increase the Mach number of the cloud, leading to an enhanced star formation efficiency and finally the formation of massive stellar associations, in a fashion similar to galaxy-galaxy interactions. We highlight the role of bar dynamics in decoupling young stars from the clouds in which they form, and discuss the implications on the injection of feedback into the interstellar medium, in particular in the context of galaxy formation. Key words: Galaxy: structure — ISM: structure — methods: numerical 1 INTRODUCTION In isolated disc galaxies in the local Universe in general and the Milky Way in particular, most of the star formation activity oc- curs in giant molecular clouds distributed within kpc-scale struc- tures like spiral arms, where the interstellar medium (ISM) is about one hundred time denser than in inter-arm regions (Visser 1980; Hughes et al. 2013). Such excess of star formation is also observed in the central regions of galactic bars, again because of high surface densities of molecular gas (Sheth et al. 2002, but see Longmore et al. 2013 on a deficit of star formation in the ⋆ [email protected] central molecular zone). Furthermore, the extremities of bars can host large amounts of molecular gas, distributed in massive com- plexes, also called giant molecular associations (Solomon et al. 1987; Martin & Friedli 1997; Nguyen Luong et al. 2011). Among them, the complex W43 at the tip of the Milky Way bar gath- ers about 9 × 10 6 M⊙ of gas, embedded in a neutral hydro- gen envelope of 3 × 10 6 M⊙ (Motte et al. 2014). This complex hosts a mini-starburst activity, with the ongoing formation of mas- sive stars (Motte et al. 2003; Louvet et al. 2014). Using position- velocity data, Motte et al. (2014) proposed that such activity results from a collision between clouds accreted from a nearby spiral arm. However, because of the very short dynamical timescales in such environment (∼ 10 Myr) and the interplay between the numerous c 0000 RAS
Transcript of Environmental regulation of cloud and star formation in ... · 6 Observatoire de Paris, LERMA, PSL,...
arX
iv:1
509.
0656
7v1
[ast
ro-p
h.G
A]
22 S
ep 2
015
Mon. Not. R. Astron. Soc.000, 000–000 (0000) Printed 7 March 2018 (MN LATEX style file v2.2)
Environmental regulation of cloud and star formation in galacticbars
F. Renaud1⋆, F. Bournaud2, E. Emsellem3,4, O. Agertz1, E. Athanassoula5,F. Combes6, B. Elmegreen7, K. Kraljic5, F. Motte2 and R. Teyssier81Department of Physics, University of Surrey, Guildford, GU2 7XH, UK2 Laboratoire AIM Paris-Saclay, CEA/IRFU/SAp-CNRS/INSU, Universite Paris Diderot, F-91191 Gif-sur-Yvette Cedex, France3 European Southern Observatory, 85748 Garching bei Muenchen, Germany4 Universite Lyon 1, Observatoire de Lyon, CRAL et ENS, 9 Av Charles Andre, F-69230 Saint-Genis Laval, France5 Aix Marseille Universite, CNRS, LAM (Laboratoire d’Astrophysique de Marseille), 13388 Marseille, France6 Observatoire de Paris, LERMA, PSL, CNRS, Sorbonne Univ. UPMC and College de France, F-75014, Paris, France7 IBM T. J. Watson Research Center, 1101 Kitchawan Road, Yorktown Heights, New York 10598, USA8 Institute for Theoretical Physics, University of Zurich,CH-8057 Zurich, Switzerland
Accepted 2015 September 22. Received 2015 September 7; in original form 2015 August 10
ABSTRACTThe strong time-dependence of the dynamics of galactic barsyields a complex and rapidlyevolving distribution of dense gas and star forming regions. Although bars mainly host re-gions void of any star formation activity, their extremities can gather the physical conditionsfor the formation of molecular complexes and mini-starbursts. Using a sub-parsec resolu-tion hydrodynamical simulation of a Milky Way-like galaxy,we probe these conditions toexplore how and where bar (hydro-)dynamics favours the formation or destruction of molec-ular clouds and stars. The interplay between the kpc-scale dynamics (gas flows, shear) andthe parsec-scale (turbulence) is key to this problem. We finda strong dichotomy between theleading and trailing sides of the bar, in term of cloud fragmentation and in the age distributionof the young stars. After orbiting along the bar edge, these young structures slow down at theextremities of the bar, where orbital crowding increases the probability of cloud-cloud colli-sion. We find that such events increase the Mach number of the cloud, leading to an enhancedstar formation efficiency and finally the formation of massive stellar associations, in a fashionsimilar to galaxy-galaxy interactions. We highlight the role of bar dynamics in decouplingyoung stars from the clouds in which they form, and discuss the implications on the injectionof feedback into the interstellar medium, in particular in the context of galaxy formation.
Key words: Galaxy: structure — ISM: structure — methods: numerical
1 INTRODUCTION
In isolated disc galaxies in the local Universe in general and theMilky Way in particular, most of the star formation activityoc-curs in giant molecular clouds distributed within kpc-scale struc-tures like spiral arms, where the interstellar medium (ISM)isabout one hundred time denser than in inter-arm regions (Visser1980; Hughes et al. 2013). Such excess of star formation is alsoobserved in the central regions of galactic bars, again becauseof high surface densities of molecular gas (Sheth et al. 2002, butsee Longmore et al. 2013 on a deficit of star formation in the
central molecular zone). Furthermore, the extremities of bars canhost large amounts of molecular gas, distributed in massivecom-plexes, also called giant molecular associations (Solomonet al.1987; Martin & Friedli 1997; Nguyen Luong et al. 2011). Amongthem, the complex W43 at the tip of the Milky Way bar gath-ers about9 × 106 M⊙ of gas, embedded in a neutral hydro-gen envelope of3 × 106 M⊙ (Motte et al. 2014). This complexhosts a mini-starburst activity, with the ongoing formation of mas-sive stars (Motte et al. 2003; Louvet et al. 2014). Using position-velocity data, Motte et al. (2014) proposed that such activity resultsfrom a collision between clouds accreted from a nearby spiral arm.However, because of the very short dynamical timescales in suchenvironment (∼ 10 Myr) and the interplay between the numerous
c© 0000 RAS
2 Renaud et al.
physical processes at stake, understanding the origin of molecularcomplexes, their lifetimes, and the physical conditions leading toenhanced star formation in bars is rather difficult observationally.
Numerical simulations provide a complementary approachto the problem, and have been long used to address the ques-tions related to the dynamics and star formation in bars (seea review in Athanassoula 2013). Using sticky particle simula-tions, Combes & Gerin (1985) noted asymmetries in the distribu-tion of dust lanes between the leading and trailing sides of bars.Such results have also been established in hydrodynamical mod-els (Prendergast 1983; Athanassoula 1992; Piner et al. 1995) whichalso showed that gas concentration on the leading side correspondsto shocks. These simulations have sufficiently high resolutions(∼ 100 pc) to describe the inner structures of the bar. However,such pioneer studies faced technical limitations and couldnot re-solve how these features fragment (or not) into molecular clouds(∼ 10 pc). Although modern simulations still face the long-lastingissue of coupling between the kpc-scale dynamics of the galaxy andthe parsec and sub-parsec physics driving star formation and the as-sociated processes like feedback, technical improvementsin highperformance computation push further the limitations. Present-daygalaxy simulations now encompass both scales at once (see e.g.Dobbs et al. 2012; Bonnell et al. 2013; Fujimoto et al. 2014).
Using the model of the Milky Way presented in Renaud et al.(2013), we address here some of the questions related to the evo-lution of the structure of the ISM and the formation of stars in agalactic bar, focussing on the regions at their tips. The main advan-tage of this simulation is to describe the evolution of the interstellarmedium and the formation of stars by resolving the giant molecu-lar clouds at parsec and sub-parsec scales, within a “live” galacticcontext, i.e. with no forcing of the potential nor of the spiral or barpattern. Therefore, this simulation encompasses both dynamical as-pects from the kpc scales like tides, shear, disc rotation, and localparsec and sub-parsec effects like cloud self-gravity, turbulence andstellar feedback. This paper aims at providing comprehensive sce-narios for the formation of gaseous structures, their fragmentationinto molecular clouds, the interaction of these clouds, andthe po-tential formation of molecular complexes like W43.
2 NUMERICAL SIMULATION
Details of the galaxy simulation used in this work are presented inRenaud et al. (2013) and summarised here. We have run a hydrody-namical simulation of a Milky Way like galaxy in isolation, usingthe adaptive mesh refinement codeRAMSES (Teyssier 2002). Theinitial conditions are axisymmetric distributions of stars (bulge anddiscs) and dark matter halo rendered with particles, and gasmod-elled by an exponential disc on the mesh of the simulation. Thestellar component forms spirals and a bar within a few108 yr (seeEmsellem et al. 2015). The gas then naturally follows this potentialwell, and further fragments to form its own structures. The forma-tion and evolution of stellar and gaseous structures naturally arisefrom the dynamical evolution from axisymmetric initial conditionsand are not regulated by a pattern speed nor a fixed potential.
In a cubic box100 kpcwide, the maximum resolution reachedis 0.05 pc for a cloud crossing time (i.e. a few106 yr), and sub-parsec resolution for a few cloud lifetimes (i.e. several10 Myr).The equation of state, which is a fit to the actual thermal heat-
t = 755 Myr t = 800 Myr
Figure 1.Map of the stellar component of our Milky Way model (seen face-on) at the beginning and the end of our period of interest. (The bar rotatesanti-clockwise in all our Figures.)
ing/cooling balance, mimics a hot diffuse halo (105 –7 K), anisothermal warm phase (104 K up to≈ 10−1 cm−3) and a poly-tropic branch at high density, down to14 K. In Milky Way-likegalaxies, only a moderate amount of gas lies off the adopted equa-tion, and the heating and cooling processes make it rapidly fallback onto the relation, such that this equation of state provides agood approximation to more elaborate implementations, as shownin Kraljic et al. (2014). A pressure floor (for gas denser than≈2 × 105 cm−3) ensures that the local Jeans length is always re-solved by a few cells.
Star formation proceeds at a constant efficiency per free-falltime in the gas denser than2000 cm−3 (which corresponds, onaverage over the galaxy, to the transition where self-gravity takesover the supersonic turbulent dominated regime, visible asa power-law tail in the otherwise log-normal density probability distributionfunction, see Renaud et al. 2013, their Figure 10). The prescriptionfor stellar feedback consists in various phenomenologicalrecipesfor photo-ionisation in HII regions (by setting the temperature ofStromgrem spheres to2 × 104 K), radiative pressure (by deposi-tion of radial velocity kicks in these spheres) and kinetic supernovablasts (Renaud et al. 2013). No magnetic field has been included.
The snapshot att = 800 Myr (with t = 0 corresponding tothe initial conditions of the simulation) provides a good match tothe observational data of the Milky Way, in term of morphology andkinematics. Although some fine features are absent of the model(e.g. the nuclear ring at200 pc), the main structures of the MilkyWay (bar, spiral arms) are well reproduced (see Renaud et al.2013;Emsellem et al. 2015; Chemin et al. 2015). In that sense, althoughit is still utopian to compare the simulation with observations atthe level of individual GMCs, this model can confidently be usedto probe the average physical conditions of the real Galaxy andaddress the questions of formation and evolution of GMCs from astatistical perspective.
In this contribution, we study the formation of gas clouds andstars in the outer parts of the bar. The (hydro-)dynamics of the in-nermost kpc, and the coupling between the large-scales and the cen-tral black hole are presented in Emsellem et al. (2015). We focusour analysis betweent = 755 Myr andt = 800 Myr to monitorthe physical conditions leading to the formation of clouds and thento stars (Fig. 1). Running the simulation at sub-parsec resolutionover this period would be too costly. Instead, the resolution is pro-gressively increased, from3 pc to 0.05 pc, one refinement level ata time. Before activating a finer level, we let the simulationrun forseveral free-fall times of the densest structures, to ensure the signa-
c© 0000 RAS, MNRAS000, 000–000
Cloud and star formation in galactic bars 3
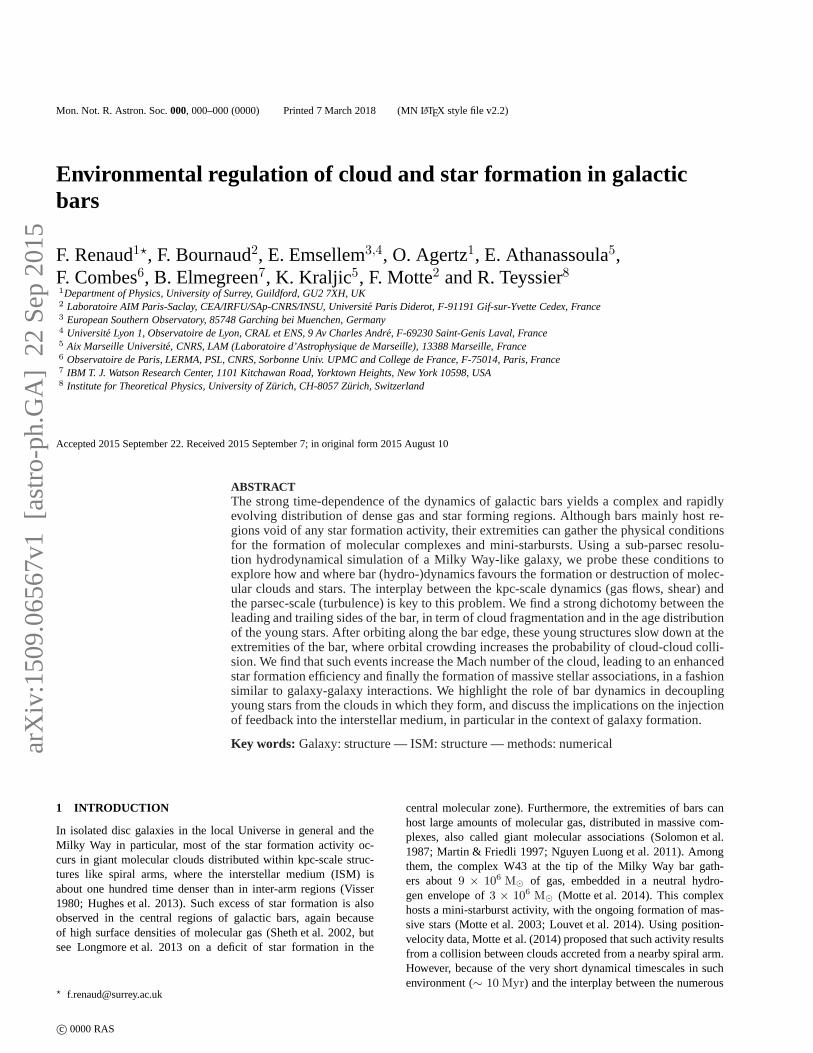
Figure 2.Map of the gas density (att = 755 Myr), in the bar and the innerregion of the disc.
tures of previous refinements have been erased. Star formation andfeedback are however active throughout the analysed period. Notethat the effective resolution controls the fragmentation level of theISM, which enables us to allow for the formation of spirals and barwhile preventing that of molecular clouds during the earliest epochsof the simulation (∼ 3 –4 rotation periods) to avoid a too floccu-lent disc. The coarsest resolution is however sufficient to describethe properties of the ISM at the scale of molecular clouds (several10 pc), but without being able to describe their inner structures.
The bar formed att ≈ 600 Myr and evolved from a weakbar (maximum amplitude of the tangential to radial force ratioof Q ≈ 0.2 at t = 700 Myr) to a stronger bar (Q ≈ 0.6 att = 800 Myr, see Emsellem et al. 2015, their Section 3.1). Att = 800 Myr, the bar pattern-speed is≈ 58 km/s/kpc (withco-rotation found at3.6 kpc). Its semi-major axis is2.4 kpc, withan axis ratio of 1:3. Inner Lindblad resonances, as computedfromthe azimuthally averaged mass distribution, are found at40 pc and450 pc from the galactic centre. More details on the evolutionof the disc and the bar can be found in Renaud et al. (2013) andEmsellem et al. (2015).
3 RESULTS
Fig. 2 shows the density of gas att = 755 Myr, before most ofthe star forming clumps form in the bar. Using this snapshot al-lows us to measure the physical conditions of cloud formation. Gashas already gathered in dense structures, following the gravitationalpotential of the stellar component, and is at the turning point offragmenting into clouds. Some regions along the outermost spiralarms (e.g. on lower part of Fig. 2) already host beads-on-a-stringclouds (Elmegreen & Elmegreen 1983; Renaud et al. 2013), whichare still in the phase of accreting their surrounding material. Gravi-tational torques from the bar and resonances regulate the gas flowstoward the centre along mini-spirals, in particular insidethe innerkpc, as discussed in Emsellem et al. (2015).
leading
trailing
trailing
leading
0°
90°
180°
270°
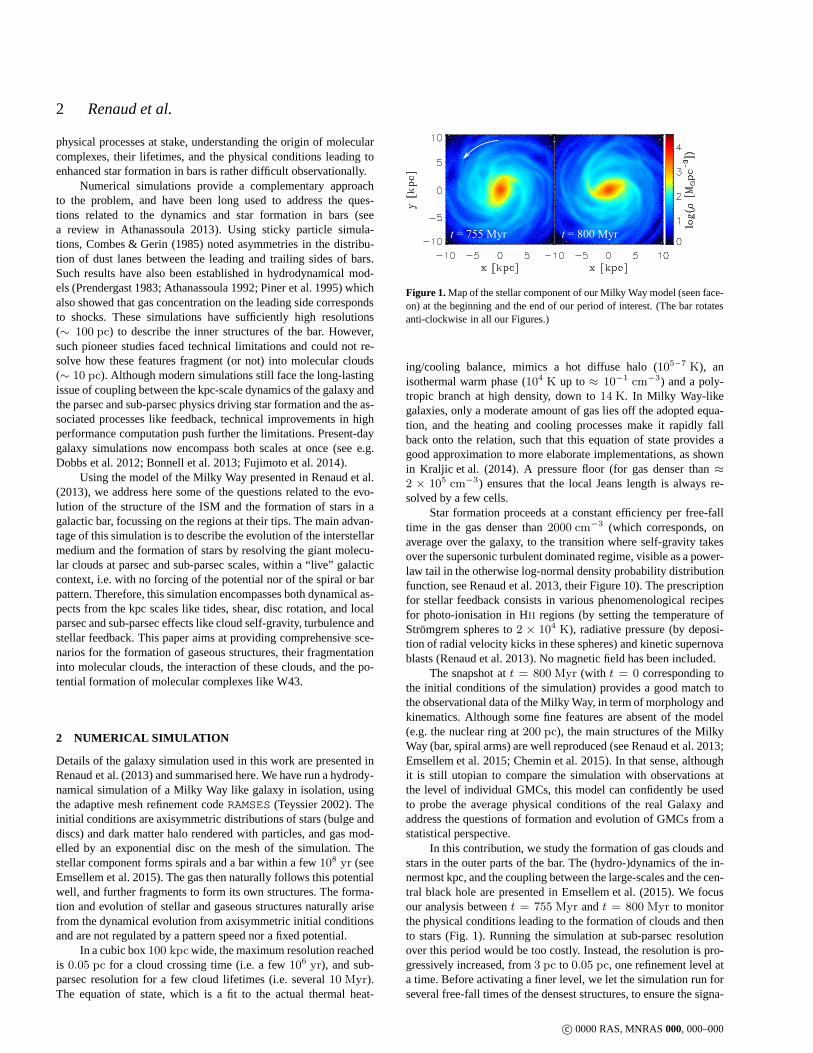
Figure 3. Map of the turbulent Mach number evaluated at the scale24 pc.Dashed lines indicate the major and minor axes of the bar, andthus tellapart the leading and trailing quadrants. The highest turbulent Mach num-bers are found on leading edges of the bar, where the ISM gets supersoni-cally shocked.
leading trailing leading trailing
Figure 4. Azimuthal profile of the turbulent Mach number (computed at thescale of24 pc), along the edge of the bar. The edge is here defined as an el-lipse of semi-major and semi-minor axes1.8 kpc and0.7 kpc respectively,and with an inclination of 72 degrees with respect to the axisx = 0 (seeFig. 3). To account for the non-perfectly ellipsoidal nature of the bar andinclude the densest gas features, data is extracted in a ringspanning250 pc
on both the inner and outer sides of this ellipse. Azimuths are indicated onFig. 3. On each quadrant (matching those displayed in Fig. 3), a horizontaldashed line indicates the average turbulent Mach number. The leading sidesof the bar host regions with higher turbulent Mach numbers than the trailingquadrants.
3.1 Turbulence
At the scale of24 pc, only a few regions yield supersonic tur-bulence (Fig. 3): the leading edges of the bar (as observed bySheth et al. 2002) and, to a lower extent, the two main spiral armsclose to the points where they connect to the bar. (The turbulentMach number is computed as in Kraljic et al. 2014, their Section4.1.) To further illustrate this point, Fig. 4 displays the azimuthalprofile of the turbulent Mach number along the edge of the bar,confirming the presence of a leading versus trailing asymmetry.
These high turbulent Mach numbers mostly originate from avelocity dispersion (∼ 20 km s−1) about 2 to 10 times larger inthese regions than elsewhere along the bar edge (where density,temperature, and thus sound speed are comparable). The locations
c© 0000 RAS, MNRAS000, 000–000
4 Renaud et al.
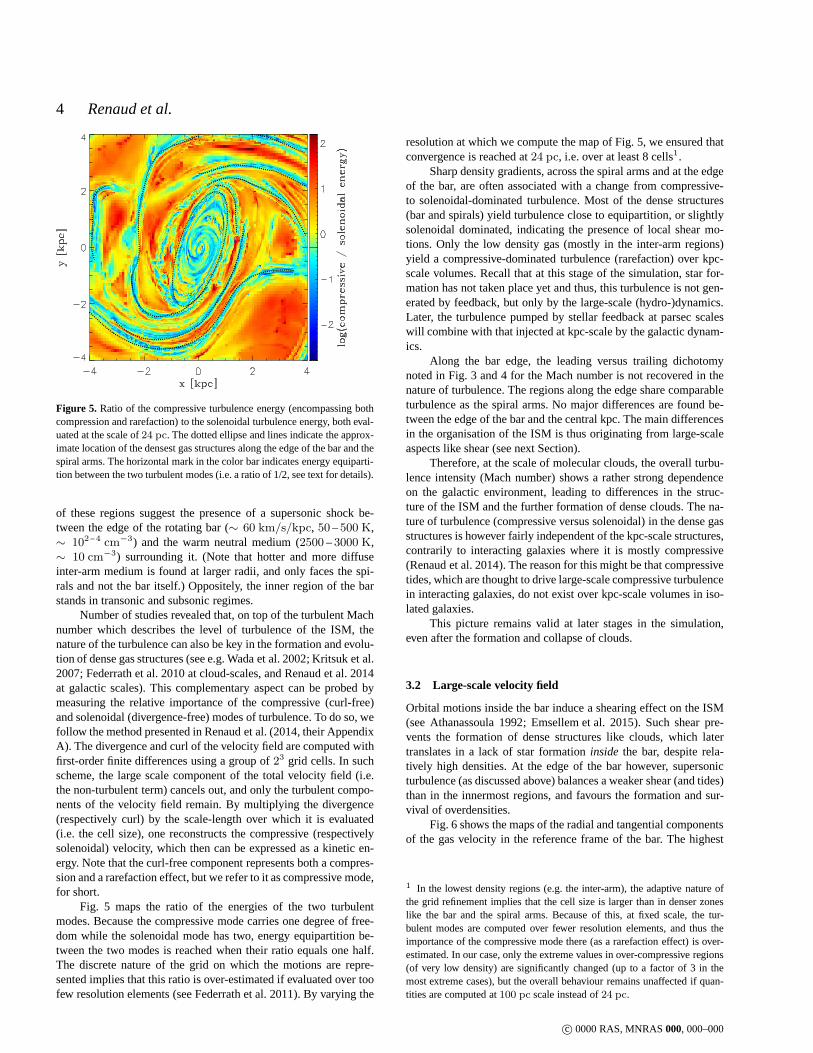
Figure 5. Ratio of the compressive turbulence energy (encompassing bothcompression and rarefaction) to the solenoidal turbulenceenergy, both eval-uated at the scale of24 pc. The dotted ellipse and lines indicate the approx-imate location of the densest gas structures along the edge of the bar and thespiral arms. The horizontal mark in the color bar indicates energy equiparti-tion between the two turbulent modes (i.e. a ratio of 1/2, seetext for details).
of these regions suggest the presence of a supersonic shock be-tween the edge of the rotating bar (∼ 60 km/s/kpc, 50 –500 K,∼ 102 –4 cm−3) and the warm neutral medium (2500 –3000 K,∼ 10 cm−3) surrounding it. (Note that hotter and more diffuseinter-arm medium is found at larger radii, and only faces thespi-rals and not the bar itself.) Oppositely, the inner region ofthe barstands in transonic and subsonic regimes.
Number of studies revealed that, on top of the turbulent Machnumber which describes the level of turbulence of the ISM, thenature of the turbulence can also be key in the formation and evolu-tion of dense gas structures (see e.g. Wada et al. 2002; Kritsuk et al.2007; Federrath et al. 2010 at cloud-scales, and Renaud et al. 2014at galactic scales). This complementary aspect can be probed bymeasuring the relative importance of the compressive (curl-free)and solenoidal (divergence-free) modes of turbulence. To do so, wefollow the method presented in Renaud et al. (2014, their AppendixA). The divergence and curl of the velocity field are computedwithfirst-order finite differences using a group of23 grid cells. In suchscheme, the large scale component of the total velocity field(i.e.the non-turbulent term) cancels out, and only the turbulentcompo-nents of the velocity field remain. By multiplying the divergence(respectively curl) by the scale-length over which it is evaluated(i.e. the cell size), one reconstructs the compressive (respectivelysolenoidal) velocity, which then can be expressed as a kinetic en-ergy. Note that the curl-free component represents both a compres-sion and a rarefaction effect, but we refer to it as compressive mode,for short.
Fig. 5 maps the ratio of the energies of the two turbulentmodes. Because the compressive mode carries one degree of free-dom while the solenoidal mode has two, energy equipartitionbe-tween the two modes is reached when their ratio equals one half.The discrete nature of the grid on which the motions are repre-sented implies that this ratio is over-estimated if evaluated over toofew resolution elements (see Federrath et al. 2011). By varying the
resolution at which we compute the map of Fig. 5, we ensured thatconvergence is reached at24 pc, i.e. over at least 8 cells1.
Sharp density gradients, across the spiral arms and at the edgeof the bar, are often associated with a change from compressive-to solenoidal-dominated turbulence. Most of the dense structures(bar and spirals) yield turbulence close to equipartition,or slightlysolenoidal dominated, indicating the presence of local shear mo-tions. Only the low density gas (mostly in the inter-arm regions)yield a compressive-dominated turbulence (rarefaction) over kpc-scale volumes. Recall that at this stage of the simulation, star for-mation has not taken place yet and thus, this turbulence is not gen-erated by feedback, but only by the large-scale (hydro-)dynamics.Later, the turbulence pumped by stellar feedback at parsec scaleswill combine with that injected at kpc-scale by the galacticdynam-ics.
Along the bar edge, the leading versus trailing dichotomynoted in Fig. 3 and 4 for the Mach number is not recovered in thenature of turbulence. The regions along the edge share comparableturbulence as the spiral arms. No major differences are found be-tween the edge of the bar and the central kpc. The main differencesin the organisation of the ISM is thus originating from large-scaleaspects like shear (see next Section).
Therefore, at the scale of molecular clouds, the overall turbu-lence intensity (Mach number) shows a rather strong dependenceon the galactic environment, leading to differences in the struc-ture of the ISM and the further formation of dense clouds. Thena-ture of turbulence (compressive versus solenoidal) in the dense gasstructures is however fairly independent of the kpc-scale structures,contrarily to interacting galaxies where it is mostly compressive(Renaud et al. 2014). The reason for this might be that compressivetides, which are thought to drive large-scale compressive turbulencein interacting galaxies, do not exist over kpc-scale volumes in iso-lated galaxies.
This picture remains valid at later stages in the simulation,even after the formation and collapse of clouds.
3.2 Large-scale velocity field
Orbital motions inside the bar induce a shearing effect on the ISM(see Athanassoula 1992; Emsellem et al. 2015). Such shear pre-vents the formation of dense structures like clouds, which latertranslates in a lack of star formationinside the bar, despite rela-tively high densities. At the edge of the bar however, supersonicturbulence (as discussed above) balances a weaker shear (and tides)than in the innermost regions, and favours the formation andsur-vival of overdensities.
Fig. 6 shows the maps of the radial and tangential componentsof the gas velocity in the reference frame of the bar. The highest
1 In the lowest density regions (e.g. the inter-arm), the adaptive nature ofthe grid refinement implies that the cell size is larger than in denser zoneslike the bar and the spiral arms. Because of this, at fixed scale, the tur-bulent modes are computed over fewer resolution elements, and thus theimportance of the compressive mode there (as a rarefaction effect) is over-estimated. In our case, only the extreme values in over-compressive regions(of very low density) are significantly changed (up to a factor of 3 in themost extreme cases), but the overall behaviour remains unaffected if quan-tities are computed at100 pc scale instead of24 pc.
c© 0000 RAS, MNRAS000, 000–000
Cloud and star formation in galactic bars 5
leading
leading
trailing
trailing
leading
leading
trailing
trailing
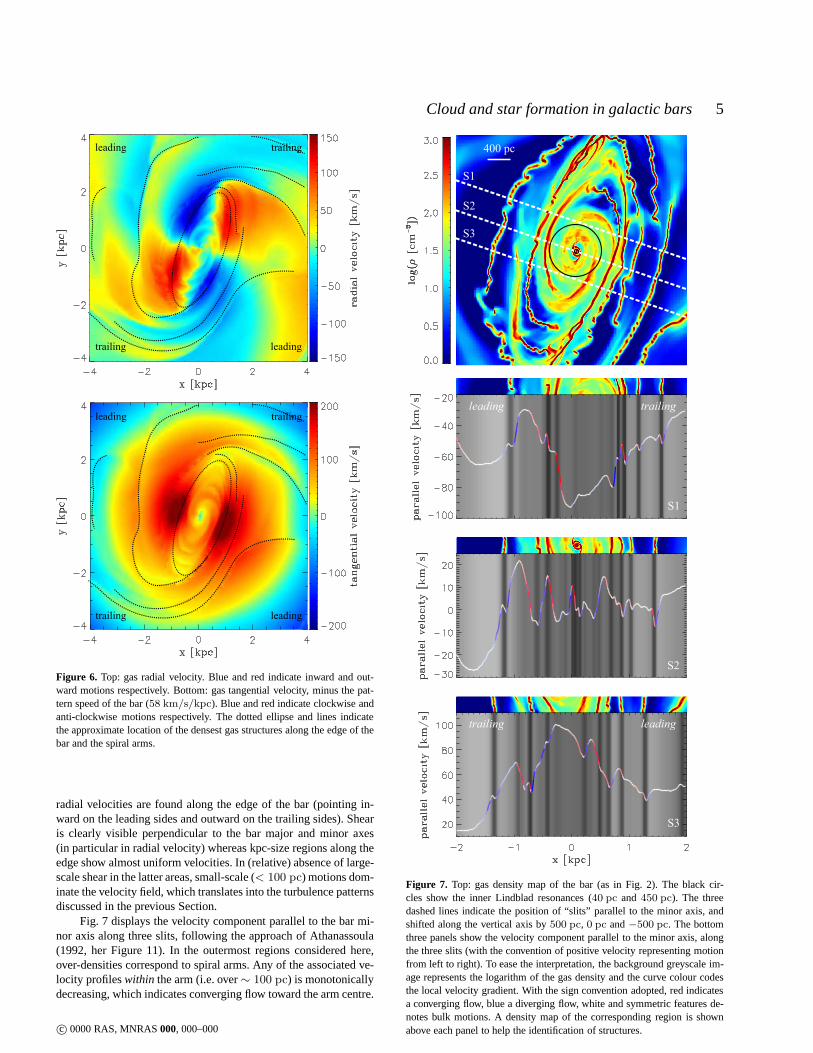
Figure 6. Top: gas radial velocity. Blue and red indicate inward and out-ward motions respectively. Bottom: gas tangential velocity, minus the pat-tern speed of the bar (58 km/s/kpc). Blue and red indicate clockwise andanti-clockwise motions respectively. The dotted ellipse and lines indicatethe approximate location of the densest gas structures along the edge of thebar and the spiral arms.
radial velocities are found along the edge of the bar (pointing in-ward on the leading sides and outward on the trailing sides).Shearis clearly visible perpendicular to the bar major and minor axes(in particular in radial velocity) whereas kpc-size regions along theedge show almost uniform velocities. In (relative) absenceof large-scale shear in the latter areas, small-scale (< 100 pc) motions dom-inate the velocity field, which translates into the turbulence patternsdiscussed in the previous Section.
Fig. 7 displays the velocity component parallel to the bar mi-nor axis along three slits, following the approach of Athanassoula(1992, her Figure 11). In the outermost regions considered here,over-densities correspond to spiral arms. Any of the associated ve-locity profileswithin the arm (i.e. over∼ 100 pc) is monotonicallydecreasing, which indicates converging flow toward the arm centre.
400 pc
S1
S2
S3
S1
S2
S3
trailing
trailingleading
leading
Figure 7. Top: gas density map of the bar (as in Fig. 2). The black cir-cles show the inner Lindblad resonances (40 pc and 450 pc). The threedashed lines indicate the position of “slits” parallel to the minor axis, andshifted along the vertical axis by500 pc, 0 pc and−500 pc. The bottomthree panels show the velocity component parallel to the minor axis, alongthe three slits (with the convention of positive velocity representing motionfrom left to right). To ease the interpretation, the background greyscale im-age represents the logarithm of the gas density and the curvecolour codesthe local velocity gradient. With the sign convention adopted, red indicatesa converging flow, blue a diverging flow, white and symmetric features de-notes bulk motions. A density map of the corresponding region is shownabove each panel to help the identification of structures.c© 0000 RAS, MNRAS000, 000–000
6 Renaud et al.
Figure 8.Profile of the velocity component perpendicular to the minoraxis,along the three slits shown in Fig. 7. Background indicates the gas densityin the slits, as in Fig. 7.
At larger scale, the flows are set by the disc dynamics and thusvarywith location.
The innermost dense gas structures (only visible in the centralslit) match the positions of the inner Lindblad resonances,at40 pc
and450 pc. The gas is fuelled there along mini-spiral arms by thegravitational torques of the bar and piled up on these stableorbits(see Renaud et al. 2013; Emsellem et al. 2015). Regions in betweenthese orbits yield either low velocities or diverging flows,whichparticipate in the lack of cloud and star formation in this area.
At the edge of the bar (0.5 kpc . |x| . 1 kpc), the denseststructures match steep velocity gradients, i.e. shocks, especially onthe leading side of the bar (x ≈ 300 ± 100 pc for S1 andx ≈600±100 pc for S3), which confirms the findings of Athanassoula(1992). On the trailing side, the velocity profile is mostly symmetricover a few100 pc, which simply denotes the rotation of the bar.
However, structures at intermediate radii and on the trailingside are not systematically associated with shocks. The differenceoriginates from the velocity component perpendicular to the minoraxis of the bar, of which profile is displayed on Fig. 8. Dense gasstructures associated with shocks (i.e. with steep parallel velocityprofiles on Fig. 7) are found in zones of low shear (i.e. flat perpen-dicular velocity profiles Fig. 8), particularly close to theedge of thebar, and in a few∼ 100 pc-scale regions where the perpendicularvelocity profile locally flattens.
Such relatively weak shear, combined with high densitiesand strong turbulence (recall Section 3.1), shapes elongated densegaseous structures and allows for their survival until theyfragmentinto clouds. Most of the material found there does not spiralinsidethe bar but remains on the bar edge and circulates around the bar(onx1-type orbits, see Contopoulos & Grosbol 1989; Skokos et al.2002) at high velocity (up to230 km s−1 in the bar referenceframe). It takes about20 Myr to travel from one of its apocen-tre to the next (on the other side of the bar,≈ 3 kpc on aver-age). The eccentric nature of this motion makes the gas slow down(∼ 40 km s−1) when it reaches the apocentre, i.e. the extremitiesof the bar (along the major axis). Here, the spread in orbitalen-ergies translates into a radial spread of apocentres, such that thematerial coming from the thin filaments parallel to the bar spansa large area (about1 kpc2, between∼ 1 kpc and∼ 2 kpc away
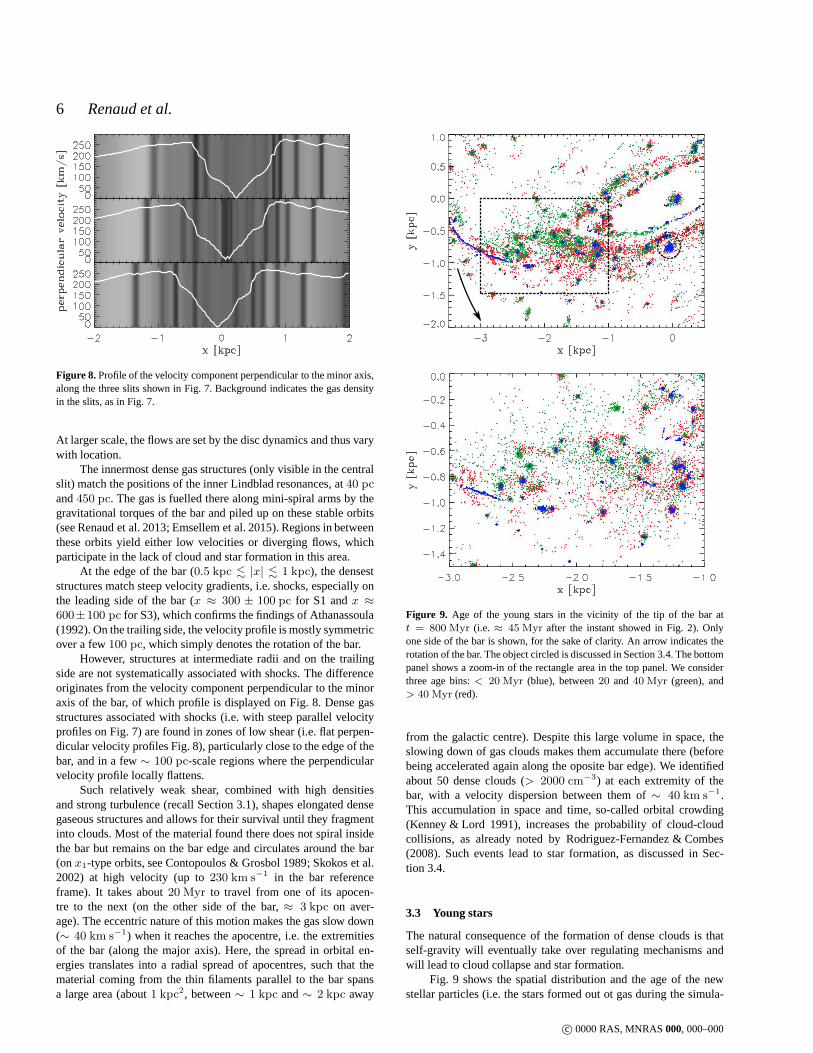
Figure 9. Age of the young stars in the vicinity of the tip of the bar att = 800 Myr (i.e. ≈ 45 Myr after the instant showed in Fig. 2). Onlyone side of the bar is shown, for the sake of clarity. An arrow indicates therotation of the bar. The object circled is discussed in Section 3.4. The bottompanel shows a zoom-in of the rectangle area in the top panel. We considerthree age bins:< 20 Myr (blue), between20 and 40 Myr (green), and> 40 Myr (red).
from the galactic centre). Despite this large volume in space, theslowing down of gas clouds makes them accumulate there (beforebeing accelerated again along the oposite bar edge). We identifiedabout 50 dense clouds (> 2000 cm−3) at each extremity of thebar, with a velocity dispersion between them of∼ 40 km s−1.This accumulation in space and time, so-called orbital crowding(Kenney & Lord 1991), increases the probability of cloud-cloudcollisions, as already noted by Rodriguez-Fernandez & Combes(2008). Such events lead to star formation, as discussed in Sec-tion 3.4.
3.3 Young stars
The natural consequence of the formation of dense clouds is thatself-gravity will eventually take over regulating mechanisms andwill lead to cloud collapse and star formation.
Fig. 9 shows the spatial distribution and the age of the newstellar particles (i.e. the stars formed out ot gas during the simula-
c© 0000 RAS, MNRAS000, 000–000

Cloud and star formation in galactic bars 7
= 200 km/s
Figure 10. Velocity field of the young stars, in the reference frame of thebar (58 km/s/kpc), in the same region and at the same epoch as in Fig. 9.The background displays the gas density map. Like the clouds, the starsslow down when reaching the extremity of the bar.
tion), about45 Myr after the instant previously discussed, once theclouds have formed, collapsed and began to form their stellar ma-terial. The lack of star formation in the inner bar (except atthe verycentre) is caused by the strong shear destroying clouds in this re-gion (Emsellem et al. 2015, see also Fig. 8), and the orbital patternpreventing stars formed elsewhere to enter this area.
One can tell apart three stellar populations: (i) the very youngstars (< 20 Myr), (ii) the intermediate class (between20 and40 Myr old), and (iii) the older population (> 40 Myr). (Theseclasses are defined arbitrarily, only for the sake of clarity.)
As expected, the very young stars are found associated withdense gas structures: along the spiral arm connected to the tip ofthe bar (i.e. in the elongated blue feature on the left-hand side of thefigure), and in central regions of some dense clumps at the tipof thebar itself (bottom panel), with the notable exception of themassiveclump on the edge of the bar (x ≈ −0.1 kpc, y ≈ −0.8 kpc)which will be discussed in Section 3.4.
The intermediate age stars (20 Myr < age< 40 Myr) arepreferentially found at the tip of the bar, but on the trailing side(upper half of the bottom panel of Fig. 9). Their ages indicate thatthey formed at the opposite tip of the bar and have travelled alongthe (upper) edge of the bar within the last∼ 20 –40 Myr, at thehigh velocity noted above. When reaching this extremity of the bar(i.e. their orbital apocentre), these stars slow down, as shown inFig. 10. They stay in the area of the tip of the bar for∼ 20 Myr
before being slingshot along the leading side of the bar (bottom onFig. 9 and 10) toward the other tip. This explains that stars on theleading side of the tip are a couple of10 Myr older than those onthe trailing side: they aged in the area of the tip.
By tracking back the origins of the stars found at the extremityof the bar (by selecting all stars in the bottom panel of Fig. 9), wefind that about 50% of them form in spiral arms and are accretedlater by the bar, with the furthest formation site being4.5 kpc awayfrom the galactic centre. Among this accreted population, abouthalf (55%) originates from the main spiral arms connected to thebar, while the other half forms along a secondary structure,equiv-alent to the 3-kpc arm (or Norma arm) in the real Galaxy. Whilethese stars form in clusters, the dynamics of the accretion (shearand tides) makes most of these objects dissolve before they reachthe extremity of the bar. They participate in populating the“field”,
10 pc
Figure 11. Gas density map in the region of interacting clouds along theedge of the bar (att = 800 Myr). Signatures of cloud-cloud interaction arevisible, as tidal tails and bridges made of dense gas.
as opposed to the clustered distribution of the young stars formedin situ, as visible on Fig. 9.
To summarise, the highly dynamical environment of the galac-tic bar directly influences the spatial distribution of young stars. Itis however likely that the stellar populations will mix overseveralorbital periods (∼ 100 Myr) and that the long-term evolution of thebar and the associated orbits would amplify this mixing process.
3.4 Cloud-cloud collisions and W43-analogue
The cluster of young stars at the positionx ≈ −0.1 kpc, y ≈−0.8 kpc in Fig. 9 stands out, both in terms of age (5 Myr on av-erage) and mass (3 × 10⁶ M⊙). The on-going star formation inthis region contrasts with the surrounding stellar material that hasformed either at the tip of the bar a few∼ 30 –40 Myr before,or even earlier elsewhere along the bar or in the spiral arms.Thereason for this is the interaction of two gas clouds in this region.Fig. 11 shows the distribution of gas, in the densest regionsof theclouds, which exhibits tail features. These tails are a signature ofthe past and still on-going tidal interaction between the clouds, ina very similar fashion as interacting galaxies exhibit longtails atmuch larger scale (e.g. Duc & Renaud 2013).
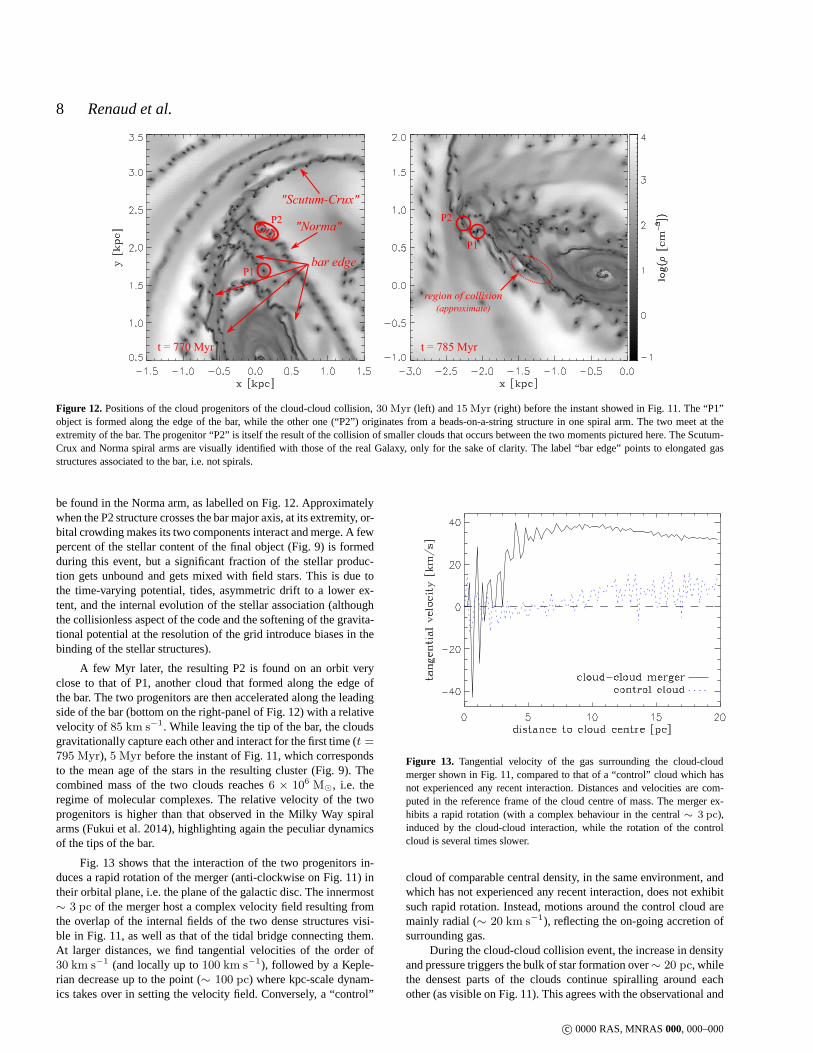
The Eulerian nature of the code used makes it difficult to trackthe cloud progenitors back. However, by tracking back the stel-lar particles found in this structure, we are able to get insights onthe formation of this object. Fig. 12 shows the identification of theclouds in earlier snapshots, respectively 30 and 15 Myr before theinstant of Fig. 9 and Fig. 11. The two progenitors visible in Fig. 11are labelled “P1” and “P2” here. (Distinguishing which is which onFig. 11 is impossible because of a too low time sampling of thesim-ulation snapshots compared to their orbital timescale around eachother, and because their stellar contents are too spatiallyextended,such that they overlap on the late snapshot.)
P2 is itself the result of a merger of (at least two, but possi-bly more) beads-on-a-string clouds that formed along a spiral arm.By visual identification with the real Galaxy, these clouds would
c© 0000 RAS, MNRAS000, 000–000
8 Renaud et al.
P1
P2 P2
P1
t = 785 Myrt = 770 Myr
"Scutum-Crux"
"Norma"
bar edge
region of collision
(approximate)
Figure 12. Positions of the cloud progenitors of the cloud-cloud collision,30 Myr (left) and15 Myr (right) before the instant showed in Fig. 11. The “P1”object is formed along the edge of the bar, while the other one(“P2”) originates from a beads-on-a-string structure in one spiral arm. The two meet at theextremity of the bar. The progenitor “P2” is itself the result of the collision of smaller clouds that occurs between the two moments pictured here. The Scutum-Crux and Norma spiral arms are visually identified with thoseof the real Galaxy, only for the sake of clarity. The label “bar edge” points to elongated gasstructures associated to the bar, i.e. not spirals.
be found in the Norma arm, as labelled on Fig. 12. Approximatelywhen the P2 structure crosses the bar major axis, at its extremity, or-bital crowding makes its two components interact and merge.A fewpercent of the stellar content of the final object (Fig. 9) is formedduring this event, but a significant fraction of the stellar produc-tion gets unbound and gets mixed with field stars. This is due tothe time-varying potential, tides, asymmetric drift to a lower ex-tent, and the internal evolution of the stellar association(althoughthe collisionless aspect of the code and the softening of thegravita-tional potential at the resolution of the grid introduce biases in thebinding of the stellar structures).
A few Myr later, the resulting P2 is found on an orbit veryclose to that of P1, another cloud that formed along the edge ofthe bar. The two progenitors are then accelerated along the leadingside of the bar (bottom on the right-panel of Fig. 12) with a relativevelocity of 85 km s−1. While leaving the tip of the bar, the cloudsgravitationally capture each other and interact for the first time (t =795 Myr), 5 Myr before the instant of Fig. 11, which correspondsto the mean age of the stars in the resulting cluster (Fig. 9).Thecombined mass of the two clouds reaches6 × 106 M⊙, i.e. theregime of molecular complexes. The relative velocity of thetwoprogenitors is higher than that observed in the Milky Way spiralarms (Fukui et al. 2014), highlighting again the peculiar dynamicsof the tips of the bar.
Fig. 13 shows that the interaction of the two progenitors in-duces a rapid rotation of the merger (anti-clockwise on Fig.11) intheir orbital plane, i.e. the plane of the galactic disc. Theinnermost∼ 3 pc of the merger host a complex velocity field resulting fromthe overlap of the internal fields of the two dense structuresvisi-ble in Fig. 11, as well as that of the tidal bridge connecting them.At larger distances, we find tangential velocities of the order of30 km s−1 (and locally up to100 km s−1), followed by a Keple-rian decrease up to the point (∼ 100 pc) where kpc-scale dynam-ics takes over in setting the velocity field. Conversely, a “control”
Figure 13. Tangential velocity of the gas surrounding the cloud-cloudmerger shown in Fig. 11, compared to that of a “control” cloudwhich hasnot experienced any recent interaction. Distances and velocities are com-puted in the reference frame of the cloud centre of mass. The merger ex-hibits a rapid rotation (with a complex behaviour in the central ∼ 3 pc),induced by the cloud-cloud interaction, while the rotationof the controlcloud is several times slower.
cloud of comparable central density, in the same environment, andwhich has not experienced any recent interaction, does not exhibitsuch rapid rotation. Instead, motions around the control cloud aremainly radial (∼ 20 km s−1), reflecting the on-going accretion ofsurrounding gas.
During the cloud-cloud collision event, the increase in densityand pressure triggers the bulk of star formation over∼ 20 pc, whilethe densest parts of the clouds continue spiralling around eachother (as visible on Fig. 11). This agrees with the observational and
c© 0000 RAS, MNRAS000, 000–000
Cloud and star formation in galactic bars 9
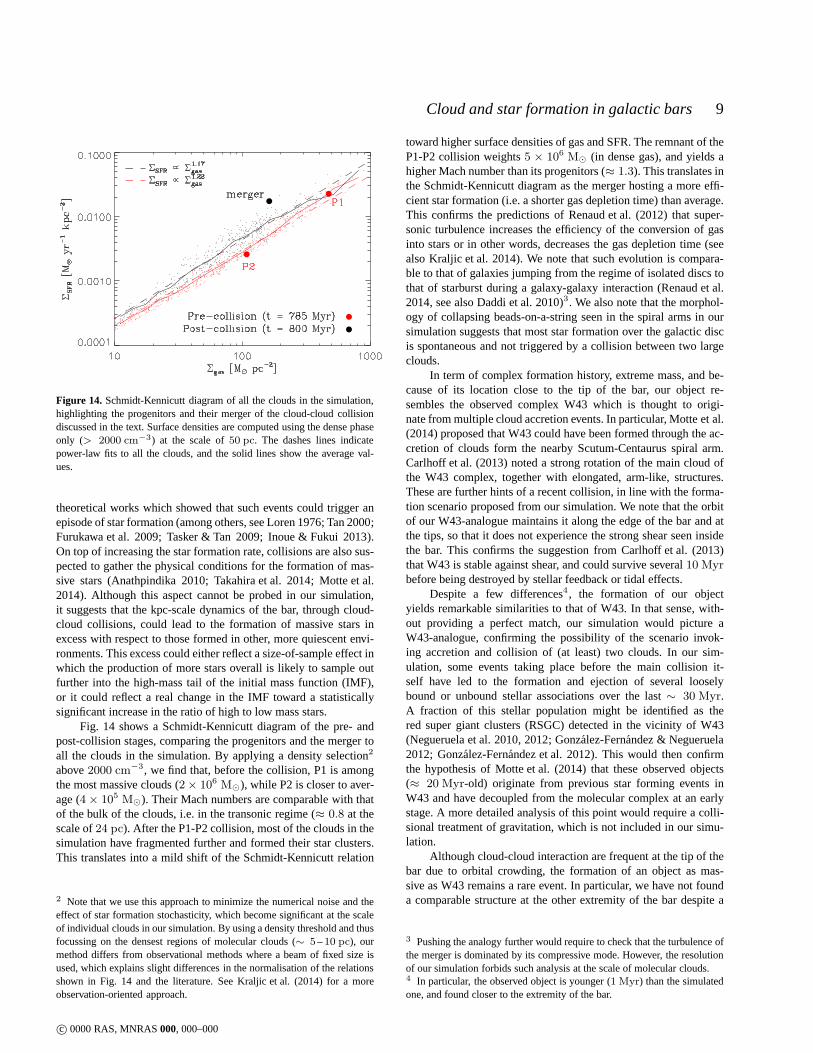
Figure 14. Schmidt-Kennicutt diagram of all the clouds in the simulation,highlighting the progenitors and their merger of the cloud-cloud collisiondiscussed in the text. Surface densities are computed usingthe dense phaseonly (> 2000 cm−3) at the scale of50 pc. The dashes lines indicatepower-law fits to all the clouds, and the solid lines show the average val-ues.
theoretical works which showed that such events could trigger anepisode of star formation (among others, see Loren 1976; Tan2000;Furukawa et al. 2009; Tasker & Tan 2009; Inoue & Fukui 2013).On top of increasing the star formation rate, collisions arealso sus-pected to gather the physical conditions for the formation of mas-sive stars (Anathpindika 2010; Takahira et al. 2014; Motte et al.2014). Although this aspect cannot be probed in our simulation,it suggests that the kpc-scale dynamics of the bar, through cloud-cloud collisions, could lead to the formation of massive stars inexcess with respect to those formed in other, more quiescentenvi-ronments. This excess could either reflect a size-of-sampleeffect inwhich the production of more stars overall is likely to sample outfurther into the high-mass tail of the initial mass function(IMF),or it could reflect a real change in the IMF toward a statisticallysignificant increase in the ratio of high to low mass stars.
Fig. 14 shows a Schmidt-Kennicutt diagram of the pre- andpost-collision stages, comparing the progenitors and the merger toall the clouds in the simulation. By applying a density selection2
above2000 cm−3, we find that, before the collision, P1 is amongthe most massive clouds (2× 10⁶ M⊙), while P2 is closer to aver-age (4× 10⁵ M⊙). Their Mach numbers are comparable with thatof the bulk of the clouds, i.e. in the transonic regime (≈ 0.8 at thescale of24 pc). After the P1-P2 collision, most of the clouds in thesimulation have fragmented further and formed their star clusters.This translates into a mild shift of the Schmidt-Kennicutt relation
2 Note that we use this approach to minimize the numerical noise and theeffect of star formation stochasticity, which become significant at the scaleof individual clouds in our simulation. By using a density threshold and thusfocussing on the densest regions of molecular clouds (∼ 5–10 pc), ourmethod differs from observational methods where a beam of fixed size isused, which explains slight differences in the normalisation of the relationsshown in Fig. 14 and the literature. See Kraljic et al. (2014)for a moreobservation-oriented approach.
toward higher surface densities of gas and SFR. The remnant of theP1-P2 collision weights5 × 106 M⊙ (in dense gas), and yields ahigher Mach number than its progenitors (≈ 1.3). This translates inthe Schmidt-Kennicutt diagram as the merger hosting a more effi-cient star formation (i.e. a shorter gas depletion time) than average.This confirms the predictions of Renaud et al. (2012) that super-sonic turbulence increases the efficiency of the conversionof gasinto stars or in other words, decreases the gas depletion time (seealso Kraljic et al. 2014). We note that such evolution is compara-ble to that of galaxies jumping from the regime of isolated discs tothat of starburst during a galaxy-galaxy interaction (Renaud et al.2014, see also Daddi et al. 2010)3. We also note that the morphol-ogy of collapsing beads-on-a-string seen in the spiral armsin oursimulation suggests that most star formation over the galactic discis spontaneous and not triggered by a collision between two largeclouds.
In term of complex formation history, extreme mass, and be-cause of its location close to the tip of the bar, our object re-sembles the observed complex W43 which is thought to origi-nate from multiple cloud accretion events. In particular, Motte et al.(2014) proposed that W43 could have been formed through the ac-cretion of clouds form the nearby Scutum-Centaurus spiral arm.Carlhoff et al. (2013) noted a strong rotation of the main cloud ofthe W43 complex, together with elongated, arm-like, structures.These are further hints of a recent collision, in line with the forma-tion scenario proposed from our simulation. We note that theorbitof our W43-analogue maintains it along the edge of the bar andatthe tips, so that it does not experience the strong shear seeninsidethe bar. This confirms the suggestion from Carlhoff et al. (2013)that W43 is stable against shear, and could survive several10 Myr
before being destroyed by stellar feedback or tidal effects.Despite a few differences4, the formation of our object
yields remarkable similarities to that of W43. In that sense, with-out providing a perfect match, our simulation would pictureaW43-analogue, confirming the possibility of the scenario invok-ing accretion and collision of (at least) two clouds. In our sim-ulation, some events taking place before the main collisionit-self have led to the formation and ejection of several looselybound or unbound stellar associations over the last∼ 30 Myr.A fraction of this stellar population might be identified as thered super giant clusters (RSGC) detected in the vicinity of W43(Negueruela et al. 2010, 2012; Gonzalez-Fernandez & Negueruela2012; Gonzalez-Fernandez et al. 2012). This would then confirmthe hypothesis of Motte et al. (2014) that these observed objects(≈ 20 Myr-old) originate from previous star forming events inW43 and have decoupled from the molecular complex at an earlystage. A more detailed analysis of this point would require acolli-sional treatment of gravitation, which is not included in our simu-lation.
Although cloud-cloud interaction are frequent at the tip ofthebar due to orbital crowding, the formation of an object as mas-sive as W43 remains a rare event. In particular, we have not founda comparable structure at the other extremity of the bar despite a
3 Pushing the analogy further would require to check that the turbulence ofthe merger is dominated by its compressive mode. However, the resolutionof our simulation forbids such analysis at the scale of molecular clouds.4 In particular, the observed object is younger (1 Myr) than the simulatedone, and found closer to the extremity of the bar.
c© 0000 RAS, MNRAS000, 000–000
10 Renaud et al.
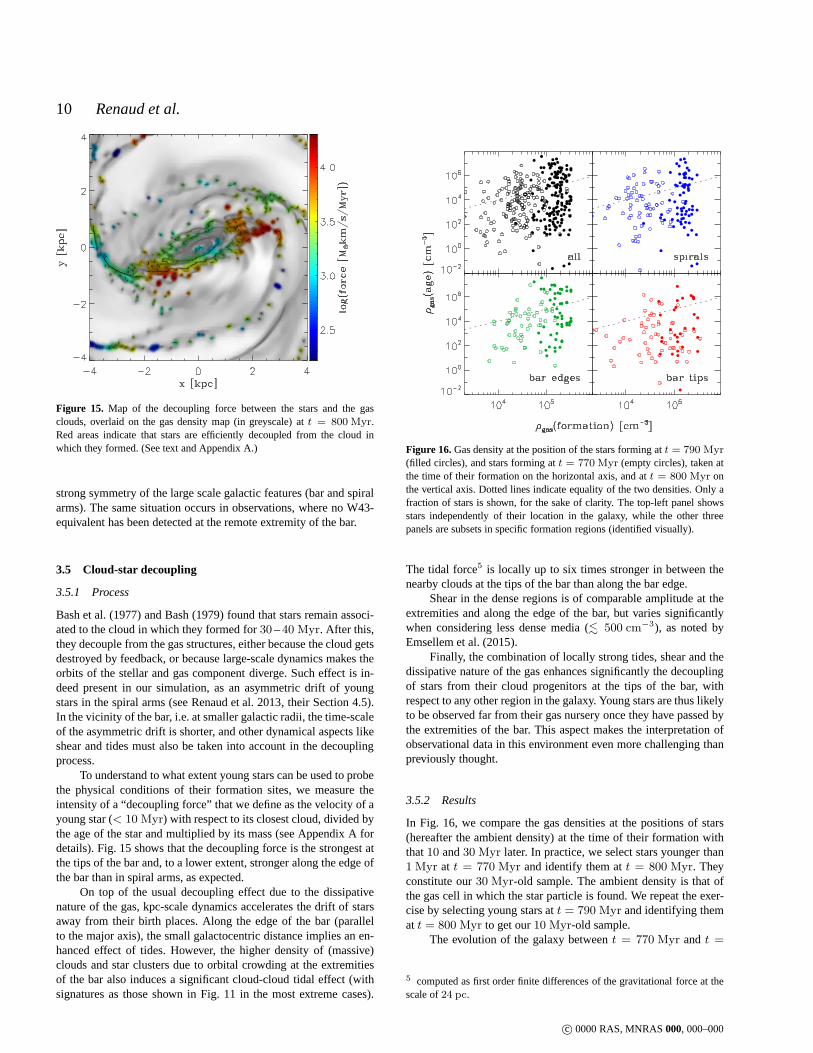
Figure 15. Map of the decoupling force between the stars and the gasclouds, overlaid on the gas density map (in greyscale) att = 800 Myr.Red areas indicate that stars are efficiently decoupled fromthe cloud inwhich they formed. (See text and Appendix A.)
strong symmetry of the large scale galactic features (bar and spiralarms). The same situation occurs in observations, where no W43-equivalent has been detected at the remote extremity of the bar.
3.5 Cloud-star decoupling
3.5.1 Process
Bash et al. (1977) and Bash (1979) found that stars remain associ-ated to the cloud in which they formed for30 –40 Myr. After this,they decouple from the gas structures, either because the cloud getsdestroyed by feedback, or because large-scale dynamics makes theorbits of the stellar and gas component diverge. Such effectis in-deed present in our simulation, as an asymmetric drift of youngstars in the spiral arms (see Renaud et al. 2013, their Section 4.5).In the vicinity of the bar, i.e. at smaller galactic radii, the time-scaleof the asymmetric drift is shorter, and other dynamical aspects likeshear and tides must also be taken into account in the decouplingprocess.
To understand to what extent young stars can be used to probethe physical conditions of their formation sites, we measure theintensity of a “decoupling force” that we define as the velocity of ayoung star (< 10 Myr) with respect to its closest cloud, divided bythe age of the star and multiplied by its mass (see Appendix A fordetails). Fig. 15 shows that the decoupling force is the strongest atthe tips of the bar and, to a lower extent, stronger along the edge ofthe bar than in spiral arms, as expected.
On top of the usual decoupling effect due to the dissipativenature of the gas, kpc-scale dynamics accelerates the driftof starsaway from their birth places. Along the edge of the bar (parallelto the major axis), the small galactocentric distance implies an en-hanced effect of tides. However, the higher density of (massive)clouds and star clusters due to orbital crowding at the extremitiesof the bar also induces a significant cloud-cloud tidal effect (withsignatures as those shown in Fig. 11 in the most extreme cases).
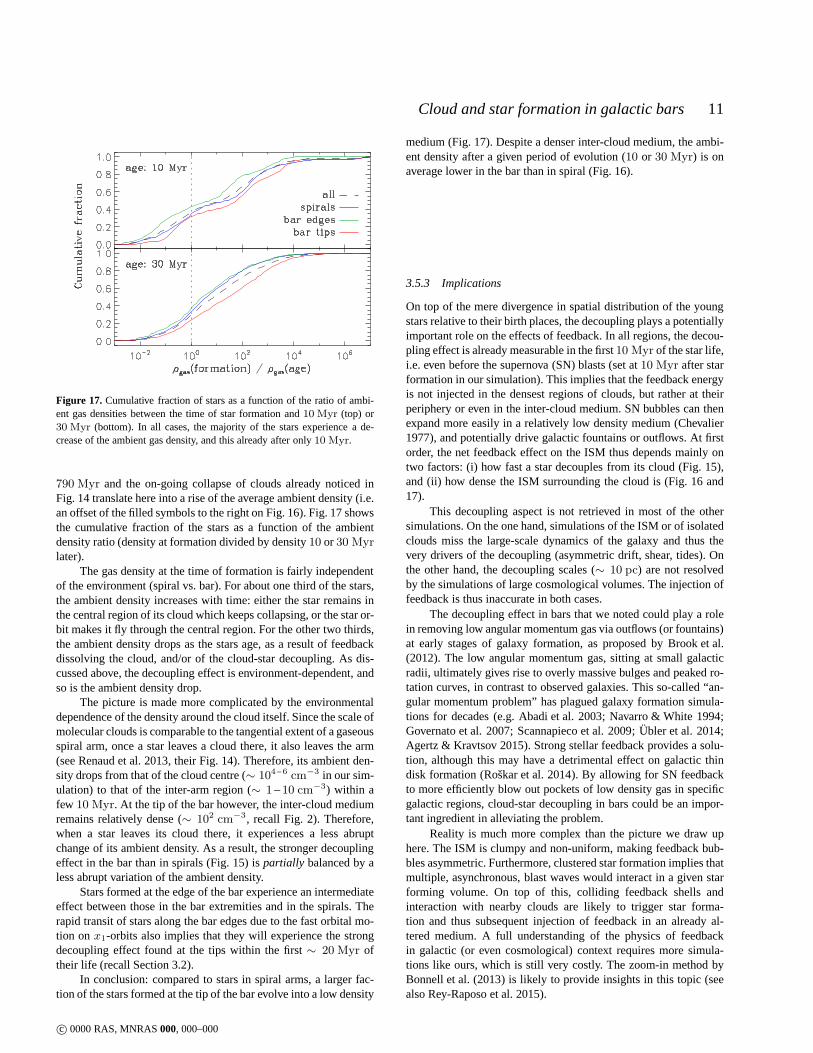
Figure 16.Gas density at the position of the stars forming att = 790 Myr
(filled circles), and stars forming att = 770 Myr (empty circles), taken atthe time of their formation on the horizontal axis, and att = 800 Myr onthe vertical axis. Dotted lines indicate equality of the twodensities. Only afraction of stars is shown, for the sake of clarity. The top-left panel showsstars independently of their location in the galaxy, while the other threepanels are subsets in specific formation regions (identifiedvisually).
The tidal force5 is locally up to six times stronger in between thenearby clouds at the tips of the bar than along the bar edge.
Shear in the dense regions is of comparable amplitude at theextremities and along the edge of the bar, but varies significantlywhen considering less dense media (. 500 cm−3), as noted byEmsellem et al. (2015).
Finally, the combination of locally strong tides, shear andthedissipative nature of the gas enhances significantly the decouplingof stars from their cloud progenitors at the tips of the bar, withrespect to any other region in the galaxy. Young stars are thus likelyto be observed far from their gas nursery once they have passed bythe extremities of the bar. This aspect makes the interpretation ofobservational data in this environment even more challenging thanpreviously thought.
3.5.2 Results
In Fig. 16, we compare the gas densities at the positions of stars(hereafter the ambient density) at the time of their formation withthat10 and30 Myr later. In practice, we select stars younger than1 Myr at t = 770 Myr and identify them att = 800 Myr. Theyconstitute our30 Myr-old sample. The ambient density is that ofthe gas cell in which the star particle is found. We repeat theexer-cise by selecting young stars att = 790 Myr and identifying themat t = 800 Myr to get our10 Myr-old sample.
The evolution of the galaxy betweent = 770 Myr andt =
5 computed as first order finite differences of the gravitational force at thescale of24 pc.
c© 0000 RAS, MNRAS000, 000–000
Cloud and star formation in galactic bars 11
Figure 17. Cumulative fraction of stars as a function of the ratio of ambi-ent gas densities between the time of star formation and10 Myr (top) or30 Myr (bottom). In all cases, the majority of the stars experiencea de-crease of the ambient gas density, and this already after only 10 Myr.
790 Myr and the on-going collapse of clouds already noticed inFig. 14 translate here into a rise of the average ambient density (i.e.an offset of the filled symbols to the right on Fig. 16). Fig. 17showsthe cumulative fraction of the stars as a function of the ambientdensity ratio (density at formation divided by density10 or 30 Myr
later).The gas density at the time of formation is fairly independent
of the environment (spiral vs. bar). For about one third of the stars,the ambient density increases with time: either the star remains inthe central region of its cloud which keeps collapsing, or the star or-bit makes it fly through the central region. For the other two thirds,the ambient density drops as the stars age, as a result of feedbackdissolving the cloud, and/or of the cloud-star decoupling.As dis-cussed above, the decoupling effect is environment-dependent, andso is the ambient density drop.
The picture is made more complicated by the environmentaldependence of the density around the cloud itself. Since thescale ofmolecular clouds is comparable to the tangential extent of agaseousspiral arm, once a star leaves a cloud there, it also leaves the arm(see Renaud et al. 2013, their Fig. 14). Therefore, its ambient den-sity drops from that of the cloud centre (∼ 104 –6 cm−3 in our sim-ulation) to that of the inter-arm region (∼ 1 –10 cm−3) within afew 10 Myr. At the tip of the bar however, the inter-cloud mediumremains relatively dense (∼ 102 cm−3, recall Fig. 2). Therefore,when a star leaves its cloud there, it experiences a less abruptchange of its ambient density. As a result, the stronger decouplingeffect in the bar than in spirals (Fig. 15) ispartially balanced by aless abrupt variation of the ambient density.
Stars formed at the edge of the bar experience an intermediateeffect between those in the bar extremities and in the spirals. Therapid transit of stars along the bar edges due to the fast orbital mo-tion onx1-orbits also implies that they will experience the strongdecoupling effect found at the tips within the first∼ 20 Myr oftheir life (recall Section 3.2).
In conclusion: compared to stars in spiral arms, a larger fac-tion of the stars formed at the tip of the bar evolve into a low density
medium (Fig. 17). Despite a denser inter-cloud medium, the ambi-ent density after a given period of evolution (10 or 30 Myr) is onaverage lower in the bar than in spiral (Fig. 16).
3.5.3 Implications
On top of the mere divergence in spatial distribution of the youngstars relative to their birth places, the decoupling plays apotentiallyimportant role on the effects of feedback. In all regions, the decou-pling effect is already measurable in the first10 Myr of the star life,i.e. even before the supernova (SN) blasts (set at10 Myr after starformation in our simulation). This implies that the feedback energyis not injected in the densest regions of clouds, but rather at theirperiphery or even in the inter-cloud medium. SN bubbles can thenexpand more easily in a relatively low density medium (Chevalier1977), and potentially drive galactic fountains or outflows. At firstorder, the net feedback effect on the ISM thus depends mainlyontwo factors: (i) how fast a star decouples from its cloud (Fig. 15),and (ii) how dense the ISM surrounding the cloud is (Fig. 16 and17).
This decoupling aspect is not retrieved in most of the othersimulations. On the one hand, simulations of the ISM or of isolatedclouds miss the large-scale dynamics of the galaxy and thus thevery drivers of the decoupling (asymmetric drift, shear, tides). Onthe other hand, the decoupling scales (∼ 10 pc) are not resolvedby the simulations of large cosmological volumes. The injection offeedback is thus inaccurate in both cases.
The decoupling effect in bars that we noted could play a rolein removing low angular momentum gas via outflows (or fountains)at early stages of galaxy formation, as proposed by Brook et al.(2012). The low angular momentum gas, sitting at small galacticradii, ultimately gives rise to overly massive bulges and peaked ro-tation curves, in contrast to observed galaxies. This so-called “an-gular momentum problem” has plagued galaxy formation simula-tions for decades (e.g. Abadi et al. 2003; Navarro & White 1994;Governato et al. 2007; Scannapieco et al. 2009;Ubler et al. 2014;Agertz & Kravtsov 2015). Strong stellar feedback provides asolu-tion, although this may have a detrimental effect on galactic thindisk formation (Roskar et al. 2014). By allowing for SN feedbackto more efficiently blow out pockets of low density gas in specificgalactic regions, cloud-star decoupling in bars could be animpor-tant ingredient in alleviating the problem.
Reality is much more complex than the picture we draw uphere. The ISM is clumpy and non-uniform, making feedback bub-bles asymmetric. Furthermore, clustered star formation implies thatmultiple, asynchronous, blast waves would interact in a given starforming volume. On top of this, colliding feedback shells andinteraction with nearby clouds are likely to trigger star forma-tion and thus subsequent injection of feedback in an alreadyal-tered medium. A full understanding of the physics of feedbackin galactic (or even cosmological) context requires more simula-tions like ours, which is still very costly. The zoom-in method byBonnell et al. (2013) is likely to provide insights in this topic (seealso Rey-Raposo et al. 2015).
c© 0000 RAS, MNRAS000, 000–000

12 Renaud et al.
4 DISCUSSION AND CONCLUSIONS
We use a hydrodynamical simulation of a Milky Way-like galaxy toprobe the role of the bar environment in triggering and regulatingthe formation of clouds and stars. Our approach consists in con-necting kpc-scale processes with the formation and early evolutionof parsec-scale structures. Our main conclusions are:
• The leading edges of the bar yield converging flows and large-scale shocks that favour the gathering of dense gas in kpc-long fil-aments, confirming the results of Athanassoula (1992) and others.Furthermore, these regions host supersonic turbulence which thenhelps the fragmentation of these filaments into clouds.• The tangential velocity gradient at the edge of the bar is
much weaker than in innermost regions, while the radial compo-nent yields shocks. Such differences explain that gas clumps arelikely to survive at the edge but not inside the bar.• The orbital pattern in the bar creates a fast circulation of matter
along the bar. While going from one tip to the other takes only20 Myr, the gas slows down at both tips and accumulates there.• Because of the high velocities along the bar, the objects older
than∼ 10 Myr have formed in a different environment and underdifferent physical conditions than the ones they are when observed.• Orbital crowding at the tip of the bar leads to cloud-cloud col-
lisions that can form massive molecular complexes like W43 andmassive stellar associations (∼ 106 M⊙). Such objects remain atthe tip of the bar for a rather short period (∼ 10 Myr or less) aftertheir formation.• A cloud-cloud collision increases the rotation of the merger,
the turbulent Mach number inside the cloud and the efficiencyofstar formation, in a comparable way as galaxy mergers.• Young stars decouple from their gas cloud more efficiently at
the tips of the bar than along the edge or in spiral arms. Such aspectcan affect the net effect of stellar feedback, possibly evenat galacticscale.
All together, these points illustrate the paramount effectof thefast dynamical evolution connected to the bar: stars even only afew 10 Myr old can be found in a very different environment thanthe one they formed in. Tips of the bar play an important part inthis picture. Either they host clouds long enough to witnesstheircollapse and star formation, or they gather physical conditions al-lowing star formation events (like cloud-cloud collisions). In thelatter case, the actual event can occur a few Myr later, whiletheclouds already exited this particular region.
The processes we highlight are likely to be altered in weakerbars (but see Zhou et al. 2015, and references therein) or by thepresence of multiple bars, especially if they rotate at different speed(Wozniak et al. 1995), e.g. by changing the large scale velocityfield. Active star forming regions, comparable to those we anal-ysed, has been observed at the extremities of bars of severalgalax-ies, like NGC 1097 (Ondrechen & van der Hulst 1983), NGC 1433,NGC 1512 and NGC 5383 (Athanassoula 1992).
Kraljic et al. (2012) showed that, although bars are short-livedat high redshift (z > 1), those formed atz ≈ 0.8 –1 survive forlong periods. They evolve through the accretion of intergalacticgas that they re-distribute within the galactic disc via gravitationaltorques (Bournaud et al. 2005). According to the classification ofbars in isolated galaxies proposed by Verley et al. (2007), the casemodelled here is representative of the most common class (theirgroup E). The evolution scenario in Verley et al. (2007) suggests
such bar would weaken and even be destroyed by gas infall. There-fore, simulations at parsec resolution and in cosmologicalcontextare needed to establish the frequency and the importance of the as-pects we presented here in the special case of our Milky Way-likesimulation.
ACKNOWLEDGMENTS
We thank the reviewer for a report that helped improve the clar-ity of the paper. This work was granted access to the PRACE Re-search Infrastructure resourceCurie hosted at the TGCC, France(PRACE project ra-0283), and national GENCI resources (projects2013, 2014, 2015-GEN2192). FR and FB acknowledges supportfrom the European Research Council through grants ERC-StG-335936 and ERC-StG-257720. EA acknowledges financial supportfrom the People Programme (Marie Curie Actions) of the EuropeanUnion’s Seventh Framework Programme FP7/2007-2013/ underREA grant agreement number PITN-GA-2011-289313 to the DA-GAL network and from the CNES (Centre National d’Etudes Spa-tiales - France). FC acknowledges the European Research Councilfor the Advanced Grant Program Num 267399-Momentum. KK ac-knowledges support from grant Spin(e) ANR-13-BS05-0005 ofthefrench ANR.
APPENDIX A: COMPUTATION OF THE DECOUPLINGFORCE
To measure the effect of the decoupling of the stars from the gascloud in which they form, we first identify clouds as density peaksin one snapshot of the simulation. We select the grid cells inwhichthe gas is denser than the star formation threshold (2000 cm−3).All contiguous selected cells constitute one cloud. Then, we selectstars between 2 and10 Myr old, and identify their closest cloudas their formation site. Choosing older stars could lead to errors inthe identification of the formation site. We compute the velocity ofthe star with respect to the cloud and its radial and tangential com-ponent. We reject the stars with a negative radial velocity,as theyare moving toward the cloud and do not experience a decouplingeffect. The total velocity is then converted into a force, bymulti-plying it by the mass of the star, and dividing it by the age of thestar. Finally, we compute the average force for each cloud over allits stars.
To obtain the map of Fig. 15, we convolve the scattered dis-tribution of the force for each cloud by a Gaussian kernel. Wethenmultiply this map by a smoothed version of the gas density mapforgraphical purposes only.
REFERENCES
Abadi M. G., Navarro J. F., Steinmetz M., Eke V. R., 2003, ApJ,597, 21
Agertz O., Kravtsov A. V., 2015, ApJ, 804, 18Anathpindika S. V., 2010, MNRAS, 405, 1431Athanassoula E., 1992, MNRAS, 259, 345Athanassoula E., 2013, in ”Secular Evolution of Galaxies”,J.Falcon-Barroso, and J. H. Knapen (eds), Cambridge, UK: Cam-bridge University Press
c© 0000 RAS, MNRAS000, 000–000
Cloud and star formation in galactic bars 13
Bash F. N., 1979, ApJ, 233, 524Bash F. N., Green E., Peters III W. L., 1977, ApJ, 217, 464Bonnell I. A., Dobbs C. L., Smith R. J., 2013, MNRAS, 430, 1790Bournaud F., Jog C. J., Combes F., 2005, A&A, 437, 69Brook C. B., Stinson G., Gibson B. K., Roskar R., Wadsley J.,Quinn T., 2012, MNRAS, 419, 771
Carlhoff P., Nguyen Luong Q., Schilke P., Motte F., Schneider N.,Beuther H., Bontemps S., Heitsch F., Hill T., Kramer C., Os-senkopf V., Schuller F., Simon R., Wyrowski F., 2013, A&A,560, A24
Chemin L., Renaud F., Soubiran C., 2015, A&A, 578, A14Chevalier R. A., 1977, ARA&A, 15, 175Combes F., Gerin M., 1985, A&A, 150, 327Contopoulos G., Grosbol P., 1989, A&A Rev., 1, 261Daddi E., Elbaz D., Walter F., Bournaud F., Salmi F., CarilliC.,Dannerbauer H., Dickinson M., et al. 2010, ApJ, 714, L118
Dobbs C. L., Pringle J. E., Burkert A., 2012, MNRAS, 425, 2157Duc P.-A., Renaud F., 2013, in Souchay J., Mathis S., TokiedaT.,eds, Lecture Notes in Physics, Berlin Springer Verlag Vol. 861,Tides in Colliding Galaxies. p. 327
Elmegreen B. G., Elmegreen D. M., 1983, MNRAS, 203, 31Emsellem E., Renaud F., Bournaud F., Elmegreen B., Combes F.,Gabor J. M., 2015, MNRAS, 446, 2468
Federrath C., Roman-Duval J., Klessen R. S., Schmidt W., MacLow M.-M., 2010, A&A, 512, A81
Federrath C., Sur S., Schleicher D. R. G., Banerjee R., KlessenR. S., 2011, ApJ, 731, 62
Fujimoto Y., Tasker E. J., Wakayama M., Habe A., 2014, MN-RAS, 439, 936
Fukui Y., Ohama A., Hanaoka N., Furukawa N., Torii K., DawsonJ. R., Mizuno N., Hasegawa K., et al. 2014, ApJ, 780, 36
Furukawa N., Dawson J. R., Ohama A., Kawamura A., MizunoN., Onishi T., Fukui Y., 2009, ApJ, 696, L115
Gonzalez-Fernandez C., Lopez-Corredoira M., Amores E. B.,Minniti D., Lucas P., Toledo I., 2012, A&A, 546, A107
Gonzalez-Fernandez C., Negueruela I., 2012, A&A, 539, A100Governato F., Willman B., Mayer L., Brooks A., Stinson G.,Valenzuela O., Wadsley J., Quinn T., 2007, MNRAS, 374, 1479
Hughes A., Meidt S. E., Schinnerer E., Colombo D., Pety J., LeroyA. K., Dobbs C. L., Garcıa-Burillo S., Thompson T. A., DumasG., Schuster K. F., Kramer C., 2013, ApJ, 779, 44
Inoue T., Fukui Y., 2013, ApJ, 774, L31Kenney J. D. P., Lord S. D., 1991, ApJ, 381, 118Kraljic K., Bournaud F., Martig M., 2012, ApJ, 757, 60Kraljic K., Renaud F., Bournaud F., Combes F., Elmegreen B.,Emsellem E., Teyssier R., 2014, ApJ, 784, 112
Kritsuk A. G., Norman M. L., Padoan P., Wagner R., 2007, ApJ,665, 416
Longmore S. N., Bally J., Testi L., Purcell C. R., Walsh A. J.,Bressert E., Pestalozzi M., Molinari S., et al. 2013, MNRAS,429, 987
Loren R. B., 1976, ApJ, 209, 466Louvet F., Motte F., Hennebelle P., Maury A., Bonnell I., Bon-temps S., Gusdorf A., Hill T., et al. 2014, A&A, 570, A15
Martin P., Friedli D., 1997, A&A, 326, 449Motte F., Nguyen Luong Q., Schneider N., Heitsch F., GloverS.,Carlhoff P., Hill T., Bontemps S., Schilke P., Louvet F., Henne-mann M., Didelon P., Beuther H., 2014, A&A, 571, A32
Motte F., Schilke P., Lis D. C., 2003, ApJ, 582, 277
Navarro J. F., White S. D. M., 1994, MNRAS, 267, 401Negueruela I., Gonzalez-Fernandez C., Marco A., Clark J.S.,Martınez-Nunez S., 2010, A&A, 513, A74
Negueruela I., Marco A., Gonzalez-Fernandez C., Jimenez-Esteban F., Clark J. S., Garcia M., Solano E., 2012, A&A, 547,A15
Nguyen Luong Q., Motte F., Schuller F., Schneider N., BontempsS., Schilke P., Menten K. M., Heitsch F., Wyrowski F., CarlhoffP., Bronfman L., Henning T., 2011, A&A, 529, A41
Ondrechen M. P., van der Hulst J. M., 1983, ApJ, 269, L47Piner B. G., Stone J. M., Teuben P. J., 1995, ApJ, 449, 508Prendergast, K. H., 1983, in Internal Kinematics and Dynamics ofGalaxies, IAUS100, ed. E. Athanassoula, Dordrecht: Reidel, 215
Renaud F., Bournaud F., Emsellem E., Elmegreen B., TeyssierR.,Alves J., Chapon D., Combes F., et al. 2013, MNRAS, 436, 1836
Renaud F., Bournaud F., Kraljic K., Duc P.-A., 2014, MNRAS,442, L33
Renaud F., Kraljic K., Bournaud F., 2012, ApJ, 760, L16Rey-Raposo R., Dobbs C., Duarte-Cabral A., 2015, MNRAS, 446,L46
Rodriguez-Fernandez N. J., Combes F., 2008, A&A, 489, 115Roskar R., Teyssier R., Agertz O., Wetzstein M., Moore B., 2014,MNRAS, 444, 2837
Scannapieco C., White S. D. M., Springel V., Tissera P. B., 2009,MNRAS, 396, 696
Sheth K., Vogel S. N., Regan M. W., Teuben P. J., Harris A. I.,Thornley M. D., 2002, AJ, 124, 2581
Skokos C., Patsis P. A., Athanassoula E., 2002, MNRAS, 333, 847Solomon P. M., Rivolo A. R., Barrett J., Yahil A., 1987, ApJ, 319,730
Takahira K., Tasker E. J., Habe A., 2014, ApJ, 792, 63Tan J. C., 2000, ApJ, 536, 173Tasker E. J., Tan J. C., 2009, ApJ, 700, 358Teyssier R., 2002, A&A, 385, 337Ubler H., Naab T., Oser L., Aumer M., Sales L. V., White S. D. M.,2014, MNRAS, 443, 2092
Verley S., Combes F., Verdes-Montenegro L., Bergond G., LeonS., 2007, A&A, 474, 43
Visser H. C. D., 1980, A&A, 88, 149Wada K., Meurer G., Norman C. A., 2002, ApJ, 577, 197Wozniak H., Friedli D., Martinet L., Martin P., Bratschi P.,1995,A&AS, 111, 115
Zhou Z.-M., Cao C., Wu H., 2015, AJ, 149, 1
c© 0000 RAS, MNRAS000, 000–000