Environmental Protection Expenditure by Industry: 2013 …€¢ To enable the UK to provide these...
70
Environmental Protection Expenditure by Industry: 2013 UK Survey April 2015 Ref. 47067423
Transcript of Environmental Protection Expenditure by Industry: 2013 …€¢ To enable the UK to provide these...
Environmental
Protection
Expenditure by
Industry: 2013 UK
Survey
April 2015
Ref. 47067423
AECOM
The Crescent Centre
Temple Back
Bristol
BS1 6EZ
REVISION RECORD
Rev Date Details Prepared by Reviewed by Approved by
1 20.03.15 First Draft Anna Hatley
Consultant
Kirsty Sargent
Principal
Consultant
Sally Vivian
Technical
Director
2 14.04.15 Final Report Anna Hatley
Consultant
Sally Vivian
Technical
Director
Sally Vivian
Technical
Director

AECOM Ref. 47067423 i
The views and recommendations expressed in this report are those of the authors and do not necessarily
represent the views of the Department for Environment, Food and Rural Affairs, its ministers or officials.

AECOM Ref. 47067423 ii
Executive Summary
AECOM Ref. 47067423 iii
Executive Summary
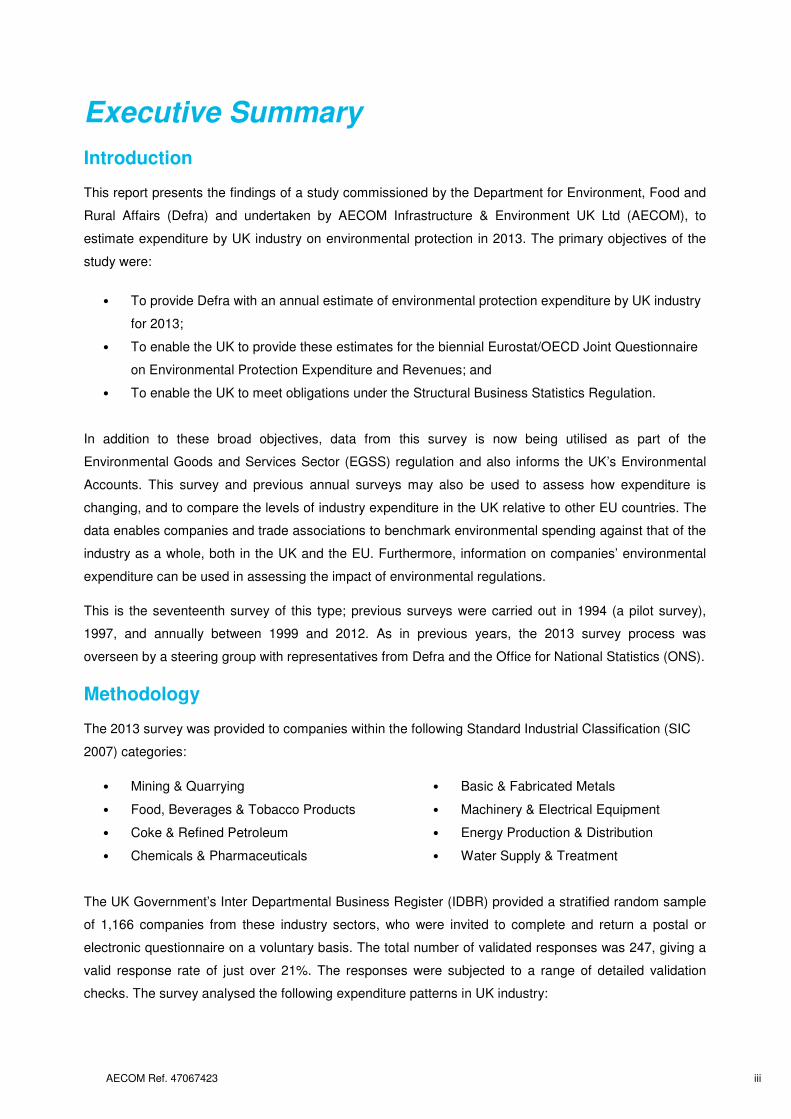
Introduction
This report presents the findings of a study commissioned by the Department for Environment, Food and
Rural Affairs (Defra) and undertaken by AECOM Infrastructure & Environment UK Ltd (AECOM), to
estimate expenditure by UK industry on environmental protection in 2013. The primary objectives of the
study were:
• To provide Defra with an annual estimate of environmental protection expenditure by UK industry
for 2013;
• To enable the UK to provide these estimates for the biennial Eurostat/OECD Joint Questionnaire
on Environmental Protection Expenditure and Revenues; and
• To enable the UK to meet obligations under the Structural Business Statistics Regulation.
In addition to these broad objectives, data from this survey is now being utilised as part of the
Environmental Goods and Services Sector (EGSS) regulation and also informs the UK’s Environmental
Accounts. This survey and previous annual surveys may also be used to assess how expenditure is
changing, and to compare the levels of industry expenditure in the UK relative to other EU countries. The
data enables companies and trade associations to benchmark environmental spending against that of the
industry as a whole, both in the UK and the EU. Furthermore, information on companies’ environmental
expenditure can be used in assessing the impact of environmental regulations.
This is the seventeenth survey of this type; previous surveys were carried out in 1994 (a pilot survey),
1997, and annually between 1999 and 2012. As in previous years, the 2013 survey process was
overseen by a steering group with representatives from Defra and the Office for National Statistics (ONS).
Methodology
The 2013 survey was provided to companies within the following Standard Industrial Classification (SIC
2007) categories:
• Mining & Quarrying • Basic & Fabricated Metals
• Food, Beverages & Tobacco Products • Machinery & Electrical Equipment
• Coke & Refined Petroleum • Energy Production & Distribution
• Chemicals & Pharmaceuticals • Water Supply & Treatment
The UK Government’s Inter Departmental Business Register (IDBR) provided a stratified random sample
of 1,166 companies from these industry sectors, who were invited to complete and return a postal or
electronic questionnaire on a voluntary basis. The total number of validated responses was 247, giving a
valid response rate of just over 21%. The responses were subjected to a range of detailed validation
checks. The survey analysed the following expenditure patterns in UK industry:
AECOM Ref. 47067423 iv
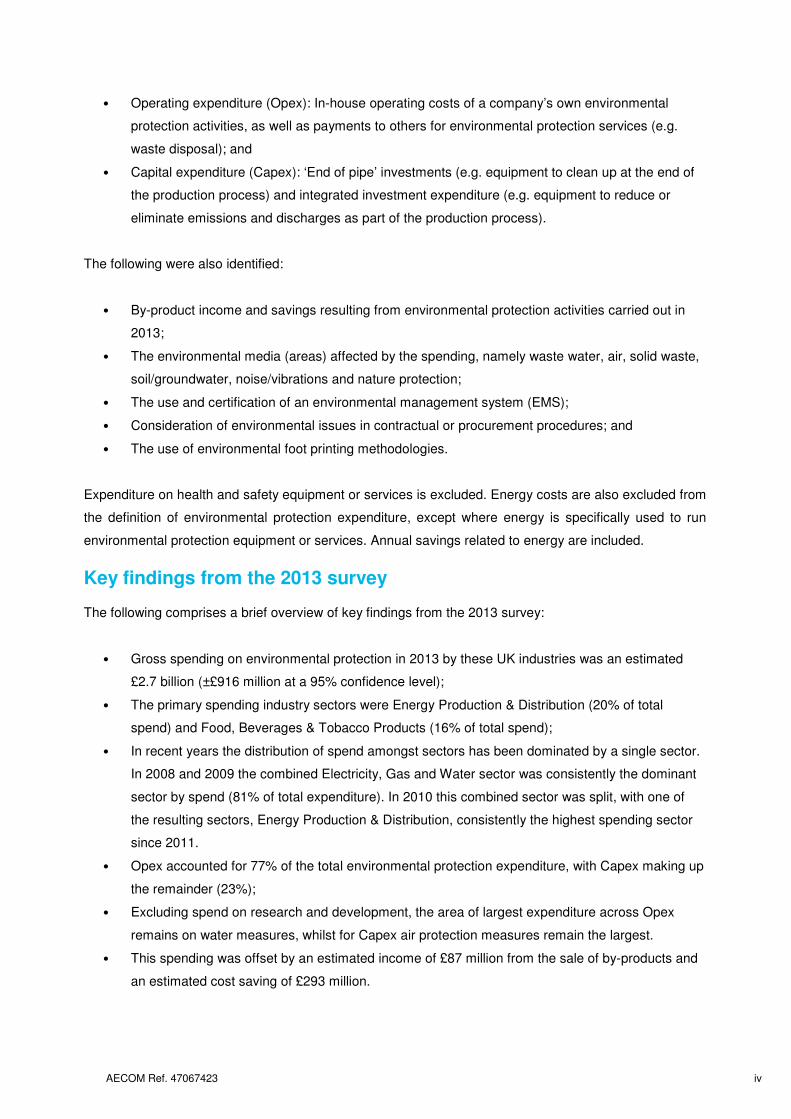
• Operating expenditure (Opex): In-house operating costs of a company’s own environmental
protection activities, as well as payments to others for environmental protection services (e.g.
waste disposal); and
• Capital expenditure (Capex): ‘End of pipe’ investments (e.g. equipment to clean up at the end of
the production process) and integrated investment expenditure (e.g. equipment to reduce or
eliminate emissions and discharges as part of the production process).
The following were also identified:
• By-product income and savings resulting from environmental protection activities carried out in
2013;
• The environmental media (areas) affected by the spending, namely waste water, air, solid waste,
soil/groundwater, noise/vibrations and nature protection;
• The use and certification of an environmental management system (EMS);
• Consideration of environmental issues in contractual or procurement procedures; and
• The use of environmental foot printing methodologies.
Expenditure on health and safety equipment or services is excluded. Energy costs are also excluded from
the definition of environmental protection expenditure, except where energy is specifically used to run
environmental protection equipment or services. Annual savings related to energy are included.
Key findings from the 2013 survey
The following comprises a brief overview of key findings from the 2013 survey:
• Gross spending on environmental protection in 2013 by these UK industries was an estimated
£2.7 billion (±£916 million at a 95% confidence level);
• The primary spending industry sectors were Energy Production & Distribution (20% of total
spend) and Food, Beverages & Tobacco Products (16% of total spend);
• In recent years the distribution of spend amongst sectors has been dominated by a single sector.
In 2008 and 2009 the combined Electricity, Gas and Water sector was consistently the dominant
sector by spend (81% of total expenditure). In 2010 this combined sector was split, with one of
the resulting sectors, Energy Production & Distribution, consistently the highest spending sector
since 2011.
• Opex accounted for 77% of the total environmental protection expenditure, with Capex making up
the remainder (23%);
• Excluding spend on research and development, the area of largest expenditure across Opex
remains on water measures, whilst for Capex air protection measures remain the largest.
• This spending was offset by an estimated income of £87 million from the sale of by-products and
an estimated cost saving of £293 million.
AECOM Ref. 47067423 v
• Overall, 67% of responding companies had an EMS in place in 2013. Of these nearly three
quarters had an EMS certified to ISO 14001, with the remainder reporting an in-house
management system.
Comparisons between survey years
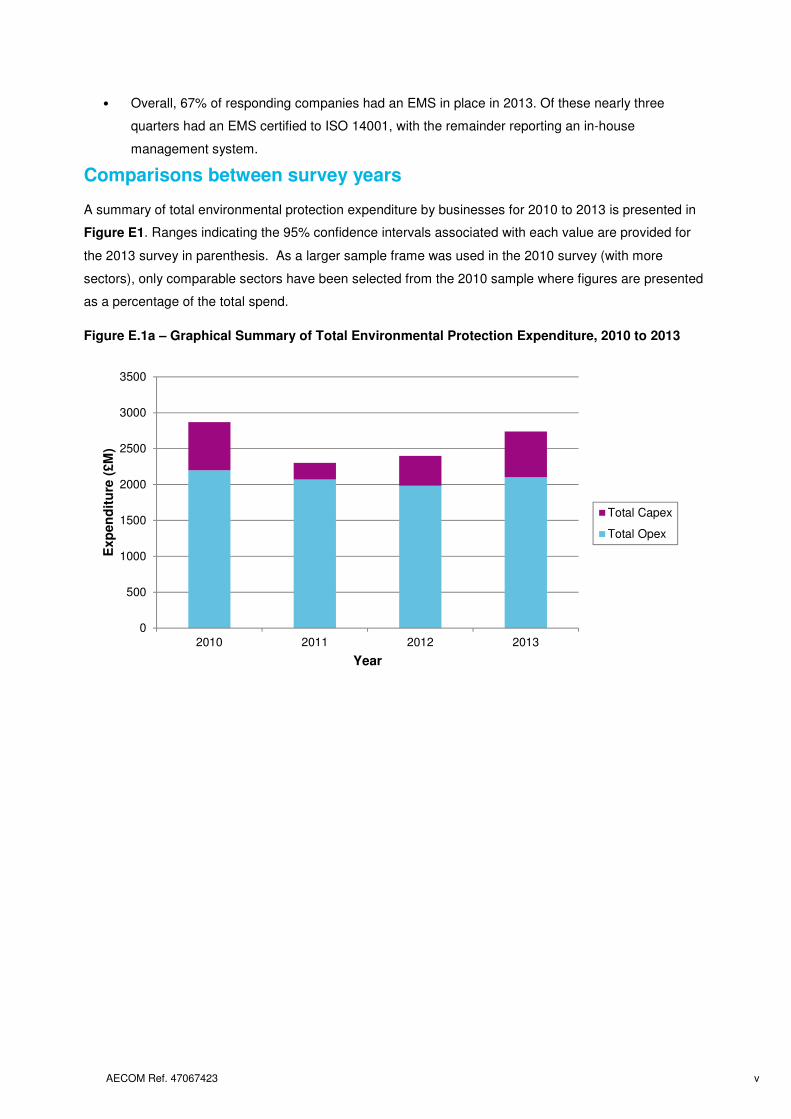
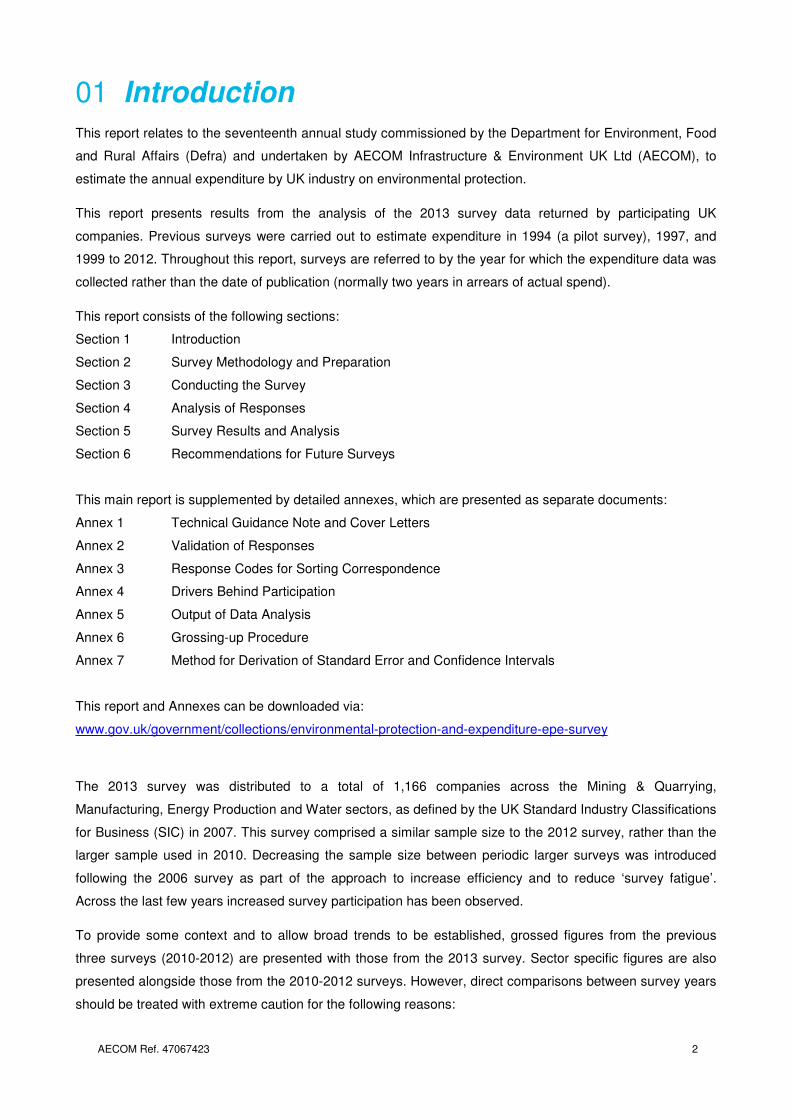
A summary of total environmental protection expenditure by businesses for 2010 to 2013 is presented in
Figure E1. Ranges indicating the 95% confidence intervals associated with each value are provided for
the 2013 survey in parenthesis. As a larger sample frame was used in the 2010 survey (with more
sectors), only comparable sectors have been selected from the 2010 sample where figures are presented
as a percentage of the total spend.
Figure E.1a – Graphical Summary of Total Environmental Protection Expenditure, 2010 to 2013
0
500
1000
1500
2000
2500
3000
3500
2010 2011 2012 2013
Exp
en
dit
ure
(£M
)
Year
Total Capex
Total Opex
AECOM Ref. 47067423 vi
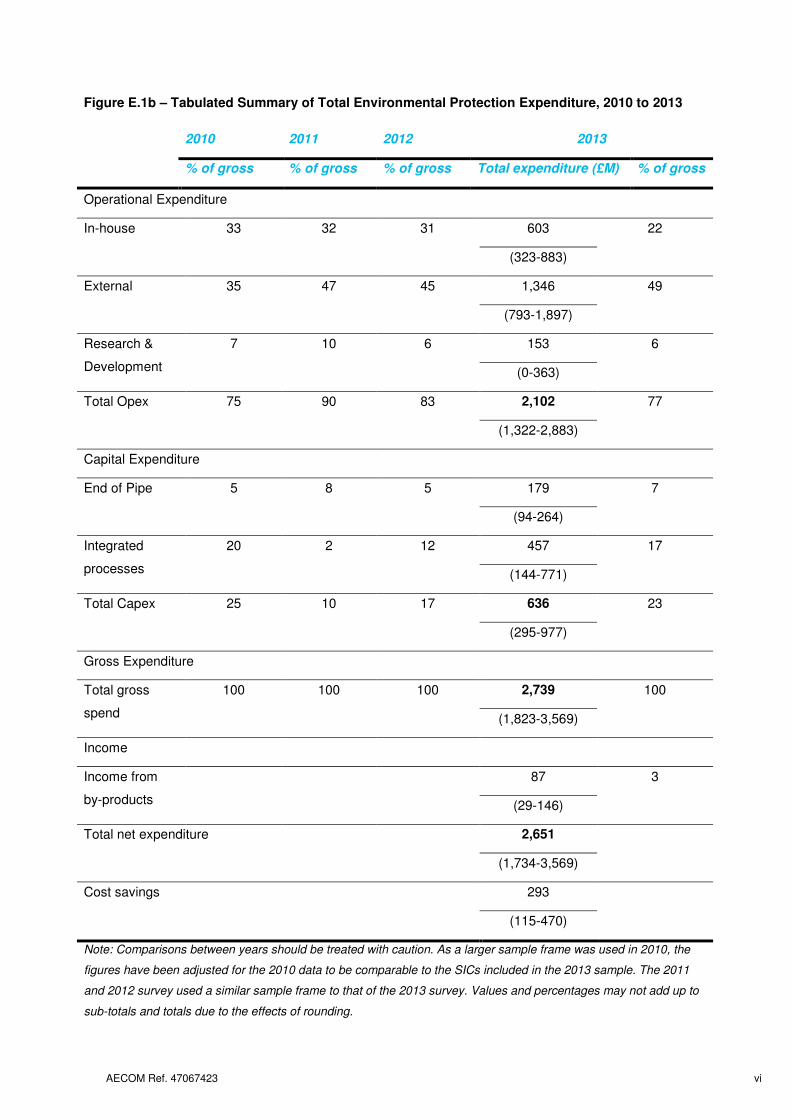
Figure E.1b – Tabulated Summary of Total Environmental Protection Expenditure, 2010 to 2013
2010 2011 2012 2013
% of gross % of gross % of gross Total expenditure (£M) % of gross
Operational Expenditure
In-house 33 32 31 603 22
(323-883)
External 35 47 45 1,346 49
(793-1,897)
Research &
Development
7 10 6 153 6
(0-363)
Total Opex 75 90 83 2,102 77
(1,322-2,883)
Capital Expenditure
End of Pipe 5 8 5 179 7
(94-264)
Integrated
processes
20 2 12 457 17
(144-771)
Total Capex 25 10 17 636 23
(295-977)
Gross Expenditure
Total gross
spend
100 100 100 2,739 100
(1,823-3,569)
Income
Income from
by-products
87 3
(29-146)
Total net expenditure 2,651
(1,734-3,569)
Cost savings 293
(115-470)
Note: Comparisons between years should be treated with caution. As a larger sample frame was used in 2010, the
figures have been adjusted for the 2010 data to be comparable to the SICs included in the 2013 sample. The 2011
and 2012 survey used a similar sample frame to that of the 2013 survey. Values and percentages may not add up to
sub-totals and totals due to the effects of rounding.
AECOM Ref. 47067423 vii
Comparisons between years should be treated with extreme caution due to variances in the sample
frame (size and sectors) across the survey years, as well as improvements made to the questionnaire
design and layout. In light of this, the following figures include a proportionate breakdown of total spend
by Opex and Capex reported in each year, as well as absolute figures. Also note that the figures
presented in this report are not adjusted for inflation but are presented as reported by responding
companies following the grossing up procedure (see Annex 6 for further information).
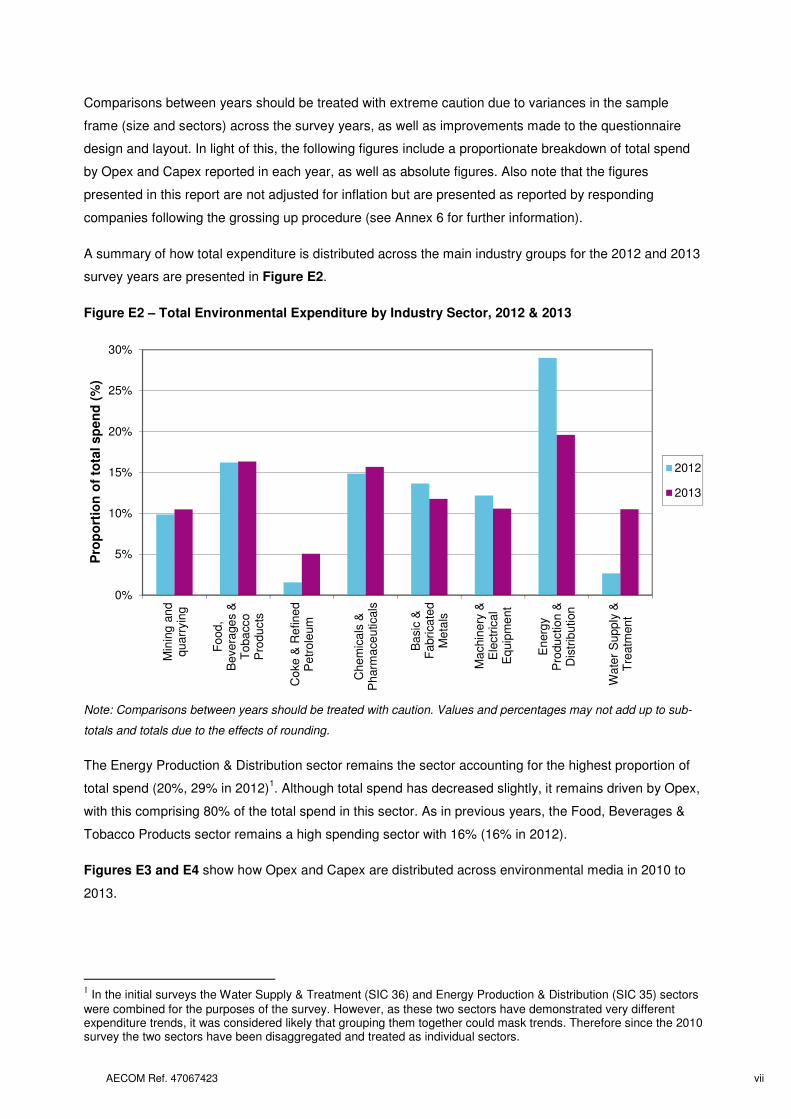
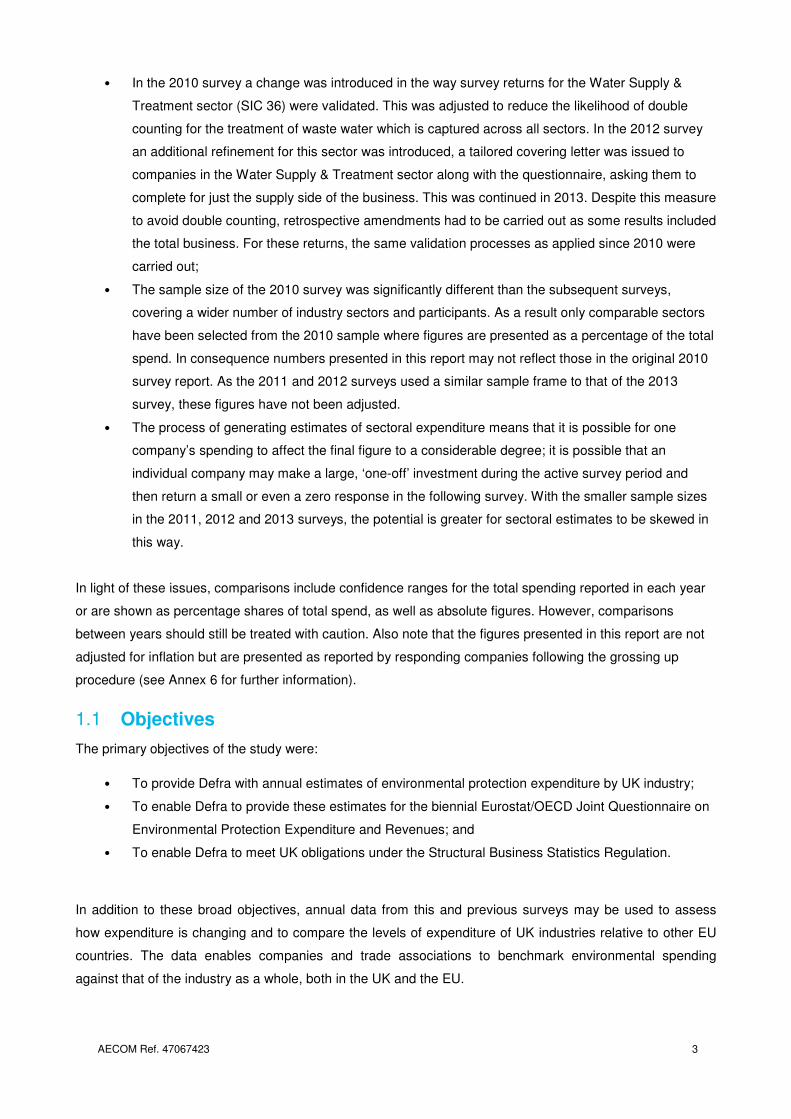
A summary of how total expenditure is distributed across the main industry groups for the 2012 and 2013
survey years are presented in Figure E2.
Figure E2 – Total Environmental Expenditure by Industry Sector, 2012 & 2013
Note: Comparisons between years should be treated with caution. Values and percentages may not add up to sub-
totals and totals due to the effects of rounding.
The Energy Production & Distribution sector remains the sector accounting for the highest proportion of
total spend (20%, 29% in 2012)1. Although total spend has decreased slightly, it remains driven by Opex,
with this comprising 80% of the total spend in this sector. As in previous years, the Food, Beverages &
Tobacco Products sector remains a high spending sector with 16% (16% in 2012).
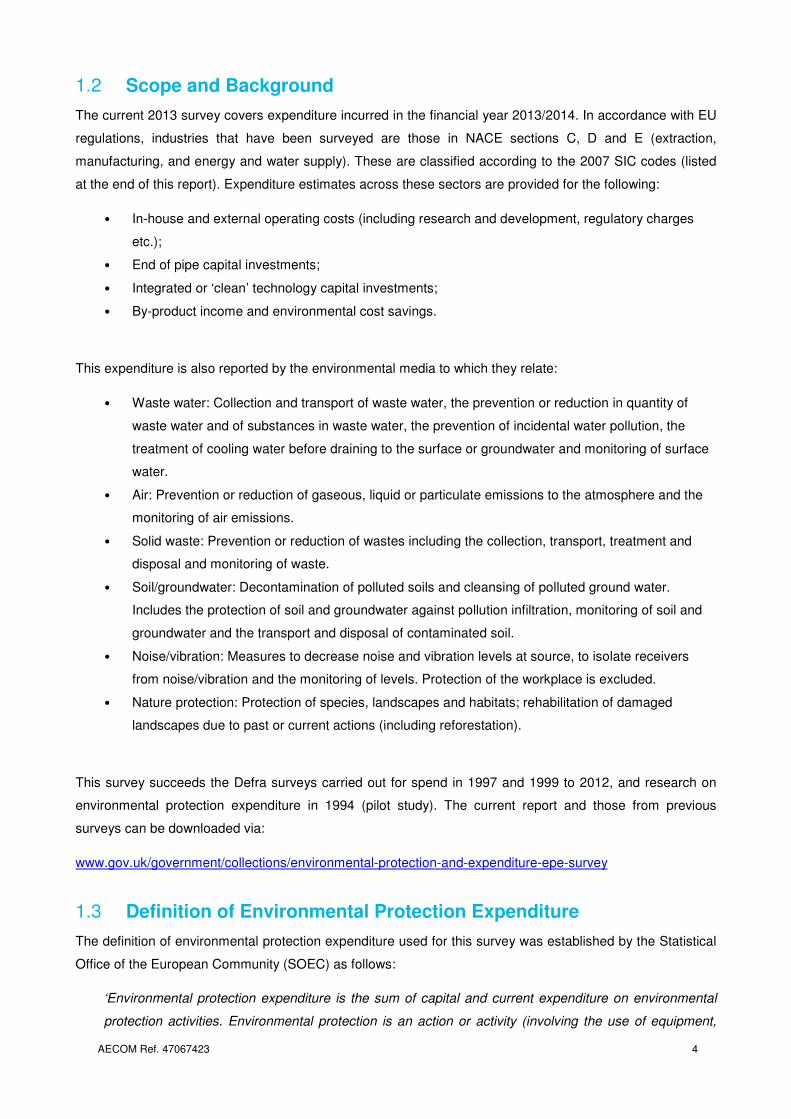
Figures E3 and E4 show how Opex and Capex are distributed across environmental media in 2010 to
2013.
1 In the initial surveys the Water Supply & Treatment (SIC 36) and Energy Production & Distribution (SIC 35) sectors
were combined for the purposes of the survey. However, as these two sectors have demonstrated very different expenditure trends, it was considered likely that grouping them together could mask trends. Therefore since the 2010 survey the two sectors have been disaggregated and treated as individual sectors.
0%
5%
10%
15%
20%
25%
30%
Min
ing
an
dq
ua
rryin
g
Fo
od
,B
eve
rage
s &
To
ba
cco
Pro
du
cts
Co
ke
& R
efin
ed
Pe
trole
um
Ch
em
ica
ls &
Ph
arm
ace
uticals
Ba
sic
&F
abri
ca
ted
Me
tals
Ma
chin
ery
&E
lectr
ica
lE
quip
me
nt
En
erg
yP
rodu
ctio
n &
Dis
trib
ution
Wa
ter
Su
pp
ly &
Tre
atm
en
t
Pro
po
rtio
n o
f to
tal sp
en
d (
%)
2012
2013
AECOM Ref. 47067423 viii
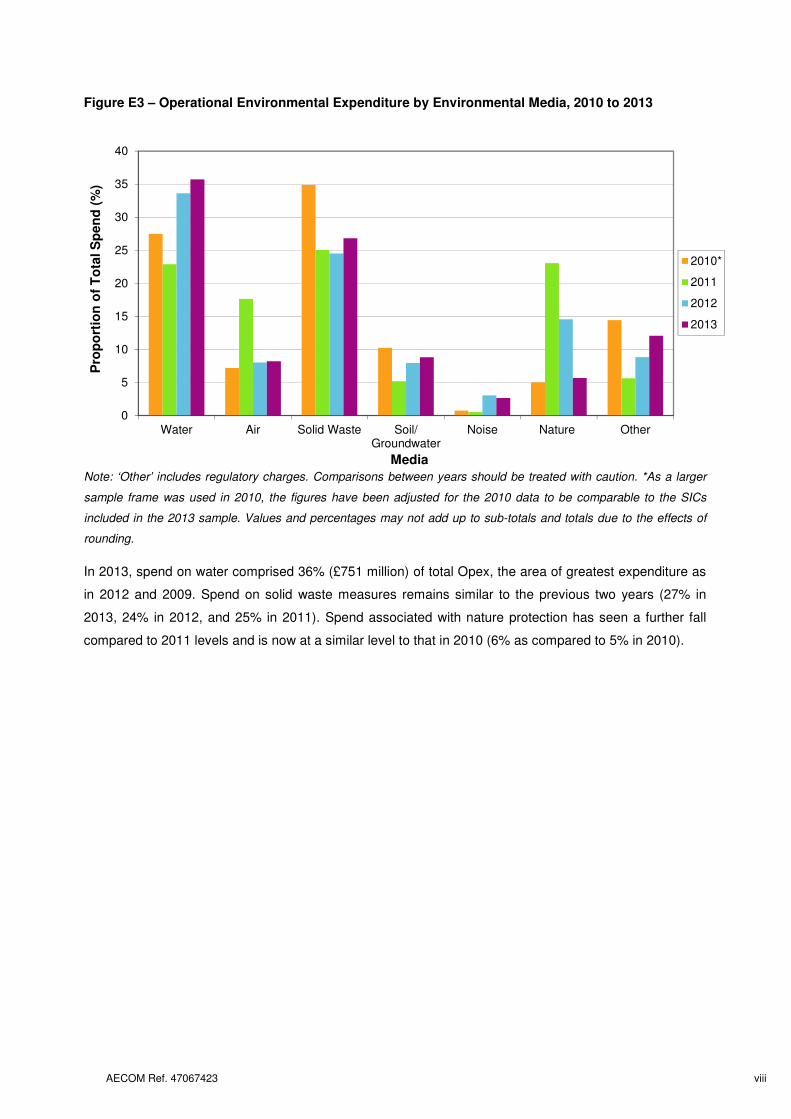
Figure E3 – Operational Environmental Expenditure by Environmental Media, 2010 to 2013
Note: ‘Other’ includes regulatory charges. Comparisons between years should be treated with caution. *As a larger
sample frame was used in 2010, the figures have been adjusted for the 2010 data to be comparable to the SICs
included in the 2013 sample. Values and percentages may not add up to sub-totals and totals due to the effects of
rounding.
In 2013, spend on water comprised 36% (£751 million) of total Opex, the area of greatest expenditure as
in 2012 and 2009. Spend on solid waste measures remains similar to the previous two years (27% in
2013, 24% in 2012, and 25% in 2011). Spend associated with nature protection has seen a further fall
compared to 2011 levels and is now at a similar level to that in 2010 (6% as compared to 5% in 2010).
0
5
10
15
20
25
30
35
40
Water Air Solid Waste Soil/Groundwater
Noise Nature Other
Pro
po
rtio
n o
f T
ota
l S
pen
d (
%)
Media
2010*
2011
2012
2013
AECOM Ref. 47067423 ix
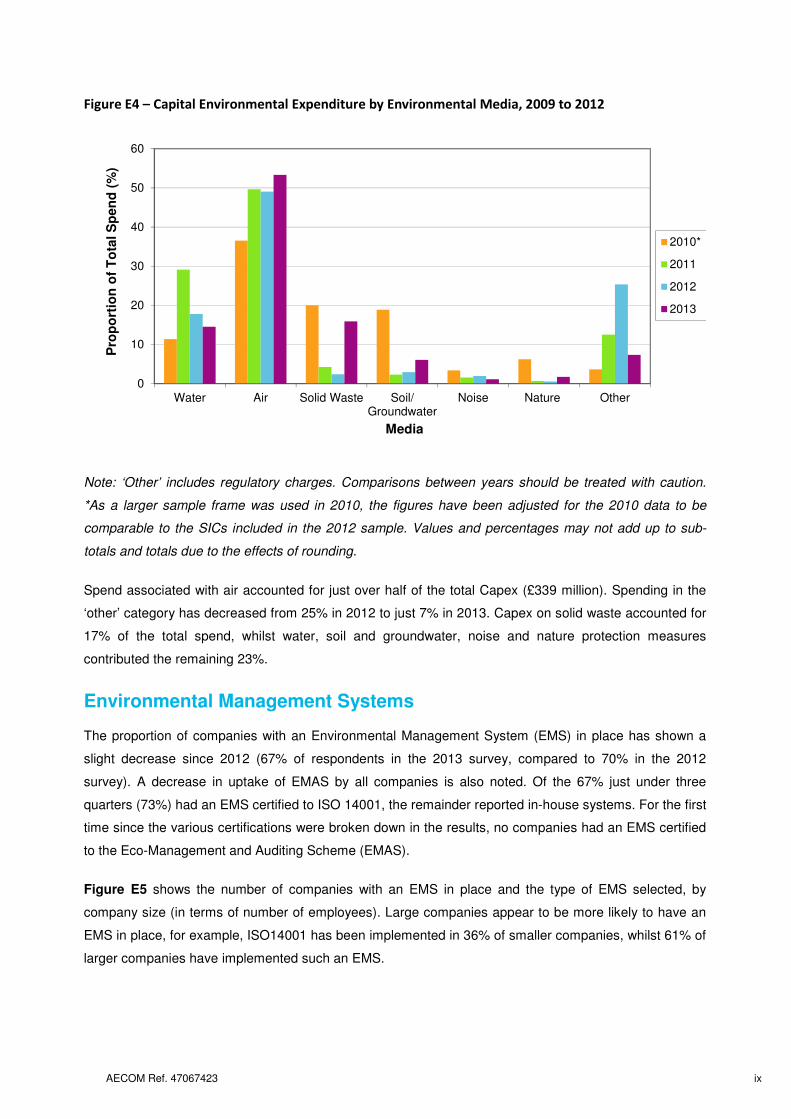
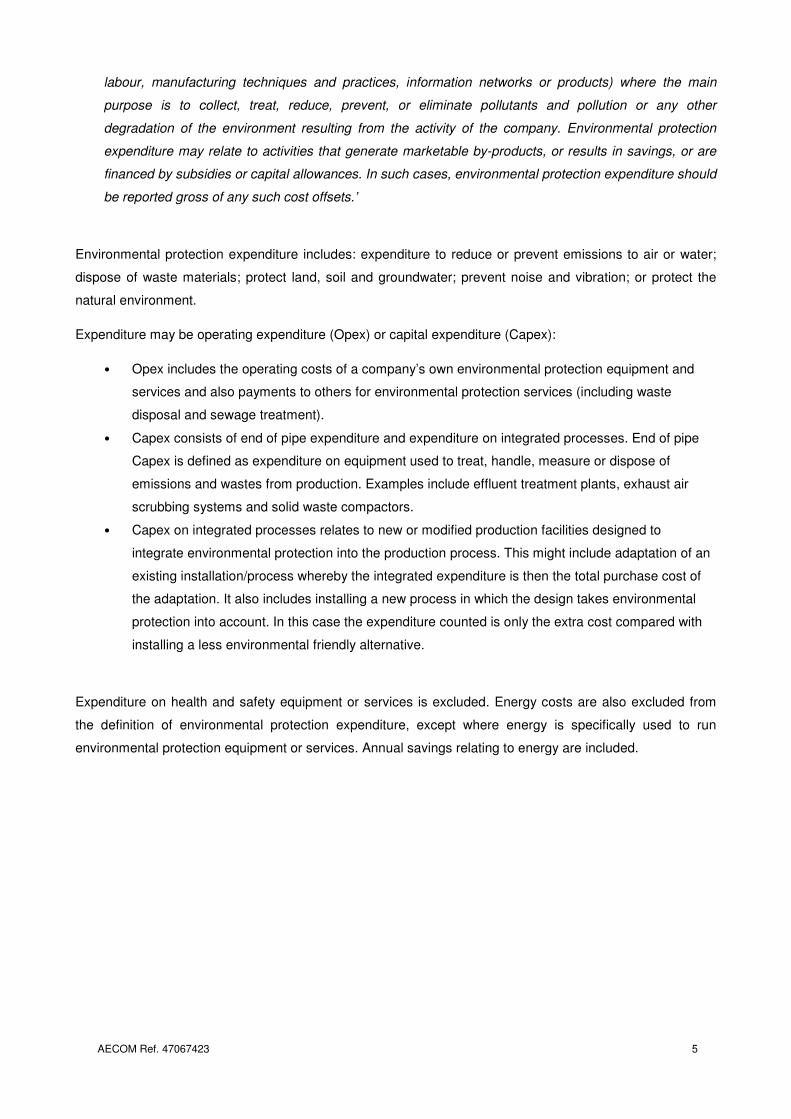
Figure E4 – Capital Environmental Expenditure by Environmental Media, 2009 to 2012
Note: ‘Other’ includes regulatory charges. Comparisons between years should be treated with caution.
*As a larger sample frame was used in 2010, the figures have been adjusted for the 2010 data to be
comparable to the SICs included in the 2012 sample. Values and percentages may not add up to sub-
totals and totals due to the effects of rounding.
Spend associated with air accounted for just over half of the total Capex (£339 million). Spending in the
‘other’ category has decreased from 25% in 2012 to just 7% in 2013. Capex on solid waste accounted for
17% of the total spend, whilst water, soil and groundwater, noise and nature protection measures
contributed the remaining 23%.
Environmental Management Systems
The proportion of companies with an Environmental Management System (EMS) in place has shown a
slight decrease since 2012 (67% of respondents in the 2013 survey, compared to 70% in the 2012
survey). A decrease in uptake of EMAS by all companies is also noted. Of the 67% just under three
quarters (73%) had an EMS certified to ISO 14001, the remainder reported in-house systems. For the first
time since the various certifications were broken down in the results, no companies had an EMS certified
to the Eco-Management and Auditing Scheme (EMAS).
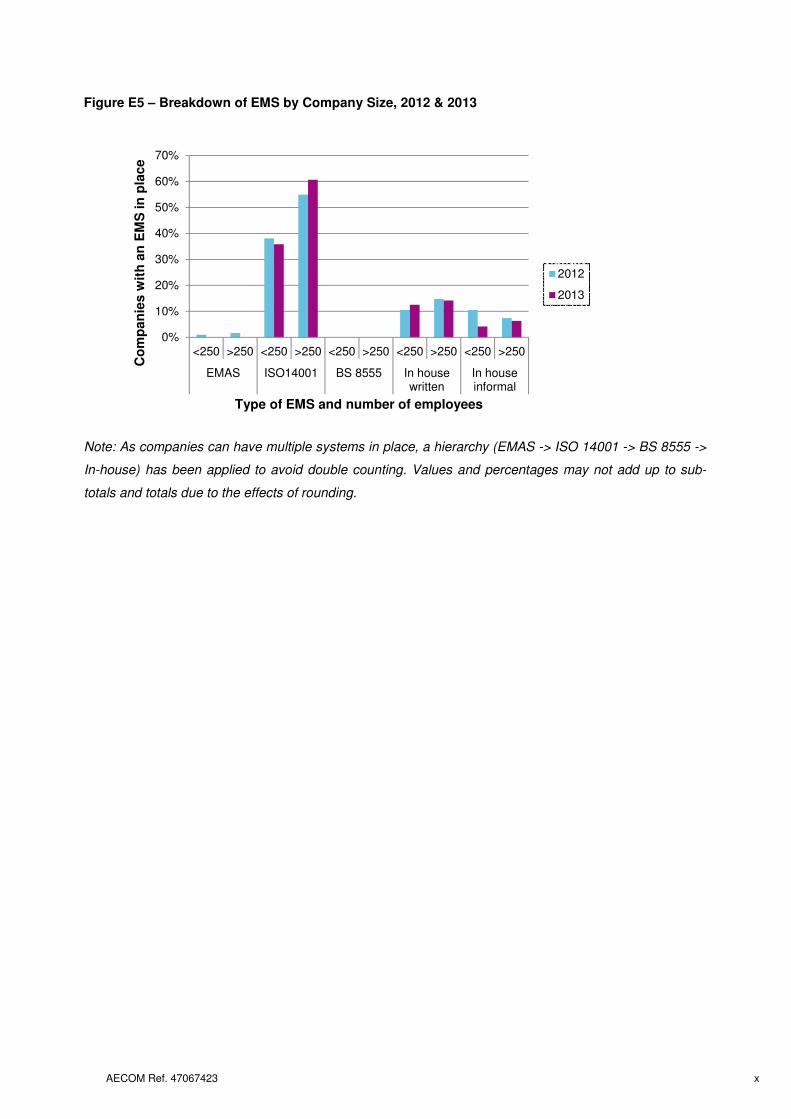
Figure E5 shows the number of companies with an EMS in place and the type of EMS selected, by
company size (in terms of number of employees). Large companies appear to be more likely to have an
EMS in place, for example, ISO14001 has been implemented in 36% of smaller companies, whilst 61% of
larger companies have implemented such an EMS.
0
10
20
30
40
50
60
Water Air Solid Waste Soil/Groundwater
Noise Nature Other
Pro
po
rtio
n o
f T
ota
l S
pen
d (
%)
Media
2010*
2011
2012
2013
AECOM Ref. 47067423 x
Figure E5 – Breakdown of EMS by Company Size, 2012 & 2013
Note: As companies can have multiple systems in place, a hierarchy (EMAS -> ISO 14001 -> BS 8555 ->
In-house) has been applied to avoid double counting. Values and percentages may not add up to sub-
totals and totals due to the effects of rounding.
0%
10%
20%
30%
40%
50%
60%
70%
<250 >250 <250 >250 <250 >250 <250 >250 <250 >250
EMAS ISO14001 BS 8555 In housewritten
In houseinformal
Co
mp
an
ies w
ith
an
EM
S in
pla
ce
Type of EMS and number of employees
2012
2013
AECOM Ref. 47067423 xi
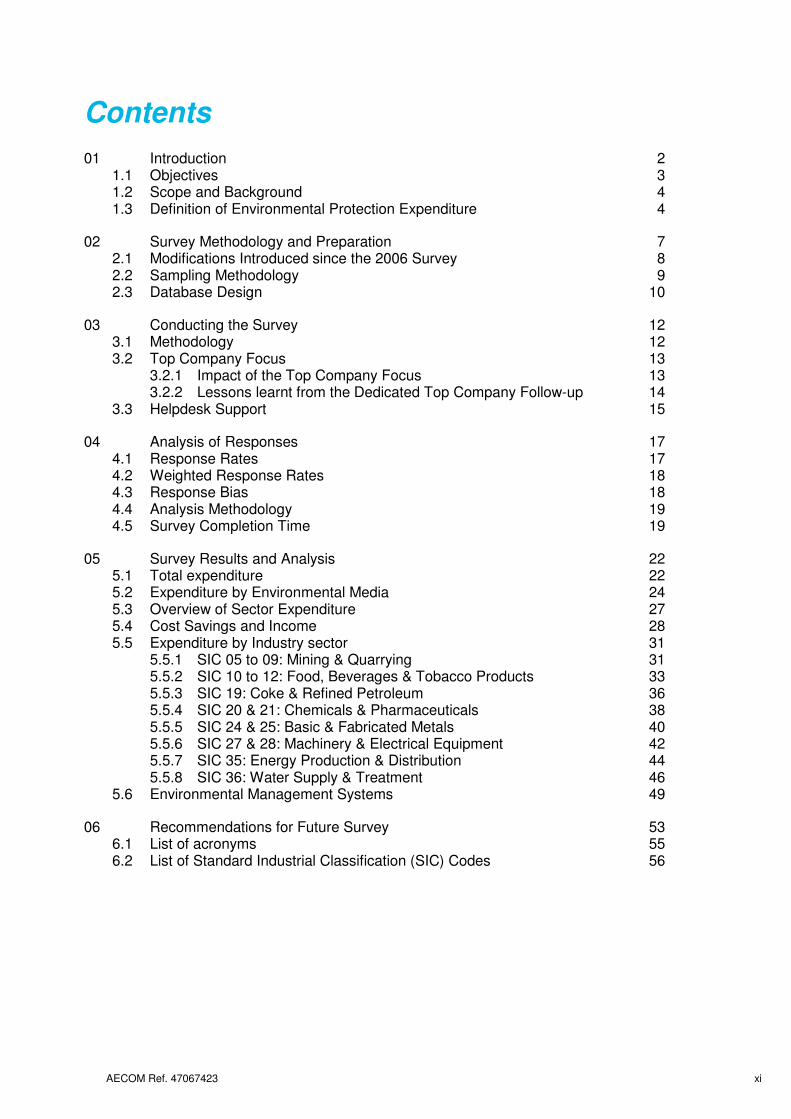
Contents
01 Introduction 2 Objectives 3 1.1 Scope and Background 4 1.2 Definition of Environmental Protection Expenditure 4 1.3
02 Survey Methodology and Preparation 7 Modifications Introduced since the 2006 Survey 8 2.1 Sampling Methodology 9 2.2 Database Design 10 2.3
03 Conducting the Survey 12 Methodology 12 3.1 Top Company Focus 13 3.2
3.2.1 Impact of the Top Company Focus 13 3.2.2 Lessons learnt from the Dedicated Top Company Follow-up 14
Helpdesk Support 15 3.3
04 Analysis of Responses 17 Response Rates 17 4.1 Weighted Response Rates 18 4.2 Response Bias 18 4.3 Analysis Methodology 19 4.4 Survey Completion Time 19 4.5
05 Survey Results and Analysis 22 Total expenditure 22 5.1 Expenditure by Environmental Media 24 5.2 Overview of Sector Expenditure 27 5.3 Cost Savings and Income 28 5.4 Expenditure by Industry sector 31 5.5
5.5.1 SIC 05 to 09: Mining & Quarrying 31 5.5.2 SIC 10 to 12: Food, Beverages & Tobacco Products 33 5.5.3 SIC 19: Coke & Refined Petroleum 36 5.5.4 SIC 20 & 21: Chemicals & Pharmaceuticals 38 5.5.5 SIC 24 & 25: Basic & Fabricated Metals 40 5.5.6 SIC 27 & 28: Machinery & Electrical Equipment 42 5.5.7 SIC 35: Energy Production & Distribution 44 5.5.8 SIC 36: Water Supply & Treatment 46
Environmental Management Systems 49 5.6
06 Recommendations for Future Survey 53 List of acronyms 55 6.1 List of Standard Industrial Classification (SIC) Codes 56 6.2
AECOM Ref. 47067423 1
01
Introduction
AECOM Ref. 47067423 2
Introduction 01
This report relates to the seventeenth annual study commissioned by the Department for Environment, Food
and Rural Affairs (Defra) and undertaken by AECOM Infrastructure & Environment UK Ltd (AECOM), to
estimate the annual expenditure by UK industry on environmental protection.
This report presents results from the analysis of the 2013 survey data returned by participating UK
companies. Previous surveys were carried out to estimate expenditure in 1994 (a pilot survey), 1997, and
1999 to 2012. Throughout this report, surveys are referred to by the year for which the expenditure data was
collected rather than the date of publication (normally two years in arrears of actual spend).
This report consists of the following sections:
Section 1 Introduction
Section 2 Survey Methodology and Preparation
Section 3 Conducting the Survey
Section 4 Analysis of Responses
Section 5 Survey Results and Analysis
Section 6 Recommendations for Future Surveys
This main report is supplemented by detailed annexes, which are presented as separate documents:
Annex 1 Technical Guidance Note and Cover Letters
Annex 2 Validation of Responses
Annex 3 Response Codes for Sorting Correspondence
Annex 4 Drivers Behind Participation
Annex 5 Output of Data Analysis
Annex 6 Grossing-up Procedure
Annex 7 Method for Derivation of Standard Error and Confidence Intervals
This report and Annexes can be downloaded via:
www.gov.uk/government/collections/environmental-protection-and-expenditure-epe-survey
The 2013 survey was distributed to a total of 1,166 companies across the Mining & Quarrying,
Manufacturing, Energy Production and Water sectors, as defined by the UK Standard Industry Classifications
for Business (SIC) in 2007. This survey comprised a similar sample size to the 2012 survey, rather than the
larger sample used in 2010. Decreasing the sample size between periodic larger surveys was introduced
following the 2006 survey as part of the approach to increase efficiency and to reduce ‘survey fatigue’.
Across the last few years increased survey participation has been observed.
To provide some context and to allow broad trends to be established, grossed figures from the previous
three surveys (2010-2012) are presented with those from the 2013 survey. Sector specific figures are also
presented alongside those from the 2010-2012 surveys. However, direct comparisons between survey years
should be treated with extreme caution for the following reasons:
AECOM Ref. 47067423 3
• In the 2010 survey a change was introduced in the way survey returns for the Water Supply &
Treatment sector (SIC 36) were validated. This was adjusted to reduce the likelihood of double
counting for the treatment of waste water which is captured across all sectors. In the 2012 survey
an additional refinement for this sector was introduced, a tailored covering letter was issued to
companies in the Water Supply & Treatment sector along with the questionnaire, asking them to
complete for just the supply side of the business. This was continued in 2013. Despite this measure
to avoid double counting, retrospective amendments had to be carried out as some results included
the total business. For these returns, the same validation processes as applied since 2010 were
carried out;
• The sample size of the 2010 survey was significantly different than the subsequent surveys,
covering a wider number of industry sectors and participants. As a result only comparable sectors
have been selected from the 2010 sample where figures are presented as a percentage of the total
spend. In consequence numbers presented in this report may not reflect those in the original 2010
survey report. As the 2011 and 2012 surveys used a similar sample frame to that of the 2013
survey, these figures have not been adjusted.
• The process of generating estimates of sectoral expenditure means that it is possible for one
company’s spending to affect the final figure to a considerable degree; it is possible that an
individual company may make a large, ‘one-off’ investment during the active survey period and
then return a small or even a zero response in the following survey. With the smaller sample sizes
in the 2011, 2012 and 2013 surveys, the potential is greater for sectoral estimates to be skewed in
this way.
In light of these issues, comparisons include confidence ranges for the total spending reported in each year
or are shown as percentage shares of total spend, as well as absolute figures. However, comparisons
between years should still be treated with caution. Also note that the figures presented in this report are not
adjusted for inflation but are presented as reported by responding companies following the grossing up
procedure (see Annex 6 for further information).
Objectives 1.1
The primary objectives of the study were:
• To provide Defra with annual estimates of environmental protection expenditure by UK industry;
• To enable Defra to provide these estimates for the biennial Eurostat/OECD Joint Questionnaire on
Environmental Protection Expenditure and Revenues; and
• To enable Defra to meet UK obligations under the Structural Business Statistics Regulation.
In addition to these broad objectives, annual data from this and previous surveys may be used to assess
how expenditure is changing and to compare the levels of expenditure of UK industries relative to other EU
countries. The data enables companies and trade associations to benchmark environmental spending
against that of the industry as a whole, both in the UK and the EU.
AECOM Ref. 47067423 4
Scope and Background 1.2
The current 2013 survey covers expenditure incurred in the financial year 2013/2014. In accordance with EU
regulations, industries that have been surveyed are those in NACE sections C, D and E (extraction,
manufacturing, and energy and water supply). These are classified according to the 2007 SIC codes (listed
at the end of this report). Expenditure estimates across these sectors are provided for the following:
• In-house and external operating costs (including research and development, regulatory charges
etc.);
• End of pipe capital investments;
• Integrated or ‘clean’ technology capital investments;
• By-product income and environmental cost savings.
This expenditure is also reported by the environmental media to which they relate:
• Waste water: Collection and transport of waste water, the prevention or reduction in quantity of
waste water and of substances in waste water, the prevention of incidental water pollution, the
treatment of cooling water before draining to the surface or groundwater and monitoring of surface
water.
• Air: Prevention or reduction of gaseous, liquid or particulate emissions to the atmosphere and the
monitoring of air emissions.
• Solid waste: Prevention or reduction of wastes including the collection, transport, treatment and
disposal and monitoring of waste.
• Soil/groundwater: Decontamination of polluted soils and cleansing of polluted ground water.
Includes the protection of soil and groundwater against pollution infiltration, monitoring of soil and
groundwater and the transport and disposal of contaminated soil.
• Noise/vibration: Measures to decrease noise and vibration levels at source, to isolate receivers
from noise/vibration and the monitoring of levels. Protection of the workplace is excluded.
• Nature protection: Protection of species, landscapes and habitats; rehabilitation of damaged
landscapes due to past or current actions (including reforestation).
This survey succeeds the Defra surveys carried out for spend in 1997 and 1999 to 2012, and research on
environmental protection expenditure in 1994 (pilot study). The current report and those from previous
surveys can be downloaded via:
www.gov.uk/government/collections/environmental-protection-and-expenditure-epe-survey
Definition of Environmental Protection Expenditure 1.3
The definition of environmental protection expenditure used for this survey was established by the Statistical
Office of the European Community (SOEC) as follows:
‘Environmental protection expenditure is the sum of capital and current expenditure on environmental
protection activities. Environmental protection is an action or activity (involving the use of equipment,
AECOM Ref. 47067423 5
labour, manufacturing techniques and practices, information networks or products) where the main
purpose is to collect, treat, reduce, prevent, or eliminate pollutants and pollution or any other
degradation of the environment resulting from the activity of the company. Environmental protection
expenditure may relate to activities that generate marketable by-products, or results in savings, or are
financed by subsidies or capital allowances. In such cases, environmental protection expenditure should
be reported gross of any such cost offsets.’
Environmental protection expenditure includes: expenditure to reduce or prevent emissions to air or water;
dispose of waste materials; protect land, soil and groundwater; prevent noise and vibration; or protect the
natural environment.
Expenditure may be operating expenditure (Opex) or capital expenditure (Capex):
• Opex includes the operating costs of a company’s own environmental protection equipment and
services and also payments to others for environmental protection services (including waste
disposal and sewage treatment).
• Capex consists of end of pipe expenditure and expenditure on integrated processes. End of pipe
Capex is defined as expenditure on equipment used to treat, handle, measure or dispose of
emissions and wastes from production. Examples include effluent treatment plants, exhaust air
scrubbing systems and solid waste compactors.
• Capex on integrated processes relates to new or modified production facilities designed to
integrate environmental protection into the production process. This might include adaptation of an
existing installation/process whereby the integrated expenditure is then the total purchase cost of
the adaptation. It also includes installing a new process in which the design takes environmental
protection into account. In this case the expenditure counted is only the extra cost compared with
installing a less environmental friendly alternative.
Expenditure on health and safety equipment or services is excluded. Energy costs are also excluded from
the definition of environmental protection expenditure, except where energy is specifically used to run
environmental protection equipment or services. Annual savings relating to energy are included.
AECOM Ref. 47067423 6
02
Survey Methodology
and Preparation
AECOM Ref. 47067423 7
Survey Methodology and Preparation 02
As in previous years, the 2013 survey consisted of three phases, sub-divided into the following individual
tasks/activities:
Pre-survey phase (April 2014 – May 2014):
• Review of the 2012 survey and introduction of modifications
• Promotion of 2012 survey results
• Steering Group meeting participation
• Request submitted for company data from the UK Government’s Inter Departmental Business
Register (IDBR)
Survey phase (June 2014 – January 2015):
• Selection of sample from the IDBR and subsequent database work
• Review and submission of mail out materials to Defra
• Amendments and approval of mail out materials as required
• Coordination of printing and preparation of mail out materials
• E-mail notice of the 2013 survey dispatch to previous respondents
• Dispatch of survey pack to companies
• Provision of Helpdesk support
• Data entry of survey returns
• Resending of surveys as required
• Dispatch of reminder letter
• Follow-up phone calls with Top Companies
Analysis and Final Reporting (November 2014 – May 2015):
• Creation/updating of validation process
• Continuous validation (statistically and via participant consultation)
• Grossing/aggregation of results
• Estimation of non-response bias
• Supply of survey database to Defra
• Analysis of survey data
• Final reporting and feedback
As in previous years, progress of the survey has been guided by a Steering Group, chaired by a professional
statistician from Defra and comprising representatives from Defra and the Office for National Statistics
(ONS).
Certain activities outlined above are described in more detail in the following sections. These include
preparation of sampling methodology, and updates to the database design.
AECOM Ref. 47067423 8
Modifications Introduced since the 2006 Survey 2.1
Several modifications have been made to the survey process and questionnaire in the years subsequent to
the 2006 survey, to improve both awareness of the survey aims and benefits, the clarity of survey definitions,
to encourage participation and increase the survey response rate. These modifications include, for example,
the following activities:
• Linked to the continuation of reducing respondent burden, micro-sized companies (with 1 to 9
employees) were again excluded from the 2013 survey. Similar to previous years, companies
received a covering letter tailored to the company type (‘standard’ companies versus ‘top’
companies). The definitions of these company groups are explained in full in section 3.2 and the
cover letters can be seen in Annex 1.
• The approach taken for water companies was similar to the previous two years of the survey in that
double counting of sewage treatment was avoided through including only environmental protection
costs associated with the supply side of the business. The same approach was used as in 2012 for
the 2013 survey, issuing a cover letter tailored for this purpose, rather than corrections being made
retrospectively through the validation process.
• Helpdesk staff were trained to encourage companies to fill in specific/minimum questions in cases
where individuals felt the survey was not relevant to their business. This approach was carried over
from the previous surveys, as it proved useful in persuading companies to respond when they
contacted the Helpdesk.
• Prior to the launch of the 2012 and 2013 survey questionnaire, an e-mail was sent out to all
companies that responded to the previous survey which were also included in the current sample.
The e-mail invited each company to participate in the survey and also provided the key results from
the previous survey. This enabled the company to prepare for the survey and provide the Helpdesk
with the most appropriate contact details.
• Survey returns were accepted several weeks after the initial deadline which, amongst other
reasons, allowed enough time for the questionnaire to reach the most appropriate person within the
company.
• Calling each Top Company (see section 2.2 for definition) up to five times significantly increased
survey returns by allowing the most appropriate person to be identified and then contacted.
• A combination of reminder letter, reminder postcard and follow-up calls were utilised to elicit
responses as in the 2009 and 2010 surveys. The use of a reminder postcard was dropped in
subsequent surveys and resources used instead to make further follow-up calls.
• In 2012 a new question was inserted on addressing environmental issues in the supply chain. This
was retained in 2013.
• In 2012 a wider array of responses was included for question 4.2 on EMS, to include ‘BS 8555’ and
both ‘in-house written EMS’ and ‘in-house informal EMS’. Again, this has been retained in 2013.
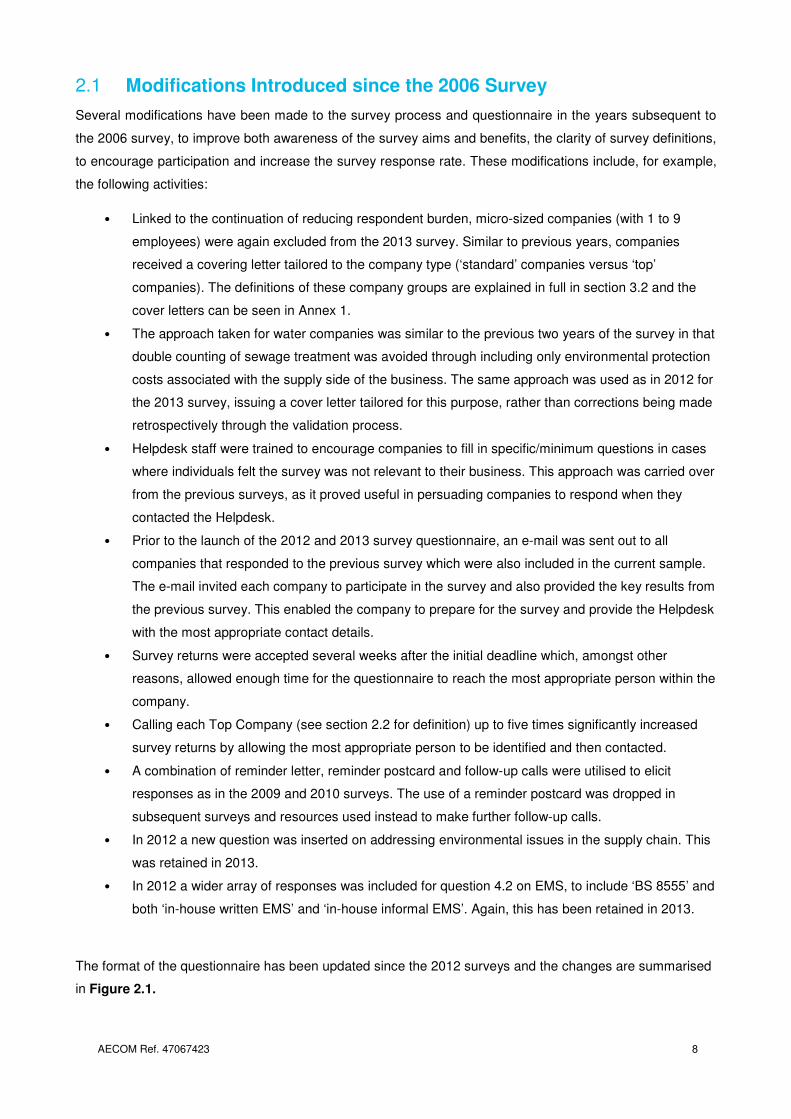
The format of the questionnaire has been updated since the 2012 surveys and the changes are summarised
in Figure 2.1.
AECOM Ref. 47067423 9
Figure 2.1 - Summary of Questionnaire Modifications since the 2010 survey
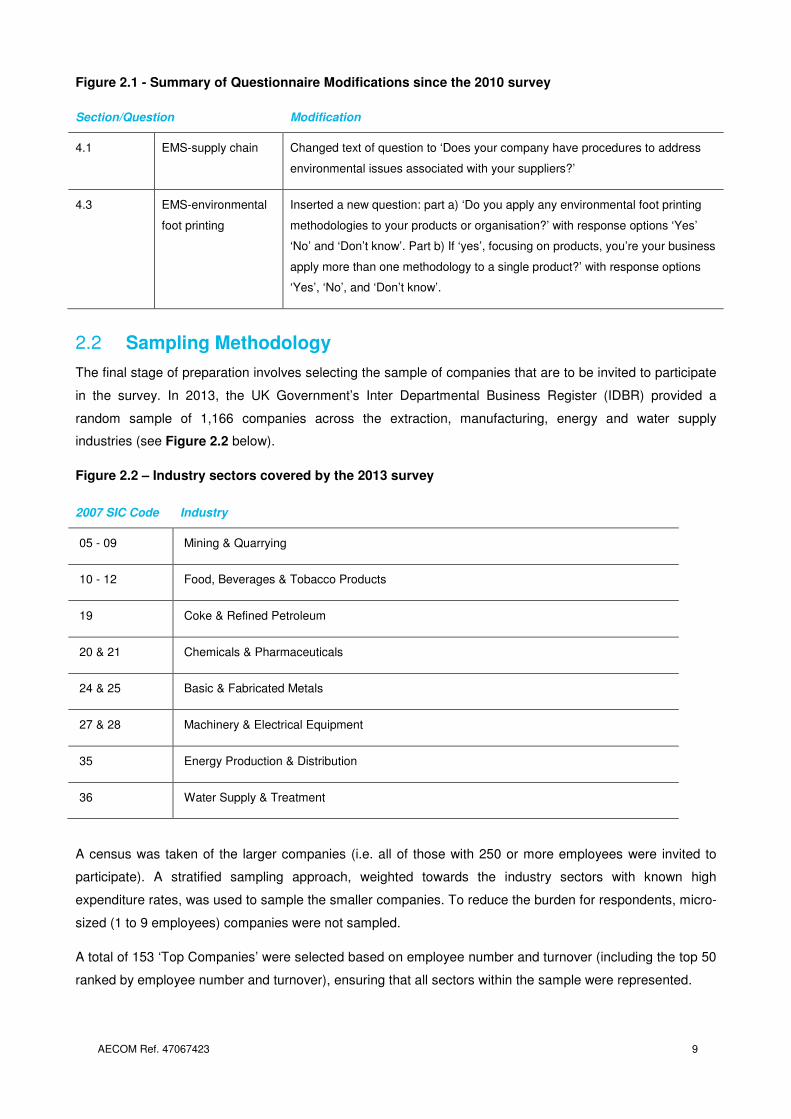
Sampling Methodology 2.2
The final stage of preparation involves selecting the sample of companies that are to be invited to participate
in the survey. In 2013, the UK Government’s Inter Departmental Business Register (IDBR) provided a
random sample of 1,166 companies across the extraction, manufacturing, energy and water supply
industries (see Figure 2.2 below).
Figure 2.2 – Industry sectors covered by the 2013 survey
A census was taken of the larger companies (i.e. all of those with 250 or more employees were invited to
participate). A stratified sampling approach, weighted towards the industry sectors with known high
expenditure rates, was used to sample the smaller companies. To reduce the burden for respondents, micro-
sized (1 to 9 employees) companies were not sampled.
A total of 153 ‘Top Companies’ were selected based on employee number and turnover (including the top 50
ranked by employee number and turnover), ensuring that all sectors within the sample were represented.
Section/Question Modification
4.1 EMS-supply chain Changed text of question to ‘Does your company have procedures to address
environmental issues associated with your suppliers?’
4.3 EMS-environmental
foot printing
Inserted a new question: part a) ‘Do you apply any environmental foot printing
methodologies to your products or organisation?’ with response options ‘Yes’
‘No’ and ‘Don’t know’. Part b) If ‘yes’, focusing on products, you’re your business
apply more than one methodology to a single product?’ with response options
‘Yes’, ‘No’, and ‘Don’t know’.
2007 SIC Code Industry
05 - 09 Mining & Quarrying
10 - 12 Food, Beverages & Tobacco Products
19 Coke & Refined Petroleum
20 & 21 Chemicals & Pharmaceuticals
24 & 25 Basic & Fabricated Metals
27 & 28 Machinery & Electrical Equipment
35 Energy Production & Distribution
36 Water Supply & Treatment
AECOM Ref. 47067423 10
In the initial years where a smaller sample size was applied (e.g. 2008, 2009), the Water Supply & Treatment
(SIC 36) and Energy Production & Distribution (SIC 35) sectors were combined for the purposes of the
survey. However, as these two sectors have demonstrated very different expenditure trends, it was
considered likely that grouping them together could mask trends. Therefore since the 2010 survey the two
sectors have been disaggregated and treated as individual sectors.
Database Design 2.3
A database was specifically designed and built using Microsoft Access to store information from the surveys
and intended for use by AECOM personnel to:
• Gather information from postal questionnaires and other correspondence;
• Carry out continuous validation checks of the data entry process; and
• Conduct statistical analysis of each year’s data.
The 2012 survey database was updated for use during the 2013 survey through inputting the sample data
from the IDBR and making limited, minor updates to the user form to reflect the changes summarised in
Figure 2.1.
As described in Annex 2, certain validation checks are incorporated into the database, which has a number
of advantages:
• Checks can be run more frequently and consistently;
• Validation tests take account of the data types and conversions;
• There is no delay between the data entry and the return of the validation checks, as the whole
process is undertaken within the same programme;
• Companies could be contacted promptly after returning their completed questionnaires with any
queries; and
• Results of validation calls or changes are input into the database.
After the validation tests were run, the results were stored for manual validation. The records within the
database did not change until the validation tests were run again.
AECOM Ref. 47067423 11
03
Conducting the Survey
AECOM Ref. 47067423 12
Conducting the Survey 03
Methodology 3.1
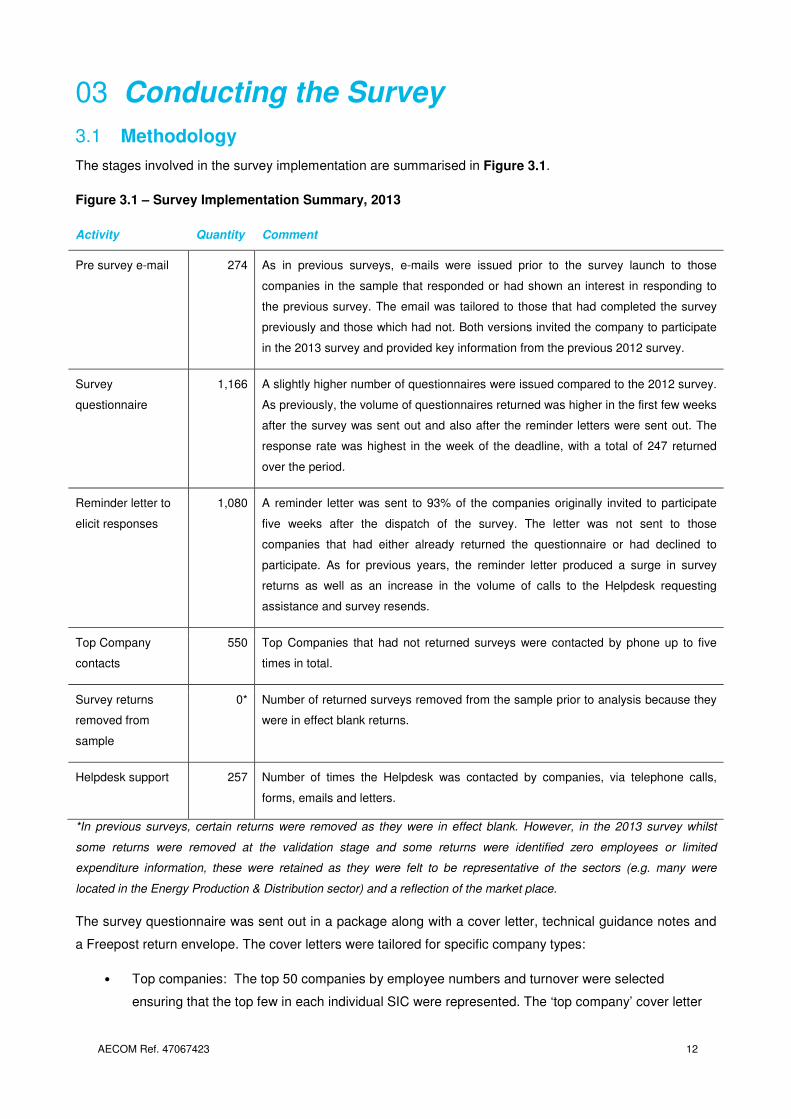
The stages involved in the survey implementation are summarised in Figure 3.1.
Figure 3.1 – Survey Implementation Summary, 2013
*In previous surveys, certain returns were removed as they were in effect blank. However, in the 2013 survey whilst
some returns were removed at the validation stage and some returns were identified zero employees or limited
expenditure information, these were retained as they were felt to be representative of the sectors (e.g. many were
located in the Energy Production & Distribution sector) and a reflection of the market place.
The survey questionnaire was sent out in a package along with a cover letter, technical guidance notes and
a Freepost return envelope. The cover letters were tailored for specific company types:
• Top companies: The top 50 companies by employee numbers and turnover were selected
ensuring that the top few in each individual SIC were represented. The ‘top company’ cover letter
Activity Quantity Comment
Pre survey e-mail 274 As in previous surveys, e-mails were issued prior to the survey launch to those
companies in the sample that responded or had shown an interest in responding to
the previous survey. The email was tailored to those that had completed the survey
previously and those which had not. Both versions invited the company to participate
in the 2013 survey and provided key information from the previous 2012 survey.
Survey
questionnaire
1,166 A slightly higher number of questionnaires were issued compared to the 2012 survey.
As previously, the volume of questionnaires returned was higher in the first few weeks
after the survey was sent out and also after the reminder letters were sent out. The
response rate was highest in the week of the deadline, with a total of 247 returned
over the period.
Reminder letter to
elicit responses
1,080 A reminder letter was sent to 93% of the companies originally invited to participate
five weeks after the dispatch of the survey. The letter was not sent to those
companies that had either already returned the questionnaire or had declined to
participate. As for previous years, the reminder letter produced a surge in survey
returns as well as an increase in the volume of calls to the Helpdesk requesting
assistance and survey resends.
Top Company
contacts
550 Top Companies that had not returned surveys were contacted by phone up to five
times in total.
Survey returns
removed from
sample
0*
Number of returned surveys removed from the sample prior to analysis because they
were in effect blank returns.
Helpdesk support 257 Number of times the Helpdesk was contacted by companies, via telephone calls,
forms, emails and letters.
AECOM Ref. 47067423 13
emphasised potential benefits of participation, including the potential use of survey information for
benchmarking purposes.
• Standard companies: The remaining companies not encompassed by the ‘top’ company criteria.
The ‘standard’ cover letter emphasised the benefits of participation even if the companies’
environmental protection expenditure was very low.
• Water companies: A tailored cover letter was issued asking them to complete for the supply side
only to avoid double counting of costs associated with sewage treatment. This was issued
irrespective of whether the company was a ‘top’ or ‘standard’ company.
Copies of the 2013 survey questionnaire, cover letters and technical guidance notes are provided in Annex
1.
Top Company Focus 3.2
Owing to its success in increasing participation levels, dedicated Top Company follow-up (repeat
calls/reminder emails) has been continued for all post-1999 surveys. The following advantages have been
consistently identified:
• The telephone calls enable the survey team to build on their existing contact lists, and help
minimise future issues normally experienced in identifying and contacting the right person within
the different organisations;
• The calls offer the opportunity to increase the profile of the survey, encourage companies to
allocate time/resources to complete the survey, and to offer assistance in doing so where possible;
• Follow-up telephone conversations are helpful in data validation and quality control processes and
also provide an insight into the way companies interpreted the questions and presented their data
as responses; and
• Feedback received from companies is an integral part of the questionnaire design for the following
year.
3.2.1 Impact of the Top Company Focus
The end result of Top Company calls are summarised below in Figure 3.2. An analysis of reminder calls for
Top Companies is also provided. Specific codes used for recording the correspondence received by the
Helpdesk are presented in Annex 3.
AECOM Ref. 47067423 14
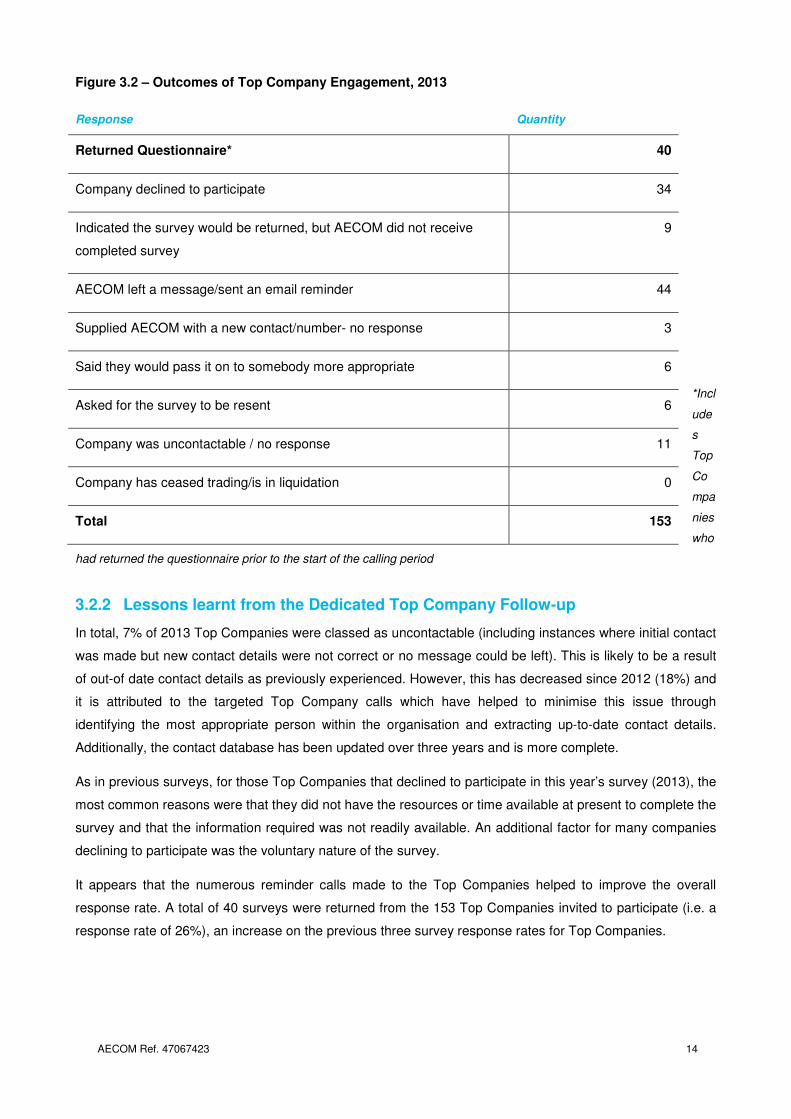
Figure 3.2 – Outcomes of Top Company Engagement, 2013
*Incl
ude
s
Top
Co
mpa
nies
who
had returned the questionnaire prior to the start of the calling period
3.2.2 Lessons learnt from the Dedicated Top Company Follow-up
In total, 7% of 2013 Top Companies were classed as uncontactable (including instances where initial contact
was made but new contact details were not correct or no message could be left). This is likely to be a result
of out-of date contact details as previously experienced. However, this has decreased since 2012 (18%) and
it is attributed to the targeted Top Company calls which have helped to minimise this issue through
identifying the most appropriate person within the organisation and extracting up-to-date contact details.
Additionally, the contact database has been updated over three years and is more complete.
As in previous surveys, for those Top Companies that declined to participate in this year’s survey (2013), the
most common reasons were that they did not have the resources or time available at present to complete the
survey and that the information required was not readily available. An additional factor for many companies
declining to participate was the voluntary nature of the survey.
It appears that the numerous reminder calls made to the Top Companies helped to improve the overall
response rate. A total of 40 surveys were returned from the 153 Top Companies invited to participate (i.e. a
response rate of 26%), an increase on the previous three survey response rates for Top Companies.
Response Quantity
Returned Questionnaire* 40
Company declined to participate 34
Indicated the survey would be returned, but AECOM did not receive
completed survey
9
AECOM left a message/sent an email reminder 44
Supplied AECOM with a new contact/number- no response 3
Said they would pass it on to somebody more appropriate 6
Asked for the survey to be resent 6
Company was uncontactable / no response 11
Company has ceased trading/is in liquidation 0
Total 153
AECOM Ref. 47067423 15
Helpdesk Support 3.3
A dedicated Helpdesk, with direct phone, fax lines and email account, was available to participating
companies throughout the survey response period (September 2014 – January 2015). Companies were
encouraged to use any or all of these methods to contact a member of the AECOM survey team.
The Helpdesk enabled companies to discuss all aspects of the survey, providing an insight into the context
from which the data has been derived. As a result, contact made through the Helpdesk allowed the data to
be validated more efficiently and feedback to be obtained from companies regarding their individual
experiences with the survey.
These facilities, in conjunction with the Defra website, have proved to be a valuable part of the survey
process. The feedback provided has enabled the survey team to identify the reasons behind participation
and constraints highlighted by potential survey participants. Annex 4 identifies the main drivers behind
participation and also the reasons why companies declined to participate. This feedback will be considered
when designing future surveys.
Companies that used the Helpdesk service commented that it had provided useful information, clarification
and assistance in completing the survey questionnaire.
The Defra website has been maintained and supported throughout the 2013 survey period:
www.gov.uk/government/collections/environmental-protection-and-expenditure-epe-survey. The website has
been used, in conjunction with the Helpdesk, to provide companies with additional copies of the
questionnaire, technical guidance notes and other information relating to the survey. As in previous surveys,
the website was used as a primary means of providing additional digital copies of the survey questionnaire, a
digital copy sent by e-mail was used as a secondary means, and a paper copy by post was only offered as a
final resort.
AECOM Ref. 47067423 16
04
Analysis of Responses
AECOM Ref. 47067423 17
Analysis of Responses 04
Response Rates 4.1
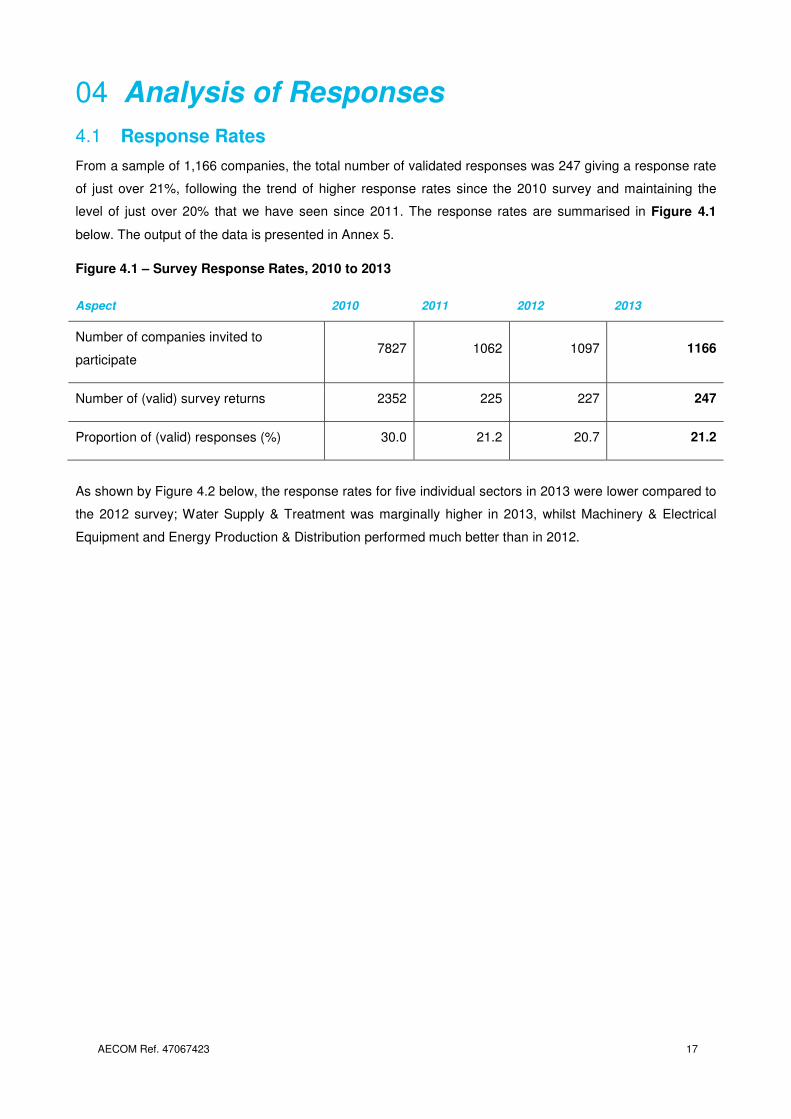
From a sample of 1,166 companies, the total number of validated responses was 247 giving a response rate
of just over 21%, following the trend of higher response rates since the 2010 survey and maintaining the
level of just over 20% that we have seen since 2011. The response rates are summarised in Figure 4.1
below. The output of the data is presented in Annex 5.
Figure 4.1 – Survey Response Rates, 2010 to 2013
As shown by Figure 4.2 below, the response rates for five individual sectors in 2013 were lower compared to
the 2012 survey; Water Supply & Treatment was marginally higher in 2013, whilst Machinery & Electrical
Equipment and Energy Production & Distribution performed much better than in 2012.
Aspect 2010 2011 2012 2013
Number of companies invited to
participate 7827 1062 1097 1166
Number of (valid) survey returns 2352 225 227 247
Proportion of (valid) responses (%) 30.0 21.2 20.7 21.2
AECOM Ref. 47067423 18
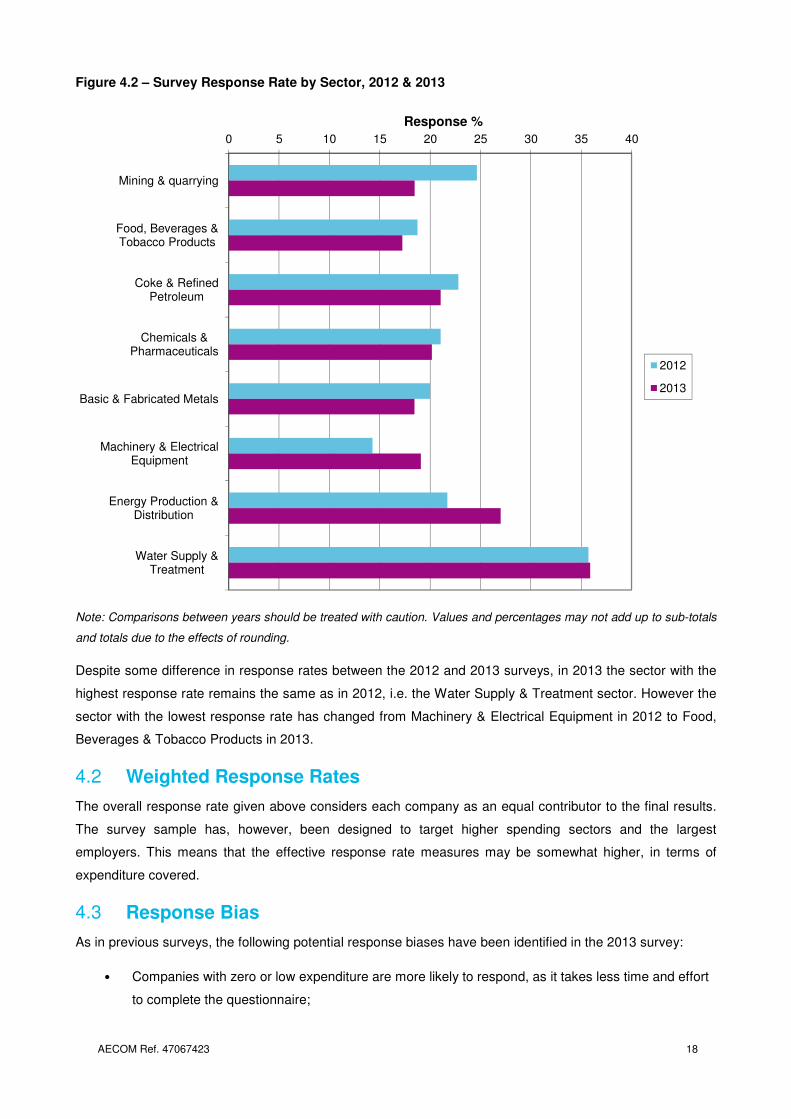
Figure 4.2 – Survey Response Rate by Sector, 2012 & 2013
Note: Comparisons between years should be treated with caution. Values and percentages may not add up to sub-totals
and totals due to the effects of rounding.
Despite some difference in response rates between the 2012 and 2013 surveys, in 2013 the sector with the
highest response rate remains the same as in 2012, i.e. the Water Supply & Treatment sector. However the
sector with the lowest response rate has changed from Machinery & Electrical Equipment in 2012 to Food,
Beverages & Tobacco Products in 2013.
Weighted Response Rates 4.2
The overall response rate given above considers each company as an equal contributor to the final results.
The survey sample has, however, been designed to target higher spending sectors and the largest
employers. This means that the effective response rate measures may be somewhat higher, in terms of
expenditure covered.
Response Bias 4.3
As in previous surveys, the following potential response biases have been identified in the 2013 survey:
• Companies with zero or low expenditure are more likely to respond, as it takes less time and effort
to complete the questionnaire;
0 5 10 15 20 25 30 35 40
Mining & quarrying
Food, Beverages &Tobacco Products
Coke & RefinedPetroleum
Chemicals &Pharmaceuticals
Basic & Fabricated Metals
Machinery & ElectricalEquipment
Energy Production &Distribution
Water Supply &Treatment
Response %
2012
2013
AECOM Ref. 47067423 19
• Companies with dedicated environmental resource are more likely to respond, due to greater data
and resource availability; and
• Companies that have completed the survey in previous years are more likely to participate and
return a completed questionnaire.
The effect of these possible biases is likely to be reduced by the stratified sampling and grossing
arrangements (refer to Annex 6 for further details). This means that using a relatively large number of cells
(determined by size of company and SIC) to categorise companies with similar characteristics, results in any
bias being ‘contained’ within the cell.
Analysis Methodology 4.4
In comparing the data sets from different survey years, a number of factors need to be considered. The
ranges indicated by the confidence intervals for the total expenditure are relatively large, and there have
been improvements made to the questionnaire design and estimation procedure. Hence, comparing the
absolute values between years should be undertaken with caution.
The process of generating estimates of expenditure from the sample sets means that it is possible for one
company’s expenditure to affect the final figure to a considerable degree. Furthermore, the nature of
environmental protection expenditure is such that an individual company may make a large “one-off”
investment in any one year of the survey (e.g. capital equipment upgrade). Therefore, whilst these large
figures may make a considerable difference in the final expenditure, they should still be included. This
principally relates to Capex rather than Opex, which would be expected to be more consistent from one year
to the next. Details of the derivation of standard error and confidence interval are presented in Annex 7.
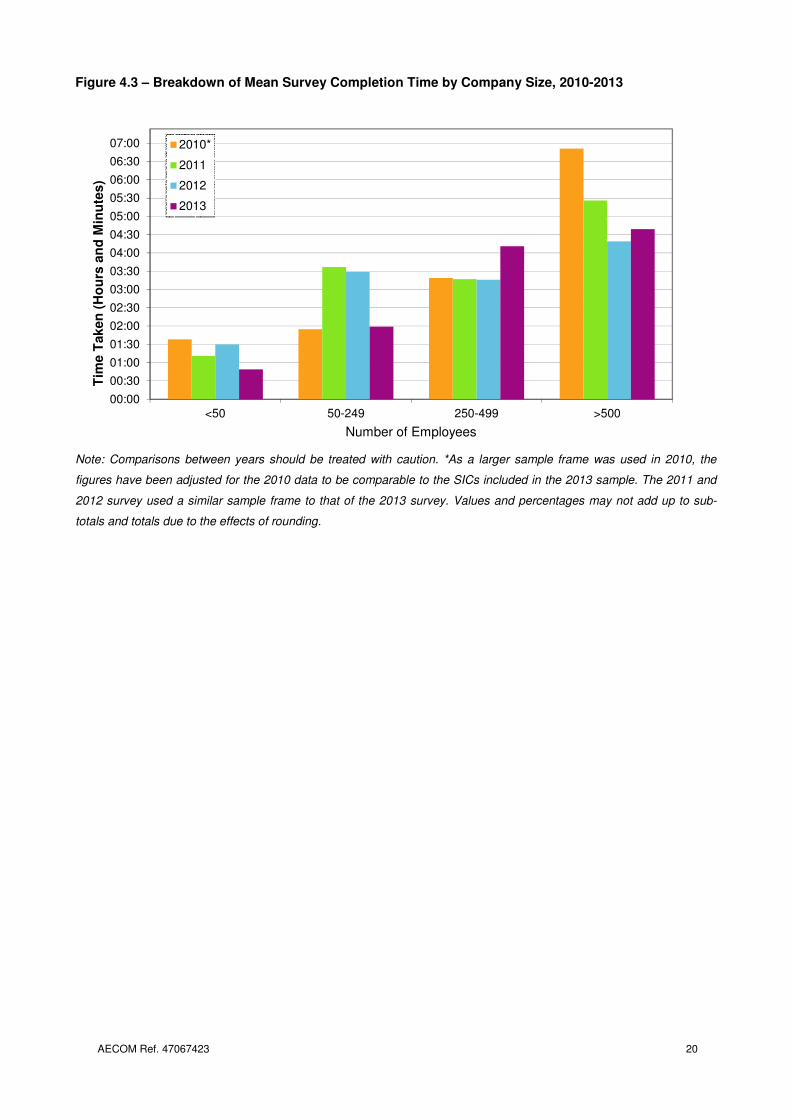
Survey Completion Time 4.5
The breakdown of survey completion time as compared to previous survey years is presented in Figure 4.3.
Responses indicate that:
• Companies with less than 50 employees took on average 49 minutes to complete the 2013 survey
questionnaire (compared to 1 hour 30 minutes for the 2012 survey);
• Those with between 50 and 249 employees spent an average of 1 hours 59 minutes completing
the questionnaire (compared to 3 hour 29 minutes for the 2012 survey);
• Companies with between 250 and 499 employees took, on average 4 hours 11 minutes
(comparative to the 2012 average of 3 hours 16 minutes);
• For companies with over 500 employees, completion time was similar to that in 2012, with an
average completion time of approximately 4 hours 39 minutes (4 hours 19 minutes in 2012).
For the 2013 survey, the average reported time taken for companies with less than 249 employees is much
lower compared to that in 2012, whilst companies with between 250 and 499 employees took longer in 2013
to complete the questionnaire as compared to 2012. Companies with more than 500 employees completed
the questionnaire in a similar time to 2012.
AECOM Ref. 47067423 20
Figure 4.3 – Breakdown of Mean Survey Completion Time by Company Size, 2010-2013
Note: Comparisons between years should be treated with caution. *As a larger sample frame was used in 2010, the
figures have been adjusted for the 2010 data to be comparable to the SICs included in the 2013 sample. The 2011 and
2012 survey used a similar sample frame to that of the 2013 survey. Values and percentages may not add up to sub-
totals and totals due to the effects of rounding.
00:00
00:30
01:00
01:30
02:00
02:30
03:00
03:30
04:00
04:30
05:00
05:30
06:00
06:30
07:00
<50 50-249 250-499 >500
Tim
e T
aken
(H
ou
rs a
nd
Min
ute
s)
Number of Employees
2010*
2011
2012
2013
AECOM Ref. 47067423 21
05
Survey Results and
Analysis
AECOM Ref. 47067423 22
Survey Results and Analysis 05
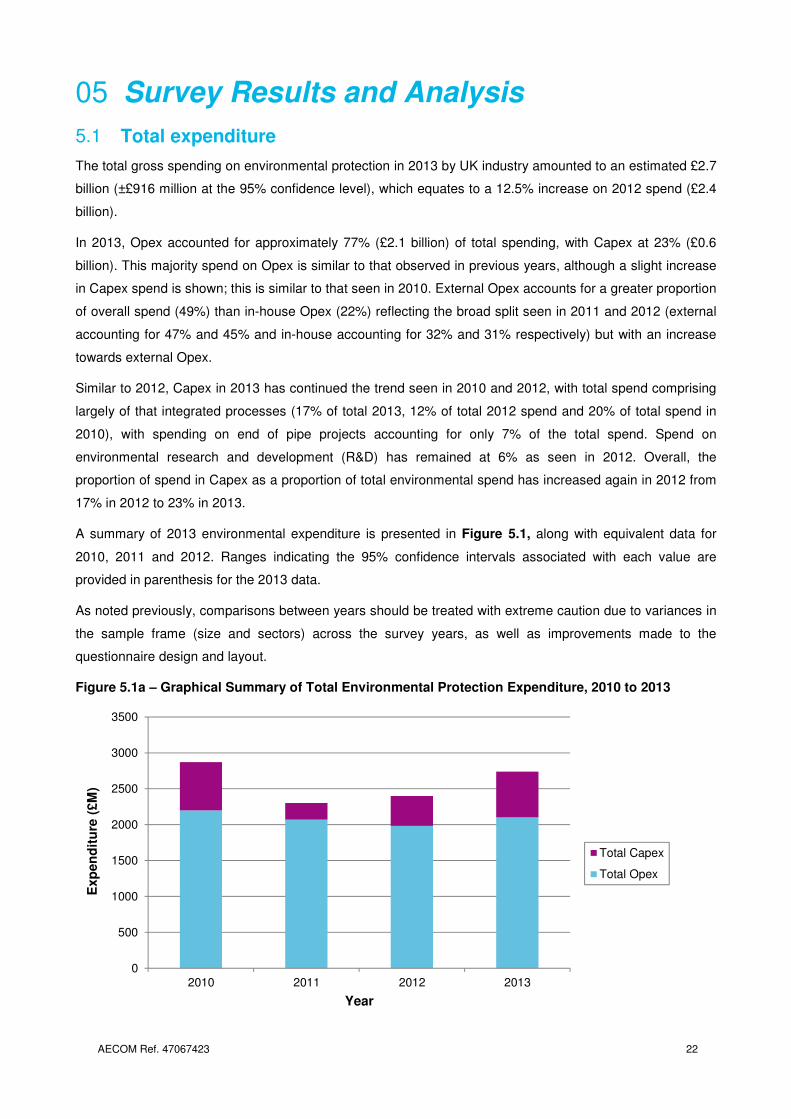
Total expenditure 5.1
The total gross spending on environmental protection in 2013 by UK industry amounted to an estimated £2.7
billion (±£916 million at the 95% confidence level), which equates to a 12.5% increase on 2012 spend (£2.4
billion).
In 2013, Opex accounted for approximately 77% (£2.1 billion) of total spending, with Capex at 23% (£0.6
billion). This majority spend on Opex is similar to that observed in previous years, although a slight increase
in Capex spend is shown; this is similar to that seen in 2010. External Opex accounts for a greater proportion
of overall spend (49%) than in-house Opex (22%) reflecting the broad split seen in 2011 and 2012 (external
accounting for 47% and 45% and in-house accounting for 32% and 31% respectively) but with an increase
towards external Opex.
Similar to 2012, Capex in 2013 has continued the trend seen in 2010 and 2012, with total spend comprising
largely of that integrated processes (17% of total 2013, 12% of total 2012 spend and 20% of total spend in
2010), with spending on end of pipe projects accounting for only 7% of the total spend. Spend on
environmental research and development (R&D) has remained at 6% as seen in 2012. Overall, the
proportion of spend in Capex as a proportion of total environmental spend has increased again in 2012 from
17% in 2012 to 23% in 2013.
A summary of 2013 environmental expenditure is presented in Figure 5.1, along with equivalent data for
2010, 2011 and 2012. Ranges indicating the 95% confidence intervals associated with each value are
provided in parenthesis for the 2013 data.
As noted previously, comparisons between years should be treated with extreme caution due to variances in
the sample frame (size and sectors) across the survey years, as well as improvements made to the
questionnaire design and layout.
Figure 5.1a – Graphical Summary of Total Environmental Protection Expenditure, 2010 to 2013
0
500
1000
1500
2000
2500
3000
3500
2010 2011 2012 2013
Exp
en
dit
ure
(£M
)
Year
Total Capex
Total Opex
AECOM Ref. 47067423 23
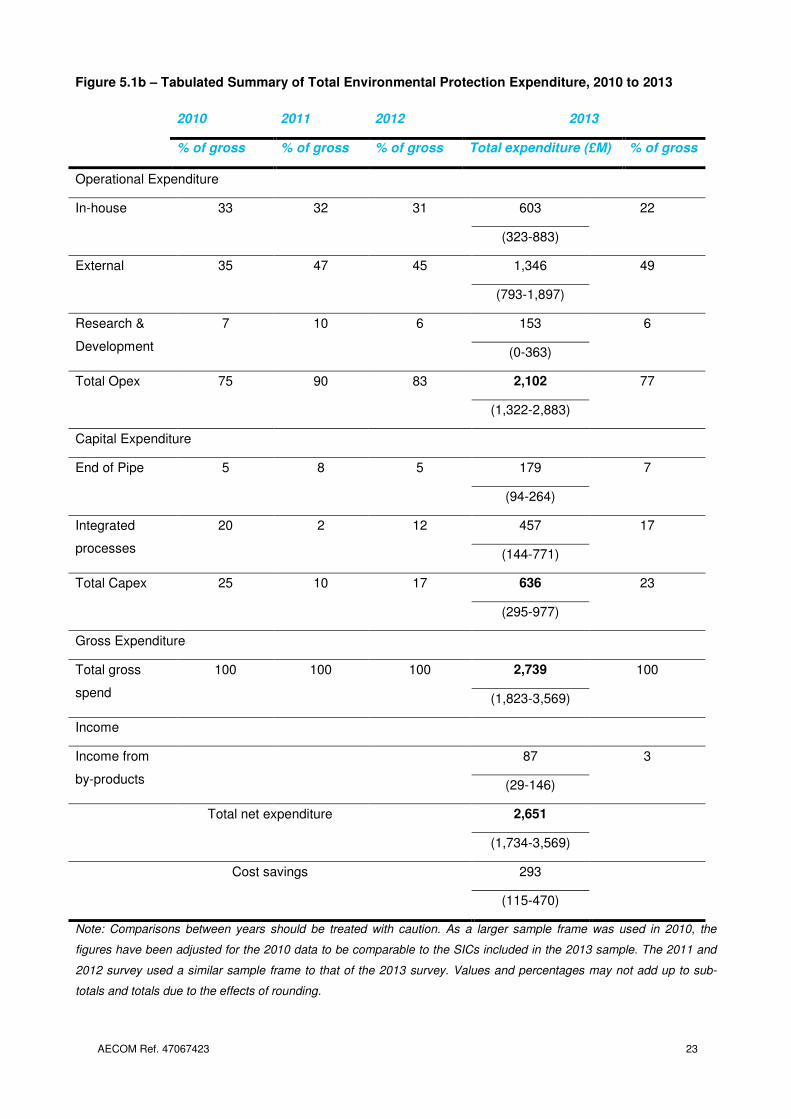
Figure 5.1b – Tabulated Summary of Total Environmental Protection Expenditure, 2010 to 2013
2010 2011 2012 2013
% of gross % of gross % of gross Total expenditure (£M) % of gross
Operational Expenditure
In-house 33 32 31 603 22
(323-883)
External 35 47 45 1,346 49
(793-1,897)
Research &
Development
7 10 6 153 6
(0-363)
Total Opex 75 90 83 2,102 77
(1,322-2,883)
Capital Expenditure
End of Pipe 5 8 5 179 7
(94-264)
Integrated
processes
20 2 12 457 17
(144-771)
Total Capex 25 10 17 636 23
(295-977)
Gross Expenditure
Total gross
spend
100 100 100 2,739 100
(1,823-3,569)
Income
Income from
by-products
87 3
(29-146)
Total net expenditure 2,651
(1,734-3,569)
Cost savings 293
(115-470)
Note: Comparisons between years should be treated with caution. As a larger sample frame was used in 2010, the
figures have been adjusted for the 2010 data to be comparable to the SICs included in the 2013 sample. The 2011 and
2012 survey used a similar sample frame to that of the 2013 survey. Values and percentages may not add up to sub-
totals and totals due to the effects of rounding.
AECOM Ref. 47067423 24
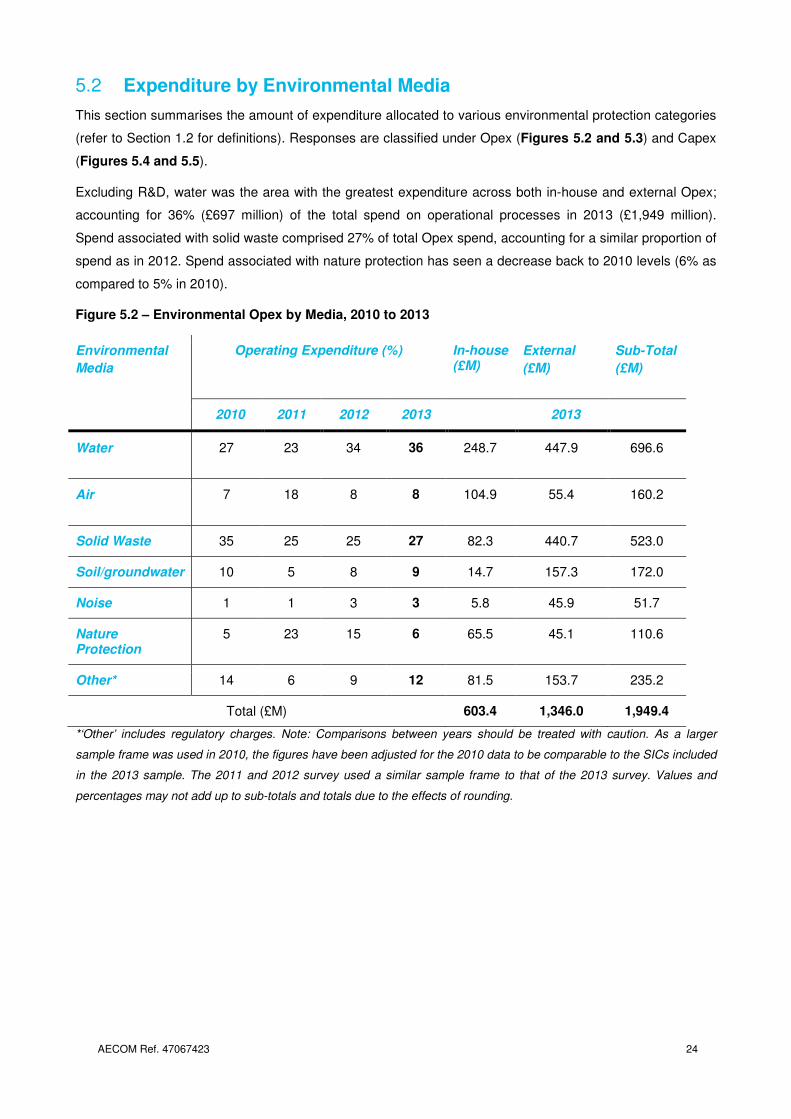
Expenditure by Environmental Media 5.2
This section summarises the amount of expenditure allocated to various environmental protection categories
(refer to Section 1.2 for definitions). Responses are classified under Opex (Figures 5.2 and 5.3) and Capex
(Figures 5.4 and 5.5).
Excluding R&D, water was the area with the greatest expenditure across both in-house and external Opex;
accounting for 36% (£697 million) of the total spend on operational processes in 2013 (£1,949 million).
Spend associated with solid waste comprised 27% of total Opex spend, accounting for a similar proportion of
spend as in 2012. Spend associated with nature protection has seen a decrease back to 2010 levels (6% as
compared to 5% in 2010).
Figure 5.2 – Environmental Opex by Media, 2010 to 2013
*‘Other’ includes regulatory charges. Note: Comparisons between years should be treated with caution. As a larger
sample frame was used in 2010, the figures have been adjusted for the 2010 data to be comparable to the SICs included
in the 2013 sample. The 2011 and 2012 survey used a similar sample frame to that of the 2013 survey. Values and
percentages may not add up to sub-totals and totals due to the effects of rounding.
Environmental
Media
Operating Expenditure (%) In-house (£M)
External
(£M)
Sub-Total
(£M)
2010 2011 2012 2013 2013
Water 27 23 34 36 248.7 447.9 696.6
Air 7 18 8 8 104.9 55.4 160.2
Solid Waste 35 25 25 27 82.3 440.7 523.0
Soil/groundwater 10 5 8 9 14.7 157.3 172.0
Noise 1 1 3 3 5.8 45.9 51.7
Nature Protection
5 23 15 6 65.5 45.1 110.6
Other* 14 6 9 12 81.5 153.7 235.2
Total (£M) 603.4 1,346.0 1,949.4
AECOM Ref. 47067423 25
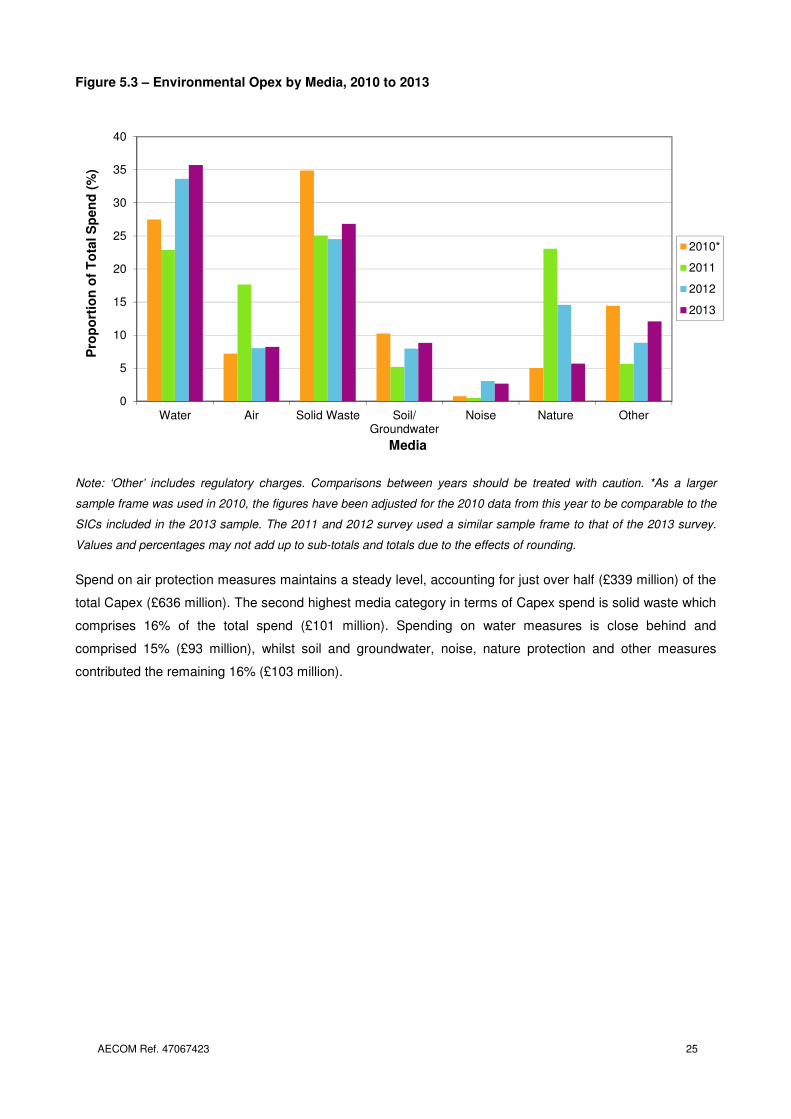
Figure 5.3 – Environmental Opex by Media, 2010 to 2013
Note: ‘Other’ includes regulatory charges. Comparisons between years should be treated with caution. *As a larger
sample frame was used in 2010, the figures have been adjusted for the 2010 data from this year to be comparable to the
SICs included in the 2013 sample. The 2011 and 2012 survey used a similar sample frame to that of the 2013 survey.
Values and percentages may not add up to sub-totals and totals due to the effects of rounding.
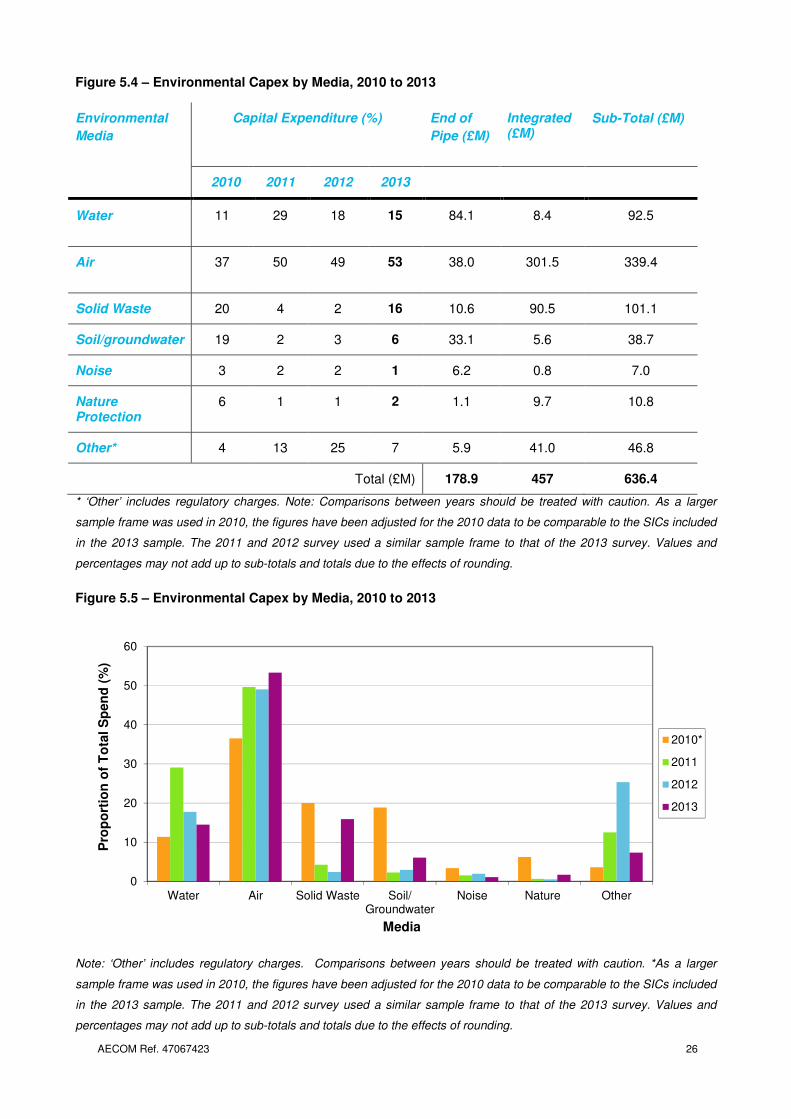
Spend on air protection measures maintains a steady level, accounting for just over half (£339 million) of the
total Capex (£636 million). The second highest media category in terms of Capex spend is solid waste which
comprises 16% of the total spend (£101 million). Spending on water measures is close behind and
comprised 15% (£93 million), whilst soil and groundwater, noise, nature protection and other measures
contributed the remaining 16% (£103 million).
0
5
10
15
20
25
30
35
40
Water Air Solid Waste Soil/Groundwater
Noise Nature Other
Pro
po
rtio
n o
f T
ota
l S
pen
d (
%)
Media
2010*
2011
2012
2013
AECOM Ref. 47067423 26
Figure 5.4 – Environmental Capex by Media, 2010 to 2013
* ‘Other’ includes regulatory charges. Note: Comparisons between years should be treated with caution. As a larger
sample frame was used in 2010, the figures have been adjusted for the 2010 data to be comparable to the SICs included
in the 2013 sample. The 2011 and 2012 survey used a similar sample frame to that of the 2013 survey. Values and
percentages may not add up to sub-totals and totals due to the effects of rounding.
Figure 5.5 – Environmental Capex by Media, 2010 to 2013
Note: ‘Other’ includes regulatory charges. Comparisons between years should be treated with caution. *As a larger
sample frame was used in 2010, the figures have been adjusted for the 2010 data to be comparable to the SICs included
in the 2013 sample. The 2011 and 2012 survey used a similar sample frame to that of the 2013 survey. Values and
percentages may not add up to sub-totals and totals due to the effects of rounding.
0
10
20
30
40
50
60
Water Air Solid Waste Soil/Groundwater
Noise Nature Other
Pro
po
rtio
n o
f T
ota
l S
pen
d (
%)
Media
2010*
2011
2012
2013
Environmental
Media
Capital Expenditure (%) End of
Pipe (£M)
Integrated (£M)
Sub-Total (£M)
2010 2011 2012 2013
Water 11 29 18 15 84.1 8.4 92.5
Air 37 50 49 53 38.0 301.5 339.4
Solid Waste 20 4 2 16 10.6 90.5 101.1
Soil/groundwater 19 2 3 6 33.1 5.6 38.7
Noise 3 2 2 1 6.2 0.8 7.0
Nature Protection
6 1 1 2 1.1 9.7 10.8
Other* 4 13 25 7 5.9 41.0 46.8
Total (£M) 178.9 457 636.4
AECOM Ref. 47067423 27
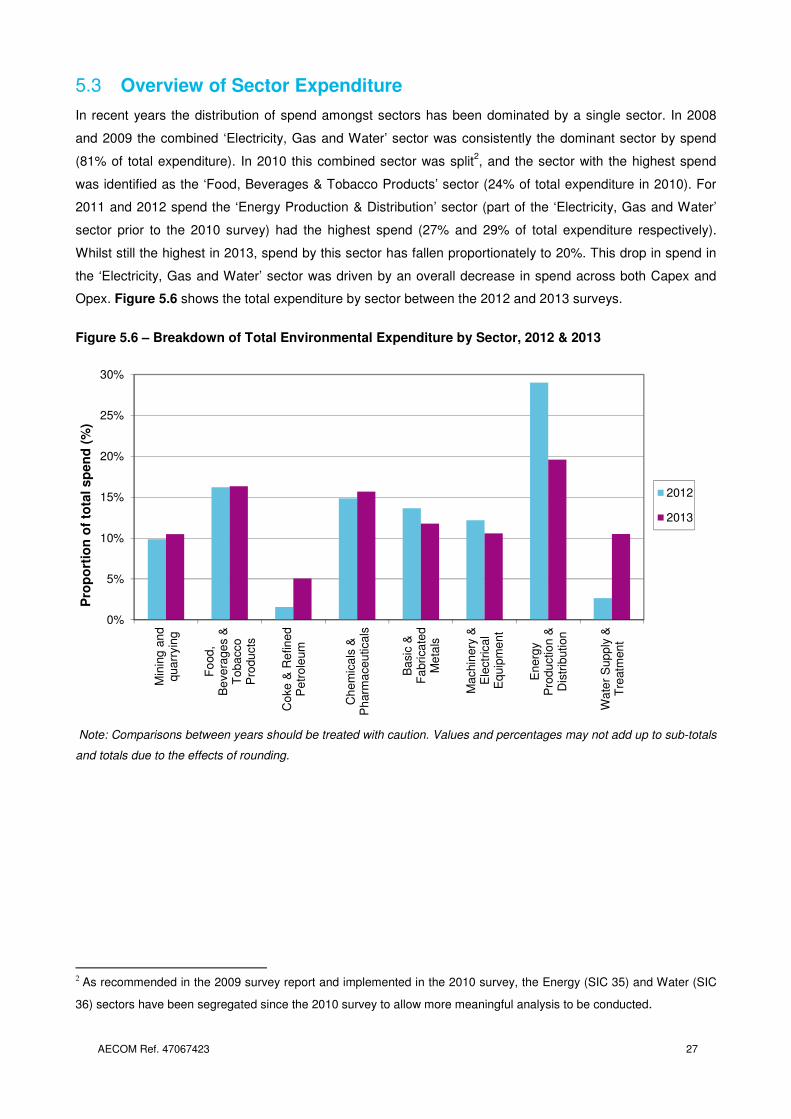
Overview of Sector Expenditure 5.3
In recent years the distribution of spend amongst sectors has been dominated by a single sector. In 2008
and 2009 the combined ‘Electricity, Gas and Water’ sector was consistently the dominant sector by spend
(81% of total expenditure). In 2010 this combined sector was split2, and the sector with the highest spend
was identified as the ‘Food, Beverages & Tobacco Products’ sector (24% of total expenditure in 2010). For
2011 and 2012 spend the ‘Energy Production & Distribution’ sector (part of the ‘Electricity, Gas and Water’
sector prior to the 2010 survey) had the highest spend (27% and 29% of total expenditure respectively).
Whilst still the highest in 2013, spend by this sector has fallen proportionately to 20%. This drop in spend in
the ‘Electricity, Gas and Water’ sector was driven by an overall decrease in spend across both Capex and
Opex. Figure 5.6 shows the total expenditure by sector between the 2012 and 2013 surveys.
Figure 5.6 – Breakdown of Total Environmental Expenditure by Sector, 2012 & 2013
Note: Comparisons between years should be treated with caution. Values and percentages may not add up to sub-totals
and totals due to the effects of rounding.
2 As recommended in the 2009 survey report and implemented in the 2010 survey, the Energy (SIC 35) and Water (SIC
36) sectors have been segregated since the 2010 survey to allow more meaningful analysis to be conducted.
0%
5%
10%
15%
20%
25%
30%
Min
ing
an
dq
ua
rryin
g
Fo
od
,B
eve
rage
s &
To
ba
cco
Pro
du
cts
Co
ke
& R
efin
ed
Pe
trole
um
Ch
em
ica
ls &
Ph
arm
ace
uticals
Ba
sic
&F
abri
ca
ted
Me
tals
Ma
chin
ery
&E
lectr
ica
lE
quip
me
nt
En
erg
yP
rodu
ctio
n &
Dis
trib
ution
Wa
ter
Su
pp
ly &
Tre
atm
en
t
Pro
po
rtio
n o
f to
tal sp
en
d (
%)
2012
2013
AECOM Ref. 47067423 28
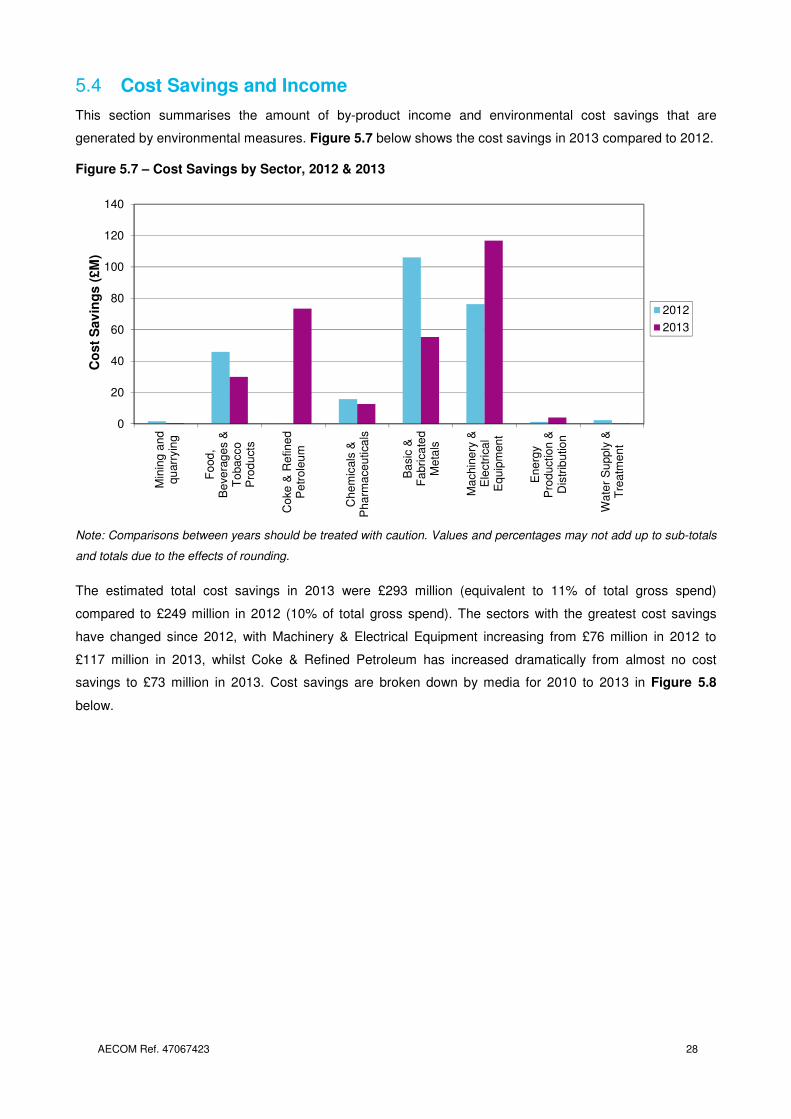
Cost Savings and Income 5.4
This section summarises the amount of by-product income and environmental cost savings that are
generated by environmental measures. Figure 5.7 below shows the cost savings in 2013 compared to 2012.
Figure 5.7 – Cost Savings by Sector, 2012 & 2013
Note: Comparisons between years should be treated with caution. Values and percentages may not add up to sub-totals
and totals due to the effects of rounding.
The estimated total cost savings in 2013 were £293 million (equivalent to 11% of total gross spend)
compared to £249 million in 2012 (10% of total gross spend). The sectors with the greatest cost savings
have changed since 2012, with Machinery & Electrical Equipment increasing from £76 million in 2012 to
£117 million in 2013, whilst Coke & Refined Petroleum has increased dramatically from almost no cost
savings to £73 million in 2013. Cost savings are broken down by media for 2010 to 2013 in Figure 5.8
below.
0
20
40
60
80
100
120
140
Min
ing
an
dq
uarr
yin
g
Fo
od
,B
eve
rag
es &
To
ba
cco
Pro
du
cts
Co
ke
& R
efin
ed
Pe
trole
um
Ch
em
icals
&P
ha
rma
ce
utica
ls
Ba
sic
&F
abri
ca
ted
Me
tals
Ma
chin
ery
&E
lectr
ica
lE
qu
ipm
en
t
En
erg
yP
rod
uctio
n &
Dis
trib
utio
n
Wa
ter
Su
pp
ly &
Tre
atm
en
t
Co
st
Sav
ing
s (
£M
)
2012
2013
AECOM Ref. 47067423 29
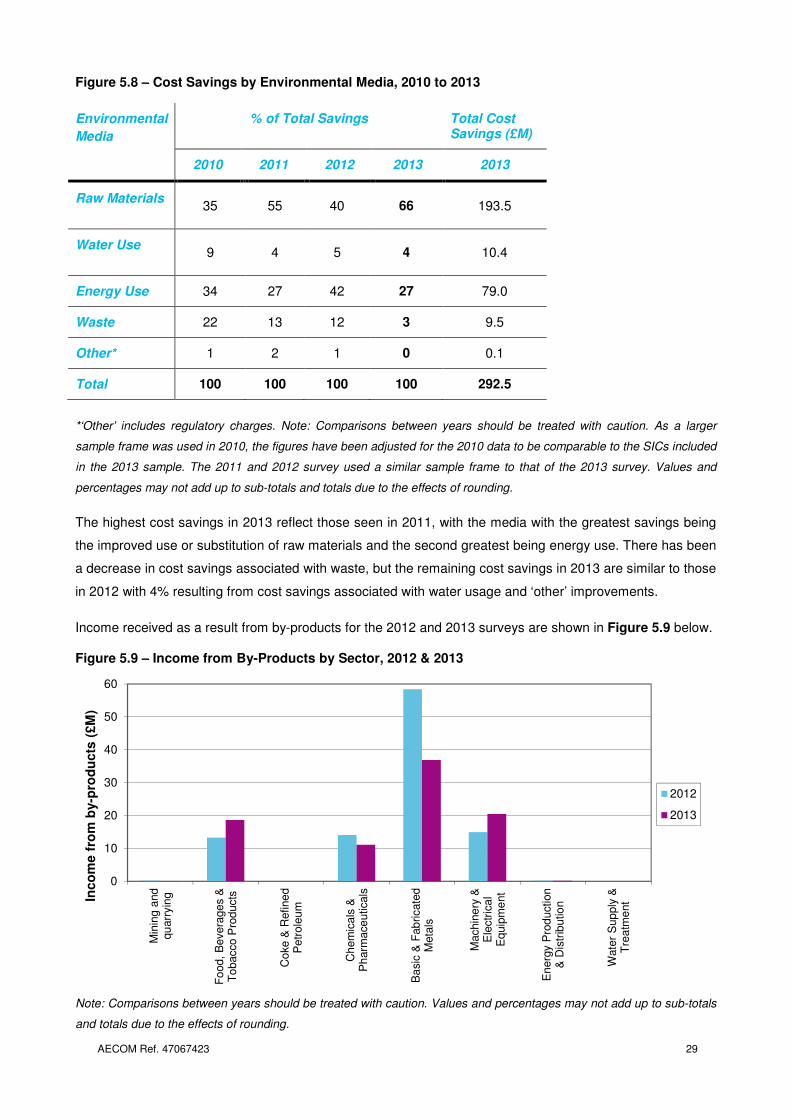
Figure 5.8 – Cost Savings by Environmental Media, 2010 to 2013
*‘Other’ includes regulatory charges. Note: Comparisons between years should be treated with caution. As a larger
sample frame was used in 2010, the figures have been adjusted for the 2010 data to be comparable to the SICs included
in the 2013 sample. The 2011 and 2012 survey used a similar sample frame to that of the 2013 survey. Values and
percentages may not add up to sub-totals and totals due to the effects of rounding.
The highest cost savings in 2013 reflect those seen in 2011, with the media with the greatest savings being
the improved use or substitution of raw materials and the second greatest being energy use. There has been
a decrease in cost savings associated with waste, but the remaining cost savings in 2013 are similar to those
in 2012 with 4% resulting from cost savings associated with water usage and ‘other’ improvements.
Income received as a result from by-products for the 2012 and 2013 surveys are shown in Figure 5.9 below.
Figure 5.9 – Income from By-Products by Sector, 2012 & 2013
Note: Comparisons between years should be treated with caution. Values and percentages may not add up to sub-totals
and totals due to the effects of rounding.
0
10
20
30
40
50
60
Min
ing
and
qu
arr
yin
g
Fo
od,
Bevera
ge
s &
To
bacco
Pro
ducts
Co
ke &
Refine
dP
etr
ole
um
Ch
em
icals
&P
harm
ace
uticals
Ba
sic
& F
ab
ricate
dM
eta
ls
Machin
ery
&E
lectr
ica
lE
quip
me
nt
En
erg
y P
rod
uction
& D
istr
ibutio
n
Wate
r S
up
ply
&T
rea
tme
ntIn
co
me f
rom
by-p
rod
ucts
(£M
)
2012
2013
Environmental
Media
% of Total Savings Total Cost Savings (£M)
2010 2011 2012 2013 2013
Raw Materials 35 55 40 66 193.5
Water Use 9 4 5 4 10.4
Energy Use 34 27 42 27 79.0
Waste 22 13 12 3 9.5
Other* 1 2 1 0 0.1
Total 100 100 100 100 292.5
AECOM Ref. 47067423 30
Income resulting from the sale of by-products in 2013 was £87 million (equating to 3% of total gross spend),
a slight decrease from the previous two surveys. As in 2012, the Basic & Fabricated Metals sectors were the
leaders in terms of income generated from the sale of by-products during 2013 (£37 million). However, the
sectors’ dominance has decreased in line with the overall decrease in income resulting from the sale of by-
products and also the increase seen in income within the Food, Beverages & Tobacco Products and the
Machinery & Electrical Equipment sectors.
AECOM Ref. 47067423 31
Expenditure by Industry sector 5.5
This section looks at individual sectors and identifies notable features under the following headings, with a
brief analysis of trends and drivers of environmental protection expenditure in 2013:
• Key Expenditure: Summary of key 2013 data by Opex and Capex categories, along with
expenditure in 2010 to 2012.
• Expenditure by Media: Expenditure by media type (i.e. water, solid waste, noise, air
soil/groundwater, nature protection and ‘other’) is shown in a graphical format for external, in-
house, integrated and end of pipe expenditure.
• Income and Savings: Summary of key 2013 data by cost savings and by-product sales, along with
data from 2010 to 2012.
When looking at the sector analyses, it should be remembered that direct comparisons between survey
years are not possible due to variances in the sample size between the smaller 2011, 2012 and 2013
surveys and the larger 2010 survey, as well as the improvements made to the questionnaire design and
estimation procedures.
5.5.1 SIC 05 to 09: Mining & Quarrying
Estimates of environmental protection expenditure and income/savings are provided below for the Mining &
Quarrying sector. Of the 130 invited to participate in the 2013 survey, a total of 24 companies returned valid
responses, giving a response rate for the sector of 19%. This is a slight decrease from the 25% response
rate for the 2012 survey and sees a return to the response rates of 2011 (19%).
The Mining & Quarrying sector has a relatively small number of sizable companies in the UK, which do not
necessarily participate in the survey each year and thus increases the potential for skewed results. This has
been found to be the case again in the 2013 survey, with the returns biased towards one sub-sector area
(mining support service activities) with very few returns from other sector areas,.
Key Expenditure
Environmental expenditure for this sector is shown in Figure 5.10 for the years 2010-2013. The data is
presented separately for Opex and Capex.
AECOM Ref. 47067423 32
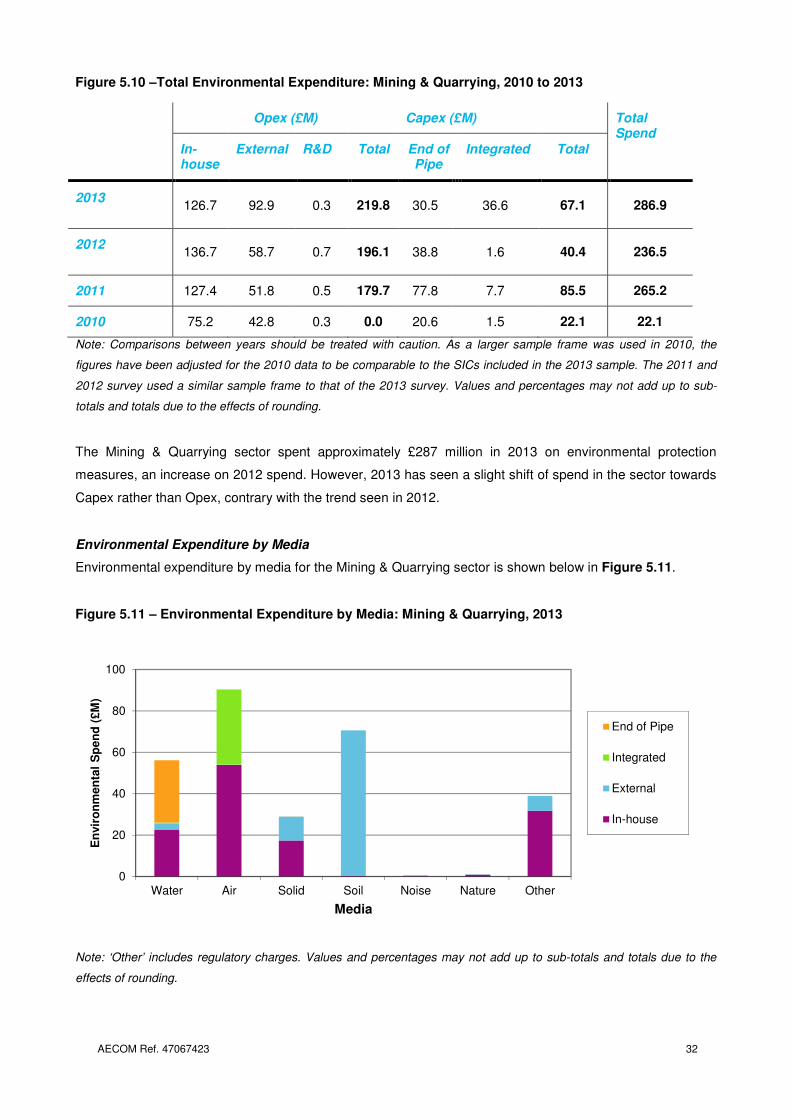
Figure 5.10 –Total Environmental Expenditure: Mining & Quarrying, 2010 to 2013
Note: Comparisons between years should be treated with caution. As a larger sample frame was used in 2010, the
figures have been adjusted for the 2010 data to be comparable to the SICs included in the 2013 sample. The 2011 and
2012 survey used a similar sample frame to that of the 2013 survey. Values and percentages may not add up to sub-
totals and totals due to the effects of rounding.
The Mining & Quarrying sector spent approximately £287 million in 2013 on environmental protection
measures, an increase on 2012 spend. However, 2013 has seen a slight shift of spend in the sector towards
Capex rather than Opex, contrary with the trend seen in 2012.
Environmental Expenditure by Media
Environmental expenditure by media for the Mining & Quarrying sector is shown below in Figure 5.11.
Figure 5.11 – Environmental Expenditure by Media: Mining & Quarrying, 2013
Note: ‘Other’ includes regulatory charges. Values and percentages may not add up to sub-totals and totals due to the
effects of rounding.
0
20
40
60
80
100
Water Air Solid Soil Noise Nature Other
En
vir
on
men
tal
Sp
en
d (
£M
)
Media
End of Pipe
Integrated
External
In-house
Opex (£M) Capex (£M) Total Spend
In-house
External R&D Total End of Pipe
Integrated Total
2013 126.7 92.9 0.3 219.8 30.5 36.6 67.1 286.9
2012 136.7 58.7 0.7 196.1 38.8 1.6 40.4 236.5
2011 127.4 51.8 0.5 179.7 77.8 7.7 85.5 265.2
2010 75.2 42.8 0.3 0.0 20.6 1.5 22.1 22.1
AECOM Ref. 47067423 33
The greatest environmental spend was on air protection measures, driven by in-house and integrated spend
and replacing water protection measures as the area of greatest spend in 2012. This is in contrast with the
second highest media spend soil, which almost exclusively comprises external spend.
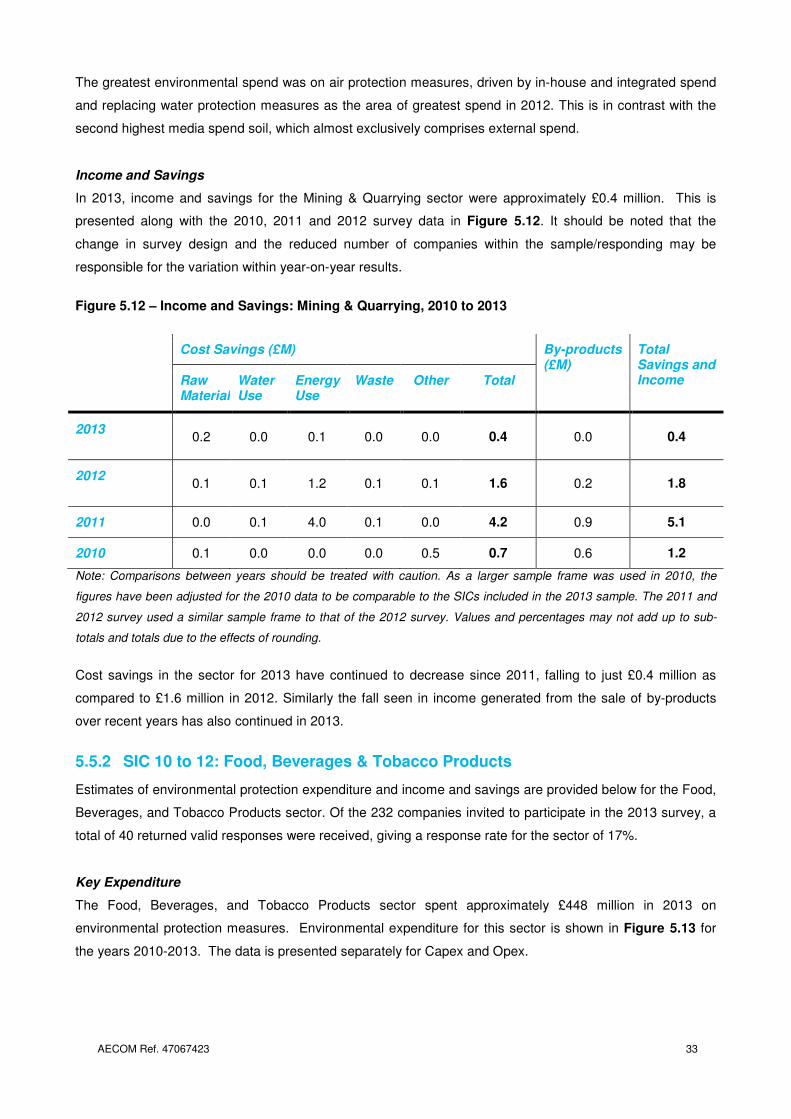
Income and Savings
In 2013, income and savings for the Mining & Quarrying sector were approximately £0.4 million. This is
presented along with the 2010, 2011 and 2012 survey data in Figure 5.12. It should be noted that the
change in survey design and the reduced number of companies within the sample/responding may be
responsible for the variation within year-on-year results.
Figure 5.12 – Income and Savings: Mining & Quarrying, 2010 to 2013
Note: Comparisons between years should be treated with caution. As a larger sample frame was used in 2010, the
figures have been adjusted for the 2010 data to be comparable to the SICs included in the 2013 sample. The 2011 and
2012 survey used a similar sample frame to that of the 2012 survey. Values and percentages may not add up to sub-
totals and totals due to the effects of rounding.
Cost savings in the sector for 2013 have continued to decrease since 2011, falling to just £0.4 million as
compared to £1.6 million in 2012. Similarly the fall seen in income generated from the sale of by-products
over recent years has also continued in 2013.
5.5.2 SIC 10 to 12: Food, Beverages & Tobacco Products
Estimates of environmental protection expenditure and income and savings are provided below for the Food,
Beverages, and Tobacco Products sector. Of the 232 companies invited to participate in the 2013 survey, a
total of 40 returned valid responses were received, giving a response rate for the sector of 17%.
Key Expenditure
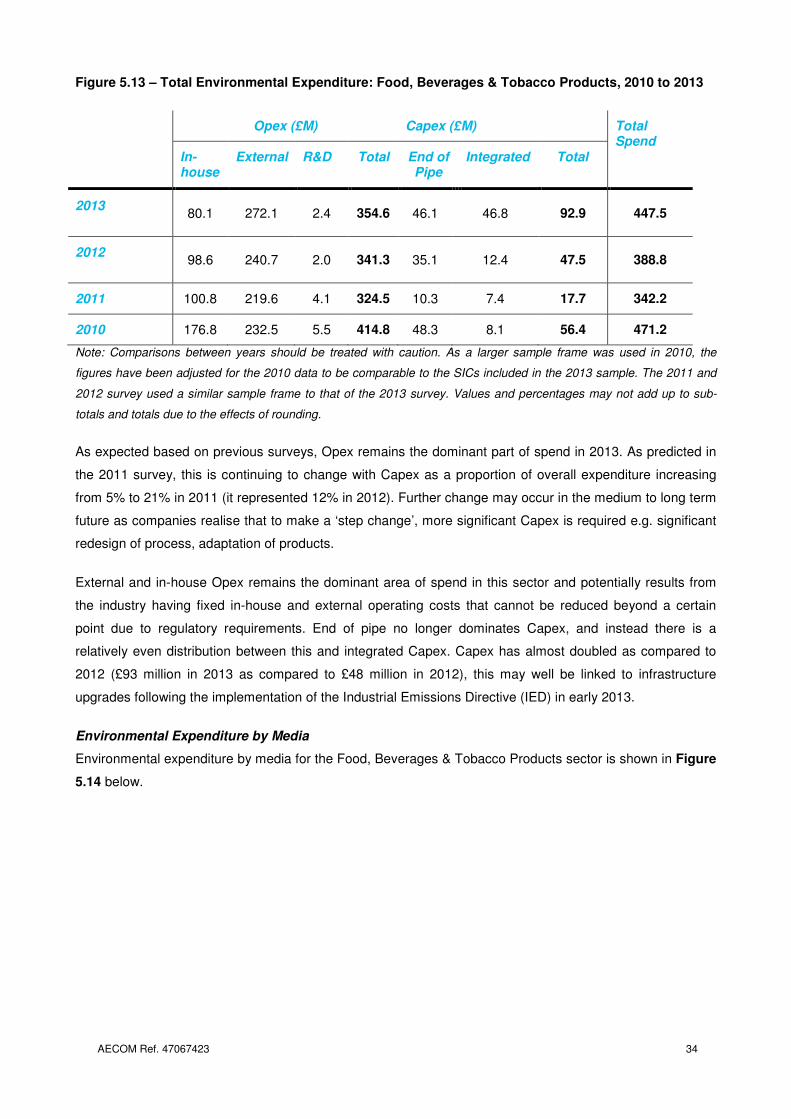
The Food, Beverages, and Tobacco Products sector spent approximately £448 million in 2013 on
environmental protection measures. Environmental expenditure for this sector is shown in Figure 5.13 for
the years 2010-2013. The data is presented separately for Capex and Opex.
Cost Savings (£M) By-products (£M)
Total Savings and Income Raw
MaterialWater Use
Energy Use
Waste Other Total
2013 0.2 0.0 0.1 0.0 0.0 0.4 0.0 0.4
2012 0.1 0.1 1.2 0.1 0.1 1.6 0.2 1.8
2011 0.0 0.1 4.0 0.1 0.0 4.2 0.9 5.1
2010 0.1 0.0 0.0 0.0 0.5 0.7 0.6 1.2
AECOM Ref. 47067423 34
Figure 5.13 – Total Environmental Expenditure: Food, Beverages & Tobacco Products, 2010 to 2013
Note: Comparisons between years should be treated with caution. As a larger sample frame was used in 2010, the
figures have been adjusted for the 2010 data to be comparable to the SICs included in the 2013 sample. The 2011 and
2012 survey used a similar sample frame to that of the 2013 survey. Values and percentages may not add up to sub-
totals and totals due to the effects of rounding.
As expected based on previous surveys, Opex remains the dominant part of spend in 2013. As predicted in
the 2011 survey, this is continuing to change with Capex as a proportion of overall expenditure increasing
from 5% to 21% in 2011 (it represented 12% in 2012). Further change may occur in the medium to long term
future as companies realise that to make a ‘step change’, more significant Capex is required e.g. significant
redesign of process, adaptation of products.
External and in-house Opex remains the dominant area of spend in this sector and potentially results from
the industry having fixed in-house and external operating costs that cannot be reduced beyond a certain
point due to regulatory requirements. End of pipe no longer dominates Capex, and instead there is a
relatively even distribution between this and integrated Capex. Capex has almost doubled as compared to
2012 (£93 million in 2013 as compared to £48 million in 2012), this may well be linked to infrastructure
upgrades following the implementation of the Industrial Emissions Directive (IED) in early 2013.
Environmental Expenditure by Media
Environmental expenditure by media for the Food, Beverages & Tobacco Products sector is shown in Figure
5.14 below.
Opex (£M) Capex (£M) Total Spend
In-house
External R&D Total End of Pipe
Integrated Total
2013 80.1 272.1 2.4 354.6 46.1 46.8 92.9 447.5
2012 98.6 240.7 2.0 341.3 35.1 12.4 47.5 388.8
2011 100.8 219.6 4.1 324.5 10.3 7.4 17.7 342.2
2010 176.8 232.5 5.5 414.8 48.3 8.1 56.4 471.2
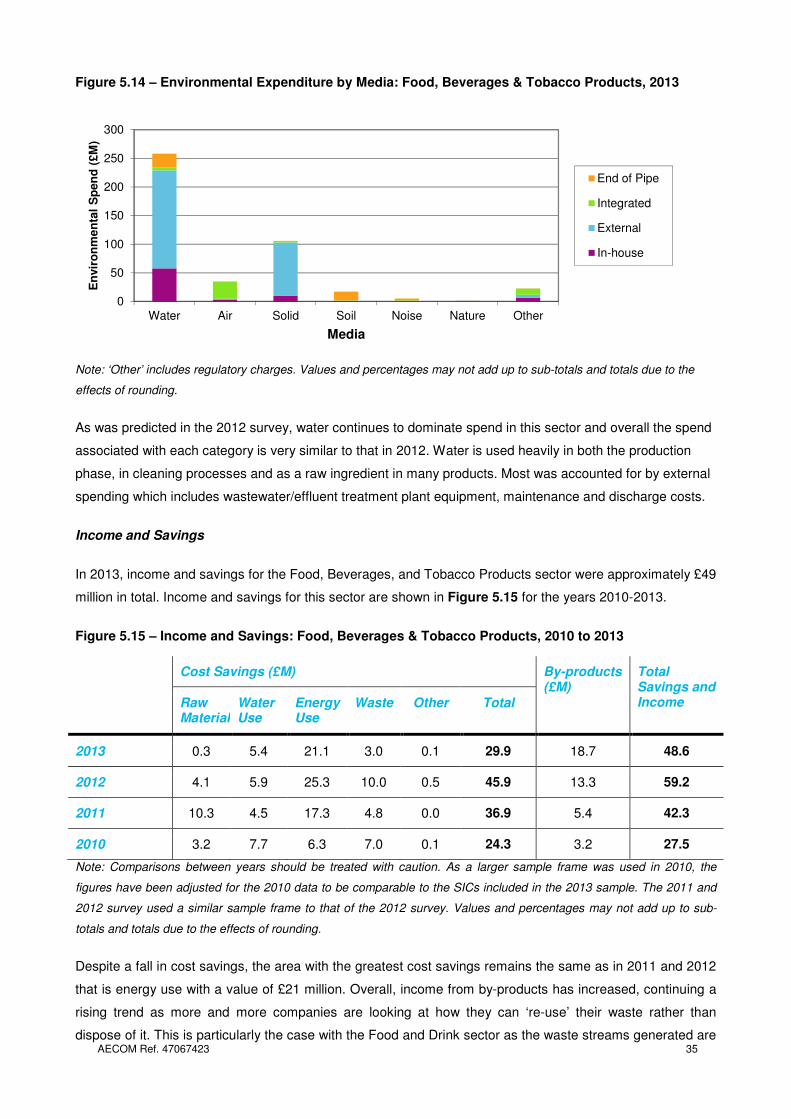
AECOM Ref. 47067423 35
Figure 5.14 – Environmental Expenditure by Media: Food, Beverages & Tobacco Products, 2013
Note: ‘Other’ includes regulatory charges. Values and percentages may not add up to sub-totals and totals due to the
effects of rounding.
As was predicted in the 2012 survey, water continues to dominate spend in this sector and overall the spend
associated with each category is very similar to that in 2012. Water is used heavily in both the production
phase, in cleaning processes and as a raw ingredient in many products. Most was accounted for by external
spending which includes wastewater/effluent treatment plant equipment, maintenance and discharge costs.
Income and Savings
In 2013, income and savings for the Food, Beverages, and Tobacco Products sector were approximately £49
million in total. Income and savings for this sector are shown in Figure 5.15 for the years 2010-2013.
Figure 5.15 – Income and Savings: Food, Beverages & Tobacco Products, 2010 to 2013
Note: Comparisons between years should be treated with caution. As a larger sample frame was used in 2010, the
figures have been adjusted for the 2010 data to be comparable to the SICs included in the 2013 sample. The 2011 and
2012 survey used a similar sample frame to that of the 2012 survey. Values and percentages may not add up to sub-
totals and totals due to the effects of rounding.
Despite a fall in cost savings, the area with the greatest cost savings remains the same as in 2011 and 2012
that is energy use with a value of £21 million. Overall, income from by-products has increased, continuing a
rising trend as more and more companies are looking at how they can ‘re-use’ their waste rather than
dispose of it. This is particularly the case with the Food and Drink sector as the waste streams generated are
0
50
100
150
200
250
300
Water Air Solid Soil Noise Nature Other
En
vir
on
men
tal
Sp
en
d (
£M
)
Media
End of Pipe
Integrated
External
In-house
Cost Savings (£M) By-products (£M)
Total Savings and Income Raw
MaterialWater Use
Energy Use
Waste Other Total
2013 0.3 5.4 21.1 3.0 0.1 29.9 18.7 48.6
2012 4.1 5.9 25.3 10.0 0.5 45.9 13.3 59.2
2011 10.3 4.5 17.3 4.8 0.0 36.9 5.4 42.3
2010 3.2 7.7 6.3 7.0 0.1 24.3 3.2 27.5
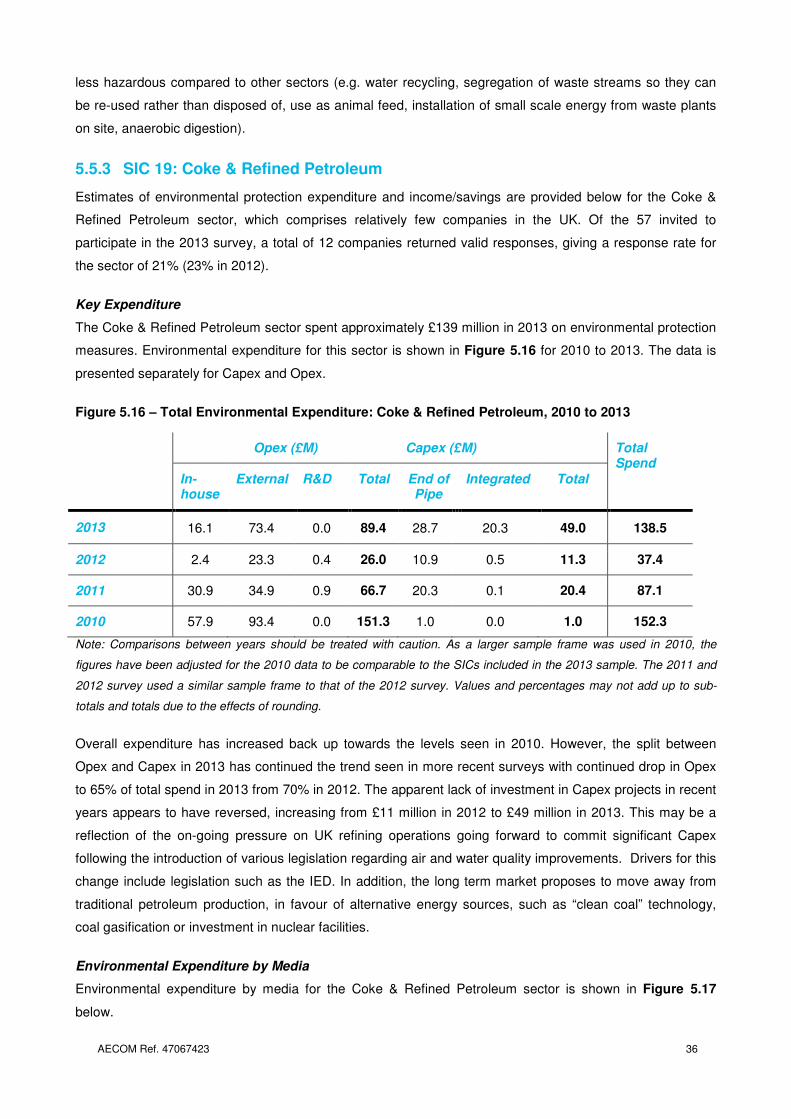
AECOM Ref. 47067423 36
less hazardous compared to other sectors (e.g. water recycling, segregation of waste streams so they can
be re-used rather than disposed of, use as animal feed, installation of small scale energy from waste plants
on site, anaerobic digestion).
5.5.3 SIC 19: Coke & Refined Petroleum
Estimates of environmental protection expenditure and income/savings are provided below for the Coke &
Refined Petroleum sector, which comprises relatively few companies in the UK. Of the 57 invited to
participate in the 2013 survey, a total of 12 companies returned valid responses, giving a response rate for
the sector of 21% (23% in 2012).
Key Expenditure
The Coke & Refined Petroleum sector spent approximately £139 million in 2013 on environmental protection
measures. Environmental expenditure for this sector is shown in Figure 5.16 for 2010 to 2013. The data is
presented separately for Capex and Opex.
Figure 5.16 – Total Environmental Expenditure: Coke & Refined Petroleum, 2010 to 2013
Note: Comparisons between years should be treated with caution. As a larger sample frame was used in 2010, the
figures have been adjusted for the 2010 data to be comparable to the SICs included in the 2013 sample. The 2011 and
2012 survey used a similar sample frame to that of the 2012 survey. Values and percentages may not add up to sub-
totals and totals due to the effects of rounding.
Overall expenditure has increased back up towards the levels seen in 2010. However, the split between
Opex and Capex in 2013 has continued the trend seen in more recent surveys with continued drop in Opex
to 65% of total spend in 2013 from 70% in 2012. The apparent lack of investment in Capex projects in recent
years appears to have reversed, increasing from £11 million in 2012 to £49 million in 2013. This may be a
reflection of the on-going pressure on UK refining operations going forward to commit significant Capex
following the introduction of various legislation regarding air and water quality improvements. Drivers for this
change include legislation such as the IED. In addition, the long term market proposes to move away from
traditional petroleum production, in favour of alternative energy sources, such as “clean coal” technology,
coal gasification or investment in nuclear facilities.
Environmental Expenditure by Media
Environmental expenditure by media for the Coke & Refined Petroleum sector is shown in Figure 5.17
below.
Opex (£M) Capex (£M) Total Spend
In-house
External R&D Total End of Pipe
Integrated Total
2013 16.1 73.4 0.0 89.4 28.7 20.3 49.0 138.5
2012 2.4 23.3 0.4 26.0 10.9 0.5 11.3 37.4
2011 30.9 34.9 0.9 66.7 20.3 0.1 20.4 87.1
2010 57.9 93.4 0.0 151.3 1.0 0.0 1.0 152.3
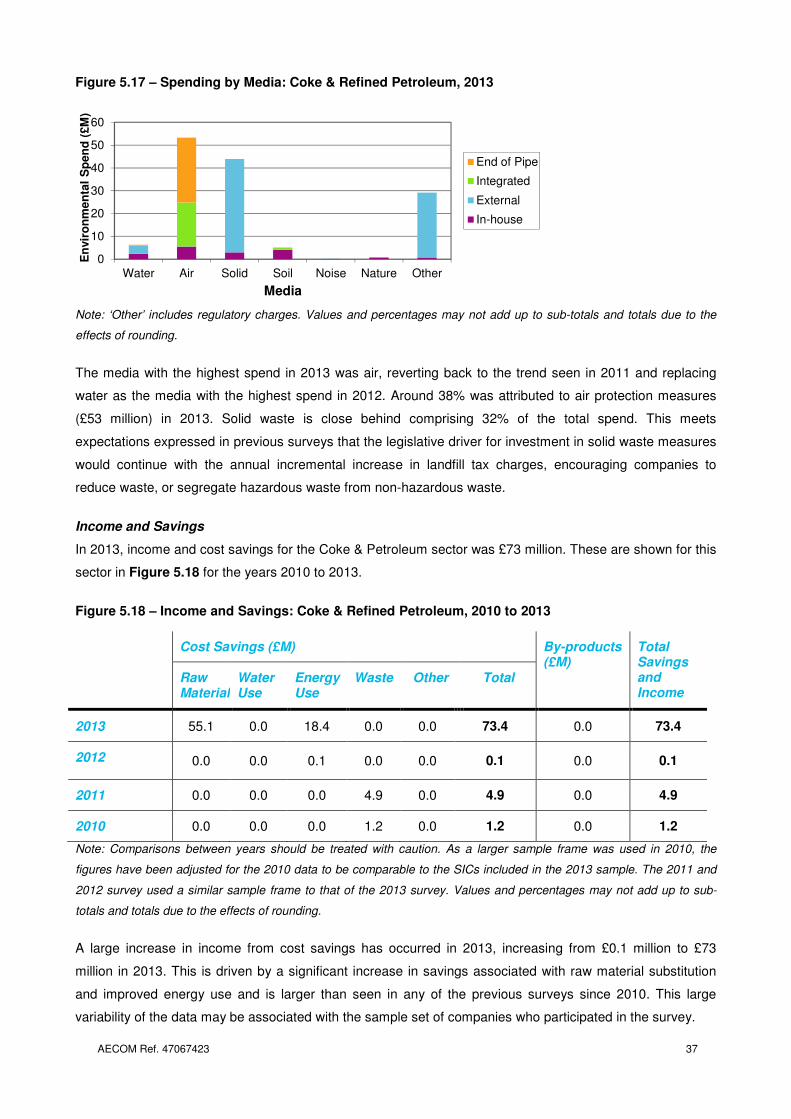
AECOM Ref. 47067423 37
Figure 5.17 – Spending by Media: Coke & Refined Petroleum, 2013
Note: ‘Other’ includes regulatory charges. Values and percentages may not add up to sub-totals and totals due to the
effects of rounding.
The media with the highest spend in 2013 was air, reverting back to the trend seen in 2011 and replacing
water as the media with the highest spend in 2012. Around 38% was attributed to air protection measures
(£53 million) in 2013. Solid waste is close behind comprising 32% of the total spend. This meets
expectations expressed in previous surveys that the legislative driver for investment in solid waste measures
would continue with the annual incremental increase in landfill tax charges, encouraging companies to
reduce waste, or segregate hazardous waste from non-hazardous waste.
Income and Savings
In 2013, income and cost savings for the Coke & Petroleum sector was £73 million. These are shown for this
sector in Figure 5.18 for the years 2010 to 2013.
Figure 5.18 – Income and Savings: Coke & Refined Petroleum, 2010 to 2013
Note: Comparisons between years should be treated with caution. As a larger sample frame was used in 2010, the
figures have been adjusted for the 2010 data to be comparable to the SICs included in the 2013 sample. The 2011 and
2012 survey used a similar sample frame to that of the 2013 survey. Values and percentages may not add up to sub-
totals and totals due to the effects of rounding.
A large increase in income from cost savings has occurred in 2013, increasing from £0.1 million to £73
million in 2013. This is driven by a significant increase in savings associated with raw material substitution
and improved energy use and is larger than seen in any of the previous surveys since 2010. This large
variability of the data may be associated with the sample set of companies who participated in the survey.
0
10
20
30
40
50
60
Water Air Solid Soil Noise Nature Other
En
vir
on
men
tal
Sp
en
d (
£M
)
Media
End of Pipe
Integrated
External
In-house
Cost Savings (£M) By-products (£M)
Total Savings and Income
Raw Material
Water Use
Energy Use
Waste Other Total
2013 55.1 0.0 18.4 0.0 0.0 73.4 0.0 73.4
2012 0.0 0.0 0.1 0.0 0.0 0.1 0.0 0.1
2011 0.0 0.0 0.0 4.9 0.0 4.9 0.0 4.9
2010 0.0 0.0 0.0 1.2 0.0 1.2 0.0 1.2
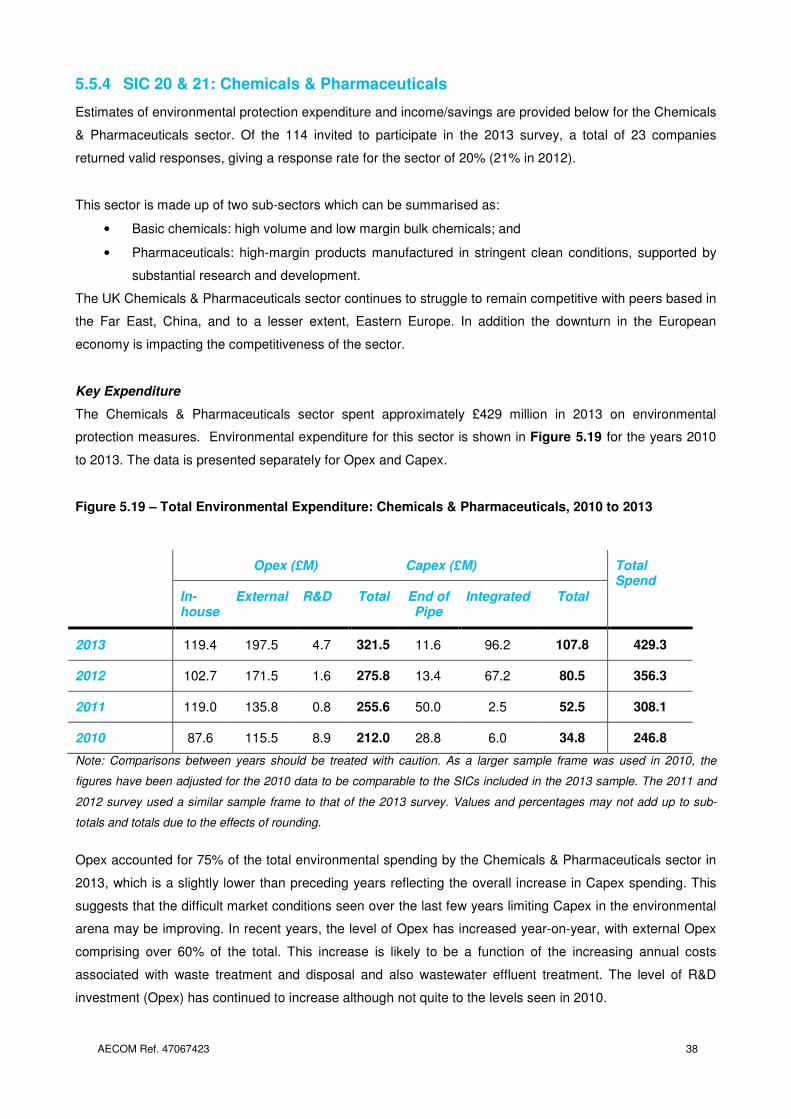
AECOM Ref. 47067423 38
5.5.4 SIC 20 & 21: Chemicals & Pharmaceuticals
Estimates of environmental protection expenditure and income/savings are provided below for the Chemicals
& Pharmaceuticals sector. Of the 114 invited to participate in the 2013 survey, a total of 23 companies
returned valid responses, giving a response rate for the sector of 20% (21% in 2012).
This sector is made up of two sub-sectors which can be summarised as:
• Basic chemicals: high volume and low margin bulk chemicals; and
• Pharmaceuticals: high-margin products manufactured in stringent clean conditions, supported by
substantial research and development.
The UK Chemicals & Pharmaceuticals sector continues to struggle to remain competitive with peers based in
the Far East, China, and to a lesser extent, Eastern Europe. In addition the downturn in the European
economy is impacting the competitiveness of the sector.
Key Expenditure
The Chemicals & Pharmaceuticals sector spent approximately £429 million in 2013 on environmental
protection measures. Environmental expenditure for this sector is shown in Figure 5.19 for the years 2010
to 2013. The data is presented separately for Opex and Capex.
Figure 5.19 – Total Environmental Expenditure: Chemicals & Pharmaceuticals, 2010 to 2013
Note: Comparisons between years should be treated with caution. As a larger sample frame was used in 2010, the
figures have been adjusted for the 2010 data to be comparable to the SICs included in the 2013 sample. The 2011 and
2012 survey used a similar sample frame to that of the 2013 survey. Values and percentages may not add up to sub-
totals and totals due to the effects of rounding.
Opex accounted for 75% of the total environmental spending by the Chemicals & Pharmaceuticals sector in
2013, which is a slightly lower than preceding years reflecting the overall increase in Capex spending. This
suggests that the difficult market conditions seen over the last few years limiting Capex in the environmental
arena may be improving. In recent years, the level of Opex has increased year-on-year, with external Opex
comprising over 60% of the total. This increase is likely to be a function of the increasing annual costs
associated with waste treatment and disposal and also wastewater effluent treatment. The level of R&D
investment (Opex) has continued to increase although not quite to the levels seen in 2010.
Opex (£M) Capex (£M) Total Spend
In-house
External R&D Total End of Pipe
Integrated Total
2013 119.4 197.5 4.7 321.5 11.6 96.2 107.8 429.3
2012 102.7 171.5 1.6 275.8 13.4 67.2 80.5 356.3
2011 119.0 135.8 0.8 255.6 50.0 2.5 52.5 308.1
2010 87.6 115.5 8.9 212.0 28.8 6.0 34.8 246.8
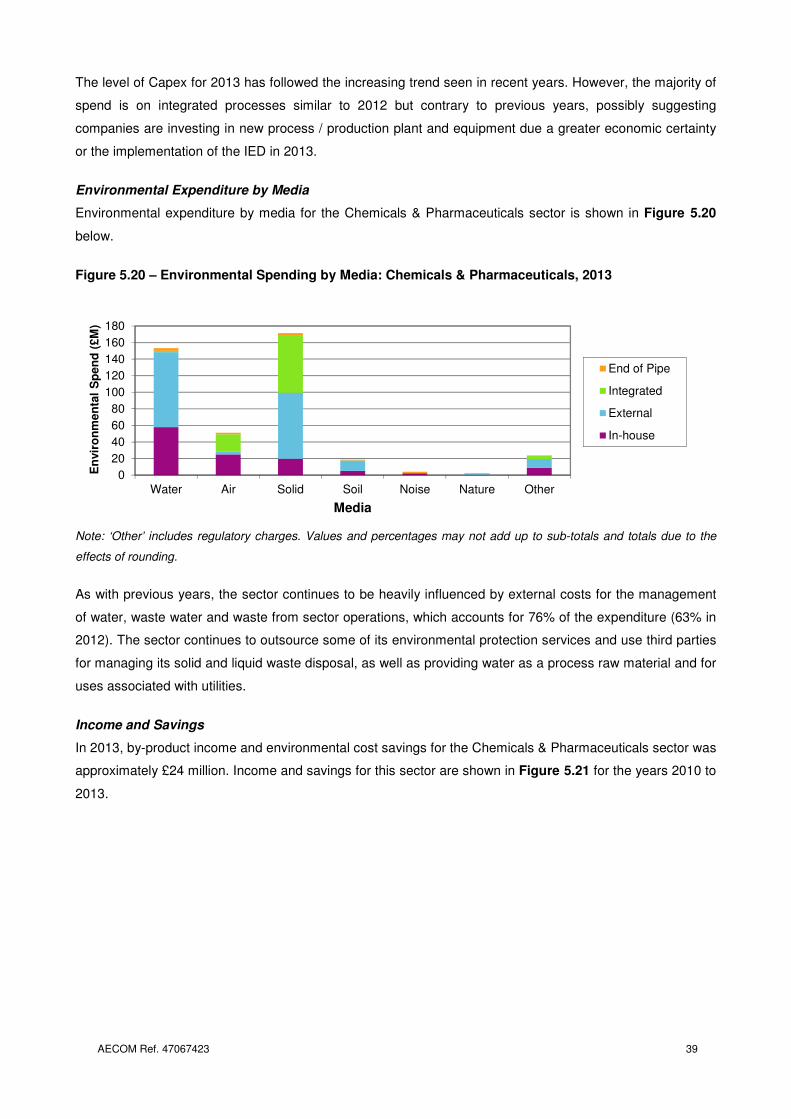
AECOM Ref. 47067423 39
The level of Capex for 2013 has followed the increasing trend seen in recent years. However, the majority of
spend is on integrated processes similar to 2012 but contrary to previous years, possibly suggesting
companies are investing in new process / production plant and equipment due a greater economic certainty
or the implementation of the IED in 2013.
Environmental Expenditure by Media
Environmental expenditure by media for the Chemicals & Pharmaceuticals sector is shown in Figure 5.20
below.
Figure 5.20 – Environmental Spending by Media: Chemicals & Pharmaceuticals, 2013
Note: ‘Other’ includes regulatory charges. Values and percentages may not add up to sub-totals and totals due to the
effects of rounding.
As with previous years, the sector continues to be heavily influenced by external costs for the management
of water, waste water and waste from sector operations, which accounts for 76% of the expenditure (63% in
2012). The sector continues to outsource some of its environmental protection services and use third parties
for managing its solid and liquid waste disposal, as well as providing water as a process raw material and for
uses associated with utilities.
Income and Savings
In 2013, by-product income and environmental cost savings for the Chemicals & Pharmaceuticals sector was
approximately £24 million. Income and savings for this sector are shown in Figure 5.21 for the years 2010 to
2013.
0
20
40
60
80
100
120
140
160
180
Water Air Solid Soil Noise Nature Other
En
vir
on
men
tal
Sp
en
d (
£M
)
Media
End of Pipe
Integrated
External
In-house
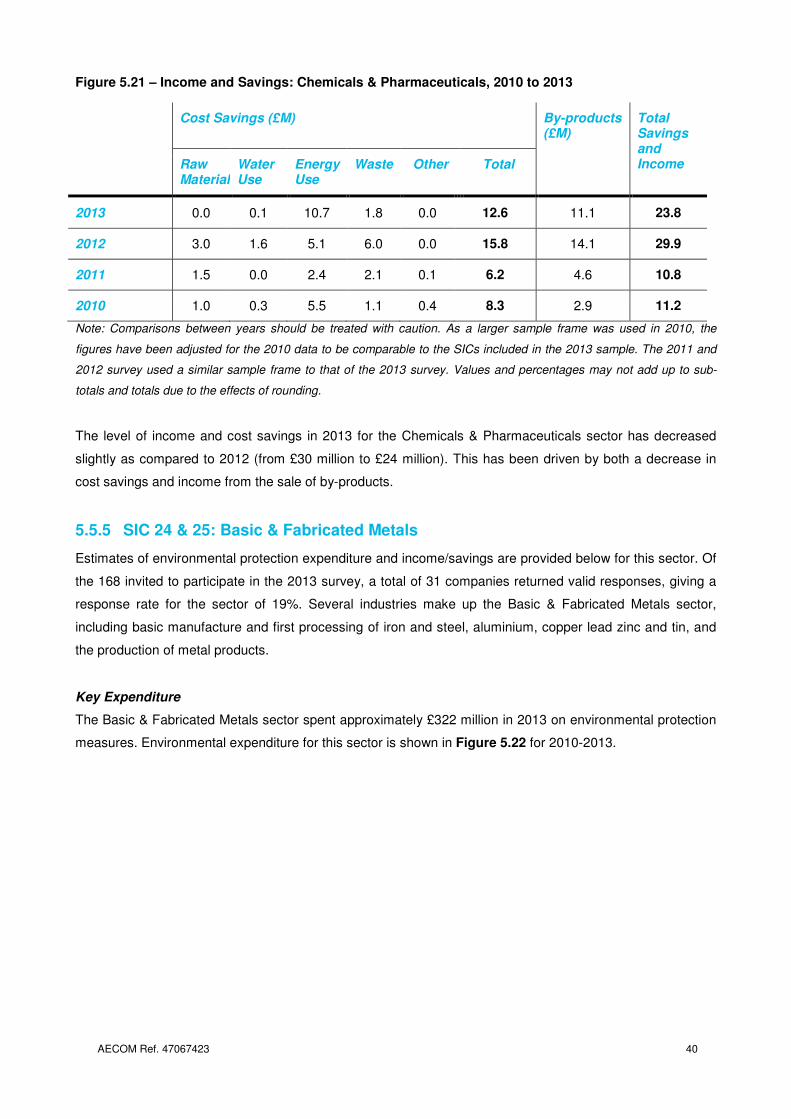
AECOM Ref. 47067423 40
Figure 5.21 – Income and Savings: Chemicals & Pharmaceuticals, 2010 to 2013
Note: Comparisons between years should be treated with caution. As a larger sample frame was used in 2010, the
figures have been adjusted for the 2010 data to be comparable to the SICs included in the 2013 sample. The 2011 and
2012 survey used a similar sample frame to that of the 2013 survey. Values and percentages may not add up to sub-
totals and totals due to the effects of rounding.
The level of income and cost savings in 2013 for the Chemicals & Pharmaceuticals sector has decreased
slightly as compared to 2012 (from £30 million to £24 million). This has been driven by both a decrease in
cost savings and income from the sale of by-products.
5.5.5 SIC 24 & 25: Basic & Fabricated Metals
Estimates of environmental protection expenditure and income/savings are provided below for this sector. Of
the 168 invited to participate in the 2013 survey, a total of 31 companies returned valid responses, giving a
response rate for the sector of 19%. Several industries make up the Basic & Fabricated Metals sector,
including basic manufacture and first processing of iron and steel, aluminium, copper lead zinc and tin, and
the production of metal products.
Key Expenditure
The Basic & Fabricated Metals sector spent approximately £322 million in 2013 on environmental protection
measures. Environmental expenditure for this sector is shown in Figure 5.22 for 2010-2013.
Cost Savings (£M) By-products (£M)
Total Savings and Income Raw
MaterialWater Use
Energy Use
Waste Other Total
2013 0.0 0.1 10.7 1.8 0.0 12.6 11.1 23.8
2012 3.0 1.6 5.1 6.0 0.0 15.8 14.1 29.9
2011 1.5 0.0 2.4 2.1 0.1 6.2 4.6 10.8
2010 1.0 0.3 5.5 1.1 0.4 8.3 2.9 11.2
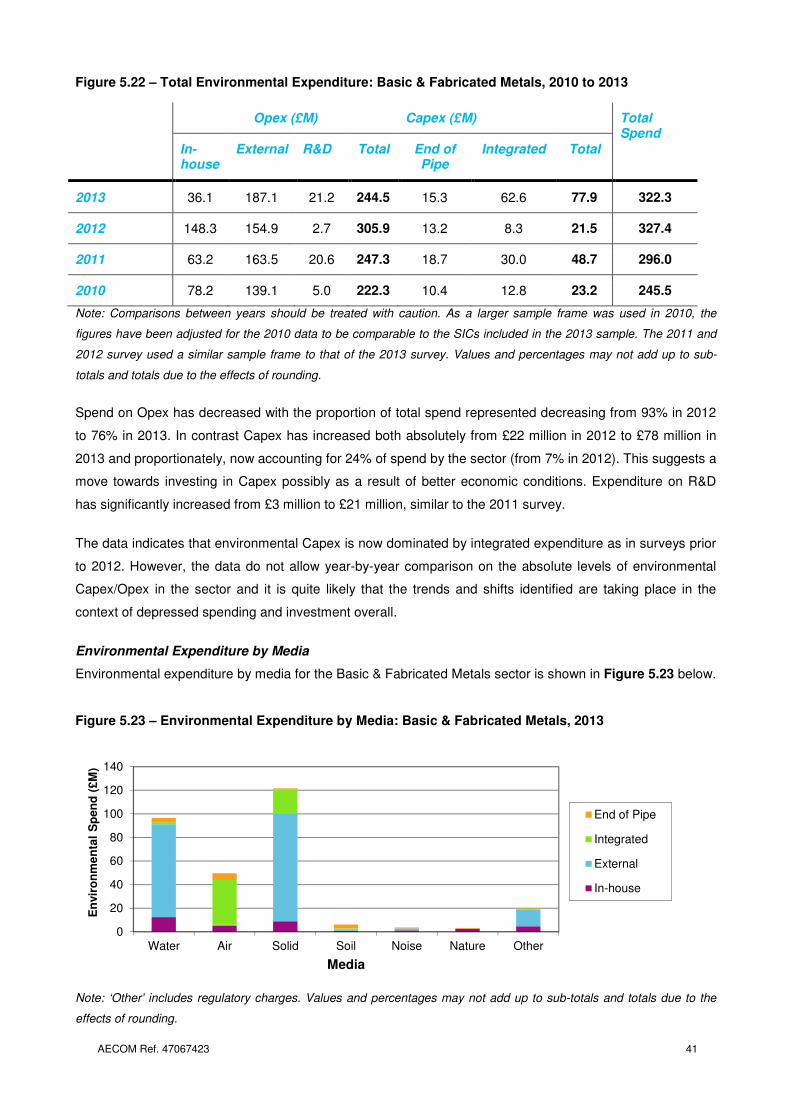
AECOM Ref. 47067423 41
Figure 5.22 – Total Environmental Expenditure: Basic & Fabricated Metals, 2010 to 2013
Note: Comparisons between years should be treated with caution. As a larger sample frame was used in 2010, the
figures have been adjusted for the 2010 data to be comparable to the SICs included in the 2013 sample. The 2011 and
2012 survey used a similar sample frame to that of the 2013 survey. Values and percentages may not add up to sub-
totals and totals due to the effects of rounding.
Spend on Opex has decreased with the proportion of total spend represented decreasing from 93% in 2012
to 76% in 2013. In contrast Capex has increased both absolutely from £22 million in 2012 to £78 million in
2013 and proportionately, now accounting for 24% of spend by the sector (from 7% in 2012). This suggests a
move towards investing in Capex possibly as a result of better economic conditions. Expenditure on R&D
has significantly increased from £3 million to £21 million, similar to the 2011 survey.
The data indicates that environmental Capex is now dominated by integrated expenditure as in surveys prior
to 2012. However, the data do not allow year-by-year comparison on the absolute levels of environmental
Capex/Opex in the sector and it is quite likely that the trends and shifts identified are taking place in the
context of depressed spending and investment overall.
Environmental Expenditure by Media
Environmental expenditure by media for the Basic & Fabricated Metals sector is shown in Figure 5.23 below.
Figure 5.23 – Environmental Expenditure by Media: Basic & Fabricated Metals, 2013
Note: ‘Other’ includes regulatory charges. Values and percentages may not add up to sub-totals and totals due to the
effects of rounding.
0
20
40
60
80
100
120
140
Water Air Solid Soil Noise Nature Other
En
vir
on
men
tal
Sp
en
d (
£M
)
Media
End of Pipe
Integrated
External
In-house
Opex (£M) Capex (£M) Total Spend
In-house
External R&D Total End of Pipe
Integrated Total
2013 36.1 187.1 21.2 244.5 15.3 62.6 77.9 322.3
2012 148.3 154.9 2.7 305.9 13.2 8.3 21.5 327.4
2011 63.2 163.5 20.6 247.3 18.7 30.0 48.7 296.0
2010 78.2 139.1 5.0 222.3 10.4 12.8 23.2 245.5
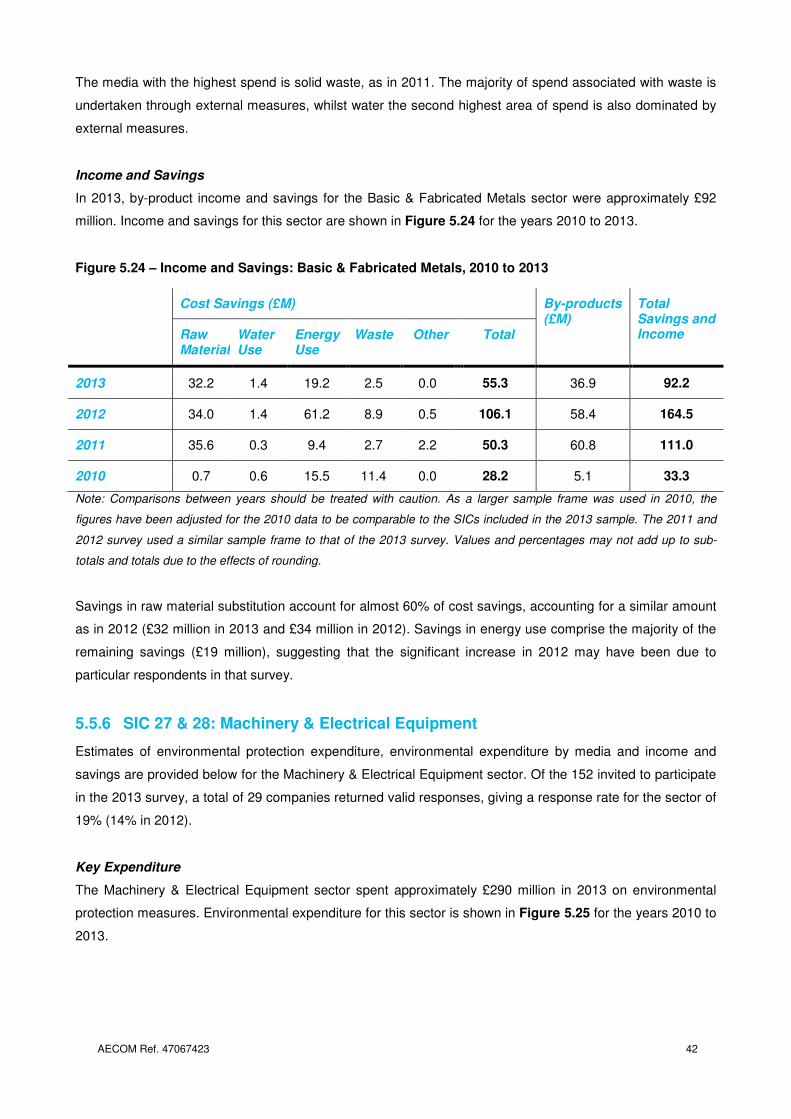
AECOM Ref. 47067423 42
The media with the highest spend is solid waste, as in 2011. The majority of spend associated with waste is
undertaken through external measures, whilst water the second highest area of spend is also dominated by
external measures.
Income and Savings
In 2013, by-product income and savings for the Basic & Fabricated Metals sector were approximately £92
million. Income and savings for this sector are shown in Figure 5.24 for the years 2010 to 2013.
Figure 5.24 – Income and Savings: Basic & Fabricated Metals, 2010 to 2013
Note: Comparisons between years should be treated with caution. As a larger sample frame was used in 2010, the
figures have been adjusted for the 2010 data to be comparable to the SICs included in the 2013 sample. The 2011 and
2012 survey used a similar sample frame to that of the 2013 survey. Values and percentages may not add up to sub-
totals and totals due to the effects of rounding.
Savings in raw material substitution account for almost 60% of cost savings, accounting for a similar amount
as in 2012 (£32 million in 2013 and £34 million in 2012). Savings in energy use comprise the majority of the
remaining savings (£19 million), suggesting that the significant increase in 2012 may have been due to
particular respondents in that survey.
5.5.6 SIC 27 & 28: Machinery & Electrical Equipment
Estimates of environmental protection expenditure, environmental expenditure by media and income and
savings are provided below for the Machinery & Electrical Equipment sector. Of the 152 invited to participate
in the 2013 survey, a total of 29 companies returned valid responses, giving a response rate for the sector of
19% (14% in 2012).
Key Expenditure
The Machinery & Electrical Equipment sector spent approximately £290 million in 2013 on environmental
protection measures. Environmental expenditure for this sector is shown in Figure 5.25 for the years 2010 to
2013.
Cost Savings (£M) By-products (£M)
Total Savings and Income Raw
MaterialWater Use
Energy Use
Waste Other Total
2013 32.2 1.4 19.2 2.5 0.0 55.3 36.9 92.2
2012 34.0 1.4 61.2 8.9 0.5 106.1 58.4 164.5
2011 35.6 0.3 9.4 2.7 2.2 50.3 60.8 111.0
2010 0.7 0.6 15.5 11.4 0.0 28.2 5.1 33.3
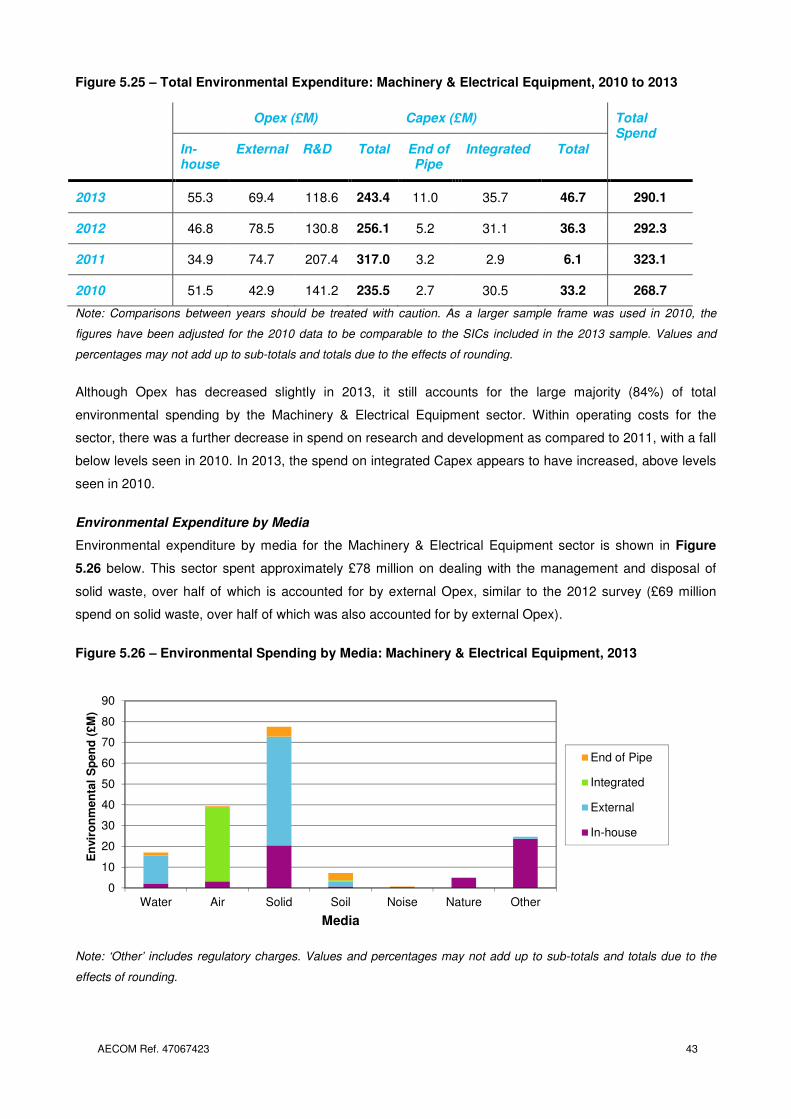
AECOM Ref. 47067423 43
Figure 5.25 – Total Environmental Expenditure: Machinery & Electrical Equipment, 2010 to 2013
Note: Comparisons between years should be treated with caution. As a larger sample frame was used in 2010, the
figures have been adjusted for the 2010 data to be comparable to the SICs included in the 2013 sample. Values and
percentages may not add up to sub-totals and totals due to the effects of rounding.
Although Opex has decreased slightly in 2013, it still accounts for the large majority (84%) of total
environmental spending by the Machinery & Electrical Equipment sector. Within operating costs for the
sector, there was a further decrease in spend on research and development as compared to 2011, with a fall
below levels seen in 2010. In 2013, the spend on integrated Capex appears to have increased, above levels
seen in 2010.
Environmental Expenditure by Media
Environmental expenditure by media for the Machinery & Electrical Equipment sector is shown in Figure
5.26 below. This sector spent approximately £78 million on dealing with the management and disposal of
solid waste, over half of which is accounted for by external Opex, similar to the 2012 survey (£69 million
spend on solid waste, over half of which was also accounted for by external Opex).
Figure 5.26 – Environmental Spending by Media: Machinery & Electrical Equipment, 2013
Note: ‘Other’ includes regulatory charges. Values and percentages may not add up to sub-totals and totals due to the
effects of rounding.
0
10
20
30
40
50
60
70
80
90
Water Air Solid Soil Noise Nature Other
En
vir
on
men
tal
Sp
en
d (
£M
)
Media
End of Pipe
Integrated
External
In-house
Opex (£M) Capex (£M) Total Spend
In-house
External R&D Total End of Pipe
Integrated Total
2013 55.3 69.4 118.6 243.4 11.0 35.7 46.7 290.1
2012 46.8 78.5 130.8 256.1 5.2 31.1 36.3 292.3
2011 34.9 74.7 207.4 317.0 3.2 2.9 6.1 323.1
2010 51.5 42.9 141.2 235.5 2.7 30.5 33.2 268.7
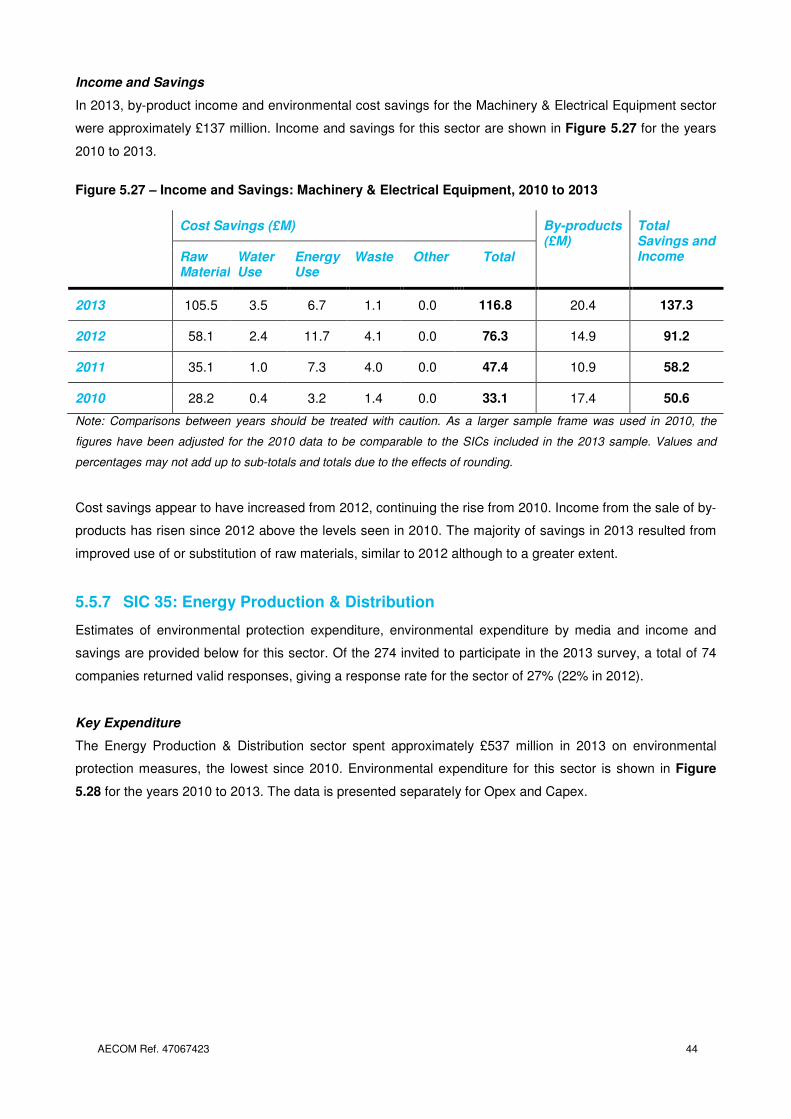
AECOM Ref. 47067423 44
Income and Savings
In 2013, by-product income and environmental cost savings for the Machinery & Electrical Equipment sector
were approximately £137 million. Income and savings for this sector are shown in Figure 5.27 for the years
2010 to 2013.
Figure 5.27 – Income and Savings: Machinery & Electrical Equipment, 2010 to 2013
Note: Comparisons between years should be treated with caution. As a larger sample frame was used in 2010, the
figures have been adjusted for the 2010 data to be comparable to the SICs included in the 2013 sample. Values and
percentages may not add up to sub-totals and totals due to the effects of rounding.
Cost savings appear to have increased from 2012, continuing the rise from 2010. Income from the sale of by-
products has risen since 2012 above the levels seen in 2010. The majority of savings in 2013 resulted from
improved use of or substitution of raw materials, similar to 2012 although to a greater extent.
5.5.7 SIC 35: Energy Production & Distribution
Estimates of environmental protection expenditure, environmental expenditure by media and income and
savings are provided below for this sector. Of the 274 invited to participate in the 2013 survey, a total of 74
companies returned valid responses, giving a response rate for the sector of 27% (22% in 2012).
Key Expenditure
The Energy Production & Distribution sector spent approximately £537 million in 2013 on environmental
protection measures, the lowest since 2010. Environmental expenditure for this sector is shown in Figure
5.28 for the years 2010 to 2013. The data is presented separately for Opex and Capex.
Cost Savings (£M) By-products (£M)
Total Savings and Income Raw
MaterialWater Use
Energy Use
Waste Other Total
2013 105.5 3.5 6.7 1.1 0.0 116.8 20.4 137.3
2012 58.1 2.4 11.7 4.1 0.0 76.3 14.9 91.2
2011 35.1 1.0 7.3 4.0 0.0 47.4 10.9 58.2
2010 28.2 0.4 3.2 1.4 0.0 33.1 17.4 50.6
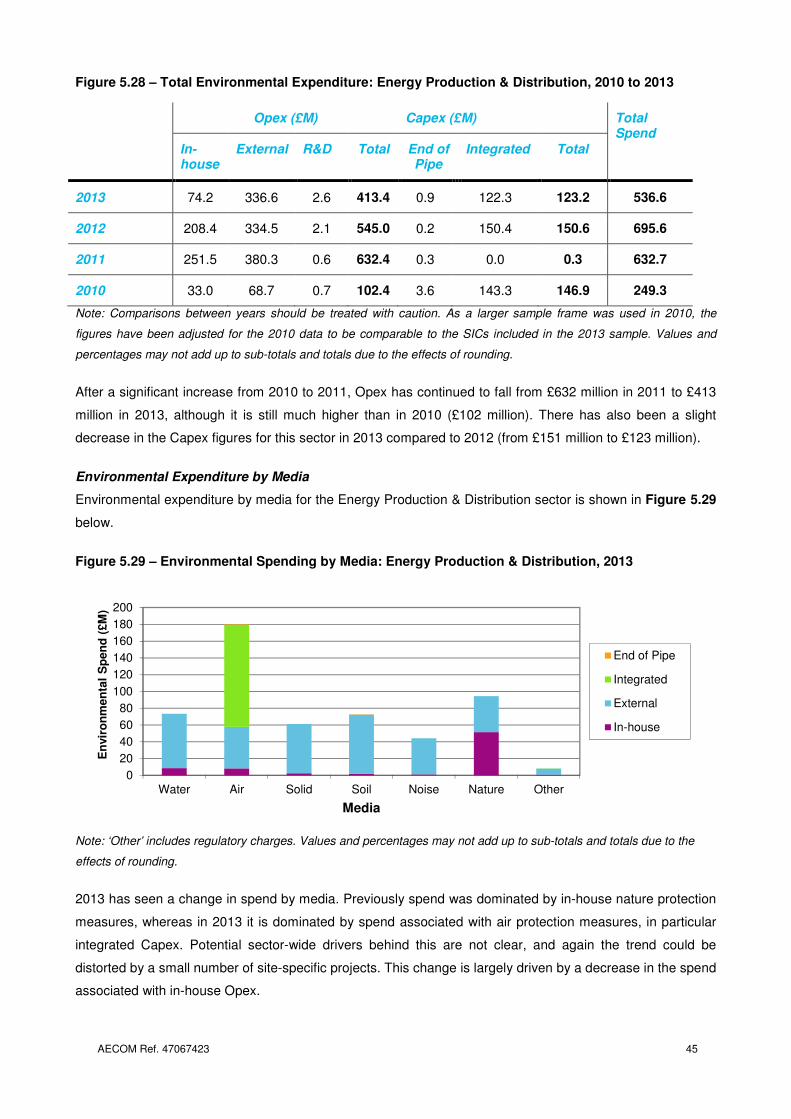
AECOM Ref. 47067423 45
Figure 5.28 – Total Environmental Expenditure: Energy Production & Distribution, 2010 to 2013
Note: Comparisons between years should be treated with caution. As a larger sample frame was used in 2010, the
figures have been adjusted for the 2010 data to be comparable to the SICs included in the 2013 sample. Values and
percentages may not add up to sub-totals and totals due to the effects of rounding.
After a significant increase from 2010 to 2011, Opex has continued to fall from £632 million in 2011 to £413
million in 2013, although it is still much higher than in 2010 (£102 million). There has also been a slight
decrease in the Capex figures for this sector in 2013 compared to 2012 (from £151 million to £123 million).
Environmental Expenditure by Media
Environmental expenditure by media for the Energy Production & Distribution sector is shown in Figure 5.29
below.
Figure 5.29 – Environmental Spending by Media: Energy Production & Distribution, 2013
Note: ‘Other’ includes regulatory charges. Values and percentages may not add up to sub-totals and totals due to the
effects of rounding.
2013 has seen a change in spend by media. Previously spend was dominated by in-house nature protection
measures, whereas in 2013 it is dominated by spend associated with air protection measures, in particular
integrated Capex. Potential sector-wide drivers behind this are not clear, and again the trend could be
distorted by a small number of site-specific projects. This change is largely driven by a decrease in the spend
associated with in-house Opex.
0
20
40
60
80
100
120
140
160
180
200
Water Air Solid Soil Noise Nature Other
En
vir
on
men
tal
Sp
en
d (
£M
)
Media
End of Pipe
Integrated
External
In-house
Opex (£M) Capex (£M) Total Spend
In-house
External R&D Total End of Pipe
Integrated Total
2013 74.2 336.6 2.6 413.4 0.9 122.3 123.2 536.6
2012 208.4 334.5 2.1 545.0 0.2 150.4 150.6 695.6
2011 251.5 380.3 0.6 632.4 0.3 0.0 0.3 632.7
2010 33.0 68.7 0.7 102.4 3.6 143.3 146.9 249.3
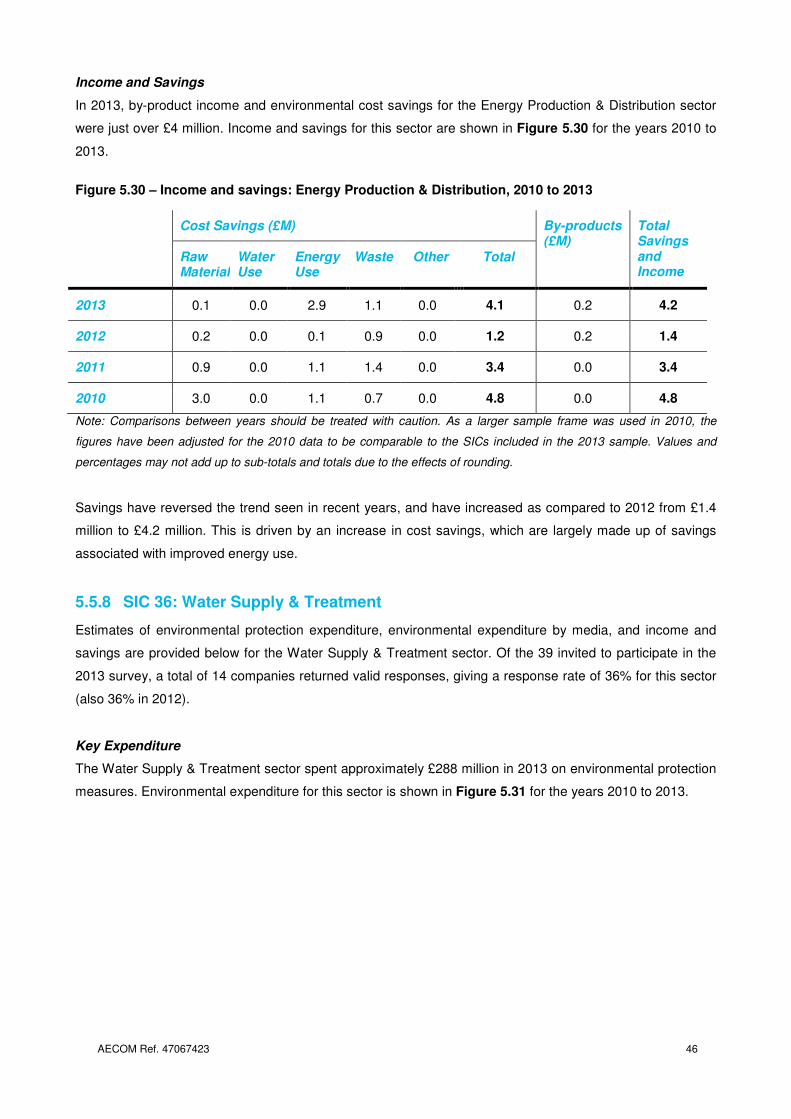
AECOM Ref. 47067423 46
Income and Savings
In 2013, by-product income and environmental cost savings for the Energy Production & Distribution sector
were just over £4 million. Income and savings for this sector are shown in Figure 5.30 for the years 2010 to
2013.
Figure 5.30 – Income and savings: Energy Production & Distribution, 2010 to 2013
Note: Comparisons between years should be treated with caution. As a larger sample frame was used in 2010, the
figures have been adjusted for the 2010 data to be comparable to the SICs included in the 2013 sample. Values and
percentages may not add up to sub-totals and totals due to the effects of rounding.
Savings have reversed the trend seen in recent years, and have increased as compared to 2012 from £1.4
million to £4.2 million. This is driven by an increase in cost savings, which are largely made up of savings
associated with improved energy use.
5.5.8 SIC 36: Water Supply & Treatment
Estimates of environmental protection expenditure, environmental expenditure by media, and income and
savings are provided below for the Water Supply & Treatment sector. Of the 39 invited to participate in the
2013 survey, a total of 14 companies returned valid responses, giving a response rate of 36% for this sector
(also 36% in 2012).
Key Expenditure
The Water Supply & Treatment sector spent approximately £288 million in 2013 on environmental protection
measures. Environmental expenditure for this sector is shown in Figure 5.31 for the years 2010 to 2013.
Cost Savings (£M) By-products (£M)
Total Savings and Income
Raw Material
Water Use
Energy Use
Waste Other Total
2013 0.1 0.0 2.9 1.1 0.0 4.1 0.2 4.2
2012 0.2 0.0 0.1 0.9 0.0 1.2 0.2 1.4
2011 0.9 0.0 1.1 1.4 0.0 3.4 0.0 3.4
2010 3.0 0.0 1.1 0.7 0.0 4.8 0.0 4.8
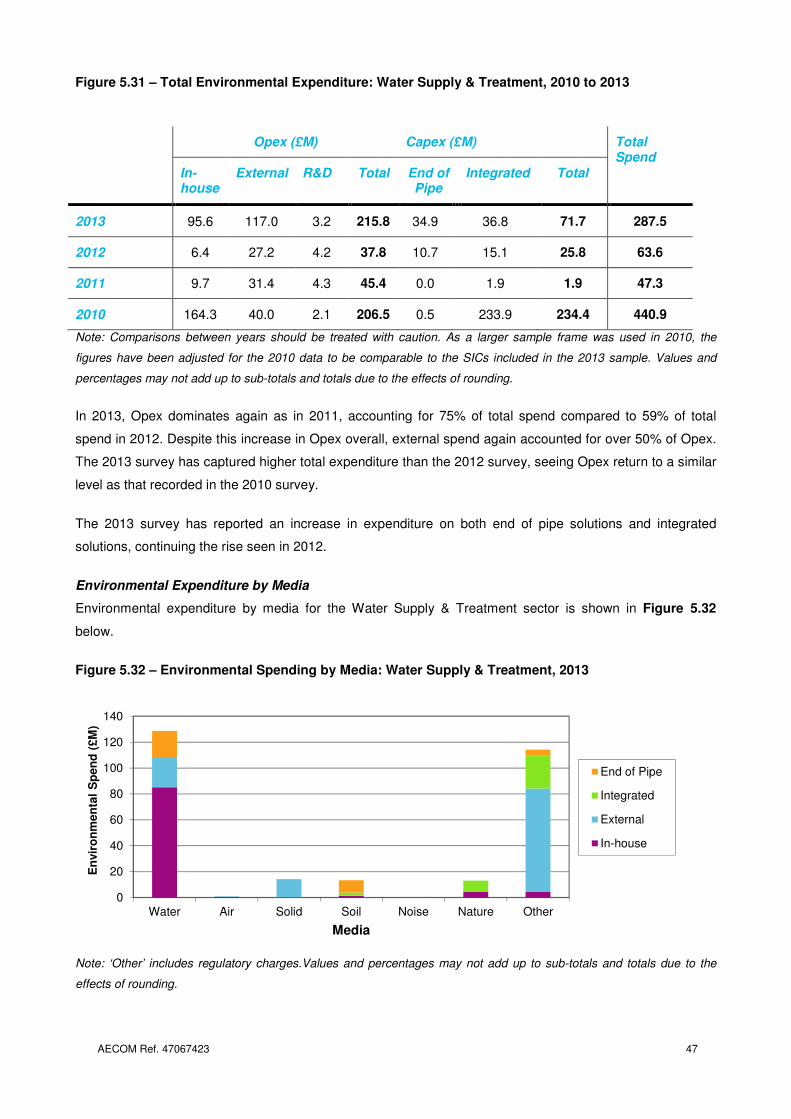
AECOM Ref. 47067423 47
Figure 5.31 – Total Environmental Expenditure: Water Supply & Treatment, 2010 to 2013
Note: Comparisons between years should be treated with caution. As a larger sample frame was used in 2010, the
figures have been adjusted for the 2010 data to be comparable to the SICs included in the 2013 sample. Values and
percentages may not add up to sub-totals and totals due to the effects of rounding.
In 2013, Opex dominates again as in 2011, accounting for 75% of total spend compared to 59% of total
spend in 2012. Despite this increase in Opex overall, external spend again accounted for over 50% of Opex.
The 2013 survey has captured higher total expenditure than the 2012 survey, seeing Opex return to a similar
level as that recorded in the 2010 survey.
The 2013 survey has reported an increase in expenditure on both end of pipe solutions and integrated
solutions, continuing the rise seen in 2012.
Environmental Expenditure by Media
Environmental expenditure by media for the Water Supply & Treatment sector is shown in Figure 5.32
below.
Figure 5.32 – Environmental Spending by Media: Water Supply & Treatment, 2013
Note: ‘Other’ includes regulatory charges.Values and percentages may not add up to sub-totals and totals due to the
effects of rounding.
0
20
40
60
80
100
120
140
Water Air Solid Soil Noise Nature Other
En
vir
on
men
tal
Sp
en
d (
£M
)
Media
End of Pipe
Integrated
External
In-house
Opex (£M) Capex (£M) Total Spend
In-house
External R&D Total End of Pipe
Integrated Total
2013 95.6 117.0 3.2 215.8 34.9 36.8 71.7 287.5
2012 6.4 27.2 4.2 37.8 10.7 15.1 25.8 63.6
2011 9.7 31.4 4.3 45.4 0.0 1.9 1.9 47.3
2010 164.3 40.0 2.1 206.5 0.5 233.9 234.4 440.9
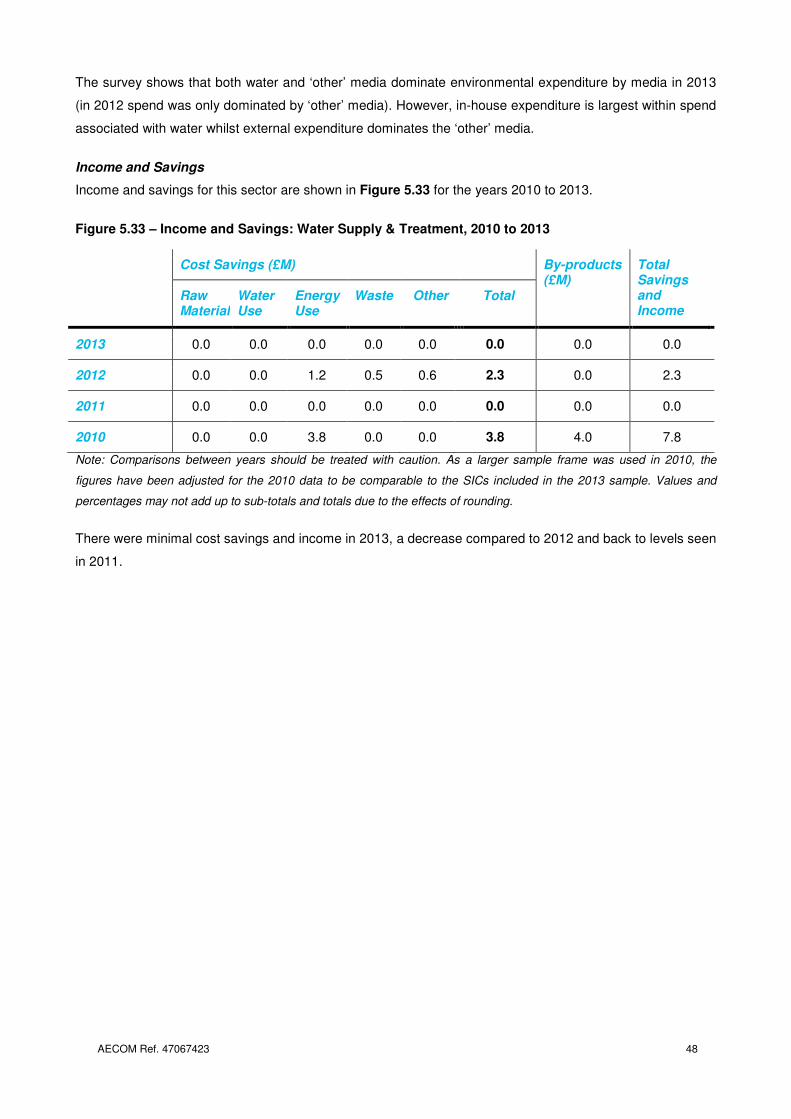
AECOM Ref. 47067423 48
The survey shows that both water and ‘other’ media dominate environmental expenditure by media in 2013
(in 2012 spend was only dominated by ‘other’ media). However, in-house expenditure is largest within spend
associated with water whilst external expenditure dominates the ‘other’ media.
Income and Savings
Income and savings for this sector are shown in Figure 5.33 for the years 2010 to 2013.
Figure 5.33 – Income and Savings: Water Supply & Treatment, 2010 to 2013
Note: Comparisons between years should be treated with caution. As a larger sample frame was used in 2010, the
figures have been adjusted for the 2010 data to be comparable to the SICs included in the 2013 sample. Values and
percentages may not add up to sub-totals and totals due to the effects of rounding.
There were minimal cost savings and income in 2013, a decrease compared to 2012 and back to levels seen
in 2011.
Cost Savings (£M) By-products (£M)
Total Savings and Income
Raw Material
Water Use
Energy Use
Waste Other Total
2013 0.0 0.0 0.0 0.0 0.0 0.0 0.0 0.0
2012 0.0 0.0 1.2 0.5 0.6 2.3 0.0 2.3
2011 0.0 0.0 0.0 0.0 0.0 0.0 0.0 0.0
2010 0.0 0.0 3.8 0.0 0.0 3.8 4.0 7.8
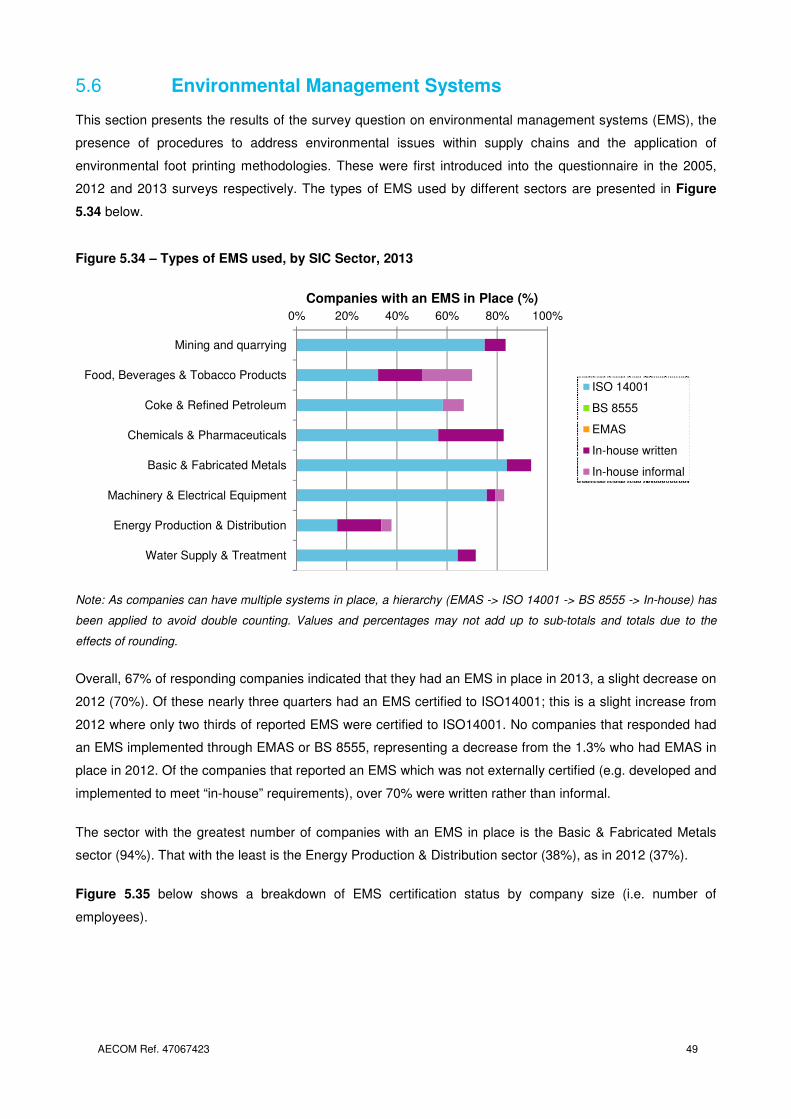
AECOM Ref. 47067423 49
Environmental Management Systems 5.6
This section presents the results of the survey question on environmental management systems (EMS), the
presence of procedures to address environmental issues within supply chains and the application of
environmental foot printing methodologies. These were first introduced into the questionnaire in the 2005,
2012 and 2013 surveys respectively. The types of EMS used by different sectors are presented in Figure
5.34 below.
Figure 5.34 – Types of EMS used, by SIC Sector, 2013
Note: As companies can have multiple systems in place, a hierarchy (EMAS -> ISO 14001 -> BS 8555 -> In-house) has
been applied to avoid double counting. Values and percentages may not add up to sub-totals and totals due to the
effects of rounding.
Overall, 67% of responding companies indicated that they had an EMS in place in 2013, a slight decrease on
2012 (70%). Of these nearly three quarters had an EMS certified to ISO14001; this is a slight increase from
2012 where only two thirds of reported EMS were certified to ISO14001. No companies that responded had
an EMS implemented through EMAS or BS 8555, representing a decrease from the 1.3% who had EMAS in
place in 2012. Of the companies that reported an EMS which was not externally certified (e.g. developed and
implemented to meet “in-house” requirements), over 70% were written rather than informal.
The sector with the greatest number of companies with an EMS in place is the Basic & Fabricated Metals
sector (94%). That with the least is the Energy Production & Distribution sector (38%), as in 2012 (37%).
Figure 5.35 below shows a breakdown of EMS certification status by company size (i.e. number of
employees).
0% 20% 40% 60% 80% 100%
Mining and quarrying
Food, Beverages & Tobacco Products
Coke & Refined Petroleum
Chemicals & Pharmaceuticals
Basic & Fabricated Metals
Machinery & Electrical Equipment
Energy Production & Distribution
Water Supply & Treatment
Companies with an EMS in Place (%)
ISO 14001
BS 8555
EMAS
In-house written
In-house informal
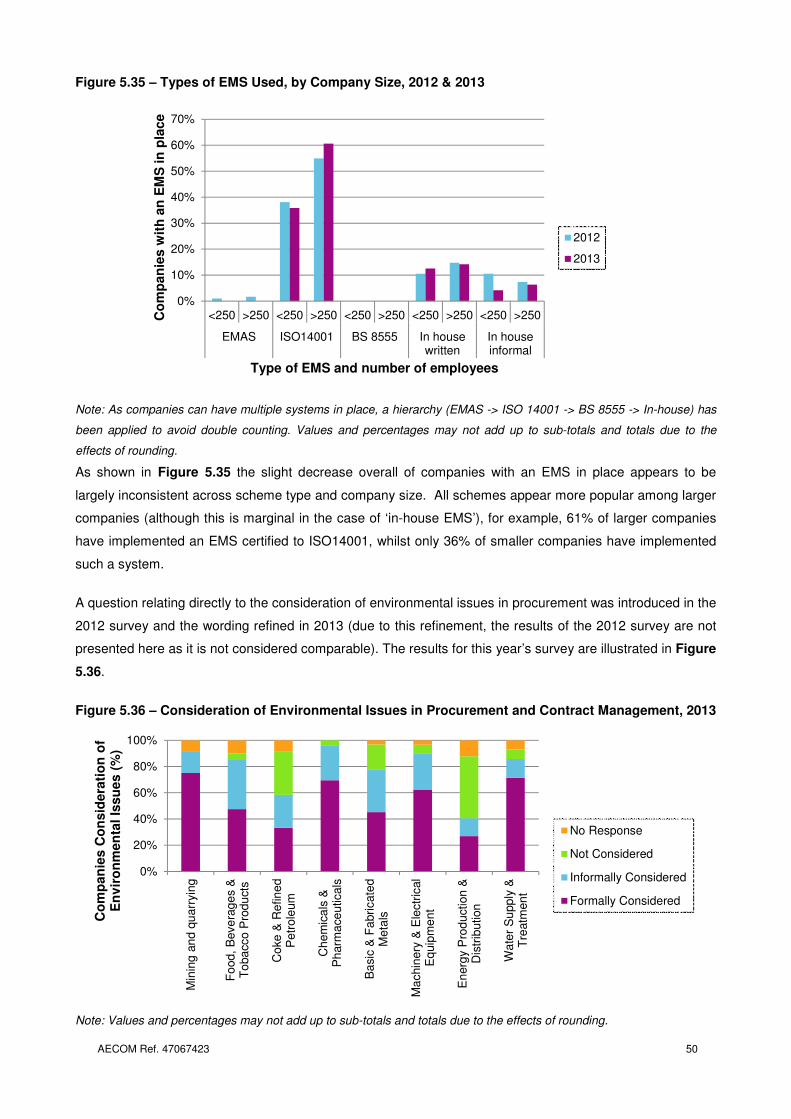
AECOM Ref. 47067423 50
Figure 5.35 – Types of EMS Used, by Company Size, 2012 & 2013
Note: As companies can have multiple systems in place, a hierarchy (EMAS -> ISO 14001 -> BS 8555 -> In-house) has
been applied to avoid double counting. Values and percentages may not add up to sub-totals and totals due to the
effects of rounding.
As shown in Figure 5.35 the slight decrease overall of companies with an EMS in place appears to be
largely inconsistent across scheme type and company size. All schemes appear more popular among larger
companies (although this is marginal in the case of ‘in-house EMS’), for example, 61% of larger companies
have implemented an EMS certified to ISO14001, whilst only 36% of smaller companies have implemented
such a system.
A question relating directly to the consideration of environmental issues in procurement was introduced in the
2012 survey and the wording refined in 2013 (due to this refinement, the results of the 2012 survey are not
presented here as it is not considered comparable). The results for this year’s survey are illustrated in Figure
5.36.
Figure 5.36 – Consideration of Environmental Issues in Procurement and Contract Management, 2013
Note: Values and percentages may not add up to sub-totals and totals due to the effects of rounding.
0%
20%
40%
60%
80%
100%
Min
ing
an
d q
ua
rryin
g
Fo
od
, B
eve
rag
es &
To
ba
cco
Pro
du
cts
Co
ke
& R
efin
ed
Pe
trole
um
Ch
em
ica
ls &
Ph
arm
ace
uticals
Ba
sic
& F
abri
cate
dM
eta
ls
Ma
chin
ery
& E
lectr
ical
Eq
uip
me
nt
En
erg
y P
rod
uction
&D
istr
ibution
Wa
ter
Su
pp
ly &
Tre
atm
en
t
Co
mp
an
ies C
on
sid
era
tio
n o
f E
nv
iro
nm
en
tal
Issu
es (
%)
No Response
Not Considered
Informally Considered
Formally Considered
0%
10%
20%
30%
40%
50%
60%
70%
<250 >250 <250 >250 <250 >250 <250 >250 <250 >250
EMAS ISO14001 BS 8555 In housewritten
In houseinformal
Co
mp
an
ies w
ith
an
EM
S in
pla
ce
Type of EMS and number of employees
2012
2013
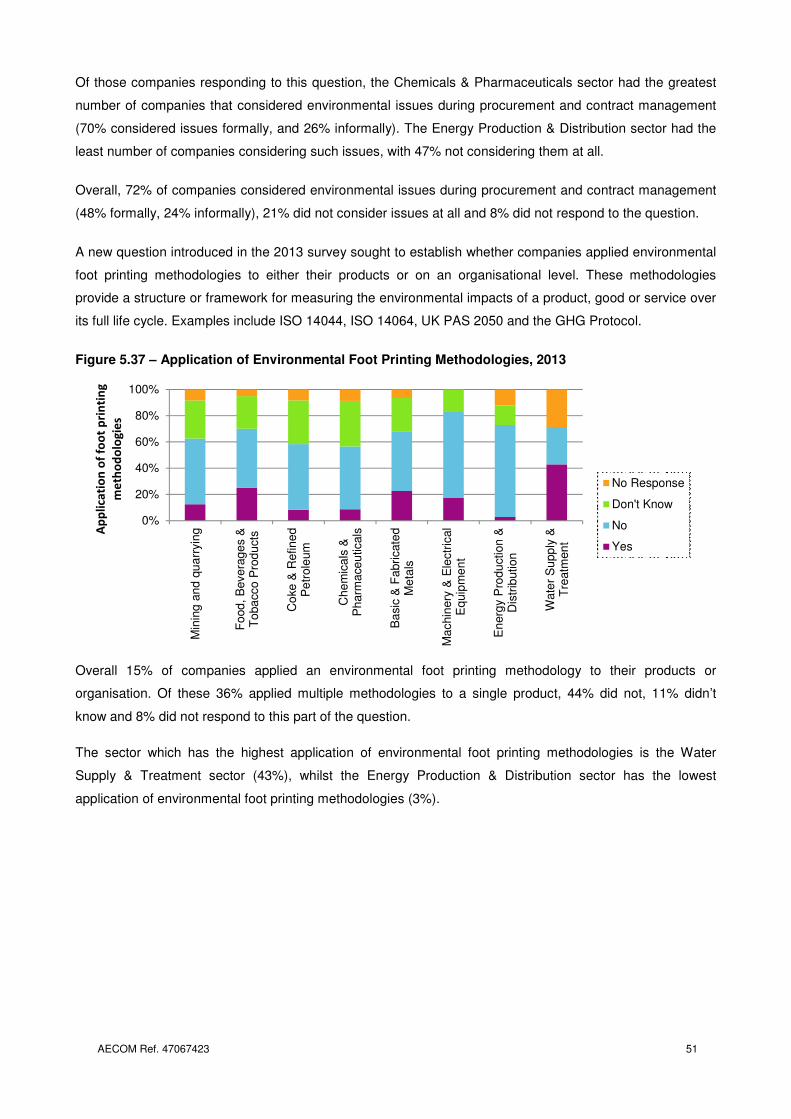
AECOM Ref. 47067423 51
Of those companies responding to this question, the Chemicals & Pharmaceuticals sector had the greatest
number of companies that considered environmental issues during procurement and contract management
(70% considered issues formally, and 26% informally). The Energy Production & Distribution sector had the
least number of companies considering such issues, with 47% not considering them at all.
Overall, 72% of companies considered environmental issues during procurement and contract management
(48% formally, 24% informally), 21% did not consider issues at all and 8% did not respond to the question.
A new question introduced in the 2013 survey sought to establish whether companies applied environmental
foot printing methodologies to either their products or on an organisational level. These methodologies
provide a structure or framework for measuring the environmental impacts of a product, good or service over
its full life cycle. Examples include ISO 14044, ISO 14064, UK PAS 2050 and the GHG Protocol.
Figure 5.37 – Application of Environmental Foot Printing Methodologies, 2013
Overall 15% of companies applied an environmental foot printing methodology to their products or
organisation. Of these 36% applied multiple methodologies to a single product, 44% did not, 11% didn’t
know and 8% did not respond to this part of the question.
The sector which has the highest application of environmental foot printing methodologies is the Water
Supply & Treatment sector (43%), whilst the Energy Production & Distribution sector has the lowest
application of environmental foot printing methodologies (3%).
0%
20%
40%
60%
80%
100%
Min
ing
an
d q
ua
rryin
g
Fo
od
, B
eve
rag
es &
To
ba
cco
Pro
du
cts
Co
ke
& R
efin
ed
Pe
trole
um
Ch
em
ica
ls &
Ph
arm
ace
uticals
Ba
sic
& F
abri
cate
dM
eta
ls
Ma
chin
ery
& E
lectr
ical
Eq
uip
me
nt
En
erg
y P
rod
uction
&D
istr
ibution
Wa
ter
Su
pp
ly &
Tre
atm
en
t
Ap
pli
cati
on
of
foo
t p
rin
tin
g
me
tho
do
log
ies
No Response
Don't Know
No
Yes
AECOM Ref. 47067423 52
Recommendations
06
AECOM Ref. 47067423 53
Recommendations for Future Survey 06
The following section provides recommendations for subsequent surveys based on the experience of the
AECOM project team in conducting the study, and feedback received during the 2013 survey process.
The main sources of feedback were through phone calls made by companies to the Survey Helpdesk, and
phone calls made by the AECOM project team during Top Company follow-up and during data validation.
Useful feedback was also obtained from comments made within returned questionnaires, and letters from
companies to the Helpdesk to indicate non-participation. All such feedback was recorded in the survey
database. Additionally discussions were held and the outcomes of meetings between Defra and AECOM
during the survey period have further raised potential recommendations which are included in the following
section.
Recommendations for future surveys comprise:
Response Rates
• When looking at the response rate over the survey period, there are three clear peaks of activity:
1. In the first couple of weeks after the survey was initially sent out.
2. In the eighth weeks of the survey period following the issue of a reminder letter and the
beginning of the top company reminder calls.
3. Around the twelfth week following further top company calls and the week of the final deadline.
Based on these peaks of return activity and the relatively high response rate for the 2013 survey overall,
it is recommended that a similar strategy concerning the timing of reminder letter dispatch and the timing
and number of Top company calls, is carried forward for future surveys.
• The reason behind the effectiveness of the reminder letters in increasing the response rate appears
twofold:
1. They act as a prompt for companies who may have put the questionnaire aside;
2. They act as a prompt for other companies to contact the Helpdesk, for instance where the
original survey did not reach the most appropriate person. This allowed the Helpdesk to obtain
the correct contact details and provided an opportunity to encourage the company to complete
and return the questionnaire.
• As in the 2012 survey, a reminder postcard was not issued during the 2013 survey. However, this does
not appear to have significantly affected the overall response rate.
Questionnaire Availability
• A digital version of the questionnaire was available via the Defra website for download by participating
companies. As in recent surveys, where companies contacted the Helpdesk for an additional copy of the
questionnaire, they were in the first instance directed to the Defra website and then offered to receive the
survey by email. It is recommended that this approach is carried forward in future surveys, so as to
minimise the number of hard copies re-sent by post.
AECOM Ref. 47067423 54
Survey Benefits
• As in previous years, logistical issues are more likely to be reported by larger companies, such as the
co-ordination of all the data from various sites, whilst smaller companies tend to question the relevance
of the questionnaire to their company and seek assistance with technical questions. Further promotion of
the benefits, including the ‘what’s in it for me’, of collecting such data will improve the response rate both
through encouraging better data collation at a company level and secondly through providing a business
case for completing the questionnaire. This can be done through the initial mail out material and also
through the website text. This is particularly important in the current economic climate when cut backs
are being made across industry.
Survey Sample
• As implemented in recent surveys, the Energy (SIC 35) and Water (SIC 36) sectors were disaggregated
once again for the 2013 survey. Due to the different nature of companies in these groupings, this allowed
more meaningful analysis to be conducted and it is recommended that this is repeated in subsequent
surveys where the number of returns allows.
Validation Process
• Following on from the introduction in the 2012 survey, this year the survey team again undertook
validation calls within five days of the survey response being entered into the database. It is
recommended that, where possible, this is repeated as it enables companies to remember their
responses and minimise the changes in personnel responsible between submitting the survey and being
called for validation checks.
Water Companies
• Whilst the approach for water companies was the same as in the 2012 survey, whereby they received a
tailored covering letter and a flyer explaining how to complete the survey, a high proportion of companies
were surprised upon receiving validation calls that they should have completed the survey for just the
supply side of the business. Many had not seen the flyer or covering letter as it had been passed through
the company and been lost on the way. It is recommended that this is made clearer in future surveys,
either through a tailored questionnaire or through attaching the flyer to the questionnaire.
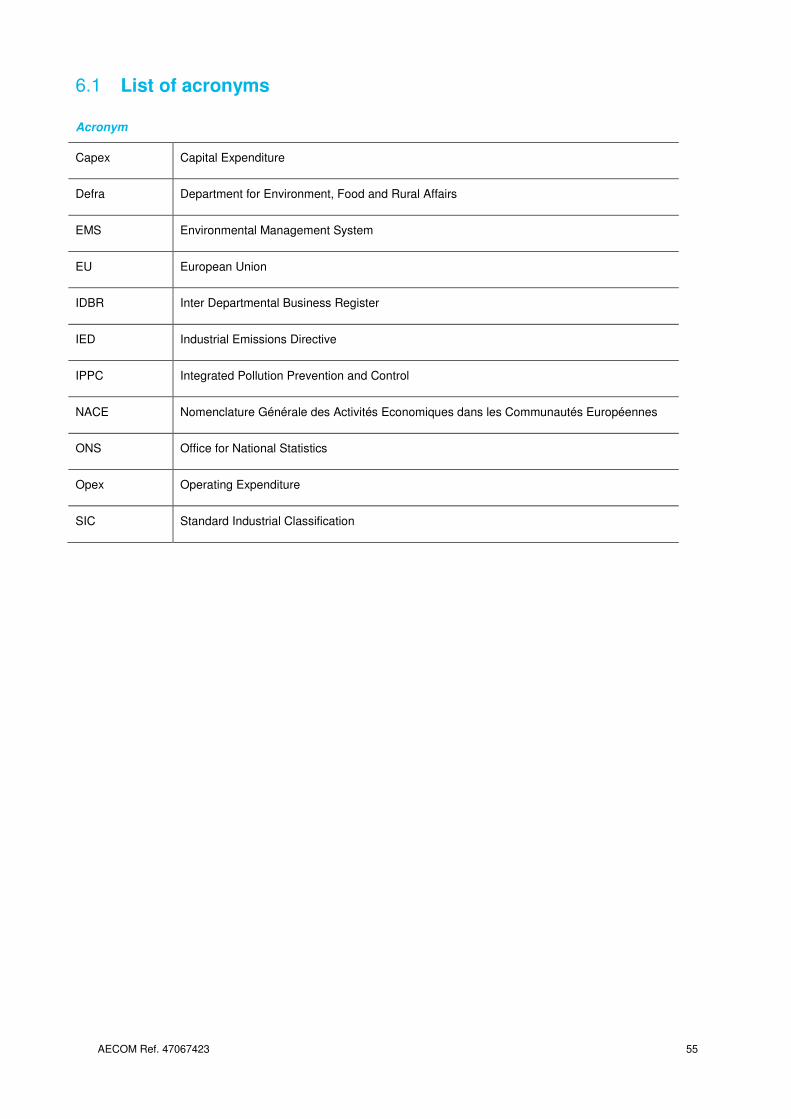
AECOM Ref. 47067423 55
List of acronyms 6.1
Acronym
Capex Capital Expenditure
Defra Department for Environment, Food and Rural Affairs
EMS Environmental Management System
EU European Union
IDBR Inter Departmental Business Register
IED Industrial Emissions Directive
IPPC Integrated Pollution Prevention and Control
NACE Nomenclature Générale des Activités Economiques dans les Communautés Européennes
ONS Office for National Statistics
Opex Operating Expenditure
SIC Standard Industrial Classification
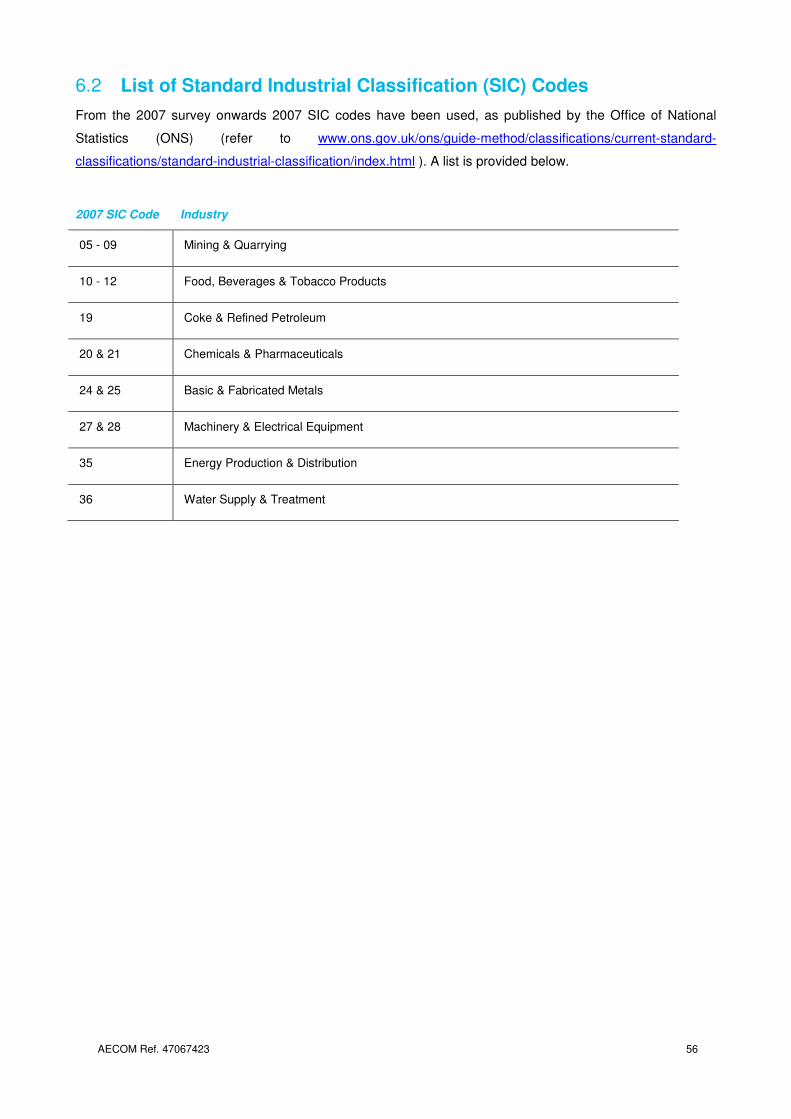
AECOM Ref. 47067423 56
List of Standard Industrial Classification (SIC) Codes 6.2
From the 2007 survey onwards 2007 SIC codes have been used, as published by the Office of National
Statistics (ONS) (refer to www.ons.gov.uk/ons/guide-method/classifications/current-standard-
classifications/standard-industrial-classification/index.html ). A list is provided below.
2007 SIC Code Industry
05 - 09 Mining & Quarrying
10 - 12 Food, Beverages & Tobacco Products
19 Coke & Refined Petroleum
20 & 21 Chemicals & Pharmaceuticals
24 & 25 Basic & Fabricated Metals
27 & 28 Machinery & Electrical Equipment
35 Energy Production & Distribution
36 Water Supply & Treatment
AECOM Ref. 47067423 57
ABOUT AECOM In a complex and unpredictable world, where growing
demands have to be met with finite resources, AECOM
brings experience gained from improving quality of life
in hundreds of places.
We bring together economists, planners, engineers,
designers and project managers to work on projects at
every scale. We engineer energy efficient buildings and
we build new links between cities. We design new
communities and regenerate existing ones. We are the
first whole environments business, going beyond
buildings and infrastructure.
Our Europe teams form an important part of our
worldwide network of nearly 100,000 staff in 150
countries. Through 360 ingenuity, we develop
pioneering solutions that help our clients to
see further and go further.
www.aecom.com
Follow us on Twitter: @aecom