Environmental Protection Agency Pt. 430, App. A - U.S. Government
40
207 Environmental Protection Agency Pt. 430, App. A SUBPART L—Continued [PSNS for non-integrated mills where tissue papers are produced from purchased pulp] Pollutant or pollutant property Maximum for any 1 day Milligrams/liter (mg/l) Kg/kkg (or pounds per 1,000 lb) of product a y = wastewater discharged in kgal per ton of product. a The following equivalent mass limitations are provided as guidance in cases when POTWs find it necessary to impose mass effluent limitations. SUBPART L [PSNS for non-integrated mills where filter and non-woven papers are produced from purchased pulp] Pollutant or pollutant property Maximum for any 1 day Milligrams/liter (mg/l) Kg/kkg (or pounds per 1,000 lb) of product a Pentachlorophenol ......................................................................................... (0.040)(47.5)/y ................................... 0.0080 Trichlorophenol .............................................................................................. (0.013)(47.5)/y ................................... 0.0025 y = wastewater discharged in kgal per ton of product. a The following equivalent mass limitations are provided as guidance in cases when POTWs find it necessary to impose mass effluent limitations. SUBPART L [PSNS for non-integrated mills where paperboard is produced from purchased pulp] Pollutant or pollutant property Maximum for any 1 day Milligrams/liter (mg/l) Kg/kkg (or pounds per 1,000 lb) of product a Pentachlorophenol ....................................................................................... (0.037)(11.2)/y ................................... 0.0017 Trichlorophenol ............................................................................................ (0.012)(11.2)/y ................................... 0.00054 y = wastewater discharged in kgal per ton of product. a The following equivalent mass limitations are provided as guidance in cases when POTWs find it necessary to impose mass effluent limitations. APPENDIX A TO PART 430—METHODS 1650 AND 1653 METHOD 1650—ADSORBABLE ORGANIC HALIDES BY ADSORPTION AND COULOMETRIC TITRATION 1.0 Scope and Application 1.1 This method is for determination of adsorbable organic halides (AOX) associated with the Clean Water Act; the Resource Con- servation and Recovery Act; the Comprehen- sive Environmental Response, Compensa- tion, and Liability Act; and other organic halides amenable to combustion and coulometric titration. The method is de- signed to meet the survey and monitoring re- quirements of the Environmental Protection Agency (EPA). 1.2 The method is applicable to the deter- mination of AOX in water and wastewater. This method is a combination of several ex- isting methods for organic halide measure- ments (References 1 through 7). 1.3 The method can be used to measure organically-bound halides (chlorine, bro- mine, iodine) present in dissolved or sus- pended form. Results are reported as organic chloride (Cl ¥ ). The detection limit of the method is usually dependent on interferences rather than instrumental limitations. A method detection limit (MDL; Reference 8) of 6.6 μg/L, and a minimum level (ML; Sec- tion 18) of 20 μg/L, can be achieved with no interferences present. 1.4 This method is for use by or under the supervision of analysts experienced in the use of a combustion/micro-coulometer. Each laboratory that uses this method must dem- onstrate the ability to generate acceptable results using the procedures described in Section 9.2. 1.5 Any modification of the method be- yond those expressly permitted (Section 9.1.2) is subject to application and approval of an alternate test procedure under 40 CFR 136.4 and 136.5. VerDate Mar<15>2010 09:46 Aug 24, 2012 Jkt 226176 PO 00000 Frm 00217 Fmt 8010 Sfmt 8002 Y:\SGML\226176.XXX 226176 pmangrum on DSK3VPTVN1PROD with CFR
Transcript of Environmental Protection Agency Pt. 430, App. A - U.S. Government

207
Environmental Protection Agency Pt. 430, App. A
SUBPART L—Continued [PSNS for non-integrated mills where tissue papers are produced from purchased pulp]
Pollutant or pollutant property
Maximum for any 1 day
Milligrams/liter (mg/l)
Kg/kkg (or pounds per 1,000 lb) of
product a
y = wastewater discharged in kgal per ton of product.
a The following equivalent mass limitations are provided as guidance in cases when POTWs find it necessary to impose mass effluent limitations.
SUBPART L [PSNS for non-integrated mills where filter and non-woven papers are produced from purchased pulp]
Pollutant or pollutant property
Maximum for any 1 day
Milligrams/liter (mg/l)
Kg/kkg (or pounds per 1,000 lb) of
product a
Pentachlorophenol ......................................................................................... (0.040)(47.5)/y ................................... 0.0080 Trichlorophenol .............................................................................................. (0.013)(47.5)/y ................................... 0.0025 y = wastewater discharged in kgal per ton of product.
a The following equivalent mass limitations are provided as guidance in cases when POTWs find it necessary to impose mass effluent limitations.
SUBPART L [PSNS for non-integrated mills where paperboard is produced from purchased pulp]
Pollutant or pollutant property
Maximum for any 1 day
Milligrams/liter (mg/l)
Kg/kkg (or pounds per 1,000 lb) of
product a
Pentachlorophenol ....................................................................................... (0.037)(11.2)/y ................................... 0 .0017 Trichlorophenol ............................................................................................ (0.012)(11.2)/y ................................... 0 .00054 y = wastewater discharged in kgal per ton of product.
a The following equivalent mass limitations are provided as guidance in cases when POTWs find it necessary to impose mass effluent limitations.
APPENDIX A TO PART 430—METHODS 1650 AND 1653
METHOD 1650—ADSORBABLE ORGANIC HALIDES BY ADSORPTION AND COULOMETRIC TITRATION
1.0 Scope and Application
1.1 This method is for determination of adsorbable organic halides (AOX) associated with the Clean Water Act; the Resource Con-servation and Recovery Act; the Comprehen-sive Environmental Response, Compensa-tion, and Liability Act; and other organic halides amenable to combustion and coulometric titration. The method is de-signed to meet the survey and monitoring re-quirements of the Environmental Protection Agency (EPA).
1.2 The method is applicable to the deter-mination of AOX in water and wastewater. This method is a combination of several ex-isting methods for organic halide measure-ments (References 1 through 7).
1.3 The method can be used to measure organically-bound halides (chlorine, bro-mine, iodine) present in dissolved or sus-pended form. Results are reported as organic chloride (Cl¥). The detection limit of the method is usually dependent on interferences rather than instrumental limitations. A method detection limit (MDL; Reference 8) of 6.6 μg/L, and a minimum level (ML; Sec-tion 18) of 20 μg/L, can be achieved with no interferences present.
1.4 This method is for use by or under the supervision of analysts experienced in the use of a combustion/micro-coulometer. Each laboratory that uses this method must dem-onstrate the ability to generate acceptable results using the procedures described in Section 9.2.
1.5 Any modification of the method be-yond those expressly permitted (Section 9.1.2) is subject to application and approval of an alternate test procedure under 40 CFR 136.4 and 136.5.
VerDate Mar<15>2010 09:46 Aug 24, 2012 Jkt 226176 PO 00000 Frm 00217 Fmt 8010 Sfmt 8002 Y:\SGML\226176.XXX 226176pman
grum
on
DS
K3V
PT
VN
1PR
OD
with
CF
R

208
40 CFR Ch. I (7–1–12 Edition) Pt. 430, App. A
2.0 Summary of Method
2.1 Sample preservation: Residual chlo-rine that may be present is removed by the addition of sodium thiosulfate. Samples are adjusted to a pH < 2 and maintained at 0 to 4 °C until analysis.
2.2 Sample analysis: Organic halide in water is determined by adsorption onto granular activated carbon (GAC), washing the adsorbed sample and GAC to remove in-organic halide, combustion of the sample and GAC to form the hydrogen halide, and titra-tion of the hydrogen halide with a micro- coulometer, as shown in Figure 1.
2.3 Micro-coulometer. 2.3.1 This detector operates by maintain-
ing a constant silver-ion concentration in a titration cell. An electric potential is ap-plied to a solid silver electrode to produce silver ions in the cell. As hydrogen halide produced from the combustion of organic ha-lide enters the cell, it is partitioned into an acetic acid electrolyte where it precipitates as silver halide. The current produced is in-tegrated over the combustion period. The electric charge is proportional to the number of moles of halogen captured in the cell (Ref-erence 6).
2.3.2 The mass concentration of organic halides is reported as an equivalent con-centration of organically bound chloride (Cl¥).
3.0 Definitions
3.1 Adsorbable organic halides is defined as the analyte measured by this method. The nature of the organo-halides and the pres-ence of semi-extractable material will influ-ence the amount measured and interpreta-tion of results.
3.2 Definitions for terms used in this method are given in the glossary at the end of the method (Section 18).
4.0 Interferences
4.1 Solvents, reagents, glassware, and other sample processing hardware may yield elevated readings from the micro-coulom-eter. All materials used in the analysis shall be demonstrated to be free from inter-ferences under the conditions of analysis by running method blanks initially and with each sample batch (samples started through the adsorption process in a given eight-hour shift, to a maximum of 20 samples). Specific selection of reagents and purification of sol-vents may be required.
4.2 Glassware is cleaned by detergent washing in hot water, rinsing with tap water and distilled water, capping with aluminum foil, and baking at 450 °C for at least one hour. For some glassware, immersion in a chromate cleaning solution prior to deter-gent washing may be required. If blanks from glassware without cleaning or with fewer cleaning steps show no detectable or-
ganic halide, the cleaning steps that do not eliminate organic halide may be omitted.
4.3 Most often, contamination results from methylene chloride vapors in labora-tories that perform organic extractions. Heating, ventilating, and air conditioning systems that are shared between the extrac-tion laboratory and the laboratory in which organic halide measurements are performed transfer the methylene chloride vapors to the air in the organic halide laboratory. Ex-posure of the activated carbon used in the analysis results in contamination. Separate air handling systems, charcoal filters, and glove boxes can be used to minimize this ex-posure.
4.4 Activated carbon. 4.4.1 The purity of each lot of activated
carbon must be verified before each use by measuring the adsorption capacity and the background level of halogen (Section 9.5). The stock of activated carbon should be stored in its granular form in a glass con-tainer that is capped tightly. Protect carbon at all times from sources of halogen vapors.
4.4.2 Inorganic substances such as chlo-ride, chlorite, bromide, and iodide will ad-sorb on activated carbon to an extent de-pendent on their original concentration in the aqueous solution and the volume of sam-ple adsorbed. Treating the activated carbon with a solution of nitrate causes competitive desorption of inorganic halide species. How-ever, if the inorganic halide concentration is greater than 2,000 times the organic halide concentration, artificially high results may be obtained.
4.4.3 Halogenated organic compounds that are weakly adsorbed on activated carbon are only partially recovered from the sample. These include certain alcohols and acids such as chloroethanol and chloroacetic acid that can be removed from activated carbon by the nitrate wash.
4.5 Polyethylene gloves should be worn when handling equipment surfaces in contact with the sample to prevent transfer of con-taminants that may be present on the hands.
5.0 Safety
5.1 The toxicity or carcinogenicity of each reagent used in this method has not been precisely determined; however, each chemical substance should be treated as a potential health hazard. Exposure to these substances should be reduced to the lowest possible level. The laboratory is responsible for maintaining a current awareness file of OSHA regulations regarding the safe han-dling of the chemicals specified in this meth-od. A reference file of material safety data sheets (MSDSs) should be made available to all personnel involved in the chemical anal-ysis. Additional information on laboratory safety can be found in References 9 through 11.
VerDate Mar<15>2010 09:46 Aug 24, 2012 Jkt 226176 PO 00000 Frm 00218 Fmt 8010 Sfmt 8002 Y:\SGML\226176.XXX 226176pman
grum
on
DS
K3V
PT
VN
1PR
OD
with
CF
R
209
Environmental Protection Agency Pt. 430, App. A
5.2 This method employs strong acids. Ap-propriate clothing, gloves, and eye protec-tion should be worn when handling these substances.
5.3 Field samples may contain high con-centrations of toxic volatile compounds. Sample containers should be opened in a hood and handled with gloves that will pre-vent exposure.
6.0 Equipment and Supplies
NOTE: Brand names, suppliers, and part numbers are for illustrative purposes only. No endorsement is implied. Equivalent per-formance may be achieved using apparatus and materials other than those specified here, but demonstration of equivalent per-formance that meets the requirements of this method is the responsibility of the lab-oratory.
6.1 Sampling equipment. 6.1.1 Bottles: 100- to 4000-mL, amber glass,
sufficient for all testing (Section 8.2). Deter-gent water wash, chromic acid rinse, rinse with tap and distilled water, cover with alu-minum foil, and heat to 450 °C for at least one hour before use.
6.1.2 PTFE liner: Cleaned as above and baked at 100 to 200 °C for at least one hour.
6.1.3 Bottles and liners must be lot cer-tified to be free of organic halide by running blanks according to this method.
6.2 Scoop for granular activated carbon (GAC): Capable of precisely measuring 40 mg (±5 mg) GAC (Dohrmann Measuring Cup 521– 021, or equivalent).
6.3 Batch adsorption and filtration sys-tem.
6.3.1 Adsorption system: Rotary shaker, wrist action shaker, ultrasonic system, or other system for assuring thorough contact of sample with activated carbon. Systems different from the one described below must be demonstrated to meet the performance re-quirements in Section 9 of this method.
6.3.1.1 Erlenmeyer flasks: 250- to 1500-mL with ground-glass stopper, for use with ro-tary shaker.
6.3.1.2 Shake table: Sybron Thermolyne Model LE ‘‘Big Bill’’ rotator/shaker, or equivalent.
6.3.1.3 Rack attached to shake table to permit agitation of 16 to 25 samples simulta-neously.
6.3.2 Filtration system (Figure 2). 6.3.2.1 Vacuum filter holder: Glass, with
fritted-glass support (Fisher Model 09–753E, or equivalent).
6.3.2.2 Polycarbonate filter: 0.40 to 0.45 micron, 25-mm diameter (Micro Separations Inc, Model K04CP02500, or equivalent).
6.3.2.3 Filter forceps: Fisher Model 09–753– 50, or equivalent, for handling filters. Two forceps may better aid in handling filters. Clean by washing with detergent and water,
rinsing with tap and deionized water, and air drying on aluminum foil.
6.3.2.4 Vacuum flask: 500- to 1500-mL (Fisher 10–1800, or equivalent).
6.3.2.5 Vacuum Source: A pressure/vacuum pump, rotary vacuum pump, or other vacu-um source capable of providing at least 610 mm (24 in.) Hg vacuum at 30 L/min free air displacement.
6.3.2.6 Stopper and tubing to mate the fil-ter holder to the flask and the flask to the pump.
6.3.2.7 Polyethylene gloves: (Fisher 11–394– 110–B, or equivalent).
6.4 Column adsorption system. 6.4.1 Adsorption module: Dohrmann AD–2,
Mitsubishi TXA–2, or equivalent with pres-surized sample and nitrate-wash reservoirs, adsorption columns, column housings, gas and gas pressure regulators, and receiving vessels. For each sample reservoir, there are two adsorption columns connected in series. A small steel funnel for filling the columns and a rod for pushing out the carbon are also required. A schematic of the column adsorp-tion system is shown in Figure 3.
6.4.2 Adsorption columns: Pyrex, 5 ±0.2 cm long × 2 mm ID, to hold 40 mg of granular ac-tivated carbon (GAC).
6.4.3 Cerafelt: Johns-Manville, or equiva-lent, formed into plugs using stainless steel borer (2 mm ID) with ejection rod (available from Dohrmann or Mitsubishi) to hold 40 mg of granular activated carbon (GAC). Caution: Handle Cerafelt with gloves.
6.4.4 Column holders: To support adsorp-tion columns.
6.5 Combustion/micro-coulometer system: Commercially available as a single unit or assembled from parts. At the time of the writing of this method, organic halide units were commercially available from the Dohrmann Division of Rosemount Analyt-ical, Santa Clara, California; Euroglas BV, Delft, the Netherlands; and Mitsubishi Chemical Industries, Ltd., Tokyo, Japan.
6.5.1 Combustion system: Older systems may not have all of the features shown in Figure 4. These older systems may be used provided the performance requirements (Sec-tion 9) of this method are met.
6.5.1.1 Combustion tube: Quartz, capable of being heated to 800 to 1000 °C and accom-modating a boat sampler. The tube must contain an air lock for introduction of a combustion boat, connections for purge and combustion gas, and connection to the micro-coulometer cell.
6.5.1.2 Tube furnace capable of controlling combustion tube in the range of 800 to 1000 °C.
6.5.1.3 Boat sampler: Capable of holding 35 to 45 mg of activated carbon and a polycarbonate filter, and fitting into the combustion tube (Section 6.5.1.1). Some man-ufacturers offer an enlarged boat and com-bustion tube for this purpose. Under a time-
VerDate Mar<15>2010 09:46 Aug 24, 2012 Jkt 226176 PO 00000 Frm 00219 Fmt 8010 Sfmt 8002 Y:\SGML\226176.XXX 226176pman
grum
on
DS
K3V
PT
VN
1PR
OD
with
CF
R

210
40 CFR Ch. I (7–1–12 Edition) Pt. 430, App. A
controlled sequence, the boat is first moved into an evaporation zone where water and other volatiles are evaporated, and then into the combustion zone where the carbon and all other organic material in the boat are burned in a flowing oxygen stream. The evolved gases are transported by a non-reac-tive carrier gas to the micro-coulometer cell.
6.5.1.4 Motor driven boat sampler: Capable of advancing the combustion boat into the furnace in a reproducible time sequence. A suggested time sequence is as follows:
A. Establish initial gas flow rates: 160 mL/ min CO2; 40 mL/min O2.
B. Sequence start. C. Hold boat in hatch for five seconds to
allow integration for baseline subtraction. D. Advance boat into vaporization zone. E. Hold boat in vaporization zone for 110
seconds. F. Establish gas flow rates for combustion:
200 mL/min O2; 0 mL/min CO2; advance boat into pyrolysis zone (800 °C).
G. Hold boat in pyrolysis zone for six min-utes.
H. Return gas flow rates to initial values; retract boat into hatch to cool and to allow remaining HX to be swept into detector (ap-proximately two minutes).
I. Stop integration at 10 minutes after se-quence start.
NOTE: If the signal from the detector does not return to baseline, it may be necessary to extend the pyrolysis time. The sequence above may need to be optimized for each in-strument.
6.5.1.5 Absorber: Containing sulfuric acid to dry the gas stream after combustion to prevent backflush of electrolyte is highly recommended.
6.5.2 Micro-coulometer system: Capable of detecting the equivalent of 0.2 μg of Cl¥ at a signal-to-noise ratio of 2; capable of detect-ing the equivalent of 1 μg of Cl¥ with a rel-ative standard deviation less than 10%, and capable of accumulating a minimum of the equivalent of 500 μg of Cl¥ before a change of electrolyte is required.
6.5.2.1 Micro-coulometer cell: The three cell designs presently in use are shown in Figure 1. Cell operation is described in Sec-tion 2.
6.5.2.2 Cell controller: Electronics capable of measuring the small currents generated in the cell and accumulating and displaying the charge produced by hydrogen halides enter-ing the cell. A strip-chart recorder is desir-able for display of accumulated charge.
6.6 Miscellaneous glassware: nominal sizes are specified below; other sizes may be used, as necessary.
6.6.1 Volumetric flasks: 5-, 10-, 25-, 50-, 100- , and 1000-mL.
6.6.2 Beakers: 100-, 500-, and 1000-mL. 6.6.3 Volumetric pipets: 1- and 10-mL with
pipet bulbs.
6.6.4 Volumetric micro-pipets: 10-, 20-, 50- , 100-, 200-, and 500-μL with pipet control (Hamilton 0010, or equivalent).
6.6.5 Graduated cylinders: 10-, 100-, and 1000-mL.
6.7 Micro-syringes: 10-, 50-, and 100-μL. 6.8 Balances. 6.8.1 Top-loading, capable of weighing 0.1
g. 6.8.2 Analytical, capable of weighing 0.1
mg. 6.9 pH meter. 6.10 Wash bottles: 500- to 1000-mL, PTFE
or polyethylene. 6.11 Strip-chart recorder: suggested but
not required—useful for determining end of integration (Section 11.4.2).
7.0 Reagents and Standards
7.1 Granular activated carbon (GAC): 75 to 150 μm (100 to 200 mesh); (Dohrmann, Mitsubishi, Carbon Plus, or equivalent), with chlorine content less than 1 μg Cl¥ per scoop (< 25 μg Cl¥ per gram), adsorption capacity greater than 1000 μg Cl¥ (as 2,4,6- trichlorophenol) per scoop (≤25,000 μg/g), in-organic halide retention of less than 1 μg Cl¥
per scoop in the presence of 10 mg of inor-ganic halide (< 20 μg Cl¥ per gram in the presence of 2500 mg of inorganic halide), and that meets the other test criteria in this method.
7.2 Reagent water: Water in which or-ganic halide is not detected by this method.
7.2.1 Preparation: Reagent water may be generated by:
7.2.1.1 Activated carbon: Pass tap water through a carbon bed (Calgon Filtrasorb-300, or equivalent).
7.2.1.2 Water purifier: Pass tap water through a purifier (Millipore Super Q, or equivalent).
7.2.2 pH adjustment: Adjust the pH of the reagent water to < 2 with nitric acid for all reagent water used in this method, except for the acetic acid solution (Section 7.13).
7.3 Nitric acid (HNO3): Concentrated, ana-lytical grade.
7.4 Sodium chloride (NaCl) solution (100 μg/mL of Cl¥): Dissolve 0.165g NaCl in 1000 mL reagent water. This solution is used for cell testing and for the inorganic halide re-jection test.
7.5 Ammonium chloride (NH4Cl) solution (100 μg/mL of Cl¥): Dissolve 0.1509 g NH4Cl in 1000 mL reagent water.
7.6 Sulfuric acid: Reagent grade (specific gravity 1.84).
7.7 Oxygen: 99.9% purity. 7.8 Carbon Dioxide: 99.9% purity. 7.9 Nitrate stock solution: In a 1000-mL
volumetric flask, dissolve 17g of NaNO3 in approximately 100 mL of reagent water, add 1.4 mL nitric acid (Section 7.3) and dilute to the mark with reagent water.
VerDate Mar<15>2010 09:46 Aug 24, 2012 Jkt 226176 PO 00000 Frm 00220 Fmt 8010 Sfmt 8002 Y:\SGML\226176.XXX 226176pman
grum
on
DS
K3V
PT
VN
1PR
OD
with
CF
R

211
Environmental Protection Agency Pt. 430, App. A
7.10 Nitrate wash solution: Dilute 50 mL of nitrate stock solution (Section 7.9) to 1000 mL with reagent water.
7.11 Sodium thiosulfate (Na2S2O3) solution (1 N): Weigh 79 grams of Na2S2O3 in a 1-L vol-umetric flask and dilute to the mark with reagent water.
7.12 Trichlorophenol solutions.
NOTE: The calibration solutions in this sec-tion employ 100-mL volumes. For determina-tions requiring a larger or smaller volume, increase or decrease the size of the volu-metric flasks commensurately. For example, if a 1-L sample is to be analyzed, use 1000-mL flasks (Sections 7.12.3.1 and 7.12.4) and 10 times the volume of reagent water (Sections 7.12.3.1 and 7.12.4). The volume of stock solu-tion added to the calibration solutions and precision and recovery (PAR) test solution remain as specified (Sections 7.12.3.2 and 7.12.4) so that the same amount of chloride is delivered to the coulometric cell regardless of the volume of the calibration and PAR so-lutions.
7.12.1 Methanol: HPLC grade. 7.12.2 Trichlorophenol stock solution (1.0
mg/mL of Cl¥): Dissolve 0.186 g of 2,4,6- trichlorophenol in 100 mL of halide-free methanol.
7.12.3 Trichlorophenol calibration solu-tions.
7.12.3.1 Place approximately 90 mL of rea-gent water in each of five 100-mL volumetric flasks.
7.12.3.2 Using a calibrated micro-syringe or micro-pipets, add 2, 5, 10, 30, and 80 μL of the trichlorophenol stock solution (Section 7.12.2) to the volumetric flasks and dilute each to the mark with reagent water to produce calibration solutions of 2, 5, 10, 30, and 80 μg Cl¥ per 100 mL of solution (20, 50, 100, 300, and 800 μg/L).
7.12.3.3 Some instruments may have a calibration range that does not extend to 800 μg/L (80 μg of Cl¥). For those instruments, a narrower dynamic range may be used. How-ever, if the concentration of halide in a sam-ple exceeds that range, the sample must be diluted to bring the concentration within the range calibrated.
7.12.4 Trichlorophenol precision and re-covery (PAR) test solution (10 μg/L of Cl¥): Partially fill a 100-mL volumetric flask, add 10 μL of the stock solution (Section 7.12.2), and dilute to the mark with reagent water.
7.13 Acetic acid solution: Containing 30 to 70% acetic acid in deionized water, per the instrument manufacturer’s instructions.
8.0 Sample Collection, Preservation, and Storage
8.1 Sample preservation. 8.1.1 Residual chlorine: If the sample is
known or suspected to contain free chlorine, the chlorine must be reduced to eliminate positive interference that may result from
continued chlorination reactions. A knowl-edge of the process from which the sample is collected may be of value in determining whether dechlorination is necessary. Imme-diately after sampling, test for residual chlo-rine using the following method or an alter-native EPA method (Reference 12):
8.1.1.1 Dissolve a few crystals of potas-sium iodide in the sample and add three to five drops of a 1% starch solution. A blue color indicates the presence of residual chlo-rine.
8.1.1.2 If residual chlorine is found, add 1 mL of sodium thiosulfate solution (Section 7.11) for each 2.5 ppm of free chlorine or until the blue color disappears. Do not add an ex-cess of sodium thiosulfate. Excess sodium thiosulfate may cause decomposition of a small fraction of the OX.
8.1.2 Acidification: Adjust the pH of aque-ous samples to < 2 with nitric acid. Acidifica-tion inhibits biological activity and sta-bilizes chemical degradation, including pos-sible dehalogenation reactions that may occur at high pH. Acidification is necessary to facilitate thorough adsorption.
8.1.3 Refrigeration: Maintain samples at a temperature of 0 to 4 °C from time of collec-tion until analysis.
8.2 Collect the amount of sample nec-essary for analysis (Section 11) and all QC tests (Section 9) in an amber glass bottle of the appropriate size (Section 6.1.1).
8.3 Analyze samples no less than three days nor more than six months after collec-tion.
9.0 Quality Control
9.1 Each laboratory that uses this method is required to operate a formal quality assur-ance program. The minimum requirements of this program consist of an initial dem-onstration of laboratory capability, an ongo-ing analysis of standards and blanks as tests of continued performance, and analysis of matrix spike and matrix spike duplicate (MS/MSD) samples to assess accuracy and precision. Laboratory performance is com-pared to established performance criteria to determine if the results of analyses meet the performance characteristics of the method.
9.1.1 The laboratory shall make an initial demonstration of the ability to produce ac-ceptable results with this method. This abil-ity is demonstrated as described in Section 9.2.
9.1.2 The laboratory is permitted to mod-ify this method to improve separations or lower the costs of measurements, provided that all performance specifications are met. Each time a modification is made to the method, the laboratory is required to repeat the procedures in Sections 9.2.2 and 10 to demonstrate continued method performance. If the detection limit of the method will be affected by the modification, the laboratory should demonstrate that the MDL (40 CFR
VerDate Mar<15>2010 09:46 Aug 24, 2012 Jkt 226176 PO 00000 Frm 00221 Fmt 8010 Sfmt 8002 Y:\SGML\226176.XXX 226176pman
grum
on
DS
K3V
PT
VN
1PR
OD
with
CF
R

212
40 CFR Ch. I (7–1–12 Edition) Pt. 430, App. A
136, appendix B) is less than or equal to the MDL in this method or one-third the regu-latory compliance level, whichever is higher.
9.1.3 The laboratory shall spike 10% of the samples with known concentrations of 2,4,6- trichlorophenol to monitor method perform-ance and matrix interferences (interferences caused by the sample matrix). This test is described in Section 9.3. When results of these spikes indicate atypical method per-formance for samples, the samples are di-luted to bring method performance within acceptable limits.
9.1.4 Analyses of blanks are required to demonstrate freedom from contamination. The procedures and criteria for analysis of blanks are described in Section 9.4.
9.1.5 The laboratory shall, on an ongoing basis, demonstrate through the analysis of the precision and recovery (PAR) standard that the analysis system is in control. These procedures are described in Section 9.10.
9.1.6 The laboratory shall perform quality control tests on the granular activated car-bon. These procedures are described in Sec-tion 9.5.
9.1.7 Samples are analyzed in duplicate to demonstrate precision. These procedures are described in Section 9.6.
9.2 Initial demonstration of laboratory capability.
9.2.1 Method Detection Limit (MDL): To establish the ability to detect AOX, the lab-oratory should determine the MDL per the procedure in 40 CFR 136, appendix B using the apparatus, reagents, and standards that will be used in the practice of this method. An MDL less than or equal to the MDL in Section 1.3 should be achieved prior to the practice of this method.
9.2.2 Initial precision and recovery (IPR): To establish the ability to generate accept-able precision and recovery, the laboratory shall perform the following operations:
9.2.2.1 Analyze four aliquots of the PAR standard (Section 7.12.4) and a method blank according to the procedures in Sections 9.4 and 11.
9.2.2.2 Using the blank-subtracted results of the set of four analyses, compute the aver-age percent recovery (X) and the standard deviation of the percent recovery (s) for the results.
9.2.2.3 The average percent recovery shall be in the range of 81 to 114 μg/L and the standard deviation shall be less than 8 μg/L. If X and s meet these acceptance criteria, system performance is acceptable and anal-ysis of blanks and samples may begin. If, however, s exceeds the precision limit or X falls outside the range for recovery, system performance is unacceptable. In this case, correct the problem and repeat the test.
9.3 Matrix spikes: The laboratory shall spike a minimum of 10% of samples from a given matrix type (e.g., C-stage filtrate, pro-duced water, treated effluent) in duplicate
(MS/MSD). If only one sample from a given matrix type is analyzed, an additional two aliquots of that sample shall be spiked.
9.3.1 The concentration of the analytes spiked into the MS/MSD shall be determined as follows:
9.3.1.1 If, as in compliance monitoring, the concentration of OX is being checked against a regulatory concentration limit, the spiking level shall be at that limit or at one to five times higher than the background concentration determined in Section 9.3.2, whichever concentration is higher.
9.3.1.2 If the concentration of OX is not being checked against a regulatory limit, the spike shall be at the concentration of the precision and recovery standard (PAR; Sec-tion 7.12.4) or at one to five times higher than the background concentration deter-mined in Section 9.3.2, whichever concentra-tion is higher.
9.3.2 Analyze one sample out of each batch of 10 samples from each site to deter-mine the background concentration of AOX. If necessary, prepare a solution of 2,4,6- trichlorophenol appropriate to produce a level in the sample one to five times the background concentration. Spike two addi-tional sample aliquots with spiking solution and analyze them to determine the con-centration after spiking.
9.3.2.1 Compute the percent recovery of each analyte in each aliquot:
% Recovery100 (Found Background)
T is the true value of the spike
= −T
where:
9.3.2.2 Compute the relative percent dif-ference (RPD) between the two results (not between the two recoveries) as described in Section 12.4.
9.3.2.3 If the RPD is less than 20%, and the recoveries for the MS and MSD are within the range of 78 to 116%, the results are ac-ceptable.
9.3.2.4 If the RPD is greater than 20%, analyze two aliquots of the precision and re-covery standard (PAR).
9.3.2.4.1 If the RPD for the two aliquots of the PAR is greater than 20%, the analytical system is out of control. In this case, repair the problem and repeat the analysis of the sample batch, including the MS/MSD.
9.3.2.4.2 If, however, the RPD for the two aliquots of the PAR is less than 20%, dilute the sample chosen for the MS/MSD by a fac-tor of 2–10 (to remain within the working range of the analytical system) and repeat the MS/MSD test. If the RPD is still greater than 20%, the result may not be reported for regulatory compliance purposes. In this case, choose another sample for the MS/MSD and repeat analysis of the sample batch.
9.3.2.5 If the percent recovery for both the MS and MSD are less than 78% or greater
VerDate Mar<15>2010 09:46 Aug 24, 2012 Jkt 226176 PO 00000 Frm 00222 Fmt 8010 Sfmt 8002 Y:\SGML\226176.XXX 226176 ER
15ap
98.0
18<
/GP
H>
pman
grum
on
DS
K3V
PT
VN
1PR
OD
with
CF
R

213
Environmental Protection Agency Pt. 430, App. A
than 116%, analyze the precision and recov-ery (PAR) standard.
9.3.2.5.1 If the recovery of the PAR is out-side the 78 to 116% range, the analytical sys-tem is out of control. In this case, repair the problem and repeat the analysis of the sam-ple batch, including the MS/MSD.
9.3.2.5.2 If the recovery of the PAR is within the range of 78 to 116%, dilute the sample, MS, and MSD by a factor of 2–10 (to remain within the working range of the ana-lytical system) and re-analyze. If the results of the dilute analyses remain outside of the acceptable range, these results may not be reported for regulatory compliance purposes. In this case, choose another sample for the MS/MSD and repeat the analysis of the sam-ple batch.
9.4 Blanks. 9.4.1 Reagent water blanks: Analyzed to
demonstrate freedom from contamination. 9.4.1.1 Analyze a reagent water blank with
each batch of samples. The blank must be analyzed immediately preceding calibration verification to allow for blank subtraction and to demonstrate freedom from contami-nation and memory effects, and must include all details of the procedure to be followed when analyzing samples.
9.4.1.2 Prepare the reagent water blank using a volume of reagent water equivalent to the volume used for sample preparation (Section 11.1). If using the micro-column pro-cedure, adsorb the method blank using two columns, as described in Section 11. Combust the GAC from each column separately, as de-scribed in Section 11.
9.4.1.3 If the result from the blank from the batch method or the sum of the results from two columns is more than 20 μg/L, anal-ysis of samples is halted until the source of contamination is eliminated and a blank shows no evidence of contamination at this level.
9.4.2 Nitrate-washed GAC blanks: Ana-lyzed daily to demonstrate that the GAC is free from contamination.
9.4.2.1 Nitrate-washed GAC blank for the batch procedure: Analyze a batch nitrate- washed GAC blank by adding a scoop of dry GAC to the assembled filter apparatus con-taining the polycarbonate membrane and washing the GAC with the nitrate wash solu-tion (Section 7.10) using the procedure in Section 11.2.6.
9.4.2.2 Nitrate-washed GAC blank for the column procedure: Analyze a column nitrate- washed GAC blank by assembling two carbon columns in series and washing the columns with the nitrate wash solution (Section 7.10) using the procedure in Section 11.3.4.2. Ana-lyze the GAC in each column separately. The results of the second analysis must be within ±0.2 μg Cl¥ of the first. A difference greater than 0.2 μg Cl¥ indicates a lack of homo-geneity in the GAC that could introduce un-acceptable variability. If the difference ex-
ceeds this amount, the GAC should be re-placed.
9.4.3 The result for the reagent water blank (Section 9.4.1) shall not exceed the re-sult for the nitrate wash blank (Section 9.4.2.1 or 9.4.2.2) by more than 0.5 μg Cl¥.
9.5 Granular activated carbon (GAC) batch testing: Each lot number or batch of activated carbon received from a supplier is tested once before use to ensure adequate quality. Use only GAC that meets the test criteria below.
9.5.1 Contamination test: Analyze a scoop of GAC. Reject carbon if the amount of OX exceeds 1 μg (25 μg Cl¥/g).
9.5.2 Inorganic chloride adsorption test: Attempt to adsorb NaCl from 100 mL of a so-lution containing 100 mg/L in reagent water. Wash with nitrate solution and analyze. The amount of halide should be less than 1 μg Cl¥
larger than the blank. A larger amount indi-cates significant uptake of inorganic chlo-ride by the carbon. Reject carbon if the 1 μg level is exceeded.
9.6 Samples that are being used for regu-latory compliance purposes shall be analyzed in duplicate.
9.6.1 The procedure for preparing dupli-cate sample aliquots is described in Section 11.5.
9.6.2 Calculate the RPD by following the same procedure described in Section 12.4.
9.6.3 If the RPD is greater than 20%, the analyses must be repeated.
9.6.4 If the RPD remains greater than 20%, the result may not be reported for regu-latory compliance purposes.
9.7 The specifications in this method can be met if the apparatus used is calibrated properly and maintained in a calibrated state. The standards used for calibration (Section 10), calibration verification (Section 9.9), and for initial (Section 9.2.2) and ongo-ing (Section 9.10) precision and recovery should be identical, so that the most precise results will be obtained.
9.8 Depending on specific program re-quirements, field duplicates may be collected to determine the precision of the sampling technique.
9.9 At the beginning and end of each eight-hour shift during which analyses are performed, system performance and calibra-tion are verified. Verification of system per-formance and calibration may be performed more frequently, if desired.
9.9.1 If performance and calibration are verified at the beginning and end of each shift (or more frequently), samples analyzed during that period are considered valid.
9.9.2 If performance and calibration are not verified at both the beginning and end of a shift (or more frequently), samples ana-lyzed during that period must be reanalyzed.
9.9.3 If calibration is verified at the begin-ning of a shift, recalibration using the five standards described in Section 10.6 is not
VerDate Mar<15>2010 09:46 Aug 24, 2012 Jkt 226176 PO 00000 Frm 00223 Fmt 8010 Sfmt 8002 Y:\SGML\226176.XXX 226176pman
grum
on
DS
K3V
PT
VN
1PR
OD
with
CF
R

214
40 CFR Ch. I (7–1–12 Edition) Pt. 430, App. A
necessary; otherwise, the instrument must be recalibrated prior to analyzing samples (Section 10).
9.9.4 Cell maintenance and other changes to the analytical system that can affect sys-tem performance may not be performed dur-ing the eight-hour (or shorter) shift.
9.10 Calibration verification and ongoing precision and recovery: Calibration and sys-tem performance are verified by the analysis of the 100 μg/L PAR standard.
9.10.1 Analyze a blank (Section 9.4) and analyze the PAR standard (Section 7.12.4) immediately thereafter at the beginning and end of each shift. Compute the concentration of organic halide in the blank and in the PAR standard using the procedures in Sec-tion 12. The blank shall be less than 2 μg Cl¥
(20 μg/L equivalent). 9.10.2 Subtract the result for the blank
from the result of the PAR standard using the procedures in Section 12, and compute the percent recovery of the blank-subtracted PAR standard. The percent recovery shall be in the range of 78 to 116%.
9.10.3 If the recovery is within this range, the analytical process is in control and anal-ysis of blanks and samples may proceed. If, however, the recovery is not within the ac-ceptable range, the analytical process is not in control. In this event, correct the problem and repeat the ongoing precision and recov-ery test (Section 9.10), or recalibrate (Sec-tions 10.5 through 10.6).
9.10.4 If the recovery is not within the ac-ceptable range for the PAR standard ana-lyzed at the end of the eight-hour shift, cor-rect the problem, repeat the ongoing preci-sion and recovery test (Section 9.10), or re-calibrate (Sections 10.5 through 10.6), and re-analyze the sample batch that was analyzed during the eight-hour shift.
9.10.5 If the recovery is within the accept-able range at the end of the shift, and sam-ples are to be analyzed during the next eight- hour shift, the end of shift verification may be used as the beginning of shift verification for the subsequent shift, provided the next eight-hour shift begins as the first shift ends.
9.11 It is suggested but not required that the laboratory develop a statement of data quality for AOX and develop QC charts to form a graphic demonstration of method per-formance. Add results that pass the speci-fication in Section 9.10.2 to initial and pre-vious ongoing data. Develop a statement of data quality by calculating the average per-cent recovery (R) and the standard deviation of percent recovery (sr). Express the accuracy as a recovery interval from R ¥ 2sr to R = 2sr. For example, if R=95% and sr=5%, the accu-racy is 85 to 105%.
10.0 Calibration and Standardization
10.1 Assemble the OX system and estab-lish the operating conditions necessary for analysis. Differences between various makes
and models of instruments will require dif-ferent operating procedures. Laboratories should follow the operating instructions pro-vided by the manufacturer of their par-ticular instrument. Sensitivity, instrument detection limit, precision, linear range, and interference effects must be investigated and established for each particular instrument. Calibration is performed when the instru-ment is first set up and when calibration cannot be verified (Section 9.9).
10.2 Cell performance test: Inject 100 μL of the sodium chloride solution (10 μg Cl¥; Sec-tion 7.4) directly into the titration cell elec-trolyte. Adjust the instrument to produce a reading of 10 μg Cl¥.
10.3 Combustion system test: This test can be used to assure that the combustion/ micro-coulometer systems are performing properly without introduction of carbon. This test should be used during initial in-strument setup and when instrument per-formance indicates a problem with the com-bustion system.
10.3.1 Designate a quartz boat for use with the ammonium chloride (NH4Cl) solution only.
10.3.2 Inject 100 μL of the NH4Cl solution (Section 7.5) into this boat and proceed with the analysis.
10.3.3 The result shall be between 9.5 and 10.5 μg Cl¥. If the recovery is not between these limits, the combustion or micro-cou-lometer systems are not performing prop-erly. Check the temperature of the combus-tion system, verify that there are no leaks in the combustion system, confirm that the cell is performing properly (Section 10.2), and then repeat the test.
10.4 Trichlorophenol combustion test: This test can be used to assure that the com-bustion/micro-coulometer systems are per-forming properly when carbon is introduced. It should be used during instrument setup and when it is necessary to isolate the ad-sorption and combustion steps.
10.4.1 Inject 10 μL of the 1 mg/mL trichlorophenol stock solution (Section 7.12.2) onto one level scoop of GAC in a quartz boat.
10.4.2 Immediately proceed with the anal-ysis to prevent loss of trichlorophenol and to prevent contamination of the carbon.
10.4.3 The result shall be between 9.0 and 11.0 μg Cl¥. If the recovery is not between these limits, the combustion/micro-coulom-eter system shall be adjusted and the test re-peated until the result falls within these lim-its.
10.5 Background level of Cl¥: Determine the average background level of Cl¥ for the entire analytical system as follows:
10.5.1 Using the procedure in Section 11 (batch or column) that will be used for the analysis of samples, determine the back-ground level of Cl¥ in each of three portions of reagent water. The volume of reagent
VerDate Mar<15>2010 09:46 Aug 24, 2012 Jkt 226176 PO 00000 Frm 00224 Fmt 8010 Sfmt 8002 Y:\SGML\226176.XXX 226176pman
grum
on
DS
K3V
PT
VN
1PR
OD
with
CF
R

215
Environmental Protection Agency Pt. 430, App. A
water used shall be the same as the volume used for analysis of samples.
10.5.2 Calculate the average (mean) con-centration of Cl¥ and the standard deviation of the concentration.
10.5.3 The sum of the average concentra-tion plus two times the standard deviation of the concentration shall be less than 20 μg/L. If not, the water or carbon shall be replaced, or the adsorption system moved to an area free of organic halide vapors, and the test (Section 10.5) shall be repeated. Only after this test is passed may calibration proceed.
10.6 Calibration by external standard: A calibration line encompassing the calibra-tion range is developed using solutions of 2,4,6-trichlorophenol.
10.6.1 Analyze each of the five calibration solutions (Section 7.12.3) using the procedure in Section 11 (batch or column) that will be used for the analysis of samples, and the same procedure that was used for determina-tion of the system background (Section 10.5). Analyze these solutions beginning with the lowest concentration and proceeding to the highest. Record the response of the micro- coulometer to each calibration solution.
10.6.2 Prepare a method blank as de-scribed in Section 9.4. Subtract the value of the blank from each of the five calibration results, as described in Section 12.
10.6.3 Calibration factor (ratio of response to concentration) Using the blank subtracted results, compute the calibration factor at each calibration point, and compute the av-erage calibration factor and the relative standard deviation (coefficient of variation; Cv) of the calibration factor over the calibra-tion range.
10.6.4 Linearity: The Cv of the calibration factor shall be less than 20%; otherwise, the calibration shall be repeated after adjust-ment of the combustion/micro-coulometer
system and/or preparation of fresh calibra-tion standards.
10.6.5 Using the average calibration fac-tor, compute the percent recovery at each calibration point. The recovery at each cali-bration point shall be within the range of 80 to 111%. If any point is not within this range, a fresh calibration standard shall be pre-pared for that point, this standard shall be analyzed, and the calibration factor (Section 10.6.3) and calibration linearity (Section 10.6.4) shall be computed using the new cali-bration point. All points used in the calibra-tion must meet the 80 to 111% recovery spec-ification.
11.0 Procedure
11.1 Sample dilution: Many samples will contain high concentrations of halide. If ana-lyzed without dilution, the micro-coulom-eter can be overloaded, resulting in frequent cell cleaning and downtime. The following guidance is provided to assist in estimating dilution levels.
11.1.1 Paper and pulp mills that employ chlorine bleaching: Samples from pulp mills that use a chlorine bleaching process may overload the micro-coulometer. To prevent system overload, the maximum volume sug-gested for paper industry samples that em-ploy halide in the bleaching process is 100 mL. An adsorption volume as small as 25 mL may be used, provided the concentration of AOX in the sample can be measured reliably, as defined by the requirements in Section 9.11. To minimize volumetric error, an ad-sorption volume less than 25 mL may not be used. If AOX cannot be measured reliably in a 100-mL sample volume, a sample volume to a maximum of 1000 mL must be used. The sample and adsorption volumes are sug-gested for paper industry samples employing chlorine compounds in the bleaching process:
Paper or pulp mill stream Sample volume (mL)*
Adsorption volume (mL)
Evaporator condensate ....................................................................................................................... 100 .0 100 Process water ...................................................................................................................................... 100 .0 100 Pulp mill effluent .................................................................................................................................. 30 .0 50 Paper mill effluent ............................................................................................................................... 10 .0 25 Combined mill effluent ......................................................................................................................... 5 .0 25 Combined bleach effluent ................................................................................................................... 1 .0 25 C-stage filtrate ..................................................................................................................................... 0 .5 25 E-stage filtrate ..................................................................................................................................... 0 .5 25
* Assumes dilution to final volume of 100 mL. All sample aliquots (replicates, diluted samples) must be analyzed using the same fixed final volume (sample volume plus reagent water, as needed).
11.1.2 Sample dilution procedure. 11.1.2.1 Partially fill a precleaned volu-
metric flask with pH < 2 reagent water, al-lowing for the volume of sample to be added.
11.1.2.2 Mix sample thoroughly by tum-bling or shaking vigorously.
11.1.2.3 Immediately withdraw the re-quired sample aliquot using a pipet or micro- syringe.
NOTE: Because it will be necessary to rinse the pipet or micro-syringe (Section 11.1.2.5), it may be necessary to pre-calibrate the
VerDate Mar<15>2010 09:46 Aug 24, 2012 Jkt 226176 PO 00000 Frm 00225 Fmt 8010 Sfmt 8002 Y:\SGML\226176.XXX 226176pman
grum
on
DS
K3V
PT
VN
1PR
OD
with
CF
R

216
40 CFR Ch. I (7–1–12 Edition) Pt. 430, App. A
pipet or micro-syringe to assure that the exact volume desired will be delivered.
11.1.2.4 Dispense or inject the aliquot into the volumetric flask.
11.1.2.5 Rinse the pipet or syringe with small portions of reagent water and add to the flask.
11.1.2.6 Dilute to the mark with pH < 2 re-agent water.
11.1.3 All samples to be reported for regu-latory compliance monitoring purposes must be analyzed in duplicate, as described in Sec-tion 11.5.
11.1.4 Pulp and Paper in-process samples: The concentration of organic halide in in- process samples has been shown to be 20 to 30% greater using the micro-column adsorp-tion technique than using the batch adsorp-tion technique. For this reason, the micro- column technique shall be used for moni-toring in-process samples. Examples of in- process samples include: combined bleach plant effluent, C-stage filtrate, and E-stage filtrate.
11.2 Batch adsorption and filtration. 11.2.1 Place the appropriate volume of
sample (diluted if necessary), preserved as described in Section 8, into an Erlenmeyer flask.
11.2.2 Add 5 mL of nitrate stock solution to the sample aliquot.
11.2.3 Add one level scoop of activated carbon that has passed the quality control tests in Section 9.
11.2.4 Shake the suspension for at least one hour in a mechanical shaker.
11.2.5 Filter the suspension through a polycarbonate membrane filter. Filter by suction until the liquid level reaches the top of the carbon.
11.2.6 Wash the inside surface of the filter funnel with 25 mL (±5 mL) of nitrate wash so-lution in several portions. After the level of the final wash reaches the top of the GAC, filter by suction until the cake is barely dry. The time required for drying should be mini-mized to prevent exposure of the GAC to halogen vapors in the air, but should be suf-ficient to permit drying of the cake so that excess water is not introduced into the com-bustion apparatus. A drying time of approxi-mately 10 seconds under vacuum has been shown to be effective for this operation.
11.2.7 Carefully remove the top of the fil-ter holder, making sure that no carbon is lost. This operation is most successfully per-formed by removing the clamp, tilting the top of the filter holder (the funnel portion) to one side, and lifting upward.
11.2.8 Using a squeeze bottle or micro-sy-ringe, rapidly rinse the carbon from the in-side of the filter holder onto the filter cake using small portions of wash solution. Allow the cake to dry under vacuum for no more than 10 seconds after the final rinse. Imme-diately turn the vacuum off.
11.2.9 Using tweezers, carefully fold the polycarbonate filter in half, then in fourths, making sure that no carbon is lost.
11.3 Column adsorption. 11.3.1 Column preparation: Prepare a suf-
ficient number of columns for one day’s oper-ation as follows:
11.3.1.1 In a glove box or area free from halide vapors, place a plug of Cerafelt into the end of a clean glass column.
11.3.1.2 Fill the glass column with one level scoop (approximately 40 mg) of granu-lar activated carbon that has passed the quality control tests in Section 9.
11.3.1.3 Insert a Cerafelt plug into the open end of the column to hold the carbon in place.
11.3.1.4 Store the columns in a glass jar with PTFE lined screw-cap to prevent infil-tration of halide vapors from the air.
11.3.2 Column setup. 11.3.2.1 Install two columns in series in
the adsorption module. 11.3.2.2 If the sample is known or expected
to contain particulates that could prevent free flow of sample through the micro-col-umns, a Cerafelt plug is placed in the tubing ahead of the columns. If a measurement of the OX content of the particulates is desired, the Cerafelt plug can be washed with nitrate solution, placed in a combustion boat, and processed as a separate sample.
11.3.3 Adjusting sample flow rate: Because the flow rate used to load the sample onto the columns can affect the ability of the GAC to adsorb organic halides, the flow rate of the method blank is measured, and the gas pressure used to process samples is adjusted accordingly. The flow rate of the blank, which is composed of acidified reagent water and contains no particulate matter, should be greater than the flow rate of any sample containing even small amounts of particu-late matter.
11.3.3.1 Fill the sample reservoir with the volume of reagent water chosen for the anal-ysis (Section 9.4.1.2) that has been preserved and acidified as described in Section 8. Cap the reservoir.
11.3.3.2 Adjust the gas pressure per the manufacturer’s instructions. Record the time required for the entire volume of rea-gent water to pass through both columns. The flow rate must not exceed 3 mL/min over the duration of the time required to adsorb the volume. If this flow rate is exceeded, ad-just gas pressure, prepare another blank, and repeat the adsorption.
11.3.3.3 Once the flow rate for the blank has been established, the same adsorption conditions must be applied to all subsequent samples during that eight-hour shift, or until another method blank is processed, whichever comes first. To aid in overcoming breakthrough problems, a lower gas pressure (and, therefore, flow rate) may be used for
VerDate Mar<15>2010 09:46 Aug 24, 2012 Jkt 226176 PO 00000 Frm 00226 Fmt 8010 Sfmt 8002 Y:\SGML\226176.XXX 226176pman
grum
on
DS
K3V
PT
VN
1PR
OD
with
CF
R

217
Environmental Protection Agency Pt. 430, App. A
processing of samples, if desired. If the sam-ple adsorption unit is disassembled or cleaned, the flow rate must be checked be-fore processing additional samples.
11.3.3.4 Elute the pair of columns with 2 mL of nitrate wash solution. The flow rate of nitrate wash solution must not exceed 3 mL/ min.
11.3.3.5 Separate the columns and mark for subsequent analysis.
11.3.4 The adsorption of sample volumes is performed in a similar fashion. Fill the sam-ple reservoir with the sample volume chosen for the analysis (Section 11.1), that has been preserved as described in Section 8. All anal-yses must be performed with this volume (sample volume plus reagent water, as need-ed) in order to maintain a flow rate no great-er than that determined for the blank (see Section 11.3.3).
11.3.4.1 Use the same gas pressure for sam-ple adsorption as is used for the blank.
11.3.4.2 Elute the columns with 2 mL of the nitrate wash solution.
11.3.4.3 Separate the columns and mark for subsequent analysis.
11.3.5 If it is desirable to make measure-ments at levels lower than can be achieved with the sample volume chosen, or if the in-strument response of an undiluted sample is less than three times the instrument re-sponse of the blank (Section 12.6.3), a larger sample volume must be used.
11.4 Combustion and titration. 11.4.1 Polycarbonate filter and GAC from
batch adsorption. 11.4.1.1 Place the folded polycarbonate fil-
ter containing the GAC in a quartz combus-tion boat, close the airlock, and proceed with the automated sequence.
11.4.1.2 Record the signal from the micro- coulometer for a minimum integration time of 10 minutes and determine the concentra-tion of Cl¥ from calibration data, per Sec-tion 12.
11.4.2 Columns from column adsorption. 11.4.2.1 Using the push rod, push the car-
bon and the Cerafelt plug(s) from the first column into a combustion boat. Proceed with the automated sequence.
11.4.2.2 Record the signal from the micro- coulometer for a minimum integration time of 10 minutes and determine the concentra-tion of Cl¥ for the first column from calibra-tion data, per Section 12.
11.4.2.3 Repeat the automated sequence with the second column.
11.4.2.4 Determine the extent of break-through of organic halides from the first col-umn to the second column, as described in Section 12.
11.4.3 The two columns that are used for the method blank must be combusted sepa-rately, as is done for samples. 11.5 Duplicate sample analysis: All samples to be reported for regulatory compliance purposes must be analyzed in duplicate. This requirement ap-
plies to both the batch and column adsorp-tion procedures. In addition, if it is nec-essary to dilute the sample for the purposes of reducing breakthrough or maintaining the concentration within the calibration range, a more or less dilute sample must be ana-lyzed. The adsorption volumes used for anal-ysis of undiluted samples, diluted samples, and all replicates must be the same as the volume used for QC tests and calibration (Sections 9 and 10).
11.5.1 Using results from analysis of one sample volume (Section 11.4) and the proce-dure in Section 11.1.2, determine if the dilu-tion used was within the calibration range of the instrument and/or if breakthrough ex-ceeded the specification in Section 12.3.1. If the breakthrough criterion was exceeded or the sample was not within the calibration range, adjust the dilution volume as needed. If the breakthrough criterion was not ex-ceeded and the sample dilution was within the calibration range, a second volume at the same dilution level may be used.
11.5.2 Adsorb the sample using the same technique (batch or column) used for the first sample volume. Combust the GAC from the second volume as described in Section 11.4, and calculate the results as described in Section 12. Compare the results of the two analyses as described in Section 12.4.
11.5.3 Duplicate analyses are not required for method blanks, as different dilution lev-els are not possible.
11.5.4 Duplicate analyses of the PAR standard used for calibration verification (Section 9.10) are not required.
12.0 Data Analysis and Calculations
12.1 Batch Adsorption Method: Calculate the blank-subtracted concentration of ad-sorbable organic halide detected in each sample (in micrograms of chloride per liter) using the following equation:
AOX g LC B
V( / )
( )μ = −
Where:
C=μg Cl¥ from micro-coulometer for the sample
B=μg Cl¥ from micro-coulometer for the rea-gent water blank (Section 9.4.1)
V = volume of sample in liters
This calculation is performed for each of the two dilution levels analyzed for each sample.
12.2 Column Adsorption Method: Cal-culate the blank-subtracted concentration of adsorbable organic halide detected in each sample (in micrograms of chloride per liter) using the following equation:
VerDate Mar<15>2010 09:46 Aug 24, 2012 Jkt 226176 PO 00000 Frm 00227 Fmt 8010 Sfmt 8002 Y:\SGML\226176.XXX 226176 ER
15ap
98.0
19<
/GP
H>
pman
grum
on
DS
K3V
PT
VN
1PR
OD
with
CF
R

218
40 CFR Ch. I (7–1–12 Edition) Pt. 430, App. A
AOX g LC C B B
V( / )μ =
+( ) − +( )[ ]1 2 1 2
C1=μg Cl¥ from micro-coulometer for first column from the sample
C2=μg Cl¥ from micro-coulometer for second column from the sample
B1=μg from micro-coulometer for first col-umn from the reagent water blank (Sec-tion 9.4.1)
B2=μg Cl¥ from micro-coulometer for second column from the reagent water blank (Sec-tion 9.4.1)
V=volume of sample in liters
12.3 Percent breakthrough: For each sam-ple analyzed by the column method, cal-culate the percent breakthrough of halide from the first column to the second column, using the following equation:
%Breakthrough =C1
( )( )C B
B C B2 2
1 2 2
100−−( ) + −( )[ ]
12.3.1 For samples to be reported for regu-latory compliance purposes, the percent breakthrough must be less than or equal to 25% for both of the two analyses performed on each sample (see Section 11.5).
12.3.2 If the breakthrough exceeds 25%, di-lute the affected sample further, maintain-ing the amount of halide at least three times higher than the level of blank, and reanalyze the sample. Ensure that the sample is also analyzed at a second level of dilution that is at least a factor of 2 different (and still high-er than three times the blank).
12.4 Relative percent difference (RPD): Calculate the relative percent difference be-tween the results of the two analyses of each sample, using the following equation:
RPDAOX AOX
AOX AOX=
−( )+( )[ ]
200 1 2
1 2
12.5 High concentrations of AOX: If the amount of halide from either analysis ex-ceeds the calibration range, dilute the sam-ple and reanalyze, maintaining at least a fac-tor of 2 difference in the dilution levels of the two portions of the sample used.
12.6 Low concentrations of AOX: The blank-subtracted final result from the batch procedure or the sum of the blank-subtracted results from the two carbon columns should be significantly above the level of the blank.
12.6.1 If the instrument response for a sample exceeds the instrument response for the blank by a factor of at least 3, the result is acceptable.
12.6.2 If the instrument response for a sample is less than three times the instru-ment response for the blank, and the sample
has been diluted, analyze a less dilute ali-quot of sample.
12.6.3 If the instrument response of an un-diluted sample containing AOX above the minimum level is less than three times the instrument response for the blank, the result is suspect and may not be used for regu-latory compliance purposes. In this case, find the cause of contamination, correct the problem, and reanalyze the sample under the corrected conditions.
12.7 Report results that meet all of the specifications in this method as the mean of the blank-subtracted values from Section 12.1 or 12.2 for the two analyses at different dilution levels, in μg/L of Cl¥ (not as 2,4,6- trichlorophenol), to three significant figures. Report the RPD of the two analyses. For samples analyzed by the column procedure, also report the percent breakthrough.
13.0 Method Performance
The specifications contained in this meth-od are based on data from a single laboratory and from a large-scale study of the pulp and paper industry.
14.0 Pollution Prevention
14.1 The solvents used in this method pose little threat to the environment when recy-cled and managed properly.
14.2 Standards should be prepared in vol-umes consistent with laboratory use to mini-mize the volume of expired standards to be disposed.
15.0 Waste Management
15.1 It is the laboratory’s responsibility to comply with all federal, state, and local reg-ulations governing waste management, par-ticularly the hazardous waste identification rules and land disposal restrictions, and to protect the air, water, and land by mini-mizing and controlling all releases from fume hoods and bench operations. Compli-ance with all sewage discharge permits and regulations is also required.
15.2 Samples preserved with HCl or H2SO4 to pH <2 are hazardous and must be neutral-ized before being disposed, or must be han-dled as hazardous waste. Acetic acid and sil-ver acetate solutions resulting from cell flushing must be disposed of in accordance with all applicable federal, state, and local regulations.
15.3 For further information on waste management, consult ‘‘The Waste Manage-ment Manual for Laboratory Personnel,’’ and ‘‘Less is Better: Laboratory Chemical Management for Waste Reduction,’’ both available from the American Chemical Soci-ety’s Department of Government Relations and Science Policy, 1155 16th Street NW., Washington, DC 20036.
VerDate Mar<15>2010 09:46 Aug 24, 2012 Jkt 226176 PO 00000 Frm 00228 Fmt 8010 Sfmt 8002 Y:\SGML\226176.XXX 226176 ER
15ap
98.0
20<
/GP
H>
ER
15ap
98.0
21<
/GP
H>
ER
15ap
98.0
22<
/GP
H>
pman
grum
on
DS
K3V
PT
VN
1PR
OD
with
CF
R

219
Environmental Protection Agency Pt. 430, App. A
16.0 References
16.1 ‘‘Total Organic Halide, Methods 450.1—Interim,’’ Prepared by Stephen Billets and James J. Lichtenberg, USEPA, Office of Research and Development, Physical and Chemical Methods Branch, EMSL-Cin-cinnati, Cincinnati, OH 45268, EPA 600/4–81– 056 (1981).
16.2 Method 9020, USEPA Office of Solid Waste, ‘‘Test Methods for Evaluating Solid Waste, SW–846,’’ Third Edition, 1987.
16.3 ‘‘Determination of Adsorbable Or-ganic Halogens (AOX),’’ ‘‘German Standard Methods for the Analysis of Water, Waste Water and Sludge—General Parameters of Effects and Substances,’’ Deutsche Industrie Norm (DIN) Method 38 409, Part 14, DIN Ger-man Standards Institute, Beuth Verlag, Ber-lin, Germany (1987).
16.4 ‘‘Water Quality: Determination of Adsorbable Organic Halogens (AOX),’’ Inter-national Organization for Standard/Draft International Standardization (ISO/DIS) Method 9562 (1988).
16.5 ‘‘Organically Bound Chlorine by the AOX Method,’’ SCAN-W 9:89, Secretariat, Scandinavian Pulp, Paper and Board Testing Committee, Box 5604, S–11486, Stockholm, Sweden (1989).
16.6 Method 5320, ‘‘Dissolved Organic Halogen,’’ from ‘‘Standard Methods for the
Examination of Water and Wastewater,’’ 5320, American Public Health Association, 1015 15th St. NW, Washington, DC 20005 (1989).
16.7 ‘‘Canadian Standard Method for the Determination of Adsorbable Organic Halides (AOX) in Waters and Wastewaters,’’ Environment Canada and The Canadian Pulp and Paper Association (1990).
16.8 40 CFR part 136, appendix B. 16.9 ‘‘Working with Carcinogens,’’ DHEW,
PHS, CDC, NIOSH, Publication 77–206, (Aug 1977).
16.10 ‘‘OSHA Safety and Health Stand-ards, General Industry’’ OSHA 2206, 29 CFR 1910 (Jan 1976).
16.11 ‘‘Safety in Academic Chemistry Lab-oratories,’’ ACS Committee on Chemical Safety (1979).
16.12 ‘‘Methods 330.4 and 330.5 for Total Residual Chlorine,’’ USEPA, EMSL-Cin-cinnati, Cincinnati, OH 45268, EPA–4–79–020 (March 1979).
16.13 ‘‘Validation of Method 1650: Deter-mination of Organic Halide,’’ Analytical Technologies Inc., ERCE Contract 87–3410, November 15, 1990. Available from the EPA Sample Control Center, DynCorp, 300 N. Lee St., Alexandria, VA 22314 (703–519–1140).
17.0 Figures
VerDate Mar<15>2010 09:46 Aug 24, 2012 Jkt 226176 PO 00000 Frm 00229 Fmt 8010 Sfmt 8002 Y:\SGML\226176.XXX 226176pman
grum
on
DS
K3V
PT
VN
1PR
OD
with
CF
R

220
40 CFR Ch. I (7–1–12 Edition) Pt. 430, App. A
VerDate Mar<15>2010 09:46 Aug 24, 2012 Jkt 226176 PO 00000 Frm 00230 Fmt 8010 Sfmt 8006 Y:\SGML\226176.XXX 226176 ER
15ap
98.0
23<
/GP
H>
pman
grum
on
DS
K3V
PT
VN
1PR
OD
with
CF
R

221
Environmental Protection Agency Pt. 430, App. A
VerDate Mar<15>2010 09:46 Aug 24, 2012 Jkt 226176 PO 00000 Frm 00231 Fmt 8010 Sfmt 8006 Y:\SGML\226176.XXX 226176 ER
15ap
98.0
24<
/GP
H>
pman
grum
on
DS
K3V
PT
VN
1PR
OD
with
CF
R

222
40 CFR Ch. I (7–1–12 Edition) Pt. 430, App. A
VerDate Mar<15>2010 09:46 Aug 24, 2012 Jkt 226176 PO 00000 Frm 00232 Fmt 8010 Sfmt 8006 Y:\SGML\226176.XXX 226176 ER
15ap
98.0
25<
/GP
H>
pman
grum
on
DS
K3V
PT
VN
1PR
OD
with
CF
R

223
Environmental Protection Agency Pt. 430, App. A
18.0 Glossary of Definitions and Purposes
These definitions and purposes are specific to this method but have been conformed to common usage as much as possible.
18.1 Units of weight and measure and their abbreviations.
18.1.1 Symbols.
°C degrees Celsius μg microgram μL microliter < less than > greater than % percent
18.1.2 Alphabetical characters.
cm centimeter g gram h hour ID inside diameter in inch L liter m meter mg milligram min minute mL milliliter mm millimeter
VerDate Mar<15>2010 09:46 Aug 24, 2012 Jkt 226176 PO 00000 Frm 00233 Fmt 8010 Sfmt 8002 Y:\SGML\226176.XXX 226176 ER
15ap
98.0
26<
/GP
H>
pman
grum
on
DS
K3V
PT
VN
1PR
OD
with
CF
R

224
40 CFR Ch. I (7–1–12 Edition) Pt. 430, App. A
N normal; gram molecular weight of solute divided by hydrogen equivalent of solute, per liter of solution
OD outside diameter ppb part-per-billion ppm part-per-million ppt part-per-trillion psig pounds-per-square inch gauge v/v volume per unit volume w/v weight per unit volume
18.2 Definitions and acronyms (in alpha-betical order).
Analyte: AOX tested for by this method. Calibration standard (CAL): A solution
prepared from a secondary standard and/or stock solution which is used to calibrate the response of the instrument with respect to analyte concentration.
Calibration verification standard (VER): The mid-point calibration standard (CS3) that is used to verify calibration.
Field blank: An aliquot of reagent water or other reference matrix that is placed in a sample container in the laboratory or the field, and treated as a sample in all respects, including exposure to sampling site condi-tions, storage, preservation, and all analyt-ical procedures. The purpose of the field blank is to determine if the field or sample transporting procedures and environments have contaminated the sample.
IPR: Initial precision and recovery; four aliquots of the diluted PAR standard ana-lyzed to establish the ability to generate ac-ceptable precision and accuracy. An IPR is performed prior to the first time this method is used and any time the method or instru-mentation is modified.
Laboratory blank: See Method blank. Laboratory control sample (LCS): See On-
going precision and recovery sample (OPR). Laboratory reagent blank: See Method
blank. May: This action, activity, or procedural
step is neither required nor prohibited. May not: This action, activity, or proce-
dural step is prohibited. Method blank: An aliquot of reagent water
that is treated exactly as a sample including exposure to all glassware, equipment, sol-vents, reagents, internal standards, and sur-rogates that are used with samples. The method blank is used to determine if analytes or interferences are present in the laboratory environment, the reagents, or the apparatus.
Minimum level (ML): The level at which the entire analytical system must give a rec-ognizable signal and acceptable calibration point for the analyte. It is equivalent to the concentration of the lowest calibration standard, assuming that all method-specified sample weights, volumes, and cleanup proce-dures have been employed.
Must: This action, activity, or procedural step is required.
OPR: Ongoing precision and recovery standard; a laboratory blank spiked with a known quantity of analyte. The OPR is ana-lyzed exactly like a sample. Its purpose is to assure that the results produced by the lab-oratory remain within the limits specified in this method for precision and recovery.
PAR: Precision and recovery standard; sec-ondary standard that is diluted and spiked to form the IPR and OPR.
Preparation blank: See Method blank. Primary dilution standard: A solution con-
taining the specified analytes that is pur-chased or prepared from stock solutions and diluted as needed to prepare calibration solu-tions and other solutions.
Quality control check sample (QCS): A sample containing all or a subset of the analytes at known concentrations. The QCS is obtained from a source external to the lab-oratory or is prepared from a source of standards different from the source of cali-bration standards. It is used to check labora-tory performance with test materials pre-pared external to the normal preparation process.
Reagent water: Water demonstrated to be free from the analyte of interest and poten-tially interfering substances at the method detection limit for the analyte.
Relative standard deviation (RSD): The standard deviation multiplied by 100, divided by the mean.
RSD: See Relative standard deviation. Should: This action, activity, or proce-
dural step is suggested but not required. Stock solution: A solution containing an
analyte that is prepared using a reference material traceable to EPA, the National In-stitute of Science and Technology (NIST), or a source that will attest to the purity and authenticity of the reference material.
VER: See Calibration verification stand-ard.
Method 1653—Chlorinated Phenolics in Wastewater by In Situ Acetylation and GCMS
1.0 Scope and Application
1.1 This method is for determination of chlorinated phenolics (chlorinated phenols, guaiacols, catechols, vanillins, syringaldehydes) and other compounds asso-ciated with the Clean Water Act; the Re-source Conservation and Recovery Act; and the Comprehensive Environmental Response, Compensation, and Liability Act; and that are amenable to in situ acetylation, extrac-tion, and analysis by capillary column gas chromatography/mass spectrometry (GCMS). This method is based on existing methods for determination of chlorophenolics in pulp and paper industry wastewaters (References 1 and 2).
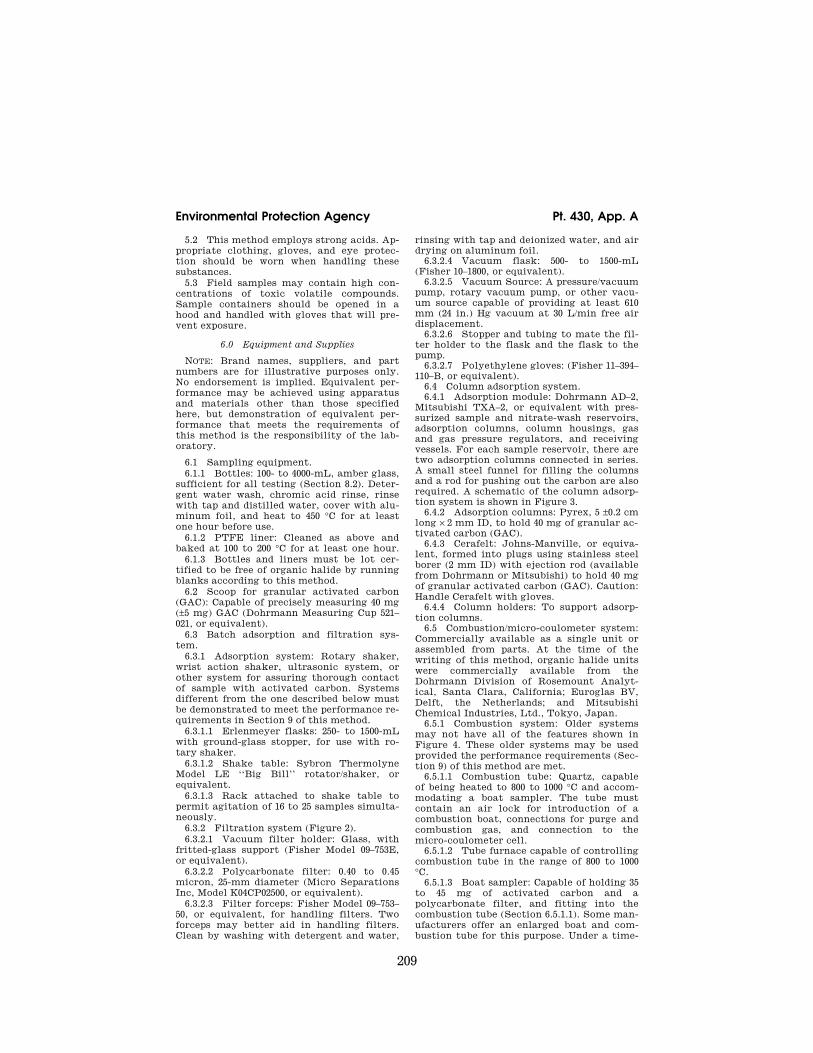
1.2 The chemical compounds listed in Table 1 may be determined in waters and, specifically, in in-process streams and
VerDate Mar<15>2010 09:46 Aug 24, 2012 Jkt 226176 PO 00000 Frm 00234 Fmt 8010 Sfmt 8002 Y:\SGML\226176.XXX 226176pman
grum
on
DS
K3V
PT
VN
1PR
OD
with
CF
R

225
Environmental Protection Agency Pt. 430, App. A
wastewaters associated with the pulp and paper industry. The method is designed to meet the survey and monitoring require-ments of the Environmental Protection Agency (EPA).
1.3 The detection limit of this method is usually dependent on the level of inter-ferences rather than instrumental limita-tions. The method detection limits (MDLs) in Table 2 typify the minimum quantity that can be detected with no interferences present.
1.4 The GCMS portions of this method are for use only by persons experienced with GCMS or under the close supervision of such qualified persons. Laboratories unfamiliar with analyses of environmental samples by GCMS should run the performance tests in Reference 3 before beginning.
1.5 Any modification of the method be-yond those expressly permitted is subject to the application and approval of alternative test procedures under 40 CFR parts 136.4 and 136.5.
2.0 Summary of Method
2.1 A 1000-mL aliquot of water is spiked with stable isotopically labeled analogs of the compounds of interest and an internal standard. The solution is adjusted to neutral pH, potassium carbonate buffer is added, and the pH is raised to 9–11.5. The chlorophenolics are converted in situ to ace-tates by the addition of acetic anhydride. After acetylation, the solution is extracted with hexane. The hexane is concentrated to a final volume of 0.5 mL, an instrument in-ternal standard is added, and an aliquot of the concentrated extract is injected into the gas chromatograph (GC). The compounds are separated by GC and detected by a mass spectrometer (MS). The labeled compounds and internal standard serve to correct the variability of the analytical technique.
2.2 Identification of a pollutant (quali-tative analysis) is performed by comparing the relative retention time and mass spec-trum to that of an authentic standard. A compound is identified when its relative re-tention time and mass spectrum agree.
2.3 Quantitative analysis is performed in one of two ways by GCMS using extracted ion-current profile (EICP) areas: (1) For those compounds listed in Table 1 for which standards and labeled analogs are available, the GCMS system is calibrated and the com-pound concentration is determined using an isotope dilution technique; (2) for those com-pounds listed in Table 1 for which authentic standards but no labeled compounds are available, the GCMS system is calibrated and the compound concentration is deter-mined using an internal standard technique.
2.4 Quality is assured through reproduc-ible calibration and testing of the extraction and GCMS systems.
3.0 Definitions
3.1 Chlorinated phenolics are the chlorinated phenols, guaiacols, catechols, vanillins, syringaldehydes and other com-pounds amenable to in situ acetylation, ex-traction, and determination by GCMS using this method.
3.2 Definitions for other terms used in this method are given in the glossary at the end of the method (Section 20.0).
4.0 Interferences
4.1 Solvents, reagents, glassware, and other sample processing hardware may yield artifacts and/or elevated baselines, causing misinterpretation of chromatograms and spectra. All materials used in the analysis shall be demonstrated to be free from inter-ferences under the conditions of analysis by running method blanks initially and with each sample batch (samples started through the extraction process on a given eight-hour shift, to a maximum of 20). Specific selection of reagents and purification of solvents by distillation in all-glass systems may be re-quired. Glassware and, where possible, re-agents are cleaned by using solvent rinse and baking at 450 °C for a minimum of one hour.
4.2 Interferences co-extracted from sam-ples will vary considerably from source to source, depending on the diversity of the site being sampled. Industry experience suggests that high levels of non-chlorinated phenols may cause poor recovery of the compounds of interest, particularly in samples collected in the vicinity of a source of creosote, such as a wood-preserving plant (Reference 1).
4.3 The internal standard, 3,4,5- trichlorophenol, has been reported to be an anaerobic degradation product of 2,3,4,5- tetrachlorophenol and/or pentachlorophenol (Reference 1). When an interference with this or another compound occurs, labeled pentachlorophenol or another labeled com-pound may be used as an alternative internal standard; otherwise, the internal standards and reference compounds must be used as specified in this method.
4.4 Blank contamination by pentachlorophenol has been reported (Ref-erence 1) to be traceable to potassium car-bonate; it has also been reported that this contamination may be removed by baking overnight at 400 to 500 °C.
4.5 Catechols are susceptible to degrada-tion by active sites on injection port liners and columns, and are subject to oxidation to the corresponding chloro-o-benzoquinones (Reference 2). A small amount of ascorbic acid may be added to samples to prevent auto-oxidation (Reference 2; also see Section 11.1.6). For pulp and paper industry samples, ascorbic acid may be added to treated efflu-ent samples only.
VerDate Mar<15>2010 09:46 Aug 24, 2012 Jkt 226176 PO 00000 Frm 00235 Fmt 8010 Sfmt 8002 Y:\SGML\226176.XXX 226176pman
grum
on
DS
K3V
PT
VN
1PR
OD
with
CF
R

226
40 CFR Ch. I (7–1–12 Edition) Pt. 430, App. A
5.0 Safety
5.1 The toxicity or carcinogenicity of each compound or reagent used in this meth-od has not been precisely determined; how-ever, each chemical compound should be treated as a potential health hazard. Expo-sure to these compounds should be reduced to the lowest possible level. The laboratory is responsible for maintaining a current awareness file of OSHA regulations regard-ing the safe handling of the chemicals speci-fied in this method. A reference file of mate-rials safety data sheets (MSDSs) should be made available to all personnel involved in these analyses. Additional information on laboratory safety can be found in References 4 through 6.
5.2 Samples may contain high concentra-tions of toxic compounds, and should be han-dled with gloves and a hood opened to pre-vent exposure.
6.0 Equipment and Supplies
NOTE: Brand names, suppliers, and part numbers are for illustrative purposes only. No endorsement is implied. Equivalent per-formance may be achieved using apparatus and materials other than those specified here, but demonstration of equivalent per-formance that meets the requirements of this method is the responsibility of the lab-oratory.
6.1 Sampling equipment for discrete or composite sampling.
6.1.1 Sample bottles and caps. 6.1.1.1 Sample bottle: Amber glass, 1000-
mL minimum, with screw-cap. If amber bot-tles are not available, samples shall be pro-tected from light.
6.1.1.2 Bottle caps: Threaded to fit sample bottles. Caps shall be lined with PTFE.
6.1.1.3 Cleaning bottles: Detergent water wash, cap with aluminum foil, and bake at 450 °C for a minimum of one hour before use.
6.1.1.4 Cleaning liners: Detergent water wash, reagent water (Section 7.4) and solvent rinse, and bake at approximately 200 °C for a minimum of 1 hour prior to use.
6.1.1.5 Bottles and liners must be lot-cer-tified to be free of chlorophenolics by run-ning blanks according to this method. If blanks from bottles and/or liners without cleaning or with fewer cleaning steps show no detectable chlorophenolics, the bottle and liner cleaning steps that do not eliminate chlorophenolics may be omitted.
6.1.2 Compositing equipment: Automatic or manual compositing system incorporating glass containers cleaned per bottle cleaning procedure above. Sample containers are kept at 0 to 4 °C during sampling. Glass or PTFE tubing only shall be used. If the sampler uses a peristaltic pump, a minimum length of compressible silicone rubber tubing may be used in the pump only. Before use, the tub-ing shall be thoroughly rinsed with meth-
anol, followed by repeated rinsing with rea-gent water (Section 7.4) to minimize sample contamination. An integrating flow meter is used to collect proportional composite sam-ples.
6.2 Extraction apparatus. 6.2.1 Bottle or beaker: 1500-to 2000-mL ca-
pacity. 6.2.2 Separatory funnel: 500-to 2000-mL,
glass, with PTFE stopcock. 6.2.3 Magnetic stirrer: Corning Model 320,
or equivalent, with stirring bar. 6.3 Polyethylene gloves: For handling
samples and extraction equipment (Fisher 11–394–110–B, or equivalent).
6.4 Graduated cylinders: 1000-mL, 100-mL, and 10-mL nominal.
6.5 Centrifuge: Capable of accepting 50- mL centrifuge tubes and achieving 3000 RPM.
6.5.1 Centrifuge tubes. 6.5.1.1 35-mL nominal, with PTFE-lined
screw-cap. 6.5.1.2 15-mL nominal, conical graduated,
with ground-glass stopper. 6.6 Concentration apparatus. 6.6.1 Kuderna-Danish (K-D) concen-
trator tube: 10-mL, graduated (Kontes K- 570050–1025, or equivalent) with calibration verified. Ground-glass stopper (size 19/22 joint) is used to prevent evaporation of ex-tracts.
6.6.2 Kuderna-Danish (K-D) evaporation flask: 1000-mL (Kontes K-570001–1000, or equivalent), attached to concentrator tube with springs (Kontes K-662750–0012).
6.6.3 Snyder column: Three-ball macro (Kontes K-503000–0232, or equivalent).
6.6.4 Snyder column: Two-ball micro (Kontes K-469002–0219, or equivalent).
6.6.5 Boiling chips: Approximately 10/40 mesh, extracted with methylene chloride and baked at 450 °C for a minimum of one hour.
6.6.6 Nitrogen evaporation apparatus: Equipped with a water bath controlled at 35 to 40 °C (N-Evap, Organomation Associates, Inc., South Berlin, MA, or equivalent), in-stalled in a fume hood. This device may be used in place of the micro-Snyder column concentrator in Section 6.6.4 above.
6.7 Water bath: Heated, with concentric ring cover, capable of temperature control (±2 °C), installed in a fume hood.
6.8 Sample vials: Amber glass, 1- to 3-mL, with PTFE-lined screw-cap.
6.9 Balances. 6.9.1 Analytical: Capable of weighing 0.1
mg. 6.9.2 Top loading: Capable of weighing 10
mg. 6.10 pH meter. 6.11 Gas chromatograph: Shall have
splitless or on-column injection port for cap-illary column, temperature program with 50 °C hold, and shall meet all of the perform-ance specifications in Section 9.
VerDate Mar<15>2010 09:46 Aug 24, 2012 Jkt 226176 PO 00000 Frm 00236 Fmt 8010 Sfmt 8002 Y:\SGML\226176.XXX 226176pman
grum
on
DS
K3V
PT
VN
1PR
OD
with
CF
R

227
Environmental Protection Agency Pt. 430, App. A
6.12 Gas chromatographic column: 30 m (±5 m) × 0.25 mm (±0.02 mm) I.D. × 0.25 mi-cron, 5% phenyl, 94% methyl, 1% vinyl sili-cone bonded-phase fused-silica capillary col-umn (J & W DB–5, or equivalent).
6.13 Mass spectrometer: 70 eV electron im-pact ionization, shall repetitively scan from 42 to 450 amu in 0.95 to 1.00 second, and shall produce a unit resolution (valleys between m/z 441–442 less than 10% of the height of the 441 peak), background-corrected mass spec-trum from 50 ng decafluorotriphenylphosphine (DFTPP) in-troduced through the GC inlet. The spectrum shall meet the mass-intensity criteria in Table 3 (Reference 7). The mass spectrometer shall be interfaced to the GC such that the end of the capillary column terminates with-in 1 cm of the ion source, but does not inter-cept the electron or ion beams. All portions of the column which connect the GC to the ion source shall remain at or above the col-umn temperature during analysis to preclude condensation of less volatile compounds.
6.14 Data system: Shall collect and record MS data, store mass-intensity data in spec-tral libraries, process GCMS data, generate reports, and compute and record response factors.
6.14.1 Data acquisition: Mass spectra shall be collected continuously throughout the analysis and stored on a mass storage device.
6.14.2 Mass spectral libraries: User-cre-ated libraries containing mass spectra ob-tained from analysis of authentic standards shall be employed to reverse search GCMS runs for the compounds of interest (Section 10.2).
6.14.3 Data processing: The data system shall be used to search, locate, identify, and quantify the compounds of interest in each GCMS analysis. Software routines shall be employed to compute retention times, and to compute peak areas at the m/z’s specified (Table 4). Displays of spectra, mass chromatograms, and library comparisons are required to verify results.
6.14.4 Response factors and multi-point calibrations: The data system shall be used to record and maintain lists of response fac-tors (response ratios for isotope dilution) and multi-point calibration curves (Section 10). Computations of relative standard deviation (coefficient of variation) are used for testing calibration linearity. Statistics on initial (Section 9.3.2) and ongoing (Section 9.6) per-formance shall be computed and maintained.
7.0 Reagents and Standards
7.1 Reagents for adjusting sample pH. 7.1.1 Sodium hydroxide: Reagent grade, 6
N in reagent water. 7.1.2 Sulfuric acid: Reagent grade, 6 N in
reagent water. 7.2 Reagents for sample preservation. 7.2.1 Sodium thiosulfate (Na2S2O3) solu-
tion (1 N): Weigh 79 g Na2S2O3 in a 1–L volu-
metric flask and dilute to the mark with rea-gent water.
7.2.2 Ascorbic acid solution: Prepare a so-lution of ascorbic acid in reagent water at a concentration of 0.1 g/mL. This solution must be prepared fresh on each day when derivatizations will be performed. Therefore, do not prepare more than will be used that day. (A 50-mL volume is sufficient for ten analyses).
7.3 Solvents: Hexane, acetone, and meth-anol. Distilled in glass (Burdick and Jack-son, or equivalent).
7.4 Reagent water: Water in which the compounds of interest and interfering com-pounds are not detected by this method.
7.5 Reagents for derivatization. 7.5.1 Potassium carbonate (K2CO3). 7.5.1.1 Purification: Spread in a shallow
baking dish, heat overnight at 400 to 500 °C. 7.5.1.2 Solution: Dissolve 150 g purified
K2CO3 in 250 mL reagent water. 7.5.2 Acetic anhydride: Redistilled reagent
grade. 7.6 Analytical standards. 7.6.1 Derivatization: Because the
chlorinated phenolics are determined as their acetate derivatives after in situ acetylation, the method requires that the calibration standards be prepared by spiking the underivatized materials into reagent water and carrying the spiked reagent water aliquot through the entire derivatization and extraction procedure that is applied to the field samples.
7.6.2 Standard solutions: Purchased as so-lutions or mixtures with certification to their purity, concentration, and authen-ticity, or prepared from materials of known purity and composition. If chemical purity of a compound is 98% or greater, the weight may be used without correction to compute the concentration of the standard. When not being used, standards are stored in the dark at ¥20 to ¥10 °C in screw-capped vials with PTFE-lined lids. A mark is placed on the vial at the level of the solution so that solvent evaporation loss can be detected. The vials are brought to room temperature prior to use.
7.6.3 If the chemical purity of any stand-ard does not meet the 98% requirement above, the laboratory must correct all cal-culations, calibrations, etc., for the dif-ference in purity.
7.7 Preparation of stock solutions: Pre-pare chlorovanillins and chlorosyringaldehydes in acetone, as these compounds are subject to degradation in methanol. Prepare the remaining chlorophenolics in methanol. Prepare all standards per the steps below. Observe the safety precautions in Section 5.
7.7.1 Dissolve an appropriate amount of assayed reference material in a suitable sol-vent. For example, weigh 50 mg (±0.1 mg) of pentachlorophenol in a 10-mL ground-glass-
VerDate Mar<15>2010 09:46 Aug 24, 2012 Jkt 226176 PO 00000 Frm 00237 Fmt 8010 Sfmt 8002 Y:\SGML\226176.XXX 226176pman
grum
on
DS
K3V
PT
VN
1PR
OD
with
CF
R

228
40 CFR Ch. I (7–1–12 Edition) Pt. 430, App. A
stoppered volumetric flask and fill to the mark with methanol. After the pentachlorophenol is completely dissolved, transfer the solution to a 15-mL vial with PTFE-lined cap.
7.7.2 Stock solutions should be checked for signs of degradation prior to the prepara-tion of calibration or performance test standards and shall be replaced after six months, or sooner if comparison with quality control check standards indicates a change in concentration.
7.8 Labeled compound spiking solution: From stock solutions prepared as above, or from mixtures, prepare one spiking solution to contain the labeled chlorovanillin in ace-tone and a second spiking solution to con-tain the remaining chlorophenolics, includ-ing the 3,4,5-trichlorophenol sample matrix internal standard (SMIS), in methanol. The labeled compounds and SMIS are each at a concentration of 12.5 μg/mL.
7.9 Secondary standards for calibration: Using stock solutions (Section 7.7), prepare one secondary standard containing the chlorovanillins and chlorsyringaldehydes listed in Table 1 in acetone and a second sec-ondary standard containing the remaining chlorophenolics in methanol. The monochlorinated phenol, guaiacol, and cat-echol are included at a concentration of 25 μg/mL; the trichlorinated catechols, tetrachlorinated guaiacol and catechol, pentachlorophenol, 5,6-dichlorovanillin, and 2,6-dichlorosyringaldehyde are included at a concentration of 100 μg/mL; and the remain-ing compounds are included at a concentra-tion of 50 μg/mL, each in their respective so-lutions.
7.10 Instrument internal standard (IIS): Prepare a solution of 2,2′-difluorobiphenyl (DFB) at a concentration of 2.5 mg/mL in hexane.
7.11 DFTPP solution: Prepare a solution of DFTPP at 50 μg/mL in acetone.
7.12 Solutions for obtaining authentic mass spectra (Section 10.2): Prepare mixtures of compounds at concentrations which will assure authentic spectra are obtained for storage in libraries.
7.13 Preparation of calibration solutions. 7.13.1 Into five 1000-mL aliquots of rea-
gent water, spike 50, 100, 200, 500 and 1000 μL of each of the two solutions in Section 7.9. Spike 1.00 mL of each of the two labeled compound spiking solutions (Section 7.8) into each of the five aliquots.
7.13.2 Using the procedure in Section 11, derivatize and extract each solution, and concentrate the extract to a final volume of 0.50 mL. This will produce calibration solu-tions of nominal 5, 10, 20, 50, and 100 μg/mL of the native chlorophenolics and a constant concentration of 25 μg/mL of each labeled compound and the SMIS (assuming 100% derivatization and recovery). As noted in Section 11.1.6, ascorbic acid is added to all
samples of final effluents to stabilize chlorocatechols, but is not added to samples of pulp and paper in-process wastewaters. Therefore, it is necessary to prepare separate sets of five initial calibration standards with and without the addition of ascorbic acid. Also, in the event that the laboratory is ex-tracting final effluent samples by both the stir-bar and separatory funnel procedures (see Section 11.3), initial calibration stand-ards should be prepared by both methods.
7.13.3 These solutions permit the relative response (labeled to unlabeled) and the re-sponse factor to be measured as a function of concentration (Sections 10.4 and 10.5).
7.13.4 The nominal 50 μg/mL standard may also be used as a calibration verification standard (see Section 9.6).
7.14 Ongoing precision and recovery (OPR) standard: Used for determination of initial (Section 9.3.2) and ongoing (Section 9.6) pre-cision and recovery. This solution is pre-pared by spiking 500 μL of each the two solu-tions of the secondary calibration standards (Section 7.9) and 1 mL of each of the two la-beled compound spiking solutions (Section 7.8) into 1000 mL of reagent water.
7.15 Stability of solutions: All standard solutions (Sections 7.7 through 7.14) shall be analyzed within 48 hours of preparation and on a monthly basis thereafter for signs of degradation. Standards will remain accept-able if the peak area at the quantitation m/ z relative to the DFB internal standard re-mains within ±15% of the area obtained in the initial analysis of the standard.
8.0 Sample Collection, Preservation, and Storage
8.1 Collect samples in glass containers (Section 6.1) following conventional sam-pling practices (Reference 9). Aqueous sam-ples are collected in refrigerated bottles using automatic sampling equipment.
8.2 Sample preservation. 8.2.1 Residual chlorine: If the sample con-
tains residual chlorine, the chlorine must be reduced to eliminate positive interference resulting from continued chlorination reac-tions. Immediately after sampling, test for residual chlorine using the following method or an alternative EPA method (Reference 10).
8.2.1.1 Dissolve a few crystals of potas-sium iodide in the sample and add three to five drops of a 1% starch solution. A blue color indicates the presence of residual chlo-rine.
8.2.1.2 If residual chlorine is found, add 1 mL of sodium thiosulfate solution (Section 7.2.1) for each 2.5 ppm of free chlorine or until the blue color disappears.
8.2.2 Acidification: Adjust pH of all aque-ous samples to <2 with sulfuric acid (Section 7.1.2). Failure to acidify samples may result in positive interferences from continued chlorination reactions.
VerDate Mar<15>2010 09:46 Aug 24, 2012 Jkt 226176 PO 00000 Frm 00238 Fmt 8010 Sfmt 8002 Y:\SGML\226176.XXX 226176pman
grum
on
DS
K3V
PT
VN
1PR
OD
with
CF
R

229
Environmental Protection Agency Pt. 430, App. A
8.2.3 Refrigeration: Maintain sample tem-perature at 0 to 4 °C from time of collection until extraction, and maintain extracts at a temperature of 0 to 4 °C from time of extrac-tion until analysis.
8.3 Collect a minimum of 2000 mL of sam-ple. This will provide a sufficient amount for all testing. Smaller amounts may be col-lected if the stream is known to contain high levels of chlorophenolics.
8.4 All samples must be acetylated and extracted within 30 days of collection, and must be analyzed within 30 days of acetylation. If labeled compound recoveries for a sample do not meet the acceptance cri-teria in Table 5 and the 30-day holding time is not met, a new sample must be collected.
9.0 Quality Control
9.1 Each laboratory that uses this method is required to operate a formal quality assur-ance program (Reference 8). The minimum requirements of this program consist of an initial demonstration of laboratory capa-bility, analysis of samples spiked with la-beled compounds to evaluate and document data quality, and analysis of standards and blanks as tests of continued performance. Laboratory performance is compared to es-tablished performance criteria to determine if the results of analyses meet the perform-ance characteristics of the method.
9.1.1 DFTPP spectrum validity shall be checked at the beginning of each eight-hour shift during which analyses are performed. This test is described in Section 9.2.
9.1.2 The laboratory shall make an initial demonstration of the ability to generate ac-ceptable results with this method. This abil-ity is established as described in Section 9.3.
9.1.3 The laboratory is permitted to mod-ify this method to improve separations or lower the costs of measurements, provided all performance specifications are met. Each time a modification is made to the method, the laboratory is required to repeat the pro-cedures in Sections 10.3 and 9.3.2 to dem-onstrate method performance. If the detec-tion limits for the analytes in this method will be affected by the modification, the lab-oratory should demonstrate that each MDL (40 CFR 136, appendix B) is less than or equal to the MDL in this method or one-third the regulatory compliance level, whichever is higher.
9.1.4 The laboratory shall spike all sam-ples with labeled compounds and the sample matrix internal standard (SMIS) to monitor method performance. This test is described in Section 9.4. When results of these spikes indicate atypical method performance for samples, the samples are diluted to bring method performance within acceptable lim-its (Section 13).
9.1.5 Analyses of blanks are required to demonstrate freedom from contamination.
The procedures and criteria for analysis of a blank are described in Section 9.5.
9.1.6 The laboratory shall, on an ongoing basis, demonstrate through analysis of the ongoing precision and recovery standard (Section 7.14) that the analysis system is in control. These procedures are described in Section 9.6.
9.1.7 The laboratory shall maintain records to define the quality of data that is generated. Development of accuracy state-ments is described in Section 9.4.4 and 9.6.3.
9.2 DFTPP spectrum validity: Inject 1 μL of the DFTPP solution (Section 7.11) either separately or within a few seconds of injec-tion of the OPR standard (Section 9.6) ana-lyzed at the beginning of each shift. The cri-teria in Table 3 shall be met.
9.3 Initial demonstration of laboratory capability.
9.3.1 Method Detection Limit (MDL): To establish the ability to detect the analytes in this method, the laboratory should deter-mine the MDL per the procedure in 40 CFR 136, appendix B using the apparatus, re-agents, and standards that will be used in the practice of this method. MDLs less than or equal to the MDLs in Table 2 should be achieved prior to the practice of this meth-od.
9.3.2 Initial precision and recovery (IPR): To establish the ability to demonstrate con-trol over the analysis system and to gen-erate acceptable precision and accuracy, the laboratory shall perform the following oper-ations:
9.3.2.1 Derivatize, extract, concentrate, and analyze four 1000-mL aliquots of the on-going precision and recovery standard (OPR; Section 7.14), according to the procedure in Section 11. Separate sets of IPR aliquots must be prepared with the addition of ascor-bic acid and without.
9.3.2.2 Using results of the four analyses, compute the average percent recovery (X) and the relative standard deviation of the re-covery (s) for each compound, by isotope di-lution for pollutants with a labeled analog, and by internal standard for pollutants with no labeled analog and for the labeled com-pounds and the SMIS.
9.3.2.3 For each compound, compare s and X with the corresponding limits for initial precision and recovery in Table 5. If s and X for all compounds meet the acceptance cri-teria, system performance is acceptable and analysis of blanks and samples may begin. If, however, any individual s exceeds the preci-sion limit or any individual X falls outside the range for recovery, system performance is unacceptable for that compound. In this event, correct the problem and repeat the test (Section 9.3.2).
9.4 Labeled compound recovery: The lab-oratory shall spike all samples with labeled compounds and the sample matrix internal
VerDate Mar<15>2010 09:46 Aug 24, 2012 Jkt 226176 PO 00000 Frm 00239 Fmt 8010 Sfmt 8002 Y:\SGML\226176.XXX 226176pman
grum
on
DS
K3V
PT
VN
1PR
OD
with
CF
R

230
40 CFR Ch. I (7–1–12 Edition) Pt. 430, App. A
standard (SMIS) to assess method perform-ance on the sample matrix.
9.4.1 Analyze each sample according to the method beginning in Section 11.
9.4.2 Compute the percent recovery (P) of the labeled compounds and the SMIS using the internal standard method (Section 14.3) with 2,2′-difluorobiphenyl as the reference compound.
9.4.3 Compare the labeled compound and SMIS recovery for each compound with the corresponding limits in Table 5. If the recov-ery of any compound falls outside its warn-ing limit, method performance is unaccept-able for that compound in that sample. Therefore, the sample is complex. The sam-ple is diluted and reanalyzed per Section 13.
9.4.4 As part of the QA program for the laboratory, it is suggested, but not required, that method accuracy for samples be as-sessed and records maintained. After the analysis of five samples for which the labeled compounds pass the tests in Section 9.4.3, compute the average percent recovery (P) and the standard deviation of the percent re-covery (sp) for the labeled compounds only. Express the accuracy assessment as a per-cent recovery interval from P¥2sp to P = 2sp for each matrix. For example, if P = 90% and sp = 10%, the accuracy interval is expressed as 70 to 110%. Update the accuracy assess-ment for each compound on a regular basis (e.g., after each 20 to 30 new accuracy meas-urements).
9.5 Blanks: Reagent water blanks are ana-lyzed to demonstrate freedom from contami-nation.
9.5.1 Extract and concentrate a 1000-mL reagent water blank with each sample batch (samples started through the extraction process on the same eight-hour shift, to a maximum of 20 samples). Blanks associated with samples to which ascorbic acid is added must be prepared with ascorbic acid, and blanks associated with samples to which ascorbic acid is not added must be prepared without ascorbic acid. Analyze the blank im-mediately after analysis of the OPR (Section 7.14) to demonstrate freedom from contami-nation.
9.5.2 If any of the compounds of interest (Table 1) or any potentially interfering com-pound is found in an aqueous blank at great-er than 5 μg/L (assuming a response factor of one relative to the sample matrix internal standard for compounds not listed in Table 1), analysis of samples is halted until the source of contamination is eliminated and a blank shows no evidence of contamination at this level.
9.6 Calibration verification and ongoing precision and recovery: At the beginning of each eight-hour shift during which analyses are performed, analytical system perform-ance is verified for all compounds. Analysis of DFTPP (Section 9.2) and the nominal 50 μg/mL OPR (Section 11.1.5) is used to verify
all performance criteria. Adjustment and/or recalibration, per Section 10, shall be per-formed until all performance criteria are met. Only after all performance criteria are met may samples and blanks be analyzed.
9.6.1 Analyze the extract of the OPR (Sec-tion 11.1.5) at the beginning of each eight- hour shift and prior to analysis of samples from the same batch. Alternatively, a sepa-rate calibration verification may be per-formed using an aliquot of the midpoint cali-bration standard from Section 7.13 (with a nominal concentration of 50 μg/mL). This al-ternative may be used to check instrument performance on failure of an OPR, or when samples extracted with an OPR aliquot are not analyzed within the same eight-hour analysis shift.
9.6.1.1 Retention times: The absolute re-tention time of 2,2′-difluorobiphenyl shall be within the range of 765 to 885 seconds, and the relative retention times of all pollutants and labeled compounds shall fall within the limits given in Table 2.
9.6.1.2 GC resolution: The valley height between 4,6-dichloroguaiacol and 3,4- dichloroguaiacol at m/z 192 shall not exceed 10% of the height of the taller of the two peaks.
9.6.1.3 Multiple peaks: Each compound in-jected shall give a single, distinct GC peak.
9.6.2 Compute the percent recovery of each pollutant (Table 1) by isotope dilution (Section 10.4) for those compounds that have labeled analogs. Compute the percent recov-ery of each pollutant that has no labeled analog by the internal standard method (Section 10.5), using the 3,4,5-trichlorophenol (SMIS) as the internal standard. Compute the percent recovery of the labeled com-pounds and the SMIS by the internal stand-ard method, using the 2,2′-difluorobiphenyl as the internal standard.
9.6.2.1 For each compound, compare the recovery with the limits for ongoing preci-sion and recovery in Table 5. If all com-pounds meet the acceptance criteria, system performance is acceptable and analysis of blanks and samples may proceed. If, how-ever, any individual recovery falls outside of the range given, system performance is unac-ceptable for that compound. In this event, there may be a problem with the GCMS or with the derivatization/extraction/con-centration systems.
9.6.2.2 GCMS system: To determine if the failure of the OPR test (Section 9.6.2.1) is due to instrument drift, analyze the current cali-bration verification extract (Section 7.13.4), calculate the percent recoveries of all com-pounds, and compare with the OPR recovery limits in Table 5. If all compounds meet these criteria, GCMS performance/stability is verified, and the failure of the OPR anal-ysis is attributed to problems in the derivatization/extraction/concentration of the OPR. In this case, analysis of the sample
VerDate Mar<15>2010 09:46 Aug 24, 2012 Jkt 226176 PO 00000 Frm 00240 Fmt 8010 Sfmt 8002 Y:\SGML\226176.XXX 226176pman
grum
on
DS
K3V
PT
VN
1PR
OD
with
CF
R

231
Environmental Protection Agency Pt. 430, App. A
extracts may proceed. However, failure of any of the recovery criteria in the analysis of a sample extract requires rederivatization of that sample (Sections 13.3.1 and 13.3.2). If, however, the performance/stability of the GCMS is not verified by analysis of the cali-bration verification extract, the GCMS re-quires recalibration and all extracts associ-ated with the failed OPR must be reanalyzed.
9.6.3 Add results that pass the specifica-tions in Section 9.6.2.1 to initial and previous ongoing data for each compound. Update QC charts to form a graphic representation of continued laboratory performance. Develop a statement of laboratory accuracy for each pollutant and labeled compound in each ma-trix type (reagent water, C-stage filtrate, E- stage filtrate, final effluent, etc.) by calcu-lating the average percent recovery (R) and the standard deviation of percent recovery (sr). Express the accuracy as a recovery in-terval from R¥ 2sr to R = 2sr. For example, if R = 95% and sr = 5%, the accuracy is 85 to 105%.
9.7 The specifications contained in this method can be met if the apparatus used is calibrated properly, then maintained in a calibrated state. The standards used for cali-bration (Section 10) and for initial (Section 9.3.2) and ongoing (Section 9.6) precision and recovery should be identical, so that the most precise results will be obtained. The GCMS instrument in particular will provide the most reproducible results if dedicated to the settings and conditions required for the analyses of chlorophenolics by this method.
9.8 Depending on specific program re-quirements, field replicates may be collected to determine the precision of the sampling technique, and spiked samples may be re-quired to determine the accuracy of the analysis when the internal standard method is used.
10.0 Calibration and Standardization
10.1 Assemble the GCMS and establish the operating conditions in Section 12. Analyze standards per the procedure in Section 12 to demonstrate that the analytical system meets the minimum levels in Table 2, and the mass-intensity criteria in Table 3 for 50 ng DFTPP.
10.2 Mass-spectral libraries: Detection and identification of compounds of interest are dependent upon spectra stored in user-cre-ated libraries.
10.2.1 Obtain a mass spectrum of the ace-tyl derivative of each chlorophenolic com-pound (pollutant, labeled compound, and the sample matrix internal standard) by derivatizing and analyzing an authentic standard either singly or as part of a mix-ture in which there is no interference be-tween closely eluting components. That only a single compound is present is determined by examination of the spectrum. Fragments not attributable to the compound under
study indicate the presence of an interfering compound.
10.2.2 Adjust the analytical conditions and scan rate (for this test only) to produce an undistorted spectrum at the GC peak maximum. An undistorted spectrum will usually be obtained if five complete spectra are collected across the upper half of the GC peak. Software algorithms designed to ‘‘en-hance’’ the spectrum may eliminate distor-tion, but may also eliminate authentic m/z’s or introduce other distortion.
10.2.3 The authentic reference spectrum is obtained under DFTPP tuning conditions (Section 10.1 and Table 3) to normalize it to spectra from other instruments.
10.2.4 The spectrum is edited by removing all peaks in the m/z 42 to 45 range, and saving the five most intense mass spectral peaks and all other mass spectral peaks greater than 10% of the base peak (excluding the peaks in the m/z 42 to 45 range). The spec-trum may be further edited to remove com-mon interfering m/z’s. The spectrum ob-tained is stored for reverse search and for compound confirmation. 10.3 Minimum level: Demonstrate that the chlorophenolics are detectable at the minimum level (per all cri-teria in Section 14). The nominal 5 μg/mL calibration standard (Section 7.13) can be used to demonstrate this performance.
10.4 Calibration with isotope dilution: Iso-tope dilution is used when (1) labeled com-pounds are available, (2) interferences do not preclude its use, and (3) the quantitation m/ z (Table 4) extracted ion-current profile (EICP) area for the compound is in the cali-bration range. Alternative labeled com-pounds and quantitation m/z’s may be used based on availability. If any of the above conditions preclude isotope dilution, the in-ternal standard calibration method (Section 10.5) is used.
10.4.1 A calibration curve encompassing the concentration range is prepared for each compound to be determined. The relative re-sponse (pollutant to labeled) vs. concentra-tion in standard solutions is plotted or com-puted using a linear regression. The example in Figure 1 shows a calibration curve for phe-nol using phenol-d5 as the isotopic diluent. Also shown are the ±10% error limits (dotted lines). Relative response (RR) is determined according to the procedures described below. A minimum of five data points are employed for calibration.
10.4.2 The relative response of a pollutant to its labeled analog is determined from iso-tope ratio values computed from acquired data. Three isotope ratios are used in this process: Rx = the isotope ratio measured for the pure
pollutant. Ry = the isotope ratio measured for the la-
beled compound. Rm = the isotope ratio of an analytical mix-
ture of pollutant and labeled compounds.
VerDate Mar<15>2010 09:46 Aug 24, 2012 Jkt 226176 PO 00000 Frm 00241 Fmt 8010 Sfmt 8002 Y:\SGML\226176.XXX 226176pman
grum
on
DS
K3V
PT
VN
1PR
OD
with
CF
R

232
40 CFR Ch. I (7–1–12 Edition) Pt. 430, App. A
The m/z’s are selected such that Rx>Ry. If Rm is not between 2Ry and 0.5Rx, the method does not apply and the sample is analyzed by the internal standard method.
10.4.3 Capillary columns sometimes sepa-rate the pollutant-labeled pair when deute-rium labeled compounds are used, with the labeled compound eluted first (Figure 2). For this case,
Rarea m z
Rarea m z
Rarea at m z
area at m z
x
y
m
= ⎡⎣⎢
⎤⎦⎥
=⎡
⎣⎢
⎤
⎦⎥
=( )( )
⎡
⎣⎢⎢
⎤
⎦⎥⎥
1
2
1
2
1
1 at the retention time of the pollutant (RT
at the retention time of the labeled compound (RT
at RT
at RT
as measured in the mixture of the pollutant and
labeled compounds (Figure 2), and RR = R
2
1
2
1 m
, ).
, ).
,.
10.4.4 When the pollutant-labeled pair is not separated (as occurs with carbon-13-la-beled compounds), or when another labeled compound with interfering spectral masses overlaps the pollutant (a case which can occur with isomeric compounds), it is nec-essary to determine the contributions of the pollutant and labeled compound to the re-spective EICP areas. If the peaks are sepa-rated well enough to permit the data system or operator to remove the contributions of the compounds to each other, the equations in Section 10.4.3 apply. This usually occurs when the height of the valley between the two GC peaks at the same m/z is less than 70 to 90% of the height of the shorter of the two peaks. If significant GC and spectral overlap occur, RR is computed using the following equation:
RRR R R
R R R
y m x
m x y
=−( ) +( )−( ) +( )
1
1
Where:
Rx is measured as shown in figure 3A, Ry is measured as shown in figure 3B, Rm is measured as shown in figure 3C.
For example, Rx = 46100/4780 = 9.644; Ry = 2650/43600 = 0.0608; Rm = 49200/48300 = 1.1019; thus, RR = 1.114. 10.4.5 To calibrate the ana-lytical system by isotope dilution, analyze a 1-μL aliquot of each of the calibration stand-ards (Section 7.13) using the procedure in Section 12. Compute the RR at each con-centration.
10.4.6 Linearity: If the ratio of relative re-sponse to concentration for any compound is constant (less than 20% coefficient of vari-ation) over the five-point calibration range, an averaged relative response/concentration ratio may be used for that compound; other-wise, the complete calibration curve for that
compound shall be used over the five-point calibration range.
10.5 Calibration by internal standard: The method contains two types of internal stand-ards, the sample matrix internal standard (SMIS) and the instrument internal standard (IIS), and they are used for different quan-titative purposes. The 3,4,5-trichlorophenol sample matrix internal standard (SMIS) is used for measurement of all pollutants with no labeled analog and when the criteria for isotope dilution (Section 10.4) cannot be met. The 2,2′-difluorobiphenyl instrument inter-nal standard (IIS) is used for determination of the labeled compounds and the SMIS. The results are used for intralaboratory statis-tics (Sections 9.4.4 and 9.6.3).
10.5.1 Response factors: Calibration re-quires the determination of response factors (RF) for both the pollutants with no labeled analog and for the labeled compounds and the SMIS. The response factor is defined by the following equation:
RFA C
A Cs is
is s
=×( )×( )
Where: As=the area of the characteristic mass for
the compound in the daily standard. Ais=the area of the characteristic mass for
the internal standard. Cis=the concentration of the internal stand-
ard (μg/mL). Cs=is the concentration of the compound in
the calibration standard (μg/mL). When this equation is used to determine
the response factors for pollutant compounds without labeled analogs, use the area (Ais) and concentration (Cis) of 3,4,5- trichlorophenol (SMIS) as the internal standard. When this equation is used to de-termine the response factors for the labeled
VerDate Mar<15>2010 09:46 Aug 24, 2012 Jkt 226176 PO 00000 Frm 00242 Fmt 8010 Sfmt 8002 Y:\SGML\226176.XXX 226176 ER
15ap
98.0
28<
/GP
H>
ER
15ap
98.0
29<
/GP
H>
ER
15ap
98.0
30<
/GP
H>
pman
grum
on
DS
K3V
PT
VN
1PR
OD
with
CF
R

233
Environmental Protection Agency Pt. 430, App. A
analogs and the SMIS, use the area (Ais) and concentration (Cis) of 2,2′-difluorobiphenyl as the internal standard.
10.5.2 The response factor is determined for at least five concentrations appropriate to the response of each compound (Section 7.13); nominally, 5, 10, 20, 50, and 100 μg/mL. The amount of SMIS added to each solution is the same (25 μg/mL) so that Cis remains constant. Likewise, the concentration of IIS is constant in each solution. The area ratio (As/Ais) is plotted versus the concentration ratio (Cs/Cis) for each compound in the stand-ard to produce a calibration curve.
10.5.3 Linearity: If the response factor (RF) for any compound is constant (less than 35% coefficient of variation) over the five- point calibration range, an averaged re-sponse factor may be used for that com-pound; otherwise, the complete calibration curve for that compound shall be used over the five-point range.
10.6 Combined calibration: By using cali-bration solutions (Section 7.13) containing the pollutants, labeled compounds, and the internal standards, a single set of analyses can be used to produce calibration curves for the isotope dilution and internal standard methods. These curves are verified each shift (Section 9) by analyzing the OPR standard, or an optional calibration verification (VER) standard. Recalibration is required only if OPR criteria (Section 9.6 and Table 5) cannot be met.
11.0 Sample Derivatization, Extraction, and Concentration
The procedure described in this section uses a stir-bar in a beaker for the derivatization. The extraction procedures applied to samples depend on the type of sample being analyzed. Extraction of sam-ples from in-process wastewaters is per-formed using a separatory funnel procedure. All calibrations, IPR, OPR, and blank anal-yses associated with in-process wastewater samples must be performed by the sepa-ratory funnel procedure.
Extraction of samples of final effluents and raw water may be performed using either the stir-bar procedure or the separatory funnel procedure. However, all calibrations, IPR, OPR, blank, and sample analyses must be performed using the same procedure. Both procedures are described below.
11.1 Preparation of all sample types for stir-bar derivatization.
11.1.1 Allow sample to warm to room tem-perature.
11.1.2 Immediately prior to measuring, shake sample vigorously to insure homo-geneity.
11.1.3 Measure 1000 mL (±10 mL) of sample into a clean 2000-mL beaker. Label the beak-er with the sample number.
11.1.4 Dilute aliquot(s).
11.1.4.1 Complex samples: For samples that are expected to be difficult to derivatize, concentrate, or are expected to overload the GC column or mass spectrom-eter, measure an additional 100 mL (±1 mL) into a clean 2000-mL beaker and dilute to a final volume of 1000-mL (±50 mL) with rea-gent water. Label with the sample number and as the dilute aliquot. However, to ensure adequate sensitivity, a 1000-mL aliquot must always be prepared and analyzed.
11.1.4.2 Pulp and paper industry samples: For in-process streams such as E-stage and C-stage filtrates and other in-process wastewaters, it may be necessary to prepare an aliquot at an additional level of dilution. In this case, dilute 10 mL (±0.1 mL) of sample to 1000-mL (±50 mL).
11.1.5 QC aliquots: For a batch of samples of the same type to be extracted at the same time (to a maximum of 20), place two 1000- mL (±10 mL) aliquots of reagent water in clean 2000-mL beakers. Label one beaker as the blank and the other as the ongoing preci-sion and recovery (OPR) aliquot. Because final effluent samples are treated with ascor-bic acid and in-process wastewater samples are not (see Section 11.1.6), prepare an OPR aliquot and a blank for the final effluent and a separate pair for the in-process samples. Treat these QC aliquots in the same fashion as the associated samples, adding ascorbic acid to the pair associated with the final effluents, and not adding ascorbic acid to the pair associated with the in-process samples.
11.1.6 Ascorbic acid: Added to stabilize chlorocatechols. However, for pulp and paper industry in-process streams and other in- process wastewaters, the addition of ascorbic acid may convert chloro-o-quinones to catechols if these quinones are present. Sep-arate calibration curves must be prepared with and without the addition of ascorbic acid (Section 7.13.2).
11.1.6.1 Spike 5 to 6 mL of the ascorbic acid solution (Section 7.2.2) into each final effluent sample, and the associated calibra-tion standards, IPR and OPR aliquots, and blank.
11.1.6.2 For pulp and paper industry C- stage filtrates, E-stage filtrates, and un-treated effluents, omit the ascorbic acid to prevent the conversion of chloro-o-quinones to catechols. Prepare calibration standards, IPR and OPR aliquots, and blanks associated with these samples without ascorbic acid as well.
11.1.7 Spike 1000 μL of the labeled com-pound spiking solution (Section 7.8) into the sample and QC aliquots.
11.1.8 Spike 500 μL of the nominal 50 μg/ mL calibration solution (Section 7.13.4) into the OPR aliquot.
11.1.9 Adjust the pH of the sample aliquots to between 7.0 and 7.1. For calibra-tion standards, IPR and OPR aliquots, and blanks, pH adjustment is not required.
VerDate Mar<15>2010 09:46 Aug 24, 2012 Jkt 226176 PO 00000 Frm 00243 Fmt 8010 Sfmt 8002 Y:\SGML\226176.XXX 226176pman
grum
on
DS
K3V
PT
VN
1PR
OD
with
CF
R

234
40 CFR Ch. I (7–1–12 Edition) Pt. 430, App. A
11.1.10 Equilibrate all sample and QC solu-tions for approximately 15 minutes, with oc-casional stirring.
11.2 Derivatization: Because derivatization must proceed rapidly, particu-larly upon the addition of the K2CO3 buffer, it is necessary to work with one sample at a time until the derivatization step (Section 11.2.3) is complete.
11.2.1 Place a beaker containing a sample or QC aliquot on the magnetic stirrer in a fume hood, drop a clean stirring bar into the beaker, and increase the speed of the stirring bar until the vortex is drawn to the bottom of the beaker.
11.2.2 Measure 25 to 26 mL of K2CO3 buffer into a graduated cylinder or other container and 25 to 26 mL of acetic acid into another.
11.2.3 Add the K2CO3 buffer to the sample or QC aliquot, immediately (within one to three seconds) add the acetic anhydride, and stir for three to five minutes to complete the derivatization.
11.3 Extraction: Two procedures are de-scribed below for the extraction of derivatized samples. The choice of extraction procedure will depend on the sample type. For final effluent samples, either of two pro-cedures may be utilized for extraction of derivatized samples. For samples of in-proc-ess wastewaters, the separatory funnel ex-traction procedure must be used.
NOTE: Whichever procedure is employed, the same extraction procedure must be used for calibration standards, IPR aliquots, OPR aliquots, blanks, and the associated field samples.
11.3.1 Stir-bar extraction of final effluents.
11.3.1.1 Add 200 mL (±20 mL) of hexane to the beaker and stir for three to five minutes, drawing the vortex to the bottom of the beaker.
11.3.1.2 Stop the stirring and drain the hexane and a portion of the water into a 500- to 1000-mL separatory funnel. Allow the lay-ers to separate.
11.3.1.3 Drain the aqueous layer back into the beaker.
11.3.1.4 The formation of emulsions can be expected in any solvent extraction proce-dure. If an emulsion forms, the laboratory must take steps to break the emulsion before proceeding. Mechanical means of breaking the emulsion include the use of a glass stir-ring rod, filtration through glass wool, and other techniques. For emulsions that resist these techniques, centrifugation is nearly 100% effective.
If centrifugation is employed to break the emulsion, drain the organic layer into a cen-trifuge tube, cap the tube, and centrifuge for two to three minutes or until the phases sep-arate. If the emulsion cannot be completely broken, collect as much of the organic phase
as possible, and measure and record the vol-ume of the organic phase collected.
If all efforts to break the emulsion fail, in-cluding centrifugation, and none of the or-ganic phase can be collected, proceed with the dilute aliquot (Section 11.1.4.2). However, use of the dilute aliquot will sacrifice the sensitivity of the method, and may not be appropriate in all cases.
11.3.1.5 Drain the organic layer into a Kuderna-Danish (K-D) apparatus equipped with a 10-mL concentrator tube. Label the K- D apparatus. It may be necessary to pour the organic layer through a funnel containing anhydrous sodium sulfate to remove any traces of water from the extract.
11.3.1.6 Repeat the extraction (Section 11.3.1.1 through 11.3.1.5) two more times using another 200-mL of hexane for each ex-traction, combining the extracts in the K-D apparatus.
11.3.1.7 Proceed with concentration of the extract, as described in Section 11.4.
11.3.2 Separatory funnel extraction of ei-ther final effluents or in-process wastewaters.
11.3.2.1 Transfer the derivatized sample or QC aliquot to a 2-L separatory funnel.
11.3.2.2 Add 200 mL (±20 mL) of hexane to the separatory funnel. Cap the funnel and ex-tract the sample by shaking the funnel for two to three minutes with periodic venting.
11.3.2.3 Allow the organic layer to sepa-rate from the water phase for a minimum of 10 minutes.
11.3.2.4 Drain the lower aqueous layer into the beaker used for derivatization (Section 11.2), or into a second clean 2-L separatory funnel. Transfer the solvent to a 1000-mL K- D flask. It may be necessary to pour the or-ganic layer through a funnel containing an-hydrous sodium sulfate to remove any traces of water from the extract.
11.3.2.5 The formation of emulsions can be expected in any solvent extraction proce-dure. If an emulsion forms, the laboratory must take steps to break the emulsion before proceeding. Mechanical means of breaking the emulsion include the use of a glass stir-ring rod, filtration through glass wool, and other techniques. For emulsions that resist these techniques, centrifugation may be re-quired.
If centrifugation is employed to break the emulsion, drain the organic layer into a cen-trifuge tube, cap the tube, and centrifuge for two to three minutes or until the phases sep-arate. If the emulsion cannot be completely broken, collect as much of the organic phase as possible, and measure and record the vol-ume of the organic phase collected. If all ef-forts to break the emulsion, including cen-trifugation, fail and none of the organic phase can be collected, proceed with the di-lute aliquot (Section 11.1.4.2). However, use
VerDate Mar<15>2010 09:46 Aug 24, 2012 Jkt 226176 PO 00000 Frm 00244 Fmt 8010 Sfmt 8002 Y:\SGML\226176.XXX 226176pman
grum
on
DS
K3V
PT
VN
1PR
OD
with
CF
R

235
Environmental Protection Agency Pt. 430, App. A
of the dilute aliquot will sacrifice the sensi-tivity of the method, and may not be appro-priate in all cases.
11.3.2.6 If drained into a beaker, transfer the aqueous layer to the 2-L separatory fun-nel (Section 11.3.2.1). Perform a second ex-traction using another 200 mL of fresh sol-vent.
11.3.2.7 Transfer the extract to the 1000- mL K-D flask in Section 11.3.2.4.
11.3.2.8 Perform a third extraction in the same fashion as above.
11.3.2.9 Proceed with concentration of the extract, as described in Section 11.4.
11.4 Macro concentration: Concentrate the extracts in separate 1000-mL K-D flasks equipped with 10-mL concentrator tubes. Add one to two clean boiling chips to the flask and attach a three-ball macro-Snyder col-umn. Prewet the column by adding approxi-mately 1 mL of hexane through the top. Place the K-D apparatus in a hot water bath so that the entire lower rounded surface of the flask is bathed with steam. Adjust the vertical position of the apparatus and the water temperature as required to complete the concentration in 15 to 20 minutes. At the proper rate of distillation, the balls of the column will actively chatter but the cham-bers will not flood. When the liquid has reached an apparent volume of 1 mL, remove the K-D apparatus from the bath and allow the solvent to drain and cool for at least 10 minutes. Remove the Snyder column and rinse the flask and its lower joint into the concentrator tube with 1 to 2 mL of hexane. A 5-mL syringe is recommended for this op-eration.
11.5 Micro-concentration: Final con-centration of the extracts may be accom-plished using either a micro-Snyder column or nitrogen evaporation.
11.5.1 Micro-Snyder column: Add a clean boiling chip and attach a two-ball micro- Snyder column to the concentrator tube. Prewet the column by adding approximately 0.5 mL hexane through the top. Place the ap-paratus in the hot water bath. Adjust the vertical position and the water temperature as required to complete the concentration in 5 to 10 minutes. At the proper rate of dis-tillation, the balls of the column will ac-tively chatter but the chambers will not flood. When the liquid reaches an apparent volume of approximately 0.2 mL, remove the apparatus from the water bath and allow to drain and cool for at least 10 minutes. Re-move the micro-Snyder column and rinse its lower joint into the concentrator tube with approximately 0.2 mL of hexane. Adjust to a final volume of 0.5 mL.
11.5.2 Nitrogen evaporation: Transfer the concentrator tube to a nitrogen evaporation device and direct a gentle stream of clean dry nitrogen into the concentrator. Rinse the sides of the concentrator tube with small
volumes of hexane, and concentrate the ex-tract to a final volume of 0.5 mL.
11.6 Spike each extract with 10 μL of the 2,2′-difluorobiphenyl IIS (Section 7.10) and transfer the concentrated extract to a clean screw-cap vial using hexane to rinse the con-centrator tube. Seal the vial with a PTFE- lined lid, and mark the level on the vial. Label with the sample number and store in the dark at ¥20 to ¥10 °C until ready for analysis.
12.0 GCMS Analysis
12.1 Establish the following operating conditions: Carrier gas flow: Helium at 30 cm/sec at 50 °C Injector temperature: 300 °C Initial temperature: 50 °C Temperature program: 8 °C/min to 270 °C Final hold: Until after 2,6-
dichlorosyringaldehyde elutes Adjust the GC conditions to meet the re-
quirements in Section 9.6.1.1 and Table 2 for analyte separation and sensitivity. Once op-timized, the same GC conditions must be used for the analysis of all standards, blanks, IPR and OPR aliquots, and samples.
12.2 Bring the concentrated extract (Sec-tion 11.6) or standard (Sections 7.13 and 7.14) to room temperature and verify that any precipitate has redissolved. Verify the level on the extract (Sections 7.13, 7.14, and 11.6) and bring to the mark with solvent if re-quired.
12.3 Inject a 1-μL volume of the standard solution or extract using on-column or splitless injection. For 0.5 mL extracts, this 1-μL injection volume will contain 50 ng of the DFB internal standard. If an injection volume other than 1 μL is used, that volume must contain 50 ng of DFB.
12.4 Start the GC column temperature ramp upon injection. Start MS data collec-tion after the solvent peak elutes. Stop data collection after the 2,6- dichlorosyringaldehyde peak elutes. Return the column to the initial temperature for analysis of the next sample.
13.0 Analysis of Complex Samples
Some samples may contain high levels (>1000 μg/L) of the compounds of interest, interfering compounds, and/or other phenolic materials. Some samples will not con-centrate to 0.5 mL (Section 11.5); others will overload the GC column and/or mass spec-trometer; others may contain amounts of phenols that may exceed the capacity of the derivatizing agent.
13.1 Analyze the dilute aliquot (Section 11.1.4) when the sample will not concentrate to 0.5 mL. If a dilute aliquot was not ex-tracted, and the sample holding time (Sec-tion 8.4) has not been exceeded, dilute an ali-quot of sample with reagent water, and derivatize and extract it (Section 11.1.4).
VerDate Mar<15>2010 09:46 Aug 24, 2012 Jkt 226176 PO 00000 Frm 00245 Fmt 8010 Sfmt 8002 Y:\SGML\226176.XXX 226176pman
grum
on
DS
K3V
PT
VN
1PR
OD
with
CF
R

236
40 CFR Ch. I (7–1–12 Edition) Pt. 430, App. A
Otherwise, dilute the extract (Section 14.7.3) and quantitate it by the internal standard method (Section 14.3).
13.2 Recovery of the 2,2′-difluorobiphenyl instrument internal standard: The EICP area of the internal standard should be within a factor of two of the area in the OPR or VER standard (Section 9.6). If the absolute areas of the labeled compounds and the SMIS are within a factor of two of the respective areas in the OPR or VER standard, and the DFB internal standard area is less than one-half of its respective area, then internal standard loss in the extract has occurred. In this case, analyze the extract from the dilute aliquot (Section 11.1.4).
13.3 Recovery of labeled compounds and the sample matrix internal standard (SMIS): SMIS and labeled compound recovery speci-fications have been developed for samples with and without the addition of ascorbic acid. Compare the recoveries to the appro-priate limits in Table 5.
13.3.1 If SMIS or labeled compound recov-eries are outside the limits given in Table 5 and the associated OPR analysis meets the recovery criteria, the extract from the dilute aliquot (Section 11.1.4) is analyzed as in Sec-tion 14.7.
13.3.2 If labeled compound or SMIS recov-ery is outside the limits given in Table 5 and the associated OPR analysis did not meet re-covery criteria, a problem in the derivatization/extraction/concentration of the sample is indicated, and the sample must be rederivatized and reanalyzed.
14.0 Data Analysis and Calculations
14.1 Qualitative determination: Identi-fication is accomplished by comparison of data from analysis of a sample or blank with data stored in the mass spectral libraries. Identification of a compound is confirmed when the following criteria are met:
14.1.1 The signals for m/z 43 (to indicate the presence of the acetyl derivative) and all characteristic m/z’s stored in the spectral li-brary (Section 10.2.4) shall be present and shall maximize within the same two consecu-tive scans.
14.1.2 Either (1) the background corrected EICP areas, or (2) the corrected relative in-tensities of the mass spectral peaks at the GC peak maximum shall agree within a fac-tor of two (0.5 to 2 times) for all m/z’s stored in the library.
14.1.3 The relative retention time shall be within the window specified in Table 2.
14.1.4 The m/z’s present in the mass spec-trum from the component in the sample that are not present in the reference mass spec-trum shall be accounted for by contaminant or background ions. If the mass spectrum is contaminated, an experienced spectrometrist (Section 1.4) shall determine the presence or absence of the compound.
14.2 Quantitative determination by iso-tope dilution: By adding a known amount of a labeled compound to every sample prior to derivatization and extraction, correction for recovery of the pollutant can be made be-cause the pollutant and its labeled analog exhibit the same effects upon derivatization, extraction, concentration, and gas chroma-tography. Relative response (RR) values for sample mixtures are used in conjunction with calibration curves described in Section 10.4 to determine concentrations directly, so long as labeled compound spiking levels are constant. For the phenol example given in Figure 1 (Section 10.4.1), RR would be equal to 1.114. For this RR value, the phenol cali-bration curve given in Figure 1 indicates a concentration of 27 μg/mL in the sample ex-tract (Cex).
14.2.1 Compute the concentration in the extract using the response ratio determined from calibration data (Section 10.4) and the following equation:
C g mL A C A RRex n l l( ) /μ = ×( ) ×( )Where: Cex = concentration of the pollutant in the
extract. An = area of the characteristic m/z for the
pollutant. Cl = concentration of the labeled compound
in the extract. Al = area of the characteristic m/z for the la-
beled compound. RR = response ratio from the initial calibra-
tion. 14.2.2 For the IPR (Section 9.3.2) and OPR
(Section 9.6), compute the percent recovery of each pollutant using the equation in Sec-tion 14.6. The percent recovery is used for the evaluation of method and laboratory per-formance, in the form of IPR (Section 9.3.2) and OPR (Section 9.6).
14.3 Quantitative determination by inter-nal standard: Compute the concentration using the response factor determined from calibration data (Section 10.5) and the fol-lowing equation:
C g mL A C A RFex s is is( ) /μ = ×( ) ×( )Where: Cex = concentration of the pollutant in the
extract. As = area of the characteristic m/z for the
pollutant. Cis = concentration of the internal standard
in the extract (see note below). Ais = area of the characteristic m/z for the in-
ternal standard. RF = response factor from the initial calibra-
tion.
NOTE: When this equation is used to com-pute the extract concentrations of native compounds without labeled analogs, use the
VerDate Mar<15>2010 09:46 Aug 24, 2012 Jkt 226176 PO 00000 Frm 00246 Fmt 8010 Sfmt 8002 Y:\SGML\226176.XXX 226176 ER
15ap
98.0
31<
/GP
H>
ER
15ap
98.0
32<
/GP
H>
pman
grum
on
DS
K3V
PT
VN
1PR
OD
with
CF
R

237
Environmental Protection Agency Pt. 430, App. A
area (Ais) and concentration (Cis) of 3,4,5- trichlorophenol (SMIS) as the internal standard.
For the IPR (Section 9.3.2) and OPR (Sec-tion 9.6), compute the percent recovery using the equation in Section 14.6.
NOTE: Separate calibration curves will be required for samples with and without the addition of ascorbic acid, and also for both extraction procedures (stir-bar and sepa-ratory funnel) where applicable.
14.4 Compute the concentration of the la-beled compounds and the SMIS using the equation in Section 14.3, but using the area and concentration of the 2,2′- difluorobiphenyl as the internal standard, and the area of the labeled compound or SMIS as As.
14.5 Compute the concentration of each pollutant compound in the sample using the following equation:
C g LC V
Vsex ex
o
= =×( )
( )μ
Where:
Cs = Concentration of the pollutant in the sample.
Cex = Concentration of the pollutant in the extract.
Vex = Volume of the concentrated extract (typically 0.5 mL).
Vo = Volume of the original sample in liters.
14.6 Compute the recovery of each labeled compound and the SMIS as the ratio of con-centration (or amount) found to the con-centration (or amount) spiked, using the fol-lowing equation:
Percent recovery =Concentration found
Concentration spiked×100
These percent recoveries are used to assess method performance according to Sections 9 and 13.
14.7 If the EICP area at the quantitation m/z for any compound exceeds the calibra-tion range of the system, three approaches are used to obtain results within the calibra-tion range.
14.7.1 If the recoveries of all the labeled compounds in the original sample aliquot meet the limits in Table 5, then the extract of the sample may be diluted by a maximum of a factor of 10, and the diluted extract re-analyzed.
14.7.2 If the recovery of any labeled com-pound is outside its limits in Table 5, or if a tenfold dilution of the extract will not bring the pollutant within the calibration range, then extract and analyze a dilute aliquot of the sample (Section 11). Dilute 100 mL, 10 mL, or an appropriate volume of sample to 1000 mL with reagent water and extract per Section 11.
14.7.3 If the recoveries of all labeled com-pounds in the original sample aliquot (Sec-tion 14.7.1) meet the limits in Table 5, and if the sample holding time has been exceeded, then the original sample extract is diluted by successive factors of 10, the DFB internal standard is added to give a concentration of 50 μg/mL in the diluted extract, and the di-luted extract is analyzed. Quantitation of all analytes is performed using the DFB inter-nal standard.
14.7.4 If the recoveries of all labeled com-pounds in the original sample aliquot (Sec-tion 14.7.1) or in the dilute aliquot (Section
14.7.2) (if a dilute aliquot was analyzed) do not meet the limits in Table 5, and if the holding time has been exceeded, re-sampling is required.
14.8 Results are reported for all pollut-ants, labeled compounds, and the sample ma-trix internal standard in standards, blanks, and samples, in units of μg/L.
14.8.1 Results for samples which have been diluted are reported at the least dilute level at which the area at the quantitation m/z is within the calibration range (Section 14.7).
14.8.2 For compounds having a labeled analog, results are reported at the least di-lute level at which the area at the quantita-tion m/z is within the calibration range (Sec-tion 14.7) and the labeled compound recovery is within the normal range for the method (Section 13.3).
15.0 Method Performance
15.1 Single laboratory performance for this method is detailed in References 1, 2, and 11. Acceptance criteria were established from multiple laboratory use of the draft method.
15.2 A chromatogram of the ongoing pre-cision and recovery standard (Section 7.14) is shown in Figure 4.
16.0 Pollution Prevention
16.1 The solvents used in this method pose little threat to the environment when recy-cled and managed properly.
VerDate Mar<15>2010 09:46 Aug 24, 2012 Jkt 226176 PO 00000 Frm 00247 Fmt 8010 Sfmt 8002 Y:\SGML\226176.XXX 226176 ER
15ap
98.0
33<
/GP
H>
ER
15ap
98.0
34<
/GP
H>
pman
grum
on
DS
K3V
PT
VN
1PR
OD
with
CF
R

238
40 CFR Ch. I (7–1–12 Edition) Pt. 430, App. A
16.2 Standards should be prepared in vol-umes consistent with laboratory use to mini-mize the volume of expired standards to be disposed.
17.0 Waste Management
17.1 It is the laboratory’s responsibility to comply with all federal, state, and local reg-ulations governing waste management, par-ticularly the hazardous waste identification rules and land disposal restrictions, and to protect the air, water, and land by mini-mizing and controlling all releases from fume hoods and bench operations. Compli-ance with all sewage discharge permits and regulations is also required.
17.2 Samples preserved with HCl or H2SO4 to pH < 2 are hazardous and must be neutral-ized before being disposed, or must be han-dled as hazardous waste.
17.3 For further information on waste management, consult ‘‘The Waste Manage-ment Manual for Laboratory Personnel’’, and ‘‘Less is Better: Laboratory Chemical Management for Waste Reduction’’, both available from the American Chemical Soci-ety’s Department of Government Relations and Science Policy, 1155 16th Street N.W., Washington, DC 20036.
18.0 References
18.1 ‘‘Chlorinated Phenolics in Water by In Situ Acetylation/GC/MS Determination,’’ Method CP–86.01, National Council of the Paper Industry for Air and Stream Improve-ment, Inc., 260 Madison Avenue, New York, NY 10016 (July 1986).
18.2 ‘‘6240-Chlorinated Phenolics (Interim Standard),’’ Draft Version, U.S. Environ-mental Protection Agency, Manchester Lab-oratory, Manchester, Washington.
18.3 ‘‘Performance Tests for the Evalua-tion of Computerized Gas Chromatography/
Mass Spectrometry Equipment and Labora-tories,’’ USEPA, EMSL Cincinnati, OH 45268, EPA–600/4–80–025 (April 1980).
18.4 ‘‘Working with Carcinogens,’’ DHEW, PHS, CDC, NIOSH, Publication 77–206 (Au-gust 1977).
18.5 ‘‘OSHA Safety and Health Standards, General Industry,’’ OSHA 2206, 29 CFR 1910 (January 1976).
18.6 ‘‘Safety in Academic Chemistry Lab-oratories,’’ ACS Committee on Chemical Safety (1979).
18.7 ‘‘Interlaboratory Validation of U. S. Environmental Protection Agency Method 1625A, Addendum Report,’’ SRI Inter-national, Prepared for Analysis and Evalua-tion Division (WH–557), USEPA, 401 M St., SW., Washington, DC 20460 (January 1985).
18.8 ‘‘Handbook of Analytical Quality Control in Water and Wastewater Labora-tories,’’ USEPA, EMSL, Cincinnati, OH 45268, EPA–600/4–79–019 (March 1979).
18.9 ‘‘Standard Practice for Sampling Water,’’ ASTM Annual Book of Standards, ASTM, Philadelphia, PA, 76 (1980).
18.10 ‘‘Methods 330.4 and 330.5 for Total Residual Chlorine,’’ USEPA, EMSL, Cin-cinnati, OH 45268, EPA 600/4–70–020 (March 1979).
18.11 ‘‘Determination of Chlorophenolics, Special Analytical Services Contract 1047, Episode 1886,’’ Analytical Technologies, Inc., Prepared for W. A. Telliard, Industrial Tech-nology Division (WH–552), USEPA, 401 M St., SW., Washington, DC 20460 (June 1990).
18.12 ‘‘Determination of Chlorophenolics by GCMS, Development of Method 1653,’’ An-alytical Technologies, Inc., Prepared for W. A. Telliard, Industrial Technology Division (WH–552), USEPA, 401 M St., SW., Wash-ington, DC 20460 (May 1991).
19.0 Tables and Figures
TABLE 1—CHLOROPHENOLIC COMPOUNDS DETERMINED BY GCMS USING ISOTOPE DILUTION AND INTERNAL STANDARD TECHNIQUES
Compound Pollutant Labeled compound
CAS registry EPA-EGD Analog CAS registry EPA-EGD
4-chlorophenol ..................................................... 106–48–9 1001 2,4-dichlorophenol ............................................... 120–83–2 1002 d3 93951–74–7 1102 2,6-dichlorophenol ............................................... 87–65–0 1003 2,4,5-trichlorophenol ............................................ 95–95–4 1004 2,4,6-trichlorophenol ............................................ 88–06–2 1005 2,3,4,6-tetrachlorophenol ..................................... 58–90–2 1006 pentachlorophenol ............................................... 87–86–5 1007 13C6 85380–74–1 1107 4-chloroguaiacol .................................................. 16766–30–6 1008 13C6 136955–39–0 1108 3,4-dichloroguaiacol ............................................. 77102–94–4 1009 4,5-dichloroguaiacol ............................................. 2460–49–3 1010 4,6-dichloroguaiacol ............................................. 16766–31–7 1011 3,4,5-trichloroguaiacol ......................................... 57057–83–7 1012 3,4,6-trichloroguaiacol ......................................... 60712–44–9 1013 4,5,6-trichloroguaiacol ......................................... 2668–24–8 1014 13C6 136955–40–3 1114 tetrachloroguaiacol .............................................. 2539–17–5 1015 13C6 136955–41–4 1115 4-chlorocatechol .................................................. 2138–22–9 1016 3,4-dichlorocatechol ............................................. 3978–67–4 1017 3,6-dichlorocatechol ............................................. 3938–16–7 1018 4,5-dichlorocatechol ............................................. 3428–24–8 1019 13C6 136955–42–5 1119
VerDate Mar<15>2010 09:46 Aug 24, 2012 Jkt 226176 PO 00000 Frm 00248 Fmt 8010 Sfmt 8002 Y:\SGML\226176.XXX 226176pman
grum
on
DS
K3V
PT
VN
1PR
OD
with
CF
R
239
Environmental Protection Agency Pt. 430, App. A
TABLE 1—CHLOROPHENOLIC COMPOUNDS DETERMINED BY GCMS USING ISOTOPE DILUTION AND INTERNAL STANDARD TECHNIQUES—Continued
Compound Pollutant Labeled compound
CAS registry EPA-EGD Analog CAS registry EPA-EGD
3,4,5-trichlorocatechol ......................................... 56961–20–7 1020 3,4,6-trichlorocatechol ......................................... 32139–72–3 1021 tetrachlorocatechol .............................................. 1198–55–6 1022 13C6 136955–43–6 1122 5-chlorovanillin ..................................................... 19463–48–0 1023 13C6 136955–44–7 1123 6-chlorovanillin ..................................................... 18268–76–3 1024 5,6-dichlorovanillin ............................................... 18268–69–4 1025 2-chlorosyringaldehyde ........................................ 76341–69–0 1026 2,6-dichlorosyringaldehyde .................................. 76330–06–8 1027 trichlorosyringol .................................................... 2539–26–6 1028
Sample matrix internal standard (SMIS)
3,4,5-trichlorophenol ............................................ 609–19–8 184
Instrument internal standard (IIS)
2,2′-difluorobiphenyl ............................................. 388–82–9 164
TABLE 2—GAS CHROMATOGRAPHY AND METHOD DETECTION LIMITS FOR CHLOROPHENOLICS
EGD No. 1 Compound
Retention time
mean (sec) 2
EGD ref No.
RRT window 3
Minimum level 4 (μg/
L)
MDL 5 (μg/L)
1001 ................ 4-chlorophenol ........................................... 691 184 0.651–0.681 1 .25 1.11 1003 ................ 2,6-dichlorophenol ..................................... 796 184 0.757–0.779 2 .5 1.39 1102 ................ 2,4-dichlorophenol-d3 ................................. 818 164 0.986–0.998 1202 ................ 2,4-dichlorophenol ..................................... 819 1102 0.997–1.006 2 .5 0.15 164 .................. 2,2′-difluorobiphenyl (I.S.) ......................... 825 164 1.000 1108 ................ 4-chloroguaiacol-13C6 ................................ 900 164 1.077–1.103 1208 ................ 4-chloroguaiacol ........................................ 900 1108 0.998–1.002 1 .25 0.09 1005 ................ 2,4,6-trichlorophenol .................................. 920 184 0.879–0.895 2 .5 0.71 1004 ................ 2,4,5-trichlorophenol .................................. 979 184 0.936–0.952 2 .5 0.57 1016 ................ 4-chlorocatechol ........................................ 1004 184 0.961–0.975 1 .25 0.59 1011 ................ 4,6-dichloroguaiacol ................................... 1021 184 0.979–0.991 2 .5 0.45 1009 ................ 3,4-dichloroguaiacol ................................... 1029 184 0.986–0.998 2 .5 0.52 184 .................. 3,4,5-trichlorophenol (I.S.) ......................... 1037 164 1.242–1.272 1010 ................ 4,5-dichloroguaiacol ................................... 1071 184 1.026–1.040 2 .5 0.52 1018 ................ 3,6-dichlorocatechol ................................... 1084 184 1.037–1.053 2 .5 0.57 1006 ................ 2,3,4,6-tetrachlorophenol ........................... 1103 184 1.050–1.078 2 .5 0.38 1123 ................ 5-chlorovanillin-13C6 .................................. 1111 164 1.327–1.367 1223 ................ 5-chlorovanillin ........................................... 1111 1123 0.998–1.001 2 .5 1.01 1013 ................ 3,4,6-trichloroguaiacol ............................... 1118 184 1.066–1.090 2 .5 0.46 1024 ................ 6-chlorovanillin ........................................... 1122 184 1.070–1.094 2 .5 0.94 1017 ................ 3,4-dichlorocatechol ................................... 1136 184 1.083–1.105 2 .5 0.60 1119 ................ 4,5-dichlorocatechol-13C6 .......................... 1158 164 1.384–1.424 1219 ................ 4,5-dichlorocatechol ................................... 1158 1119 0.998–1.001 2 .5 0.24 1012 ................ 3,4,5-trichloroguaiacol ............................... 1177 184 1.120–1.160 2 .5 0.49 1114 ................ 4,5,6-trichloroguaiacol-13C6 ....................... 1208 164 1.444–1.484 1214 ................ 4,5,6-trichloroguaiacol ............................... 1208 1114 0.998–1.002 2 .5 0.25 1021 ................ 3,4,6-trichlorocatechol ............................... 1213 184 1.155–1.185 5 .0 0.44 1025 ................ 5,6-dichlorovanillin ..................................... 1246 184 1.182–1.222 5 .0 0.80 1026 ................ 2-chlorosyringaldehyde .............................. 1255 184 1.190–1.230 2 .5 0.87 1107 ................ pentachlorophenol-13C6 ............................. 1267 164 1.511–1.561 1207 ................ pentachlorophenol ..................................... 1268 1107 0.998–1.002 5 .0 0.28 1020 ................ 3,4,5-trichlorocatechol ............................... 1268 184 1.208–1.238 5 .0 0.53 1115 ................ tetrachloroguaiacol-13C6 ............................ 1289 164 1.537–1.587 1215 ................ tetrachloroguaiacol .................................... 1290 1115 0.998–1.002 5 .0 0.23 1028 ................ trichlorosyringol .......................................... 1301 184 1.240–1.270 2 .5 0.64 1122 ................ tetrachlorocatechol-13C6 ............................ 1365 164 1.630–1.690 1222 ................ tetrachlorocatechol .................................... 1365 1122 0.998–1.002 5 .0 0.76 1027 ................ 2,6-dichlorosyringaldehyde ........................ 1378 184 1.309–1.349 5 .0 1.13
1 Four digit numbers beginning with 10 indicate a pollutant quantified by the internal standard method; four digit numbers be-ginning with 11 indicate a labeled compound quantified by the internal standard method; four digit numbers beginning with 12 in-dicate a pollutant quantified by isotope dilution.
2 The retention times in this column are based on data from a single laboratory (reference 12), utilizing the GC conditions in Section 11.
3 Relative retention time windows are estimated from EPA Method 1625. 4 The minimum level (ML) is defined as the level at which the entire analytical system must give a recognizable signal and ac-
ceptable calibration point for the analyte. It is equivalent to the concentration of the lowest calibration standard, assuming that all method-specified sample weights, volumes, and cleanup procedures have been employed.
VerDate Mar<15>2010 09:46 Aug 24, 2012 Jkt 226176 PO 00000 Frm 00249 Fmt 8010 Sfmt 8002 Y:\SGML\226176.XXX 226176pman
grum
on
DS
K3V
PT
VN
1PR
OD
with
CF
R

240
40 CFR Ch. I (7–1–12 Edition) Pt. 430, App. A
5 40 CFR part 136, appendix B; from reference 2.
TABLE 3—DFTPP MASS INTENSITY SPECIFICATIONS 1
Mass Intensity required
51 ............................................................................................................................... 8 to 82% of m/z 198. 68 ............................................................................................................................... Less than 2% of m/z 69. 69 ............................................................................................................................... 11 to 91% of m/z 198. 70 ............................................................................................................................... Less than 2% of m/z 69. 127 ............................................................................................................................. 32 to 59% of m/z 198. 197 ............................................................................................................................. Less than 1% of m/z 198. 198 ............................................................................................................................. Base peak, 100% abundance. 199 ............................................................................................................................. 4 to 9% of m/z 198. 275 ............................................................................................................................. 11 to 30% of m/z 198. 441 ............................................................................................................................. 44 to 110% of m/z 443. 442 ............................................................................................................................. 30 to 86% of m/z 198. 443 ............................................................................................................................. 14 to 24% of m/z 442.
1 Reference 7.
TABLE 4—CHARACTERISTIC M/Z’S OF CHLOROPHENOLIC COMPOUNDS
Compound Primary m/z
4-chlorophenol ........................................................................................................................................................... 128 2,4-dichlorophenol ..................................................................................................................................................... 162 2,4-dichlorophenol-d3 ................................................................................................................................................ 167 2,6-dichlorophenol ..................................................................................................................................................... 162 2,4,5-trichlorophenol .................................................................................................................................................. 196 2,4,6-trichlorophenol .................................................................................................................................................. 196 2,3,4,6-tetrachlorophenol ........................................................................................................................................... 232 pentachlorophenol ..................................................................................................................................................... 266 pentachlorophenol¥13C6 ........................................................................................................................................... 272 4-chloroguaiacol ........................................................................................................................................................ 158 4-chloroguaiacol¥13C6 ............................................................................................................................................... 164 3,4-dichloroguaiacol .................................................................................................................................................. 192 4,5-dichloroguaiacol .................................................................................................................................................. 192 4,6-dichloroguaiacol .................................................................................................................................................. 192 3,4,5-trichloroguaiacol ............................................................................................................................................... 226 3,4,6-trichloroguaiacol ............................................................................................................................................... 226 4,5,6-trichloroguaiacol ............................................................................................................................................... 226 4,5,6-trichloroguaiacol¥13C6 ...................................................................................................................................... 234 tetrachloroguaiacol .................................................................................................................................................... 262 tetrachloroguaiacol¥13C6 ........................................................................................................................................... 268 4-chlorocatechol ........................................................................................................................................................ 144 3,4-dichlorocatechol .................................................................................................................................................. 178 3,6-dichlorocatechol .................................................................................................................................................. 178 4,5-dichlorocatechol .................................................................................................................................................. 178 4,5-dichlorocatechol¥13C6 ......................................................................................................................................... 184 3,4,5-trichlorocatechol ............................................................................................................................................... 212 3,4,6-trichlorocatechol ............................................................................................................................................... 212 tetrachlorocatechol .................................................................................................................................................... 248 tetrachlorocatechol¥13C6 ........................................................................................................................................... 254 5-chlorovanillin ........................................................................................................................................................... 186 5-chlorovanillin¥13C6 ................................................................................................................................................. 192 6-chlorovanillin ........................................................................................................................................................... 186 5,6-dichlorovanillin ..................................................................................................................................................... 220 2-chlorosyringaldehyde ............................................................................................................................................. 216 2,6-dichlorosyringaldehyde ........................................................................................................................................ 250 trichlorosyringol ......................................................................................................................................................... 256
Sample Matrix Internal Standard (SMIS)
3,4,5-trichlorophenol .................................................................................................................................................. 196
Instrument Internal Standard (IIS)
2,2′-difluorobiphenyl .................................................................................................................................................. 190
VerDate Mar<15>2010 09:46 Aug 24, 2012 Jkt 226176 PO 00000 Frm 00250 Fmt 8010 Sfmt 8002 Y:\SGML\226176.XXX 226176pman
grum
on
DS
K3V
PT
VN
1PR
OD
with
CF
R

241
Environmental Protection Agency Pt. 430, App. A
TABLE 5—ACCEPTANCE CRITERIA FOR PERFORMANCE TESTS 1
EGD No. 2 Compound Test
conc. 3 (μg/mL)
Initial precision and recovery sec. 9.3.2
(percent) Ongoing recovery sec. 9.6 (percent)
Labeled compound and SMIS recovery sec. 9.4 and 14.6
s X
With ascorbic acid P
(%)
Without ascorbic acid P
(%)
1001 .......... 4-chlorophenol ....................................... 25 64 72–144 40–236 1202 .......... 2,4-dichlorophenol ................................. 50 14 84–120 84–118 1102 .......... 2,4-dichlorophenol-d3 ............................. 25 54 64–160 56–170 58–135 27–143 1003 .......... 2,6-dichlorophenol ................................. 50 20 66–148 58–170 1004 .......... 2,4,5-trichlorophenol .............................. 50 14 78–140 82–128 1005 .......... 2,4,6-trichlorophenol .............................. 50 20 72–142 72–146 1006 .......... 2,3,4,6-tetrachlorophenol ....................... 50 14 80–132 82–132 1207 .......... pentachlorophenol ................................. 100 6 90–111 84–120 1107 .......... pentachlorophenol-13C6 ......................... 25 21 58–169 61–157 8–143 27–167 1208 .......... 4-chloroguaiacol .................................... 25 20 88–120 88–120 1108 .......... 4-chloroguaiacol-13C6 ............................ 25 104 68–148 64–152 59–121 43–168 1009 .......... 3,4-dichloroguaiaco 4 ............................. 50 18 80–126 82–126 1010 .......... 4,5-dichloroguaiacol ............................... 50 14 82–121 80–128 1011 .......... 4,6-dichloroguaiacol ............................... 50 16 82–126 86–120 1012 .......... 3,4,5-trichloroguaiacol ........................... 50 16 78–130 80–134 1013 .......... 3,4,6-trichloroguaiacol ........................... 50 16 64–152 74–140 1214 .......... 4,5,6-trichloroguaiacol ........................... 50 14 92–106 88–116 1114 .......... 4,5,6-trichloroguaiacol-13C6 ................... 25 48 66–146 74–140 48–131 51–139 1215 .......... tetrachloroguaiacol ................................ 100 7 84–115 81–126 1115 .......... tetrachloroguaiacol-13C6 ........................ 25 22 57–173 65–161 35–120 27–161 1016 .......... 4-chlorocatechol .................................... 25 48 76–140 80–124 1017 .......... 3,4-dichlorocatechol ............................... 50 24 66–154 78–134 1018 .......... 3,6-dichlorocatechol ............................... 50 16 78–136 84–126 1219 .......... 4,5-dichlorocatechol ............................... 50 8 84–118 86–122 1119 .......... 4,5-dichlorocatechol-13C6 ...................... 25 78 68–144 66–142 33–129 0–190 1020 .......... 3,4,5-trichlorocatechol ........................... 100 17 60–166 72–128 1021 .......... 3,4,6-trichlorocatechol 4 ......................... 100 17 74–138 64–149 1222 .......... tetrachlorocatechol ................................ 100 29 46–234 81–132 1122 .......... tetrachlorocatechol-13C6 ........................ 25 39 48–227 63–152 14–118 0–184 1223 .......... 5-chlorovanillin ....................................... 50 20 94–208 84–118 1123 .......... 5-chlorovanillin-13C6 .............................. 25 84 68–160 70–144 51–126 32–254 1024 .......... 6-chlorovanillin ....................................... 50 22 82–128 80–126 1025 .......... 5,6-dichlorovanillin ................................. 100 9 67–146 77–140 1026 .......... 2-chlorosyringaldehyde .......................... 50 28 76–130 72–156 1027 .......... 2,6-dichlorosyringaldehyde .................... 100 14 82–129 60–183 1028 .......... trichlorosyringol ...................................... 50 18 76–136 66–174
Sample Matrix Internal Standard
184 ............ 3,4,5-trichlorophenol .............................. 100 47 62–185 68–144 56–116 24–167
1 Specifications derived from multi-laboratory testing of draft method. 2 Four-digit numbers beginning with 10 indicate a pollutant quantified by the internal standard method; four-digit numbers be-
ginning with 11 indicate a labeled compound quantified by the internal standard method; four-digit numbers beginning with 12 in-dicate a pollutant quantified by isotope dilution.
3 Test concentrations are in units of μg/mL. 4 Specification derived from isomer.
VerDate Mar<15>2010 09:46 Aug 24, 2012 Jkt 226176 PO 00000 Frm 00251 Fmt 8010 Sfmt 8006 Y:\SGML\226176.XXX 226176pman
grum
on
DS
K3V
PT
VN
1PR
OD
with
CF
R

242
40 CFR Ch. I (7–1–12 Edition) Pt. 430, App. A
VerDate Mar<15>2010 09:46 Aug 24, 2012 Jkt 226176 PO 00000 Frm 00252 Fmt 8010 Sfmt 8006 Y:\SGML\226176.XXX 226176 ER
15ap
98.0
35<
/GP
H>
pman
grum
on
DS
K3V
PT
VN
1PR
OD
with
CF
R

243
Environmental Protection Agency Pt. 430, App. A
VerDate Mar<15>2010 09:46 Aug 24, 2012 Jkt 226176 PO 00000 Frm 00253 Fmt 8010 Sfmt 8006 Y:\SGML\226176.XXX 226176 ER
15ap
98.0
36<
/GP
H>
pman
grum
on
DS
K3V
PT
VN
1PR
OD
with
CF
R

244
40 CFR Ch. I (7–1–12 Edition) Pt. 430, App. A
VerDate Mar<15>2010 09:46 Aug 24, 2012 Jkt 226176 PO 00000 Frm 00254 Fmt 8010 Sfmt 8006 Y:\SGML\226176.XXX 226176 ER
15ap
98.0
37<
/GP
H>
pman
grum
on
DS
K3V
PT
VN
1PR
OD
with
CF
R

245
Environmental Protection Agency Pt. 430, App. A
20.0 Glossary of Definitions and Purposes
These definitions and purposes are specific to this method but have been conformed to common usage as much as possible.
20.1 Units of weight and measure and their abbreviations
20.1.1 Symbols. °C degrees Celsius μL microliter < less than > greater than % percent
20.1.2 Alphabetical characters. cm centimeter g gram h hour ID inside diameter in. inch L liter M Molecular ion m meter mg milligram min minute mL milliliter
mm millimeter m/z mass-to-charge ratio N normal; gram molecular weight of solute
divided by hydrogen equivalent of solute, per liter of solution
OD outside diameter pg picogram ppb part-per-billion ppm part-per-million ppt part-per-trillion psig pounds-per-square inch gauge v/v volume per unit volume w/v weight per unit volume
20.2 Definitions and acronyms (in alpha-betical order).
Analyte: A chlorophenolic tested for by this method.
The analytes are listed in Table 1. Calibration standard (CAL): A solution
prepared from a secondary standard and/or stock solutions and used to calibrate the re-sponse of the instrument with respect to analyte concentration.
VerDate Mar<15>2010 09:46 Aug 24, 2012 Jkt 226176 PO 00000 Frm 00255 Fmt 8010 Sfmt 8002 Y:\SGML\226176.XXX 226176 ER
15ap
98.0
38<
/GP
H>
pman
grum
on
DS
K3V
PT
VN
1PR
OD
with
CF
R

246
40 CFR Ch. I (7–1–12 Edition) Pt. 432
Calibration verification standard (VER): The mid-point calibration standard (CS3) that is used to verify calibration. See Table 4.
Chlorophenolics: collectively, the analytes listed in Table 1.
CS1, CS2, CS3, CS4, CS5: See Calibration standards and Table 4.
Field blank: An aliquot of reagent water or other reference matrix that is placed in a sample container in the laboratory or the field, and treated as a sample in all respects, including exposure to sampling site condi-tions, storage, preservation, and all analyt-ical procedures. The purpose of the field blank is to determine if the field or sample transporting procedures and environments have contaminated the sample.
GC: Gas chromatograph or gas chroma-tography.
HRGC: High resolution GC. IPR: Initial precision and recovery; four
aliquots of the diluted PAR standard ana-lyzed to establish the ability to generate ac-ceptable precision and accuracy. An IPR is performed prior to the first time this method is used and any time the method or instru-mentation is modified.
K-D: Kuderna-Danish concentrator; a de-vice used to concentrate the analytes in a solvent.
Laboratory blank: See Method blank. Laboratory control sample (LCS): See On-
going precision and recovery standard (OPR). Laboratory reagent blank: See Method
blank. May: This action, activity, or procedural
step is neither required nor prohibited. May not: This action, activity, or proce-
dural step is prohibited. Method blank: An aliquot of reagent water
that is treated exactly as a sample including exposure to all glassware, equipment, sol-vents, reagents, internal standards, and sur-rogates that are used with samples. The method blank is used to determine if analytes or interferences are present in the laboratory environment, the reagents, or the apparatus.
Minimum level (ML): The level at which the entire analytical system must give a rec-ognizable signal and acceptable calibration point for the analyte. It is equivalent to the concentration of the lowest calibration standard, assuming that all method-specified sample weights, volumes, and cleanup proce-dures have been employed.
MS: Mass spectrometer or mass spectrom-etry.
Must: This action, activity, or procedural step is required.
OPR: Ongoing precision and recovery standard (OPR); a laboratory blank spiked with known quantities of analytes. The OPR is analyzed exactly like a sample. Its purpose is to assure that the results produced by the laboratory remain within the limits speci-
fied in this method for precision and recov-ery.
PAR: Precision and recovery standard; sec-ondary standard that is diluted and spiked to form the IPR and OPR.
Preparation blank: See Method blank. Primary dilution standard: A solution con-
taining the specified analytes that is pur-chased or prepared from stock solutions and diluted as needed to prepare calibration solu-tions and other solutions.
Quality control check sample (QCS): A sample containing all or a subset of the analytes at known concentrations. The QCS is obtained from a source external to the lab-oratory or is prepared from a source of standards different from the source of cali-bration standards. It is used to check labora-tory performance with test materials pre-pared external to the normal preparation process.
Reagent water: Water demonstrated to be free from the analytes of interest and poten-tially interfering substances at the method detection limit for the analyte.
Relative standard deviation (RSD): The standard deviation times 100 divided by the mean.
RF: Response factor. See Section 10.5.1. RR: Relative response. See Section 10.4.4. RSD: See Relative standard deviation. Should: This action, activity, or proce-
dural step is suggested but not required. Stock solution: A solution containing an
analyte that is prepared using a reference material traceable to EPA, the National In-stitute of Science and Technology (NIST), or a source that will attest to the purity and authenticity of the reference material.
VER: See Calibration verification stand-ard.
PART 431 [RESERVED]
PART 432—MEAT AND POULTRY PRODUCTS POINT SOURCE CAT-EGORY
Sec. 432.1 General applicability. 432.2 General definitions. 432.3 General limitation or standard for pH. 432.5 Incorporation by reference.
Subpart A—Simple Slaughterhouses
432.10 Applicability. 432.11 Special definitions. 432.12 Effluent limitations attainable by the
application of the best practicable con-trol technology currently available (BPT).
432.13 Effluent limitations attainable by the application of the best available tech-nology economically achievable (BAT).
VerDate Mar<15>2010 09:46 Aug 24, 2012 Jkt 226176 PO 00000 Frm 00256 Fmt 8010 Sfmt 8010 Y:\SGML\226176.XXX 226176pman
grum
on
DS
K3V
PT
VN
1PR
OD
with
CF
R


![Pt. 86, App. I 40 CFR Ch. I (7–1–14 Edition) · 851 Environmental Protection Agency Pt. 86, App. I EPA URBAN DYNAMOMETER—Continued DRIVING SCHEDULE [Speed versus Time Sequence]](https://static.fdocuments.us/doc/165x107/5b1bd21f7f8b9a41258f0fec/pt-86-app-i-40-cfr-ch-i-7114-edition-851-environmental-protection.jpg)


![Pt. 86, App. I - gpo.gov · 544 Pt. 86, App. I 40 CFR Ch. I (7–1–12 Edition) EPA URBAN DYNAMOMETER—Continued DRIVING SCHEDULE [Speed versus Time Sequence] Time (sec…](https://static.fdocuments.us/doc/165x107/5b1bd21f7f8b9a41258f0ff1/pt-86-app-i-gpogov-544-pt-86-app-i-40-cfr-ch-i-7112-edition.jpg)

![FORUM Viewer App 3 - zeiss.com · Conteúdo Manual do utilizador FORUM Viewer App Versão de software 3.0 [000000-2241-957-GA-PT-011018] 1 000000-2241-957-GA-Conteúdo-PT](https://static.fdocuments.us/doc/165x107/60053ef79c5c9530f6427fb1/forum-viewer-app-3-zeisscom-contedo-manual-do-utilizador-forum-viewer-app-verso.jpg)