Environmental Product Declaration Step
41
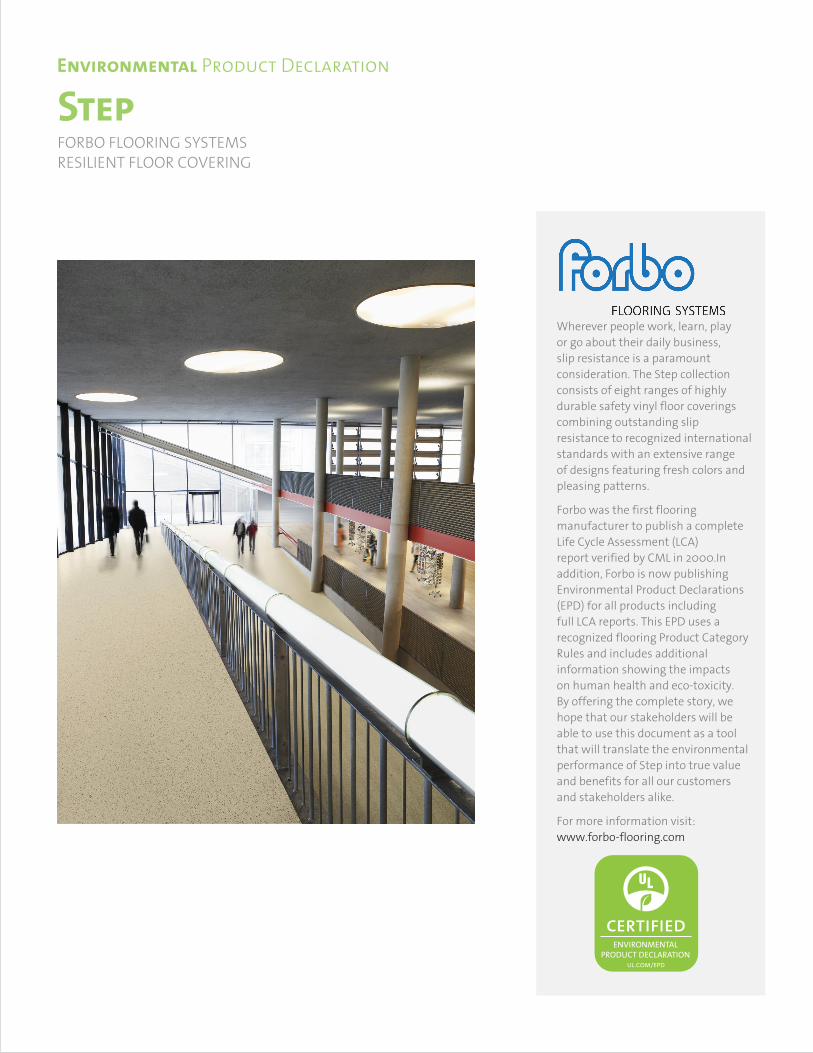
Step Environmental Product Declaration Wherever people work, learn, play or go about their daily business, slip resistance is a paramount consideration. The Step collection consists of eight ranges of highly durable safety vinyl floor coverings combining outstanding slip resistance to recognized international standards with an extensive range of designs featuring fresh colors and pleasing patterns. Forbo was the first flooring manufacturer to publish a complete Life Cycle Assessment (LCA) report verified by CML in 2000.In addition, Forbo is now publishing Environmental Product Declarations (EPD) for all products including full LCA reports. This EPD uses a recognized flooring Product Category Rules and includes additional information showing the impacts on human health and eco-toxicity. By offering the complete story, we hope that our stakeholders will be able to use this document as a tool that will translate the environmental performance of Step into true value and benefits for all our customers and stakeholders alike. For more information visit: www.forbo-flooring.com FORBO FLOORING SYSTEMS RESILIENT FLOOR COVERING
Transcript of Environmental Product Declaration Step
StepEnvironmental Product Declaration
Wherever people work, learn, play or go about their daily business, slip resistance is a paramount consideration. The Step collection consists of eight ranges of highly durable safety vinyl floor coverings combining outstanding slip resistance to recognized international standards with an extensive range of designs featuring fresh colors and pleasing patterns.
Forbo was the first flooring manufacturer to publish a complete Life Cycle Assessment (LCA) report verified by CML in 2000.In addition, Forbo is now publishing Environmental Product Declarations (EPD) for all products including full LCA reports. This EPD uses a recognized flooring Product Category Rules and includes additional information showing the impacts on human health and eco-toxicity. By offering the complete story, we hope that our stakeholders will be able to use this document as a tool that will translate the environmental performance of Step into true value and benefits for all our customers and stakeholders alike.
For more information visit: www.forbo-flooring.com
FORBO FLOORING SYSTEMSRESILIENT FLOOR COVERING
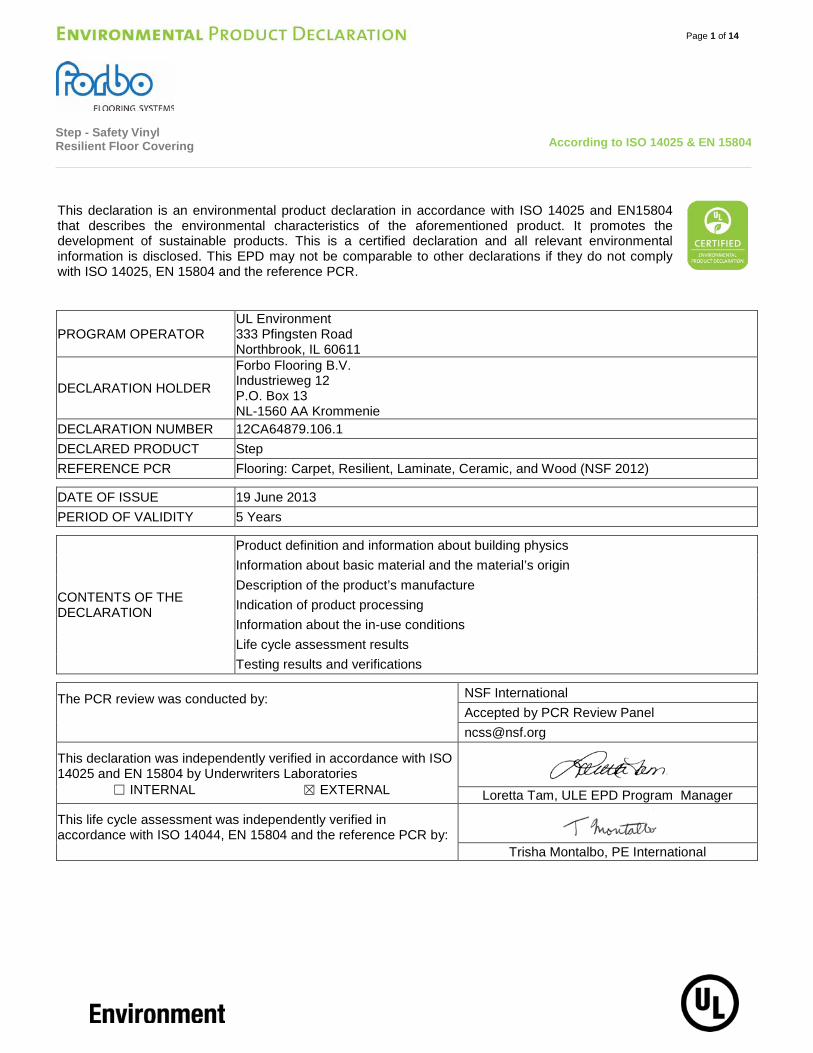
Step - Safety Vinyl Resilient Floor Covering
According to ISO 14025 & EN 15804
Page 1 of 14
This declaration is an environmental product declaration in accordance with ISO 14025 and EN15804 that describes the environmental characteristics of the aforementioned product. It promotes the development of sustainable products. This is a certified declaration and all relevant environmental information is disclosed. This EPD may not be comparable to other declarations if they do not comply with ISO 14025, EN 15804 and the reference PCR.
PROGRAM OPERATOR UL Environment 333 Pfingsten Road Northbrook, IL 60611
DECLARATION HOLDER
Forbo Flooring B.V. Industrieweg 12 P.O. Box 13 NL-1560 AA Krommenie
DECLARATION NUMBER 12CA64879.106.1 DECLARED PRODUCT Step REFERENCE PCR Flooring: Carpet, Resilient, Laminate, Ceramic, and Wood (NSF 2012) DATE OF ISSUE 19 June 2013 PERIOD OF VALIDITY 5 Years
CONTENTS OF THE DECLARATION
Product definition and information about building physics Information about basic material and the material’s origin Description of the product’s manufacture Indication of product processing Information about the in-use conditions Life cycle assessment results Testing results and verifications
The PCR review was conducted by: NSF International
Accepted by PCR Review Panel [email protected]
This declaration was independently verified in accordance with ISO 14025 and EN 15804 by Underwriters Laboratories ☐ INTERNAL ☒ EXTERNAL
Loretta Tam, ULE EPD Program Manager
This life cycle assessment was independently verified in accordance with ISO 14044, EN 15804 and the reference PCR by:
Trisha Montalbo, PE International
Step - Safety Vinyl Resilient Floor Covering
According to ISO 14025 & EN 15804
Page 2 of 14
Product Definition
Product Classification and Description
This declaration covers the “Step” collection of slip resistant project vinyl products (Safety Vinyl).The Step safety vinyl collection covers a range of products of different slip resistant properties, designs and colors.
Step from Forbo Flooring is a resilient floor covering complying with all the requirements of EN-ISO 10582: Heterogeneous polyvinyl chloride floor coverings – Specification and EN 13845: Polyvinyl chloride floor coverings with particle based enhanced slip resistance – Specification. The key raw materials include PVC, plasticizer, mineral filler, stabilizers and glass fiber tissue and slip resistant particles.
The Step collection of Safety Vinyl is produced by Forbo Flooring and is sold worldwide.
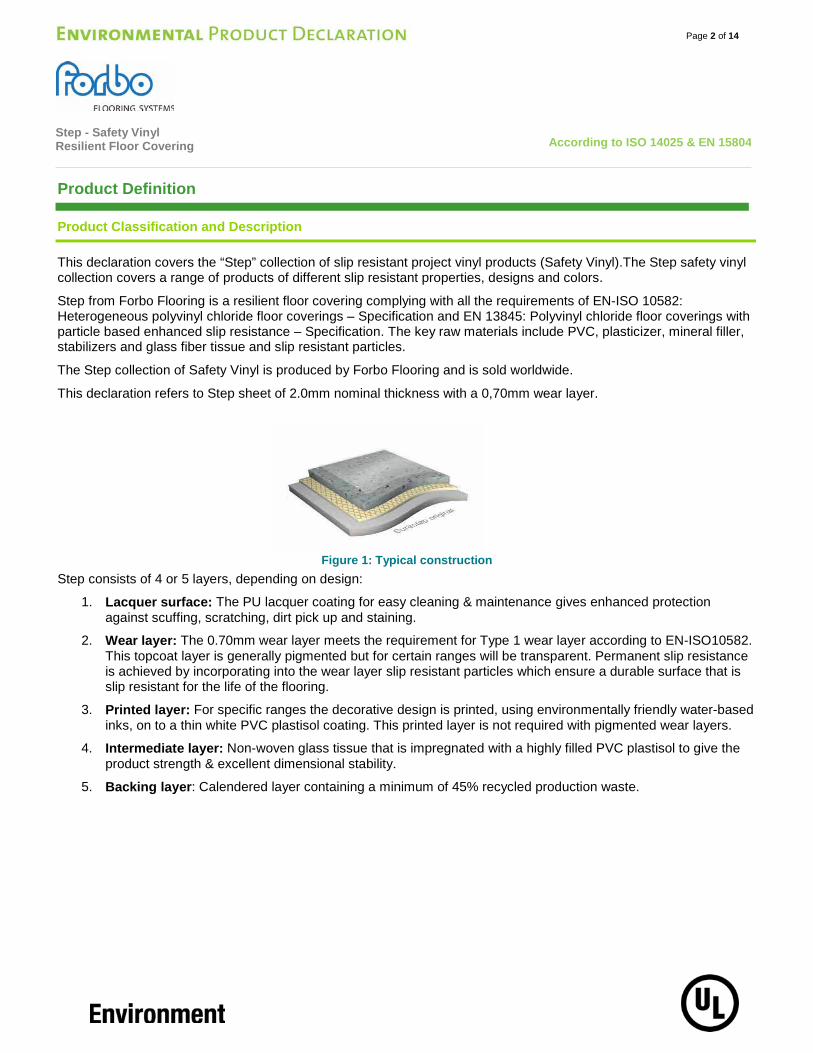
This declaration refers to Step sheet of 2.0mm nominal thickness with a 0,70mm wear layer.
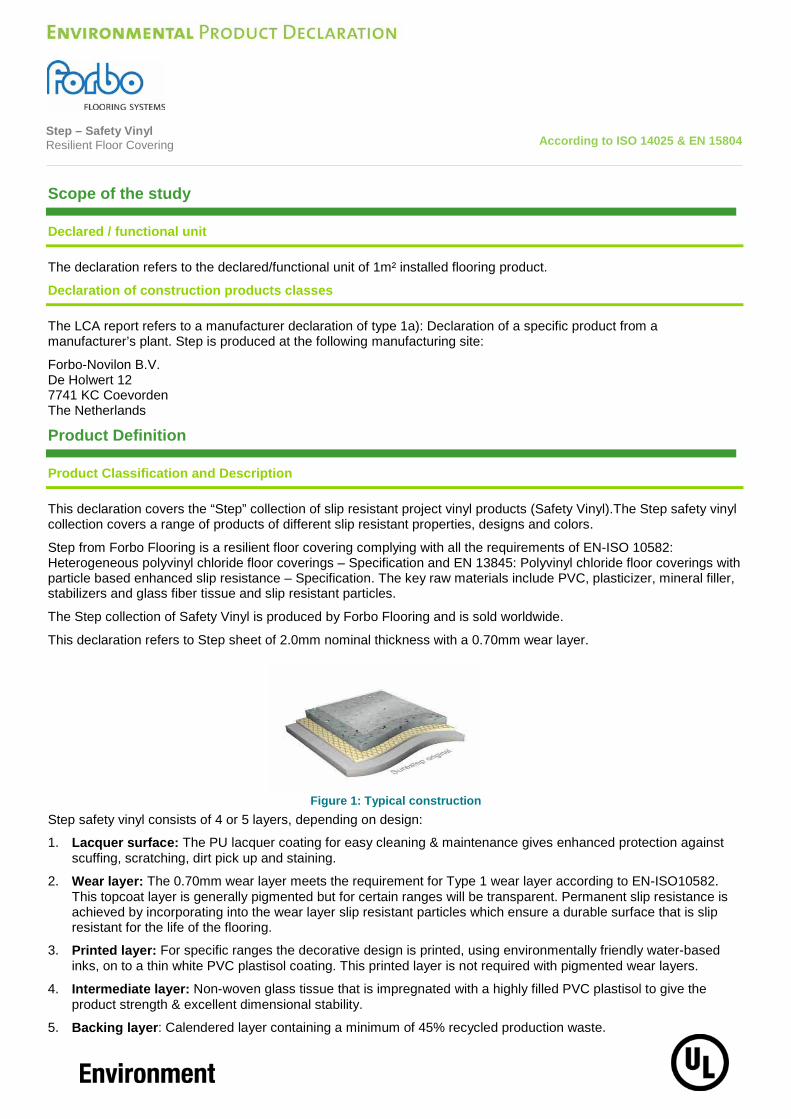
Figure 1: Typical construction Step consists of 4 or 5 layers, depending on design:
1. Lacquer surface: The PU lacquer coating for easy cleaning & maintenance gives enhanced protection against scuffing, scratching, dirt pick up and staining.
2. Wear layer: The 0.70mm wear layer meets the requirement for Type 1 wear layer according to EN-ISO10582. This topcoat layer is generally pigmented but for certain ranges will be transparent. Permanent slip resistance is achieved by incorporating into the wear layer slip resistant particles which ensure a durable surface that is slip resistant for the life of the flooring.
3. Printed layer: For specific ranges the decorative design is printed, using environmentally friendly water-based inks, on to a thin white PVC plastisol coating. This printed layer is not required with pigmented wear layers.
4. Intermediate layer: Non-woven glass tissue that is impregnated with a highly filled PVC plastisol to give the product strength & excellent dimensional stability.
5. Backing layer: Calendered layer containing a minimum of 45% recycled production waste.
Step - Safety Vinyl Resilient Floor Covering
According to ISO 14025 & EN 15804
Page 3 of 14
Range of Applications
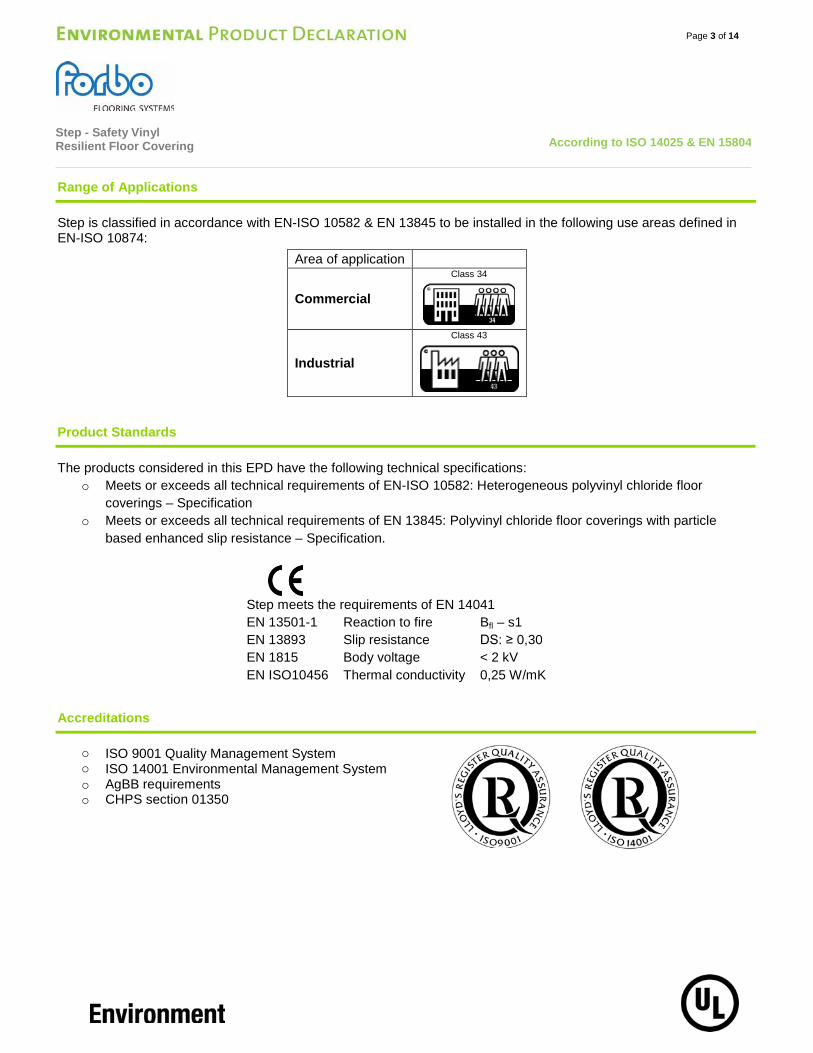
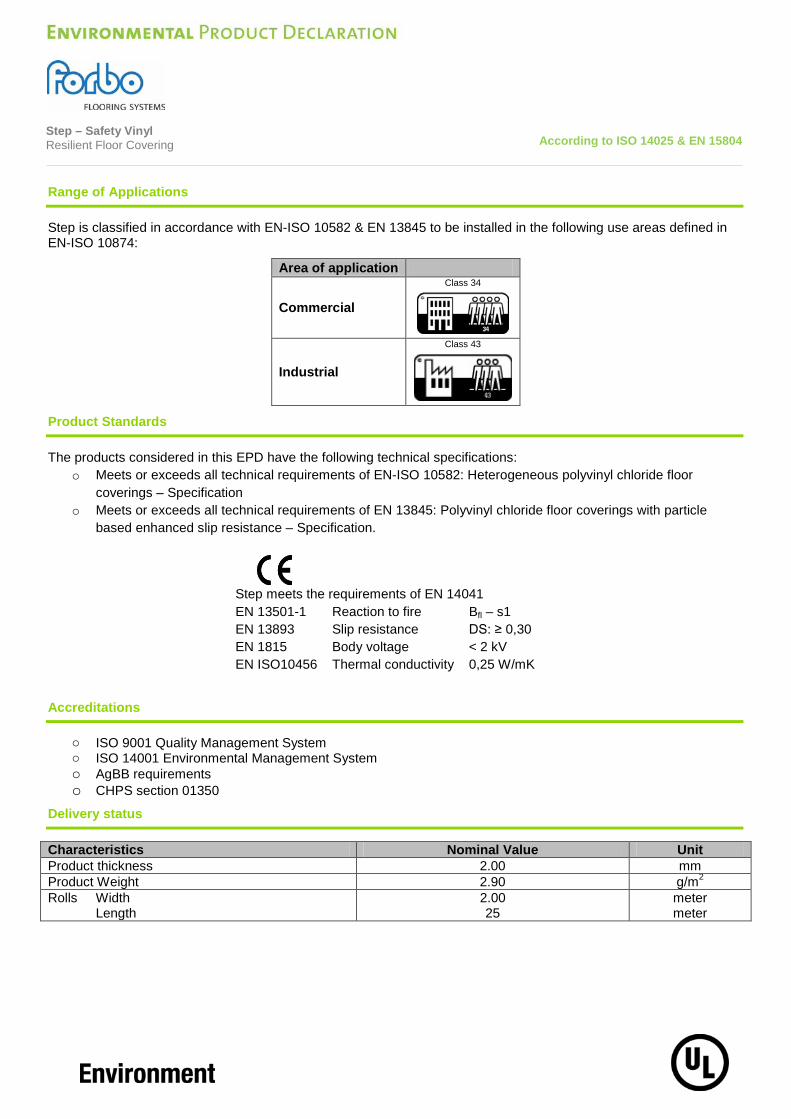
Step is classified in accordance with EN-ISO 10582 & EN 13845 to be installed in the following use areas defined in EN-ISO 10874:
Area of application
Commercial
Class 34
Industrial
Class 43
Product Standards
The products considered in this EPD have the following technical specifications: o Meets or exceeds all technical requirements of EN-ISO 10582: Heterogeneous polyvinyl chloride floor
coverings – Specification o Meets or exceeds all technical requirements of EN 13845: Polyvinyl chloride floor coverings with particle
based enhanced slip resistance – Specification.
Step meets the requirements of EN 14041 EN 13501-1 Reaction to fire Bfl – s1 EN 13893 Slip resistance DS: ≥ 0,30 EN 1815 Body voltage < 2 kV EN ISO10456 Thermal conductivity 0,25 W/mK
Accreditations
o ISO 9001 Quality Management System o ISO 14001 Environmental Management System o AgBB requirements o CHPS section 01350
Step - Safety Vinyl Resilient Floor Covering
According to ISO 14025 & EN 15804
Page 4 of 14
Delivery Status
Table 1: Specification of delivered product
Characteristics Nominal Value Unit Product thickness 2.00 mm Product Weight 2.90 kg/m2
Rolls Width Length
2.00 25
meter
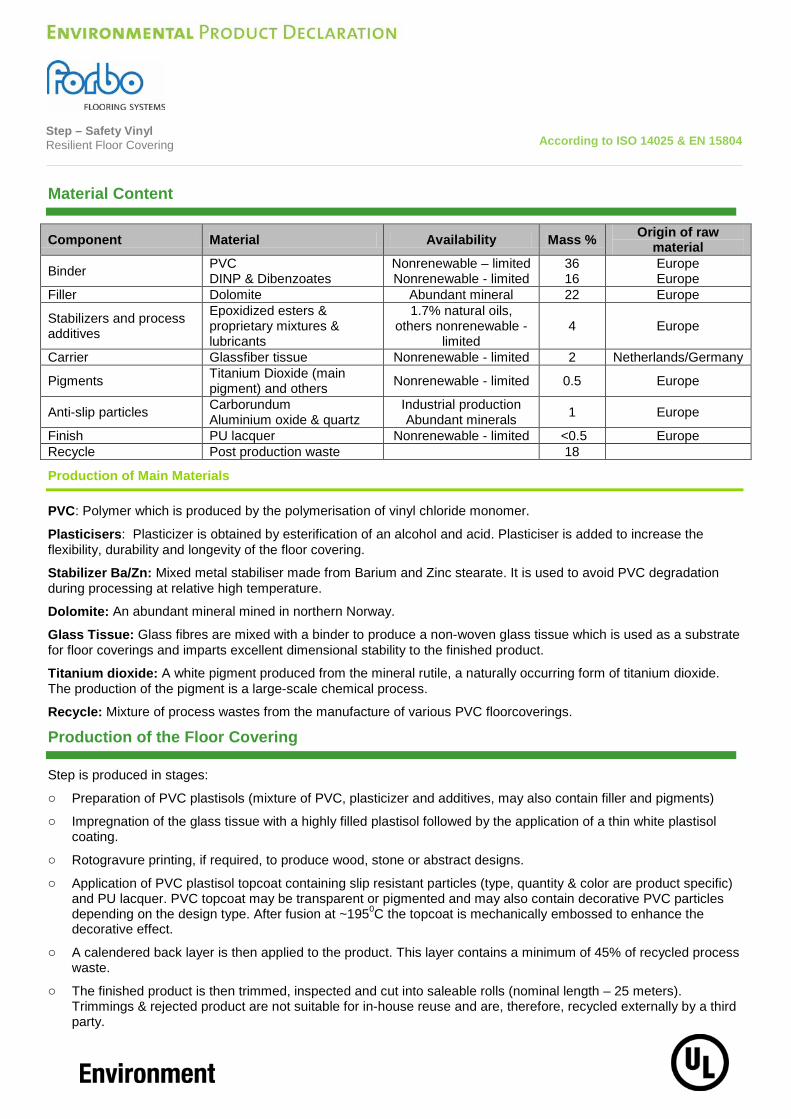
Material Content
Material Content of the Product
Table 2: Composition of Step
Component Material Availability Amount [%] Origin of raw material
Binder PVC DINP & Dibenzoates
Nonrenewable – limited Nonrenewable - limited
36 16
Europe Europe
Filler Dolomite Abundant mineral 22 Europe
Stabilizers and process additives
Epoxidized esters & proprietary mixtures & lubricants
1.7% natural oils, others nonrenewable - limited 4 Europe
Carrier Glassfiber tissue Nonrenewable - limited 2 Netherlands/Germany
Pigments Titanium Dioxide (main pigment) and others Nonrenewable - limited 0.5 Europe
Anti-slip particles Carborundum Aluminium oxide & quartz
Industrial production Abundant minerals 1 Europe
Finish PU lacquer Nonrenewable - limited <0.5 Europe Recycle Post production waste 18
Production of Main Materials
PVC: Polymer which is produced by the polymerisation of vinyl chloride monomer.
Plasticisers: Plasticizer is obtained by esterification of an alcohol and acid. Plasticiser is added to increase the flexibility, durability and longevity of the floor covering.
Stabilizer Ba/Zn: Mixed metal stabiliser made from Barium and Zinc stearate. It is used to avoid PVC degradation during processing at relative high temperature.
Dolomite: An abundant mineral mined in northern Norway.
Glass Tissue: Glass fibres are mixed with a binder to produce a non-woven glass tissue which is used as a substrate for floor coverings and imparts excellent dimensional stability to the finished product.
Titanium dioxide: A white pigment produced from the mineral rutile, a naturally occurring form of titanium dioxide. The production of the pigment is a large-scale chemical process.
Recycle: Mixture of process wastes from the manufacture of various PVC floorcoverings.
Step - Safety Vinyl Resilient Floor Covering
According to ISO 14025 & EN 15804
Page 5 of 14
Production of the Floor Covering
Step is produced in stages:
o Preparation of PVC plastisols (mixture of PVC, plasticizer and additives, may also contain filler and pigments)
o Impregnation of the glass tissue with a highly filled plastisol followed by the application of a thin white plastisol coating.
o Rotogravure printing, if required, to produce wood, stone or abstract designs.
o Application of PVC plastisol topcoat containing slip resistant particles (type, quantity & color are product specific) and PU lacquer. PVC topcoat may be transparent or pigmented and may also contain decorative PVC particles depending on the design type. After fusion at ~1950C the topcoat is mechanically embossed to enhance the decorative effect.
o A calendered back layer is then applied to the product. This layer contains a minimum of 45% of recycled process waste.
o The finished product is then trimmed, inspected and cut into saleable rolls (nominal length – 25 meters). Trimmings & rejected product are not suitable for in-house reuse and are, therefore, recycled externally by a third party.
Health, Safety and Environmental Aspects during Production
o ISO 14001 Environmental Management System
Production Waste
Rejected material and the cuttings of the trimming stage are recycled externally as it is currently not possible to reuse this waste internally. Packaging materials are being collected separately and externally recycled.
Delivery and Installation of the Floor Covering
Delivery
A worldwide distribution by truck and container ship is considered. On average every square meter of Step is transported as follows:
o Transport distance 40 t truck 660 km o Transport distance 7.5t truck (Fine distribution) 290 km o Capacity utilization trucks (including empty runs) 85 % o Transport distance Ocean ship 3837 km o Capacity utilization Ocean ship 48%
Installation
Because of the specific techniques used during the installation of Step approximately 6% of the material is cut off as installation waste. For installation of Step on the floor a scenario has been modeled assuming 0.30 kg/m2 of adhesive is applied to the sub-floor. Waste during the installation process may be thermally recycled in a waste incineration plant.
Step - Safety Vinyl Resilient Floor Covering
According to ISO 14025 & EN 15804
Page 6 of 14
Health, Safety and Environmental Aspects during Installation
Forbo flooring recommends the use of (low) zero emission adhesives for installing Step floorcovering.
Waste
As it is currently not possible for Forbo Flooring to reuse Step flooring it is recommended that any waste from the installation process is thermally recycled in a waste incineration plant.
Packaging
Cardboard tubes and packaging paper can be collected separately and should be used in a local recycling process. In the calculation model, 100% incineration is taken into account for which there is a credit received.
Use stage
The service lifetime of a floor covering for a certain application on a floor is too widespread to give one common number. For this EPD model the reference service lifetime (RSL) is set to one year. This means that all impacts for the use phase are based on the cleaning and maintenance model for one year. Depending on the area of use, the technical lifetime advised by the manufacturer and the estimated time on the floor by the customer, the service lifetime can be determined. The use phase impacts should be calculated with the foreseen service life to arrive at the total environmental impact.
Cleaning and Maintenance
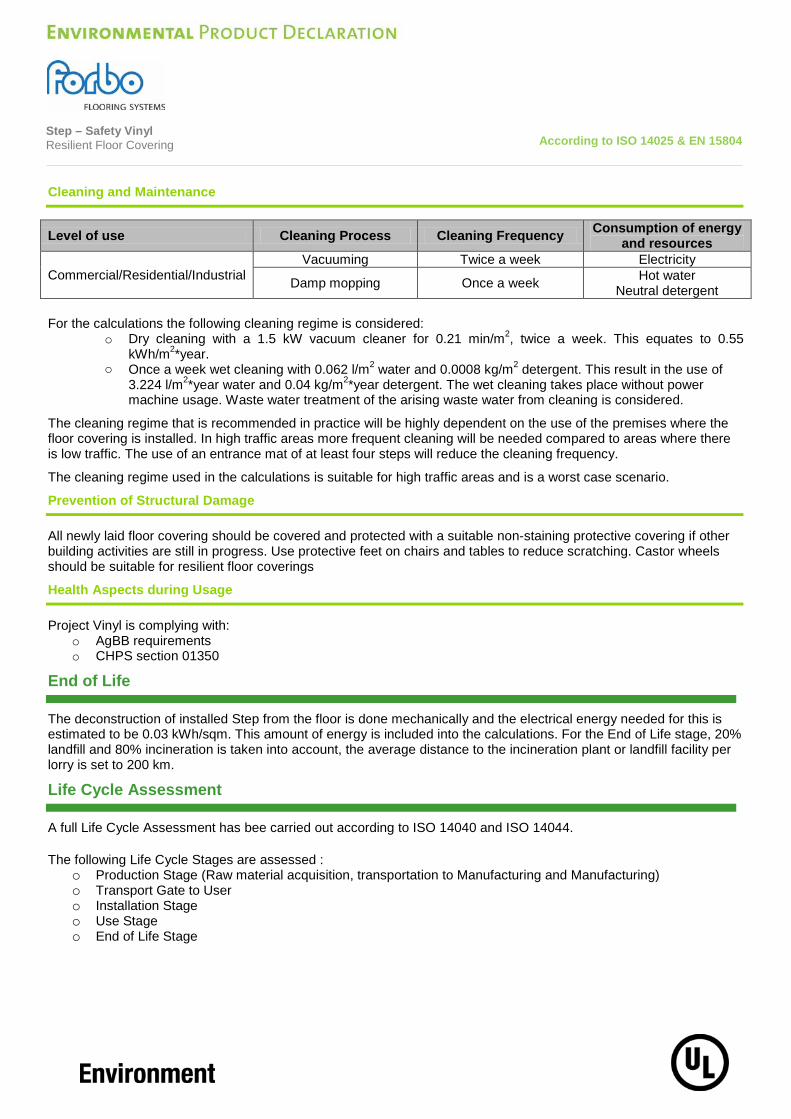
Level of use Cleaning Process Cleaning Frequency Consumption of energy and resources
Commercial/Residential Vacuuming Twice a week Electricity
Wet Cleaning Once a week Hot water Neutral detergent
For the calculations the following cleaning regime is considered:
o Dry cleaning with a 1.5 kW vacuum cleaner for 0.21 min/m2, twice a week. This equates to 0.55 kWh/m2*year.
o Once a week wet cleaning with 0.062 l/m2 water and 0.0008 kg/m2 detergent. This result in the use of 3.224 l/m2*year water and 0.04 kg/m2*year detergent. The wet cleaning takes place without power machine usage. Waste water treatment of the arising waste water from cleaning is considered (Data sourced from Forbo GABI model).
The cleaning regime that is recommended in practice will be highly dependent on the use of the premises where the floor covering is installed. In high traffic areas more frequent cleaning will be needed compared to areas where there is low traffic. The use of an entrance mat of at least four steps will reduce the cleaning frequency.
The cleaning regime used in the calculations is suitable for high traffic areas.
Prevention of Structural Damage
All newly laid floor covering should be covered and protected with a suitable non-staining protective covering if other building activities are still in progress. Use protective feet on chairs and tables to reduce scratching. Castor wheels should be suitable for resilient floor coverings.
Step - Safety Vinyl Resilient Floor Covering
According to ISO 14025 & EN 15804
Page 7 of 14
Health Aspects during Usage
Step is complying with: o AgBB requirements o CHPS section 01350
End of Life
The deconstruction of installed Step from the floor is done mechanically and the electrical energy needed for this is estimated to be 0.03 kWh/sqm. This amount of energy is included into the calculations. For the End of Life stage, 20% landfill and 80% incineration is taken into account, the average distance to the incineration plant or landfill facility per lorry is set to 200 km.
Life Cycle Assessment
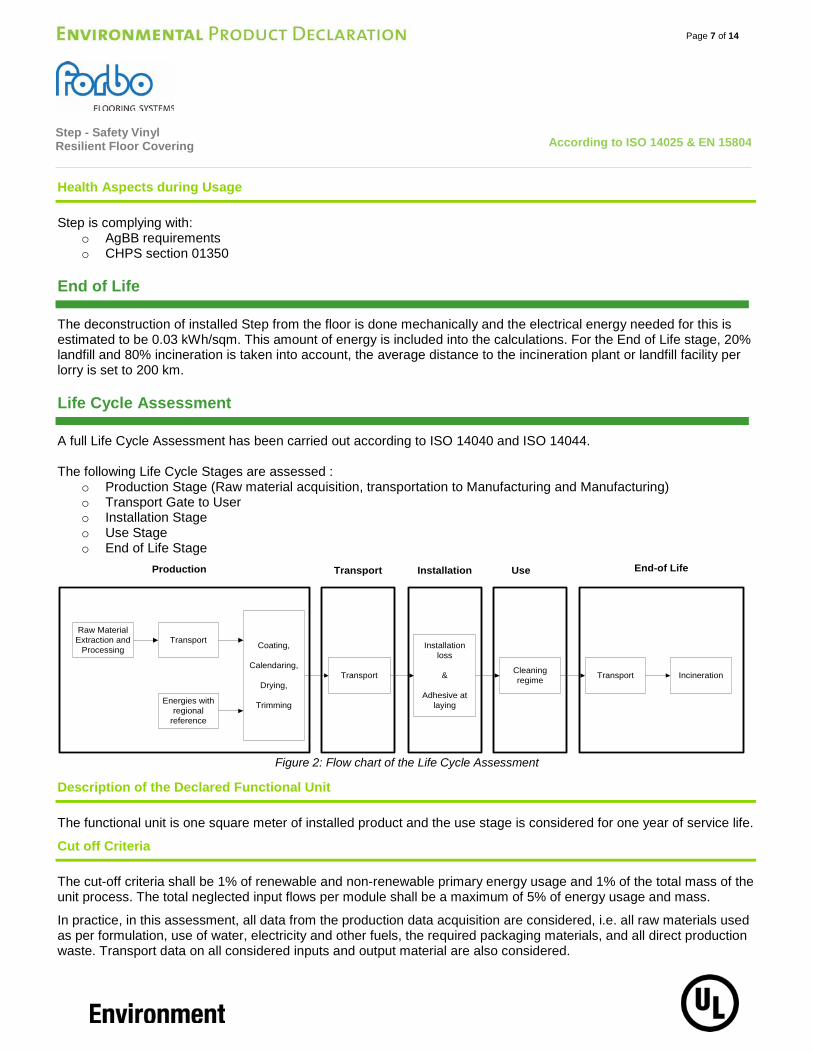
A full Life Cycle Assessment has been carried out according to ISO 14040 and ISO 14044. The following Life Cycle Stages are assessed :
o Production Stage (Raw material acquisition, transportation to Manufacturing and Manufacturing) o Transport Gate to User o Installation Stage o Use Stage o End of Life Stage
Raw Material Extraction and
Processing
Energies with regional
reference
Coating,
Calendaring,
Drying,
Trimming
Transport
Transport
Installation loss
&
Adhesive at laying
Cleaning regime Transport Incineration
Production Transport Installation Use End-of Life
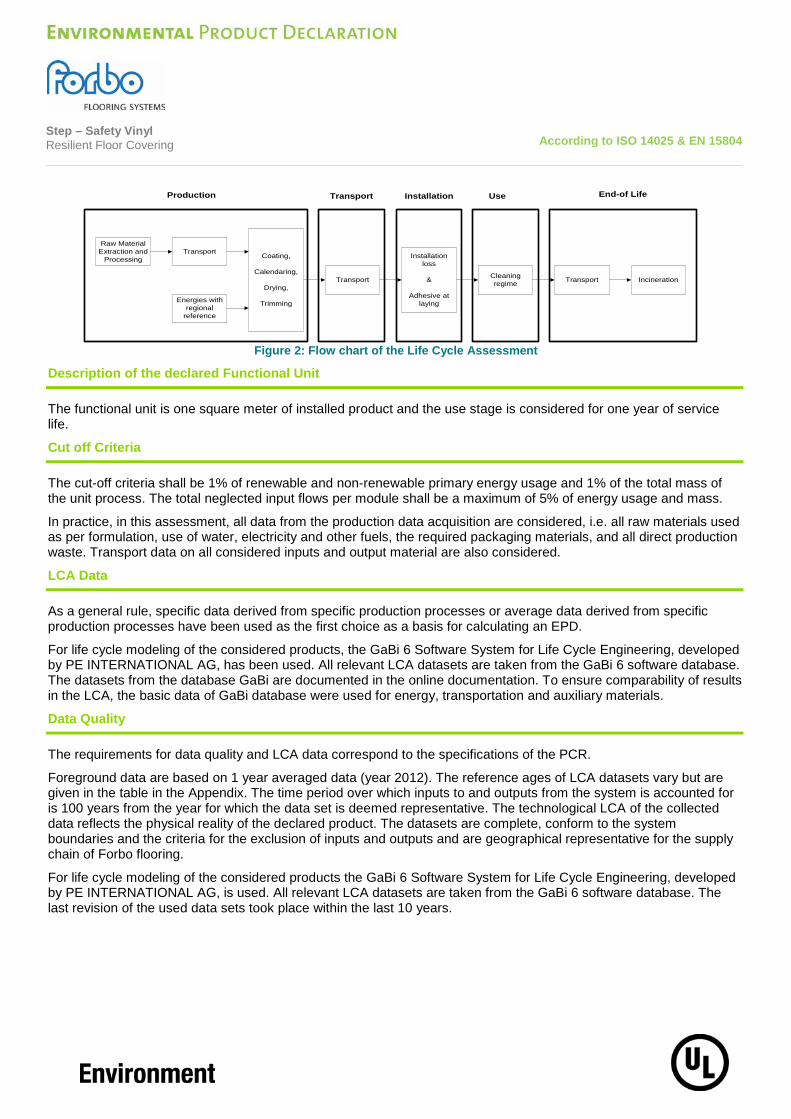
Figure 2: Flow chart of the Life Cycle Assessment
Description of the Declared Functional Unit
The functional unit is one square meter of installed product and the use stage is considered for one year of service life.
Cut off Criteria
The cut-off criteria shall be 1% of renewable and non-renewable primary energy usage and 1% of the total mass of the unit process. The total neglected input flows per module shall be a maximum of 5% of energy usage and mass.
In practice, in this assessment, all data from the production data acquisition are considered, i.e. all raw materials used as per formulation, use of water, electricity and other fuels, the required packaging materials, and all direct production waste. Transport data on all considered inputs and output material are also considered.
Step - Safety Vinyl Resilient Floor Covering
According to ISO 14025 & EN 15804
Page 8 of 14
Allocations
In the present study some allocations have been made. Detailed explanations can be found in the chapters below.
Co-product allocation
No co-product allocation occurs in the product system.
Allocation of multi-input processes
The Production and End of Life stage include incineration plants. In these processes different products are treated together within a process. The allocation procedures followed in these cases are based on a physical classification of the mass flows or calorific values.
Credits from energy substitution are allocated to the production stage, because the gained energy from energy substitution is lower than the energy input in this stage. The same quality of energy is considered.
Allocation procedure of reuse, recycling and recovery
The installation waste and end of life waste is fed into incineration processes. Incineration processes include cogeneration processes which give thermal and power energy as outputs. It is assumed that this recovered energy offsets that produced by the European average grid mix and thermal energy generation from natural gas.
Description of the allocation processes in the LCA report
The description of allocation rules in of this LCA report meets the requirements of the PCR.
Background Data
As a general rule, specific data derived from specific production processes or average data derived from specific production processes have been used as the first choice as a basis for calculating an EPD.
For life cycle modeling of the considered products, the GaBi 6 Software System for Life Cycle Engineering, developed by PE INTERNATIONAL AG has been used. All relevant LCA datasets are taken from the GaBi 6 software database. The datasets from the database GaBi are documented in the online documentation. To ensure comparability of results in the LCA, the basic data of GaBi database were used for energy, transportation and auxiliary materials.
Data Quality
The requirements for data quality and LCA data correspond to the specifications of the PCR.
Foreground data are based on 1 year averaged data (year 2012). The reference ages of LCA datasets vary but are given in the table in the Appendix. The time period over which inputs to and outputs from the system is accounted for is 100 years from the year for which the data set is deemed representative. The technological LCA of the collected data reflects the physical reality of the declared product. The datasets are complete, conform to the system boundaries and the criteria for the exclusion of inputs and outputs and are geographical representative for the supply chain of Forbo flooring.
For life cycle modeling of the considered products the GaBi 6 Software System for Life Cycle Engineering, developed by PE INTERNATIONAL AG, is used. All relevant LCA datasets are taken from the GaBi 6 software database. The last revision of the used data sets took place within the last 10 years.
Step - Safety Vinyl Resilient Floor Covering
According to ISO 14025 & EN 15804
Page 9 of 14
System Boundaries
Production Stage includes provision of all materials, products and energy, packaging processing and its transport, as well as waste processing up to the end-of waste state or disposal of final residues during the product stage.
Transport and Installation Stage includes provision of all materials, products and energy, as well as waste processing up to the end-of-waste state or disposal of final residues during the construction stage. These information modules also include all impacts and aspects related to any losses during this construction stage (i.e. production, transport, and waste processing and disposal of the lost products and materials). For the transportation a worldwide distribution is considered.
Use Stage includes provision and transport of all materials, products and related energy and water use, as well as waste processing up to the end-of-waste state or disposal of final residues during this part of the use stage. These information modules also include all impacts and aspects related to the losses during this part of the use stage (i.e. production, transport, and waste processing and disposal of the lost products and materials).
End of Life Stage includes provision and all transports, provision of all materials, products and related energy and water use. It also includes any declared benefits and loads from net flows leaving the product system that have not been allocated as co-products and that have passed the end-of-waste state in the form of reuse, recovery and/or recycling potentials.
Power mix
The selection of LCA data for the electricity generation is in line with the PCR.
The products are manufactured in Coevorden, the Netherlands. The GaBi 6 Hydropower dataset has therefore been used (reference year 2009). The energy supplier is providing Forbo with a certificate every year.
CO2-Certificates
No CO2-certificates are considered in this study.
Life Cycle Inventory Analysis
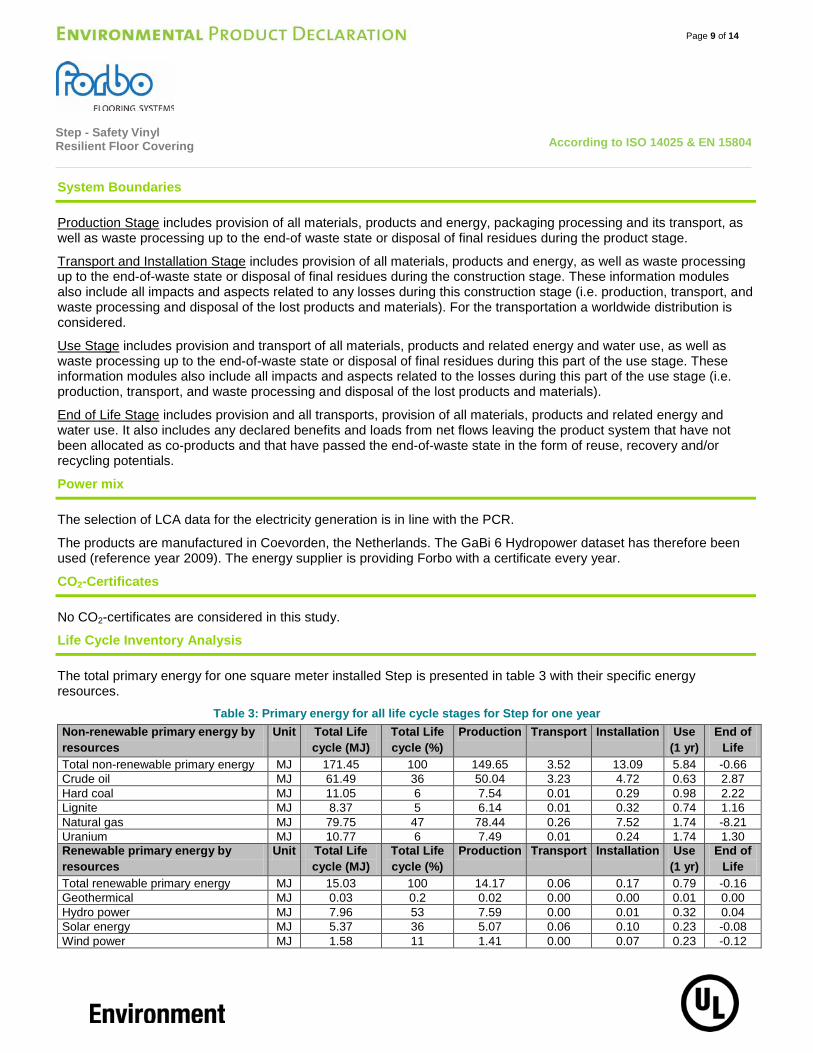
The total primary energy for one square meter installed Step is presented in table 3 with their specific energy resources.
Table 3: Primary energy for all life cycle stages for Step for one year Non-renewable primary energy by resources
Unit Total Life cycle (MJ)
Total Life cycle (%)
Production Transport Installation Use (1 yr)
End of Life
Total non-renewable primary energy MJ 171.45 100 149.65 3.52 13.09 5.84 -0.66 Crude oil MJ 61.49 36 50.04 3.23 4.72 0.63 2.87 Hard coal MJ 11.05 6 7.54 0.01 0.29 0.98 2.22 Lignite MJ 8.37 5 6.14 0.01 0.32 0.74 1.16 Natural gas MJ 79.75 47 78.44 0.26 7.52 1.74 -8.21 Uranium MJ 10.77 6 7.49 0.01 0.24 1.74 1.30 Renewable primary energy by resources
Unit Total Life cycle (MJ)
Total Life cycle (%)
Production Transport Installation Use (1 yr)
End of Life
Total renewable primary energy MJ 15.03 100 14.17 0.06 0.17 0.79 -0.16 Geothermical MJ 0.03 0.2 0.02 0.00 0.00 0.01 0.00 Hydro power MJ 7.96 53 7.59 0.00 0.01 0.32 0.04 Solar energy MJ 5.37 36 5.07 0.06 0.10 0.23 -0.08 Wind power MJ 1.58 11 1.41 0.00 0.07 0.23 -0.12
Step - Safety Vinyl Resilient Floor Covering
According to ISO 14025 & EN 15804
Page 10 of 14
The total amount of renewable and non-renewable primary energy is predominated by the production stage for a one year usage; within the production stage the main contributors are the raw material production and energy generation.
Waste and non-renewable resource consumption
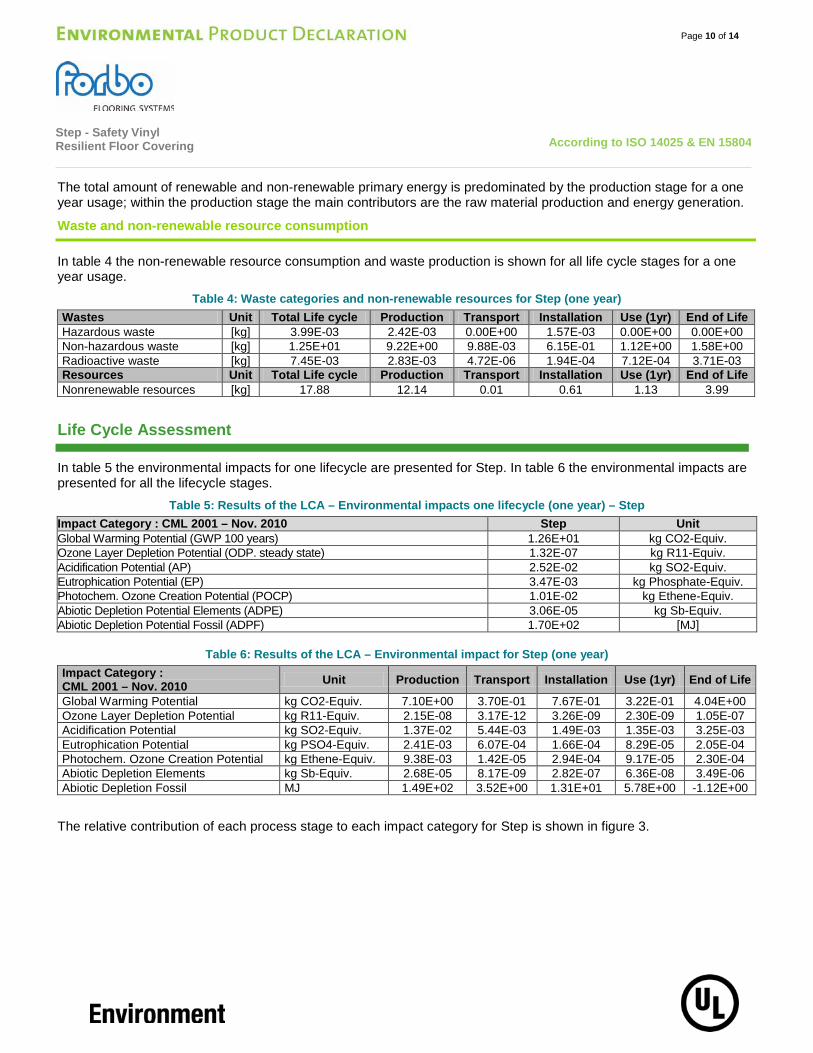
In table 4 the non-renewable resource consumption and waste production is shown for all life cycle stages for a one year usage.
Table 4: Waste categories and non-renewable resources for Step (one year) Wastes Unit Total Life cycle Production Transport Installation Use (1yr) End of Life Hazardous waste [kg] 3.99E-03 2.42E-03 0.00E+00 1.57E-03 0.00E+00 0.00E+00 Non-hazardous waste [kg] 1.25E+01 9.22E+00 9.88E-03 6.15E-01 1.12E+00 1.58E+00 Radioactive waste [kg] 7.45E-03 2.83E-03 4.72E-06 1.94E-04 7.12E-04 3.71E-03 Resources Unit Total Life cycle Production Transport Installation Use (1yr) End of Life Nonrenewable resources [kg] 17.88 12.14 0.01 0.61 1.13 3.99
Life Cycle Assessment
In table 5 the environmental impacts for one lifecycle are presented for Step. In table 6 the environmental impacts are presented for all the lifecycle stages.
Table 5: Results of the LCA – Environmental impacts one lifecycle (one year) – Step Impact Category : CML 2001 – Nov. 2010 Step Unit Global Warming Potential (GWP 100 years) 1.26E+01 kg CO2-Equiv. Ozone Layer Depletion Potential (ODP. steady state) 1.32E-07 kg R11-Equiv. Acidification Potential (AP) 2.52E-02 kg SO2-Equiv. Eutrophication Potential (EP) 3.47E-03 kg Phosphate-Equiv. Photochem. Ozone Creation Potential (POCP) 1.01E-02 kg Ethene-Equiv. Abiotic Depletion Potential Elements (ADPE) 3.06E-05 kg Sb-Equiv. Abiotic Depletion Potential Fossil (ADPF) 1.70E+02 [MJ]
Table 6: Results of the LCA – Environmental impact for Step (one year) Impact Category : CML 2001 – Nov. 2010 Unit Production Transport Installation Use (1yr) End of Life
Global Warming Potential kg CO2-Equiv. 7.10E+00 3.70E-01 7.67E-01 3.22E-01 4.04E+00 Ozone Layer Depletion Potential kg R11-Equiv. 2.15E-08 3.17E-12 3.26E-09 2.30E-09 1.05E-07 Acidification Potential kg SO2-Equiv. 1.37E-02 5.44E-03 1.49E-03 1.35E-03 3.25E-03 Eutrophication Potential kg PSO4-Equiv. 2.41E-03 6.07E-04 1.66E-04 8.29E-05 2.05E-04 Photochem. Ozone Creation Potential kg Ethene-Equiv. 9.38E-03 1.42E-05 2.94E-04 9.17E-05 2.30E-04 Abiotic Depletion Elements kg Sb-Equiv. 2.68E-05 8.17E-09 2.82E-07 6.36E-08 3.49E-06 Abiotic Depletion Fossil MJ 1.49E+02 3.52E+00 1.31E+01 5.78E+00 -1.12E+00
The relative contribution of each process stage to each impact category for Step is shown in figure 3.
Step - Safety Vinyl Resilient Floor Covering
According to ISO 14025 & EN 15804
Page 11 of 14
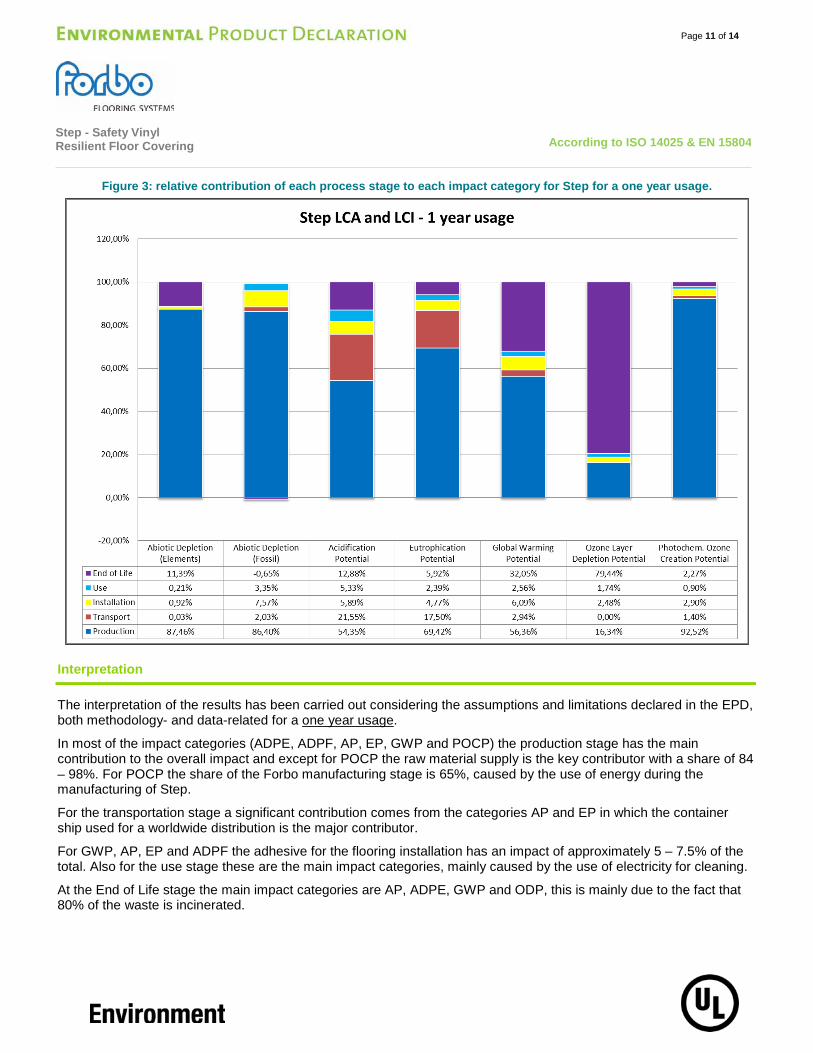
Figure 3: relative contribution of each process stage to each impact category for Step for a one year usage.
Interpretation
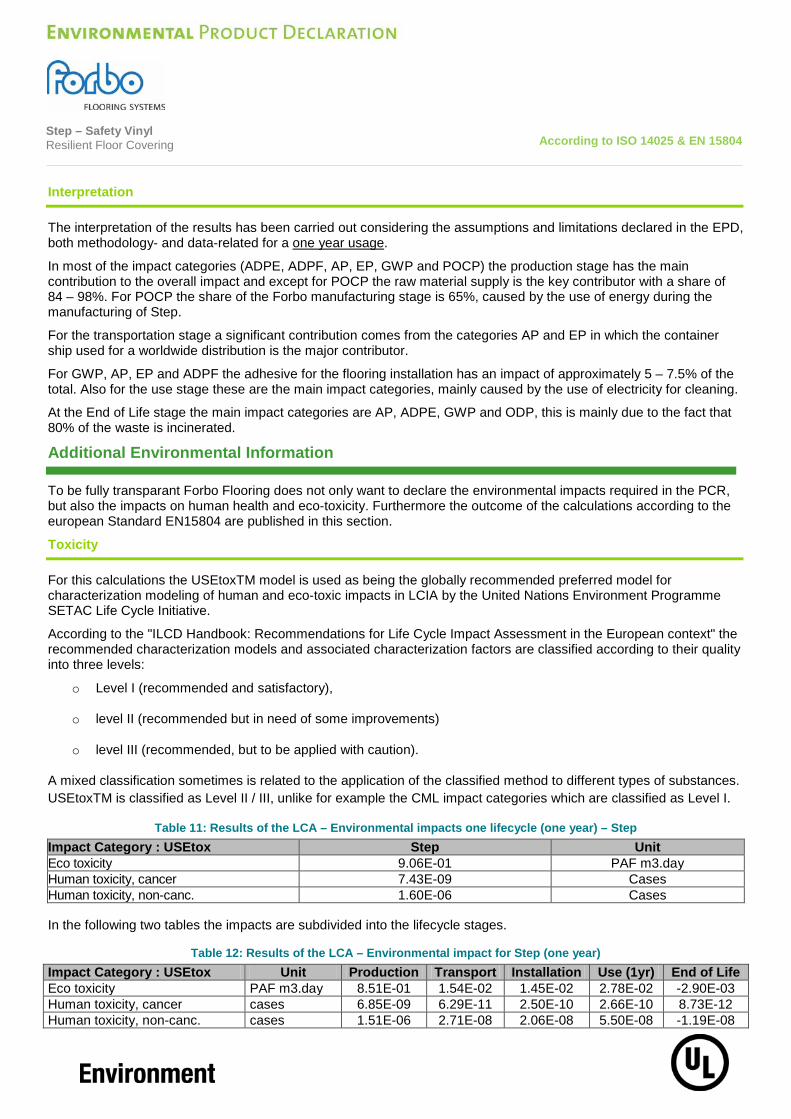
The interpretation of the results has been carried out considering the assumptions and limitations declared in the EPD, both methodology- and data-related for a one year usage.
In most of the impact categories (ADPE, ADPF, AP, EP, GWP and POCP) the production stage has the main contribution to the overall impact and except for POCP the raw material supply is the key contributor with a share of 84 – 98%. For POCP the share of the Forbo manufacturing stage is 65%, caused by the use of energy during the manufacturing of Step.
For the transportation stage a significant contribution comes from the categories AP and EP in which the container ship used for a worldwide distribution is the major contributor.
For GWP, AP, EP and ADPF the adhesive for the flooring installation has an impact of approximately 5 – 7.5% of the total. Also for the use stage these are the main impact categories, mainly caused by the use of electricity for cleaning.
At the End of Life stage the main impact categories are AP, ADPE, GWP and ODP, this is mainly due to the fact that 80% of the waste is incinerated.
Step - Safety Vinyl Resilient Floor Covering
According to ISO 14025 & EN 15804
Page 12 of 14
Additional Environmental Information
To be fully transparant Forbo Flooring does not only want to declare the environmental impacts required in the PCR, but also the impacts on human health and eco-toxicity. Furthermore the outcome of the calculations according to the european Standard EN15804 are published in this section.
Toxicity
For this calculations the USEtoxTM model is used as being the globally recommended preferred model for characterization modelling of human and eco-toxic impacts in LCIA by the United Nations Environment Programme SETAC Life Cycle Initiative. According to the "ILCD Handbook: Recommendations for Life Cycle Impact Assessment in the European context" the recommended characterization models and associated characterization factors are classified according to their quality into three levels:
o Level I (recommended and satisfactory), o Level II (recommended but in need of some improvements) o Level III (recommended, but to be applied with caution).
A mixed classification sometimes is related to the application of the classified method to different types of substances. USEtoxTM is classified as Level II / III, unlike for example the CML impact categories which are classified as Level I.
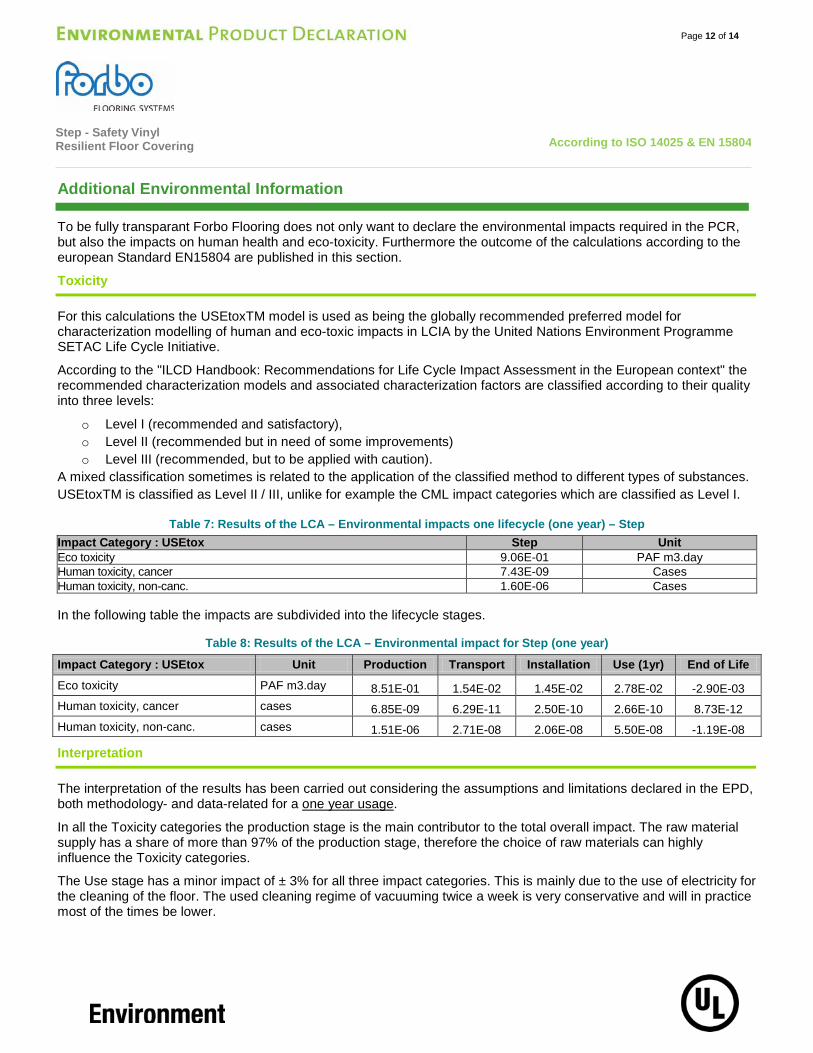
Table 7: Results of the LCA – Environmental impacts one lifecycle (one year) – Step Impact Category : USEtox Step Unit Eco toxicity 9.06E-01 PAF m3.day Human toxicity, cancer 7.43E-09 Cases Human toxicity, non-canc. 1.60E-06 Cases In the following table the impacts are subdivided into the lifecycle stages.
Table 8: Results of the LCA – Environmental impact for Step (one year)
Impact Category : USEtox Unit Production Transport Installation Use (1yr) End of Life
Eco toxicity PAF m3.day 8.51E-01 1.54E-02 1.45E-02 2.78E-02 -2.90E-03 Human toxicity, cancer cases 6.85E-09 6.29E-11 2.50E-10 2.66E-10 8.73E-12 Human toxicity, non-canc. cases 1.51E-06 2.71E-08 2.06E-08 5.50E-08 -1.19E-08
Interpretation
The interpretation of the results has been carried out considering the assumptions and limitations declared in the EPD, both methodology- and data-related for a one year usage.
In all the Toxicity categories the production stage is the main contributor to the total overall impact. The raw material supply has a share of more than 97% of the production stage, therefore the choice of raw materials can highly influence the Toxicity categories.
The Use stage has a minor impact of ± 3% for all three impact categories. This is mainly due to the use of electricity for the cleaning of the floor. The used cleaning regime of vacuuming twice a week is very conservative and will in practice most of the times be lower.
Step - Safety Vinyl Resilient Floor Covering
According to ISO 14025 & EN 15804
Page 13 of 14
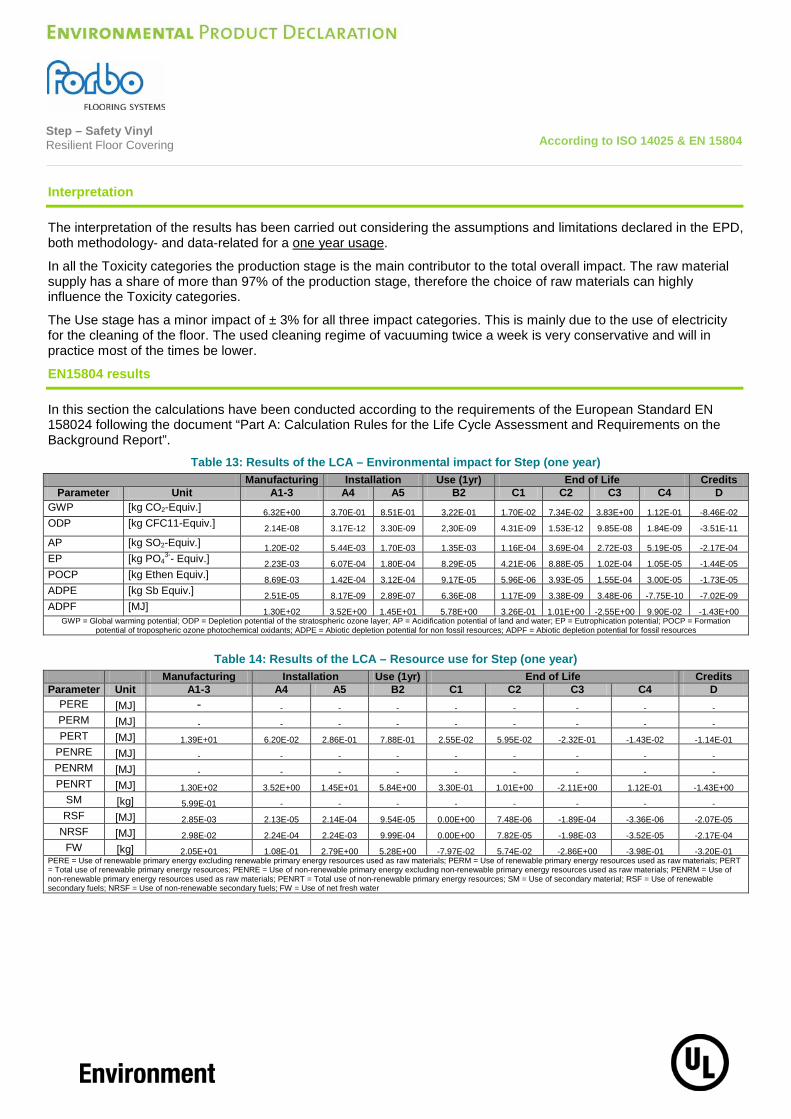
EN15804 Results
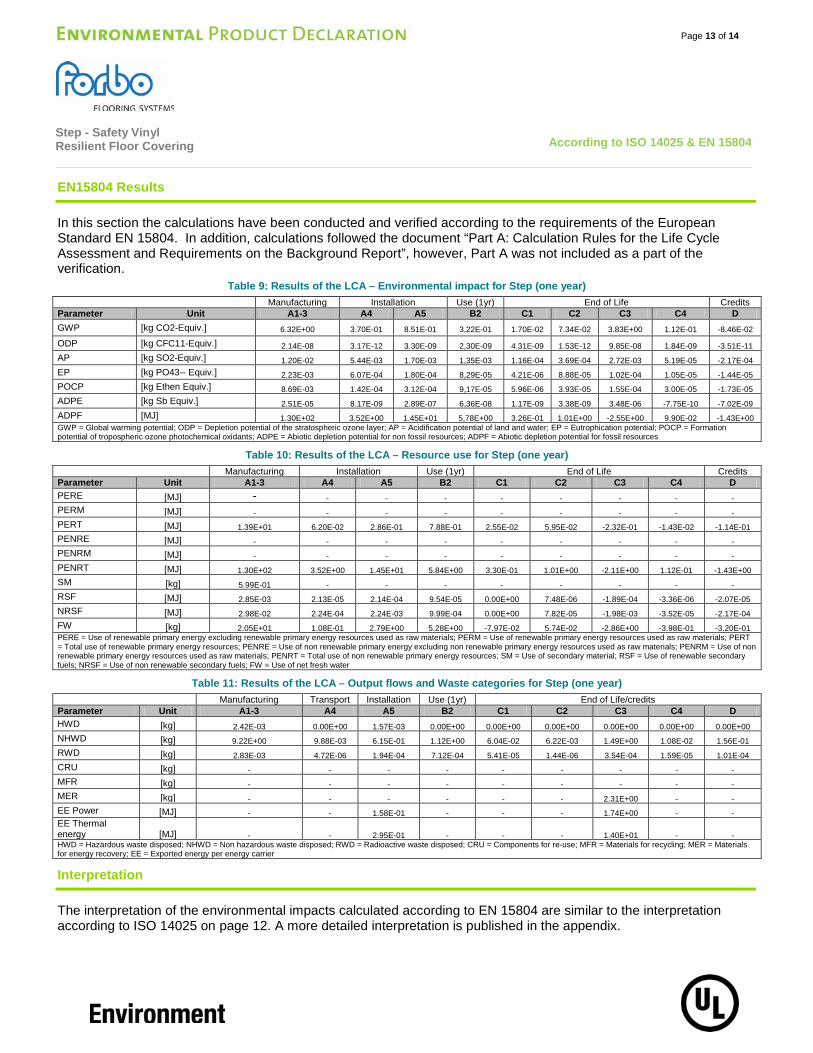
In this section the calculations have been conducted and verified according to the requirements of the European Standard EN 15804. In addition, calculations followed the document “Part A: Calculation Rules for the Life Cycle Assessment and Requirements on the Background Report”, however, Part A was not included as a part of the verification.
Table 9: Results of the LCA – Environmental impact for Step (one year) Manufacturing Installation Use (1yr) End of Life Credits
Parameter Unit A1-3 A4 A5 B2 C1 C2 C3 C4 D GWP [kg CO2-Equiv.] 6.32E+00 3.70E-01 8.51E-01 3,22E-01 1.70E-02 7.34E-02 3.83E+00 1.12E-01 -8.46E-02 ODP [kg CFC11-Equiv.] 2.14E-08 3.17E-12 3.30E-09 2,30E-09 4.31E-09 1.53E-12 9.85E-08 1.84E-09 -3.51E-11 AP [kg SO2-Equiv.] 1.20E-02 5.44E-03 1.70E-03 1,35E-03 1.16E-04 3.69E-04 2.72E-03 5.19E-05 -2.17E-04 EP [kg PO43-- Equiv.] 2.23E-03 6.07E-04 1.80E-04 8,29E-05 4.21E-06 8.88E-05 1.02E-04 1.05E-05 -1.44E-05 POCP [kg Ethen Equiv.] 8.69E-03 1.42E-04 3.12E-04 9,17E-05 5.96E-06 3.93E-05 1.55E-04 3.00E-05 -1.73E-05 ADPE [kg Sb Equiv.] 2.51E-05 8.17E-09 2.89E-07 6,36E-08 1.17E-09 3.38E-09 3.48E-06 -7.75E-10 -7.02E-09 ADPF [MJ] 1.30E+02 3.52E+00 1.45E+01 5,78E+00 3.26E-01 1.01E+00 -2.55E+00 9.90E-02 -1.43E+00 GWP = Global warming potential; ODP = Depletion potential of the stratospheric ozone layer; AP = Acidification potential of land and water; EP = Eutrophication potential; POCP = Formation potential of tropospheric ozone photochemical oxidants; ADPE = Abiotic depletion potential for non fossil resources; ADPF = Abiotic depletion potential for fossil resources
Table 10: Results of the LCA – Resource use for Step (one year) Manufacturing Installation Use (1yr) End of Life Credits
Parameter Unit A1-3 A4 A5 B2 C1 C2 C3 C4 D PERE [MJ] - - - - - - - - - PERM [MJ] - - - - - - - - - PERT [MJ] 1.39E+01 6.20E-02 2.86E-01 7.88E-01 2.55E-02 5.95E-02 -2.32E-01 -1.43E-02 -1.14E-01 PENRE [MJ] - - - - - - - - - PENRM [MJ] - - - - - - - - - PENRT [MJ] 1.30E+02 3.52E+00 1.45E+01 5.84E+00 3.30E-01 1.01E+00 -2.11E+00 1.12E-01 -1.43E+00 SM [kg] 5.99E-01 - - - - - - - - RSF [MJ] 2.85E-03 2.13E-05 2.14E-04 9.54E-05 0.00E+00 7.48E-06 -1.89E-04 -3.36E-06 -2.07E-05 NRSF [MJ] 2.98E-02 2.24E-04 2.24E-03 9.99E-04 0.00E+00 7.82E-05 -1.98E-03 -3.52E-05 -2.17E-04 FW [kg] 2.05E+01 1.08E-01 2.79E+00 5.28E+00 -7.97E-02 5.74E-02 -2.86E+00 -3.98E-01 -3.20E-01 PERE = Use of renewable primary energy excluding renewable primary energy resources used as raw materials; PERM = Use of renewable primary energy resources used as raw materials; PERT = Total use of renewable primary energy resources; PENRE = Use of non renewable primary energy excluding non renewable primary energy resources used as raw materials; PENRM = Use of non renewable primary energy resources used as raw materials; PENRT = Total use of non renewable primary energy resources; SM = Use of secondary material; RSF = Use of renewable secondary fuels; NRSF = Use of non renewable secondary fuels; FW = Use of net fresh water
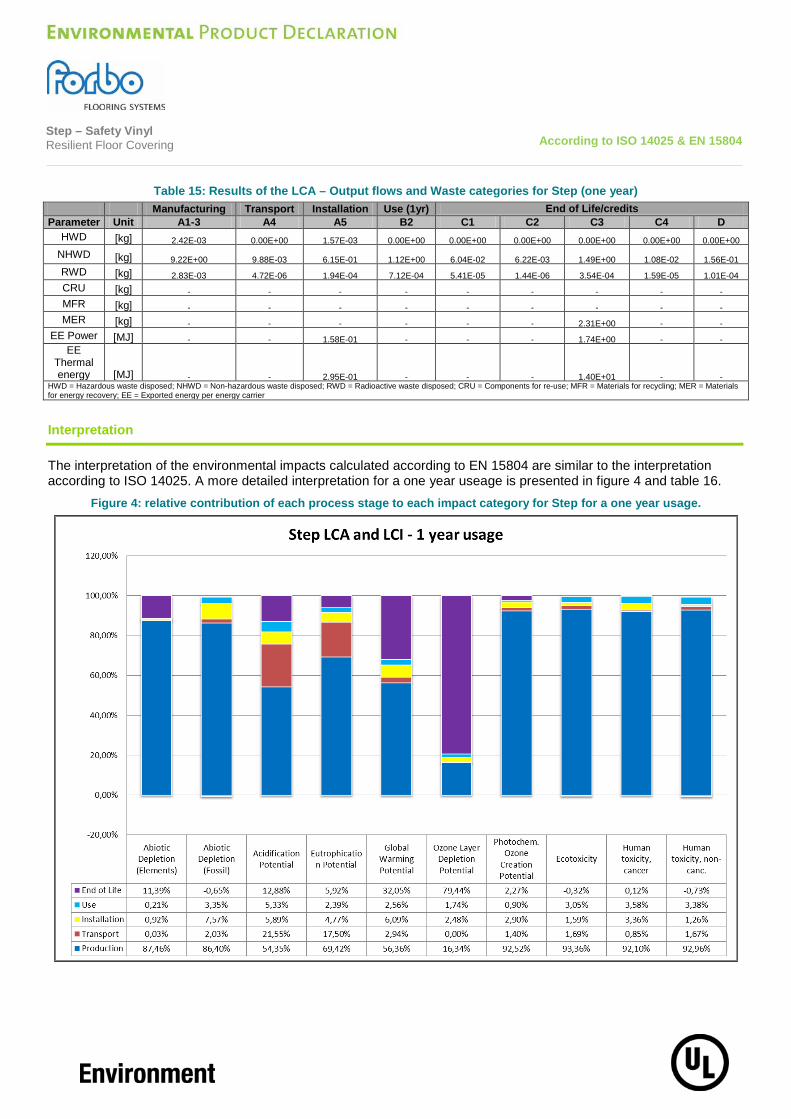
Table 11: Results of the LCA – Output flows and Waste categories for Step (one year) Manufacturing Transport Installation Use (1yr) End of Life/credits Parameter Unit A1-3 A4 A5 B2 C1 C2 C3 C4 D HWD [kg] 2.42E-03 0.00E+00 1.57E-03 0.00E+00 0.00E+00 0.00E+00 0.00E+00 0.00E+00 0.00E+00 NHWD [kg] 9.22E+00 9.88E-03 6.15E-01 1.12E+00 6.04E-02 6.22E-03 1.49E+00 1.08E-02 1.56E-01 RWD [kg] 2.83E-03 4.72E-06 1.94E-04 7.12E-04 5.41E-05 1.44E-06 3.54E-04 1.59E-05 1.01E-04 CRU [kg] - - - - - - - - - MFR [kg] - - - - - - - - - MER [kg] - - - - - - 2.31E+00 - - EE Power [MJ] - - 1.58E-01 - - - 1.74E+00 - - EE Thermal energy [MJ] - - 2.95E-01 - - - 1.40E+01 - - HWD = Hazardous waste disposed; NHWD = Non hazardous waste disposed; RWD = Radioactive waste disposed; CRU = Components for re-use; MFR = Materials for recycling; MER = Materials for energy recovery; EE = Exported energy per energy carrier
Interpretation
The interpretation of the environmental impacts calculated according to EN 15804 are similar to the interpretation according to ISO 14025 on page 12. A more detailed interpretation is published in the appendix.
Step - Safety Vinyl Resilient Floor Covering
According to ISO 14025 & EN 15804
Page 14 of 14
References
GABI 6 2012 PE INTERNATIONAL AG; GaBi 6: Software-System and Database for Life Cycle
Engineering. Copyright, TM. Stuttgart, Echterdingen, 1992-2012. GABI 6 2012D GaBi 6: Documentation of GaBi 6: Software-System and Database for Life Cycle Engineering.
Copyright, TM. Stuttgart, Echterdingen, 1992-2012. http://documentation.gabi-software.com/ NSF International May 22, 2012
Product Category Rule for Environmental Product Declarations Flooring: Carpet, Resilient, Laminate, Ceramic, Wood
UL ENVIRONMENT UL Environment’s Program Operator Rules ERFMI 2008 Final report: LCA, Environmental Information Sheet and Eco design Model of Resilient
Flooring by order of ERFMI, PE International, 2008 IBU 2011 PCR - Part A: Calculation rules for the Life Cycle Assessment and Requirements on the
Background Report, Institut Bauen und Umwelt e.V. PE 2012 ILCD Handbook: General guide for Life Cycle Assessment - Detailed guidance
Description of Selected Impact Categories, PE International AG, 2012 European Commission - Joint Research Centre - Institute for Environment and Sustainability: International Reference Life Cycle Data System (ILCD) Handbook - General guide for Life Cycle Assessment - Detailed guidance. First edition March 2010. EUR 24708 EN. Luxembourg. Publications Office of the European Union; 2010
STANDARDS AND LAWS DIN EN ISO 14044 Environmental management - Life cycle assessment - Requirements and guidelines (ISO
14044:2006); German and English version EN ISO 14044 ISO 14025 2006 DIN EN ISO 14025: Environmental labels and declarations — Type III environmental
declarations — Principles and procedures ISO 14040 2006 Environmental management - Life cycle assessment - Principles and framework (ISO 14040);
German and English version EN ISO 14040 CEN/TR 15941 Sustainability of construction works - Environmental product declarations - Methodology for
selection and use of generic data; German version CEN/TR 15941 EN 15804 EN 15804: Sustainability of construction works — Environmental Product Declarations —
Core rules for the product category of construction products ISO 24011 Resilient floor coverings - Specification for plain and decorative linoleum CPR REGULATION (EU) No 305/2011 OF THE EUROPEAN PARLIAMENT AND OF THE
COUNCIL of 9 March 2011 laying down harmonized conditions for the marketing of construction products and repealing Council Directive 89/106/EEC
EN-ISO 10874 Resilient, textile and laminate floor coverings - Classification
Step – Safety Vinyl Resilient Floor Covering
According to ISO 14025 & EN 15804
Appendix
The following life cycle assessment study of the company Forbo Flooring, a manufacturer of resilient floor coverings, has been performed by Forbo Flooring under support of PE International and has been conducted according to the requirements of the European Standard /EN 15804/ following the document “Part A: Calculation Rules for the Life Cycle Assessment and Requirements on the Background Report” /IBU 2011/.
Step – Safety Vinyl Resilient Floor Covering
According to ISO 14025 & EN 15804
LCA Report for Environmental Product Declarations (EPD)
Title of the study:
Environmental product declarations of Step – Safety Vinyl
Part of the project: Life Cycle assessment (LCA)
LCA study conducted by:
Forbo Flooring
Industrieweg 12
1566 JP Assendelft
The Netherlands
June 2013
Supported by:
PE INTERNATIONAL AG
Step – Safety Vinyl
Forbo Flooring
Step – Safety Vinyl Resilient Floor Covering
According to ISO 14025 & EN 15804
Authors: Floris Zeitler, Forbo Supported by Peter Shonfield, Julia Goerke
Forbo Flooring BV Industrieweg 12 1566 JP Assendelft, The Netherlands
Tel. +31 (0) 75 6477477 Fax +31 (0) 75 6477707
E-mail [email protected] Internet www.forbo-flooring.com Supported by: PE INTERNATIONAL AG
Hauptstraße 111 – 115 D – 70771 Leinfelden – Echterdingen
Tel. +49 (0) 711 34 18 17 – 0 Fax +49 (0) 711 34 18 17 – 25
E-mail [email protected] Internet www.pe-international.com
Nomenclature Abbreviation Explanation ADP Abiotic Depletion Potential AP Acidification Potential BLBSB Benefits and Loads Beyond the System Boundary CRU Components for re-use EE Exported energy per energy carrier EP Eutrophication Potential EPD Environmental Product Declaration FW Use of net fresh water GWP Global Warming Potential HWD Hazardous waste disposed LCA Life Cycle Assessment MER Materials for energy recovery MFR Materials for recycling NRSF Use of non-renewable secondary fuels ODP Ozone Layer Depletion Potential PENRE Use of non-renewable primary energy excluding non-renewable primary energy resources used as
raw materials PENRM Use of non-renewable primary energy resources used as raw materials PENRT Total use of non-renewable primary energy resources PERE Use of renewable primary energy excluding renewable primary energy resources used as raw
materials PERM Use of renewable primary energy resources used as raw materials PERT Total use of renewable primary energy resources PCR Product Category Rules POCP Photochemical Ozone Creation Potential RSF Use of renewable secondary fuels RSL Reference Service Life RWD Radioactive waste disposed SM Use of secondary material
Step – Safety Vinyl Resilient Floor Covering
According to ISO 14025 & EN 15804
General
The present LCA study of the company Forbo Flooring, a manufacturer of resilient floor coverings, has been performed by Forbo Flooring under support of PE International and has been conducted according to the requirements of the European Standard EN15804 following the document “Part A: Calculation Rules for the Life Cycle Assessment and Requirements on the Background Report”. The LCA report was sent to verification on 06/11/13.
Scope
This document is the LCA report for the “Environmental Product Declaration” (EPD) of "Step". The provision of an LCA report is required for each EPD of the EPD-program holder (UL Environment). This document shows how the calculation rules were applied and describes additional LCA information on the Life Cycle Assessment in accordance with the requirements of ISO 14040 series.
Content, structure and accessibility of the LCA report
The LCA report provides a systematic and comprehensive summary of the Safety documentation supporting the verification of an EPD.
The report documents the information on which the Life Cycle Assessment is based, while also ensuring the additional information contained within the EPD complies with the requirements of ISO 14040 series.
The LCA report contains all of the data and information of importance for the details published in the EPD. Care is been given to all explanations as to how the data and information declared in the EPD arises from the Life Cycle Assessment.
The verification of the EPD is aligned towards the structure of the rule document based on ISO 14025 and EN15804.
Goal of the study
The reason for performing this LCA study is to publish an EPD based on EN 15804 and ISO 14025. This study contains the calculation and interpretation of the LCA results for Step complying with EN-ISO 10582: Heterogeneous polyvinyl chloride floor coverings – Specification and EN 13845: Polyvinyl chloride floor coverings with particle based enhanced slip resistance – Specification.
Manufactured by: Forbo-Novilon B.V. De Holwert 12 7741 KC Coevorden the Netherlands The following life cycle stages were considered:
- Product stage - Transport stage - Installation stage - Use stage - End-of-life stage - Benefits and loads beyond the product system boundary
The main purpose of EPD is for use in business-to-business communication. As all EPD are publicly available on the website of UL Environment and therefore are accessible to the end consumer they can also be used in business-to-consumer communication.
The intended use of the EPD is to communicate environmentally related information and LCA results to support the assessment of the sustainable use of resources and of the impact of construction works on the environment
Step – Safety Vinyl Resilient Floor Covering
According to ISO 14025 & EN 15804
Scope of the study
Declared / functional unit
The declaration refers to the declared/functional unit of 1m² installed flooring product.
Declaration of construction products classes
The LCA report refers to a manufacturer declaration of type 1a): Declaration of a specific product from a manufacturer’s plant. Step is produced at the following manufacturing site:
Forbo-Novilon B.V. De Holwert 12 7741 KC Coevorden The Netherlands
Product Definition
Product Classification and Description
This declaration covers the “Step” collection of slip resistant project vinyl products (Safety Vinyl).The Step safety vinyl collection covers a range of products of different slip resistant properties, designs and colors.
Step from Forbo Flooring is a resilient floor covering complying with all the requirements of EN-ISO 10582: Heterogeneous polyvinyl chloride floor coverings – Specification and EN 13845: Polyvinyl chloride floor coverings with particle based enhanced slip resistance – Specification. The key raw materials include PVC, plasticizer, mineral filler, stabilizers and glass fiber tissue and slip resistant particles.
The Step collection of Safety Vinyl is produced by Forbo Flooring and is sold worldwide.
This declaration refers to Step sheet of 2.0mm nominal thickness with a 0.70mm wear layer.
Figure 1: Typical construction Step safety vinyl consists of 4 or 5 layers, depending on design:
1. Lacquer surface: The PU lacquer coating for easy cleaning & maintenance gives enhanced protection against scuffing, scratching, dirt pick up and staining.
2. Wear layer: The 0.70mm wear layer meets the requirement for Type 1 wear layer according to EN-ISO10582. This topcoat layer is generally pigmented but for certain ranges will be transparent. Permanent slip resistance is achieved by incorporating into the wear layer slip resistant particles which ensure a durable surface that is slip resistant for the life of the flooring.
3. Printed layer: For specific ranges the decorative design is printed, using environmentally friendly water-based inks, on to a thin white PVC plastisol coating. This printed layer is not required with pigmented wear layers.
4. Intermediate layer: Non-woven glass tissue that is impregnated with a highly filled PVC plastisol to give the product strength & excellent dimensional stability.
5. Backing layer: Calendered layer containing a minimum of 45% recycled production waste.
Step – Safety Vinyl Resilient Floor Covering
According to ISO 14025 & EN 15804
Range of Applications
Step is classified in accordance with EN-ISO 10582 & EN 13845 to be installed in the following use areas defined in EN-ISO 10874:
Area of application
Commercial
Class 34
Industrial
Class 43
Product Standards
The products considered in this EPD have the following technical specifications: o Meets or exceeds all technical requirements of EN-ISO 10582: Heterogeneous polyvinyl chloride floor
coverings – Specification o Meets or exceeds all technical requirements of EN 13845: Polyvinyl chloride floor coverings with particle
based enhanced slip resistance – Specification.
Step meets the requirements of EN 14041 EN 13501-1 Reaction to fire Bfl – s1 EN 13893 Slip resistance DS: ≥ 0,30 EN 1815 Body voltage < 2 kV EN ISO10456 Thermal conductivity 0,25 W/mK
Accreditations
o ISO 9001 Quality Management System o ISO 14001 Environmental Management System o AgBB requirements o CHPS section 01350
Delivery status
Characteristics Nominal Value Unit Product thickness 2.00 mm Product Weight 2.90 g/m2
Rolls Width Length
2.00 25
meter meter
Step – Safety Vinyl Resilient Floor Covering
According to ISO 14025 & EN 15804
Material Content
Component Material Availability Mass % Origin of raw material
Binder PVC DINP & Dibenzoates
Nonrenewable – limited Nonrenewable - limited
36 16
Europe Europe
Filler Dolomite Abundant mineral 22 Europe
Stabilizers and process additives
Epoxidized esters & proprietary mixtures & lubricants
1.7% natural oils, others nonrenewable -
limited 4 Europe
Carrier Glassfiber tissue Nonrenewable - limited 2 Netherlands/Germany
Pigments Titanium Dioxide (main pigment) and others Nonrenewable - limited 0.5 Europe
Anti-slip particles Carborundum Aluminium oxide & quartz
Industrial production Abundant minerals 1 Europe
Finish PU lacquer Nonrenewable - limited <0.5 Europe Recycle Post production waste 18
Production of Main Materials
PVC: Polymer which is produced by the polymerisation of vinyl chloride monomer.
Plasticisers: Plasticizer is obtained by esterification of an alcohol and acid. Plasticiser is added to increase the flexibility, durability and longevity of the floor covering.
Stabilizer Ba/Zn: Mixed metal stabiliser made from Barium and Zinc stearate. It is used to avoid PVC degradation during processing at relative high temperature.
Dolomite: An abundant mineral mined in northern Norway.
Glass Tissue: Glass fibres are mixed with a binder to produce a non-woven glass tissue which is used as a substrate for floor coverings and imparts excellent dimensional stability to the finished product.
Titanium dioxide: A white pigment produced from the mineral rutile, a naturally occurring form of titanium dioxide. The production of the pigment is a large-scale chemical process.
Recycle: Mixture of process wastes from the manufacture of various PVC floorcoverings.
Production of the Floor Covering
Step is produced in stages:
o Preparation of PVC plastisols (mixture of PVC, plasticizer and additives, may also contain filler and pigments) o Impregnation of the glass tissue with a highly filled plastisol followed by the application of a thin white plastisol
coating.
o Rotogravure printing, if required, to produce wood, stone or abstract designs.
o Application of PVC plastisol topcoat containing slip resistant particles (type, quantity & color are product specific) and PU lacquer. PVC topcoat may be transparent or pigmented and may also contain decorative PVC particles depending on the design type. After fusion at ~1950C the topcoat is mechanically embossed to enhance the decorative effect.
o A calendered back layer is then applied to the product. This layer contains a minimum of 45% of recycled process waste.
o The finished product is then trimmed, inspected and cut into saleable rolls (nominal length – 25 meters). Trimmings & rejected product are not suitable for in-house reuse and are, therefore, recycled externally by a third party.
Step – Safety Vinyl Resilient Floor Covering
According to ISO 14025 & EN 15804
Health, Safety and Environmental Aspects during Production
o ISO 14001 Environmental Management System
Production Waste
Rejected material and the cuttings of the trimming stage are recycled externally as it is, currently, not possible to reuse this waste internally. Packaging materials are collected separately and externally recycled.
Delivery and Installation of the Floor Covering
Delivery
A worldwide distribution by truck and container ship is considered. On average every square meter of Step is transported as follows:
o Transport distance 40 t truck 660 km o Transport distance 7.5t truck (Fine distribution) 290 km o Capacity utilization trucks (including empty runs) 85 % o Transport distance Ocean ship 3837 km o Capacity utilization Ocean ship 48%
Installation
Because of the specific techniques used during the installation of Step approximately 6% of the material is cut off as installation waste. For installation of Step on the floor a scenario has been modeled assuming 0.30 kg/m2 of adhesive is applied to the sub-floor. Waste during the installation process may be thermally recycled in a waste incineration plant.
Health, Safety and Environmental Aspects during Installation
Forbo flooring recommends the use of (low) zero emission adhesives for installing Step floorcovering.
Waste
As it is currently not possible for Forbo Flooring to reuse Step flooring it is recommended that any waste from the installation process is thermally recycled in a waste incineration plant.
Packaging
Cardboard tubes and packaging paper can be collected separately and should be used in a local recycling process. In the calculation model 100% incineration is taken into account for which there is a credit received.
Use stage
The service lifetime of a floor covering for a certain application on a floor is too widespread to give one common number. For this EPD model the reference service lifetime (RSL) is set to one year. This means that all impacts for the use phase are based on the cleaning and maintenance model for one year. Depending on the area of use, the technical lifetime advised by the manufacturer and the estimated time on the floor by the customer, the service lifetime can be determined. The use phase impacts should be calculated with the foreseen service life to arrive at the total environmental impact.
Step – Safety Vinyl Resilient Floor Covering
According to ISO 14025 & EN 15804
Cleaning and Maintenance
Level of use Cleaning Process Cleaning Frequency Consumption of energy and resources
Commercial/Residential/Industrial Vacuuming Twice a week Electricity
Damp mopping Once a week Hot water Neutral detergent
For the calculations the following cleaning regime is considered:
o Dry cleaning with a 1.5 kW vacuum cleaner for 0.21 min/m2, twice a week. This equates to 0.55 kWh/m2*year.
o Once a week wet cleaning with 0.062 l/m2 water and 0.0008 kg/m2 detergent. This result in the use of 3.224 l/m2*year water and 0.04 kg/m2*year detergent. The wet cleaning takes place without power machine usage. Waste water treatment of the arising waste water from cleaning is considered.
The cleaning regime that is recommended in practice will be highly dependent on the use of the premises where the floor covering is installed. In high traffic areas more frequent cleaning will be needed compared to areas where there is low traffic. The use of an entrance mat of at least four steps will reduce the cleaning frequency.
The cleaning regime used in the calculations is suitable for high traffic areas and is a worst case scenario.
Prevention of Structural Damage
All newly laid floor covering should be covered and protected with a suitable non-staining protective covering if other building activities are still in progress. Use protective feet on chairs and tables to reduce scratching. Castor wheels should be suitable for resilient floor coverings
Health Aspects during Usage
Project Vinyl is complying with: o AgBB requirements o CHPS section 01350
End of Life
The deconstruction of installed Step from the floor is done mechanically and the electrical energy needed for this is estimated to be 0.03 kWh/sqm. This amount of energy is included into the calculations. For the End of Life stage, 20% landfill and 80% incineration is taken into account, the average distance to the incineration plant or landfill facility per lorry is set to 200 km.
Life Cycle Assessment
A full Life Cycle Assessment has bee carried out according to ISO 14040 and ISO 14044. The following Life Cycle Stages are assessed :
o Production Stage (Raw material acquisition, transportation to Manufacturing and Manufacturing) o Transport Gate to User o Installation Stage o Use Stage o End of Life Stage
Step – Safety Vinyl Resilient Floor Covering
According to ISO 14025 & EN 15804
Raw Material Extraction and
Processing
Energies with regional
reference
Coating,
Calendaring,
Drying,
Trimming
Transport
Transport
Installation loss
&
Adhesive at laying
Cleaning regime Transport Incineration
Production Transport Installation Use End-of Life
Figure 2: Flow chart of the Life Cycle Assessment
Description of the declared Functional Unit
The functional unit is one square meter of installed product and the use stage is considered for one year of service life.
Cut off Criteria
The cut-off criteria shall be 1% of renewable and non-renewable primary energy usage and 1% of the total mass of the unit process. The total neglected input flows per module shall be a maximum of 5% of energy usage and mass.
In practice, in this assessment, all data from the production data acquisition are considered, i.e. all raw materials used as per formulation, use of water, electricity and other fuels, the required packaging materials, and all direct production waste. Transport data on all considered inputs and output material are also considered.
LCA Data
As a general rule, specific data derived from specific production processes or average data derived from specific production processes have been used as the first choice as a basis for calculating an EPD.
For life cycle modeling of the considered products, the GaBi 6 Software System for Life Cycle Engineering, developed by PE INTERNATIONAL AG, has been used. All relevant LCA datasets are taken from the GaBi 6 software database. The datasets from the database GaBi are documented in the online documentation. To ensure comparability of results in the LCA, the basic data of GaBi database were used for energy, transportation and auxiliary materials.
Data Quality
The requirements for data quality and LCA data correspond to the specifications of the PCR.
Foreground data are based on 1 year averaged data (year 2012). The reference ages of LCA datasets vary but are given in the table in the Appendix. The time period over which inputs to and outputs from the system is accounted for is 100 years from the year for which the data set is deemed representative. The technological LCA of the collected data reflects the physical reality of the declared product. The datasets are complete, conform to the system boundaries and the criteria for the exclusion of inputs and outputs and are geographical representative for the supply chain of Forbo flooring.
For life cycle modeling of the considered products the GaBi 6 Software System for Life Cycle Engineering, developed by PE INTERNATIONAL AG, is used. All relevant LCA datasets are taken from the GaBi 6 software database. The last revision of the used data sets took place within the last 10 years.
Step – Safety Vinyl Resilient Floor Covering
According to ISO 14025 & EN 15804
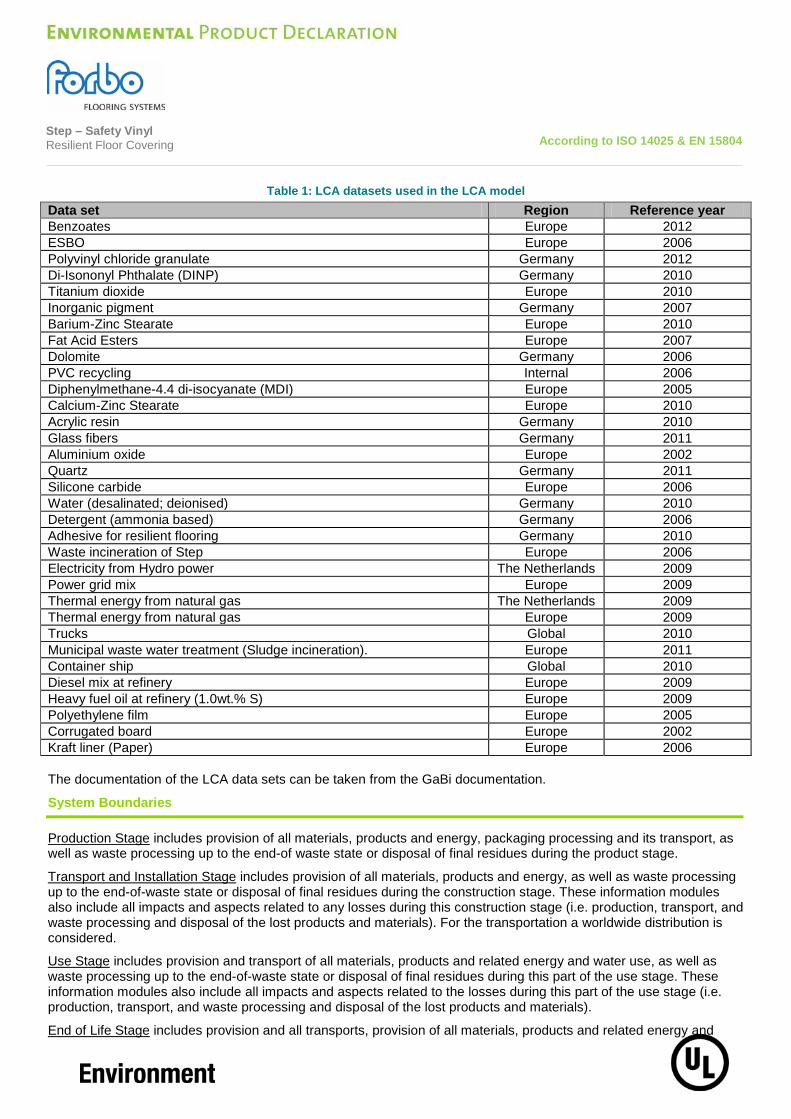
Table 1: LCA datasets used in the LCA model Data set Region Reference year Benzoates Europe 2012 ESBO Europe 2006 Polyvinyl chloride granulate Germany 2012 Di-Isononyl Phthalate (DINP) Germany 2010 Titanium dioxide Europe 2010 Inorganic pigment Germany 2007 Barium-Zinc Stearate Europe 2010 Fat Acid Esters Europe 2007 Dolomite Germany 2006 PVC recycling Internal 2006 Diphenylmethane-4.4 di-isocyanate (MDI) Europe 2005 Calcium-Zinc Stearate Europe 2010 Acrylic resin Germany 2010 Glass fibers Germany 2011 Aluminium oxide Europe 2002 Quartz Germany 2011 Silicone carbide Europe 2006 Water (desalinated; deionised) Germany 2010 Detergent (ammonia based) Germany 2006 Adhesive for resilient flooring Germany 2010 Waste incineration of Step Europe 2006 Electricity from Hydro power The Netherlands 2009 Power grid mix Europe 2009 Thermal energy from natural gas The Netherlands 2009 Thermal energy from natural gas Europe 2009 Trucks Global 2010 Municipal waste water treatment (Sludge incineration). Europe 2011 Container ship Global 2010 Diesel mix at refinery Europe 2009 Heavy fuel oil at refinery (1.0wt.% S) Europe 2009 Polyethylene film Europe 2005 Corrugated board Europe 2002 Kraft liner (Paper) Europe 2006 The documentation of the LCA data sets can be taken from the GaBi documentation. System Boundaries
Production Stage includes provision of all materials, products and energy, packaging processing and its transport, as well as waste processing up to the end-of waste state or disposal of final residues during the product stage. Transport and Installation Stage includes provision of all materials, products and energy, as well as waste processing up to the end-of-waste state or disposal of final residues during the construction stage. These information modules also include all impacts and aspects related to any losses during this construction stage (i.e. production, transport, and waste processing and disposal of the lost products and materials). For the transportation a worldwide distribution is considered.
Use Stage includes provision and transport of all materials, products and related energy and water use, as well as waste processing up to the end-of-waste state or disposal of final residues during this part of the use stage. These information modules also include all impacts and aspects related to the losses during this part of the use stage (i.e. production, transport, and waste processing and disposal of the lost products and materials).
End of Life Stage includes provision and all transports, provision of all materials, products and related energy and
Step – Safety Vinyl Resilient Floor Covering
According to ISO 14025 & EN 15804
water use. It also includes any declared benefits and loads from net flows leaving the product system that have not been allocated as co-products and that have passed the end-of-waste state in the form of reuse, recovery and/or recycling potentials.
Power mix
The selection of LCA data for the electricity generation is in line with the PCR.
The products are manufactured in Coevorden, the Netherlands. The GaBi 6 Hydro power datasets has therefore been used (reference year 2009). The energy supplier is providing Forbo with a certificate every year.
CO2-Certificates
No CO2-certificates are considered in this study.
Allocations
In the present study some allocations have been made. Detailed explanations can be found in the chapters below.
Co-product allocation
No co-product allocation occurs in the product system.
Allocation of multi-Input processes
The Production and End of Life stage include incineration plants. In these processes different products are treated together within a process. The allocation procedures followed in these cases are based on a physical classification of the mass flows or calorific values.
Credits from energy substitution are allocated to the production stage, because the gained energy from energy substitution is lower than the energy input in this stage. The same quality of energy is considered.
Allocation procedure of reuse, recycling and recovery
The installation waste and end of life waste can be fed into incineration processes. Incineration processes include cogeneration processes which give thermal and power energy as outputs. It is assumed that this recovered energy offsets that produced by the European average grid mix and thermal energy generation from natural gas.
Description of the allocation processes in the LCA report
The description of allocation rules in of this LCA report meets the requirements of the PCR.
Description of the unit processes in the LCA report
The modeling of the unit processes reported for the LCA are documented in a transparent way, respecting the confidentiality of the data present in the LCA report.
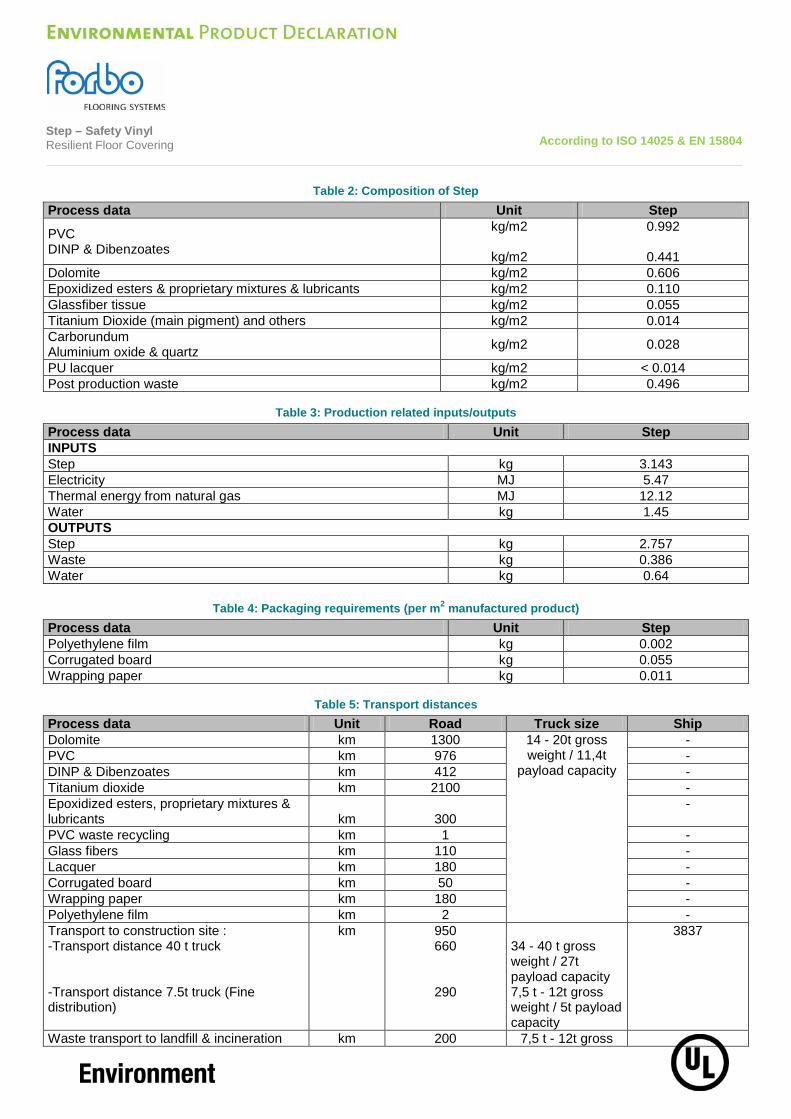
In the following tables the type and amount of the different input and output flows are listed for 1m² produced flooring; installed flooring includes the material loss during installation (5%):
Step – Safety Vinyl Resilient Floor Covering
According to ISO 14025 & EN 15804
Table 2: Composition of Step Process data Unit Step
PVC DINP & Dibenzoates
kg/m2
kg/m2
0.992
0.441 Dolomite kg/m2 0.606 Epoxidized esters & proprietary mixtures & lubricants kg/m2 0.110 Glassfiber tissue kg/m2 0.055 Titanium Dioxide (main pigment) and others kg/m2 0.014 Carborundum Aluminium oxide & quartz kg/m2 0.028
PU lacquer kg/m2 < 0.014 Post production waste kg/m2 0.496
Table 3: Production related inputs/outputs Process data Unit Step INPUTS Step kg 3.143 Electricity MJ 5.47 Thermal energy from natural gas MJ 12.12 Water kg 1.45 OUTPUTS Step kg 2.757 Waste kg 0.386 Water kg 0.64
Table 4: Packaging requirements (per m2 manufactured product) Process data Unit Step Polyethylene film kg 0.002 Corrugated board kg 0.055 Wrapping paper kg 0.011
Table 5: Transport distances
Process data Unit Road Truck size Ship Dolomite km 1300 14 - 20t gross
weight / 11,4t payload capacity
- PVC km 976 - DINP & Dibenzoates km 412 - Titanium dioxide km 2100 - Epoxidized esters, proprietary mixtures & lubricants km 300
-
PVC waste recycling km 1 - Glass fibers km 110 - Lacquer km 180 - Corrugated board km 50 - Wrapping paper km 180 - Polyethylene film km 2 - Transport to construction site : -Transport distance 40 t truck -Transport distance 7.5t truck (Fine distribution)
km 950 660
290
34 - 40 t gross weight / 27t payload capacity 7,5 t - 12t gross weight / 5t payload capacity
3837
Waste transport to landfill & incineration km 200 7,5 t - 12t gross -
Step – Safety Vinyl Resilient Floor Covering
According to ISO 14025 & EN 15804
Process data Unit Road Truck size Ship weight / 5t payload
capacity
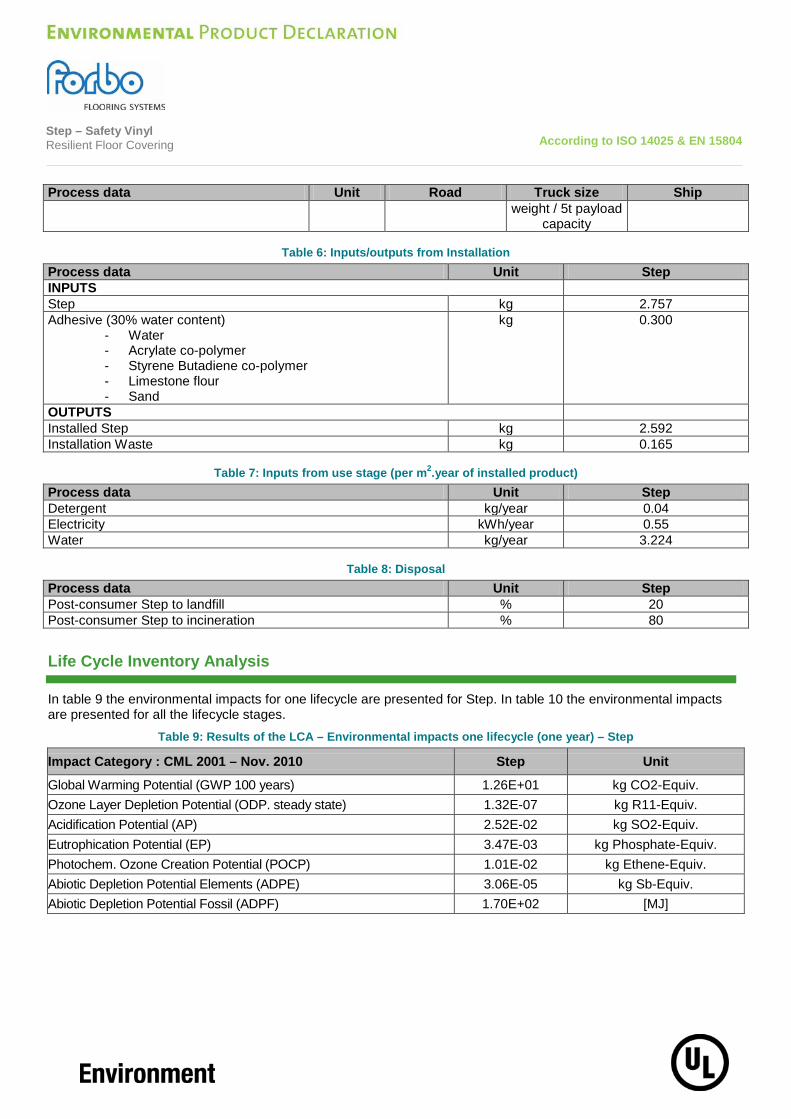
Table 6: Inputs/outputs from Installation Process data Unit Step INPUTS Step kg 2.757 Adhesive (30% water content)
- Water - Acrylate co-polymer - Styrene Butadiene co-polymer - Limestone flour - Sand
kg 0.300
OUTPUTS Installed Step kg 2.592 Installation Waste kg 0.165
Table 7: Inputs from use stage (per m2.year of installed product)
Process data Unit Step Detergent kg/year 0.04 Electricity kWh/year 0.55 Water kg/year 3.224
Table 8: Disposal
Process data Unit Step Post-consumer Step to landfill % 20 Post-consumer Step to incineration % 80
Life Cycle Inventory Analysis
In table 9 the environmental impacts for one lifecycle are presented for Step. In table 10 the environmental impacts are presented for all the lifecycle stages.
Table 9: Results of the LCA – Environmental impacts one lifecycle (one year) – Step
Impact Category : CML 2001 – Nov. 2010 Step Unit
Global Warming Potential (GWP 100 years) 1.26E+01 kg CO2-Equiv. Ozone Layer Depletion Potential (ODP. steady state) 1.32E-07 kg R11-Equiv. Acidification Potential (AP) 2.52E-02 kg SO2-Equiv. Eutrophication Potential (EP) 3.47E-03 kg Phosphate-Equiv. Photochem. Ozone Creation Potential (POCP) 1.01E-02 kg Ethene-Equiv. Abiotic Depletion Potential Elements (ADPE) 3.06E-05 kg Sb-Equiv. Abiotic Depletion Potential Fossil (ADPF) 1.70E+02 [MJ]
Step – Safety Vinyl Resilient Floor Covering
According to ISO 14025 & EN 15804
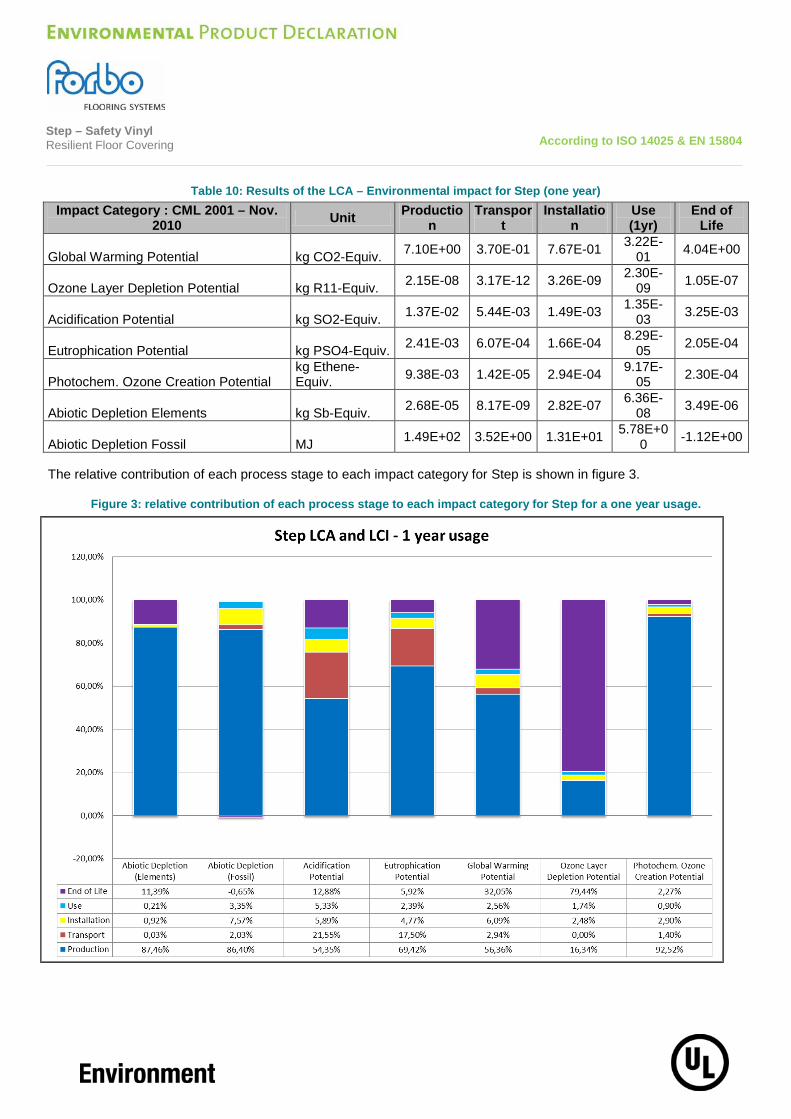
Table 10: Results of the LCA – Environmental impact for Step (one year) Impact Category : CML 2001 – Nov.
2010 Unit Production
Transport
Installation
Use (1yr)
End of Life
Global Warming Potential kg CO2-Equiv. 7.10E+00 3.70E-01 7.67E-01 3.22E-01 4.04E+00
Ozone Layer Depletion Potential kg R11-Equiv. 2.15E-08 3.17E-12 3.26E-09 2.30E-09 1.05E-07
Acidification Potential kg SO2-Equiv. 1.37E-02 5.44E-03 1.49E-03 1.35E-03 3.25E-03
Eutrophication Potential kg PSO4-Equiv. 2.41E-03 6.07E-04 1.66E-04 8.29E-05 2.05E-04
Photochem. Ozone Creation Potential kg Ethene-Equiv. 9.38E-03 1.42E-05 2.94E-04 9.17E-
05 2.30E-04
Abiotic Depletion Elements kg Sb-Equiv. 2.68E-05 8.17E-09 2.82E-07 6.36E-08 3.49E-06
Abiotic Depletion Fossil MJ 1.49E+02 3.52E+00 1.31E+01 5.78E+00 -1.12E+00
The relative contribution of each process stage to each impact category for Step is shown in figure 3.
Figure 3: relative contribution of each process stage to each impact category for Step for a one year usage.
Step – Safety Vinyl Resilient Floor Covering
According to ISO 14025 & EN 15804
Interpretation
The interpretation of the results has been carried out considering the assumptions and limitations declared in the EPD, both methodology- and data-related for a one year usage.
In most of the impact categories (ADPE, ADPF, AP, EP, GWP and POCP) the production stage has the main contribution to the overall impact and except for POCP the raw material supply is the key contributor with a share of 84 – 98%. For POCP the share of the Forbo manufacturing stage is 65%, caused by the use of energy during the manufacturing of Step.
For the transportation stage a significant contribution comes from the categories AP and EP in which the container ship used for a worldwide distribution is the major contributor.
For GWP, AP, EP and ADPF the adhesive for the flooring installation has an impact of approximately 5 – 7.5% of the total. Also for the use stage these are the main impact categories, mainly caused by the use of electricity for cleaning.
At the End of Life stage the main impact categories are AP, ADPE, GWP and ODP, this is mainly due to the fact that 80% of the waste is incinerated.
Additional Environmental Information
To be fully transparant Forbo Flooring does not only want to declare the environmental impacts required in the PCR, but also the impacts on human health and eco-toxicity. Furthermore the outcome of the calculations according to the european Standard EN15804 are published in this section.
Toxicity
For this calculations the USEtoxTM model is used as being the globally recommended preferred model for characterization modeling of human and eco-toxic impacts in LCIA by the United Nations Environment Programme SETAC Life Cycle Initiative. According to the "ILCD Handbook: Recommendations for Life Cycle Impact Assessment in the European context" the recommended characterization models and associated characterization factors are classified according to their quality into three levels:
o Level I (recommended and satisfactory),
o level II (recommended but in need of some improvements)
o level III (recommended, but to be applied with caution).
A mixed classification sometimes is related to the application of the classified method to different types of substances. USEtoxTM is classified as Level II / III, unlike for example the CML impact categories which are classified as Level I.
Table 11: Results of the LCA – Environmental impacts one lifecycle (one year) – Step Impact Category : USEtox Step Unit Eco toxicity 9.06E-01 PAF m3.day Human toxicity, cancer 7.43E-09 Cases Human toxicity, non-canc. 1.60E-06 Cases In the following two tables the impacts are subdivided into the lifecycle stages.
Table 12: Results of the LCA – Environmental impact for Step (one year) Impact Category : USEtox Unit Production Transport Installation Use (1yr) End of Life Eco toxicity PAF m3.day 8.51E-01 1.54E-02 1.45E-02 2.78E-02 -2.90E-03 Human toxicity, cancer cases 6.85E-09 6.29E-11 2.50E-10 2.66E-10 8.73E-12 Human toxicity, non-canc. cases 1.51E-06 2.71E-08 2.06E-08 5.50E-08 -1.19E-08
Step – Safety Vinyl Resilient Floor Covering
According to ISO 14025 & EN 15804
Interpretation
The interpretation of the results has been carried out considering the assumptions and limitations declared in the EPD, both methodology- and data-related for a one year usage.
In all the Toxicity categories the production stage is the main contributor to the total overall impact. The raw material supply has a share of more than 97% of the production stage, therefore the choice of raw materials can highly influence the Toxicity categories.
The Use stage has a minor impact of ± 3% for all three impact categories. This is mainly due to the use of electricity for the cleaning of the floor. The used cleaning regime of vacuuming twice a week is very conservative and will in practice most of the times be lower.
EN15804 results
In this section the calculations have been conducted according to the requirements of the European Standard EN 158024 following the document “Part A: Calculation Rules for the Life Cycle Assessment and Requirements on the Background Report”.
Table 13: Results of the LCA – Environmental impact for Step (one year) Manufacturing Installation Use (1yr) End of Life Credits
Parameter Unit A1-3 A4 A5 B2 C1 C2 C3 C4 D GWP [kg CO2-Equiv.] 6.32E+00 3.70E-01 8.51E-01 3,22E-01 1.70E-02 7.34E-02 3.83E+00 1.12E-01 -8.46E-02 ODP [kg CFC11-Equiv.] 2.14E-08 3.17E-12 3.30E-09 2,30E-09 4.31E-09 1.53E-12 9.85E-08 1.84E-09 -3.51E-11 AP [kg SO2-Equiv.] 1.20E-02 5.44E-03 1.70E-03 1,35E-03 1.16E-04 3.69E-04 2.72E-03 5.19E-05 -2.17E-04 EP [kg PO4
3-- Equiv.] 2.23E-03 6.07E-04 1.80E-04 8,29E-05 4.21E-06 8.88E-05 1.02E-04 1.05E-05 -1.44E-05 POCP [kg Ethen Equiv.] 8.69E-03 1.42E-04 3.12E-04 9,17E-05 5.96E-06 3.93E-05 1.55E-04 3.00E-05 -1.73E-05 ADPE [kg Sb Equiv.] 2.51E-05 8.17E-09 2.89E-07 6,36E-08 1.17E-09 3.38E-09 3.48E-06 -7.75E-10 -7.02E-09 ADPF [MJ] 1.30E+02 3.52E+00 1.45E+01 5,78E+00 3.26E-01 1.01E+00 -2.55E+00 9.90E-02 -1.43E+00
GWP = Global warming potential; ODP = Depletion potential of the stratospheric ozone layer; AP = Acidification potential of land and water; EP = Eutrophication potential; POCP = Formation potential of tropospheric ozone photochemical oxidants; ADPE = Abiotic depletion potential for non fossil resources; ADPF = Abiotic depletion potential for fossil resources
Table 14: Results of the LCA – Resource use for Step (one year)
Manufacturing Installation Use (1yr) End of Life Credits Parameter Unit A1-3 A4 A5 B2 C1 C2 C3 C4 D
PERE [MJ] - - - - - - - - - PERM [MJ] - - - - - - - - - PERT [MJ] 1.39E+01 6.20E-02 2.86E-01 7.88E-01 2.55E-02 5.95E-02 -2.32E-01 -1.43E-02 -1.14E-01
PENRE [MJ] - - - - - - - - - PENRM [MJ] - - - - - - - - - PENRT [MJ] 1.30E+02 3.52E+00 1.45E+01 5.84E+00 3.30E-01 1.01E+00 -2.11E+00 1.12E-01 -1.43E+00
SM [kg] 5.99E-01 - - - - - - - - RSF [MJ] 2.85E-03 2.13E-05 2.14E-04 9.54E-05 0.00E+00 7.48E-06 -1.89E-04 -3.36E-06 -2.07E-05
NRSF [MJ] 2.98E-02 2.24E-04 2.24E-03 9.99E-04 0.00E+00 7.82E-05 -1.98E-03 -3.52E-05 -2.17E-04 FW [kg] 2.05E+01 1.08E-01 2.79E+00 5.28E+00 -7.97E-02 5.74E-02 -2.86E+00 -3.98E-01 -3.20E-01
PERE = Use of renewable primary energy excluding renewable primary energy resources used as raw materials; PERM = Use of renewable primary energy resources used as raw materials; PERT = Total use of renewable primary energy resources; PENRE = Use of non-renewable primary energy excluding non-renewable primary energy resources used as raw materials; PENRM = Use of non-renewable primary energy resources used as raw materials; PENRT = Total use of non-renewable primary energy resources; SM = Use of secondary material; RSF = Use of renewable secondary fuels; NRSF = Use of non-renewable secondary fuels; FW = Use of net fresh water
Step – Safety Vinyl Resilient Floor Covering
According to ISO 14025 & EN 15804
Table 15: Results of the LCA – Output flows and Waste categories for Step (one year) Manufacturing Transport Installation Use (1yr) End of Life/credits
Parameter Unit A1-3 A4 A5 B2 C1 C2 C3 C4 D HWD [kg] 2.42E-03 0.00E+00 1.57E-03 0.00E+00 0.00E+00 0.00E+00 0.00E+00 0.00E+00 0.00E+00
NHWD [kg] 9.22E+00 9.88E-03 6.15E-01 1.12E+00 6.04E-02 6.22E-03 1.49E+00 1.08E-02 1.56E-01 RWD [kg] 2.83E-03 4.72E-06 1.94E-04 7.12E-04 5.41E-05 1.44E-06 3.54E-04 1.59E-05 1.01E-04 CRU [kg] - - - - - - - - - MFR [kg] - - - - - - - - - MER [kg] - - - - - - 2.31E+00 - -
EE Power [MJ] - - 1.58E-01 - - - 1.74E+00 - - EE
Thermal energy [MJ] - - 2.95E-01 - - - 1.40E+01 - -
HWD = Hazardous waste disposed; NHWD = Non-hazardous waste disposed; RWD = Radioactive waste disposed; CRU = Components for re-use; MFR = Materials for recycling; MER = Materials for energy recovery; EE = Exported energy per energy carrier
Interpretation
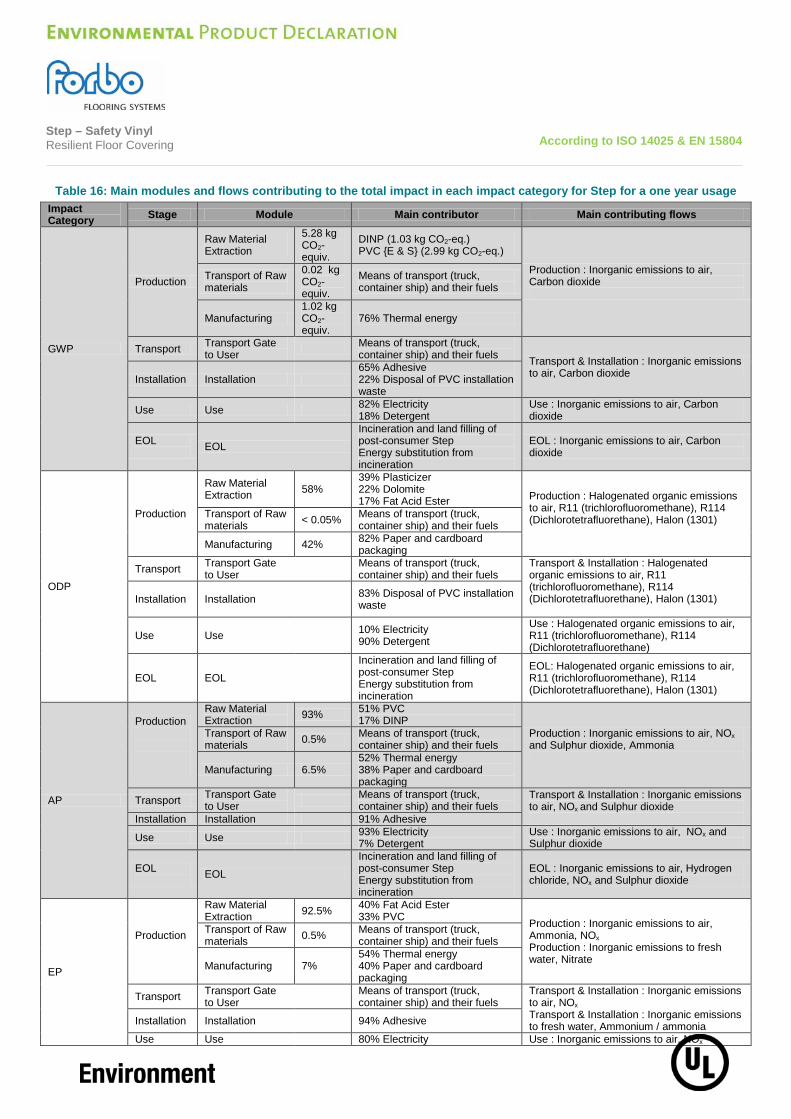
The interpretation of the environmental impacts calculated according to EN 15804 are similar to the interpretation according to ISO 14025. A more detailed interpretation for a one year useage is presented in figure 4 and table 16.
Figure 4: relative contribution of each process stage to each impact category for Step for a one year usage.
Step – Safety Vinyl Resilient Floor Covering
According to ISO 14025 & EN 15804
Table 16: Main modules and flows contributing to the total impact in each impact category for Step for a one year usage Impact Category Stage Module Main contributor Main contributing flows
GWP
Production
Raw Material Extraction
5.28 kg CO2-equiv.
DINP (1.03 kg CO2-eq.) PVC {E & S} (2.99 kg CO2-eq.)
Production : Inorganic emissions to air, Carbon dioxide
Transport of Raw materials
0.02 kg CO2-equiv.
Means of transport (truck, container ship) and their fuels
Manufacturing 1.02 kg CO2-equiv.
76% Thermal energy
Transport Transport Gate to User Means of transport (truck,
container ship) and their fuels Transport & Installation : Inorganic emissions to air, Carbon dioxide Installation Installation
65% Adhesive 22% Disposal of PVC installation waste
Use Use 82% Electricity 18% Detergent
Use : Inorganic emissions to air, Carbon dioxide
EOL EOL
Incineration and land filling of post-consumer Step Energy substitution from incineration
EOL : Inorganic emissions to air, Carbon dioxide
ODP
Production
Raw Material Extraction 58%
39% Plasticizer 22% Dolomite 17% Fat Acid Ester Production : Halogenated organic emissions
to air, R11 (trichlorofluoromethane), R114 (Dichlorotetrafluorethane), Halon (1301)
Transport of Raw materials < 0.05% Means of transport (truck,
container ship) and their fuels
Manufacturing 42% 82% Paper and cardboard packaging
Transport Transport Gate to User Means of transport (truck,
container ship) and their fuels Transport & Installation : Halogenated organic emissions to air, R11 (trichlorofluoromethane), R114 (Dichlorotetrafluorethane), Halon (1301)
Installation Installation 83% Disposal of PVC installation waste
Use Use 10% Electricity 90% Detergent
Use : Halogenated organic emissions to air, R11 (trichlorofluoromethane), R114 (Dichlorotetrafluorethane)
EOL EOL
Incineration and land filling of post-consumer Step Energy substitution from incineration
EOL: Halogenated organic emissions to air, R11 (trichlorofluoromethane), R114 (Dichlorotetrafluorethane), Halon (1301)
AP
Production
Raw Material Extraction 93% 51% PVC
17% DINP Production : Inorganic emissions to air, NOx and Sulphur dioxide, Ammonia
Transport of Raw materials 0.5% Means of transport (truck,
container ship) and their fuels
Manufacturing 6.5% 52% Thermal energy 38% Paper and cardboard packaging
Transport Transport Gate to User Means of transport (truck,
container ship) and their fuels Transport & Installation : Inorganic emissions to air, NOx and Sulphur dioxide Installation Installation 91% Adhesive
Use Use 93% Electricity 7% Detergent
Use : Inorganic emissions to air, NOx and Sulphur dioxide
EOL EOL
Incineration and land filling of post-consumer Step Energy substitution from incineration
EOL : Inorganic emissions to air, Hydrogen chloride, NOx and Sulphur dioxide
EP
Production
Raw Material Extraction 92.5% 40% Fat Acid Ester
33% PVC Production : Inorganic emissions to air, Ammonia, NOx Production : Inorganic emissions to fresh water, Nitrate
Transport of Raw materials 0.5% Means of transport (truck,
container ship) and their fuels
Manufacturing 7% 54% Thermal energy 40% Paper and cardboard packaging
Transport Transport Gate to User Means of transport (truck,
container ship) and their fuels Transport & Installation : Inorganic emissions to air, NOx Transport & Installation : Inorganic emissions to fresh water, Ammonium / ammonia Installation Installation 94% Adhesive
Use Use 80% Electricity Use : Inorganic emissions to air, NOx
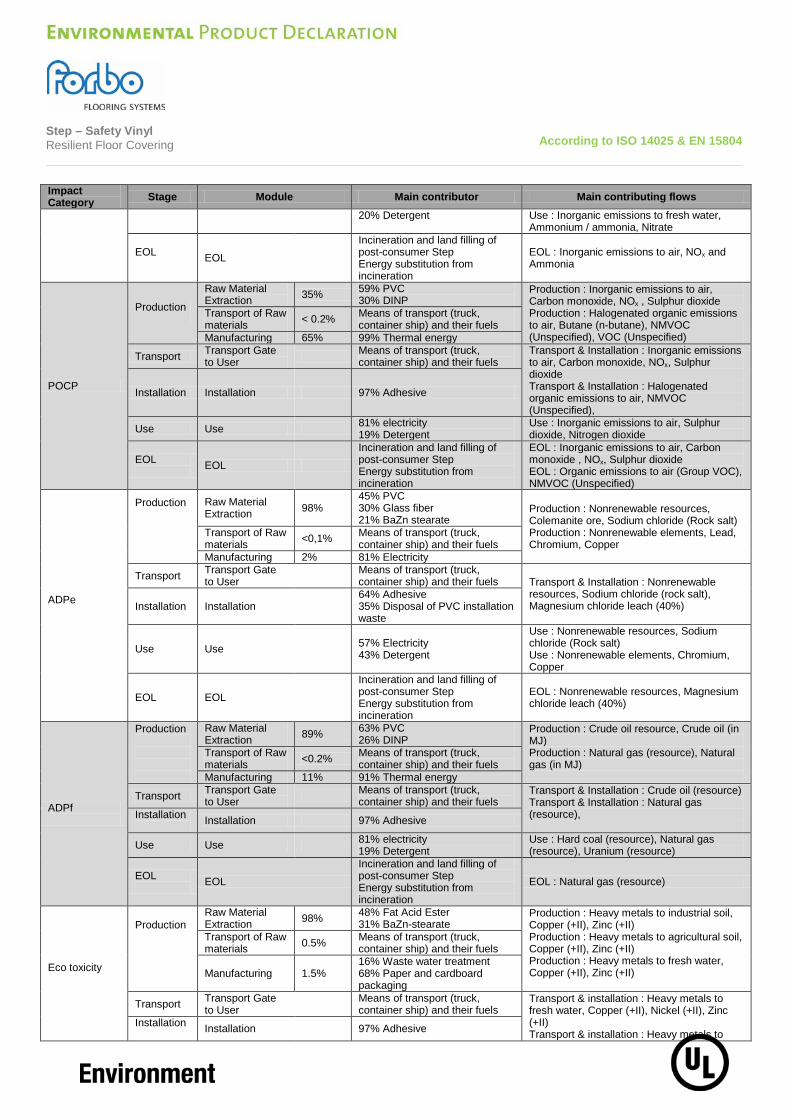
Step – Safety Vinyl Resilient Floor Covering
According to ISO 14025 & EN 15804
Impact Category Stage Module Main contributor Main contributing flows
20% Detergent Use : Inorganic emissions to fresh water, Ammonium / ammonia, Nitrate
EOL EOL
Incineration and land filling of post-consumer Step Energy substitution from incineration
EOL : Inorganic emissions to air, NOx and Ammonia
POCP
Production
Raw Material Extraction 35% 59% PVC
30% DINP Production : Inorganic emissions to air, Carbon monoxide, NOx , Sulphur dioxide Production : Halogenated organic emissions to air, Butane (n-butane), NMVOC (Unspecified), VOC (Unspecified)
Transport of Raw materials < 0.2% Means of transport (truck,
container ship) and their fuels Manufacturing 65% 99% Thermal energy
Transport Transport Gate to User Means of transport (truck,
container ship) and their fuels Transport & Installation : Inorganic emissions to air, Carbon monoxide, NOx, Sulphur dioxide Transport & Installation : Halogenated organic emissions to air, NMVOC (Unspecified),
Installation Installation 97% Adhesive
Use Use 81% electricity 19% Detergent
Use : Inorganic emissions to air, Sulphur dioxide, Nitrogen dioxide
EOL EOL
Incineration and land filling of post-consumer Step Energy substitution from incineration
EOL : Inorganic emissions to air, Carbon monoxide , NOx, Sulphur dioxide EOL : Organic emissions to air (Group VOC), NMVOC (Unspecified)
ADPe
Production
Raw Material Extraction 98%
45% PVC 30% Glass fiber 21% BaZn stearate
Production : Nonrenewable resources, Colemanite ore, Sodium chloride (Rock salt) Production : Nonrenewable elements, Lead, Chromium, Copper
Transport of Raw materials <0,1% Means of transport (truck,
container ship) and their fuels Manufacturing 2% 81% Electricity
Transport Transport Gate to User Means of transport (truck,
container ship) and their fuels Transport & Installation : Nonrenewable resources, Sodium chloride (rock salt), Magnesium chloride leach (40%) Installation Installation
64% Adhesive 35% Disposal of PVC installation waste
Use Use 57% Electricity 43% Detergent
Use : Nonrenewable resources, Sodium chloride (Rock salt) Use : Nonrenewable elements, Chromium, Copper
EOL EOL
Incineration and land filling of post-consumer Step Energy substitution from incineration
EOL : Nonrenewable resources, Magnesium chloride leach (40%)
ADPf
Production
Raw Material Extraction 89% 63% PVC
26% DINP Production : Crude oil resource, Crude oil (in MJ) Production : Natural gas (resource), Natural gas (in MJ)
Transport of Raw materials <0.2% Means of transport (truck,
container ship) and their fuels Manufacturing 11% 91% Thermal energy
Transport Transport Gate to User Means of transport (truck,
container ship) and their fuels Transport & Installation : Crude oil (resource) Transport & Installation : Natural gas (resource),
Installation Installation 97% Adhesive
Use Use 81% electricity 19% Detergent
Use : Hard coal (resource), Natural gas (resource), Uranium (resource)
EOL EOL
Incineration and land filling of post-consumer Step Energy substitution from incineration
EOL : Natural gas (resource)
Eco toxicity
Production
Raw Material Extraction 98% 48% Fat Acid Ester
31% BaZn-stearate Production : Heavy metals to industrial soil, Copper (+II), Zinc (+II) Production : Heavy metals to agricultural soil, Copper (+II), Zinc (+II) Production : Heavy metals to fresh water, Copper (+II), Zinc (+II)
Transport of Raw materials 0.5% Means of transport (truck,
container ship) and their fuels
Manufacturing 1.5% 16% Waste water treatment 68% Paper and cardboard packaging
Transport Transport Gate to User Means of transport (truck,
container ship) and their fuels Transport & installation : Heavy metals to fresh water, Copper (+II), Nickel (+II), Zinc (+II) Transport & installation : Heavy metals to
Installation Installation 97% Adhesive
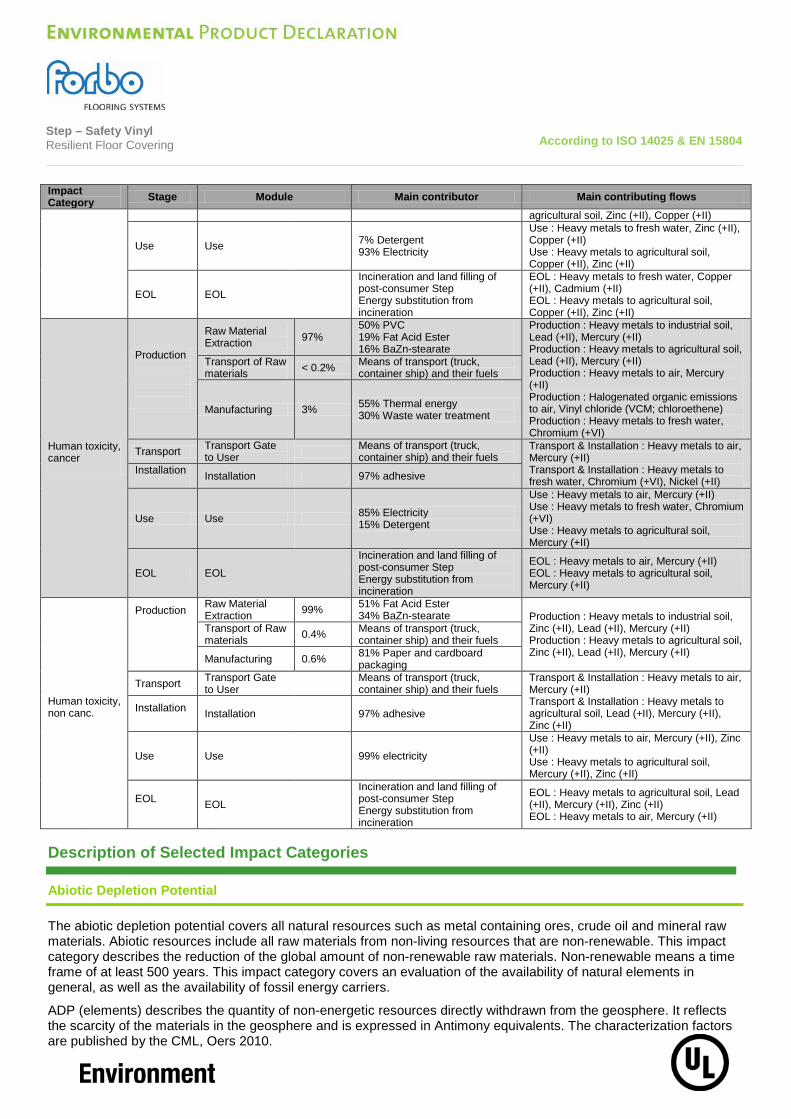
Step – Safety Vinyl Resilient Floor Covering
According to ISO 14025 & EN 15804
Impact Category Stage Module Main contributor Main contributing flows
agricultural soil, Zinc (+II), Copper (+II)
Use Use 7% Detergent 93% Electricity
Use : Heavy metals to fresh water, Zinc (+II), Copper (+II) Use : Heavy metals to agricultural soil, Copper (+II), Zinc (+II)
EOL EOL
Incineration and land filling of post-consumer Step Energy substitution from incineration
EOL : Heavy metals to fresh water, Copper (+II), Cadmium (+II) EOL : Heavy metals to agricultural soil, Copper (+II), Zinc (+II)
Human toxicity, cancer
Production
Raw Material Extraction 97%
50% PVC 19% Fat Acid Ester 16% BaZn-stearate
Production : Heavy metals to industrial soil, Lead (+II), Mercury (+II) Production : Heavy metals to agricultural soil, Lead (+II), Mercury (+II) Production : Heavy metals to air, Mercury (+II) Production : Halogenated organic emissions to air, Vinyl chloride (VCM; chloroethene) Production : Heavy metals to fresh water, Chromium (+VI)
Transport of Raw materials < 0.2% Means of transport (truck,
container ship) and their fuels
Manufacturing 3% 55% Thermal energy 30% Waste water treatment
Transport Transport Gate to User Means of transport (truck,
container ship) and their fuels Transport & Installation : Heavy metals to air, Mercury (+II) Transport & Installation : Heavy metals to fresh water, Chromium (+VI), Nickel (+II)
Installation Installation 97% adhesive
Use Use 85% Electricity 15% Detergent
Use : Heavy metals to air, Mercury (+II) Use : Heavy metals to fresh water, Chromium (+VI) Use : Heavy metals to agricultural soil, Mercury (+II)
EOL EOL
Incineration and land filling of post-consumer Step Energy substitution from incineration
EOL : Heavy metals to air, Mercury (+II) EOL : Heavy metals to agricultural soil, Mercury (+II)
Human toxicity, non canc.
Production
Raw Material Extraction 99% 51% Fat Acid Ester
34% BaZn-stearate Production : Heavy metals to industrial soil, Zinc (+II), Lead (+II), Mercury (+II) Production : Heavy metals to agricultural soil, Zinc (+II), Lead (+II), Mercury (+II)
Transport of Raw materials 0.4% Means of transport (truck,
container ship) and their fuels
Manufacturing 0.6% 81% Paper and cardboard packaging
Transport Transport Gate to User Means of transport (truck,
container ship) and their fuels Transport & Installation : Heavy metals to air, Mercury (+II) Transport & Installation : Heavy metals to agricultural soil, Lead (+II), Mercury (+II), Zinc (+II)
Installation Installation 97% adhesive
Use Use 99% electricity
Use : Heavy metals to air, Mercury (+II), Zinc (+II) Use : Heavy metals to agricultural soil, Mercury (+II), Zinc (+II)
EOL EOL
Incineration and land filling of post-consumer Step Energy substitution from incineration
EOL : Heavy metals to agricultural soil, Lead (+II), Mercury (+II), Zinc (+II) EOL : Heavy metals to air, Mercury (+II)
Description of Selected Impact Categories
Abiotic Depletion Potential
The abiotic depletion potential covers all natural resources such as metal containing ores, crude oil and mineral raw materials. Abiotic resources include all raw materials from non-living resources that are non-renewable. This impact category describes the reduction of the global amount of non-renewable raw materials. Non-renewable means a time frame of at least 500 years. This impact category covers an evaluation of the availability of natural elements in general, as well as the availability of fossil energy carriers.
ADP (elements) describes the quantity of non-energetic resources directly withdrawn from the geosphere. It reflects the scarcity of the materials in the geosphere and is expressed in Antimony equivalents. The characterization factors are published by the CML, Oers 2010.
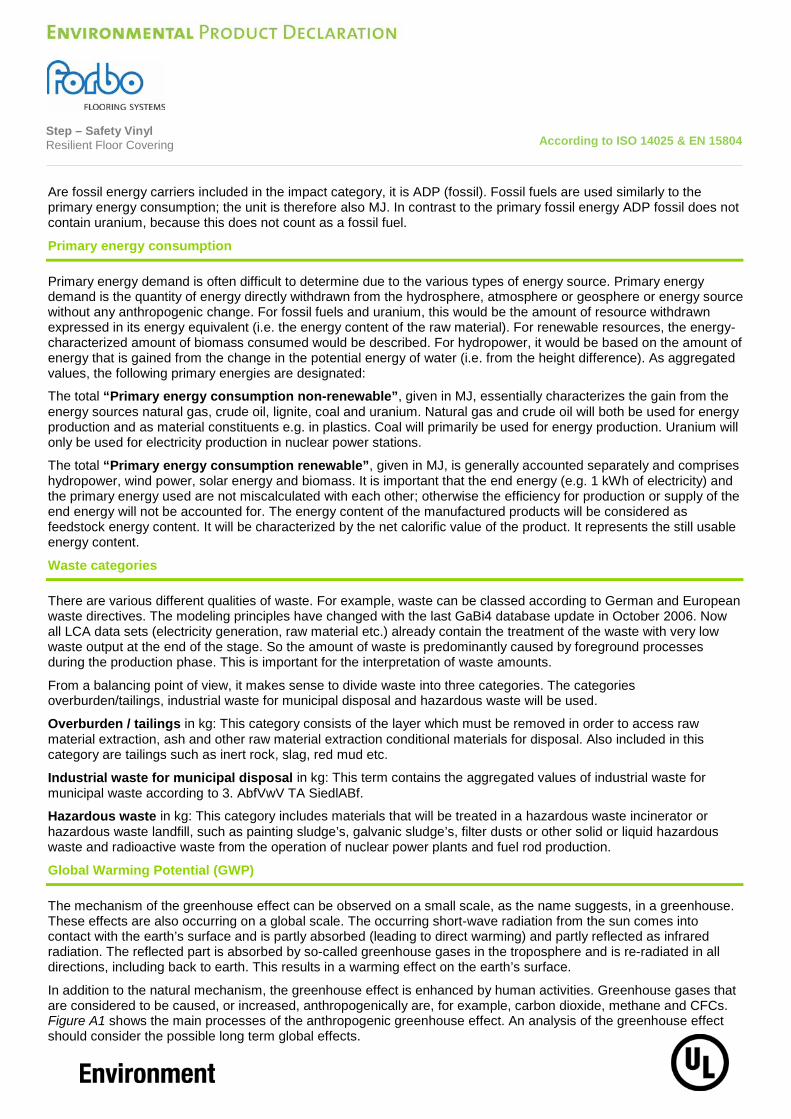
Step – Safety Vinyl Resilient Floor Covering
According to ISO 14025 & EN 15804
Are fossil energy carriers included in the impact category, it is ADP (fossil). Fossil fuels are used similarly to the primary energy consumption; the unit is therefore also MJ. In contrast to the primary fossil energy ADP fossil does not contain uranium, because this does not count as a fossil fuel.
Primary energy consumption
Primary energy demand is often difficult to determine due to the various types of energy source. Primary energy demand is the quantity of energy directly withdrawn from the hydrosphere, atmosphere or geosphere or energy source without any anthropogenic change. For fossil fuels and uranium, this would be the amount of resource withdrawn expressed in its energy equivalent (i.e. the energy content of the raw material). For renewable resources, the energy-characterized amount of biomass consumed would be described. For hydropower, it would be based on the amount of energy that is gained from the change in the potential energy of water (i.e. from the height difference). As aggregated values, the following primary energies are designated:
The total “Primary energy consumption non-renewable”, given in MJ, essentially characterizes the gain from the energy sources natural gas, crude oil, lignite, coal and uranium. Natural gas and crude oil will both be used for energy production and as material constituents e.g. in plastics. Coal will primarily be used for energy production. Uranium will only be used for electricity production in nuclear power stations.
The total “Primary energy consumption renewable”, given in MJ, is generally accounted separately and comprises hydropower, wind power, solar energy and biomass. It is important that the end energy (e.g. 1 kWh of electricity) and the primary energy used are not miscalculated with each other; otherwise the efficiency for production or supply of the end energy will not be accounted for. The energy content of the manufactured products will be considered as feedstock energy content. It will be characterized by the net calorific value of the product. It represents the still usable energy content.
Waste categories
There are various different qualities of waste. For example, waste can be classed according to German and European waste directives. The modeling principles have changed with the last GaBi4 database update in October 2006. Now all LCA data sets (electricity generation, raw material etc.) already contain the treatment of the waste with very low waste output at the end of the stage. So the amount of waste is predominantly caused by foreground processes during the production phase. This is important for the interpretation of waste amounts.
From a balancing point of view, it makes sense to divide waste into three categories. The categories overburden/tailings, industrial waste for municipal disposal and hazardous waste will be used.
Overburden / tailings in kg: This category consists of the layer which must be removed in order to access raw material extraction, ash and other raw material extraction conditional materials for disposal. Also included in this category are tailings such as inert rock, slag, red mud etc.
Industrial waste for municipal disposal in kg: This term contains the aggregated values of industrial waste for municipal waste according to 3. AbfVwV TA SiedlABf.
Hazardous waste in kg: This category includes materials that will be treated in a hazardous waste incinerator or hazardous waste landfill, such as painting sludge’s, galvanic sludge’s, filter dusts or other solid or liquid hazardous waste and radioactive waste from the operation of nuclear power plants and fuel rod production.
Global Warming Potential (GWP)
The mechanism of the greenhouse effect can be observed on a small scale, as the name suggests, in a greenhouse. These effects are also occurring on a global scale. The occurring short-wave radiation from the sun comes into contact with the earth’s surface and is partly absorbed (leading to direct warming) and partly reflected as infrared radiation. The reflected part is absorbed by so-called greenhouse gases in the troposphere and is re-radiated in all directions, including back to earth. This results in a warming effect on the earth’s surface.
In addition to the natural mechanism, the greenhouse effect is enhanced by human activities. Greenhouse gases that are considered to be caused, or increased, anthropogenically are, for example, carbon dioxide, methane and CFCs. Figure A1 shows the main processes of the anthropogenic greenhouse effect. An analysis of the greenhouse effect should consider the possible long term global effects.
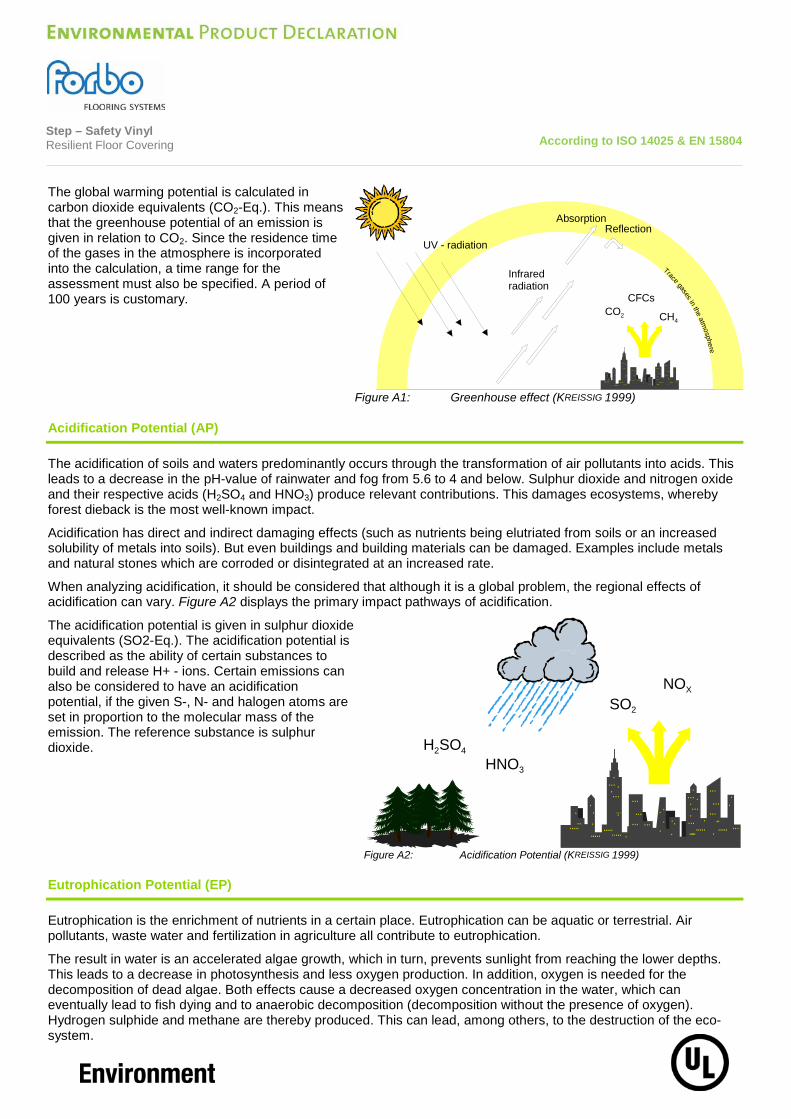
Step – Safety Vinyl Resilient Floor Covering
According to ISO 14025 & EN 15804
The global warming potential is calculated in carbon dioxide equivalents (CO2-Eq.). This means that the greenhouse potential of an emission is given in relation to CO2. Since the residence time of the gases in the atmosphere is incorporated into the calculation, a time range for the assessment must also be specified. A period of 100 years is customary.
Figure A1: Greenhouse effect (KREISSIG 1999)
Acidification Potential (AP)
The acidification of soils and waters predominantly occurs through the transformation of air pollutants into acids. This leads to a decrease in the pH-value of rainwater and fog from 5.6 to 4 and below. Sulphur dioxide and nitrogen oxide and their respective acids (H2SO4 and HNO3) produce relevant contributions. This damages ecosystems, whereby forest dieback is the most well-known impact.
Acidification has direct and indirect damaging effects (such as nutrients being elutriated from soils or an increased solubility of metals into soils). But even buildings and building materials can be damaged. Examples include metals and natural stones which are corroded or disintegrated at an increased rate.
When analyzing acidification, it should be considered that although it is a global problem, the regional effects of acidification can vary. Figure A2 displays the primary impact pathways of acidification.
The acidification potential is given in sulphur dioxide equivalents (SO2-Eq.). The acidification potential is described as the ability of certain substances to build and release H+ - ions. Certain emissions can also be considered to have an acidification potential, if the given S-, N- and halogen atoms are set in proportion to the molecular mass of the emission. The reference substance is sulphur dioxide.
Figure A2: Acidification Potential (KREISSIG 1999)
Eutrophication Potential (EP)
Eutrophication is the enrichment of nutrients in a certain place. Eutrophication can be aquatic or terrestrial. Air pollutants, waste water and fertilization in agriculture all contribute to eutrophication.
The result in water is an accelerated algae growth, which in turn, prevents sunlight from reaching the lower depths. This leads to a decrease in photosynthesis and less oxygen production. In addition, oxygen is needed for the decomposition of dead algae. Both effects cause a decreased oxygen concentration in the water, which can eventually lead to fish dying and to anaerobic decomposition (decomposition without the presence of oxygen). Hydrogen sulphide and methane are thereby produced. This can lead, among others, to the destruction of the eco-system.
SO2
NOX
H2SO44
HNO3
CO2 CH4
CFCs
UV - radiation
AbsorptionReflection
Infraredradiation
Trace gases in the atmosphere
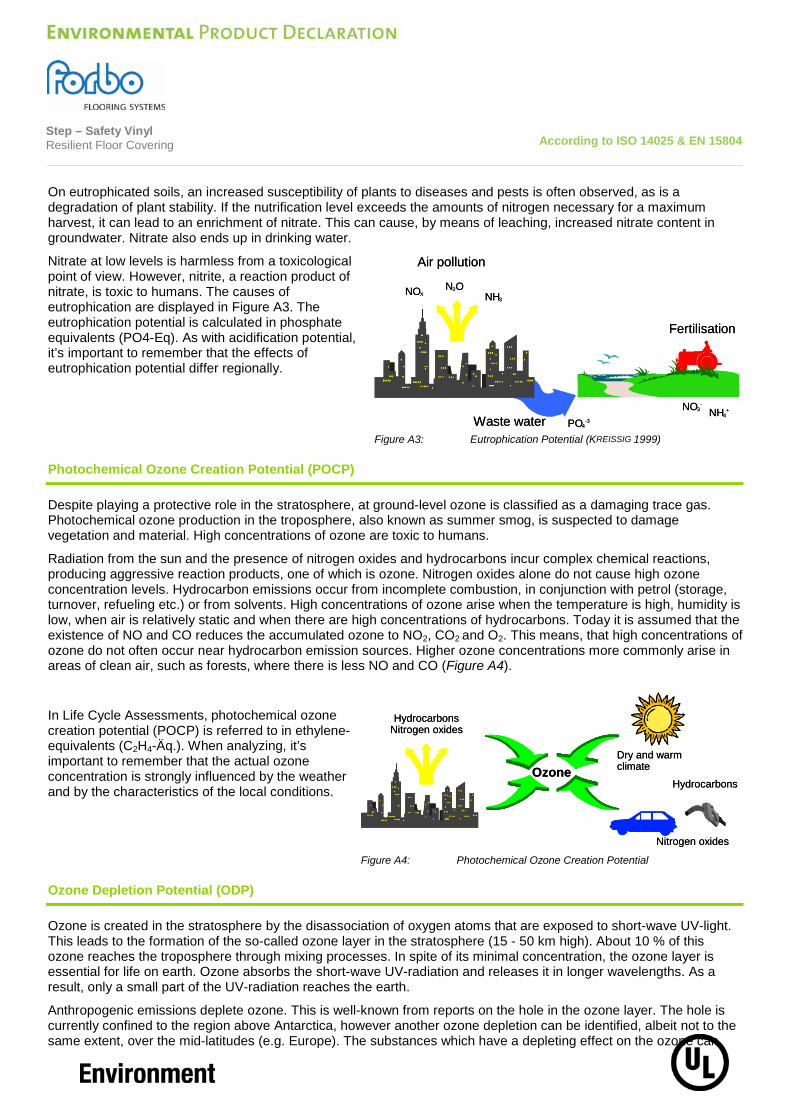
Step – Safety Vinyl Resilient Floor Covering
According to ISO 14025 & EN 15804
On eutrophicated soils, an increased susceptibility of plants to diseases and pests is often observed, as is a degradation of plant stability. If the nutrification level exceeds the amounts of nitrogen necessary for a maximum harvest, it can lead to an enrichment of nitrate. This can cause, by means of leaching, increased nitrate content in groundwater. Nitrate also ends up in drinking water.
Nitrate at low levels is harmless from a toxicological point of view. However, nitrite, a reaction product of nitrate, is toxic to humans. The causes of eutrophication are displayed in Figure A3. The eutrophication potential is calculated in phosphate equivalents (PO4-Eq). As with acidification potential, it’s important to remember that the effects of eutrophication potential differ regionally.
Figure A3: Eutrophication Potential (KREISSIG 1999)
Photochemical Ozone Creation Potential (POCP)
Despite playing a protective role in the stratosphere, at ground-level ozone is classified as a damaging trace gas. Photochemical ozone production in the troposphere, also known as summer smog, is suspected to damage vegetation and material. High concentrations of ozone are toxic to humans.
Radiation from the sun and the presence of nitrogen oxides and hydrocarbons incur complex chemical reactions, producing aggressive reaction products, one of which is ozone. Nitrogen oxides alone do not cause high ozone concentration levels. Hydrocarbon emissions occur from incomplete combustion, in conjunction with petrol (storage, turnover, refueling etc.) or from solvents. High concentrations of ozone arise when the temperature is high, humidity is low, when air is relatively static and when there are high concentrations of hydrocarbons. Today it is assumed that the existence of NO and CO reduces the accumulated ozone to NO2, CO2 and O2. This means, that high concentrations of ozone do not often occur near hydrocarbon emission sources. Higher ozone concentrations more commonly arise in areas of clean air, such as forests, where there is less NO and CO (Figure A4).
Ozone Depletion Potential (ODP)
Ozone is created in the stratosphere by the disassociation of oxygen atoms that are exposed to short-wave UV-light. This leads to the formation of the so-called ozone layer in the stratosphere (15 - 50 km high). About 10 % of this ozone reaches the troposphere through mixing processes. In spite of its minimal concentration, the ozone layer is essential for life on earth. Ozone absorbs the short-wave UV-radiation and releases it in longer wavelengths. As a result, only a small part of the UV-radiation reaches the earth.
Anthropogenic emissions deplete ozone. This is well-known from reports on the hole in the ozone layer. The hole is currently confined to the region above Antarctica, however another ozone depletion can be identified, albeit not to the same extent, over the mid-latitudes (e.g. Europe). The substances which have a depleting effect on the ozone can
In Life Cycle Assessments, photochemical ozone creation potential (POCP) is referred to in ethylene-equivalents (C2H4-Äq.). When analyzing, it’s important to remember that the actual ozone concentration is strongly influenced by the weather and by the characteristics of the local conditions.
Figure A4: Photochemical Ozone Creation Potential
Waste water
Air pollution
Fertilisation
PO4-3
NO3-
NH4+
NOXN2O
NH3
Waste water
Air pollution
Fertilisation
PO4-3
NO3-
NH4+
NOXN2O
NH3
HydrocarbonsNitrogen oxides
Dry and warmclimate
Hydrocarbons
Nitrogen oxides
Ozone
HydrocarbonsNitrogen oxides
Dry and warmclimate
Hydrocarbons
Nitrogen oxides
Ozone
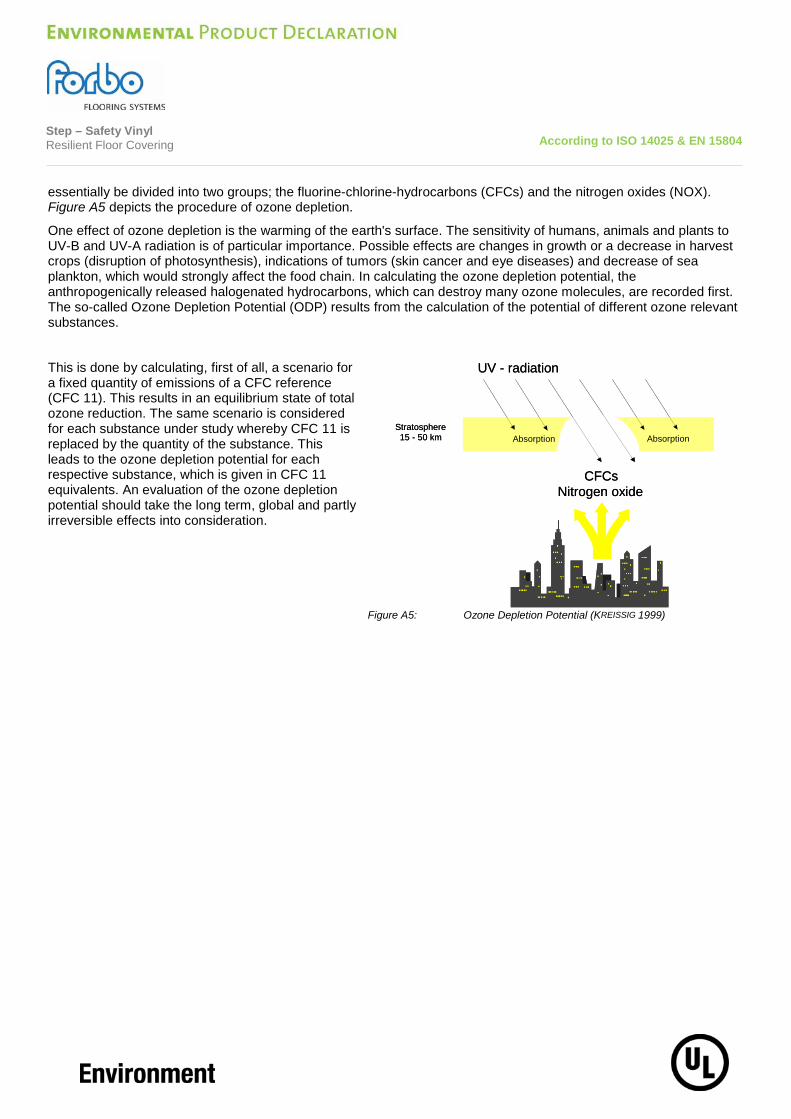
Step – Safety Vinyl Resilient Floor Covering
According to ISO 14025 & EN 15804
essentially be divided into two groups; the fluorine-chlorine-hydrocarbons (CFCs) and the nitrogen oxides (NOX). Figure A5 depicts the procedure of ozone depletion.
One effect of ozone depletion is the warming of the earth's surface. The sensitivity of humans, animals and plants to UV-B and UV-A radiation is of particular importance. Possible effects are changes in growth or a decrease in harvest crops (disruption of photosynthesis), indications of tumors (skin cancer and eye diseases) and decrease of sea plankton, which would strongly affect the food chain. In calculating the ozone depletion potential, the anthropogenically released halogenated hydrocarbons, which can destroy many ozone molecules, are recorded first. The so-called Ozone Depletion Potential (ODP) results from the calculation of the potential of different ozone relevant substances.
This is done by calculating, first of all, a scenario for a fixed quantity of emissions of a CFC reference (CFC 11). This results in an equilibrium state of total ozone reduction. The same scenario is considered for each substance under study whereby CFC 11 is replaced by the quantity of the substance. This leads to the ozone depletion potential for each respective substance, which is given in CFC 11 equivalents. An evaluation of the ozone depletion potential should take the long term, global and partly irreversible effects into consideration.
Figure A5: Ozone Depletion Potential (KREISSIG 1999)
CFCsNitrogen oxide
Stratosphere15 - 50 km Absorption Absorption
UV - radiation
CFCsNitrogen oxide
Stratosphere15 - 50 km Absorption Absorption
UV - radiation
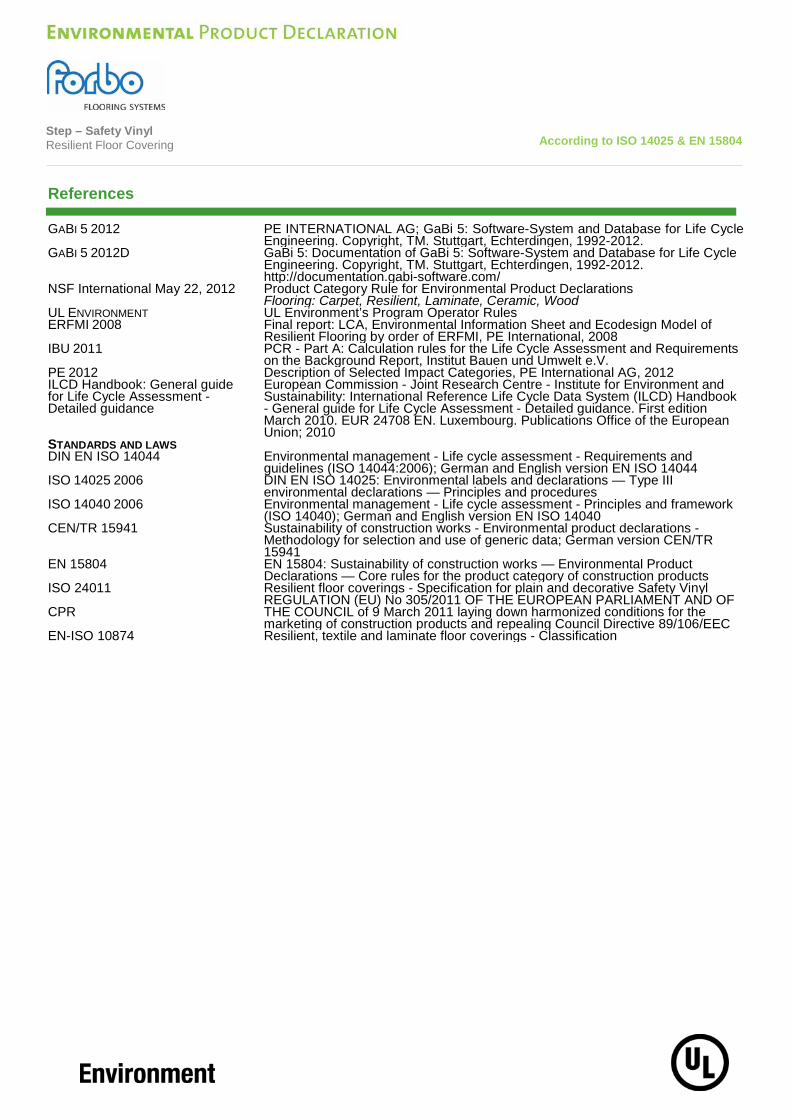
Step – Safety Vinyl Resilient Floor Covering
According to ISO 14025 & EN 15804
References
GABI 5 2012 PE INTERNATIONAL AG; GaBi 5: Software-System and Database for Life Cycle Engineering. Copyright, TM. Stuttgart, Echterdingen, 1992-2012.
GABI 5 2012D GaBi 5: Documentation of GaBi 5: Software-System and Database for Life Cycle Engineering. Copyright, TM. Stuttgart, Echterdingen, 1992-2012. http://documentation.gabi-software.com/
NSF International May 22, 2012 Product Category Rule for Environmental Product Declarations Flooring: Carpet, Resilient, Laminate, Ceramic, Wood
UL ENVIRONMENT UL Environment’s Program Operator Rules ERFMI 2008 Final report: LCA, Environmental Information Sheet and Ecodesign Model of
Resilient Flooring by order of ERFMI, PE International, 2008 IBU 2011 PCR - Part A: Calculation rules for the Life Cycle Assessment and Requirements
on the Background Report, Institut Bauen und Umwelt e.V. PE 2012 ILCD Handbook: General guide for Life Cycle Assessment - Detailed guidance
Description of Selected Impact Categories, PE International AG, 2012 European Commission - Joint Research Centre - Institute for Environment and Sustainability: International Reference Life Cycle Data System (ILCD) Handbook - General guide for Life Cycle Assessment - Detailed guidance. First edition March 2010. EUR 24708 EN. Luxembourg. Publications Office of the European Union; 2010
STANDARDS AND LAWS DIN EN ISO 14044 Environmental management - Life cycle assessment - Requirements and
guidelines (ISO 14044:2006); German and English version EN ISO 14044 ISO 14025 2006 DIN EN ISO 14025: Environmental labels and declarations — Type III
environmental declarations — Principles and procedures ISO 14040 2006 Environmental management - Life cycle assessment - Principles and framework
(ISO 14040); German and English version EN ISO 14040 CEN/TR 15941 Sustainability of construction works - Environmental product declarations -
Methodology for selection and use of generic data; German version CEN/TR 15941
EN 15804 EN 15804: Sustainability of construction works — Environmental Product Declarations — Core rules for the product category of construction products
ISO 24011 Resilient floor coverings - Specification for plain and decorative Safety Vinyl CPR
REGULATION (EU) No 305/2011 OF THE EUROPEAN PARLIAMENT AND OF THE COUNCIL of 9 March 2011 laying down harmonized conditions for the marketing of construction products and repealing Council Directive 89/106/EEC
EN-ISO 10874 Resilient, textile and laminate floor coverings - Classification