EnvironmEntal Product dEclaration - Jason Grant … Product dEclaration ... EPDs may not be...
31
ENVIRONMENTAL PRODUCT DECLARATION From Private Commercial Forestry in Gray’s Harbor County, Washington 650,000-acre Forest of Douglas fir, Western Hemlock, and Sitka Spruce 2000 Powell Street, Ste. 600, Emeryville, CA 94608 +1.510.452.8000 | www.SCSglobalServices.com This declaration covers environmental impacts throughout the product life cycle, from raw material extraction through end of life. Note: EPDs may not be comparable.
Transcript of EnvironmEntal Product dEclaration - Jason Grant … Product dEclaration ... EPDs may not be...

EnvironmEntal Product dEclaration From Private commercial Forestry in Gray’s Harbor county, Washington
650,000-acre Forest of Douglas fir, Western Hemlock, and Sitka Spruce
2000 Powell Street, Ste. 600, Emeryville, CA 94608 +1.510.452.8000 | www.SCSglobalServices.com
This declaration covers environmental impacts throughout the product life cycle, from raw material extraction through end of life. Note: EPDs may not be comparable.

© 2013 SCSglobalServices.com 2
EnvironmEntal Product dEclaration
Forestry operations in Gray’s Harbor countyDouglas Fir and Western Hemlock Dimensional Lumber
Table of Contents
About this EPD . . . . . . . . . . . . . . . . . . . . . . . . . . . . . . . . . . . . . . . . . . . . . . . . . . . . . . . . . . . . . . . . . . . . . . . . . . . . . . . . . . . . . . . . . 3
Executive Summary . . . . . . . . . . . . . . . . . . . . . . . . . . . . . . . . . . . . . . . . . . . . . . . . . . . . . . . . . . . . . . . . . . . . . . . . . . . . . . . . . . . . . 4
Functional Unit and Declared Unit . . . . . . . . . . . . . . . . . . . . . . . . . . . . . . . . . . . . . . . . . . . . . . . . . . . . . . . . . . . . . . . . . . . . . . . . 6
Product System Description . . . . . . . . . . . . . . . . . . . . . . . . . . . . . . . . . . . . . . . . . . . . . . . . . . . . . . . . . . . . . . . . . . . . . . . . . . . . . 7
Process Flow Diagram . . . . . . . . . . . . . . . . . . . . . . . . . . . . . . . . . . . . . . . . . . . . . . . . . . . . . . . . . . . . . . . . . . . . . . . . . . . . . . . . . . . 8
Methodology Summary . . . . . . . . . . . . . . . . . . . . . . . . . . . . . . . . . . . . . . . . . . . . . . . . . . . . . . . . . . . . . . . . . . . . . . . . . . . . . . . . . . 8
Assumptions and Limitations . . . . . . . . . . . . . . . . . . . . . . . . . . . . . . . . . . . . . . . . . . . . . . . . . . . . . . . . . . . . . . . . . . . . . . . . . . . . 8
Life Cycle Inventory . . . . . . . . . . . . . . . . . . . . . . . . . . . . . . . . . . . . . . . . . . . . . . . . . . . . . . . . . . . . . . . . . . . . . . . . . . . . . . . . . . . . . 9
Allocation . . . . . . . . . . . . . . . . . . . . . . . . . . . . . . . . . . . . . . . . . . . . . . . . . . . . . . . . . . . . . . . . . . . . . . . . . . . . . . . . . . . . . . . . . . . . . . 9
Life Cycle Impact Assessment Results and Methodology . . . . . . . . . . . . . . . . . . . . . . . . . . . . . . . . . . . . . . . . . . . . . . . . . . . . 10
Group 1: Extracted Resource Depletion . . . . . . . . . . . . . . . . . . . . . . . . . . . . . . . . . . . . . . . . . . . . . . . . . . . . . . . . . . . . . . 11
Group 2: Land Use Ecological Impacts . . . . . . . . . . . . . . . . . . . . . . . . . . . . . . . . . . . . . . . . . . . . . . . . . . . . . . . . . . . . . . . . 12
Group 3: Emissions with Climate and Ocean Impacts . . . . . . . . . . . . . . . . . . . . . . . . . . . . . . . . . . . . . . . . . . . . . . . . . . . 23
Group 4: Emissions with Ecosystem Impacts . . . . . . . . . . . . . . . . . . . . . . . . . . . . . . . . . . . . . . . . . . . . . . . . . . . . . . . . . . . 25
Group 5: Emissions with Human Health Impacts . . . . . . . . . . . . . . . . . . . . . . . . . . . . . . . . . . . . . . . . . . . . . . . . . . . . . . . 26
Group 6: Risks from Untreated Hazardous and Radioactive Wastes . . . . . . . . . . . . . . . . . . . . . . . . . . . . . . . . . . . . . . 27
About SCS Global Services . . . . . . . . . . . . . . . . . . . . . . . . . . . . . . . . . . . . . . . . . . . . . . . . . . . . . . . . . . . . . . . . . . . . . . . . . . . . . . 28
Appendix . . . . . . . . . . . . . . . . . . . . . . . . . . . . . . . . . . . . . . . . . . . . . . . . . . . . . . . . . . . . . . . . . . . . . . . . . . . . . . . . . . . . . . . . . . . . . 29

© 2013 SCSglobalServices.com 3
EnvironmEntal Product dEclaration
Forestry operations in Gray’s Harbor countyDouglas Fir and Western Hemlock Dimensional Lumber
About this EPD
Product name Douglas Fir and Hemlock Dimensional Lumber
organization / operationCommercial forestry on private lands in Gray’s Harbor County,
Washington
Product description Douglas Fir and Hemlock dimensional lumber
Product category Construction products
Functional unit One million board feet
declared unit One million board feet (1 MMBF)
date of issue/Period of validity August 2013 – August 2016
EPd Program operator SCS Global Services
lca conducted by Tobias Schultz, Life Cycle Assessment Practitioner, SCS Global Services
Certification Status Pre-certified Certified
NOTE: This EPD should not be compared to an EPD from a different program. See “Assumptions and Limitations” for a description of the comparability of this EPD. This is a PreCertified EPD that is based on ISO 14025, but has no underlying Product Category Rule (PCR). This PreCertified EPD is intended to be used in future PCR development, and may not be used to earn LEED credits.
✓
© 2013 SCSglobalServices.com 4
EnvironmEntal Product dEclaration
Forestry operations in Gray’s Harbor countyDouglas Fir and Western Hemlock Dimensional Lumber
ExEcutivE SummaryProduct. This Environmental Product Declaration (EPD) accounts for the life cycle impacts from lumber made from
Douglas fir and Hemlock trees from commercial forestry operations in Gray’s Harbor County, Washington. These
operations take place in 650,000 acres of forest occupied primarily by Douglas fir, western hemlock, and Sitka spruce.
An average of 355 million board feet of timber has been produced each year from Gray’s Harbor County each year since
2000.
Assessment Methodology. The life cycle assessment (LCA) method used to develop this EPD conforms to the
international ISO-14040 series of LCA standards, as well as to the draft LEO-SCS-002 standard being finalized under the
American National Standards Institute (ANSI) process. The latter standard provides detailed instructions for identifying core
impact categories and distinct category indicators, and for calculating results.
By conforming to both standards, the assessment was sufficiently robust to address a comprehensive set of impact
categories determined to be relevant to Gray’s Harbor County commercial forestry (14 impact categories). Results for
each impact category are further broken down into specific impacts (called “category indicators”). In this study, twenty
distinct impacts were able to be quantified, and another 51 impacts were identified but could not be fully quantified. This
represents a level of reporting that fulfills the ISO-14025 goal of providing transparent disclosure about all environmentally
relevant impact categories, and thereby giving readers with a more complete understanding of how forestry operations in
the county affect forest integrity.typically could be from 20 to 80 years.
Scope. The LCA scope for this EPD includes tree planting and logging through milling into construction products,
transportation of products to market, and the impacts arising from end-of-life of wood products. Use phase impacts were
not accounted for, as these will vary widely based on the specific application. The useful lifetime of this product varies by
application, but typically could be from 20 to 80 years.

© 2013 SCSglobalServices.com 5
EnvironmEntal Product dEclaration
Forestry operations in Gray’s Harbor countyDouglas Fir and Western Hemlock Dimensional Lumber
Key Findings. Commercial forestry in Gray’s Harbor County, Washington has had significant impacts on the forests of the
region. For instance:
80% of this forest’s biome integrity has been lost. The remaining 20% is largely young trees growing with little resemblance to the original ecological community of plants and animals.
The habitats for 10 key animal species listed as rare, threatened, or endangered have been dramatically reduced.
No old growth trees remain on private lands in this county. Trees are only allowed to grow for 35 years before being harvested, compared to the original forest, in which trees aged up to 400 years.
At least 110,000,000 metric tons of carbon storage, or 60% of historic carbon storage capacity, has been lost over the last century. That’s more than the annual carbon dioxide emitted by the entire state of Washington from all sources.

© 2013 SCSglobalServices.com 6
EnvironmEntal Product dEclaration
Forestry operations in Gray’s Harbor countyDouglas Fir and Western Hemlock Dimensional Lumber
Summary of Findings
Group 1: Extracted resource depletion
Energy resource depletion Roughly 4 million Gigajoules of nonrenewable energy resources are depleted each year. This amount is equivalent to the fuel used to drive one million cars for 650 miles.
Wood resource depletion* Cumulatively, there is a 75% loss in wood resources over 650,000 acres, equal to more than 26,000 million board feet, enough to build 1.5 million homes.
loss of largest trees* More than 12 million trees over 29” inches in diameter have been logged.
Group 2: land use Ecological impacts
Forest Biome disturbance* The forest biome is disturbed by 80% across the 650,000 acres of forestland.
Freshwater Biome disturbance* Impacts to the freshwater biomes in up to 44 watersheds may be occurring.
Key Species Habitat disturbance* Disturbance to suitable habitats supporting 10 key species has been documented.
Group 3: Emissions with climate and ocean impacts
Global climate change*
A 60% loss in forest carbon storage over 650,000 acres has occurred in the past century, equivalent to losing 90 million metric tons of carbon storage. Even accounting for carbon still stored in wood products, the net loss in stored carbon has added the equivalent of more than 110 million metric tons of carbon dioxide to the atmosphere –more than the total annual emissions of the entire state of Washington.
arctic climate change* The net loss of carbon storage indirectly influences climate change in the Arctic, at a level equivalent to more than 110 million metric tons of carbon dioxide.
Ocean Acidification* The net loss of carbon storage has directly resulted in the addition of roughly 190 million metric tons of carbonic acid (H2CO3) to the oceans.
ocean Warming* The net loss of carbon storage accelerates the warming of the oceans, at a level equivalent to more than 110 million metric tons of carbon dioxide.
Group 4: Emissions with Ecosystem impacts
Regional AcidificationThe equivalent of about 790 metric tons of sulfur dioxide is emitted each year, contributing to increasing acidity of land and water bodies. This is equivalent to approximately 3% of the annual emissions from a medium-sized coal-fired power plant.**
Group 5: Emissions with Human Health impacts
Ground level ozone Exposure risks
Nitrogen oxide emissions led to the formation of ground level ozone, resulting in annual human exposure measured as 15,000 persons * hours * parts per billion of ozone. This is equivalent to the annual human exposure resulting from 1 million cars driving 210 miles in the city of Seattle.
Pm2.5 Exposure risksHuman exposure to fine particulate matter (2.5 micrometers or less) is occurring annually at a rate measured as 22,000 persons * hours * µg PM2.5 eq. / m3, equivalent to the annual exposure resulting from 1 million cars driving 50 miles in the city of Seattle.
Hazardous chemical use and discharges
Applications of nine separate herbicides as a part of forest management operations could potentially expose workers.
Group 6: risks from untreated Hazardous and radioactive Wastes
no impacts
*These results are compared to an old growth forest in Olympic National Park, close to the forests in Gray’s Harbor County.
**Based on the emission rate of SO2 from a 325-MW coal power plant in Pennsylvania
LCIA Results. The following table summarizes results calculated for dimensional lumber.

© 2013 SCSglobalServices.com 7
EnvironmEntal Product dEclaration
Forestry operations in Gray’s Harbor countyDouglas Fir and Western Hemlock Dimensional Lumber
Product Description and Material Content DeclarationThis lumber is 100% wood, derived from Douglas fir and Hemlock trees, from Gray’s Harbor County, Washington. It is
cut to dimensions that are typically used in construction (e.g., 2”x4”, 2”x6”, 2”x8”) with varying lengths. It is mainly used for
residential construction. The useful lifetime of this product varies by application, but typically could be from 20 to 80 years.
This EPD covers phases from tree planting and production through milling into construction products, transportation of
products to market, and the impacts arising from end-of-life of wood products. Use phase impacts are not accounted for,
as they will vary based on the application. This EPD accounts for the impacts from lumber made from Douglas fir and
Western hemlock, as both have very similar impact levels.
Functional Unit and Declared UnitThis dimensional lumber is used in construction for a wide range of load-bearing and non-load bearing applications. Given
the large number of applications, a single functional unit cannot be clearly defined. Accordingly, a declared unit is used in
lieu of a functional unit. The declared unit is 1 million board feet of dimensional lumber.
Product System DescriptionThe forest covers approximately 650,000 acres in Gray’s Harbor County, Washington, approximately 100 miles southwest
of Seattle. The forest is composed primarily of Western hemlock, Douglas fir, and Sitka spruce in young age classes; 80% of
the forest is less than 40 years old. The only forests in Gray’s Harbor County that are represented by this EPD are those in
private ownership.
Forestry practices across the county are very similar. Most forest operators use even-aged forest management; 80% of the
timberlands are managed using clear-cutting on a 40-year rotation cycle. The remainder of the forest has been clear-cut in
the past century, with an average forest age of 27 years, in a region where forests can naturally reach 250 years of age or
more.
After harvest, logs are transported to sawmills in Aberdeen, Washington, and in counties adjoining Gray’s Harbor, relatively
close to the harvest site. Afterwards, the wood is dried, surfaced, and planed, and the final product is transported by truck
to markets.
From 2000 to 2010 in Gray’s Harbor, Douglas fir and Western hemlock together accounted for roughly 80% to 85% of the
total production of timber.
© 2013 SCSglobalServices.com 8
EnvironmEntal Product dEclaration
Forestry operations in Gray’s Harbor countyDouglas Fir and Western Hemlock Dimensional Lumber
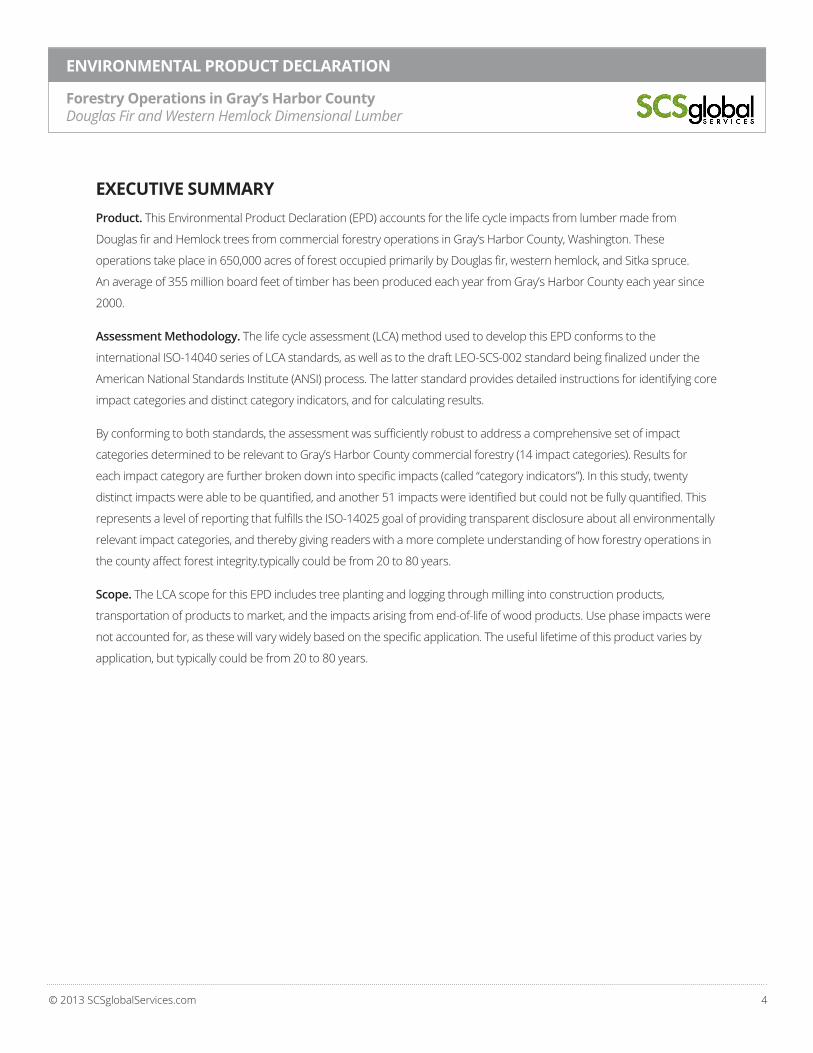
Process Flow Diagram
Methodology SummaryThe LCA methodology used to assess the results reported in this EPD is from the Draft LEO-SCS-002 standard, and is
fully consistent with the ISO 14040 standards series. To assess the loss of the largest trees, forest biome disturbance, key
species suitable habitat disturbance, wood resource depletion, and carbon storage loss, the forest in Gray’s Harbor County
was compared to a reference forest in Olympic National Park. Measurements of ecological health were compared in both
of these forests, and the disturbance profile was based upon the deviation in conditions at Gray’s Harbor when compared
to the forests of Olympic National Park, considering the potential range of conditions in the forest.
The emissions from milling and transportation were modeled using data from the US LCI database. Impact assessment
was conducted in conformance with ISO-14044 and the Draft LEO-SCS-002 standard.
Assumptions and Limitations § The Olympic National Park is a primary growth forest in the region. It was chosen to represent forest biome
conditions that are the least impacted by human activities since the pre-industrial period. The main human effects to
the park have been those associated with fire suppression. The assessment also considered the potential range of
ecological health for the forest by considering conditions in forests that were completely disturbed from clear-cuts
and forest fires in the last twenty years.
§ The list of core impact categories and category indicators is meant to be comprehensive, but there may be additional
impacts that are not accounted for due to a lack of data.
LoggingContributes 95% or more to at least one indicator result
ElectricityContributes 15% or more to at least one indicator result
Natural Gas ProductionContributes 15% or more to at least one indicator result
Milling Transportation(to Market)
Installationand Use in
Construction*End-of-life
* not included in scope
© 2013 SCSglobalServices.com 9
EnvironmEntal Product dEclaration
Forestry operations in Gray’s Harbor countyDouglas Fir and Western Hemlock Dimensional Lumber
§ The measurements of forest biome and habitat disturbance are based on forest inventory measurements, and do not
account for landscape-level disturbances such as fragmentation.
§ No data were available to characterize impacts to freshwater biomes or habitats. However, impacts to streams, such
as those from increased sedimentation, are known to occur in the area as a result of forestry operations, and many
of the watersheds in Gray’s Harbor County may be affected. All watersheds which have 25% or more of their area in
commercial timberlands are listed, though no specific data on disturbance were available.
§ This is a pre-certified EPD, and these results cannot be compared to other EPDs.
§ This EPD excludes any use phase impacts, due to the wide variety of potential applications.
§ This EPD only addresses biophysical environmental impacts. Social and economic considerations are outside of the
scope.
Life Cycle InventoryThe dataset from the National Renewable Energy Laboratory’s US LCI database titled “Surface dried lumber, at planer
mill, US Pacific Northwest” was used to represent the mill operations. Modifications incorporated the density of the
wood entering the mill (redwood and Douglas fir), and a correction to account for the hog fuel produced during milling,
which is used in the kiln drying process. For transportation, the US LCI dataset used was “Transport, combination truck,
diesel powered/US,” modified to include black carbon. All data related to forest biome disturbance were from the Forest
Inventory and Analysis (FIA) database provided by the US Forest Service.
AllocationImpacts were allocated on a mass or volume basis in accordance with ISO 14044. Impacts resulting from logging in Gray’s
Harbor County were allocated on a volume basis using the volume of timber extracted from the forest.

© 2013 SCSglobalServices.com 10
EnvironmEntal Product dEclaration
Forestry operations in Gray’s Harbor countyDouglas Fir and Western Hemlock Dimensional Lumber
Life Cycle Impact Assessment Results and MethodologyConsistent with ISO-14044 and the draft LEO-SCS-002 standard, results for relevant impact categories are calculated.
These impact categories fall within in six general groups:
§ Extracted Resource Depletion
§ Land Use Ecological Impacts
§ Emissions with Climate and Oceanic Impacts
§ Emissions with Ecosystem Impacts
§ Emissions with Human Health impacts
§ Risks from Untreated Hazardous and Radioactive Wastes
The first step in the life cycle impact assessment is the identification of “core” impact categories associated with the
production of dimensional lumber from forestry in Gray’s Harbor County. The core impact categories represent observed
impacts to the environment and human health resulting from the production of dimensional lumber in Gray’s Harbor
County.
Once the “core” impact categories are identified, the category indicators relevant to these impact categories are identified
and characterized. For some impact categories, multiple distinct impacts may be occurring, and so multiple category
indicators may be identified.
For the dimensional lumber products covered by this EPD, 17 category indicators were measured in 13 core impact
categories. An additional 59 category indicators in 3 impact categories could not be measured, though impacts may be
occurring.

© 2013 SCSglobalServices.com 11
EnvironmEntal Product dEclaration
Forestry operations in Gray’s Harbor countyDouglas Fir and Western Hemlock Dimensional Lumber
GrouP 1: ExtractEd rESourcE dEPlEtion
The impact categories in this group involve the depletion of extracted natural resources. For the production of dimensional
lumber, there are two core impact categories, each with one category indicator: Energy Resource Depletion and Wood
Resource Depletion. Energy Resource Depletion is a measure of energy consumption, factoring in the total projected
depletion of each type of energy reserve, while Wood Resource Depletion considers the drawdown in valuable timber
resources in Gray’s Harbor County when compared to Olympic National Park.
impact category /category indicator unit result for
1 mmBFresult for Gray’s Harbor county
data Quality level
uncertainty level
Energy Resource Depletion
Energy Resource Depletion GJ equivalent 11,000 4,000,000 Medium
Wood Resource Depletion
Wood Resource Depletion MMBF 73 26,000 ± 20%
The milling and transportation of dimensional lumber contributes to most of the impact for Energy Resource Depletion.
For Wood Resource Depletion, all of the impact is related to logging.
Energy Resource Depletion Wood Resource Depletion
Logging Milling and Transportation End-of-Life
100%80%
11%
9%

© 2013 SCSglobalServices.com 12
EnvironmEntal Product dEclaration
Forestry operations in Gray’s Harbor countyDouglas Fir and Western Hemlock Dimensional Lumber
GrouP 2: land uSE EcoloGical imPactS
The impact categories in this group reflect disturbances to biomes and key species habitat. For the production of
dimensional lumber, there are three core impact categories: Terrestrial Biome Disturbance (1 category indicator),
Freshwater Biome Disturbance (44 category indicators), and Key Species Habitat Disturbance (10 species represented by
11 category indicators). Impacts in each of these categories arise entirely from the logging phase of the life-cycle.
However, as described below, insufficient data were available to calculate the Freshwater Biome Disturbance indicators,
and data were available to calculate only a portion of the Key Species Habitat Disturbance indicators.
impact category / category indicator unit result for 1 mmBF
result for Gray’s Harbor county
(disturbance across 650,000 acres)
uncertainty level
Terrestrial Biome Disturbance
Central Pacific Coastal Forest Biome Disturbance
Eq. acres of fully disturbed forest
biome1,500 550,000
(80% disturbance) ± 20%
Key Species Habitat Disturbance
Loss of Largest Trees Trees removed (>29” d.b.h.) 34,000 12,000,000
(95% reduction) ± 20%
Keen’s Myotis Eq. acres of fully disturbed habitat 1,500 550,000
(80% disturbance) ± 20%
Marbled murrelet Trees removed (>29” d.b.h.) 34,000 12,000,000
(95% reduction) ± 20%
Northern spotted owl Eq. acres of fully disturbed habitat 1,500 550,000
(80% disturbance) ± 20%
Pacific fisher (foraging habitat)
Eq. acres of fully disturbed habitat 1,500 550,000
(80% disturbance) ± 20%
Pacific fisher (nesting habitat)
Trees removed (>29” d.b.h.) 34,000 12,000,000
(95% reduction ± 20%
Land Use Ecological Impacts resulting from logging do not vary with production levels on the site; even if the forest
operators in this region stopped all harvests, it would take a very long time for most of the impact levels to decline. As a
result, indicator results presented in the declared unit only can be misleading. Therefore, the fourth column of the above
table presents the county-wide scale of impacts.
Although there were insufficient data available to characterize the disturbance to the 44 watersheds identified under the
Freshwater Biome Disturbance category, impacts to watersheds are known to be attributed to forestry operations in this
region. Impacts in each of these watersheds would be considered a distinct category indicator.

© 2013 SCSglobalServices.com 13
EnvironmEntal Product dEclaration
Forestry operations in Gray’s Harbor countyDouglas Fir and Western Hemlock Dimensional Lumber
impact category / category indicator Watershed area (acres)
Freshwater Biome Disturbance
Little North River Biome Disturbance 13,002
Vesta Creek Biome Disturbance 19,829
Delzene Creek Biome Disturbance 9,196
Middle North River Biome Disturbance 20,932
Black Creek Biome Disturbance 16,046
Lower West Fork Satsop River Biome Disturbance 21,464
Johns River Biome Disturbance 20,309
Middle Wynoochee River Biome Disturbance 15,691
West Fork Wishkah River Biome Disturbance 14,043
Lowe-Salmon Creek Biome Disturbance 10,796
Upper North River Biome Disturbance 16,682
Newskah Creek-Frontal Grays Harbor Biome Disturbance 22,231
East Fork Wishkah River Biome Disturbance 14,906
Lower Humptulips River Biome Disturbance 25,906
Upper Humptulips River Biome Disturbance 26,805
Joe Creek-Frontal Pacific Ocean Biome Disturbance 22,792
Middle Humptulips River Biome Disturbance 28,514
Upper Wishkah River Biome Disturbance 24,449
Lower North River Biome Disturbance 33,208
Copalis River Biome Disturbance 25,760
West Fork Hoquiam River Biome Disturbance 22,309
Upper Wynoochee River Biome Disturbance 41,323
East Fork Hoquiam River Biome Disturbance 25,919
Lower Wishkah River Biome Disturbance 12,419
Lower Wynoochee River Biome Disturbance 25,994
Elkhorn Creek Biome Disturbance 11,084
Town of Satsop-Satsop River Biome Disturbance 5,734
Upper West Fork Satsop River Biome Disturbance 38,861
Chenois Creek-Frontal North Bay Biome Disturbance 18,134
Newman Creek-Chehalis River Biome Disturbance 31,217

© 2013 SCSglobalServices.com 14
EnvironmEntal Product dEclaration
Forestry operations in Gray’s Harbor countyDouglas Fir and Western Hemlock Dimensional Lumber
Wildcat Creek Biome Disturbance 13,482
Mox Chehalis Creek Biome Disturbance 15,823
Elliot Slough-Chehalis River Biome Disturbance 21,479
Cook Creek Biome Disturbance 25,727
Lower West Fork Humptulips River Biome Disturbance 23,106
Connor Creek-Frontal Pacific Ocean Biome Disturbance 11,329
Metcalf Slough-Chehalis River Biome Disturbance 16,211
Lower East Fork Satsop River Biome Disturbance 6,215
Garrard Creek Biome Disturbance 8,257
Hoquiam River Biome Disturbance 9,819
Middle Fork Satsop River Biome Disturbance 38,041
Moclips River Biome Disturbance 22,875
Rock Creek Biome Disturbance 16,941
Elk River-Frontal South Bay Biome Disturbance 32,772
Four of the eleven category indicators for Key Species Habitat Disturbance could be calculated with available data. The
remaining indicators represent species that are affected by the disturbance to freshwater habitat, for which data were
not available to characterize habitat disturbance. All of the impacted species, and the ranges they inhabit in Gray’s Harbor
County, are shown.
impact category / category indicatordisturbance calculated based on available data
(y/n)Species range in Gray’s Harbor county
Key Species Habitat Disturbance
Marbled murrelet Y Forests with trees over 29” d.b.h.
Pacific fisher Y Extirpated*
Northern Spotted Owl Y Forests over 80 years old
Keen’s Myotis Y Forests over 80 years old
Chinook salmon N 36 watersheds
Coho salmon N 21 watersheds
Cope’s giant salamander N 26 watersheds
Olympic torrent salamander N 44 watersheds
Steelhead trout N 29 watersheds
Van Dyke’s salamander N 14 watersheds
*The Pacific Fisher has been extirpated from Gray’s Harbor County, in large part because of past forest management practices which reduced the extent and quality of its habitat.

© 2013 SCSglobalServices.com 15
EnvironmEntal Product dEclaration
Forestry operations in Gray’s Harbor countyDouglas Fir and Western Hemlock Dimensional Lumber
Affected Biome: Central Pacific Coastal Forest
The affected forest biome is the Central Pacific Coastal Forest in Gray’s Harbor County. This includes 650,000 acres of
privately owned timberlands, composed of Douglas fir, Western hemlock, and Sitka spruce. The WWF WildFinder database
provides this description of the Central Pacific Coastal Forest:
“The Central Pacific Coastal Forests stretch from southern Oregon
to the northern tip of Vancouver Island. […] The forests of the
Central Pacific Coast are among the most productive in the world,
characterized by large trees, substantial woody debris, luxuriant
growths of mosses and lichens on trees, and abundant ferns and
herbs on the forest floor. The major forest complex consists of
Douglas-fir (Pseudotsuga menziesii) and western hemlock (Tsuga
heterophylla), encompassing seral forests dominated by Douglas-fir
and massive old-growth forests of fir, hemlock, western red cedar
(Thuja plicata), and other species. These forests occur from sea level
up to elevations of 700-1000 m in the Coast Range and Olympic
Mountains. This forest type occupies a wide range of environments
with variable composition and structure and includes such other
species as grand fir (Abies grandis), Sitka spruce (Picea sitchensis),
and western white pine (Pinus monticola).”
100%Logging
Land Use Ecological Impacts
Logging
Milling and Transportation
End-of-Life

© 2013 SCSglobalServices.com 16
EnvironmEntal Product dEclaration
Forestry operations in Gray’s Harbor countyDouglas Fir and Western Hemlock Dimensional Lumber
Douglas fir is currently the most common tree species in the privately owned forests of Gray’s Harbor County. However,
Douglas fir dominates only young forests in this region because of its large and hardy seedlings, and rapid growth rate.
Western hemlock is the major climax species in the region, and dominates old growth forests such as found in protected
forests in Olympic National Park, the reference forest. The short-rotation, even-aged forest management in Gray’s Harbor
County maintains the forest in a young age class, with an average age of only 27 years; this is in a region where, left alone,
trees can exceed 250 years in age.
To assess forest biome disturbance, the forest condition in Gray’s Harbor County is compared to a reference forest. For
this EPD, the reference forest is 250,000 acres of Western hemlock and Douglas fir forest in Olympic National Park. The
comparison is made using data from the Forest Inventory Analysis (FIA) database provided by the US Forest Service,
considering the following characteristics of the forest biome:
1. Forest compositional structure, including consideration of the age classes and species present in forest stands, and
the size of the trees present.
2. Live biomass in the forest, including above-ground biomass in trees as well as understory.
3. Dead biomass in the forest, including biomass in ground litter, and standing dead trees.
Central Pacific Coast Forest

© 2013 SCSglobalServices.com 17
EnvironmEntal Product dEclaration
Forestry operations in Gray’s Harbor countyDouglas Fir and Western Hemlock Dimensional Lumber
The deviation in conditions in Gray’s Harbor County from conditions in Olympic National Park was assessed using several
measurements, and was compared to the worst-case possible conditions of forests in this region for which data were
available. The Biome Disturbance Factor (BDF) was assessed by taking the average of the deviation values for all variables
for which data were available.
measurement unitsrecently
disturbed Forests
Gray's Harbor county
olympic national
Parkdeviation
Area considered Acres 632,082 650,887 248,878
Carbon in standing dead trees tons per acre 2.0 5.2 15.4 77%
Carbon in litter tons per acre 9.8 10.7 25.9 95%
Carbon in down dead tons per acre 8.9 9.5 17.3 93%
Carbon in live trees (belowground) tons per acre 1.7 7.2 27.7 79%
Carbon in live trees (aboveground) tons per acre 7.5 31.9 123.8 79%
Soil organic carbon tons per acre 44.0 45.9 51.2 73%
Carbon in understory (aboveground) tons per acre 1.7 1.4 1.1 60%
Number of trees >1" in diameter # of trees 414.0 511.3 346.1 100%
Number of trees >5" in diameter # of trees 97.9 194.6 132.5 100%
Number of trees >19" in diameter # of trees 0.5 6.1 38.8 85%
Number of trees >29" in diameter # of trees 0.1 1.0 19.5 95%
Percent of trees which are Hemlock Percent 39% 45% 68% 79%
Percent of trees which are Douglas fir Percent 43% 27% 3% 60%
Percent of trees which are Sitka spruce Percent 5% 4% 2% 50%
Percent of trees which are True fir Percent 0% 0% 15% 100%
Percent of forest < 40 years old Percent 100% 79% 0% 79%
Percent of forest < 60 years old Percent 0% 91% 6% 100%
Percent of forest <100 years old Percent 0% 98% 16% 100%
Percent of forest < 200 years old Percent 0% 99% 31% 100%
disturbance level (Biome disturbance Factor) 80% ±20%
Measurements of landscape level disturbance in Gray’s Harbor County, including the degree of fragmentation of the forest
and large-scale compositional structure, were not available. Though these measurements are important to consider, the
lack of data would not be expected to significantly change or bias the disturbance levels measured.

© 2013 SCSglobalServices.com 18
EnvironmEntal Product dEclaration
Forestry operations in Gray’s Harbor countyDouglas Fir and Western Hemlock Dimensional Lumber
reference Forest: olympic national Park
The regional biome is primary Central Pacific Coastal Forest, represented by Olympic National Park. This park is a located
on the Olympic Peninsula, roughly 10 to 60 miles from the privately owned forestlands considered in Gray’s Harbor
County. In Olympic National Park, 250,000 acres of Douglas fir and Western hemlock forest in the Park is compared to the
650,000 acres of the same forest types in Gray’s Harbor County.
Nearly 90% of the forests in Olympic National Park are over 100 years old. The largest anthropogenic disturbance
introduced in Olympic National Park is from fire suppression.
assessing Biome disturbance
The forest biome disturbance is calculated by considering the conditions of the forest in Gray’s Harbor County on the
spectrum of total possible forest conditions in this region. For each measurement included, the best-case conditions
considered are those in Olympic National Park; the worst-case conditions are those in the most highly disturbed forests in
the region for which data are available – Douglas fir, hemlock, and Sitka spruce forests in the Olympic Peninsula less than
20 years old (i.e., disturbed by clear-cuts or forests fires during the last 20 years).
For each condition, the deviation at Gray’s Harbor County considers the conditions in these forests relative to the best-case
and worst-case conditions. The forest biome disturbance is the average of the deviations for all conditions. An example of
the calculation for the carbon stored in live trees is shown.
Olympic National Park (http://adventure.nationalgeographic.com/adventure/trips/best-trails/national-park-day-hikes/

© 2013 SCSglobalServices.com 19
EnvironmEntal Product dEclaration
Forestry operations in Gray’s Harbor countyDouglas Fir and Western Hemlock Dimensional Lumber
CARBON STORAGE IN LIVE TREES: ABOVEGROUND
Olympic National Park
Gray’s Harbor County
Recently clear cut or burnt forest
7.5 tons / acre
32 tons / acre
Deviation
102030405060708090
100
124 tons / acre
Best CaseWorst Case
© 2013 SCSglobalServices.com 20
EnvironmEntal Product dEclaration
Forestry operations in Gray’s Harbor countyDouglas Fir and Western Hemlock Dimensional Lumber
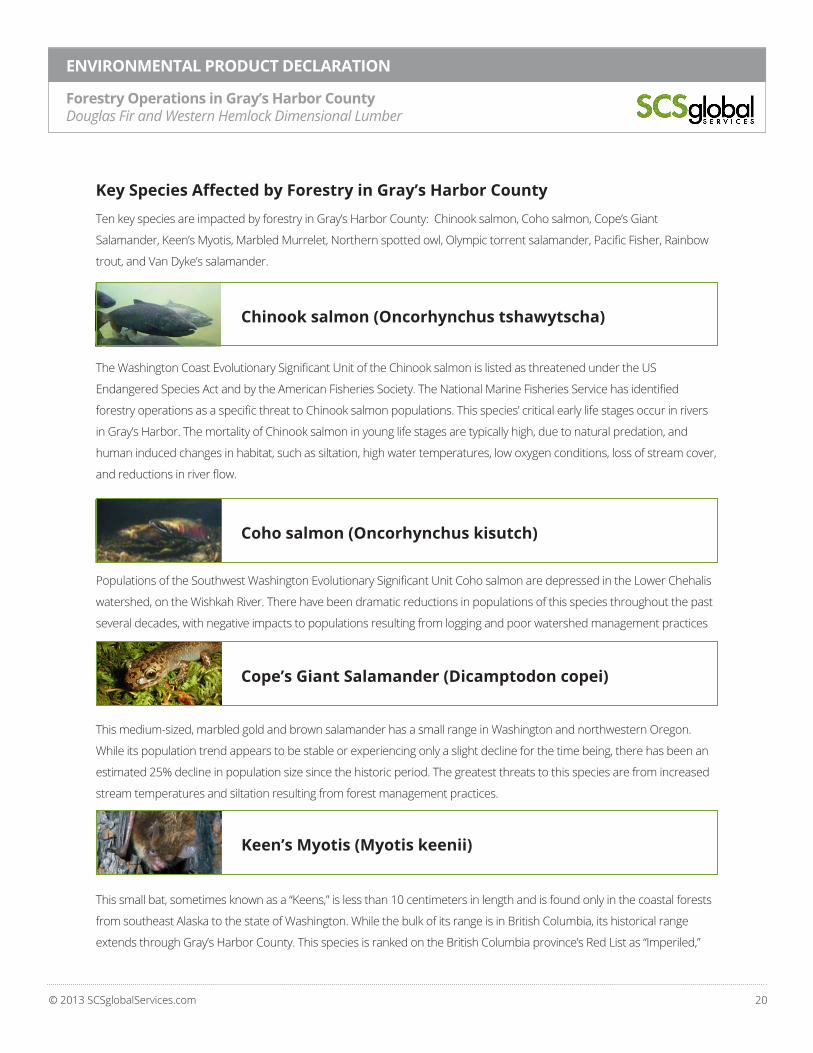
Key Species Affected by Forestry in Gray’s Harbor County
Ten key species are impacted by forestry in Gray’s Harbor County: Chinook salmon, Coho salmon, Cope’s Giant
Salamander, Keen’s Myotis, Marbled Murrelet, Northern spotted owl, Olympic torrent salamander, Pacific Fisher, Rainbow
trout, and Van Dyke’s salamander.
The Washington Coast Evolutionary Significant Unit of the Chinook salmon is listed as threatened under the US
Endangered Species Act and by the American Fisheries Society. The National Marine Fisheries Service has identified
forestry operations as a specific threat to Chinook salmon populations. This species’ critical early life stages occur in rivers
in Gray’s Harbor. The mortality of Chinook salmon in young life stages are typically high, due to natural predation, and
human induced changes in habitat, such as siltation, high water temperatures, low oxygen conditions, loss of stream cover,
and reductions in river flow.
Populations of the Southwest Washington Evolutionary Significant Unit Coho salmon are depressed in the Lower Chehalis
watershed, on the Wishkah River. There have been dramatic reductions in populations of this species throughout the past
several decades, with negative impacts to populations resulting from logging and poor watershed management practices
This medium-sized, marbled gold and brown salamander has a small range in Washington and northwestern Oregon.
While its population trend appears to be stable or experiencing only a slight decline for the time being, there has been an
estimated 25% decline in population size since the historic period. The greatest threats to this species are from increased
stream temperatures and siltation resulting from forest management practices.
This small bat, sometimes known as a “Keens,” is less than 10 centimeters in length and is found only in the coastal forests
from southeast Alaska to the state of Washington. While the bulk of its range is in British Columbia, its historical range
extends through Gray’s Harbor County. This species is ranked on the British Columbia province’s Red List as “Imperiled,”
chinook salmon (oncorhynchus tshawytscha)
coho salmon (oncorhynchus kisutch)
cope’s Giant Salamander (dicamptodon copei)
Keen’s myotis (myotis keenii)

© 2013 SCSglobalServices.com 21
EnvironmEntal Product dEclaration
Forestry operations in Gray’s Harbor countyDouglas Fir and Western Hemlock Dimensional Lumber
and is a candidate for inclusion on the state species list in Washington. The foraging environment for this species is large
coastal old growth forests in which prey density is sufficient, and the preferred roosting habitat within Gray’s Harbor
County includes the loose bark of large trees, caves, snags, and hollow trees.
The Marbled Murrelet, a chunky seabird with a black bill and entirely dark tail, has an extensive range along the Pacific
coast of North America from Alaska to California. While this species inhabits coastal areas for feeding, it travels inland to
nest in old growth forest stands. This species is listed as Endangered on the IUCN Red List, and since 1992 has been listed
as Threatened under the U.S. Endangered Species Act in the states of Washington, Oregon, and California. Habitat loss
due to logging is directly implicated as a major stressor causing reductions in species populations.
This species is known to be experiencing a continuing decline in populations in the state of Washington, in part due to an
ongoing and historical loss of forest nesting habitat. These nests are usually in old growth forest near the coast, on large
mossy horizontal branches, mistletoe infections, witches broom, or other structures providing a platform high in mature
conifer forests (e.g., Douglas fir or hemlock). In Gray’s Harbor County, forestry has removed 95% of the nesting habitat for
the marbled murrelet.
The Northern Spotted Owl is strongly affected by the logging of forests, and was officially listed as a threatened species
under the U.S. Endangered Species Act in June of 1990. In this region, forests must be about 80 to 120 years old for the
Northern spotted owl to nest; the short-rotation harvests occurring in private forests in Gray’s Harbor County, which
maintain 80% of forests in age classes less than 40 years, do not leave suitable habitat for the Northern Spotted Owl. The
disturbance to suitable habitat for this species is 80%.
This small salamander has a historical range that extends from the Olympic Peninsula southward; by comparison, its
current range is highly fragmented, and appears only in the Olympic Peninsula, south to the Chehalis River. The primary
threat is from logging, which severely disturbs the cold stream habitat required by this species. It is considered “vulnerable”
on the IUCN Red List. This species is one of the most dessication-intolerant salamander genus known, requiring a stable
source of moisture to survive.
marbled murrelet (Brachyramphus marmoratus)
northern spotted owl (Strix occidentalis caurina)
olympic torrent salamander (rhyacotriton olympicus)

© 2013 SCSglobalServices.com 22
EnvironmEntal Product dEclaration
Forestry operations in Gray’s Harbor countyDouglas Fir and Western Hemlock Dimensional Lumber
This species has a distinct population segment on the West Coast that is considered imperiled. While the historical range
included Washington, Oregon, and California, the range of this population has been reduced to two populations in the
southern Sierra Nevada in California, and in northern California-southern Oregon. Due to their small size and population,
even these populations are threatened with extirpation, despite recent efforts at reintroduction in the state of Washington.
The range of the Pacific Fisher currently does not overlap with Gray’s Harbor, as it has been extirpated from this region.
Because forestry operations contributed to the removal of the Pacific Fisher from this region, it is classified.
Fishers are considered to be habitat specialists in the western United States, occurring only in specific elevations in mature
conifer and mixed conifer/hardwood stands characterized by dense canopies and abundant large trees, snags, and logs.
This species generally avoids areas with little forest cover or significant human disturbance, and prefers large areas of
contiguous interior forest. When inactive, Fishers occupy a den in a tree hollow, under a log, in the ground or a rocky
crevice, or in the branches of a conifer. Young are usually born in dens in tree hollows, and large snags are important as
maternal den sites, with minimum tree diameters of approximately 62.5 centimeters. Forestry operations in the study
area causes disturbance to two types of suitable habitat for the Pacific Fisher, characterized in two separate indicators:
Disturbance to Suitable Foraging Habitat; and Removal of Suitable Nesting Habitat.
The steelhead trout’s historical range extended along the Pacific coast of North America from Alaska to northern
Baja California. The pop-ulations of winter steelhead in the Quinalt and Lower Chehalis watersheds are known to be
depressed. While not as sensitive as some other salmonid species to some of the impacts from forestry practices, effects
from sediment loading and changes in the availability of large woody debris are both expected to reduce the suita-bility
of habitat within Gray’s Harbor County. The Southwest Washington Evolutionary Significant Unit of the Rainbow trout is
affected by forestry in Gray’s Harbor County.
This slim-bodied, lungless salamander has a historical and current range in the State of Washington. It generally occurs in
small isolated populations, with less than 25% of occurrences considered to have high viability. It is considered a vulnerable
species, and is Federally listed as a Species of Special Concern. Its requirements for freshwater habitat are clearly impacted
by timber harvests, which cause increased sedimentation and changes in the availability of large woody debris.
Pacific Fisher (Martes pennant pacifica)
rainbow or steelhead trout (oncorhynchus mykiss)
van dyke’s salamander (Plethodon vandykei)

© 2013 SCSglobalServices.com 23
EnvironmEntal Product dEclaration
Forestry operations in Gray’s Harbor countyDouglas Fir and Western Hemlock Dimensional Lumber
Group 3: Emissions with climate and ocean impacts
The impact categories in this group consider the effects of emissions of greenhouse gases and short-lived climate
pollutants on the climate and oceanic ecosystems. It also considers the net carbon storage loss, accounting for forest
carbon storage which has been lost, and carbon which is sequestered in wood products. For the production of
dimensional lumber, there are four core impact categories, each with one category indicator of the same name: Global
Climate Change, Arctic Climate Change, Ocean Acidification, and Ocean Warming.
impact category /category indicator unit result for
1 mmBF
additional atmospheric co2
from Forest carbon Storage loss in Gray’s Harbor
county
uncertainty level
Global Climate Change
Global Climate Change tons CO2 eq. >310,000 >110,000,000 ± 40% Uncertainty
Arctic Climate Change
Arctic Climate Change tons CO2 eq. >300,000 >110,000,000 ± 40% Uncertainty
Ocean Acidification
Ocean Acidification tons H2CO3 520,000 190,000,000 ± 20% Uncertainty
Ocean Warming
Ocean Warming tons CO2 eq. >270,000 >110,000,000 ± 40% Uncertainty
Net carbon storage loss resulting from logging operations does not vary based on the annual production levels in Gray’s
Harbor County; even if the forest operators in this region stopped all harvests, it would take centuries for the stored forest
carbon to recover to the levels seen in Olympic National Park. As a result, it can be misleading if results are only presented
as normalized to the declared unit of 1 MMBF. Therefore, column four has been added to show the total addition to
atmospheric CO2 levels from net carbon storage loss in Gray’s Harbor County resulting from private commercial forestry.

© 2013 SCSglobalServices.com 24
EnvironmEntal Product dEclaration
Forestry operations in Gray’s Harbor countyDouglas Fir and Western Hemlock Dimensional Lumber
The category indicator measurements for all four impact categories in this group are dominated by net carbon storage
loss. The combined emissions from logging, milling and transportation, and end-of-life, account for less than 1% of each
result.
For Global Climate Change, Arctic Climate Change, and Ocean Warming, the increased radiative forcing associated with
net carbon storage loss in Gary’s Harbor County from forestry practices, and the eventual deposition of a portion of this
carbon dioxide into the oceans, were used to characterize results over the relevant time horizons for each impact category
(see Appendix). For Ocean Acidification, the eventual deposition of a portion of this carbon dioxide into the oceans and
conversion to carbonic acid were used to characterize results.
99.5%
0.5%
99.4%
0.6%
99.6%
0.4%
98.6%
1.4%
Global Climate Change Arctic Climate Change Ocean Acidification Ocean Warming
Forest Carbon Storage Loss Logging Milling and Transportation End-of-Life

© 2013 SCSglobalServices.com 25
EnvironmEntal Product dEclaration
Forestry operations in Gray’s Harbor countyDouglas Fir and Western Hemlock Dimensional Lumber
Group 4: Emissions with Ecosystem impacts
The impact categories in this group consider the impacts of emissions on local ecosystems. The only core impact category
in this group is Regional Acidification, with one category indictor. Regional Acidification was assessed using standard air
dispersion modeling.
impact category /category indicator unit result for
1 mmBFresult for Gray’s Harbor county
data Quality level
Regional Acidification
Regional Acidification kg SO2e 2,200 790,000 Medium Data Quality
Regional acidification impacts are caused partly by logging equipment, partly by milling and transportation, and partly by
incineration at the end-of-life of the wood products.
Regional Acidification
42%
36%
22%
Logging Milling and Transportation End-of-Life

© 2013 SCSglobalServices.com 26
EnvironmEntal Product dEclaration
Forestry operations in Gray’s Harbor countyDouglas Fir and Western Hemlock Dimensional Lumber
Group 5: Emissions with Human Health impacts
The impact categories in this group consider the effects on human health arising from emissions. For the production of
dimensional lumber, there are two core impact categories with assessed results, each with one category indicator: Ground
Level Ozone Exposure Risks and PM2.5 Exposure Risks.
impact category /category indicator unit result for
1 mmBFresult for Gray’s Harbor county data Quality level
Ground Level Ozone
Ground Level Ozone persons * hours * ppm O3
44 15,000 Medium Data Quality
PM 2.5
PM 2.5 persons * hours * µg PM 2.5 eq. / m3 63 22,000 Medium Data
Quality
For Ground Level Ozone Exposure Risks and PM2.5 Exposure Risks, most impacts are caused by milling and
transportation. These impacts were assessed using the Draft LEO-SCS-002 Standard framework, using standard air
dispersion modeling.
Ground Level Ozone PM 2.5
91%70%
20%
10% 6%3%
Logging Milling and Transportation End-of-Life

© 2013 SCSglobalServices.com 27
EnvironmEntal Product dEclaration
Forestry operations in Gray’s Harbor countyDouglas Fir and Western Hemlock Dimensional Lumber
A third core impact category, Hazardous Chemical Use and Discharges,
considers herbicide use in forestry, which is known to present a risk of
exposure to workers. In even-aged forestry, herbicides are used after
clear-cuts to prevent the invasion of fast-growing grasses and tree
species, and to promote the rapid growth of Douglas fir and Western
hemlock. These herbicides are usually used once or twice after a clear-cut.
Herbicides are also used along roadsides.
These herbicides are very often applied using backpack sprayers.
Regardless of the application method, the most important route of
exposure for workers is the skin; if herbicides get onto the skin of a
worker, a fraction will be absorbed into the bloodstream. While safety
precautions can lessen the amount of herbicide to which workers are
exposed, improper use or accidents (such as spills) can cause a risk of
exposure.
No data were available on the amounts of herbicides used. However, only certain herbicides are licensed for use in the
State of Washington. Given the large scale, conventional nature, and multiple species which are harvested in Gray’s Harbor
County, all of the herbicides permitted for use in Washington State are most likely being used in Gray’s Harbor County. The
use of all of these herbicides presents a risk to workers through exposure during use.
Herbicide
2¸4-D (including esters and salts of 2,4-D)
Atrazine
Dicambia
Glyphosate
Hexazinone
Imazapyr
Metsulfuron Methyl
Sulfometuron-Methyl
Triclopyr
Others (16 others)
Group 6: risks from untreated Hazardous and radioactive Wastes
There were no core impact categories in this group of impacts..

© 2013 SCSglobalServices.com 28
EnvironmEntal Product dEclaration
Forestry operations in Gray’s Harbor countyDouglas Fir and Western Hemlock Dimensional Lumber
About SCS Global ServicesThis EPD has been produced by SCS Global Services, a third-party certification body and Environmental Product
Declaration program operator under ISO 14025.
SCS has been providing global leadership in third-party environmental and sustainability certification, auditing, testing, and
standards development for nearly three decades. Programs span a cross-section of industries, recognizing achievements
in green building, product manufacturing, food and agriculture, forestry, and more. SCS provides accredited services under
numerous internationally recognized certification programs. SCS is a chartered benefit corporation and Certified B Corp™,
reflecting its commitment to socially and environmentally responsible business practices.
For more information about SCS, this EPD, or the methodology used, please contact Tobias Schultz at tschultz@
scsglobalservices.com.

© 2013 SCSglobalServices.com 29
EnvironmEntal Product dEclaration
Forestry operations in Gray’s Harbor countyDouglas Fir and Western Hemlock Dimensional Lumber
Appendix
measuring net carbon Storage loss
The disturbance to Central Pacific Coastal Forests from forestry in Gray’s Harbor County has resulted in a loss of forest
carbon storage. Roughly 50% of the forest biomass in Gray’s Harbor County and the Olympic National Park is carbon,
stored in the living trees, dead trees, litter on the forest floor, soil, roots, and other carbon pools. Most of this carbon
was absorbed from the atmosphere and stored as a result of photosynthesis over long time periods. Although there are
more small trees in Gray’s Harbor, there are many more large trees in Olympic National Park; it is these large trees which
store most of the forest carbon. These large trees have been almost entirely removed from Gray’s Harbor due to forestry
operations. The removal of large trees, as well as effects on litter, soil, roots, and other parts of the forest which store
carbon, have resulted in the loss of 89 million metric tons of carbon storage across the 650,000 acres of private forestlands
in Gray’s Harbor County, when compared to the potential carbon storage levels if this forest were in a condition similar to
the reference forest in Olympic National Park.
Each year, the forest in Gray’s Harbor County regrows a small amount, and a portion of this carbon is stored in products
made from harvested wood. However, most of the carbon removed from the forest each year (>50%) is used in products
which are burned or which decay within the first three years after harvest, and do not represent a long-term carbon sink.
Only roughly one million metric tons of carbon are stored in dimensional lumber products each year, which may store
carbon for long periods of time; in total, up to 8 million metric tons of the total carbon which has been removed from the
forest is still stored in products.
The remaining 80+ million metric tons of carbon has since decayed into carbon dioxide and methane, or has been burned;
this has added to the amount of carbon dioxide in the atmosphere. Though most of this carbon dioxide was released
many decades ago, a portion remains in the atmosphere, while the remainder has since been absorbed by the oceans
and other biogenic terrestrial systems on land. It is estimated that at the present time, at least 30% of this carbon dioxide
remains in the atmosphere, though the actual levels remaining are most likely larger than this.1
The increased amount of atmospheric carbon dioxide resulting from the net loss of carbon storage in Gray’s Harbor
County in turn leads to an increase in radiative forcing, which contributes to Global Climate Change, Arctic Climate Change,
and Ocean Warming:
§ For Global Climate Change, the increased radiative forcing associated with the loss of net carbon storage is integrated
from the present to 2050, the approximate year when irreversible damage to the climate is expected (when the
Global Mean temperature anomaly will exceed +2C°). There will be little change in the total net carbon storage levels
in Gray’s Harbor before 2050, considering the slow rate of recovery of forests, and the relatively small amount of
carbon stored in durable wood products each year.
1 According to the Intergovernmental Panel on Climate Change, 200 years after an emission of carbon dioxide, roughly 30% will remain in the atmosphere.

© 2013 SCSglobalServices.com 30
EnvironmEntal Product dEclaration
Forestry operations in Gray’s Harbor countyDouglas Fir and Western Hemlock Dimensional Lumber
§ For Arctic Climate Change, the increased radiative forcing associated with the loss of forest carbon storage is integrated over 20 years,
reflecting the fast pace of warming and impacts in the Arctic region occurring in the next two decades.
§ For Ocean Warming, the increased radiative forcing associated with the loss of forest carbon storage is integrated over the next 50 years,
reflecting long-term heat accumulation in the oceans.
For Ocean Acidification, there has been an increase in the amount of carbonic acid in the oceans as a result of the net loss of carbon storage
loss in Gray’s Harbor County (carbon dioxide converts to carbonic acid when it deposits in the oceans). Approximately 33% of all the carbon
dioxide which has been added to the atmosphere since forestry began in this region has been absorbed by the oceans.
While ongoing harvests in Gray’s Harbor County contribute to carbon storage in products, most of the carbon removed each year is returned
to the atmosphere within 3 years as carbon dioxide; the actual amount of carbon sequestered in durable wood products each year is very
small compared the carbon lost from the forest. Even if all harvests were to stop in Gray’s Harbor County, it would take over 250 years to
recover the forest carbon storage in Gray’s Harbor to levels similar to Olympic National Park.

©2013 SCS Global Services
For more information contactSCS Global Services
2000 Powell Street, Ste. 600Emeryville, CA 94608 USA
main +1.510.452.8000 fax +1.510.452.8001