ENVIRONMENTAL POLLUTION AND ITS IMPACT AROUND MATHURA REFINERY · Mathura district is located...
84
ENVIRONMENTAL POLLUTION AND ITS IMPACT AROUND MATHURA REFINERY OISSBRTATION tobmitted in piirtia) ftilfilfflent of the requiremeau for the awaird of the degree of Muittt of $t)tIo5a!op|ip IN GEOLOGY BY MOHAMMAD VSMAN SHABEER DSPARTMSNT OF GEOLOGY ALIOARH MUSUM UNIVBRSITY ALIGARH (INDIA) 1996
Transcript of ENVIRONMENTAL POLLUTION AND ITS IMPACT AROUND MATHURA REFINERY · Mathura district is located...

ENVIRONMENTAL POLLUTION AND ITS IMPACT AROUND MATHURA REFINERY
OISSBRTATION
tobmitted in piirtia) ftilfilfflent of the requiremeau for the awaird of the degree of
Muittt of $t)tIo5a!op|ip IN
GEOLOGY
BY
MOHAMMAD VSMAN SHABEER
DSPARTMSNT OF GEOLOGY ALIOARH MUSUM UNIVBRSITY
ALIGARH (INDIA)
1996

DS2988
• • ^ • - • " ^ - . - X
,V^
• -r • V

DEDICATED
TO
MY BELOVED FATHER
a
DEPARTED MOTHER

PHONE I ( 0 5 7 1 ) 2 6 6 1 6 TELEX I 664-230—AMU—1^*
D E P A R T M E N T O F G E O L O G Y ALIGARH MUSLIM UNIVERSITY
ALIGARH—202 002
Ref.No.. ./Geol. Dated
CERTIFICATE
This is to certify that the dissertation
entitled/ "Environmental Pollution and its inpact
around Hathura Refinery" is the original contribution
of Mr. Hohd. Osman Shabeer in the Environmental
Geology which was carried under my supervision. It
has not been published in parts or full anywhere
else.
Mr. Shabeer is allowed to submit this work
for the award of M.Phil, degree of Aligarh Muslim
University/ Aligarh.
(DR. SHADAB KHURSHID) READER

ACKNOWLEDGMENT
I am privileged to express profound gratitude to my
supervisor, Dr.Shadab Khurshid, Reader, Department of
Geology, Aligarh Muslim University, Aligarh for his skillful
and eminent guidance in completing this work.
My sincere thanks are due to Prof. Iqbaluddin, Chairman
Department of Geology, Aligarh Muslim University, Aligarh
fro providing me necessary research facilities.
I must acknowledge my indebtedness to my research
colleague Mr. Zaheeruddin for assisting me at every stage
during the entire course of study.
I am also thankful to Dr. Shakeel Ahmad, Mr.Zubair
Ahmad and Mr. Zaheer Hasan for their kind cooperation and
invaluable assistance during this work.
My thanks are also due to my friends messers Aftab
Alam, Syed Khalid Hasan, Nagendra Kumar Sharma for their
encouragement and cooperation.
I am also thankful to Mr.Dinesh Kumar Singh and
Mr.Vinay Kumar Singh for providing facilities to type the
manuscripts and Mr.Vinod Kumar for nice cartographic work.
Last but not the least I would like to express my
heartfelt gratitude to my loving father, brother and sister
for their financial assistance, invaluable encouragement and
moral support in completing this work.
A i d SJ Srkiii>ei^ (Mohd. Usman Shabeer)

CONTENTS
CHAPTER - I INTRODUCTION
Page.No
CHAPTER - II GENERAL FEATURES OF THE AREA 8 - 2 3
Geology
Hydrogeology
Geomorphology
Phys iography
CHAPTER - III GROUNDWATER POLLUTION 24 - 34
CHAPTER - IV WATER CHEMISTRY 3 5 - 6 3
CHAPTER - V SUMMARY AND CONCLUSION 64 - 68
REFERENCES 6 9 - 7 2
*****

CHAPTER - I

INTRODUCTION
The environmental pollution can be defined as an
undesireble or deleterious modification of the environment.
The modification may actually or potentially influence
humanlife, living conditions, cultural assets or the
lifecycles of the indegenous plant and animal communities
that inhibit a given system. The environmental pollution
takes place through changes in energy patterns, radiation
levels, physical and chemical constitutions and abundance of
organisms. Environmental pollution is closely associated
with human problems such as maintenance of renewable
sources, geological hazards, floods, earthquakes, landslides
etc. indiscriminate consumption of fertilizers, pesticides
in agriculture and other natural pollution hazards.
The water in the rivers is often polluted by the people
inhabiting the watershed. This water carries bacteria, some
of which are pathogenic and can cause water-borne diseases
such as typhoid, dysentery, cholera etc. Wastes from some of
the industries are let off into into rivers and pollute the
water rendering it unsafe for human consumption. Surface
run-off due to rainfall partly percolate into the ground
dissolving the salts and minerals present in the soil. As a
result sometimes the groundwater cause diseases such as
fluorosis due to the presence of fluorides in the water.
Industrialisation is generally believed to be the
universal remedy for economic backwardness. Mounting

pressure on industrialisation to withstand in the context of
advancement towards economic stability is constantly
degrading the environment through air, water and soil
pollution. Traditionally industrial solid wastes were used
as landfills, the liquid wastes pumped into the sea, river
or lagoons and the gaseous wastes let into the atmosphere.
In addition to this, a small fraction of the wastes were
also burnt in open. The ambient air and water over an
industrial area is a complex mixture of gasses, liquids and
solids. It may consists of many toxic elements which may be
hazardous, not only to humanbeings but also to the
vegetation in the surrounding area.
Due to the downward and lateral movement of water
through hydrological cycle linked up with the under ground
water recharging, the well waters upto a distance of 500 mts
from the river become polluted with the constituents of the
effluents. Because of the subsurface contamination can
eventually lead to surface water pollution also. As more
water is extracted from surface and under ground sources to
satisfy increasing water demands more polluted water is
returned which may contaminate those sources.
Mathura is one of the most industrialised towns of
Uttar Pradesh situated on the bank of the river Yamuna.
There are about 300 industries which include oil refinery,
dyeing, food & bewerage industries etc. The surface and
subsurface water bodies in the study area are continuously

3
being polluted because of unabated induatrialisation.
Untreated or partially treated industrial effluents are the
important sources of water pollution.
The problem of water pollution in Mathura requires
remedial measures in order to check the further degradation
of ground water, otherwise the extensive groundwater
resources may be damaged beyond replenishment and cannot be
used for various purposes. In order to monitor the impact of
industrial effluents on the environment identifying the
extent of degradation and evolving possible means of
minimizing the impacts, studies on quality of effluents
polluted river water and waters of adjoining wells and
changes in the soil fertility as determined through
microbial population and enzyme activties of the soils.
LOCATION
Mathura district is located south-east of Delhi in the
semi desert or gray steppe soil region of south eastern
Uttar Pradesh. Mathura district lies within the latitude
27°15' North and 27°40' North, and longitude 77°30' East to
78°55' East (FIG-1). Mathura is bounded by Aligarh district
on the North-eastern side, Agra district in southern side,
Bharatpur district of Rajasthan on western side. The area is
a part of the indo-gangetic alluvial plain.
The study area experiences severe heat during summer in
the month of June when highest temperature is around 98.7°F

4
and cold during December-February when the minimum
temperature is 58.6°F. The relative humidity is generally
high in the region during rainy season. The driest part of
the year is summer. The general direction of the natural
drainage system in the region is toward river Yamuna which
enters the area from the North and following meandering
course passes out of the area in the SSE direction into the
Agra district. This river is perennial.
Studded with places of pilgrimage connected with the
life of Lord Krishna, Mathura situated on the bank of river
Yamuna is one of the oldest cities of India. Through out the
year, devout pilgrims visit Mathura more particularly during
the occasion of 'Rassleela' a festival of colour and music
revives the early life of Krishna.
Groundwater is the main source of drinking water
supply which is controlled. Industries have their own
tubewells and there are large number of handpumps and
shallow tubewells in rural areas.
Two industrial areas have been developed by UPSIDC
(Uttar Pradesh State Industrial Development Corporation)
within five kilometres of Mathura town.
SITE ^ A:- The SITE-A was developed on an area of 362 acres
in 1976, where in 353 plots measuring 252 acres were carved
out which stands allotted.

5
SITE ^ B:- The SITE-B was developed in the area of 335
acres in 1977-78, where 362 plots of different sizes
measuring 250 acres were carved. This is situated just in
front of Mathura oil refinery and on NH-2. Three oil
companies ie. IBP; HPC; BPC are major allottes of this area.
OBJECTIVES & SCOPE
The main objective of the present study is to know the
industrialisation and urbanization effects on the quality of
water used for various purposes. The following aspects have
been carried in the present investigation.
(1) Demarcation and mapping of the study area including
surface and subsurface water bodies.
(2) A survey of the various industrial units and their
demarcations have been carried in the area.
(3) Rainfall data for the years 1992 to 1995 have been
collected, processed and plotted to generate the
hydrogeological parameters.
(4) Water levels are measured to monitor the water level
fluctuations for pre and post-monsoon seasons during
the years 1994 and 1995.
(5) Collection of water samples from surface and subsurface
water bodies and also in the vicinity of Mathura
refinery.
(6) Physical and chemical analysis or water samples.
(7) Extent of pollution and its possible repercussions.
Previous work:-
In the year 1935, Taylor carried out statistical
analysis of the rainfall in the parts of the Ganga basin.
In the year 1936, Auden conducted experiments and
submitted technical reports related to groundwater
occurrence in Gangetic alluvial tract.
The scientists from the C.G.W.B (Mathura 1958; Shah
1960; and Pathak 1961) carried out groundwater
investigations and evaluation of the resource potential in
parts of Yamuna basin.
Sahni and Garg in 1981, demarcated the saline zones in
Mathura district.
Khan and Nigam (1986) worked on geology and
geomorphology of the sub-basin and reported that the basin
is probably carved out of vindhyan basement floor.
In the year 1989, Verma found out the saline water zone
in parts of Mathura district and concluded that the fresh
water is floating over the saline water in Nojhil block.
In the year 1990, Rastogi and Gaumat worked on
groundwater pollution in Mathura district and reported
higher concentration of lead, iron, fluoride at some places.

7

CHAPTER - II

8 CHAPTER-II
GENERAL FEATURES OF THE STUDY AREA
GEOLOGY:-
The geological setup of the study area is as follows
TABLE
Quaternary Alluvium, alternate beds of sand and clay with occasional interbeds of Calc-Concretions (Kankar)
UNCONFORMITY
Ajabgarh series Precambrian (Delhi system) Alwar series
The precambrian rocks are exposed in the western part
of the area. They occur as strike ridges. They include Alwar
series and Ajabgarh series.
Alwar series:-
Alwar series belong to precambrian era. Alwar series
are predominantly characterized by dirty white, Pale gray or
pale pinkish coloured quartzites. The Alwar quartzites near
Govardhan ridge strikes NE-SW and dips about 30° in the
north westerly directions. These quartzites are
predominantly jointed in which the bedding joint
predominates. The joints are widely open at the surface. The
Alwar quartzites are interbedded with the bands of mica

schist varying in thickness from few centimeters to three
meters.
Ajabgarh Series:-
The rocks of the Ajabgarh series belong to precambrian
age. They comprise quartzite with interbedded slates. They
are unconformably underlying by quaternary alluvium.
Alluvium:-
Alluvium belongs to quaternary age. These alluvium is
unconformably overlying folded and faulted quartzites
belonging to Alwar series of precambrian. Quaternary
alluvium sediments constitute the main horizon containing
aquifer materials. The alluvium sediments comprise clay,
silt ans sands of various grades with occasional kankar (Rai
J.N et al, 1984).
Several boreholes drilled by C.G.W.B and other state
agencies dictate that the thickness of sediments on the
western side of the river Yamuna between Goverdhan and
Barsana is 151 meters while it increases to 276 meters at
Surir-kalan in the north-easterly direction.
HYDROGEOLOGY
The district Mathura is covered by both central and
marginal alluvium and the hard rock belonging to the

10
precatnbrian age. The basement comprised of formations
belonging to the Delhi system and Vindhyan system.
Groundwater in the study area occurs both under confined and
unconfined conditions. The general direction of groundwater
flow is from NNW to SSE. The river Yamuna has been
established to be effluent in nature. Depth to water lavel
varies widely. An appraisal of various lithological logs
indicates that medium to find sand with occasional kankar
forms the principal aquifer in the study area. Aquifer
performing tests (According to C.G.W-B) concluded on
selected wells tapping 10 to 12 meters saturated aquifer
have yielded 46 cubic meters per hour to 64 cubic meters per
hour for drawdowns of over 5 meters to 8 meters.
The study area is a part of Ganga-Yamuna interfluves.
The thick pile of sediments comprising sands of various
grades, silt and clay intercalated with kankar, various sand
bodies forms the prolific aquifers. Rainfall forms the
principal source of groundwater recharge in the area,
besides the surface recharge in the form of irrigation
return flow and numerous surface bodies like ponds and lakes
in the area also contribute to the groundwater bodies
through the vertical seepage.
Depth to water level (Pre-monsoon. 1994, 1995):-
The water level in an unconfined aquifer is the upper
surface of the zone of saturation where the pressure is

11 atmospheric. It is defined by the level at which water
stands in wells penetrating the aquifer, just enough to hold
standing water. In general the water level standing in dug
wells are considered accurate enough to represent water
level of an area.
In pre-monsoon (1994,June) the depth to water table
ranges from 2.05 meters to 21 meters below ground level,
while in June, 1995 it ranges between 1.85 meters to 21.80
meters below ground level. The deeper levels 21 meters and
21.80 meters were recorded at Kota village in June 1994 and
June 1995 respectively while shallowest water levels 2.05
meters and 1.85 meters below ground level were recorded at
Khaira village of Chatta block.
Depth to water level (Post-monsoon 1994.1995):-
In post-monsoon (1994,November) the depth to water
table ranges from 0.55 meters to 20.10 meters below ground
level, while in November 1995 it ranges from 0.65 meters to
20.80 meters below ground level. The deeper levels were
observed at Kota village and the shallower levels were
observed at Khaira village.
Water level fluctuation:-
The groundwater level fluctuation is a function of time
and space in response to precipitation. The change in water
levels are due to the change in storage of groundwater in an
area. It can also be caused due to excessive withdrawl of
u
water from aquifer than the quantum of average annual
recharge. The difference in groundwater level show a
seasonal pattern of fluctuations. This results from
influence such as rainfall and irrigation pumping that
follow well defined seasonal cycles.
In the study area the groundwater level fluctuation
ranges from 0.50 meters to 4.20 meters in the year 199.4 and
in the year 1995 it ranges from 0.80 meters to 3,.28 meters.
High fluctuation in the year 1994 was observed at Shergarh
village (FIG-3 & 4 and TABLE-1).
Groundwater Movement:-
The grounwater movement is governed by established
hydraulic principles (Todd,1959). Groundwater moves in the
direction of slope of water table. The slope of water table
in turn depends upon many factors such as permeability and
thickness of water bearing zone, the topography, lithology
and local variations in the quantity of recharge and
discharge (Hubbert and Toth,1962). The general groundwater
flow in consonance with the regional groundwater flow
direction in the central Ganga basin is from NE-SE
direction. However at places there are some variations which
are caused due to local factors. The river Yamuna receives
groundwater runoff all along half of its northern stretch
and along its southern most stretch and there by behaves as
an effluent stream. The river Yamuna recharges aquifers at
some places and behaves as an influent stream.

TABLE - 1
Water level fluctuation in mts during 1994. 1995
13
Hydrographic Station Max
12.25
10.60
8.70
5.75
13.00
21.00
20.00
13.00
12.80
12.80
7.50
9.90
14.25
5.60
13.85
8.05
6.35
8.75
3.00
2.05
1994
Min Fluct.I
1.25
2.35
2.00
1.50
1.10
0.90
1.10
1.00
0.80
0.80
0.50
2.45
1.00
1.35
4.20
3.05
2.30
3.90
0.95
1.50
Max
12.35
10.25
8.95
5.85
13.35
21.80
21.60
14.05
13.09
13.55
8.00
9.20
13.30
4.74
13.53
7.63
6.25
8.65
2.78
1.85
1995
Min IFluct.
1.10
2.00
1.50
0.80
0.90
1.00
0.80
0.95
0.96
0.75
0.80
1.70
2.50
0.99
3.28
2.38
1.55
3.00
0.48
1.20
Kalkatia
Mahwan
Parkham
Nagla Chandraban
Charora
Kota
Kunjnagar
Aurangabad
Industt. area-A
Maholi
Mukundpur
Gokul
Brindavan
Dhangaon
Shergarh
Govardhan
Sihi
Rasulpur
Paintha
Khaira
11.00
8.25
6.70
4 .25
11.90
20.10
18.90
12.00
12.00
12.00
7.00
7.55
13.25
4.25
9.65
5.00
4 .05
5.85
2.05
0.55
11.25
8.25
7.45
5.05
12.45
20.80
20.80
13.10
12.13
12.80
7.20
7.50
10.80
3.75
10.25
5.25
4.70
5.65
2.30
0.65

14
FIG-3

15
FIG-^
g J/
5 1 i >> '
u. J UJ > UJ
a: U J ' - *
IS s"' 3
X a. ^ o
• • - • ^ ^
1 .. r^^^^^ •c< \ 1
^ ^ ^ X < f ^ .<S* ^
A 1 r^ 1 1
^ ^ * * * ^ S f c
if J /y
L * ' » I H> O in O m < <>l (M »- • -
• i^iujj idA3 1 a J l V M
8 «?
«
,•«»
.fn
TX
.;r * " « / » o 5 •- o
-i < O o in ac o >--# X
<n
(^
• V *
»

16
QEOMORPHOLOGY
Geomorphologically Mathura district is classified on
the basis of relief, lithology, soil, vegetation, drainage
into three units.
1. Eolian Sand surface
2. Yamuna Alluvial plain
3. Yamuna Flood plain
1. Eolian Sand surface:-
This surface is about two to five meters high above the
general ground level and can be best studied. Generally
longitudinal and oblique type of dunes can be recognize on
the visual estimate in field. But due to human interference
it is difficult to recognize their dunal shape in the area.
The windward side in general was towards east and northeast,
hence it is inferred that these dunal features are aligned
NW-SE and E-W direction.
2. Yamuna Alluvial Plain:-
In the study area the alluvial plain exhibits nearly
homogeneous land scape. The alluvial plain is characterized
by paucity of well developed surface drainage. The fluvial
features associated with this surface comprise
palaeochannels, tals (natural relict of fluvial
depressions), cut-off meander scars are present in contrast
to present day active channels forming a distinct geomorphic
element in the area.

17
3.Yamuna Flood Plain:-
This surface is an upland surface characterized by over
bank sand deposits capped by fine silt, very often
intercalated with the calcareous concretions of varying
sizes.
PHYSIOGRAPHY OF THE AREA
Physiographically the district Mathura is a plain of
remarkable fertility sloping gently from north to south and
south-east. This surface has a master slope towards south
east with gradient 0.25 meters/kilometer. Longitudinally the
level surface is varied by several depressions formed by the
river valleys and natural drainage lines, while the
elevations consists merely of slight ridges of sand, which
initially appear to have been due to fluvial action.
Drainage:-
The study area is drained mainly by the Yamuna river.
The Yamuna river only affects the strip of khadir lying
below the old high bank. The Yamuna river is one of the most
important tributary of the river Ganga. It raises from
Yamunotri off Bander-punch glacier at an elevation of 633 0
meters above mean sea level in Tehri Garhwal district of U.P
in the Himalayas. Many small streams like Rishi Ganga, the
Uma, the Hanuman Ganga and several others join it in the
mountains. The Tons is the longest tributary which joins

18
PRAlNAGe,.MAP OF THE STUDY AREA.

19
Yamuna below Kalsi. The Yamuna river enters the plain at
Tagewala from it flows due south and joins the Ganga at
Allahabad (FIG-5). The velocity of the river Yamuna varies
from about 3km/hr. during normal season to llkm/hr. in the
rainy season.
Climate and Rainfall:-
The climate of the study area is sub-tropical. It
experiences extreme weather conditions characterized by
extremely hot summer and severely cold winters. The area is
associated with a general prevalence of continental air
current which moves from west south-east to east-northeast.
Winter starts at the end of October and continues till the
end of February when the day temp stratas rising. The
maximum temperature during winter months is around 21°C and
minimum around 4°C to 9°C. The maximum temperature during
hot season is around 42°C and it often rises upto 45°C
during June. Monsoon breaks by 2nd week of June and
lasts till the end of September. About 90% of the rainfall
takes place during the months of July and August. The rest
of the year is dry except for occasional light showers
during winters. The average annual rainfall in the study
area for the years 1992,1993,1994,1995 is 667.13mm (FIG-6).
Soil Types:-
The soil types of the study area are much the same in

composition and appearance. The alluvium brought by the
river Yamuna spreads almost all over the area. The alluvial
soils of the study area has been divided into two broad
geological divisions which are older alluvium and newer
alluvium. The Bhangar soils occupies the level plains above
the general flood limits of the main river. These soils vary
from clayey loam to sandy loam depending on the land form
and the drainage of the region. The soil is characterized by
the presence of impure calcareous concretions or 'kankar'.
The soils differ greatly in texture and consistency ranging
from the sands through loams and silts to heavy clays that
are ill drained and are sometimes charged with injurious
accumulations of sodium salts producing a sterile
deflocculated conditions. On the basis of profile, texture,
color the soils of the study area have been classified as
follows.
1. Sandy loam.
2. Clay to Clayey loam.
3. Loam to sandy loam.
Sandy loamy soils are sandy in texture and brown or
reddish brown in color. The water holding capacity of these
soils is low. They are suffering from the deficiencies of
organic matter and other plant nutrients.
The soils which are clayey to clayey loam are
characterized by dark gray to black in color. They are rich

21
in clay and silt which accounts for 60% to 75% of the soil.
The soils are stronoly alkaline in character and the pH
usually ranges from 7 to 9. Due to poor drainage, the
soluble sodium saltP are deposited on the surface in the
form of salt efflorepcence
The texture of l-oam to sandy loamy soils varies from
good quality loam to sandy loam. The clay percent in the
subsoils is higher than at the surface. The color of the
surface soil is ash nray while the subsoils are darker.
These soils arc compact having restricted drainage and
all the layers of tlif' soil contain 'kankar' nodules. Water
retaining capacity ot these soils is poor.

22
TABLE
RAIN FALL DATA FOR THE YEARS 1992,1993,1994,1995 AROUND
MATHURA BLOCK in mm
MONTHS
January
February
March
April
May
June
July
August
September
October
November
December
Total
Average
1992
18.0
6.2
3.0
--
16.0
--
313.0
95.0
206.0
73.0
23.0
--
687.00
57.25
1993
--
23 .5
--
7.0
--
47.0
297.5
64.5
710.5
1149.00
95.75
1994
39.0
1.0
--
34.0
6.0
--
310.0
141.0
2.0
--
--
533.00
44.43
1995 1
--
33.5
146.04
61. 0
59.0
--
299.54 1
24.96 1

23
FIG-R

CHAPTER - III

2A
CHAPTER - III
GROUNDWATER POLUJTION
The quality of groundwater is just as important as its
quality. Rain water is the purest form of water. But as it
falls to ground, it collects dust and dissolves certain
gasses forming acids. When it flows on the surface, it
collects decayed vegetable matter which forms organic acids
in water. Also when it percolates into the soil, certain
salts and minerals get dissolved in it. Groundwater
pollution is defined as degradation of groundwater quality
by artificial induction.
Groundwater is sometimes polluted by sewage containing
pathogenic bacteria. Pollution can impair the use of water
and can create hazards to public health through toxicity or
the spread of diseases. Most pollution originates from the
disposal of waste water following the use of water for any
of a wide variety of purposes. Thus a large number of
sources and causes can modify groundwater quality, ranging
from septic tanks to irrigated agriculture. In contrast with
surface water pollution is difficult to detect, is even more
difficult to control, and may persist for decades.
Groundwater pollution resulting from disposal of liquid
wastes, which has become serious problem not only in Mathura
but also in various parts of the country. The possible
pollutants in groundwater are virtually limitless.

25
Groundwater pollution is caused by the presence of certain
organic, inorganic and radioactive substance? in industrial
water present in suspended form. A complex and interrelated
series of modifications to natural water quality is created
by the diversity of human activities impinging on the
hydrologic cycle.
The sources and causes of groundwater pollution are
closely associated with human use of water. Most pollution
stems from disposal of wastes on or into the ground. Methods
of disposal include placing wastes in percolation ponds; on
the ground surface, in seepage pits or trenches, in dry
stream beds, in landfills, into disposal wells and into
injection wells. All sources and causes of pollution can be
classified as to their geometry. A point source originates
from a singular location, a line source has predominantly
linear alignment, and a diffuse source occupies an extensive
area that may or may not be clearly defined. In absence of
only surface water body in vicinity of industries, the
waters are often discharged in small channels near the
industrial units leading to accumulation in small
depressions.
Some of the factors which control groundwater pollution
are reactions in the top soil, unsaturated and saturated
zones. When the pollutants move through the unsaturated
zone, they travel primarily vertically downward from the
surface and the solute undergoes only a small degree of
26
horizontal placement. In the unsaturated zone, the movements
of pollutants is increased by the effect of following
factors.
a) The moisture content of the soil
b) The hydraulic gradient and hydraulic conductivity
c) The relative portion of active pore spaces
d) The climate of the region.
As soon as the pollutant reaches the saturated
zone, it usually spreads out laterally and moves in the
direction of groundwater flow. The pollutants in the
saturated zone either floated on the top of the aquifer at
the water table or move into the aquifer. The important
factors that effect movement of pollutants in the saturated
zone are dispersion and convection. Dispersion plays an
important role in mixing of pollutants in the aquifer
system. Molecular diffusion results in mixing of two
miscible liquids even if there is no flow. Convection is the
process by which pollutants transfer by water moving with
the same velocity and direction as pollutants. The
convection motion of a pollutant depends on the groundwater
flow field which in turn depends on the peizometric head
distribution, hydraulic conductivity and the boundary
conditions.
The principal sources and causes of groundwater
pollution are classified into four categories.

27
1. Municipal sources and causes
2. Industrial sources and causes
3. Agricultural sources and causes
4. Miscellaneous sources and causes
1) Municipal sources and causes of groundwater pollution:-
Among the municipal sources of pollutants the common
sources are (a) sewer leakage (b) liquid wastes (c) solid
wastes.
(a)Sewer leakage:- The leakage of sewage into the ground is
a common occurrence, especially from old sewers. Leakage may
occur from poor workmanship, defective sewer pipe, breakage
by tree roots, ruptures from heavy loads or soil slippage,
fractures from seismic activity, loss of foundation support,
shearing due to differential settlement at manholes and
infiltration causing sewage flow into abandoned sewer
lines. Sewer leakage can introduce high concentrations of
BOD, COD nitrate, organic chemicals and possibly bacteria
into groundwater, where sewers serve industrial areas, heavy
metals such as As, Cd, Cr, Cu, Fe, Pb, Mn and Hg may enter
the waste water.
(b)Liquid wastes: - Waste water in an urban area may
originate from domestic uses, industries. There is an
increasing trend for treated waste water to be recharged

28
into the ground where it mingles with naturally occurring
groundwater and subsequently becomes available for reuse,
municipal waste waters can introduce bacteria, viruses and
inorganic or organic chemicals into groundwater. In the
study area the domestic liquid wastes consist of organic
pollutants and gets oxidized by bacterial decomposition to
nitrate, phosphate, C02. Most of the pollution of the area
is domiciled in buildings connected to sewage treatment
system.
(c) Solid wastes:- The land disposal of solid wastes creates
important source of groundwater pollution. Hundreds of tons
of garbage and rubbish are thrown in depressions in
industrial sites of Mathura town. After decomposition these
materials are dissolved and become suspended in rain water,
percolating into ground which tends to contaminate the
groundwater.
A landfill may be defined as any land area serving as a
depository of urban or municipal solid Wastes. Leachate from
a landfill can pollute groundwater if water moves through
the fill material. The problem of pollution from landfills
is greatest where high rain fall and shallow water tables
occur. Important pollutants frequently found in leachate
include BOD, COD, Fe, Mn, Cl, N03, hardness and trace
elements.

29
2)Industrial sources and causes of groundwater pollution:-
Most of the Indian rivers and freshwater streams are
seriously polluted by industrial wastes or effluents. The
waste waters of different industries in the study area such
as petrochemical complexes, fertilizer factories, oil
refinery, textile, dyeing industries are constantly
polluting the river Yamuna.
Untreated or partially treated industrial effluents are
the major source of surface and subsurface water pollution
in the study area. Groundwater pollution may occur where
industrial waste waters are discharged into pits, ponds
there by enabling the wastes to migrate down to the water
table. Petroleum and petroleum products are responsible for
much of the pollution. Leakage is particularly frequent from
gasoline stations and home fuel oil tanks.
Food processing wastes generate large amount of
organic by-products that have been disposed off in waste
water. When the waste water is discharged, it leads to high
BOD and a consequent oxygen depletion in the receiving
water. The production of oil and gas is usually accompanied
by substantial discharges of waste water in the form of
brine include Na, Ca, NH^, B, Cl, So^ and high TDS.
The effluents discharged by metal industries steel
mills, transformer manufacture industries are termed as non-
fermentable wastes and are generally characterized by low pH
30
and high concentration of trace elements. The industrial
effluents discharged by food and bewerage industries,
tanneries are termed as fermentable wastes. The industrial
wastes discharged by fertilizer manufacturing industries,
industries manufacturing pesticides, herbicides & fungicides
are toxic wastes.
3)Agricultural sources and causes of groundwater pollution:-
Agricultural sources and causes of groundwater
pollution includes animal wastes, irrigation return flow,
fertilizers and pesticides.
Animal wastes are used as fertilizer in agricultural
area in the study area, storm run-off in contact with the
manure carries highly concentrated pollutants to surface and
subsurface waters. Animal wastes may transport salts,
organic loads and bacteria into the soil. Nitrate is the
most important pollutant that may reach the water table.
When animal wastes are permitted to enter water supplies, it
poses serious problem in water pollution. The nature and
amount of animal waste product depend on the types of animal
and its diet.
Irrigation return flow is an important source of water
pollution. Approximately two thirds of the water applied for
irrigation of crops is consumed by evapotranspiration, the
remainder termed as irrigation return flow, which drains to
surface channels or joins the underlying groundwater. The

31
degradation results from the addition of salts by
dissolution during the irrigation process. Principal cations
include Ca, Mg and Na, major ions include HCO3, SO^, Cl and
NO3 . Irrigation return flow can be the major cause of
groundwater pollution in arid and semi-arid regions.
The waste water of Yamuna river is being utilized for
irrigation in rural areas of Mathura. These waste waters
contributed mainly by Mathura refinery, dyeing industries,
plastic industries and food & bewerage industries etc.. The
waste water of Yamuna river contain high concentration of
heavy metals, organic matter and other toxic substances. The
concentration of TDS is high, therefore when used for
irrigation makes the soil saline. Percolation of this water
into ground causes deterioration of ground water quality.
Fertilizers are one of the most important source of
groundwater pollution. When fertilizers are applied to
agricultural land, a portion usually leaches through the
soil and to the water table. The primary fertilizers are
compounds of nitrogen, phosphorous and potassium. Phosphate
and potassium fertilizers are readily adsorbed on soil
particles and seldom constitute a pollution problem. There
are distinct variations in geochemical behavior of
potassium, phosphate and nitrogen in the soil and
unsaturated zone. Potassium ions undergo base exchange
reaction. Phosphate ions are most resistant to leaching
where as nitrogen ions have tendency to leached and partly

32
lost by denitrification.
The impact of pesticides on groundwater quality depends
on the properties of the pesticide residue, rainfall or
irrigation rates and soil characteristics. Most pesticides
are relatively insoluble in water while others are readily
adsorbed by soil particles or are subjected to microbial
degradation. They are cumulative poisons in the body and
usually accumulated in the food chain and hence are
hazardous. Pesticides like DDT changes fertility of mammals
and thus pose an alarming problem for mankind.
Herbicides, fungicides and insecticides are three main
classes of pesticides. Sodium chlorate, sulfuric acid and
sodium arsenate are common herbicides which are used in
agriculture. Fungicides are used to eradicate and prevent
diseases of plants. Some important fungicides are sulfur,
formaldehyde etc. Insecticides are used in agriculture for
killing the insects living on the crops.
The problem which is associated with pesticides is
presence of pesticide residue. As the pesticides residue
remain in biosphere and lithosphere for more than twenty
years, even if we stop using of pesticides long-term effects
that might occur could be related to carcinogenic, mutagenic
and tetratogenic (ability to produce congenital
uteromalformation) (Silvey,W.D.,1967).

33
Measures for controlling groundwater pollution
The important measures fro controlling groundwater
pollution are discussed herewith.
1)Waste-water treatment:- The main purpose of waste water
treatment is to reduce the amount of suspended solids,
bacteria and oxygen demanding materials in waste water. In
addition new techniques are being developed to remove
harmful dissolved inorganic materials that may be present.
The waste water treatment generally falls into two broad
classes. Primary treatment which involves removal of grit,
screening, grinding flocculation and sedimentation, the
secondary treatment involves controlled biological
assimilation and degradation processes that occur in nature
by micro-organisms.
The most troublesome aspect of waste water treatment is
the handling and disposal of sludge produced in treatment
process. The main object for waste water treatment is that
to convert the organic matter to a relatively stable form
and to destroy or control harmful organisms. The most common
methods used for industrial effluents include chemical
coagulation and filtration carbon adsorption, chemical
oxidation, air stripping, biological treatment,
electrodialysis and reverse osmosis.
34
2) {Manipulation of subsurface gradient :- Groundwater
pollution can be decreased by manipulation of subsurface
gradient by injection or withdrawal of water. The basic
objective is plume manage which is achieved by designing
well systems to control movements of water phase directly
and indirectly. Well systems are also used for recovery of
immiscible pollutants.
Measures of controlling sources of pollution
The basic objective of source control measures is to
reduce the volume of waste or cause physical/chemical
alteration in the waste characteristics. Various volume
reduction measures include recycling, filtration, resource
recovery, sand drying, chemical fixation, degradation,
detoxication, regradation and circulation of leachate.

CHAPTER - IV

35
CHAPTER - IV
WATER CHEMISTRY
Water from surface and underground sources provides
sustenance to plants and animals, constitutes the habitat
for aquatic organisms, and meets important agricultural and
industrial needs. Suitability of water for various purposes
is based on chemical and biological character of the water.
Water is the most vital resource for all kinds of life on
this planet which adversely affected both qualitatively and
quantitatively by all kinds of human activities on land in
air or in water.
Collection and Preservation of Water Samples
The objective of sampling is to collect a portion of
material small enough in volume to be transported
conveniently and handled in the laboratory while still
accurately representing the material being sampled. Before
collecting samples from distribution systems, flushlines
sufficiently to ensure that the sample is representative of
the supply, taking into account the diameter and the length
of the pipe to be flushed and after and the velocity of
flow. Collect samples from wells only after the well has
been pumped sufficiently to ensure that the sample
represents the groundwater source. When samples collected

36
from a river or stream, observed results may vary with
depth, stream flow and distance from shore and from one
shore to other. Water samples are collected in the study
area with the help of polythene bottles.
Types of samples
(a) Grab samples:- A grab sample is an ordinary sample which
is taken from a particular place representing the whole
water quality. This sample is valid only when it is certain
that the water quality is not changing in a short time.
(b) Composite sample:- A composite sample is one taken at
various times from a locality under going fluctuations and
combining that to know average chemical characteristics. A
composite sample may completely hide an anoxic state.
(c) Integrated sample:- It is a sample which is collected
from a number of nearing localities and may be pooled
together to avoid minor variation.
SAMPLE PRESERVATION
The water samples are to be collected in a separate
clean bottle and acidified with nitric acid to a pH below
2.0 to minimize precipitation and adsorption of certain
cations such as aluminium, cadmium, chromium, copper, iron,
lead. Manganese, silver and zinc.

37
To minimize the potent ial for volatization or
biodegradation between samp]iiM and analysis, keep samples
as cool as possible without frrt^/ing.
Analyze samples as quickly as possible on arrival at
the laboratory. If immediate analysis is not possible
storage at 4°C is recommended lor most samples preservation
methods are limited to pH control, chemical addition, the
use of amber and opaque bottlrt^ refrigeration, filtration
and freezing. Methods of prrix-rvation are limited and are
used to retard hydrolysis <'t chemical compounds, retard
biological action and to reduor volatility of constituents.
Methods of preservation for various parameters
Parameters Preservation Maximum holding period
Calcium BOD COD Color DO Chloride Fluoride Hardness Total metal pH TDS Turbidity Sulfate Sulfide Conductivity
7 7 7
6 Mont
Determined on None required None required None requiied 5ml HNOg/liter Determined on site None required 7 None required 7 Refrigeration at 4°C 7
2ml Zinc acetate/liter 7 refrigeration at 4°C 28
hours
days days days hs
days days days days days

38
TECHNIQUES USED FOR ANALYSIS OF WATER SAMPLES
Almost all major ions excluding sodium and potassium
have been analysed by volumetric method. Sodium and
potassium were analysed with the help of Flame photometer.
Atomic absorption spectrophotometric method and portable
digital voltametric methods are used to determine the
quantity of trace elements in water samples. EC, pH and TDS
are analysed with the help of water analysis kit.
VOLUMETRIC METHOD
Major elements such as hardness, calcium, magnesium,
chloride, carbonate, bicarbonate are determined by
volumetric method. Volumetric methods can be classified into
four types involving (1) acid-base titration (2)
Complexometric technique. (3) redox reactions. (4)
Precipitation method. The precipitation titration has wide
ranging applications in the analysis water samples. The
hardness of water can be determined by complexometric
titration. The analysis of DO, BOD and COD can be done by
redox titration which is the most reliable.
Argentometric method is generally used for the
determination of chloride. This method is based on the
principle that in a natural or slightly alkaline solution,
potassium chromate can indicate the end point of the silver
nitrate titration of chloride. Silver chloride is

39
precipitated quantitatively red silver chromate is formed.
SPECTROPHOTOMETER
In spectrophotometer monochromatic light is passed
through an absorbing column of an often colored solution of
a fixed depth and directed upon photosensitive device which
converts the radiant energy into electrical energy. The
current produced under these conditions is measured by means
of a sensitive voltmeter.
In this method the sample is atomized and aspired into
flame, a light beam is directed through the flame into a
monochrometer, and onto a detector, that measure the amount
of light absorbed. The greater the number of molecules or
ions of absorbing substance present, the greater is the
absorption of light. In other words the more the color the
greater is the deflection of the voltmeter. Thus the
concentration of absorbing component present in the
solutions may be accurately measured by spectrophotometer.
FLAME PHOTOMETER
In this method solution of sample is atomized and
sprayed into a burner. The intensity of the light emitted by
a particular spectral line is measured with the help of
photo electric cell and galvanometer. Sodium and potassium
are determined by this method. The principle involves in
flame photometry method is that salts of metals when

40
introduced under carefully controlled condition into
suitable flame are vaporized and exited to emit radiations
that are characteristics for each elements.
PORTABLE DIGITAL VOLTAMMETER
The PDV-2000 is a sensitive analytical instrument which
is used to determine some trace elements such as copper,
lead, zinc, thallium, bismuth, antimony and cadmium. The
technique of anodic stripping voltammetry is infact, a form
of electroplating on small scale. Metals are first
electroplated onto an electrode from a liquid and then,
during the subsequent stripping stage the deposited metals
are oxidized or stripped back into solution, each metal at
its own characteristics potential.
The small amount of current is generated as each metal
oxidizes is measured and correlated with the concentration
of metal in original solution. The electrodes which are used
with this instrument are glassy carbon electrode and gold
electrode. Concentrations down to one part per billion in
the cell solution can be detected. For those elements such
as mercury, silver and gold which do not allow a mercury
film to be used on the electrode surface, a lower detection
limit of 50ppb in the cell solution is appropriate.
WATER ANALYSIS KIT
EC, pH and TDS in water samples are determined with
water analysis kit. The determination of these parameters is

1
done by using various electrodes.
EH determination:- The measurement of pH with water analysis
kit is accomplished by determining the potential developed
by electrode. It is a measure of alkalinity of a solution.
The pH electrode is connected to the input socket at
the front of the instrument. Electrode is cleaned with
distilled water and dipped in the 4.00pH buffer solution
which is supplied with the instrument. After measuring the
temperature of the buffer solution, temperature knob is
fixed at the temperature of the solution. After pushing the
pH switch with the help of calibration knob, the display to
4.00ph is adjusted. The electrode is washed, dried and
dipped in the solution whose pH is to be measured.
EC determination:- Electrical conductivity is the measure of
the ability of a solution to carry electric current, which
depends on the presence of ions.
The conductivity cell is connected to the input socket
for conductivity. The cell is dipped in 0. IN KCl solution
whose conductivity is known. After pushing the conductivity
knob, the range of conductivity is adjusted at 200 micromho.
After measuring the temperature of the solution reading is
adjusted with CAL knob as per the chart supplied with the
instrument. Conductivity electrode is washed with distilled
water and dipped in the unknown solution. It will give
direct reading.

42
WATER QUALITY PARAMETERS IN THE STUDY AREA
The quality of water largely depends on a number of
individual hydrological, physical, chemical and biological
parameters are of special imp>ortance and deserve frequent
attention and observation, others give a rough picture of
water quality status. The graphical representation of major
ions and trace elements is shown in FIG - 10 & 11
respectively.
During the present study the following constituents of
water cuialysed shown in TABLE-3. The concentrations of major
ions and trace elements are given in TABLE - 4 & 5
respectively.
Physical parameters
E.C Temperature
Chemical parameters
pH T.D.S Hardness
TABLE - 3
Major Cations
Calcium Magnesium Sodium Potassium
Major Anions
Chloride Carbonate Bicarbonate
Trace Elements
Zinc Lead Copper Thallium Bismuth
PHYSICAL PARAMETERS
Electrical Conductivity
Electrical conductivity is the measure of capacity of a
substance or solution to conduct electric current.Electrical

43
conductivity is reciprocal oi the resistance. Electrical
conductivity of water is having direct relationship with the
concentration of ionized materials present in water. E.C
gives us an idea about extent of mineralization and is
indicative of the salinity of water. Surface water and
groundwater in the study area is characterized by high
mineralization in some locations. The value of electrical
conductivity in the study area ranges from 1000 microseimens
per cm to 17500 microseimens per cm with average of 3714.3
microseimens per cm at 25°C. The water sample taken from
Narholi tube well shows a high electrical conductivity
value, this may possibly be due to high mineralization.
Temperature
The parameter of temperature is basically important for
its effects on the chemistry and biological reactions in the
organisms in water. The solubility of oxygen decreases as
water temperature increases. At elevated temperatures
metabolic activity of the organisms increases. The value of
temperature in the study area i-anges from 26 °C to 31.3°C
with an average of 27.61°C
CHEMICAL PARAMETERS
pH (Potentia Hydrooenii)
pH is the measure of the intensity of acidity or

44
alkalinity and measures the concentration of hydrogen ions
in water. pH does not measure total acidity or alkalinity.
In fact the normal acidity or alkalinity depends upon excess
hydrogen ions are more than hydroxyl ions over the other. If
free hydrogen ions are more than hydroxyl ions the water
shall be acidic. pH is generally measured on a log scale and
is equals to negative log-j Q of hydrogen ion concentration.
pH scale ranges from 0 to 14 with 7 as neutral, below 7
being acid and above 7 being alkaline.
The pH values in the study area ranges from 7.36 to
9.25 with an average of 7.84. The areas where higher values
of pH are observed are Goshala, koilghat and kalkatia. The
values of pH are within the permissible limits for domestic
use at almost all the locations. The change in pH may be
due to variation in photosynthetic activity which increases
the pH due to consumption of carbondioxide.
Total Dissolved Solids:-
Total dissolved solids denote mainly various kinds of
minerals present in the water. They do not contain any gas
and colloids etc. In natural waters total dissolved solids
are composed mainly of carbonates, bicarbonates, chlorides,
sulfates, phosphates and nitrates of calcium, magnesium,
sodium, potassium, iron and manganese etc. Concentration of
dissolved solids is an important parameter in drinking water
and other water quality standards. The permissible limit of

A5
total dissolved solids prescribed by ICMR(Indian Council Of
Medical Research, 1975) is between 500 to 1500 ppm.
The values of total dissolved solids in the study area
ranges from 590ppm to 11450ppin with an average of 2435.43.
the higher concentration is recorded from Narholi,
Mukundpur, Charora, Daulatpur ka nagla. Water with high
concentration of TDS is generally palatable, may not quench
thirst and may have laxative effective on people.
Total Hardness:-
Hardness is the property of water which prevents the
lather formation with soap and increases the boiling point
of water. Principal cations imparting hardness are calcium
and magnesium. However other cations such as strontium,
iron and manganese also contribute to the hardness. The
anions responsible for hardness are mainly bicarbonate,
carbonate, sulfate, chloride, nitrate and silicates.
Hardness is called temporary if it is caused by bicarbonate
and carbonate salts of the cations, since it can be removed
by simply boiling water. Permanent hardness is caused mainly
by sulfates and chlorides of the metals.
The hardness in water is derived from the solution of
carbondioxide, released by bacterial action in the soil, in
percolating rainwater. The degree of hardness in water is
commonly based on the classification listed below.
46
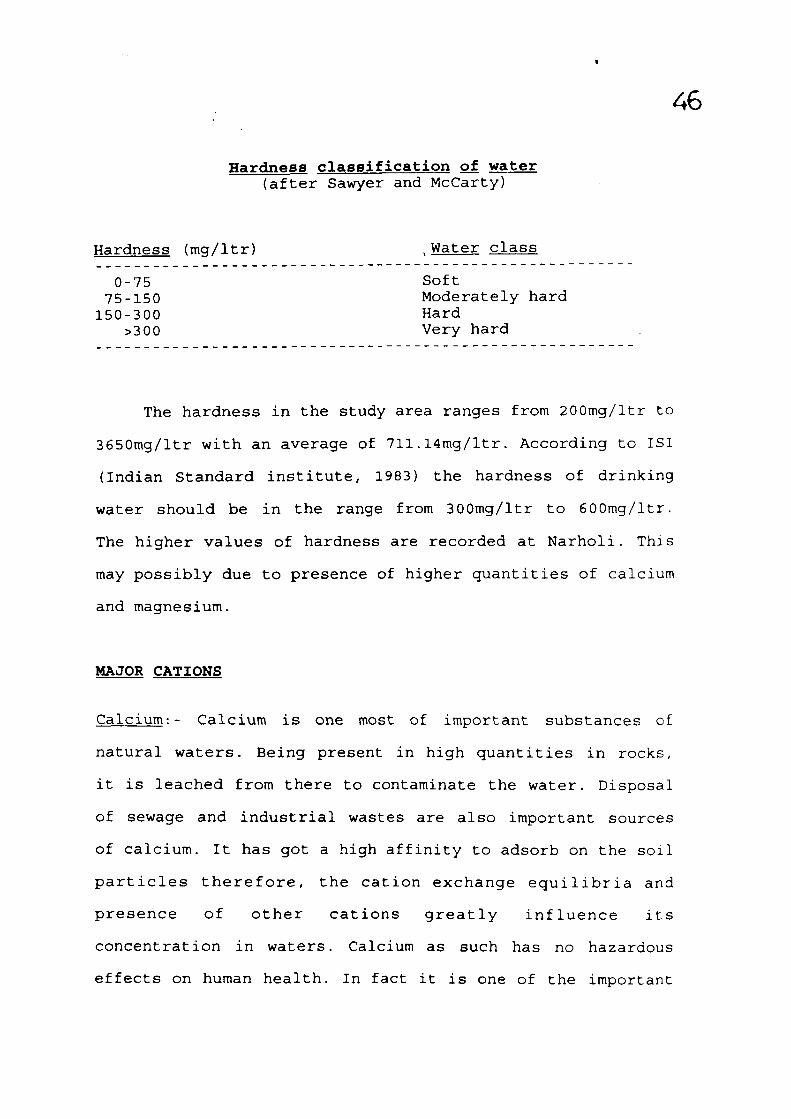
Hardness classification of water (after Sawyer and McCarty)
Hardness (mg/ltr) , Water class
0-75 Soft 75-150 Moderately hard 150-300 Hard
>300 Very hard
The hardness in the study area ranges from 200mg/ltr to
3650mg/ltr with an average of 711.14mg/ltr. According to ISI
(Indian Standard institute, 1983) the hardness of drinking
water should be in the range from 300mg/ltr to 600mg/ltr.
The higher values of hardness are recorded at Narholi. This
may possibly due to presence of higher quantities of calcium
and magnesium.
MAJOR CATIONS
Calcium: - Calcium is one most of important substances of
natural waters. Being present in high quantities in rocks,
it is leached from there to contaminate the water. Disposal
of sewage and industrial wastes are also important sources
of calcium. It has got a high affinity to adsorb on the soil
particles therefore, the cation exchange equilibria and
presence of other cations greatly influence its
concentration in waters. Calcium as such has no hazardous
effects on human health. In fact it is one of the important

47
nutrients required by . The concentration of calcium in the
study area ranges from 60.12ppm to 1561.12ppm with an average
of 237.27ppm. According to USPH (United State Public Health,
1962) the maximum permissible limit for calcium is lOOppm.
The low content of calcium may cause rickets and defective
teeth. It is essential for nervous system cardiac functions
and in coagulation of blood.
Magnesium:-
The principle sources of magnesium in the natural
waters of the study area are sewage and industrial wastes.
Like Calcium the concentration of magnesium also depends
upon exchange equilibria and presence of the ions like
sodium. Magnesium is supposed to be non-toxic at the
concentrations generally met in natural waters. High
concentrations may be cathartic and diuretic( Lehr et al.,
1980) for the initial users but a tolerance is developed in
short time. High concentrations combined with sulfate acts
as laxative to humans. Concentrations as high as SOOppm
impart an impleasant taste.
The maximum permissible limit of magnesium according to
USPH (1962) is 30ppm and according to W.H.O (1984) is
IBOppm. Magnesium concencration in the study area ranges
from 2.44ppm to 635.92ppm with an average of 58.96ppm. The
high concentration of magnesium is recorded at Narholi.
Magnesium deficiency may cause severe diarrhoea, chronic

48
rena 1 failure and protein-caloric malnutrition W.H.0(1973).
Sodium:-
Sodium is one of the important cations occurring
naturally. In natural waters, the major source of sodium is
weathering of various rocks. Many industrial wastes and
domestic sewage are rich in sodium and increase its
concentration in natural waters after disposal. Sodium has a
tendency to get adsorbed on the clay particles but may
effectly be exchanged by calcium and magnesium. At lower
concentrations there are no adverse effects on the health.
According to National Academy of Science (1977), the higher
concentrations of sodium can be related to cardiovascular
diseases and in woman toxemia associated with pregnancy. The
concentration of sodium in the study area ranges from
64.78ppm to 747.37ppm with an average of 276.94ppm.
Sodium content is usually expressed in terms of percent
sodium which is also known as sodium percentage and soluble
sodium percentage. Sodium percentage is calculated by
following expression.
(Na + K) 100 Sodium percentage =
Ca + Mg + Na + K
Where all ionic concentrations are expressed in
millieqivalent per litre. The sodium percentage values in
the study area ranges from 9.768 to 78.532 with an average

A9
of 43.207. The maximum sodium percentage was calculated at
Goshala village.
Quality classification of water for irrigation (After Wilcox, 1955)
Water class %Na Electrical conductivity
Excellent < 20 < 250 Good 20 - 40 250 - 750 Permissible 40 - 60 750 - 2000 Doubtful 60 - 80 2000 - 3000 Unsuitable > 80 > 3000
Sodium Adsorption Ratio 1£ARJ_: -
Sodium Adsorption Ratio can be calculated by the
following expression
Na SAR -
\/(Ca+Mg)/2
Where all ionic concentrations are expressed in
milliequivalent per liter. Sodium adsorption ratio was
recommended by the salinity laboratory of the U.S.Department
of Agriculture (1962). Sodium adsorption ratio is usually
calculated, because of the direct relation of sodium to
adsorption by soil

50
The sodium adsorption ratio values in the study area
ranges from 0.7680 to 15.3218 with an average of 4.7607
Potassium:
The major sources of potassium in natural fresh waters
in the study area are disposal of waste waters. As such
potassium is not very much significant from the health point
of view but large quantities may be laxative. The
concentration of potassium in the study area ranges from
llppm to 82ppm with an average of 25.114ppm. The maximum
concentration of potassium was recorded at Maholi.
MAJOR ANIONS : -
Chloride:-
The most important source of chlorides in the natural
fresh waters is the discharge of domestic sewage. In the
study area the major sources of chloride are industries.
Chlorides are highly soluble with most of the naturally
occurring cations and does not precipitate, sedimented and
cannot be removed biologically in treatment of the wastes.
High concentrations of chloride in water is not known to
have toxic effect on man, though a large amount effect
corrosively on metal pipes and be harmful to plant life. It
produces a salty taste at 250 - 500 ppm level.
The concentration of chloride in the study area ranges

51
from 21.27 ppm to 21.27 ppm with an average of 412.64 ppm.
The high concentration of chloride was recorded at Narholi
and most of the locations in the study area have the
concentration of chloride above average. The sample
collected from township quarters show the minimum
concentration of chloride (21.27 ppm). According to
I.S.I (1983) the highest desirable limit of chloride is 250
ppm and maximum permissible limit of chloride is 1000 ppm.
Carbonate:-
The major source of carbonate in natural fresh water
are lime stone and dolomite. The concentration of carbonate
in the study are ranges from 18 ppm to 24 0 ppm with an
average of 72.38 ppm. The maximum concentration of carbonate
was recorded at Narholi.
Bicarbonate:-
The major source of bicarbonate in natural fresh waters
in the study area are limestone and dolomites. Besides these
bicarbonate enters groundwater through carbondioxide in the
soil and leaching from carbonaceous rocks. The concentration
of bicarbonate in the study area ranges from 18.30 ppm to 61
ppm with an average of 3 6.6 ppm.
TRACE ELEMENTS
Zinc: -
Zinc is an essential and beneficial element for human

52
bodies. But concentrations above 5ppm cause bitter taste and
opalescence in alkaline waters. In drinking water, the
concentration of zinc ranges from 0.06 ppm to 7.0 ppm. The
major source of zinc concentration in water are the
deterioration of galvanized iron and dezincification of
brass besides industrial waste.
The concentration of Zinc in the study area is below
the highest desirable limit. The concentration ranges from
0.020 ppm to 0.057 ppm with an average of 0.03 9 ppm. Zinc
plays an important role in enzymes and many enzymatic
reactions, protein synthesis and carbohydrate metabolism
(Taylor and Demayo 1980) . It is also responsible fro cell
division and growth. Zinc deficiency in human body results
in infantilism, impaired wound healing and several other
diseases.
Lead:-
Lead enters water bodies from mining activities and
smelter discharges or from dissolution of old lead
plurabing. Lead is a very serious body poison. In the study
area the major sources of lead concentration in water bodies
are wastes of liquid and solid from dyeing industries and
Mathura refinery. Lead salts are used as anti knocking
compounds in fuel for gasoline engine which is a major
source of lead pollution in atmospheric environment.
The high concentration of Lead have adverse effects on

53
the central nervous system, blood cells, kidney and may
cause brain damage. As a result of ingestion of 'iead, there
may be loss of appetite, fatigue, irritation, headache and
vomiting.
In the study area the concentration of lead ranges
from 0.004ppm to 0.075ppm with an average of 0.021ppm., As
per the W.H.O (1984) standards the maximum permissible limit
of lead is .Ippm. Maximum concentration of lead was recorded
at the site of disposal of liquid wastes of Mathura
refinery.
Thallium :-
Thallium is an important trace element found in water
bodies. The major sources of thallium in water are
pesticides and cosmetic industries. In the study area the
concentration of thallium is ranges from 0.002ppm to 0.020
ppm with an average of 0,0087ppm. Thallium is the only toxic
metal which causes chronic poisoning.
Bismuth:-
The main source of bismuth in the study area industrial
wastes. Bismuth occurs in a free state in nature often
associated with silver, gold, copper, lead and other
minerals. Concentration of bismuth in the study area ranges
from 0.002ppm to 0.009 with an average of 0.003ppm. In some
locations it has not been recorded.

54
Copper:-
Copper in natural waters results in higher
concentration due to pollution.lt is used with sulfate as a
pesticide and also separately as an algicide. Copper is one
of the essential elements for humans an adult's daily
requirement is about 2.0ppm. The sources of copper that
enhance the concentration in water include mining waste,
industrial effluents from electroplating units, textiles,
paints, pumping equipments and pesticides.
The concentration of copper in the study area ranges
from 0.002ppm to 0.012ppm with an average of 0.0025ppm.
Copper has toxic effect if concentration is below the
desirable limit. High intake may result in damage to the
liver. It is also involved in hemoglobin synthesis,
connective tissue development. The deficiency of copper
causes diarrhoea, anaemia, demineralization of bone, Wilson
disease has been associated with abnormal copper metabolism.

55 TABLE -4
LOCATION AND HYDROCHEMICAL DATA OF WATER SAMPLES
1 . V l d n ^ ^ e t
2 . G o d B l a
3 . Ockiil
4 . Baldevpur
S . K j U a O B C
t . b U t a t x B
7 . Mil lBiria
8 . Br la favoD
9, I k u l ^ H i l l a
l O . b u d a k
1 1 . J a m a lifaun.
1 2 . IndBuCt . a r e a - B
1 3 . InduBtt . a z e a - B
1 4 . B a z a z i
I S - W i m
IC . I k u l a r p i i m n g l a
n.lvi±^
15.ariiiiMHl H u l l
2 0 - » ( t ^ i i r
Z l .OiarDca
2 2 . K X a
71 WlljIBIIfcIT
24 .DmooBi^pisa
2 6 . B i n a p i i r
2 7 . a o p a ] i B g a r
2 8 . T'"^**' .aLUU-A
2 9 J f e l i a l i
3 a . l U i u n 4 p u r
3 1 . 1 b x l i a l i
3 2 . D L H « J U « 1 B i t e
3 3 . S a I e i ^ u r
34. l faeCiB
SS-ltaHOStiip Q t x s .
Bource
S.W
H.P
B . P
T.W
H.P
D.W
T.m
rv^-igi
H.P
T.W
H.P
H.P
H.P
B . P
D.W
H.P
D.B
D.W
H.P
T.W
D.W
D.W
D.W
T.W
D.W
T.W
T.W
D.W
D.W
D.W
T.W
S.W
T.W
T.W
T.W
PB
7 . 6 5
8 . 9 5
7 . 7 5
8 . 7 5
8 . 9 2
7 . 5 2
9 . 2 5
7 . 5 «
7 . 5 5
7 . 4 5
7 . 7 5
7 . 5 0
7 . 9 7
7 . 5 5
7 . 4 5
8 . 0 2
8 . 1 2
7 . 4 5
8 . 6 7
7 . 5 5
7 . 4 5
7 . 6 5
7 . 4 5
7 . 5 0
7 . 6 5
7 . 7 5
8 . 3 5
7 . 7 9
7 . 7 2
7 . 9 5
7 . 7 8
7 . 3 6
6 . 9 5
7 . 4 5
8 . 0 6
B .C
2 1 0 0
2300
5100
2 5 0 0
2 4 0 0
1000
2 0 0 0
2 7 0 0
1700
1800
5200
1300
2 8 0 0
1600
5 5 0 0
9200
7200
2 4 0 0
6 2 0 0
3300
7000
1600
2 9 0 0
1200
1100
2 4 0 0
5200
3300
2 6 0 0
7200
17500
3700
2 9 0 0
2100
1000
•c
3 1 . 3
2 8 . 0
2 6 . 0
2 8 . 0
2 6 . 0
2 9 . 0
2 8 . 0
2 6 . 0
2 8 . 0
2 6 . 0
2 9 . 0
2 9 . 0
2 6 . 0
2 7 . 0
2 8 . 0
2 6 . 0
2 7 . 0
2 8 . 0
2 6 . 0
2 8 . 0
2 8 . 0
2 8 . 0
2 8 . 0
2 7 . 0
-28 .0
2 7 . 0
2 6 . 0
2 7 . 0
2 9 . 0
2 8 . 0
2 8 . 0
2 8 . 0
2 8 . 0
2 8 . 0
2 8 . 0
T . D . S
1400
1550
3390
1590
1540
590
1300
1730
1070
1170
3400
870
1800
1070
3580
5940
4 0 5 0
1570
4 0 4 0
2140
4 5 0 0
1030
1870
8 2 0
7 4 0
1560
3440
2140
1700
4 7 8 0
11450
2410
1920
1380
6 6 0
H m t m a e
450
4 5 0
1000
500
400
300
350
550
350
550
950
340
800
500
1500
1050
1550
850
1000
500
1050
350
350
300
350
4 0 0
4 0 0
800
800
900
3650
500
400
500
200
Odtxide
2 2 4 . 5 2
2 3 6 . 3 3
6 3 8 . 1 0
2 4 8 . 1 5
2 4 8 . 1 5
5 3 . 2 0
1 9 4 . 9 7
2 1 2 . 7 0
1 2 4 . 0 7
1 0 6 . 3 5
5 1 4 . 0 3
7 0 . 9 0
3 1 9 . 0 5
8 8 . 6 3
7 7 9 . 9 0
8 3 3 . 0 7
U 4 0 . 7 5
3 3 6 . 7 7
7 6 2 . 1 7
3 8 9 . 9 5
7 0 9 . 0 0
1 0 6 . 3 5
2 8 3 . 6 0
7 0 . 9 0
2 8 . 6 0
2 3 0 . 4 2
6 0 2 . 6 5
3 8 9 . 9 5
2 6 5 . 8 7
9 7 4 . 8 7
2 1 2 7 . 0 0
4 7 8 . 5 7
3 3 6 . 7 7
1 9 4 . 9 7
2 1 . 2 7
OO3 1
1
1 8 . 0 0
3 0 . 0 0
7 8 . 0 0
3 0 . 0 0
3 6 . 0 0
2 4 . 0 0
3 6 . 0 0
1 6 8 . 0 0
U 4 . 0 0
1 8 . 0 0
7 2 . 0 0
6 0 . 0 0
9 0 . 0 0
4 8 . 0 0
4 2 . 0 0
3 0 . 6 0
3 6 . 0 0
1 4 4 . 0 0
6 6 . 0 0
3 6 . 6 0
6 0 . 0 0
2 4 . 0 0
5 4 . 0 0
U .OO
5 4 . 0 0
1 2 0 . 0 0
3 0 . 6 0
1 9 8 . 0 0
1 2 0 . 0 0
6 0 . 0 0
2 4 0 . 0 0
7 2 . 0 0
1 2 6 . 0 0
1 1 4 . 0 0
6 6 . 0 0
HDD3 1
1
3 0 . 5 0
3 6 . 6 0
3 6 . 6 0
4 2 . 7 0
4 2 . 7 0
3 0 . 5 0
3 6 . 6 0
4 8 . 8 0
2 4 . 4 0
4 8 . 8 0
3 0 . 5 0
3 0 . 5 0
2 4 . 4 0
2 4 . 4 0
1 8 . 3 0 .
3 0 . 5 0
2 4 . 4 0
3 6 . 6 0
6 1 . 0 0
4 2 . 7 0
4 8 . 8 0
3 0 . 5 0
3 6 . 6 0
3 0 . 5 0
3 6 . 6 0
3 0 . 5 0
6 1 . 0 0
4 2 . 7 0
2 4 . 4 0
6 1 . 0 0
3 0 . 5 0
3 6 . 6 0
2 4 . 4 0
5 4 . 9 0
3 0 . 0 5
Ql 1
1
1 0 0 . 2 0
1 4 4 . 2 8
2 4 0 . 4 8
1 6 0 . 3 2
1 6 4 . 3 3
7 6 . 1 5
2 2 0 . 4 4
2 4 0 . 4 8
2 5 2 . 5 0
3 2 8 . 6 5
3 2 0 . 6 4
9 6 . 1 9
3 0 0 . 6 0
3 3 6 . 6 7
3 9 6 . 7 9
3 8 0 . 7 6
3 8 0 . 7 6
2 2 4 . 4 4
5 6 1 . 1 2
1 6 0 . 3 2
4 2 0 . 8 4
1 4 0 . 2 8
1 0 8 . 2 2
6 4 . 1 3
1 0 0 . 2 0
1 8 0 . 3 6
1 4 0 . 2 8
4 2 0 . 8 4
3 0 0 . 6 0
2 4 0 . 4 8
4 1 6 . 8 3
1 8 4 . 3 6
2 8 0 . 5 6
1 6 0 . 3 2
6 0 . 1 2
m 1 1
3 2 . 9 0
2 1 . 9 3
9 7 . 4 6
2 3 . 3 6
2 . 4 4
2 6 . 8 0
4 8 . 7 3
1 2 . 1 8
6 8 . 2 2
6 5 . 5 8
3 6 . 4 5
2 4 . 3 6
1 2 . 1 8
8 2 . 8 4
U 4 . 2 6
2 4 . 3 6
1 4 6 . 1 8
7 0 . 6 6
9 7 . 4 6
2 4 . 3 6
7 . 3 1
9 . 7 5
1 9 . 4 9
3 4 . 1 1
2 4 . 3 6
1 2 . 1 8
1 2 . 1 8
6 0 . 9 1
1 2 . 1 8
7 3 . 1 0
6 3 5 . 9 2
9 . 7 5
7 3 . 1 0
2 4 . 3 6
1 2 . 1 8
S o d i u i 1
1
3 2 6 . 3 0
7 4 7 . 3 7
5 5 0 . 0 0
5 1 0 . 0 0
6 9 4 . 7 4
9 0 . 1 4
7 5 . 9 0
6 4 2 . U
9 5 . 2 2
103 .33
370 .00
2 1 6 . 6 6
8 0 . 0 0
2 0 0 . 0 0
8 5 . 0 7
4 3 1 . 5 8
4 8 4 . 2 0
3 9 0 . 0 0
7 4 . 9 3
166 .66
7 7 . 9 7
6 7 3 . 6 8
90 .14
1 3 7 . 5 0
9 5 . 2 2
6 4 . 7 8
150 .00
300 .00
330 .00
2 6 6 . 6 6
2 3 3 . 3 3
4 8 4 . 2 0
2 0 0 . 0 0
160 .00
95 .22
K 1
1
37
13
20
11
20
11
12
13
17
14
45
24
38
11
37
4 0
31
14
25
XS
13
4 5
48
20
17
11
23
4 3
82
30
IB
30
2 0
20
11
sat 1 1
7 . 2 3 5 3
1 5 . 3 2 1 8
7 . 5 6 2 1
9 . 9 6 0 8
14 .7450
2 . 2 6 2 5
1 .2050
1 0 . 9 5 8 0
1 .3730
1 .3613
5 . 2 2 2 1
5 . 1 1 0 1
1 .2306
2 . 5 3 1 8
0 . 9 5 4 9
5 . 7 9 3 1
5 . 3 4 6 8
5 . 8 1 6 6
0 . 7 6 8 0
3 . 2 4 2 8
1 .0317
1 4 . 8 4 6 0
2 . 0 9 4 7
3 .4506
2 . 2 1 5 0
1 .2610
3 . 2 6 4 0
3 . 6 1 9 0
5 . 0 7 6 6
3 .8658
1 .6784
9 . 4 1 8 0
2 . 7 5 0 8
3 . 1 1 3 5
2 . 9 3 1 8
Uta
6 6 . 2 9 6
7 8 . 4 8 3
5 4 . 9 6 9
6 9 . 3 7 0
7 8 . 5 3 2
4 1 . 1 6 8
1 9 . 3 8 1
6 8 . 5 0 7
2 0 . 0 8 2
1 8 . 2 0 9
4 7 . 5 8 3
59 .606
2 1 . 7 7 6
2 7 . 5 5 2
U . 4 0 1
4 8 . 7 6 0
4 1 . 3 2 5
50 .451
9 .768
4 3 . 3 0 2
1 4 . 7 0 t
7 9 . 6 2 7
4 2 . 3 5 9
5 1 . 9 3 9
3 9 . 5 5 5
2 3 . 6 7 4
4 7 . 0 9 1
35 .241
5 0 . 7 0 9
4 0 . 7 0 1
1 2 . 6 6 9
6 8 . 5 7 8
31 .528
4 2 . 7 7 8
52 .563
I 7.84 |3714 .3 | 27 .6 l |2435.43 | 711.14 | 412.64 | 72.38 | 36.60 | 237.27| S6.96| 276.94 |2S.114| 4.7607| 43.207
0 9 K U T.W :- •ntie weu a n d R j ^
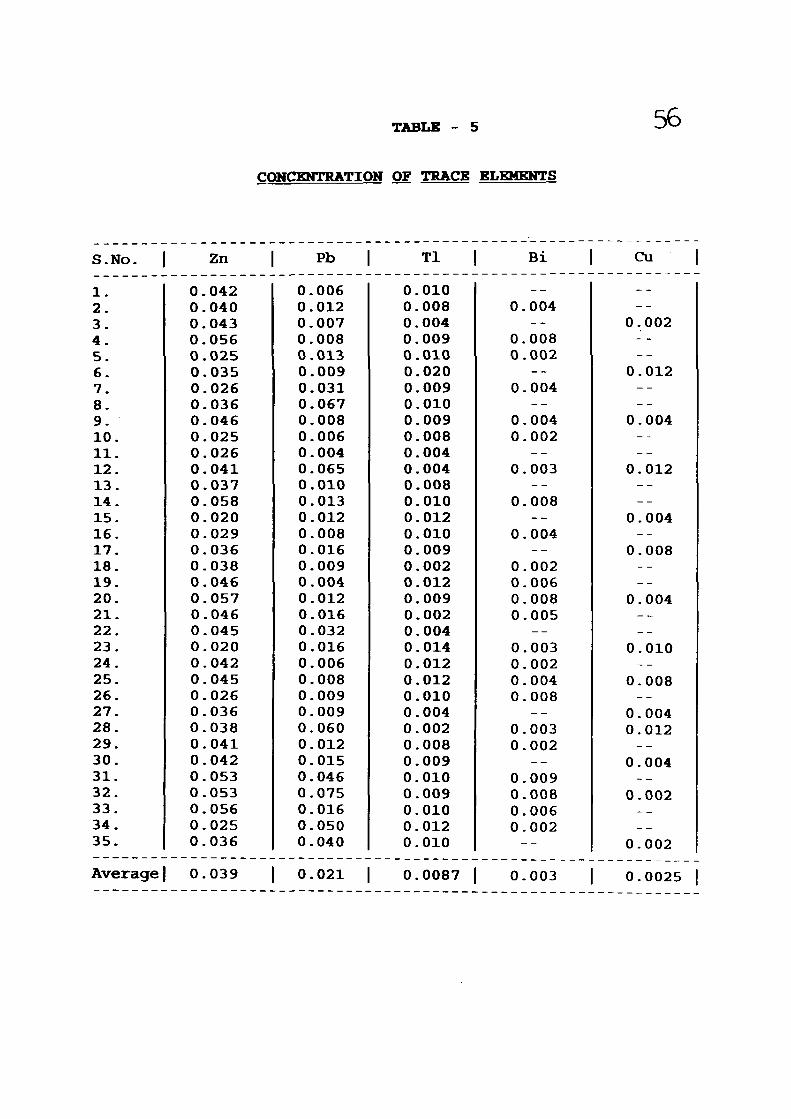
TABLE - 5 56
CONCENTRATION OF TRACE ELEMENTS
S.No.
1 . 2 . 3 . 4 . 5 . 6 . 7 . 8 . 9 . 1 0 . 1 1 . 1 2 . 1 3 . 1 4 . 1 5 . 1 6 . 1 7 . 1 8 . 1 9 . 2 0 . 2 1 . 2 2 . 2 3 . 2 4 . 2 5 . 2 6 . 2 7 . 2 8 . 2 9 . 3 0 . 3 1 . 3 2 . 3 3 . 3 4 . 3 5 .
Average
Zn
0 . 0 4 2 0 . 0 4 0 0 . 0 4 3 0 . 0 5 6 0 . 0 2 5 0 . 0 3 5 0 . 0 2 6 0 . 0 3 6 0 . 0 4 6 0 . 0 2 5 0 . 0 2 6 0 . 0 4 1 0 . 0 3 7 0 . 0 5 8 0 . 0 2 0 0 . 0 2 9 0 . 0 3 6 0 . 0 3 8 0 . 0 4 6 0 . 0 5 7 0 . 0 4 6 0 . 0 4 5 0 . 0 2 0 0 . 0 4 2 0 . 0 4 5 0 . 0 2 6 0 . 0 3 6 0 . 0 3 8 0 . 0 4 1 0 . 0 4 2 0 . 0 5 3 0 . 0 5 3 0 . 0 5 6 0 . 0 2 5 0 . 0 3 6
0 . 0 3 9
Pb
0 . 0 0 6 0 . 0 1 2 0 . 0 0 7 0 . 0 0 8 0 . 0 1 3 0 . 0 0 9 0 . 0 3 1 0 . 0 6 7 0 . 0 0 8 0 . 0 0 6 0 . 0 0 4 0 . 0 6 5 0 . 0 1 0 0 . 0 1 3 0 . 0 1 2 0 . 0 0 8 0 . 0 1 6 0 . 0 0 9 0 . 0 0 4 0 . 0 1 2 0 . 0 1 6 0 . 0 3 2 0 . 0 1 6 0 . 0 0 6 0 . 0 0 8 0 . 0 0 9 0 . 0 0 9 0 . 0 6 0 0 . 0 1 2 0 . 0 1 5 0 . 0 4 6 0 . 0 7 5 0 . 0 1 6 0 . 0 5 0 0 . 0 4 0
0 . 0 2 1
Tl
0 . 0 1 0 0 . 0 0 8 0 . 0 0 4 0 . 0 0 9 0 . 0 1 0 0 . 0 2 0 0 . 0 0 9 0 . 0 1 0 0 . 0 0 9 0 . 0 0 8 0 . 0 0 4 0 . 0 0 4 0 . 0 0 8 0 . 0 1 0 0 . 0 1 2 0 . 0 1 0 0 . 0 0 9 0 . 0 0 2 0 . 0 1 2 0 . 0 0 9 0 . 0 0 2 0 . 0 0 4 0 . 0 1 4 0 . 0 1 2 0 . 0 1 2 0 . 0 1 0 0 . 0 0 4 0 . 0 0 2 0 . 0 0 8 0 . 0 0 9 0 . 0 1 0 0 . 0 0 9 0 . 0 1 0 0 . 0 1 2 0 . 0 1 0
0 . 0 0 8 7
B i
— 0 . 0 0 4
- -0 . 0 0 8 0 . 0 0 2
- -0 . 0 0 4
- -0 . 0 0 4 0 . 0 0 2
- -0 . 0 0 3
- -0 . 0 0 8
- -0 . 0 0 4
- -0 . 0 0 2 0 . 0 0 6 0 . 0 0 8 0 . 0 0 5
- -0 . 0 0 3 0 . 0 0 2 0 . 0 0 4 0 . 0 0 8
— 0 . 0 0 3 0 . 0 0 2
— 0 . 0 0 9 0 . 0 0 8 0 . 0 0 6 0 . 0 0 2
- -
0 . 0 0 3
Cu 1
— - -
0 . 0 0 2 - -- -
0 . 0 1 2 - -- -
0 . 0 0 4 - -- -
0 . 0 1 2 - -- -
0 . 0 0 4 - -
0 . 0 0 8 - -
0 . 0 0 4 - -- -
0 . 0 1 0 —
0 . 0 0 8 —
0 . 0 0 4 0 . 0 1 2
— 0 . 0 0 4
— 0 . 0 0 2
— —
0 . 0 0 2
0 . 0 0 2 5 1

57
SAMPLING LOCATIONS IN THE STUDY AREA

58
1750 2000 3000 «000 5000 > ' > — • - ,0
100 2S0 500 750 1000 1500 2250 5000
w
Ci Low
Conductivity
C2 _ Medium
( micro mhos/cm at 2 5 * C l
C3 High
Ci Vrry High
Satinity -hazard
f i g - 8 -= Showing p lo t s of SAR va lues a g a i n s t t.C. values (U.S. S a l i n i t y Labora to ry d iagram) .

59
ELECTRCCAL CONOUCTIVITY(micromho»/cm otZS^C)
3000 3500
E
•o o 50i in
u 40-
3 0-
20-
10-
o o
u X UI
"a
a.
o o O
z
§
o o
J i_
• •
z o "5 c 3
|0 15 , 2 0 25
TOTAL CONCENTRATrON, e p m .
30 35
Fig^ 9 ShowiA9 plots of sodium percent against E.C. alues (After Wilcox).

o
60
FIG-!Q
GRAPH SHOWING CONCENTRATIONS OF
MAJOR ELEMENTS
^ o
o
8
la z z o
s
cr U LLl
C03r HCOI3 Ca^ Mg^ Na»

ir
61
FIQ-II.
GRAPH SHOWING CONCENTRATIONS OF
TRACE ELEMENTS
m , ex
IS
^ 8 o
ui o
in
3
Zn R> Tl H Cu HL
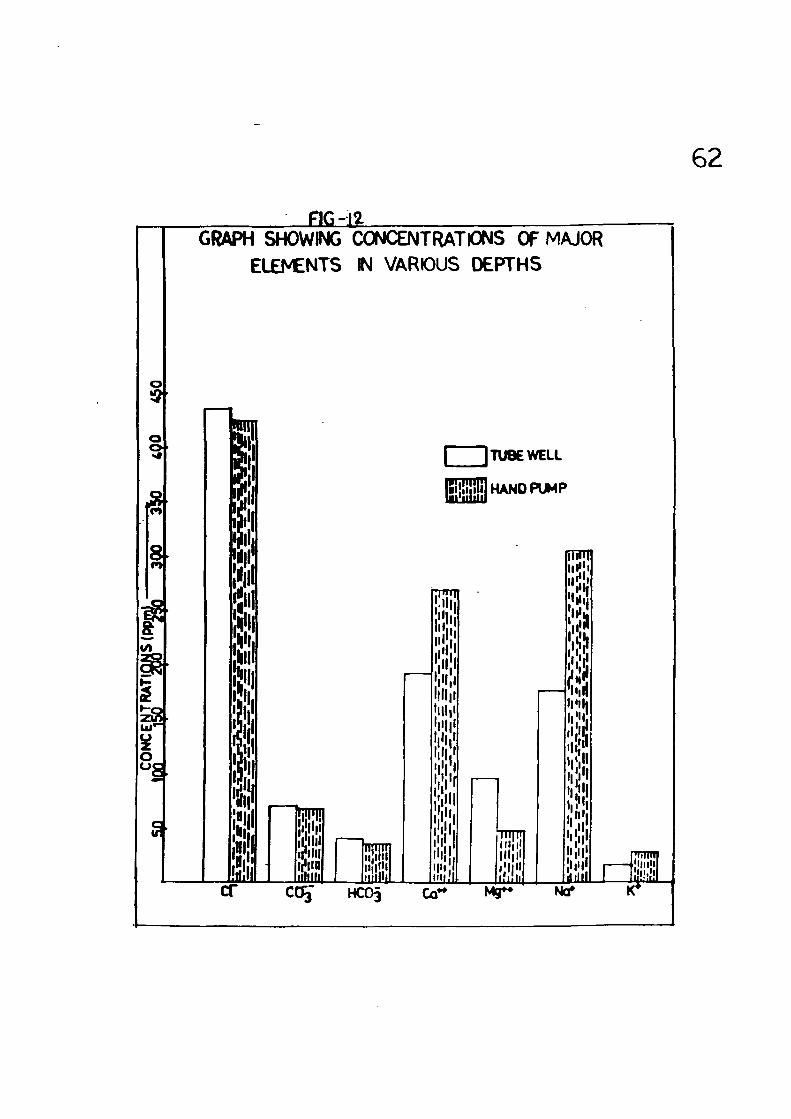
62
o
«
# (/)
u z o
PIG-12 GRAPH SHOWING CONCENTRATIONS OF MAJOR
ELEMENTS IN VARIOUS DEPTHS
liiii iiiiii
iiiim
iiiiii
jiiillil
I ] TUBE WELL
p a HAND PUMP
I'' ' I ' i l l >l<i!i iiiiii
'iHi'
'l'l|'
I
i|';:i HI' I'
nil" CC%' HCO3 Co**
TTipr I I I | l | l ( l <
I.'lill
U S ' •Hi
'11'"
" I I :
' • • i l l li'ih
" •I'l' I 'I
" I ' i|i'i I'll '"I" j'ln! I I'll
JliUl Na»
rnrm
Jliiiili

^
63
FIG -13 GRAPH SHOWING CONCENTRATIONS OF TRACE
ELEMENTS IN VARIOUS DEPTHS
1 ^
S
in
Ul O o So tJ rr
I 1 TUBE WELL
^ HAND PUMP
Zn Pb T
ic-i
^.sz.
a " ^ r~
0 u
SUMMARY
fit
CONCLUSION

w
SUMMARY AND CONCLUSION
The quality of water is not vital concern for mankind
since it is directly linked with human welfare. At present
the menace of water-borne diseases and epidemics still looms
large on the horizons of developing countries. Generally
speaking water pollution is a state of deviation from pure
condition, where by its normal function and properties are
affected . In the study area the major source of water
pollution is industrial wastes which are discharged into
natural water bodies.
Mathura is one of the most industrial towns of Uttar
Pradesh situated on the banks of river Yamuna. There are
about 300 industries which include oil refinery, dyeing,
food and bewerage industries etc. The study area is a part
of Mathura district which is located south-east of Delhi in
the semidesert or gray steppe soil region. The study area
includes Mathura block, Farah block and Baldev blocks of
Mathura district. It lies within the latitudes 27°15' North
to 27°40' North and longitude 77°30' East to 77°55' East.
Physiographically the study area is a gently sloping plain
due south to south-east with a gradient of 0.26 mts/kms.
Geomorphologically the area is classified into three
main geomorphic units based on the criteria of relief,
lithology, soil and vegetation, which are (1) Eolian Sand
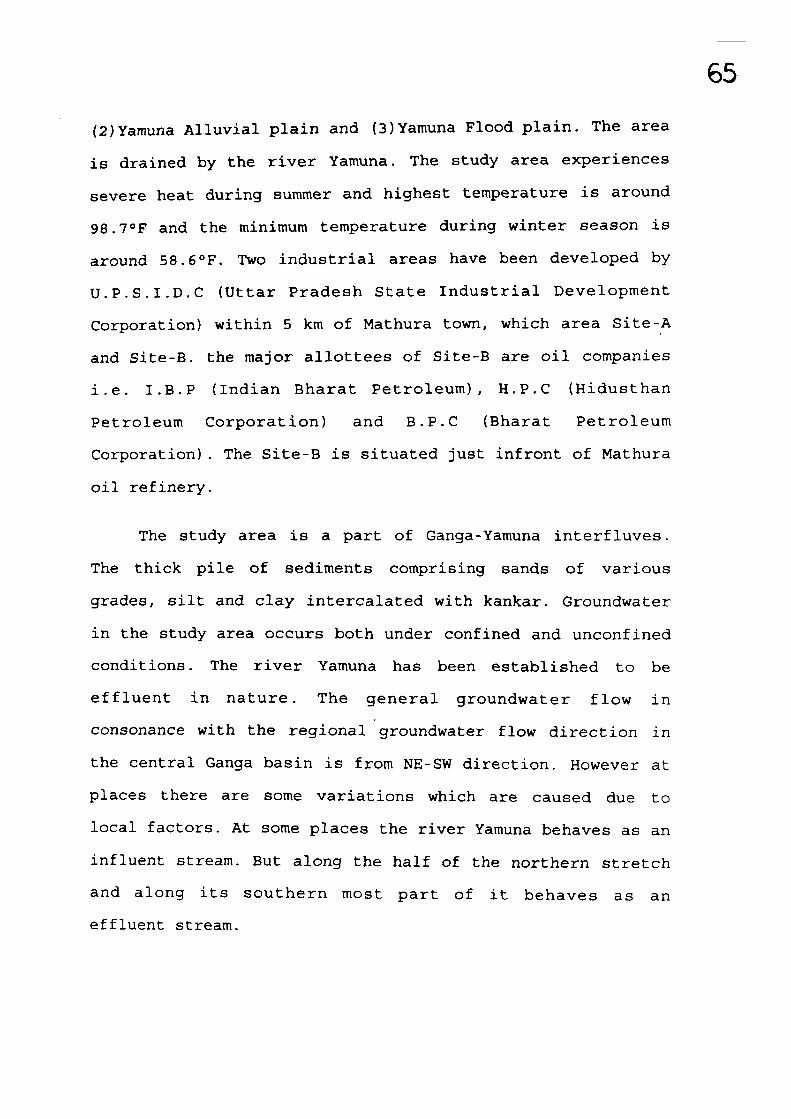
(2)Yamuna Alluvial plain and (3)Yamuna Flood plain. The area
is drained by the river Yamuna. The study area experiences
severe heat during summer and highest temperature is around
98.VF and the minimum temperature during winter season is
around 58.6°F. Two industrial areas have been developed by
U.P.S.I.D.C (Uttar Pradesh State Industrial Development
Corporation) within 5 km of Mathura town, which area Site-A
and Site-B. the major allottees of Site-B are oil companies
i.e. I.B.P (Indian Bharat Petroleum), H.P.C (Hidusthan
Petroleum Corporation) and B.P.C (Bharat Petroleum
Corporation). The Site-B is situated just infront of Mathura
oil refinery.
The study area is a part of Ganga-Yamuna interfluves.
The thick pile of sediments comprising sands of various
grades, silt and clay intercalated with kankar. Groundwater
in the study area occurs both under confined and unconfined
conditions. The river Yamuna has been established to be
effluent in nature. The general groundwater flow in
consonance with the regional groundwater flow direction in
the central Ganga basin is from NE-SW direction. However at
places there are some variations which are caused due to
local factors. At some places the river Yamuna behaves as an
influent stream. But along the half of the northern stretch
and along its southern most part of it behaves as an
effluent stream.

66
Depth to water varies widely. In pre-monsoon(1994,June)
the depth to water table ranges from 2.05 m.b.g.l.t to 25
m.b.g.l. While in June 1995 it ranges from 1.85 m.b.g.l. to
21.80 m.b.g.l. In post-monsoon (1994,November) the depth to
water table ranges from 0.55 m.b.g.l. to 20.10 m.b.g.l.,
while in November 1995 it ranges from 0.65 m.b.g.l.
The groundwater level fluctuation in the study area
ranges from 0.50 m.b.g.l. to 4.20 m.b.g.l. in the year 1994
and in the year 1995 it ranges between 0.80 m.b.g.l. to 3.28
m.b.g.l. The higher value of fluctuation is calculated at
village Shergarh.
The maximum concentrations of sodium, potassium,
calcium and magnesium in water samples of the area are
74 7.37 ppm, 82 ppm, 561.12 ppm and 635.92 ppm respectively.
This is probably due to both intensive industrialization and
agricultural activities. The presence of maximum calcium in
water samples may be attributed due to excessive use of
nitrogenous fertilizers and animal wastes.
The average concentrations of calcium, sodium and
potassium in the shallow water aquifers ranging from 267ppm,
3 02.1ppm and 29.71ppm. The water sample from deeper water
aquifer show a range between 189.44ppm, 173.67ppm and
15.5ppm respectively. This may be due to contamination of
pollution mainly confined to shallow aquifers. So water
particularly for drinking purpose should be tapped from deep

67
tube wells (FIG - 12 & 13).
Determination of trace metals such as zinc, lead,
thallium, bismuth and copper in water samples has been made.
The wide spread practice of dumping of raw sewage in shallow
soakpits has made apprehension of groundwater pollution in
the study area. The concentrations of trace elements in
water samples ranged as follows, Zn - 0.020ppm to 0.057ppm,
Pb - 0.006ppm to 0.075ppm, Tl - 0.002ppm to 0.020ppm, Bi -
0.002ppm to 0.009ppm and Cu - 0.002ppm to 0.012ppm. The
water sample collected from the site of disposal of liquid
wastes released from Mathura refinery shows higher
concentration of Pb (0.075ppm) which is more than the
maximum permissible limit according to U.S.P.H (United State
Public Health , O.OBppm, 1962) and W.H.O (World Health
Organization, 1984) standards.
RECOMMENDATIONS
It is recommended that before releasing the effluents
in the river, SAR most significantly be reduced with
decolorisation which can be achieved by extraction of the
caustic with the existing technology. This process leads to
considerable reduction in pH and sodium concentration. The
colours from the effluents can be removed by treating the
effluents with lime whiftffTacJt& nly removes the colour but
A<^ • > - , .

68
also reduces suspended solids. T.D.S may be reduced by using
some chemical or natural coagulants.
To create better environment and to protect the
ecosystem from further degradation, government should pass
legislation for strict compliance of the industry to treat
their effluents at their own cost. It is also recommended
that water for drinking purpose should be tapped from deeper
aquifers.

REFERENCES

69 REFERENCES
American Public Health Association, 1975. Standard methods
for the examination of water and waste water, 14th.
edition, A.P.H.A, Washington,D.C.
Anon, 1975. "Manual of standards of quality of drinking
water supplies". 2nd. edition. Special report series
No.44, Indian Council of Medical Research, New Delhi.
Asgar, A.G, Puri, A.N. and Taylor, A.M.,1936. Soil
deterioration in irrigated areas of Punjab, Part-1 and
part-2. Irrigation Research Institute, Memoir, Amritsar
Auden,B, 1933. Vindhyan Sedimentation in the Son valley,
Mirzapur district, Mem.Geological Survey of India. V-62
Basu, A.K.,1983. Groundwater pollution and its control.
Proceedings Seminar on groundwater for rural and urban
water supply. INC.,International Association of
Hydrogeologists, Calcutta.
Berg, J.W. and Burbank,F. 1972. Geochemical environment in
relation to health and disease. Ann. N.Y Academy of
science, 199, pp. 249-264.
C.G.W.B., 1982. Evaluation of aquifer parameters. A manual,
Central Ground Water Board, Ministry of Irrigation,
Govt, of India., pp. 183.
Chisholm, J.J.,1971. Lead poisoning Scient. Am.,V.224.,pp
15-23.
Cohen, J.M., et al.,1960.1960. Taste threshold
concentrations of metals in drinking water, Jour.Amer.
Water Works Association., V.52,pp.660.
Collins,W.D.,1923. Graphic representation of water analysis,
India and England Chem. Vol.15,pp.3 94.
Craun,G.F., and Mc Cabe,L.J.,1975. Problems associated with
metals in drinking water, Journal American Water Works
Association, 67., pp.593-599.
De,A.K,.1995. , Environmental Chemistry., 3rd.edition New Age
International (P) Limited, Publishers, pp. 167-280.
Drinking Water and Health, 1980, Vol.3, National Research
Council, Washington.D.C.
Environmental Protection Agency, 1973. Water quality
Criteria, E.P.A Publishers.,R.3-73-033..pp.594.
Fetter.C.W., 1988., Applied Hydrogeology 2nd.ed.Merril publ.
Company, Ohio., pp.52 9.
Geddes,A. , 1960. The Alluvial Morphology of the Indogangetic
plains. Trans. Inst. br.Geogr, pp.253-276.
Handa,B.K.,1984. Methods of Collection and preservation of
water samples. Technical manual.,C.G.W.B.,Ministry of

71 water Resources., Govt, of India.,pp4 0.
Handa,B.K.,1977. Modern Methods of water analysis. Tech.
Manual No.3.,C.G.W.B., Ministry of Water Resources,
Govt, of India, pp.1-404.
Indian Council of Medical Research,1975. Manual of Standards
of quality for drinking water Supplies, I.C.M.R.,
N.Delhi. 2nd. edition.
Indian Standard Institution,1983., Drinking water standards,
Table-1, Substances and characteristics affecting the
acceptability of water for domestic use.
Karanth,K.R.,1987. Groundwater Assessment Development and
Management, Mc Graw Hill Publishing Co.Ltd., N.Delhi.,
pp.720.
Krishnan,M.S.,1968. Geology of India and Burma, Sixth ed.
C.B.S Publishers., India, pp.536.
Raghunath,H.M., 1987. Groundwater Second edition. Wiley
Eastern Limited, pp.563.
Rainwater,F.H. and Thatcher, L.L. 1960. Methods for
collection and analysis of water samples., U.S.Govt,
printing office, Washington.D.C.
Rastogi,R and Gaumat,M.M., 1990. Pollution of groundwater in
Mathura district, U.P.,Bhu-Jal News,Qut.Journal of
72 C.G.W.B.., Vol.5,No.2,pp.49-51.
Silvey,W.D (1967); Occurrence of selected minor elements in
the waters of California, Geological Survey water
supply., Paper 1535-L, Washington, pp.25.
Taylor,G.C.,1959. Groundwater Provinces of India., Economic
Geology., Vol.54.,pp. 683-697.
Todd,D.K.,1980., Groundwater Hydrology, 2nd. ed. John Willy
and Sons,pp.53 5.
Trivedi,R.K., and Goel,P.K, 1984.Chemical and Biological
Methods for water pollution Studies., Environ. Publ.
Karad, pp.215.
U.S.P.H.S, 1962, United states Public Health Service,
Drinking water Standards, Publication No.956,U.S.Govt.
Printing office, Washington.D.C.
Wilcox,L.V.,1955., Classification and use of irrigation
water U.S.Deptt.of Agri.Circ. 969,Washington.D.C.pp.19.
World Health Organization, 1984., Guidelines for drinking
water quality. Vol.1 and 2., Recommendations, W.H.O.,
Geneva.