
Environmental performance indicators 2011 data
62
Environmental performance indicators 2011 data Report No. 2011e October 2012 International Association of Oil & Gas Producers
Transcript of Environmental performance indicators 2011 data

Environmental performance indicators 2011 data
Report No. 2011eOctober 2012
I n t e r n a t i o n a l A s s o c i a t i o n o f O i l & G a s P r o d u c e r s
P ublications
Global experience
The International Association of Oil & Gas Producers has access to a wealth of technical knowledge and experience with its members operating around the world in many different terrains. We collate and distil this valuable knowledge for the industry to use as guidelines for good practice by individual members.
Consistent high quality database and guidelines
Our overall aim is to ensure a consistent approach to training, management and best practice throughout the world.
The oil & gas exploration & production industry recognises the need to develop consistent databases and records in certain fields. The OGP’s members are encouraged to use the guidelines as a starting point for their operations or to supplement their own policies and regulations which may apply locally.
Internationally recognised source of industry information
Many of our guidelines have been recognised and used by international authorities and safety and environmental bodies. Requests come from governments and non-government organisations around the world as well as from non-member companies.
Disclaimer
Whilst every effort has been made to ensure the accuracy of the information contained in this publication, neither the OGP nor any of its members past present or future warrants its accuracy or will, regardless of its or their negligence, assume liability for any foreseeable or unforeseeable use made thereof, which liability is hereby excluded. Consequently, such use is at the recipient’s own risk on the basis that any use by the recipient constitutes agreement to the terms of this disclaimer. The recipient is obliged to inform any subsequent recipient of such terms.
This document may provide guidance supplemental to the requirements of local legislation. Nothing herein, however, is intended to replace, amend, supersede or otherwise depart from such requirements. In the event of any conflict or contradiction between the provisions of this document and local legislation, applicable laws shall prevail.
Copyright notice
The contents of these pages are © The International Association of Oil & Gas Producers. Permission is given to reproduce this report in whole or in part provided (i) that the copyright of OGP and (ii) the source are acknowledged. All other rights are reserved.” Any other use requires the prior written permission of the OGP.
These Terms and Conditions shall be governed by and construed in accordance with the laws of England and Wales. Disputes arising here from shall be exclusively subject to the jurisdiction of the courts of England and Wales.

Environmental performance indicators 2011 data
Report No: 2011e
October 2012

The environmental statistics for 2011 were derived from data provided by the following companies:
Contributing companiesAddaxADNOCBGBHP BillitonBPCairn EnergyChevronCNOOCConocoPhillipsDolphin EnergyDONG E&PDragon OilEni E&P DivisionExxonMobilGDF SUEZ Hess CorporationHuskyINPEXKosmosKuwait Oil CompanyMaersk OilMarathonMOLNexenOil SearchOMVPerencoPetrobrasPetronasPremier OilPTT EPQatar PetroleumRepsol YPFRWEShell CompaniesStatoilSuncorTalisman EnergyTotalTullowWintershall

i
Environmental performance inindicators – 2011 data
©OGP
Table of contents
Executive summary 1Gaseous emissions ....................................................................................................................................1Energy consumption.................................................................................................................................1Flaring ......................................................................................................................................................2Aqueous discharges ...................................................................................................................................2Non-aqueous drilling fluids ......................................................................................................................2
Introduction 3
Scope of data submissions 5
Detailed review:
1 – Gaseous emissions 71.1 Carbon Dioxide (CO2) .......................................................................................................................91.2 Methane (CH4) ................................................................................................................................101.3 Greenhouse Gas (GHG) .................................................................................................................. 111.4 Non-Methane Volatile Organic Compounds (NMVOCs) ...............................................................121.5 Sulphur dioxide (SO2) ......................................................................................................................131.6 Nitrogen oxides (NOX) ....................................................................................................................14
2 – Energy consumption 15
3 – Flaring 17
4 – Aqueous Discharges 194.1 Quality (oil content) of produced water discharges...........................................................................204.2 Quantity of oil discharged in produced water per unit of production ...............................................214.3 Produced Water Injection.................................................................................................................23
5 – Non-Aqueous Drilling Fluids 255.1 Non-Aqueous Base Fluid retained on cuttings discharged to sea ......................................................25
6 – Spills 276.1 Oil Spills ..........................................................................................................................................27
Appendix A – Data tables 33Scope of data submissions .......................................................................................................................33Detailed review .......................................................................................................................................341 Gaseous emissions ............................................................................................................................342 Energy Consumption .......................................................................................................................373 Flaring .............................................................................................................................................394 Aqueous discharges ..........................................................................................................................395 Non-Aqueous Drilling Fluids ...........................................................................................................456 Spills ................................................................................................................................................46
Appendix B – Glossary 53

ii
International Association of Oil & Gas Producers
©OGP

1
Environmental performance inindicators – 2011 data
©OGP
Over the past 13 years, The International Association of Oil & Gas Producers (OGP) has collected environmental data from its member companies on an annual basis. The objective of this programme has been to allow member companies to compare their performance with other companies in the sector leading, it is hoped, to improved and more efficient performance. The programme also contributes to the industry’s wish to be more transparent about its operations.
This report summarises information on exploration and production (E&P) activities carried out by contributing OGP member companies in 2011. Forty one member companies working in 75 countries worldwide have submitted data for the report. This total includes 5 companies reporting for the first time this year and all of the 36 companies that contributed data in 2010. Information is aggregated at both global and regional levels and is expressed within 6 environmental indicator categories:
• gaseous emissions;• energy consumption;• flaring;• aqueous discharges;• discharges of non-aqueous drilling fluids retained on cuttings; and• spills of oil and chemicals.
These data represent oil and gas wellhead production of 2,221,462 thousand tonnes, about 32% of 2011 global production sales†. This is a 2% reduction in production compared to 2010. However, regional coverage is uneven, ranging from almost all known production in Europe to 9% in the Former Soviet Union (FSU).
Gaseous emissions
Releases of gases to the atmosphere are an integral and inevitable part of exploration, production and processing operations.
In 2011 participating OGP member companies reported emissions of:• 289 million tonnes of carbon dioxide (CO2) – equivalent to 133 tonnes of carbon dioxide per thousand
tonnes of hydrocarbon production;• 2.6 million tonnes of methane (CH4) – equivalent to 1.3 tonnes of methane per thousand tonnes of
hydrocarbon production;• 1.0 million tonnes of non-methane volatile organic compounds (NMVOC) – equivalent to 0.5 tonne
of NMVOC per thousand tonnes of hydrocarbon production;• 364 thousand tonnes of sulphur dioxide (SO2) – equivalent to 0.2 tonne of SO2 per thousand tonnes of
hydrocarbon production; and• 864 thousand tonnes of nitrogen oxides (NOX) – equivalent to 0.4 tonne of NOX per thousand tonnes
of hydrocarbon production.
Normalised CH4 emissions increased in 2011 by 6% compared with 2010.Normalised NOX emissions increased in 2011 by 3% compared with 2010.Normalised CO2, SO2 and NMVOC emissions remain virtually unchanged compared with 2010.
Energy consumption
Production of oil and gas requires significant quantities of energy for extraction, processing and transport. In many oilfields those energy needs are met by locally produced gas.
In 2011, OGP reporting companies consumed on average 1.6 GigaJoules of energy for every tonne of hydrocarbon produced; a 7% increase compared with the 2010 average. As in previous years, data indicate that onshore production in 2011 was more energy intensive than offshore production.
Executive summary
† Source: BP Energy Review 2012

2
International Association of Oil & Gas Producers
©OGP
Flaring
Flaring is the controlled burning of hydrocarbons produced in the course of petroleum exploration and production operations. It includes the controlled and safe burning of gas that – for commercial, safety or technical reasons – is not used or exported.
In 2011, 15.7 tonnes of gas was flared for every thousand tonnes of hydrocarbon produced versus 16.0 tonnes in 2010 and 17.6 in 2009. Reductions in flaring rates are predominantly driven by major infrastructure improvement projects that increase the capability to inject gas for reservoir maintenance and to deliver gas to markets. Reductions in flaring rates translate to reductions in CO2 and other gaseous emission rates.
Aqueous discharges
Produced water is the most significant water discharge associated with E&P operations. For every tonne of hydrocarbon produced (including oil, condensates and gas), 0.5 tonne of produced water was discharged and 1.0 tonne of produced water was re-injected.
The quality of produced water discharges is measured in terms of oil content. In 2011, the average concentration of oil in produced water was 8.1mg/l for onshore discharges and 12.2mg/l for offshore discharges. When expressed in terms of oil production, overall, these discharges are equivalent to 6.5 tonnes of oil for every million tonnes of hydrocarbon produced.
Comparison with 2010 data indicates that the average concentration of oil in produced water discharged decreased in 2011 by 10%. The average quantity of oil discharged per unit of hydrocarbon production decreased by 7%.
Non-aqueous drilling fluids†
Although most drilling fluids are water-based, some conditions encountered during well drilling operations demand the properties that are only available from non-aqueous drilling fluids (NADFs). In 2011 reporting companies discharged 35,481 tonnes of NADF on drill cuttings. Sixty eight percent of these discharges contained Group III base fluids and 2% contained Group II fluids. There have been no reports of discharges of Group I fluids since reporting began.
Spills
For the purpose of this report a spill is defined as any loss of containment that reaches the environment (i.e. is not retained within secondary or other confinement), irrespective of quantity recovered.
In 2011, participating OGP member companies reported 3,035 spills greater than 1 barrel in size, resulting in a normalised spill rate of 1.5 spills per million tonnes of hydrocarbon production (1.4 in 2010‡).
The reported spills >1 bbl resulted in the release of a total of 15,867 tonnes of oil. The average quantity of oil spilled per unit of hydrocarbon production has risen to 7.9 tonnes per million tonnes production, 75% higher than the average for 2010‡ but less than half of the average for 2009.
† Definitions of Group I, II and III base fluids are provided in section 5.1 ‡ The Deepwater Horizon incident was not included in the 2010 report or this report. The Multi-District litigation beginning in 2012 will address the amount of oil spilled

3
Environmental performance inindicators – 2011 data
©OGP
Over the past 13 years, OGP has collected environmental information from its member companies on an annual basis. The ultimate aim of this effort is to provide a representative statement on the environmental performance of the contributing OGP Member companies. Subsidiary objectives are to provide a basis for individual member companies to compare their environmental performance, thereby helping them to identify areas for improvement and to demonstrate the industry’s wish for greater transparency concerning its activities.
Environmental information relating to emissions and discharges is collected under the following six categories:• gaseous emissions;• energy consumption;• flaring;• aqueous discharges;• discharges of non-aqueous base fluids retained on cuttings; and• spills of oil and chemicals.
Data are collected annually for each of the categories above, on the basis of a set of definitions agreed by the OGP membership. The definitions are provided via a users’ guide that is reviewed at regular intervals and updated to reflect improvements in reporting and to provide additional clarification.
Annual reports of activities in the years 2003 to 2010 and summary reports for activities in 2001 and 2002 have been published previously and are available on the OGP website, http://www.ogp.org.uk/publications.
Introduction

4
International Association of Oil & Gas Producers
©OGP

5
Environmental performance inindicators – 2011 data
©OGP
Scope of data submissions
Forty one OGP member companies reported environmental information for, on average, 6 countries each. Data from 75 countries are represented in the report. The data represent 2,221 million tonnes of hydrocarbon production, approximately equivalent to 32% of 2011 world production as reported in the BP Statistical Review 2012.
To view the data from a geographical perspective, 7 regions have been defined.
Production associated with OGP database & 2011 production in BP Statistical Review of World Energy – by regionPercentage of known production†
0
20
40
60
80
100
120
South America
North America
Middle EastFSUEuropeAsia/Australasia
Africa
64
43
111111
9
2320
37
†
† Production figures in this report include oil and gas volumes consumed in operations and thus may exceed sales volumes reported in BP Statistical Review.
North America
Africa
FSU
Europe
South America
Asia/ Australia
Middle East

6
International Association of Oil & Gas Producers
©OGP
This report only reflects the performance of the OGP member companies that have provided data. However, where the degree of coverage is highest – for example in Europe where a high percentage of hydrocarbon production is represented – the information can be taken to approximate ‘industry’ performance. In Africa, Asia/Australasia and South America, the data give a broad indication of industry performance. For the Middle East and North America, the regional coverage is less comprehensive, giving a weaker indication of industry performance. For the Former Soviet Union (FSU), data reported by participating companies represent just 9% of the total sales production for that region. Data for this region are therefore only representative of the performance of those companies reporting and not of the industry as a whole.
The number of companies reporting has fluctuated between years. Data are presented on a normalised basis to help control for this effect. Nevertheless, normalised performance indicator results may be influenced by changes in the list of reporting companies as well as changes in mixtures of assets held by the participating companies between years. Differences between years for participating companies may also, in some cases, reflect changes in calculation methodology applied or reporting definitions. Thus, though the coverage of E&P activities is good, changes in results may not necessarily reflect actual changes in performance.
Normalised analyses are only possible when data are available for both the metric to be normalised (emissions, discharges, spills) and the normaliser (hydrocarbon production, produced water). Some of the analyses will cover less than 100% of the total production reported because some companies did not submit data for all metrics covered in the survey. Coverage for the analyses is presented below.
Percentage of reported production included in normalised analyses
AfricaAsia/
Australasia Europe FSUMiddle
EastNorth
AmericaSouth
America All regions
Gas emissions
CO2 96% 99% 100% 100% 90% 100% 100% 97%
CH4 96% 86% 100% 97% 90% 100% 100% 95%
NMVOC 92% 77% 99% 96% 84% 100% 99% 92%
SO2 95% 78% 100% 100% 90% 100% 100% 94%
NOX 95% 79% 100% 100% 90% 100% 100% 94%
Energy consumed 89% 98% 98% 97% 57% 99% 100% 89%
Flaring 99% 97% 98% 96% 100% 96% 99% 98%
Oil discharged in produced water 80% 95% 95% 77% 60% 84% 98% 84%
Oil spills 100% 87% 95% 95% 74% 92% 95% 90%
In 2009, data on the source types of gaseous emissions (e.g. energy, flare, vent, fugitive emissions, and other) were collected for the first time. It was recognised that not all participating companies would be able to contribute data at that level of detail in the beginning; nevertheless, data broken down by source cover roughly half of the gaseous emissions reported for 2009, 2010 and 2011. It is expected that this information will be helpful in understanding some of the trends in the data as well as to help indicate areas for improvement. Data coverage for the breakdown is expected to improve over time.
The current year data shown in this report are based on best available information provided by member companies at time of publication. Data for previous years shown in this report are normally based on data published in previous years’ reports. However, in some cases, corrections provided by member companies have been made to data for previous years when these corrections significantly impact regional or global results.

7
Environmental performance inindicators – 2011 data
©OGP
Releases of gases to the atmosphere are an integral and inevitable part of exploration, production and processing operations. The principal (routine) sources are flaring, venting, turbine and engine operation, fluids processing and fugitive losses (for example from pumps, gas driven valves, flanges and pipes). Non-routine and emergency emissions can arise from well testing, emergency flaring and gas venting.
Gaseous emissions covered in this report are those considered most relevant from process control as well as regulatory perspectives. They are: carbon dioxide (CO2), methane (CH4), non-methane volatile organic compounds (NMVOC), sulphur dioxide (SO2) and nitrogen oxides (NOX), and separately, greenhouse gases (CO2 + CH4 expressed as CO2 equivalent).
Given the wide range of sources of gaseous emissions, it is not practicable (or possible) to measure every single release individually. Industry has, however, developed and updated detailed guidance methodologies to calculate and estimate emissions and losses†. Since companies may use a variety of estimation techniques care must be taken when interpreting aggregated data.
A number of factors affect the quantity of gases emitted from E&P petroleum industry operations. Consequently, understanding the variations in performance in terms of normalised emission ratios is complex. These factors include:
• presence or absence of infrastructure for gas sales• gas-oil ratio• reservoir and field characteristics• use of hydrocarbon recovery techniques• regulatory and contractual aspects• location and logistics• age of the fields
The following sub-sections present the overall emission data for the years 2005 to 2011 and regional emission data for 2009 to 2011.
In 2011, participating OGP member companies reported emissions of:• 289 million tonnes of carbon dioxide (CO2) – equivalent to 133 tonnes of carbon dioxide per thousand
tonnes of hydrocarbon production;• 2.6 million tonnes of methane (CH4) – equivalent to 1.2 tonnes of methane per thousand tonnes of
hydrocarbon production;• 1.0 million tonnes of non-methane volatile organic compounds (NMVOC) – equivalent to 0.5 tonne
of NMVOC per thousand tonnes of hydrocarbon production;• 364 thousand tonnes of sulphur dioxide (SO2) – equivalent to 0.2 tonne of SO2 per thousand tonnes of
hydrocarbon production; and • 864 thousand tonnes of nitrogen oxides (NOX) – equivalent to 0.4 tonne of NOX per thousand tonnes
of hydrocarbon production.
Detailed review: 1 – Gaseous emissions
† See for example: Petroleum Industry Guidelines for Reporting Greenhouse Gas Emissions (2003) Joint IPIECA/API/OGP report, 2003 (in revision); Compendium of Greenhouse Gas Emission Estimation Methodologies for the Oil and Gas Industry, API, 2009;

8
International Association of Oil & Gas Producers
©OGP
Normalised figures for 2011 emissions (see Figure 1) are broadly consistent with data published for activities in 2005-2010.
Figure 1 Emissions per thousand tonnes hydrocarbon production tonnes per thousand tonnes
0.0
0.2
0.4
0.6
0.8
1.0
1.2
201120102009
2008
2007
2006
2005
NOXSO2NMVOCCH4
1.3
0.5
0.2
0.4
0
50
100
150
200
GHGCO2
133
159
† GHG: Total GreenHouse Gases (CO2 + CH4 expressed as CO2 equivalent)
†
Note: As N2O contributes only to a small fraction to greenhouse gas emissions from E&P activities, it has not been included here.

9
Environmental performance inindicators – 2011 data
©OGP
1.1 Carbon Dioxide (CO2)
Emissions of carbon dioxide occur principally from the flaring and combustion of fuels for energy production and are therefore a function of the type and quantity of fuel burned. Carbon dioxide releases may also occur where CO2 is used for enhanced petroleum recovery or where it is stripped from the natural reservoir gases to meet sales specifications.
1.1.1 Emissions per unit of productionGlobal CO2 emissions normalised to hydrocarbon production for 2011 were 133 tonnes of CO2 per thousand tonnes of production, as shown in Figure 1.1.1a.
Regional averages for quantity of carbon dioxide emissions per unit of production vary from 47 to 215 tonnes of carbon dioxide per thousand tonnes of hydrocarbon production, as shown in Figure 1.1.1b. In 2010 the range was between 52 and 206 tonnes per thousand tonnes of production.
1.1.2 Emissions by sourceThe source was specified for 54% of the reported carbon dioxide emissions.
Where the source is specified, 59% of the reported carbon dioxide emissions are from energy use, 36% are from flaring and 5% are attributable to venting, as shown in Figure 1.1.2. In 2010, 58% of the reported carbon dioxide emissions were from energy use, 38% were from flaring and 4% were from venting.
0
30
60
90
120
150
2011201020092008200720062005
132
142 142 142135 133 133
Figure 1.1.1a: CO2 emissions per unit of production tonnes per thousand tonnes of hydrocarbon production
Vents 5%
Flare 36%
Energy 59%
Figure 1.1.2: CO2 emissions by sourceNote: excludes emissions where the source is not specified
0
50
100
150
200
250
300 2011
2010
2009
South America
North America
Middle EastFSUEuropeAsia/Australasia
Africa
215
184
47
75
181
100
136
Overall 133
Figure 1.1.1b: CO2 emissions per unit of production tonnes per thousand tonnes of hydrocarbon production

10
International Association of Oil & Gas Producers
©OGP
1.2 Methane (CH4)
Methane is emitted from sources including process vents, gas-driven pneumatic devices and tank vents. It also escapes as fugitive emissions from process components (valves, flanges, etc.) that carry process streams containing significant quantities of methane. In addition, some methane emissions result from incomplete combustion of hydrocarbons in turbines, engines and flare equipment.
1.2.1 Emissions by unit of productionNormalised CH4 emissions show a 6% increase compared with 2010, as indicated in Figure 1.2.1a
Regional averages for methane emissions expressed per unit of production vary from 0.2 to 2.8 tonnes of methane per thousand tonnes of hydrocarbon production, as shown in Figure 1.2.1b. In 2010 the range was between 0.2 and 2.5 tonnes per thousand tonnes of production.
Emissions intensity for Europe and the Middle East is lower than for other regions. In Europe this is partly due to low levels of flaring and venting in the region as well as to stringent regulatory controls that limit fugitive emissions. In the other regions there are higher rates of natural gas flaring and venting in certain types of production facilities.
1.2.2 Emissions by sourceThe source was specified for 54% of the total methane emissions reported.
Where the source is specified, the largest portion of methane emissions, 32%, is from vents (including venting, vessel loading, tank storage, etc.); 27% is from flaring, 27% is from fugitive losses and 14% is from energy use, as shown in Figure 1.2.2. In 2010, 41% of the reported methane emissions were from venting, 26% were from flaring, 20% were attributable to fugitive losses and 13% were from energy use.
0.0
0.2
0.4
0.6
0.8
1.0
1.2
1.4
2011201020092008200720062005
1.181.25
1.11
1.001.04 1.02
1.14
Figure 1.2.1a: CH4 emissions per unit of production tonnes per thousand tonnes of hydrocarbon production
0.0
0.5
1.0
1.5
2.0
2.5
3.0 20112010
2009
South America
North America
Middle EastFSUEuropeAsia/Australasia
Africa
2.8
0.4
0.6
0.2
2.2
1.5
1.2
Overall 1.3
Figure 1.2.1b: CH4 emissions per unit of production tonnes per thousand tonnes of hydrocarbon production
Vents 32%
Fugitive losses 27%
Flare 27%
Energy 14%
Figure 1.2.2: CH4 emissions by sourceNote: excludes emissions where the source is not specified

11
Environmental performance inindicators – 2011 data
©OGP
1.3 Greenhouse Gas (GHG)
For E&P activities, CO2 and CH4 are the principal contributors to greenhouse gas emissions, with other gases such as N2O playing a minor role. The CO2 and CH4 data presented above are used to calculate an estimate of the GHG emissions for the contributing OGP reporting companies, using the standard conversion to CO2 equivalent (GHG = CO2 + 21 x CH4).
1.3.1 Emissions per unit of productionBased on reported data, the average of 159 tonnes of GHG per thousand tonnes of hydrocarbon production is almost unchanged compared with that seen in previous years (see Figure 1.3.1a)
Regional averages for quantity of greenhouse gas emissions per unit of production vary from 51 to 247 tonnes tonnes of greenhouse gas per thousand tonnes of hydrocarbon production, as shown in Figure 1.3.1b. In 2010 the range was between 55 and 238 tonnes per thousand tonnes of production.
1.3.2 Emissions by sourceThe source was specified for 54% of the total reported greenhouse gas emissions.
Where the source is specified, 51% of the reported greenhouse gas emissions are from energy use, 35% are from flaring, 10% are from venting or vents and 4% are attributable to fugitive losses, as shown in Figure 1.3.2. In 2010, 51% of the reported greenhouse gas emissions were from energy use, 36% were from flaring, 10% were from venting and 3% were attributable to fugitive losses.
† GHG: Total Greenhouse Gases (CO2 + CH4 expressed as CO2 equivalent)
0
30
60
90
120
150
180
2011201020092008200720062005
162156
164 163 159 159158
Figure 1.3.1a: GHG emissions per unit of production tonnes per thousand tonnes of hydrocarbon production
0
50
100
150
200
250
300 2011
2010
2009
SouthAmerica
NorthAmerica
MiddleEast
FSUEuropeAsia/Australasia
Africa
247
243
84
51
227
162
112
Overall 159
Figure 1.3.1b: GHG† emissions per unit of production tonnes per thousand tonnes of hydrocarbon production
Vents 10%
Fugitive losses 4%
Flare 35%
Energy 51%
Figure 1.3.2: GHG emissions by sourceNote: excludes emissions where the source is not specified

12
International Association of Oil & Gas Producers
©OGP
1.4 Non-Methane Volatile Organic Compounds (NMVOCs)
NMVOC emissions mainly occur from non-combustion sources such as venting and fugitive releases (including crude oil loading). In addition, NMVOCs are emitted in the exhaust of combustion equipment and are, therefore, a function of the nature and quantity of fuel burnt, the type of combustion device used and the mode of operation.
1.4.1 Emissions per unit of productionNormalised NMVOC emissions were 0.50 tonnes per thousand tonnes of hydrocarbon, virtually unchanged compared to 2010. See Figure 1.4.1a.
Regional averages for quantity of NMVOC emitted per unit of production vary from 0.18 to 0.86 tonnes per thousand tonnes of hydrocarbon production, as shown in Figure 1.4.1b. In 2010 the range was between 0.06 and 0.81 tonnes per thousand tonnes of production.
1.4.2 Emissions by sourceThe source was specified for 42% of the total NMVOC emissions reported.
Where the source is specified, 46% of NMVOC emissions come from venting or vents, 32% from flaring, 18% from fugitive losses and 4% from energy use, as shown in Figure 1.4.2. In 2010, 45% of the reported NMVOC emissions were from flaring, 37% were from venting, 13% were attributable to fugituve losses and 5% were from energy use.
0.0
0.1
0.2
0.3
0.4
0.5
0.6
0.7
0.8
2011201020092008200720062005
0.50 0.50
0.79
0.700.68
0.58
0.53
Figure 1.4.1a: NMVOC emissions per unit of production tonnes per thousand tonnes of hydrocarbon production
0.0
0.2
0.4
0.6
0.8
1.0
1.2 2011
2010
2009
South America
North America
Middle EastFSUEuropeAsia/Australasia
Africa
0.86
0.22
0.18 0.
25
0.62
0.72
0.61
Overall 0.50
Figure 1.4.1b: NMVOC emissions per unit of production tonnes per thousand tonnes of hydrocarbon production
Vents 46%
Fugitive losses 18%
Flare 32%
Energy 4%
Figure 1.4.2: NMVOC emissions by sourceNote: excludes emissions where the source is not specified

13
Environmental performance inindicators – 2011 data
©OGP
1.5 Sulphur dioxide (SO2)
Sulphur dioxide emissions by the E&P industry arise through oxidation during combustion of sulphur naturally contained within hydrocarbon fuels or flared gas. The rate of emission therefore is principally a reflection of the sulphur content of produced hydrocarbons, which varies widely depending on the nature of the hydrocarbon produced. Flaring of gases from the sulphur removal process represents one of the biggest sources of SO2, together with flaring of associated gas containing H2S.
1.5.1 Emissions per unit of productionNormalised SO2 emissions were 0.17 tonnes per thousand tonnes of hydrocarbon production, virtually unchanged compared with 2010 results. See Figure 1.5.1a.
Regional averages for quantity of SO2 emissions expressed per unit of production vary from 0.03 to 0.54 tonne per thousand tonnes of hydrocarbon production, as shown in Figure 1.5.1b. In 2010 the range was between 0.04 and 0.57 tonne per thousand tonnes of production.
1.5.2 Emissions by sourceThe source was reported for 50% of the total SO2 emissions.
Where the source is specified, the largest percentage of sulphur dioxide emissions, 63%, relate to flaring. 28% were from energy use, 7% were from venting or vents and the remaining 2% were from fugitive losses, as shown in Figure 1.5.2. In 2010, 67% of the reported sulphur dioxide emissions were from flaring, 30% were from energy use and 3% were from venting.
0.00
0.05
0.10
0.15
0.20
0.25
2011201020092008200720062005
0.17 0.17
0.20 0.20
0.18 0.18 0.18
Figure 1.5.1a: SO2 emissions per unit of production tonnes per thousand tonnes of hydrocarbon production
0.0
0.1
0.2
0.3
0.4
0.5
0.6 2011
2010
2009
South America
North America
Middle EastFSUEuropeAsia/Australasia
Africa
0.04
0.24
0.19
0.03
0.54
0.10
0.08
Overall 0.17
Figure 1.5.1b: SO2 emissions per unit of production tonnes per thousand tonnes of hydrocarbon production
Vents 7%
Fugitivelosses 2%
Flare 63%
Energy 28%
Figure 1.5.2: SO2 emissions by sourceNote: excludes emissions where the source is not specified

14
International Association of Oil & Gas Producers
©OGP
1.6 Nitrogen oxides (NOX)
Emissions of nitrogen oxides, (principally nitric oxide and nitrogen dioxide, expressed as NOX), occur almost exclusively from the combustion of natural gas or other fuels. These emissions are a function of the combustion peak temperature, and therefore of the type and operation of combustion device. NOX emissions are frequently estimated rather than measured and consequently they are strongly dependent upon the calculation methodology.
1.6.1 Emissions per unit of productionGlobal NOX emissions normalised to hydrocarbon production for 2011 were 0.41 tonnes per thousand tonnes of production, approximately 3% higher than the 2010 results (see Figure 1.6.1a). Normalised NOX emissions are highest in the North America region, with an average of 0.77 tonne of NOX per thousand tonnes of hydrocarbon production, reflecting the high energy intensity. The Middle East region has the lowest normalised NOX emissions of 0.15 tonne NOX per thousand tonnes of hydrocarbon production, as shown in Figure 1.6.1b. In 2010 the range was between 0.15 and 0.69 tonne per thousand tonnes of production.
1.6.2 Emissions by sourceThe source was reported for 48% of the total nitrogen oxide emissions reported.
Where the source is specified, 93% of nitrogen oxide emissions are from energy use. The remaining 7% are from flaring, as shown in Figure 1.6.2. In 2010, 92% of the reported NOX emissions were from energy use and 8% were from flaring.
0.0
0.1
0.2
0.3
0.4
0.5
2011201020092008200720062005
0.40
0.32
0.38
0.41 0.41 0.410.39
Figure 1.6.1a: NOX emissions per unit of production tonnes per thousand tonnes of hydrocarbon production
0.0
0.1
0.2
0.3
0.4
0.5
0.6
0.7
0.8
0.92011
2010
2009
SouthAmerica
NorthAmerica
MiddleEast
FSUEuropeAsia/Australasia
Africa
0.40
0.47
0.28
0.24
0.15
0.77
0.71
Overall 0.41
Figure 1.6.1b: NOX emissions per unit of production tonnes per thousand tonnes of hydrocarbon production
Flare 7%
Energy 93%
Figure 1.6.2: NOX emissions by sourceNote: excludes emissions where the source is not specified

15
Environmental performance inindicators – 2011 data
©OGP
2 – Energy consumption
The energy used to produce oil and gas covers a range of activities. These include:• driving pumps that produce the hydrocarbons (and any associated produced water);• heating produced oil for separation;• producing steam for enhanced oil recovery;• driving the pumps to re-inject produced water, inject water for water-flooding and transport the
produced oil through pipelines;• powering compressors to re-inject produced gas or to export it through pipelines; and• driving turbines to generate electricity needed for operational activities, including logistics, and for
living quarters (eg at offshore platforms).
Energy consumption will vary widely depending upon the specific local circumstances and operational conditions. For example, mature or remote fields usually consume more energy than other fields.
In 2011, OGP reporting companies consumed on average 1.6 GigaJoules of energy for every tonne of hydrocarbon produced, as shown in Figure 2.1. This is an increase of 7% compared with the 2010 average.
As in previous years, data indicate that onshore production in 2011 was more energy intensive than offshore production.
The majority of energy requirements were met by combustion of fuels on-site rather than by purchase of electricity or steam. No breakdown was specified for 15% of the total; where a breakdown was provided, 95% was derived from on-site combustion and 5% was purchased.
Figure 2.1: Energy consumed per unit of hydrocarbon production GigaJoules per tonne
0.0
0.3
0.6
0.9
1.2
1.5
1.8 Unspecified energy Purchased energy On-site combustion
2011201020092008200720062005200420032002

16
International Association of Oil & Gas Producers
©OGP
In Figure 2.2, the (overall) energy consumption is normalised against the quantity of hydrocarbons produced for each region. This analysis shows that operations in North America were the most energy intensive (3.06 GigaJoules per tonne of hydrocarbon produced), while the Middle East was the least energy intensive (0.78 GigaJoules per tonne)
Figure 2.2: Energy consumption per unit of hydrocarbon production – by region GigaJoules per tonne
0.0
0.5
1.0
1.5
2.0
2.5
3.0
3.52011
2010
2009
South America
North America
Middle EastFSUEuropeAsia/Australasia
Africa
1.33
1.72
1.14
1.11
0.78
3.06
1.69
Overall 1.57

17
Environmental performance inindicators – 2011 data
©OGP
Flaring is the controlled burning of hydrocarbons produced in the course of petroleum exploration and production operations. It includes the controlled and safe burning of gas that, for commercial, safety or technical reasons, is not used or exported.
In 2011, 15.7 tonnes of gas were flared for every thousand tonnes of hydrocarbon produced versus 16.0 in 2010 and 17.6 in 2009, as shown in Figure 3.1.
Figure 3.1: Flaring per unit of hydrocarbon production Tonnes per thousand tonnes
0
5
10
15
20
25
201120102009200820072006
23.9
20.418.8
17.616.0 15.7
Figure 3.2 shows the flaring per unit of hydrocarbon production as reported by the participating companies by region.
Figure 3.2: Flaring per unit of hydrocarbon production – by region Tonnes per thousand tonnes
0
10
20
30
40
50
60 2011
2010
2009
SouthAmerica
NorthAmerica
MiddleEast
FSUEuropeAsia/Australasia
Africa
50.7
17.6
3.6 6.
4
3.4 11
.3
11.7
Overall 15.7
NB: represents either hydrocarbon only or total flare figures as reported by companies. In most cases these two metrics are similar in magnitude.
Intensities are higher in the Africa region where there is limited gas sales infrastructure. Projects in Africa that are increasing the capability to inject gas for reservoir maintenance and to deliver gas to markets have helped reduce flaring from 60.2 tonnes of gas flared for every thousand tonnes of hydrocarbon produced in 2008 to 50.7 in 2011. This reduction is reflected in the overall average as the total hydrocarbon flared in Africa is more than three times the average for all regions.
3 – Flaring

18
International Association of Oil & Gas Producers
©OGP

19
Environmental performance inindicators – 2011 data
©OGP
Produced water is the highest volume liquid discharge generated during the production of oil and gas. It consists of formation water (water present naturally in the reservoir), floodwater (water previously injected into the reservoir) and/or condensed water (in the case of some gas production).
After extraction, produced water is separated and treated (de-oiled) before discharge to surface water (including seas, rivers, lakes, etc.) or to land (including to evaporation ponds). Produced water can also be injected either into the producing reservoir where it can enhance hydrocarbon recovery or into another appropriate formation for disposal. The volume of produced water typically increases as oil and gas fields age. As context, the worldwide volume of produced water reported in this database in 2011 was approximately 1.5 times that of hydrocarbon production.
Discharge of produced water is regulated in most countries. Regulations usually vary between onshore and offshore, and from one country to another. Differences in onshore and offshore regulations reflect differing environmental conditions and sensitivities. For example, salt content and biochemical oxygen demand (BOD) can be important aspects where discharges are to rivers or where these may have an impact on potable aquifers. These factors are less important for offshore discharges where the focus is more on the oil content of produced water. The quality of produced water is most widely expressed in terms of its oil content. There are a number of analytical methodologies in use around the world for measuring oil in water. As a result of differences in analytical methodologies, care should be taken when interpreting aggregated data.
Note: Offshore refers to operations that take place at sea, including inland seas directly connecting to oceans. Operations in bays, in major inland seas, e.g. the Caspian Sea, or in other inland seas directly connected to oceans are counted as offshore. Onshore refers to operations that take place within a landmass, including those on swamps, rivers and lakese e.g. emissions, discharges and energy from crude oil and natural gas terminals are categorised by the source of production and not the location where they occur, i.e. where production is offshore and emissions and/or discharges are generated from an onshore terminal, the emissions and/or discharges are reported as offshore.
Aqueous discharge covers the discharge of produced water, mainly produced formation water.• In 2011, where the location was specified, approximately 88% of water discharged was from offshore
operations and 12% was from onshore operations.• For every tonne of hydrocarbon produced in 2011, 0.5 tonne of produced water was discharged to the
surface and 1.0 tonne of produced water was re-injected. Similarly in 2010, 0.5 tonne of produced water was discharged to the surface and 1.0 tonne was reinjected.
• The overall average oil content in produced water discharges was 12mg/l, compared with 13mg/l in 2010 and 13mg/l in 2009. Offshore the average oil content in produced water was 12mg/l, whilst onshore it was 8mg/l (see Figure 4.1a)
4 – Aqueous Discharges

20
International Association of Oil & Gas Producers
©OGP
4.1 Quality (oil content) of produced water discharges
Figure 4.1a Oil discharged per unit of produced water discharged milligrammes oil per litre of produced water discharged
0
5
10
15
20
252011 2010 2009 2008
2007 2006 2005
OverallOnshoreOffshore
8
12 12
Regional averages for the oil content of produced water discharged vary offshore from 10.3 to 16.4mg/l (Figure 4.1.b) while onshore they vary from 0.3 to 29.7mg/l (Figure 4.1.c).
Figure 4.1b: Oil content of produced water discharged offshore milligrammes oil per litre of produced water discharged (equivalent to tonnes per million tonnes)
0
5
10
15
20
25
302011
2010
2009
SouthAmerica
NorthAmerica
MiddleEast
FSU†EuropeAsia/Australasia
Africa
12.3
11.0
Overall 12.2 11.7
10.3
13.0
0.0
16.4
† FSU quantity produced water offshore is very low (0.05 million tonnes). See Scope of data submissions and Section 4 of Appendix A.

21
Environmental performance inindicators – 2011 data
©OGP
Figure 4.1c: Oil content of produced water discharged onshore milligrammes oil per litre of produced water discharged (equivalent to tonnes per million tonnes)
0
5
10
15
20
25
302011
2010
2009
South America
North America
Middle EastFSUEuropeAsia/Australasia
Africa
3.2
5.5
2.1
0.3
35 29.7
3864 80
1.7
Overall 8.1
108
The regional variations shown in this section, and particularly in Figure 4.1.c, reflect changes in the number of companies reporting oil discharges in produced water in 2011.
4.2 Quantity of oil discharged in produced water per unit of production
Figure 4.2a: Oil discharged per unit of production tonnes per million tonnes of hydrocarbon production
0
3
6
9
12
15 2011 2010 2009 2008
2007 2006 2005
OverallOnshoreOffshore
2
9
6

22
International Association of Oil & Gas Producers
©OGP
Regional averages for the quantity of oil discharged by unit of production of hydrocarbons vary, onshore (see Figure 4.2c), from a few kg per million tonnes to 6.3t/106t in Africa, while offshore (Figure 4.2b) they vary from 0.0t/106t in the FSU to 13.5t/106t in Asia/Australasia.
As noted above, the difference between the overall averages onshore and offshore reflects the fact that produced water is largely reinjected onshore (where environmental sensitivities to produced water – especially salt – are generally high) while the offshore environment is generally less sensitive to produced water discharges.
Figure 4.2b: Oil discharged per unit of production – offshore tonnes per million tonnes of hydrocarbon production
0
5
10
15
20
25
302011
2010
2009
South America
North America
Middle EastFSUEuropeAsia/Australasia
Africa
13.5
Overall 8.8
8.2
9.7
6.5
0.0 0.
7
11.8
Figure 4.2c: Oil discharged per unit of production – onshore tonnes per million tonnes of hydrocarbon production
0
5
10
15
20
25
302011
2010
2009
South America
North America
Middle EastFSUEuropeAsia/Australasia
Africa
0.5
5.8
6.3
0.0
0.1
0.0
2.8
Overall 2.4

23
Environmental performance inindicators – 2011 data
©OGP
4.3 Produced Water Injection
Figure 4.3a: Percentage of produced water re-injected offshore by region expressed as percent total produced water generated offshore
0%
10%
20%
30%
40%
50%
60%
70%
80%
90%
100% 2011
2010
2009
2008
2007
2006
2005
OverallOnshoreOffshore
As stated previously, produced water is often injected back into reservoirs (reinjection) to improve hydrocarbon recovery or into other geological strata for disposal.
Offshore (Figure 4.3b), where de-oiled produced water can be discharged to sea with limited impact in the majority of locations, there is much less reinjection (19% in 2011). Exceptions to this are locations where injection would be beneficial to the management of the reservoir or where environmental sensitivity is considered to be high. In Europe 29% of the offshore produced water was reinjected while in North America no produced water was reinjected.
Onshore, where disposal to surface is often constrained by regulatory and environmental concerns, injection of produced water is the principal disposal route with 90% of water being returned below ground (see Figure 4.3c).
Over the 3 years shown there is a slight increase in the quantity of water re-injected compared to water discharged both onshore and offshore.
Figure 4.3b: Percentage of produced water re-injected offshore by region expressed as percent total produced water generated offshore
0%
10%
20%
30%
40%
50%
60%
70%
80%
90%
100%
Overall South America
North America
Middle EastFSUEuropeAsia/Australasia
Africa
2009
2010
2011

24
International Association of Oil & Gas Producers
©OGP
Figure 4.3c: Percentage of produced water re-injected onshore by region expressed as percent total produced water generated onshore
0%
10%
20%
30%
40%
50%
60%
70%
80%
90%
100%
OverallSouth America
North America
Middle EastFSUEuropeAsia/Australasia
Africa
2008 2009 2010

25
Environmental performance inindicators – 2011 data
©OGP
While most drilling in the offshore oil and gas industry is achieved using water-based drilling fluids (muds), technical challenges often require the use of non-aqueous drilling fluids (NADF) that provide higher lubricity, stability at higher temperatures and well-bore stability compared with water-based muds. These challenges arise especially with techniques such as extended-reach and directional drilling, both of which may be required to develop new reservoirs or to improve recovery from previously identified resources. OGP reports non-aqueous base fluids (NABFs) according to the following classifications†:
Classification Base fluid Aromatic (%) PAH (%)
Group I Diesel and conventional mineral oil >5.0 >0.35
Group II Low toxicity mineral oil 0.5 – 5.0 0.001 – 0.35
Group III Enhanced mineral oil Synthetics (esters, olefins, paraffins)
<0.5 <0.001
In the past, diesel-based and mineral oil-based fluids (Group I fluids) were used to address these technical challenges, but it was recognised that the discharge of cuttings with adhering diesel or oil-based muds might cause adverse environmental impacts. Thus, less harmful low-toxicity mineral oil fluids (Group II) and later more sophisticated drilling fluids (Group III) were developed to deliver high drilling performance while ensuring that any discharges of drilling fluids adhering to cuttings or whole mud posed minimal threat to the marine environment.
Non-aqueous drilling fluids (NADF) contain more than 30% non-aqueous base fluid (NABF) as a continuous phase (typically 50%-80% by volume); the remainder consists of brine, barite and other materials such as gels and emulsifiers. The data gathered for this report relate to NABF adhering to cuttings that are discharged to the marine environment. NADFs as such are not discharged.
5.1 Non-Aqueous Base Fluid retained on cuttings discharged to sea
The following chart, Figure 5.1, provides a regional view of adhered base fluid quantities on cuttings discharged to the sea while drilling with NADFs. It should be noted that information on NABF discharges has been provided by a relatively small number of companies (19 of 41).
Regional analysis shows that, for the companies reporting NABF cuttings and discharges in 2011, cuttings with Group III fluids (24,063 tonnes, 68% of the total reported) were discharged in all regions except Europe and the Middle East, and that discharges of cuttings with Group II fluids (2% of the total reported) took place in Africa (615 tonnes) and Europe (4 tonnes). Discharges reported as “Unspecified” (10,799 tonnes, 24% of the total) occurred in all regions except Europe, the FSU and the Middle East.
Absolute values rather than normalized values are shown in Figure 5.1. Drilling discharges are not normalised because drilling activity is not directly linked to hydrocarbon production. The number of wells that are drilled varies from year to year for various reasons including the prices of oil and natural gas as well as other economic factors. Absolute volumes reported can also vary with the number or mix of companies contributing cuttings-related data between years.
5 – Non-Aqueous Drilling Fluids
† Classification is defined in OGP report “Environmental aspects of the use of non aqueous drilling fluids associated with offshore oil & gas operations”, Report No. 342, May 2003.

26
International Association of Oil & Gas Producers
©OGP
Figure 5.1: Total base fluid (NABF) discharges to sea, by region; 2009–2011 tonnes
4000
0
8000
12000
16000
20000
24000
South AmericaNorth AmericaMiddle EastFSUEuropeAsia/AustralasiaAfrica
1,16
9
842
2 0 0 0128
508
487
4,43
6
2,41
9
2,77
8
3,03
5
2,40
7
1,23
0
1,71
8
4
3,04
0
12,2
03
20,3
69
23,8
76
Unspecified
2009 2010 2011
Group III
Group II
Note: NABF discharges were only reported by 19 companies in 2011; no Group 1 NABF discharges were reported in 2009-2011

27
Environmental performance inindicators – 2011 data
©OGP
Spills are an important environmental performance indicator for the oil & gas industry since they can have a significant and visible impact on the environment. The degree of environmental impact is highly dependent on the nature of the release, where it occurred and how it was subsequently managed. Oil exploration and production companies have spill contingency plans and measures in place to respond to and mitigate spills.
For the purpose of this report a spill is defined as any loss of containment that reaches the environment (i.e. is not retained within secondary or other confinement), irrespective of quantity recovered.
Spills may have a number of causes such as equipment failure (including corrosion), operating errors, sabotage and theft.
The majority of spills reported by OGP member companies are oil spills, which include spills of crude, condensate and processed oil. Chemical spills with release to the external environment occur only infrequently and quantities released are generally small. Relatively few reports of chemical spills have been received and the data for these are presented in Appendix A.
6.1 Oil Spills
In 2011, companies reported a total of 6,996 spills. Of these, 3,961 (57%) were spills of less than one barrel in volume, amounting to a total of 57 tonnes of oil. Because of the small cumulative volume involved and, as some companies do not report spills less than 1 bbl in size, these <1 bbl size spills are not included in the detailed analysis provided below.
In 2011, 3,035 oil spills greater than 1 bbl in size were reported. 84% of the reported oil spills occurred onshore and 7% offshore. The location was not specified for the remaining 9%.
Figure 6.1 shows the total number of spills normalised per unit of hydrocarbon production onshore and offshore. The normalised rate for 2011 was 1.5 spills per million tonnes of production (1.4 in 2010†, 1.5 in 2009). The normalised rate of spills onshore is higher than that offshore.
Figure 6.1: Number of oil spills > 1 bbl per unit of hydrocarbon production spills per million tonnes
0.0
0.5
1.0
1.5
2.0
2.5
3.0
3.5
4.0 2011
2010
2009
2008
2007
2006
2005
OverallOffshoreOnshore
3.5
0.2
1.5
6 – Spills
† The Deepwater Horizon incident was not included in the 2010 report or this report. The Multi-District litigation beginning in 2012 will address the amount of oil spilled.
28
International Association of Oil & Gas Producers
©OGP
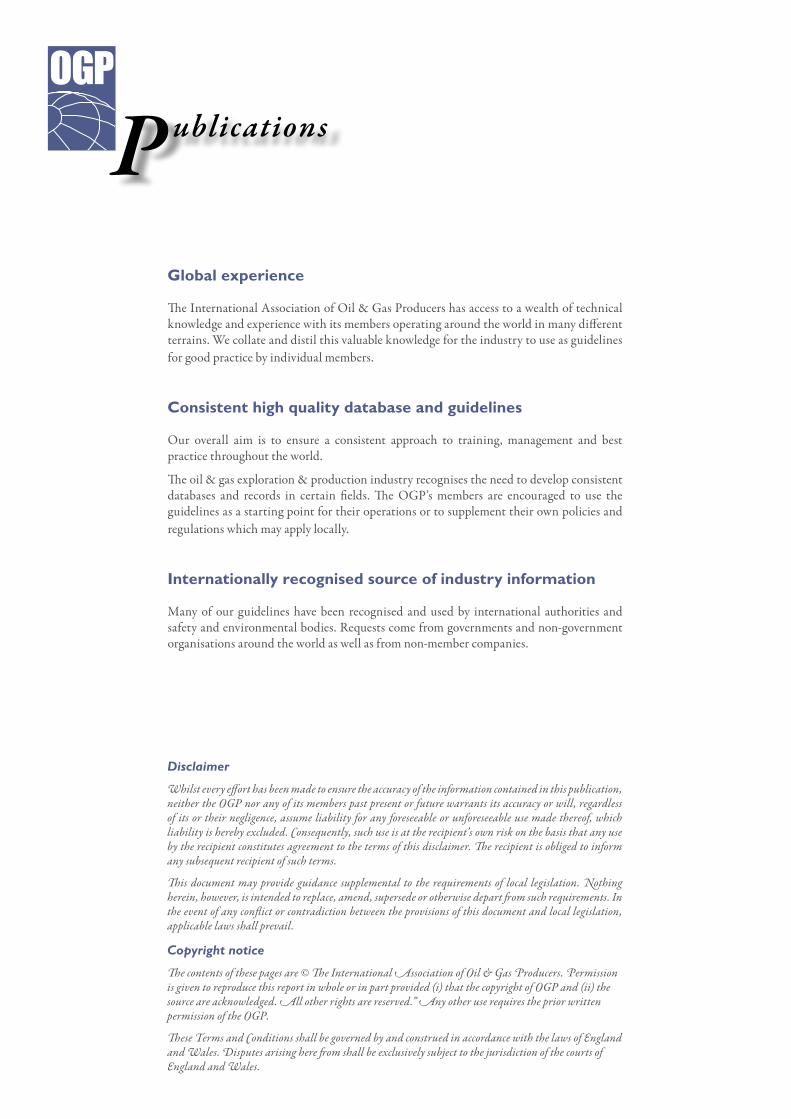
Figure 6.2 shows the number of spills normalised per unit hydrocarbon production by region. Rates for 2011 vary from 0.1 spills per million tonnes of production in the FSU to 9.0 spills per million tonnes of production in South America.
Figure 6.2: Number of oil spills > 1 bbl per unit of hydrocarbon production – by region spills per million tonnes
0
2
4
6
8
102011
2010
2009
South America
North America
Middle EastFSUEuropeAsia/Australasia
Africa
0.2 0.
4
0.1 0.
4
9.0
1.7
1.4
Overall 1.5
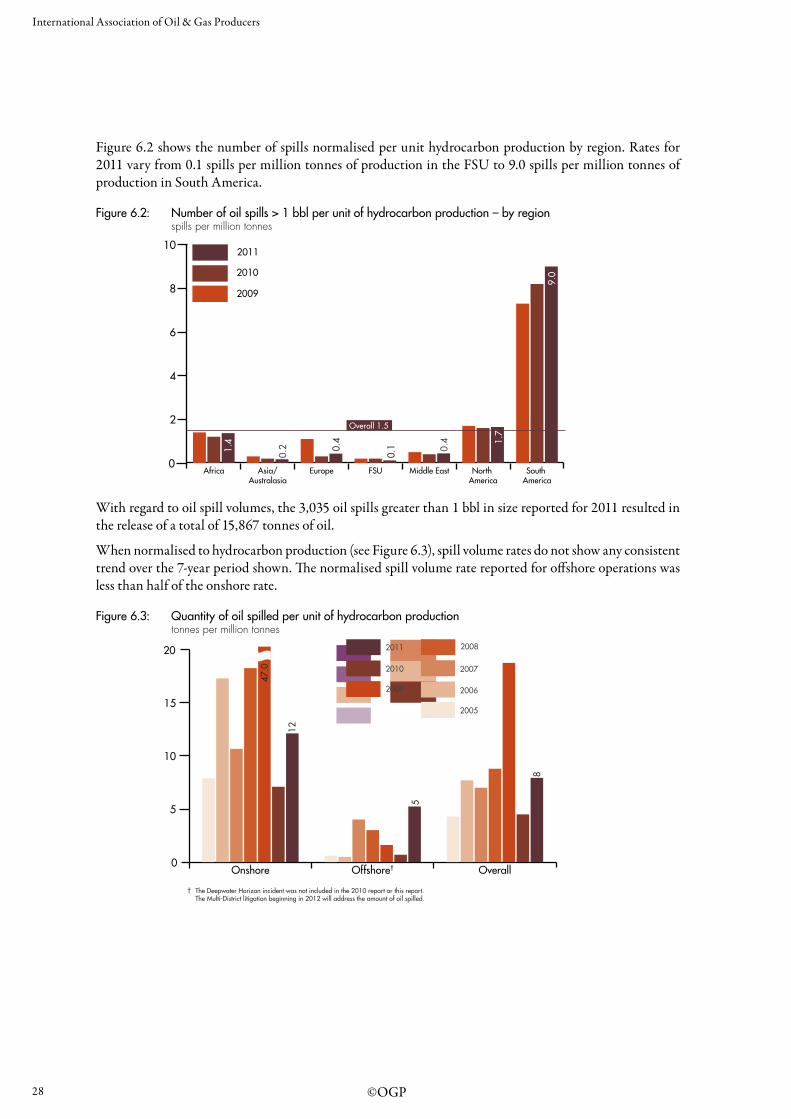
With regard to oil spill volumes, the 3,035 oil spills greater than 1 bbl in size reported for 2011 resulted in the release of a total of 15,867 tonnes of oil.
When normalised to hydrocarbon production (see Figure 6.3), spill volume rates do not show any consistent trend over the 7-year period shown. The normalised spill volume rate reported for offshore operations was less than half of the onshore rate.
Figure 6.3: Quantity of oil spilled per unit of hydrocarbon production tonnes per million tonnes
0
5
10
15
20
OverallOffshore†Onshore
47.0
5
12
8
† The Deepwater Horizon incident was not included in the 2010 report or this report. The Multi-District litigation beginning in 2012 will address the amount of oil spilled.
2007
2006
2005
2011
2010
2009
2008

29
Environmental performance inindicators – 2011 data
©OGP
The quantity of oil spilled per unit of hydrocarbon production by region is shown in Figure 6.4.
Figure 6.4: Quantity of oil spilled (spills > 1 bbl) per unit of hydrocarbon production – by region tonnes per million tonnes
0
10
20
30
40
50
602011
2010
2009
South America
North America
Middle EastFSUEuropeAsia/Australasia
Africa
1.1
0.1
10.3
10.4
4.0
23.8
0.5
Overall 7.9
Figures 6.5 and 6.6 show the reported quantities of oil spilled per unit of hydrocarbon production, onshore and offshore respectively, in the different geographic regions.
Figure 6.5: Quantity of oil spilled (spills > 1 bbl) per unit of hydrocarbon production onshore – by region tonnes per million tonnes
0
20
40
60
80
1002011
2010
2009
South America
North America
Middle EastFSUEuropeAsia/Australasia
Africa
0.4
0.2
31.7
5.3
305
7.6
26.1
12.3
Overall 12.1

30
International Association of Oil & Gas Producers
©OGP
Figure 6.6: Quantity of oil spilled (spills > 1 bbl) per unit of hydrocarbon production offshore – by region tonnes per million tonnes
0
5
10
15
20
252011
2010
2009
South America
North America
Middle EastFSUEuropeAsia/Australasia
Africa
23.6
0.5 0.8
0.0
0.0
0.0
2.4
Overall 5.2
The increase in 2011 in the quantity of oil spilled offshore per unit of production in Africa, as shown in Figure 6.6, is the result of a single oil spill in Nigeria in which 4.8 thousand tonnes of oil were spilled during the transfer of oil from a floating production, storage and offloading vessel to an oil tanker, 120km offshore.
Figure 6.7: Distribution of oil spills onshore and offshore by size number of spills
0
500
1000
1500
2000
2500 Unspecified
Offshore
Onshore
Unspecified> 100 bbl10 < x < 100 bbl1 < x < 10 bbl
num
ber
of s
pills
18427 20 0172076338
2,280
154225
Figure 6.7 shows the distribution of spills larger than 1 barrel in terms of number of spills in each size category. In terms of number of events, the distribution is dominated by the number of spills between 1 and 10 barrels in size. However, the quantity released overall (for those spills where a size category was specified) is dominated by a few relatively large events.
In addition to the data shown in Figure 6.7, a total of 3,961 spills (2,796 onshore, 918 offshore, and 247 unspecified location) of less than 1 barrel in size were reported by participating companies.

31
Environmental performance inindicators – 2011 data
©OGP
Spills greater than 100 barrels in sizeThere were 90 reported spills in which more than 100 barrels of oil was released (63 onshore, 7 offshore, 20 unspecified location).
The cause was reported for 37 of these cases which collectively were associated with 61% of the total oil spilled. 21 of those incidents (9% of the total oil spilled) were caused by equipment failure (excluding corrosion). A further 5 of the oil spills (4% of the total oil spilled) were caused by corrosion and 4 (17% of the total oil spilled) by operator or technical error. 2 of the incidents (1% of the total oil spilled) were caused by third party damage (sabotage, theft, vandalism, etc).
Of the 5 incidents categorised as ‘other’ or ‘unknown’ (30.8% of the total oil spilled), 1 (29.9%) occurred during the offshore transfer of oil from an FPSO to a tanker in Nigeria, 2 (0.6%) were caused by sea bed seepage, 1 (0.3%) by a failure in equipment design specification, and 1 (0.1%) by equipment damage resulting from a tank explosion.
Figure 6.8 shows spill incidents greater than 100 barrels in size by cause as a percentage of the total number of spill incidents >100 bbl in size where the cause was reported.
For the first time in 2010 detailed information has been reported for spills between 10 and 100 barrels in size. 265 spills in this category were reported in total and information on causes was provided for 150 of those incidents (See Figure 6.9).
Unknown3%
Other11%
Third party damage(sabotage, theft, valdalism, etc.)
5%
Operator ortechnical error
11%Equipment failure
(excluding corrosion)57%
Corrosion13%
Figure 6.8: Spills >100bbl in size – by cause as % of spill incidents
Third party damage(sabotage, theft, valdalism, etc.) 8% Other
8%
Operator ortechnical error
12%
Equipment failure(excluding corrosion)
48%
Corrosion24%
Figure 6.9: Spills 10-100bbl in size – by cause as % of spill incidents where cause was indicated
Spills between 10 and 100 barrels in sizeSince 2010, detailed information has been reported for spills between 10 and 100 barrels in size. In 2011, 249 spills in this category were reported in total and information on causes was provided for 120 of those incidents (See Figure 6.9).
In 2010, 265 spills between 10-100 bbl in size were reported and information on causes was provided for 150 of those incidents. 22% of the incidents reported in 2010 were due to Equipment failure, 15% to Equipment failure excluding corrosion, 10% to Operator or technical error, 8% to Sabotage, 7% to Technical operating error, 3% to Third party damage and 1% to Technical operating error – failure to follow procedures. The remaining 17% were categorised as ‘other or unknown’. Note the causal categories have been simplified for 2011 data.

32
International Association of Oil & Gas Producers
©OGP

33
Environmental performance inindicators – 2011 data
©OGP
Appendix A – Data tables
The following tables provide the data from which the figures and charts throughout the report are compiled.
Scope of data submissions
Production associated with database and 2011 production in BP Statistical Review of World Energy – by region
Region Production in this report (106t) BP Review production (106t) Production as % of BP Review production
Equivalent last year
Africa 387 600 64% 61%
Asia/Australasia 355 819 43% 46%
Europe 452 406 111% 107%
FSU 127 1,366 9% 9%
Middle East 411 1,775 23% 22%
North America 295 1,454 20% 23%
South America 194 531 37% 41%
Total 2,221 6,950 32% 33%
NB: Production figures given in this report relate to ‘gross production’ whereas world data extracted from the BP Statistical Review represent ‘net production’. Thus the data are not directly comparable, but the ‘percentage of world production’ figures are given as indicative of the relative regional contributions in the database.
No. of useable company/country data sheets/sets – by region
2011 2010 2009
Region No. of data sheets No. of data sets No. of data sheets No. of data sets No. of data sheets No. of data sets
Africa 57 80 49 61 50 65
Asia/Australasia 54 70 55 68 52 74
Europe 60 77 51 68 56 77
FSU 13 14 10 11 12 14
Middle East 21 26 18 27 17 24
North America 21 30 21 33 23 35
South America 28 36 24 31 27 43
Total 254 333 228 299 237 332
Data sheet: all data for one country for an individual companyData set: a set of data with distinct company, country and location (onshore/offshore/unspecified) where there is a positive return of production, emissions, discharges, energy or spill
data

34
International Association of Oil & Gas Producers
©OGP
Detailed review
1 Gaseous emissions
Gas emissions per unit of hydrocarbon production (Figures 1.1a, 1.2.1a, 1.3.1a, 1.4.1a, 1.5.1a, 1.6.1a)
2011 2010 2009
Emission per 103t production (t/103t)
Hydrocarbon production 106t
Emission per 103t production (t/103t)
Hydrocarbon production 106t
Emission per 103t production (t/103t)
Hydrocarbon production 106t
CO2 133.23 2,161 133.39 2,226 135.22 2,151
CH4 1.25 2,111 1.18 2,176 1.14 2,116
NMVOC 0.50 2,034 0.50 2,087 0.53 2,036
SO2 0.17 2,080 0.17 2,108 0.18 2,058
NOX 0.41 2,084 0.40 2,113 0.39 2,061
†GHG 159.39 158.08 159.19
† GHG: Total greenhouse gases (CO2 + CH4 expressed in CO2 equivalent: GHG = CO2 + 21 x CH4)NB Data only included where gas quantity and production level are both reported
Gross emissions of gases per region
AfricaAsia/
Australasia Europe FSU Middle East North America South America Overall
2011
CO2 (106t) 79.6 64.7 34.3 12.7 17.7 53.3 26.6 288.9
CH4 (103t) 565.2 861.7 186.2 72.2 58.4 648.9 237.7 2,630.3
NMVOC (103t) 305.3 196.7 99.2 21.5 87.7 180.4 120.4 1,011.1
SO2 (103t) 31.6 9.5 16.4 30.4 199.2 57.0 20.4 364.5
NOX (103t) 151.0 130.9 129.0 30.6 55.6 228.6 138.5 864.2
†GHG (106t) 91.5 82.8 38.2 14.2 19.0 67.0 31.6 344.1
2010
CO2 (106t) 83.5 68.5 35.0 10.7 16.1 54.5 29.0 297.4
CH4 (103t) 617.8 823.9 201.1 63.3 50.9 537.9 263.1 2,557.9
NMVOC (103t) 328.3 196.4 126.8 7.7 71.9 188.9 114.5 1,034.5
SO2 (103t) 41.0 13.0 19.2 30.3 176.9 64.5 17.5 362.4
NOX (103t) 152.6 150.0 119.6 26.4 47.0 223.6 141.0 860.2
†GHG (106t) 96.5 85.8 39.3 12.0 17.2 65.8 34.6 351.1
2009
CO2 (106t) 81.3 62.0 34.7 11.2 18.1 51.6 32.4 291.3
CH4 (103t) 521.0 778.2 131.8 80.5 45.5 543.8 316.6 2,417.4
NMVOC (103t) 365.8 168.7 123.4 15.5 72.5 195.7 130.5 1,072.0
SO2 (103t) 43.7 9.9 15.7 26.9 185.9 68.1 19.9 370.1
NOX (103t) 162.6 116.6 121.9 27.1 28.2 226.8 134.0 817.3
†GHG (106t) 92.2 78.3 37.5 12.9 19.1 63.0 39.1 342.1
† GHG: Total greenhouse gases (CO2 + CH4 expressed in CO2 equivalent: GHG = CO2 + 21 x CH4)

35
Environmental performance inindicators – 2011 data
©OGP
Emissions per unit of hydrocarbon production (tonnes per thousand tonnes) – by region (Figures 1.1b, 1.2.1b, 1.3.1b, 1.4.1b, 1.5.1b, 1.6.1b)
AfricaAsia/
Australasia Europe FSU Middle EastNorth
AmericaSouth
America Overall
2011
CO2 emissions (t/103t) 214.71 183.53 74.95 99.95 47.48 180.57 136.11 133.23
Production (106t) 370 351 452 127 371 295 194 2,161
CH4 emissions (t/103t) 1.53 2.81 0.41 0.59 0.16 2.20 1.22 1.25
Production (106t) 370 307 451 123 371 295 194 2,111
NMVOC emissions (t/103t) 0.86 0.72 0.22 0.18 0.25 0.61 0.62 0.50
Production (106t) 356 274 448 122 347 295 193 2,034
SO2 emissions (t/103t) 0.08 0.03 0.04 0.24 0.54 0.19 0.10 0.17
Production (106t) 366 277 452 126 371 295 194 2,081
NOX emissions (t/103t) 0.40 0.47 0.28 0.24 0.15 0.77 0.71 0.41
Production (106t) 366 280 452 126 371 295 194 2,084
†GHG emissions (t/103t) 246.84 242.54 83.56 112.34 50.84 226.77 161.73 159.40
2010
CO2 emissions (t/103t) 205.98 177.24 73.67 88.78 51.76 165.88 143.51 133.39
Production (106t) 405 386 474 120 310 328 202 2,226
CH4 emissions (t/103t) 1.53 2.45 0.42 0.53 0.16 1.64 1.30 1.18
Production (106t) 405 336 474 120 310 328 202 2,176
NMVOC emissions (t/103t) 0.81 0.71 0.27 0.06 0.25 0.59 0.57 0.50
Production (106t) 404 279 474 120 287 322 202 2,087
SO2 emissions (t/103t) 0.10 0.05 0.04 0.25 0.57 0.20 0.09 0.17
Production (106t) 404 276 474 120 310 322 201 2,108
NOX emissions (t/103t) 0.37 0.53 0.25 0.22 0.15 0.69 0.69 0.40
Production (106t) 404 281 474 120 310 322 202 2,113
†GHG emissions (t/103t) 238.11 228.69 82.49 99.91 55.12 200.32 170.81 158.08
2009
CO2 emissions (t/103t) 214.88 190.37 73.29 85.68 53.69 161.97 169.66 135.22
Production (106t) 378 325 473 131 335 318 191 2,151
CH4 emissions (t/103t) 1.38 2.66 0.28 0.62 0.13 1.71 1.66 1.14
Production (106t) 378 292 473 129 335 318 191 2,116
NMVOC emissions (t/103t) 1.00 0.66 0.26 0.12 0.24 0.63 0.68 0.53
Production (106t) 367 257 473 131 307 310 191 2,036
SO2 emissions (t/103t) 0.12 0.04 0.03 0.21 0.56 0.22 0.10 0.18
Production (106t) 367 255 473 131 331 310 191 2,058
NOX emissions (t/103t) 0.43 0.45 0.26 0.21 0.08 0.73 0.70 0.39
Production (106t) 367 258 473 131 331 310 191 2,061
†GHG emissions (t/103t) 243.86 246.23 79.17 98.70 56.42 197.88 204.52 159.19
† GHG: Total greenhouse gases (CO2 + CH4 expressed in CO2 equivalent: GHG = CO2 + 21 x CH4)NB Data only included where gas quantity and production level are both reported

36
International Association of Oil & Gas Producers
©OGP
Gas emissions by source‡ (Figures 1.1.2a, 1.2.2a, 1.3.2a, 1.4.2a, 1.5.2a, 1.6.2a)
Energy Flare Fugitive losses Vents Other/unspecified E&P
Overall
2011
CO2 (106t) 92.07 57.07 0.03 8.09 131.60 288.85
CH4 (103t) 192.44 384.45 384.90 462.56 1,205.95 2,630.30
NMVOC (103t) 15.84 138.42 76.02 197.36 583.50 1,011.13
SO2 (103t) 50.54 115.59 4.70 12.28 181.35 364.46
NOX (103t) 388.14 29.94 0.00 0.16 445.96 864.20
†GHG (106t) 96.11 65.15 8.11 17.81 156.92 344.09
2010
CO2 (106t) 95.64 63.83 0.15 6.47 131.27 297.37
CH4 (103t) 190.45 375.56 280.52 590.00 1,121.40 2,557.93
NMVOC (103t) 19.43 183.50 55.27 153.21 623.13 1,034.53
SO2 (103t) 49.77 110.51 0.02 4.10 197.97 362.37
NOX (103t) 387.16 32.13 0.03 1.09 439.82 860.22
†GHG (106t) 99.64 71.72 6.04 18.86 154.82 351.08
2009
CO2 (106t) 74.48 62.77 0.03 4.24 149.82 291.34
CH4 (103t) 53.34 400.30 229.17 544.54 1,190.96 2,417.41
NMVOC (103t) 22.98 191.45 42.28 240.84 574.43 1,071.99
SO2 (103t) 45.92 123.31 0.00 14.47 186.43 370.13
NOX (103t) 350.02 38.28 0.00 0.15 428.81 817.26
†GHG (106t) 75.60 71.17 4.84 15.68 174.81 342.11
‡ Emissions were categorised by source for the first time in the 2009 database. Emissions are no longer categorised by activity.
Gas emissions in production activities per unit of hydrocarbon production (tonnes per thousand tonnes) – onshore and offshore
CO2 CH4 NMVOC SO2 NOX GHG†
Onshore Offshore Onshore Offshore Onshore Offshore Onshore Offshore Onshore Offshore Onshore Offshore
2011
Emissions (t/103t) 154.34 120.27 1.60 1.07 0.65 0.45 0.32 0.10 0.52 0.35 187.73 141.96
Production (106t) 771 1,187 766 1,142 734 1,097 765 1,113 768 1,113 771 1,187
2010
Emissions (t/103t) 134.00 125.00 1.20 1.13 0.61 0.45 0.27 0.11 0.46 0.34 159.16 147.83
Production (106t) 835 1,211 832 1,164 802 1,106 822 1,106 828 1,106 835 1,211
2009
Emissions (t/103t) 139.53 125.71 1.29 1.02 0.67 0.46 0.29 0.12 0.45 0.33 166.64 146.47
Production (106t) 753 1,217 751 1,185 715 1,141 737 1,141 740 1,141 753 1,217
NB Data only included where gas quantities in production activities and production levels are both reported† GHG: Total greenhouse gases (CO2 + CH4 expressed in CO2 equivalent: GHG = CO2 + 21 x CH4)

37
Environmental performance inindicators – 2011 data
©OGP
2 Energy Consumption
Energy consumption per unit of hydrocarbon production (Figure 2.1)
2011 2010 2009 2008 2007
% Onsite combustion 80 80 80 79 78
% Purchased 4 5 5 4 5
% Unspecified 15 16 16 17 18
Total energy consumption (GJ/t) 1.57 1.47 1.48 1.40 1.47
Production (106t) 1,982 2,092 2,151 2,049 1,899
NB Data only included where energy consumption and production level are both reported.
Gross energy consumption (million GigaJoule) – by region
Onsite Purchased Unspecified Total
2011
Africa 355.47 16.24 88.52 460.24
Asia/Australasia 398.98 9.08 192.89 600.95
Europe 473.14 30.2 7.82 511.16
FSU 91.89 0.92 43.82 136.63
Middle East 154.33 12.06 15.96 182.35
North America 729.34 54.35 116.22 899.91
South America 308.26 10.17 11.42 329.85
2010
Africa 366.88 15.14 84.64 466.66
Asia/Australasia 360.04 9.67 190.24 559.94
Europe 475.16 27.58 8.26 511.01
FSU 90.15 1.56 42.26 133.96
Middle East 83.48 8.35 16.78 108.62
North America 749.8 75.3 122.7 947.8
South America 337.55 9.84 9.14 356.53
2009
Africa 333.53 14.91 80.32 428.75
Asia/Australasia 287.7 8.12 223.28 519.10
Europe 490.5 27.17 7.35 525.03
FSU 97.85 2.97 37.63 138.45
Middle East 302.31 12.39 17.93 332.63
North America 719.63 67.47 127.99 915.08
South America 306.79 9.67 6.49 322.96

38
International Association of Oil & Gas Producers
©OGP
Energy consumption per unit of hydrocarbon production (GigaJoules per tonne) – by region
AfricaAsia/
Australasia Europe FSU Middle EastNorth
AmericaSouth
America Overall
2011
% Onsite combustion 77.2 66.4 92.5 67.3 84.6 81.1 93.4 80.4
% Purchased 3.53 1.51 5.98 0.67 6.61 6.04 3.10 4.27
% Unspecified 19.26 32.11 1.55 32.07 8.78 12.91 3.48 15.32
Total energy consumption (GJ/t) 1.33 1.72 1.14 1.11 0.78 3.06 1.69 1.57
Production (106t) 345 350 444 123 233 294 194 1,982
2010
% Onsite combustion 78.6 64.2 93.0 67.3 76.8 79.1 94.7 79.8
% Purchased 3.25 1.73 5.41 1.16 7.68 7.95 2.77 4.79
% Unspecified 18.20 34.09 1.62 31.55 15.51 12.95 2.57 15.40
Total energy consumption (GJ/t) 1.16 1.45 1.08 1.11 0.60 2.89 1.76 1.47
Production (106t) 401 386 473 120 181 328 202 2,092
2009
% Onsite combustion 77.7 55.4 93.4 70.7 90.9 78.6 95.0 79.7
% Purchased 3.49 1.56 5.18 2.14 3.72 7.38 3.00 4.49
% Unspecified 18.82 43.06 1.40 27.18 5.41 13.99 2.02 15.78
Total energy consumption (GJ/t) 1.13 1.59 1.12 1.06 1.00 2.81 1.69 1.48
Production (106t) 378 326 468 131 333 326 190 2,151
NB Data only included where energy and production level are both reported. Production is the total HC production for data sets where one of onsite, purchased or unspecified energy is reported.
Energy consumption per unit of hydrocarbon production (GigaJoules per tonne) – onshore and offshore
2011 2010 2009
Onshore (GJ/t) 2.24 2.07 2.21
Offshore (GJ/t) 1.27 1.10 1.02
Unspecified (GJ/t) 1.30 1.65 1.47
Overall (GJ/t) 1.57 1.47 1.48
NB Data only included where energy and production levels are both reported

39
Environmental performance inindicators – 2011 data
©OGP
3 Flaring
Hydrocarbon flared per unit of production (tonnes per thousand tonnes)
2011 2010 2009 2008 2007 2006
Hydrocarbon flared t/103 tonnes 15.73 16.02 17.59 18.75 20.44 23.90
Production 106 tonnes 2,176 2,235 2,327 2,080 2,041 1,735
Flaring per unit of hydrocarbon production (tonnes per thousand tonnes) – by region
AfricaAsia/
Australasia Europe FSU Middle EastNorth
AmericaSouth
America Overall
2011
Total flared (t/103t) 50.73 17.56 3.64 11.69 6.43 3.42 11.29 15.73
Production (106t) 382 345 443 121 410 283 193 2,176
2010
Total flared (t/103t) 52.93 15.11 3.96 7.51 8.50 2.26 13.01 16.02
Production (106t) 400 366 471 119 352 326 202 2,235
2009
Total flared (t/103t) 56.54 23.20 3.59 7.60 9.51 2.26 19.95 17.59
Production (106t) 377 325 471 131 507 325 191 2,327
NB Data only included where flaring and production levels are both reported
4 Aqueous discharges
Oil discharged per unit of produced water discharged (milligrammes oil per litre of produced water discharged) (Figure 4.1a)
2011 2010 2009 2008 2007 2006 2005
Onshore 8.12 14.28 11.61 12.80 17.49 7.71 10.33
Offshore 12.22 12.85 13.64 14.84 15.48 17.47 21.48
Unspecified 14.56 14.60 12.98 21.64 18.84 24.86 20.52
Overall 11.85 13.15 13.34 14.77 15.84 16.40 19.87
NB Data only included where oil in produced water and produced water quantity are both reported

40
International Association of Oil & Gas Producers
©OGP
Oil content of produced water discharged (Figures 4.1b, 4.1c)
AfricaAsia/
Australasia Europe FSU Middle EastNorth
AmericaSouth
America Overall
2011
Onshore
Oil discharged (t/106t) 3.17 5.52 2.06 1.68 80.08 29.70 0.34 8.12
PW discharged (106t) 1.58 73.63 4.62 1.19 0.02 13.23 6.74 101.01
Offshore
Oil discharged (t/106t) 16.39 12.27 11.00 0.00 11.72 13.02 10.32 12.22
PW discharged (106t) 106.94 280.06 222.23 0.05 8.12 31.98 108.27 757.65
Unspecified
Oil discharged (t/106t) 9.86 12.45 0.00 no data no data 33.19 no data 14.56
Production (106t) 26.18 1.20 0.21 0.00 0.00 6.92 0.00 34.51
Overall
Oil discharged (t/106t) 14.97 10.87 10.81 1.62 11.93 19.93 9.73 11.85
PW discharged (106t) 134.69 354.90 227.06 1.24 8.14 52.13 115.00 893.17
Total PW (106t) 297 297 341 97 245 235 186 1,699
2010
Onshore
Oil discharged (t/106t) 26.56 7.72 1.60 28.83 10.43 34.87 2.08 14.28
PW discharged (106t) 16.29 90.23 4.57 0.16 0.20 22.15 0.61 134.21
Offshore
Oil discharged (t/106t) 16.31 12.87 11.72 0.00 16.23 11.88 11.96 12.85
PW discharged (106t) 117.73 294.37 269.79 0.02 6.54 33.67 112.36 834.47
Unspecified
Oil discharged (t/106t) 13.61 15.87 0.00 no data no data 14.33 no data 14.60
Production (106t) 27.63 28.54 0.39 0.00 0.00 12.12 no data 68.69
Overall
Oil discharged (t/106t) 16.88 11.95 11.54 24.68 16.06 19.81 11.90 13.15
PW discharged (106t) 161.66 413.14 274.75 0.18 6.74 67.94 112.96 1,037.37
Total PW (106t) 392 376 458 111 191 307 201 2,036
2009
Onshore
Oil discharged (t/106t) 18.73 5.38 1.17 107.69 63.85 37.70 0.31 11.61
PW discharged (106t) 17.48 92.43 5.05 0.06 0.31 18.80 0.65 134.79
Offshore
Oil discharged (t/106t) 16.88 14.65 11.75 17.57 22.58 10.51 12.80 13.64
PW discharged (106t) 109.36 301.29 280.33 0.23 7.27 34.25 106.28 839.02
Unspecified
Oil discharged (t/106t) 14.75 3.55 3.35 0.00 no data 10.14 no data 12.98
Production (106t) 27.42 0.38 0.35 0.06 no data 14.31 0.00 42.52
Overall
Oil discharged (t/106t) 16.71 12.47 11.55 30.05 24.26 18.02 12.72 13.34
PW discharged (106t) 154.27 394.10 285.74 0.35 7.58 67.37 106.93 1,016.33
Total PW (106t) 339 314 439 106 224 301 190 1,912
NB Data only included where oil discharges and produced water discharges are both reported† Business Units record all oil in produced water discharged to unlined evaporation ponds as being discharged to surface water

41
Environmental performance inindicators – 2011 data
©OGP
Oil discharged per unit of hydrocarbon production (Figure 4.2a)
2011 2010 2009 2008 2007 2006 2005
Onshore 2.41 3.16 3.02 3.62 5.65 2.04 2.1
Offshore 8.79 9.14 10.17 11.08 12.18 13.43 13.83
Overall 6.47 6.99 7.48 8.54 9.77 9.64 9.22
Oil discharged per unit of hydrocarbon production (Figures 4.2b, 4.2c)
AfricaAsia/
Australasia Europe FSU Middle EastNorth
AmericaSouth
America Overall
2011
Onshore
Oil discharged (t/106t) 6.27 5.76 0.45 0.05 0.02 2.78 0.04 2.41
Production (106t) 65 71 21 44 114 141 50 506
Offshore
Oil discharged (t/106t) 9.69 13.54 8.18 0.00 0.71 6.45 11.81 8.79
Production (106t) 187 258 342 43 134 65 141 1,169
Unspecified
Oil discharged (t/106t) 4.35 1.82 0.02 0.00 no data 6.62 no data 2.97
Production (106t) 59 8 68 10 no data 43 no data 189
Overall
Oil discharged (t/106t) 7.96 11.63 6.51 0.02 0.39 4.40 8.72 6.47
Production (106t) 311 337 431 97 248 249 191 1,865
2010
Onshore
Oil discharged (t/106t) 6.23 9.41 0.09 0.09 0.02 4.35 0.03 3.16
Production (106t) 69 74 80 52 111 177 43 607
Offshore
Oil discharged (t/106t) 7.87 14.20 8.62 0.00 2.06 7.58 9.49 9.14
Production (106t) 244 267 367 50 51 53 142 1,173
Unspecified
Oil discharged (t/106t) 4.78 19.07 0.00 0.00 no data 3.62 no data 5.87
Production (106t) 79 24 11 9 no data 48 no data 171
Overall
Oil discharged (t/106t) 6.96 13.55 6.92 0.04 0.67 4.84 7.27 6.99
Production (106t) 392 364 458 111 162 278 185 1,951
2009
Onshore
Oil discharged (t/106t) 7.64 7.67 0.10 0.14 0.19 4.50 0.00 3.02
Production (106t) 43 65 59 46 103 158 44 518
Offshore
Oil discharged (t/106t) 8.45 18.60 8.96 0.08 3.09 5.41 10.51 10.17
Production (106t) 218 237 368 53 53 67 129 1,126
Unspecified
Oil discharged (t/106t) 5.23 0.12 0.10 0.00 no data 2.94 0.00 3.25
Production (106t) 77 11 12 20 no data 49 1 170
Overall
Oil discharged (t/106t) 7.61 15.70 7.53 0.09 1.18 4.44 7.78 7.48
Production (106t) 339 313 439 119 156 273 175 1,814
NB Data only included where oil discharges and production level are both reported

42
International Association of Oil & Gas Producers
©OGP
Percent of produced water re-injected overall (expressed as percent total produced water generated) (Figure 4.3a)
2011 2010 2009 2008 2007 2006 2005
Onshore 90 90 89 88 89 90 89
Offshore 23 22 18 17 16 19 10
Overall 65 65 63 63 64 61 62
Percent of produced water reinjected overall (tonnes per tonne) (Figures 4.3b, 4.3c)
AfricaAsia/
Australasia Europe FSU Middle EastNorth
AmericaSouth
America Overall
2011
Onshore 84 87 94 65 81 95 97 90
Offshore 19 14 29 97 84 0 12 23
2010
Onshore 90 87 94 88 85 93 100 90
Offshore 10 17 31 98 82 3 5 22
2009
Onshore 75 86 94 87 76 94 100 89
Offshore 5 14 25 57 78 11 4 18

43
Environmental performance inindicators – 2011 data
©OGP
Ratio of produced water reinjected to produced water discharged (tonnes per tonne) – by region
AfricaAsia/
Australasia Europe FSU Middle EastNorth
AmericaSouth
America Overall
2011
Onshore
PW reinjected (t/t) 5.09 6.73 14.54 1.84 4.38 18.33 38.32 8.54
Offshore
PW reinjected (t/t) 0.24 0.16 0.40 32.37 5.41 0.00 0.14 0.30
Unspecified
PW reinjected (t/t) 0.51 6.29 6.55 no data no data no data no data 0.72
Overall
PW reinjected (t/t) 0.36 1.73 0.78 2.71 4.53 6.03 2.38 1.84
2010
Onshore
PW reinjected (t/t) 8.80 6.43 15.19 7.27 5.66 13.57 374.04 8.80
Offshore
PW reinjected (t/t) 0.12 0.21 0.45 50.91 4.54 0.03 0.05 0.28
Unspecified
PW reinjected (t/t) 0.54 3.07 4.33 42.13 no data 0.64 no data 0.71
Overall
PW reinjected (t/t) 0.56 1.84 0.76 13.42 5.51 5.86 2.05 1.89
2009
Onshore
PW reinjected (t/t) 3.02 6.37 14.59 6.77 3.17 15.21 326.83 7.70
Offshore
PW reinjected (t/t) 0.05 0.16 0.34 1.32 3.63 0.12 0.04 0.22
Unspecified
PW reinjected (t/t) 0.33 10.91 5.07 13.26 no data 0.16 no data 0.69
Overall
PW reinjected (t/t) 0.49 1.90 0.65 6.29 3.24 5.41 2.11 1.67
NB Data only included where quantities of both reinjected and produced water are reported

44
International Association of Oil & Gas Producers
©OGP
Produced water reinjected per unit of hydrocarbon production (tonnes per tonne) – by region
AfricaAsia/
Australasia Europe FSU Middle EastNorth
America South America Overall
2011
Onshore
Produced water (t/t) 0.51 6.57 4.73 0.07 0.82 1.80 5.06 2.13
Production (106t) 19.46 75.65 17.32 46.00 271.43 150.05 51.08 630.99
Offshore
Produced water (t/t) 0.19 0.25 0.25 0.04 0.33 0.00 0.12 0.21
Production (106t) 108.26 155.02 289.92 42.99 133.87 41.35 127.80 899.20
Unspecified
Produced water (t/t) 0.22 0.39 0.36 0.01 no data no data no data 0.23
Production (106t) 43.31 7.19 13.12 9.70 no data no data no data 73.32
Overall
Produced water (t/t) 0.23 2.26 0.50 0.05 0.66 1.41 1.53 0.97
Production (106t) 171.03 237.86 320.36 98.69 405.30 191.39 178.88 1,603.52
2010
Onshore
Produced water (t/t) 1.71 7.11 1.07 0.03 0.98 1.64 4.62 2.08
Production (106t) 25.59 81.80 75.06 52.71 260.72 194.05 60.19 750.11
Offshore
Produced water (t/t) 0.06 0.30 0.29 0.02 0.48 0.02 0.04 0.21
Production (106t) 157.57 182.44 329.62 49.53 80.26 37.16 141.02 977.60
Unspecified
Produced water (t/t) 0.19 0.34 0.15 0.01 no data 0.09 no data 0.16
Production (106t) 60.45 8.28 11.33 9.15 no data 24.30 no data 113.52
Overall
Produced water (t/t) 0.27 2.35 0.43 0.03 0.86 1.26 1.41 0.97
Production (106t) 243.60 272.51 416.01 111.39 340.98 255.51 201.21 1,841.22
2009
Onshore
Produced water (t/t) 1.21 8.51 1.36 0.21 0.48 1.76 4.38 2.00
Production (106t) 45.75 69.18 62.09 48.11 255.02 172.69 58.82 711.66
Offshore
Produced water (t/t) 0.03 0.30 0.23 0.01 0.30 0.07 0.04 0.17
Production (106t) 136.03 125.25 341.87 53.22 120.53 50.85 121.57 949.32
Unspecified
Produced water (t/t) 0.12 0.43 0.15 0.04 no data 0.04 8.86 0.17
Production (106t) 77.37 6.82 11.87 19.52 no data 30.75 1.00 147.33
Overall
Produced water (t/t) 0.27 3.13 0.40 0.09 0.42 1.21 1.49 0.89
Production (106t) 259.16 201.25 415.83 120.86 375.55 254.28 181.39 1,808.31
NB Data only included where quantities of both produced water reinjected and production are reported

45
Environmental performance inindicators – 2011 data
©OGP
Total oil discharged (discharges + spills) per unit of hydrocarbon production
2011 2010 2009
Total oil discharged per 106t production
(t/106t)
Hydrocarbon production 106t
Total oil discharged per 106t production
(t/106t)
Hydrocarbon production 106t
Total oil discharged per 106t production
(t/106t)
Hydrocarbon production 106t
Onshore 18 479 12 593 70 515
Offshore 15 1,030 10 1,112 12 1,091
Unspecified 10 186 26 157 22 168
Overall 15 1,694 12 1,862 30 1,774
NB For onshore, offshore and overall results data are only included where oil in produced water and spills are reported as well as production levels for the dataset.
5 Non-Aqueous Drilling Fluids
Total base fluid (NABF) retained on cuttings discharged to sea – by region (tonnes) (Figure 5.1)
AfricaAsia/
Australasia Europe FSU Middle East North America South America Overall
2011
Group I 0 0 0 0 0 0 0 0
Group II 615 0 4 0 0 0 0 619
Group III 2,388 13,727 0 4,436 0 1,595 1,917 34,349
Unspecified 37 10,149 0 0 0 123 490 10,799
Total 3,040 23,876 4 4,436 0 1,718 2,407 45,767
2010
Group I 0 0 0 0 0 0 0 0
Group II 352 0 1 0 0 0 0 353
Group III 417 17,867 127 0 0 1,088 2,075 21,574
Unspecified 73 2,502 0 487 0 142 960 4,164
Total 842 20,369 128 487 0 1,230 3,035 26,091
2009
Group I 0 0 0 0 0 0 0 0
Group II 587 0 1 0 0 0 0 588
Group III 582 12,203 1 508 0 2,419 2,778 18,491
Unspecified 0 0 0 0 0 0 0 0
Total 1,169 12,203 2 508 0 2,419 2,778 19,079

46
International Association of Oil & Gas Producers
©OGP
6 Spills
Number of oils spills per million tonnes hydrocarbon production (Figure 6.1)
2011 2010 2009 2008 2007 2006 2005
Onshore
Spills (t/106t) 3.46 3.10 3.47 3.31 3.37 3.48 3.12
Production (106t) 736 798 747 747 742 778 808
Offshore
Spills (t/106t) 0.19 0.13 0.21 0.16 0.21 0.39 0.21
Production (106t) 1,072 1,174 1,193 1,203 1,042 1,075 1,044
Unspecified
Spills (t/106t) 1.39 1.99 1.75 2.40 2.41 4.35 2.82
Production (106t) 199 166 178 126 129 118 201
Overall
Spills (t/106t) 1.51 1.38 1.49 1.43 1.59 1.85 1.61
Production (106t) 2,006 2,139 2,117 2,075 1,913 1,971 2,053
NB: Excludes spills <1bbl in size
Quantity of oil spilt per unit of hydrocarbon production
2011 2010 2009
Oil spilt per 106t production (t/106t)
Hydrocarbon production 106t
Oil spilt per 106t production (t/106t)
Hydrocarbon production 106t
Oil spilt per 106t production (t/106t)
Hydrocarbon production 106t
Onshore 12.13 735 7.16 798 47.0 746
Offshore 5.24 1,071 0.69 1,174 1.6 1,192
Unspecified 6.96 198 18.57 166 17.2 177
Overall 7.94 2,006 4.49 2,138 18.9 2,117
NB Data only included where quantity of oil spilt and production level are both reported. Excludes spills <1bbl in size
Number of oil spills and quantity of oil spilt – by region (Figures 6.2, 6.4)
AfricaAsia/
Australasia Europe FSU Middle EastNorth
America South America Overall
2011
Quantity spilt (t/106t) 23.78 0.45 1.08 0.11 10.28 3.95 10.40 7.94
Spills per 106t 1.37 0.17 0.43 0.12 0.44 1.65 9.00 1.51
Production (106t) 386 309 430 121 304 271 184 2,006
2010
Quantity spilt (t/106t) 17.27 1.57 0.70 0.58 0.62 2.67 4.04 4.49
Spills per 106t 1.25 0.24 0.33 0.19 0.35 1.63 8.17 1.38
Production (106t) 398 334 461 111 329 313 194 2,139
2009
Quantity spilt (t/106t) 56.49 0.58 0.67 1.06 49.95 2.91 3.06 18.92
Spills per 106t 1.44 0.28 1.07 0.17 0.52 1.68 7.26 1.49
Production (106t) 356 308 461 129 356 326 180 2,117
NB: Excludes spills <1bbl in size

47
Environmental performance inindicators – 2011 data
©OGP
Quantity of oil spilled onshore and offshore per unit of hydrocarbon production – by region (Figure 6.3)
AfricaAsia/
Australasia Europe FSU Middle East North America South America Overall
2011
Onshore
Spills (t/106t) 26.13 0.42 7.59 0.23 12.32 5.29 31.70 12.13
Production (106t) 117 56 25 58 254 176 50 736
Offshore
Spills (t/106t) 23.60 0.46 0.76 0.00 0.02 0.03 2.44 5.24
Production (106t) 208 248 336 43 50 52 134 1,072
Unspecified
Spills (t/106t) 19.89 0.27 0.30 0.01 no data 3.27 no data 6.96
Production (106t) 61 4 70 20 no data 43 no data 199
Overall
Spills (t/106t) 23.78 0.45 1.08 0.11 10.28 3.95 10.40 7.94
Production (106t) 386 309 430 121 304 271 184 2,006
2010
Onshore
Spills (t/106t) 53.11 4.86 1.39 0.52 0.79 3.40 12.86 7.16
Production (106t) 66 84 75 53 248 214 59 798
Offshore
Spills (t/106t) 1.63 0.48 0.57 0.72 0.09 0.10 0.15 0.69
Production (106t) 253 231 375 50 80 51 134 1,174
Unspecified
Spills (t/106t) 37.76 0.31 0.74 0.24 no data 2.13 no data 18.57
Production (106t) 79 19 11 9 no data 48 no data 166
Overall
Spills (t/106t) 17.27 1.57 0.70 0.58 0.62 2.67 4.04 4.49
Production (106t) 398 334 461 111 329 313 194 2,139
2009
Onshore
Spills (t/106t) 304.69 0.96 1.45 0.48 75.37 3.71 9.35 46.98
Production (106t) 52 74 71 46 236 209 59 747
Offshore
Spills (t/106t) 6.86 0.48 0.54 0.04 0.24 0.14 0.02 1.61
Production (106t) 227 223 379 53 121 68 122 1,193
Unspecified
Spills (t/106t) 35.86 0.24 0.12 3.78 no data 3.34 no data 17.18
Production (106t) 77 11 11 30 no data 49 no data 178
Overall
Spills (t/106t) 56.49 0.58 0.67 1.06 49.95 2.91 3.06 18.92
Production (106t) 356 308 461 129 356 326 180 2,117
NB Data only included for production level where oil quantities spilled and production are reported. Excludes spills <1bbl in size

48
International Association of Oil & Gas Producers
©OGP
Quantity of oil spilled per spill onshore and offshore – by region (Figures 6.5, 6.6)
AfricaAsia/
Australasia Europe FSU Middle East North America South America Overall
2011
Onshore
Average size (t) 12.3 1.2 1.8 1.0 23.5 2.5 1.0 3.5
Quantity spilt (t) 3,066 25 187 14 3,128 928 1,590 8,937
Offshore
Average size (t) 58.5 3.6 3.4 no data 0.6 0.4 41.0 27.4
Quantity spilt (t) 4,842 114 257 0 1 2 328 5,613
Unspecified
Average size (t) 6.1 0.5 2.7 0.1 no data 2.1 no data 4.9
Quantity spilt (t) 1,219 4 21 0 0 142 0 1,396
2010
Onshore
Average size (t) 18.6 8.5 1.0 1.8 1.8 1.7 0.5 2.3
Quantity spilt (t) 3,572 407 104 27 197 727 763 5,796
Offshore
Average size (t) 7.7 4.2 4.5 7.1 0.9 0.5 3.5 5.3
Quantity spilt (t) 464 110 212 36 8 5 21 856
Unspecified
Average size (t) 11.7 0.8 1.3 2.1 no data 1.7 no data 9.3
Quantity spilt (t) 2,968 6 11 2 0 102 0 3,089
2009
Onshore
Average size (t) 85.0 1.8 0.2 5.6 93.5 1.7 0.4 13.4
Quantity spilt (t) 15,803 72 104 22 17,769 774 550 35,094
Offshore
Average size (t) 13.7 2.2 2.9 1.1 3.3 1.0 1.2 7.3
Quantity spilt (t) 1,561 108 213 2 30 9 7 1,930
Unspecified
Average size (t) 12.9 1.3 0.6 7.0 no data 2.1 no data 9.8
Quantity spilt (t) 2,774 3 1 112 no data 165 0 3,055
NB: Excludes spills <1bbl in size

49
Environmental performance inindicators – 2011 data
©OGP
Distribution of oil spills onshore and offshore by size (Figure 6.7)
<1bbl 1<X<10bbl 10<X<100bbl >100bbl Unspecified Overall†
2011
Onshore
Number 2,796 2,280 184 63 20 2,547
Quantity (t) 39 1,793 876 6,268 0 8,937
Offshore
Number 918 154 27 7 17 205
Quantity (t) 14 64 86 5,460 3 5,613
Unspecified
Number 247 225 38 20 0 283
Quantity (t) 4 127 153 1,106 0 1,386
Overall
Number 3,961 2,659 249 90 37 3,035
Quantity (t) 57 1,984 1,115 12,834 3 15,936
2010
Onshore
Number 2,705 2,197 193 60 31 2,481
Quantity (t) 50 813 875 4,061 48 5,797
Offshore
Number 1,471 108 28 15 11 162
Quantity (t) 16 44 118 692 2 856
Unspecified
Number 140 264 44 24 0 332
Quantity (t) 7 126 173 2,789 0 3,088
Overall
Number 4,316 2,569 265 99 42 2,975
Quantity (t) 74 983 1,166 7,542 50 9,741
2009
Onshore
Number 3,996 2,219 114 46 232 2,611
Quantity (t) 55 813 506 33,524 251 35,094
Offshore
Number 1,220 168 43 13 39 263
Quantity (t) 14 78 189 1,611 52 1,930
Unspecified
Number 44 134 147 26 5 312
Quantity (t) 3 85 378 2,590 1 3,054
Overall
Number 5,260 2,521 304 85 276 3,186
Quantity (t) 71 976 1,073 37,725 304 40,078
†Excludes spills <1bbl in size

50
International Association of Oil & Gas Producers
©OGP
Distribution of oil spills by size – by region
<1bbl 1<X<10bbl 10<X<100bbl >100bbl Unspecified Overall†
2011
Africa Number 635 372 98 62 1 533
Quantity (t) 13.6 192.3 508.9 8,493.5 0.3 9,195.0
Asia/Australasia Number 223 47 7 2 4 60
Quantity (t) 4.7 21.8 23.8 96.7 0.3 142.7
Europe Number 2,251 149 18 6 12 185
Quantity (t) 25.9 58.2 56.3 348.6 2.5 465.6
FSU Number 56 13 2 0 0 15
Quantity (t) 1.1 6.6 7.1 0.0 0.0 13.7
Middle East Number 52 89 23 3 20 135
Quantity (t) 1.5 39.4 89.8 3000.3 0.0 3129.5
North America Number 713 347 86 15 0 448
Quantity (t) 9.6 201.5 374.1 495.9 0.0 1,071.5
South America Number 31 1,642 15 2 0 1,659
Quantity (t) 0.6 1464.0 54.7 398.8 0.0 1917.5
2010
Africa Number 410 323 98 70 15 506
Quantity (t) 12.7 154.2 460.6 6,380.6 8.0 7,003.0
Asia/Australasia Number 175 58 14 7 3 82
Quantity (t) 4.8 25.7 78.4 419.1 0.3 523.4
Europe Number 2,560 129 17 5 5 156
Quantity (t) 39.5 40.4 73.6 211.8 1.3 327.2
FSU Number 69 15 3 3 0 21
Quantity (t) 2.3 9.9 6.7 48.4 0.0 65.0
Middle East Number 44 92 22 2 0 116
Quantity (t) 1.2 38.9 75.4 89.9 0.0 204.3
North America Number 971 375 108 8 19 510
Quantity (t) 13.1 165.5 464.1 164.4 40.2 834.3
South America Number 87 1,577 3 4 0 1,584
Quantity (t) 0.2 548.4 7.4 227.5 0.0 783.3
2009
Africa Number 522 191 160 53 111 515
Quantity (t) 9.5 116.5 431.1 19,365.6 224.7 20,137.9
Asia/Australasia Number 147 70 10 2 11 93
Quantity (t) 2.9 27.3 44.3 101.8 9.3 182.7
Europe Number 2,595 456 14 3 26 499
Quantity (t) 29.5 87.2 68.3 118.6 43.3 317.4
FSU Number 40 11 5 6 0 22
Quantity (t) 1.1 7.8 19.1 109.5 0.0 136.4
Middle East Number 36 78 35 7 79 199
Quantity (t) 1.0 42.2 112.9 17,639.1 4.2 17,798.5
North America Number 1,865 417 77 13 39 546
Quantity (t) 26.2 174.6 380.9 371.5 21.7 948.7
South America Number 55 1,298 3 1 10 1,312
Quantity (t) 1.2 520.6 16.2 19.3 1.1 557.2
†Excludes spills <1bbl in size

51
Environmental performance inindicators – 2011 data
©OGP
Oil spills >100 bbl in size – by cause (where cause was indicated) (Figure 6.8)
Number of spills Loss from primary containment (tonnes) Recovered (tonnes)
Corrosion 5 560 450
Equipment failure (excluding corrosion) 21 1,448 1,024
Operator or technical error 4 2,768 2,751
Third party damage (sabotage, theft, vandalism, etc) 2 93 18
Other (2 sea bed seepage, 1 equipment specification, 1 tank explosion) 4 152 3
Unknown (1 offshore transfer) 1 4,758 no data
Oil spills 10-100 bbl – by cause (where cause was indicated) (Figure 6.9)
Number of spills Loss from primary containment (tonnes)
Corrosion 29 110
Equipment failure (excluding corrosion) 57 238
Operator or technical error 14 45
Third party damage (sabotage, theft, vandalism, etc) 10 48
Other 10 27
Oil spills 10-100 bbl 2011 – by materials spilled (where cause was indicated)
Number of spills Loss from primary containment (tonnes)
crude oil 89 342
condensate 15 61
processed oil 11 52
unspecified oil 5 13
Oil spills 10-100 bbl 2011 – by region (where cause was indicated)
Number of spills Loss from primary containment (tonnes)
Africa 28 102
Asia/Australasia 4 11
Europe 13 42
Middle East 14 61
North America 44 190
South America 15 55

52
International Association of Oil & Gas Producers
©OGP
Oil spills 10-100 bbl 2010 – by location (where cause was indicated)
Number of spills Loss from primary containment (tonnes)
Onshore 94 379
Offshore 26 89
Chemical spills (tonnes) onshore and offshore – by region†
AfricaAsia/
Australasia Europe FSU Middle East North America South America Overall
2011
Onshore
Average size (t) 48.99 1.16 2.23 31.27 0.08 1.52 11.83 6.88
Quantity spilt (t) 392 22 9 281 0 152 272 1,128
Offshore
Average size (t) 0.68 4.28 3.13 7.00 no data 3.44 12.58 4.72
Quantity spilt (t) 5 47 282 7 0 72 327 741
Overall
Average size (t) 2.93 14.31 no data no data no data 1.82 no data 3.21
Quantity spilt (t) 15 14 0 0 0 13 0 42
2010
Onshore
Average size (t) 9.75 8.27 0.74 1.03 0.72 1.89 0.94 3.18
Quantity spilt (t) 205 41 1 2 3 176 10 439
Offshore
Average size (t) 3.99 3.87 96.01 no data 2.07 2.27 14.39 59.11
Quantity spilt (t) 28 35 6,432 0 2 27 273 6,798
Unspecified
Average size (t) 15.71 0.19 no data no data no data 2.75 no data 8.22
Quantity spilt (t) 63 0 0 0 0 11 0 74
2009
Onshore
Average size (t) no data 0.26 7.52 0.28 1.91 7.99 1.22 7.24
Quantity spilt (t) 0 1 15 0 4 1,574 20 1,614
Offshore
Average size (t) 1.22 2.94 3.56 1.39 1.47 4.70 27.52 6.04
Quantity spilt (t) 4 21 249 6 3 70 330 682
Unspecified
Average size (t) 116.73 0.40 no data 2.50 no data 1.06 0.90 27.75
Quantity spilt (t) 350 1 0 2 no data 6 1 361
† Excludes spills <1bbl in size

53
Environmental performance inindicators – 2011 data
©OGP
Bbl, BarrelIn the energy industry, a barrel is 42 U.S. gallons measured at 60° Fahrenheit. This is 159 litres.
Base fluidThe continuous phase or suspending medium of a drilling fluid formulation.
CH4Methane, the principal constituent of natural gas. One of the primary greenhouse gases.
CO2Carbon dioxide, a colourless, odourless and non-flammable gas. CO2 emissions occur from the combustion of fossil fuels. CO2 is a primary greenhouse gas.
Crude oilA mixture of hydrocarbons that exists as a liquid in natural underground reservoirs and remains liquid at atmospheric pressure after passing through surface separating facilities. Crude oil is the raw material that is refined into gasoline, heating oil, jet fuel, propane, petrochemicals, and other products.
CuttingsThe particles generated by drilling into subsurface geologic formations and carried out from the wellbore with the drilling fluid. Examples of drill cuttings include small pieces of rock varying in size and texture from fine silt to gravel.
Drilling fluidThe fluid circulated through the wellbore during rotary drilling to clean and condition the hole and to counterbalance formation pressure.
E&PExploration and Production (of hydrocarbons).
Emission rateEmissions of gases per unit of hydrocarbon production.
Energy intensityEnergy consumed per unit of hydrocarbon production.
ExplorationStudy of geological formations to detect the presence of hydrocarbons.
FlaringThe controlled burning of natural gas produced in association with oil in the course of oil and gas exploration and production operations. It also includes the controlled and safe burning of gas which cannot be used for commercial or technical reasons.
Fugitive emission, fugitive lossesUnintended emissions released to the air, other than those from stacks or vents from the processing, transmission, and/or transportation of fossil fuels. They are often due to equipment leaks, evaporative processes, and windblown disturbances.
Gas-oil ratio The volume of gas at atmospheric pressure produced per unit volume of oil produced.
Gaseous emissionGaseous emissions to the atmosphere from flaring and venting, process and turbine combustion. Includes fugitive losses from pumps, valves, flanges, pipes, etc.
Greenhouse gasA gas that contributes to the natural greenhouse effect. The primary six greenhouse gases (GHGs) produced by human activities are: carbon dioxide, methane, nitrous oxide, hydrofluorocarbons, perfluorocarbons and sulphur hexafluoride. For the purpose of this report, GHG considers only CO2 and CH4.
HydrocarbonAn organic chemical compound of hydrogen and carbon (see petroleum).
Nitrogen Oxides (NOX)Nitrogen Oxides represent the sum of nitric oxide (NO) and nitrogen dioxide (NO2) expressed as NO2 equivalent. Nitrous oxide (N2O) is not included as a component of NOX. NOX emissions occur from the combustion of fossil fuels for industry and transport and are a function of the type and quantity of fuel burned and the type of combustion device in which they are burned.
Non-Aqueous Drilling Fluid (NADF)An emulsion of non-aqueous (water immiscible) base fluid and brine, mixed with weighting material and other material such as gels and emulsifiers. NADFs serve many purposes under difficult drilling conditions, the main one being suspending cuttings and transport them to the surface where they become segregated from the NADF. NADFs are usually recovered and reused.
NMVOCNon Methane Volatile Organic Compounds: all hydrocarbons other than methane that can vaporise at normal temperature and pressure.
NormalisationTo compare emissions from different regions or sources it is useful to relate them to the size of the activity causing the emission. For example, tonnes of CO2 can be presented by their ratio to tonnes of oil and gas produced. This procedure is called normalisation.
OffshoreActivities and discharges that take place at sea, including major inland seas and other inland seas directly connecting with oceans.
OnshoreActivities and discharges that take place within a landmass, including swamps, lakes, rivers and estuaries, but excluding major inland seas.
On-site combustionThe local combustion of fuels by E&P companies to produce energy for their operations.
Appendix B – Glossary

54
International Association of Oil & Gas Producers
©OGP
OperatorTerm used to describe a company appointed by venture stakeholders to take primary responsibility for day-to-day operations for a specific plant or activity.
ProcessingThe separation of oil, gas, and natural gas liquids and the removal of impurities.
Produced water (PW)The water (generally brine) brought up from the hydrocarbon-bearing strata during the extraction of oil and gas, including formation water, injection water, and any chemicals added downhole or during the oil/water separation process.
ProductionAll production activities including production drilling, process and treatment, flaring and venting, pipeline transport, and terminal operations. Also, quantity of hydrocarbon gas and/or liquids produced.
Purchased energyEnergy purchased in the form of electricity or steam.
SO2Sulphur dioxide.
Source of emissionsIn the case of gaseous emissions, this refers to the process by which the emissions are released. Source categories are energy, flare, vent, fugitive losses and unspecified.
SpillAny loss of containment that reaches the environment (i.e. not inclusive of any released volume retained within secondary or other confinement), irrespective of the quantity recovered (i.e. represents the gross volume reaching the environment, not a net volume remaining in the environment).Spills occurring from support and standby vessels are included but spills of produced water or process waste water are excluded. Includes loss of containment resulting from acts of sabotage (such as theft of oil from pipelines and storage); excludes loss as a result of ‘acts of terrorism’/attacks on infrastructure.
SyntheticsSynthetic material as applied to synthetic-based drilling fluid means material produced by the reaction of specific purified chemical feedstock, as opposed to the traditional base fluids such as diesel and mineral oil which are derived from crude oil solely through physical separation processes.
TonneA metric tonne; equivalent to 1,000 kilogrammes or 2,205 pounds.
TransportThe transfer of hydrocarbons from the site of production to the point of commercial metering or terminal or offshore loading device.
Upstream industryThose operations within the industry to the point where the produced resource is metered into the transportation system. This includes exploration & production.
VentingThe controlled release of unburned gas to the atmosphere.
Water-based drilling fluid (mud)The continuous phase and suspending medium for solids is a water-miscible fluid (often seawater or another brine solution), regardless of the presence of oil.

For further information and publications, please visit our website at
www.ogp.org.uk

209-215 Blackfriars RoadLondon SE1 8NLUnited KingdomTelephone: +44 (0)20 7633 0272Fax: +44 (0)20 7633 2350
165 Bd du Souverain4th FloorB-1160 Brussels, BelgiumTelephone: +32 (0)2 566 9150Fax: +32 (0)2 566 9159
Internet site: www.ogp.org.uke-mail: [email protected]


