ENVIRONMENTAL MEDICINE Natick, Massachusetts DTIC · ENVIRONMENTAL MEDICINE Natick, Massachusetts...
152
AD CN REPORT NO T13-89 00 00 £ o THE ROLE OF WATER CONSUMPTION " ON CONSUMPTION OF THE RATION, COLD WEATHER * Ii U S ARMY RESEARCH INSTITUTE OF ENVIRONMENTAL MEDICINE Natick, Massachusetts DTIC D1) I ~~App,*ood I*, public *I**&@e distribylio. nmne UNITED STATES ARMY MEDICAL RESEARCH & DEVELOPMENT COMMAND 89 5 30 11
Transcript of ENVIRONMENTAL MEDICINE Natick, Massachusetts DTIC · ENVIRONMENTAL MEDICINE Natick, Massachusetts...

AD
CN REPORT NO T13-8900
00£ o THE ROLE OF WATER CONSUMPTION" ON CONSUMPTION OF THE RATION, COLD WEATHER
* Ii
U S ARMY RESEARCH INSTITUTEOF
ENVIRONMENTAL MEDICINE
Natick, Massachusetts
DTIC
D1)
I ~~App,*ood I*, public *I**&@e distribylio. nmne
UNITED STATES ARMYMEDICAL RESEARCH & DEVELOPMENT COMMAND
89 5 30 11

The findings in this report are not to be construed as an officialDepartment of the Army position, unless so designated by other authorizeddocuments.
DISPOSITION INSTRUCTIONS
Destroy this report when no longer needed.
Do not return to the originator.
~lEu~ITv ELA!!IFI~ATION OF THI! PAGE
REPORT DOCUMENTATION PAGE Form Approved OMB No. 0704-11188
1a. REPORT SECURITY CLASSIFICATION 1 b. RESTRICTIVE MARKINGS
2o. SECURITY CLASSIFICATION AUTHORITY 3. OISTRIBUTION I AVAILABILITY OF REPORT
Approved for public release; distribution lb. DECLASSIFICATION I DOWNGRADING SCHiiDUL£
is unlimited
4. PERFORMING ORGANIZATION REPORT NUMBER($) 5. MONITORING ORGANIZATION REPORT NUMBER(S)
6a. NAME OF PERFORMING ORGANIZATION 6b. OFFICE SYMBOL 7o. NAME OF MONITORING ORGANIZATION
USARIEf\1 and NRD & EC (H oppllcsble)
SGRD-UE-CR US Army Medical Research & Development Cmd
6~ ADDRESS (City, State, and ZIP Code) 7b. ADDRESS (Cil)', ~tot~~ f'irf~o 12 Natick, MA 01760-5007 Fort Detr~c , -
Ba. NAME OF FUNDING /SPONSORING Bb. OFFICE SYMBOL 9. PROCUREMENT INSTRUMENT IDENTIFICATION NUMBER ORGANIZATION (If •pplicoble)
Be. ADDRESS (City, State, ond ZIP Code) 10. SOURCE OF FUNDING NUMBERS
PROGRAM ~~OJE£!.1627 TASK WORK UNIT ELEMENT NO. NO. ACCESSION NO. 62787A 87A879 BB DAOC 6131
11 . TITLE (Include Security Classification) The Role of Water Consumption on Consumption of the Ration, Cold Weather
12. PERSONAL AUTHORIS)
Roberts DE~ BJ McGuire DB Engell, CA Salter MS Rose 13a. TYPE OF REPORT rlb. TIME COVERED r4. DATE OF REPORT (Y .. z,Month,D•y) rs. PA.GE ~OUNT FinaL FROM Feb 88 TO Feb 89 1989 February 2 1]6
16. SUPPLEMENTARY NOTATION
... 17. COSATI CODES 18. SUBJECT TERMS (Continue on reverse if neces.wry and ~ntifyhby fr_odc number) ,
FIELD GROUP SUB-GROUP Ration, Cold Weather; Caloric Intake; ypo y rat1on; '.
Body Weight Loss; Callous Warrior; Water Intake; Ration
Acceptability; Nutritional Status
19. ABSTRACT (Continu• on reverH if MCO.WI)' ond Identify by block numl>tr)
Two squads of Light Infantry volunteered to test the role of water consumption on consumption of the Ration, Cold Weather (RCW). One squad was encouraged to drink at least 4 L/man/day (Group 1) wh 11 e the other served as the control (Group 2) • The test was conducted in February 1988 in conjunction with the 6th ID winter warfare training (Callous Warrior). Pre and post measurements were taken along with daily monitoring of food intake, water intake, body weight, and hydration status. Both groups consumed water i n excess of 3 L/man/day and their hydration status could be described as high normal (elevated specific gravity and decreased sodium/potassium ratios). There were no significant differences in the energy intakes of the 2 groups, but they only consumed 54% of the energy required (4700 kcal) to maintain body weight (Group 1 lost 3.2% and Group 2 lost 4.1%). Group 1 and 2 consumed a total of 2734 and 3029 k ca 1 , respectively. The main reason for 20. DISTRIBUTION I AVAILABILITY OF ABSTRACT 21. Al'f,T~CT S!':ft'~ITd CLASSIFICATION
ll1J UNCLASSIFIED/UNLIMITED 0 SAME AS RPT. 0 OTIC USERS nc ass J.e
22a. NAME OF RESPONSIBLE INDIVIDUAL 22~6~~C~Y~~g~~uc~e "'' .. code) I ~GF.9f!lrM~~soL Dr. Donald Roberts
DO Form 1473, JUN 86 l'revlous odltlons •re obsolote. SECURITY CLASSIFICATION OF THIS PAGE
UNCLASSIFIED
periods of low consumption was the lack of hot water for hydrating rationcomponents when the Yukon stove was not operating. The results of thisstudy indicate that zinc and folacin need to be increased in the RCW. Touse the RCW as a stand alone ration for the Light Infantry, modificationsare necessary in the delivery of water and in methods of heating water toallow individuals to produce hot water. Water consumption needs to beencouraged and containers issued to allow the troops to carry water insidetheir clothing to prevent freezing. -
o "L
DISCLAIMER STATEMENT
The views, opinions, and findings contained in this reportare those of the authors and should not be construed as anofficial Department of the Army position, policy, ordecis>on, unless designated by other official documentation.
Human subjects participated in these studies after givingtheir free and informed consent. Investigators adhered to AR70-25 and USAMRDC Regulation 70-25 in Use of Volunteers inResearch.
Approved for public release: distribution unlimited.
A-Orc-Icn For
MS 3 FRA&I
U--r :::ouncedJi f I cat Jon
ByDlstributlon/
Availability CodesAVail and/orlist Special
Ej.

ACKNOWLEDGEMENTS
The authors would like to thank CPT Hager, Cdr, Alpha Co5/9,6 ID (L) and the members of the 1st and 2nd platoons whovolunteered for this study. The cooperation of COL T. Lawrie(Cdr, 2nd Brigade) and LTC Cambell (Cdr, 5th Battalion) ofthe 6 ID (L) was greatly appreciated. Special thanks go toSSG David Moore for logistical support and laboratoryanalysis, and to SSG John Hodenpel and SPC Patrick McNeal fordata acquisition and laboratory analysis and to SPC PatrickMcNeal for graphics.
The authors would like to recognize the following USARIEMpersonnel for their assistance: Carlo Radovsky forstatistical support, T.E. Morgan and CPT E.G. Szeto fortechnical assistance.
The rations were provided by MAJ Dan Schilling, FoodEngineering Directorate, Natick Research, Development andEngineering Center.
ii
The Role of Water Consumption on Consumption
of the Ration, Cold Weather
DE Roberts, Ph.D. Cold Research Division1
BJ McGuire, M.S. Military Nutrition Division1
DB Engell, Ph.D. Behavioral Sciences Division 2
MAJ CA Salter, Ph.D. Behavioral Sciences Division 2LTC MS Rose, Ph.D. Military Nutrition Division
1 US Army Research Institute Of Environmental Medicine
2 US Army Natick Research, Development and
Engineering Command
February 1989
Natick, Massachusetts 01760-5007
iii
Table of Contents
Page
List of Tables ........................................ vi
List of Figures .................. ............ vii
ABSTRACT ............................................... viii
INTRODUCTION .......................................... 1
METHODS ............................................... 2
Rations ............................................... 3
Test Subjects ...................................... 3
Experimental Design ................................ 4
Anthropometry .............. ....................... 6
Food and Water Intake .............. ..... .... .... . 7
Nutrient Intake .................................... 8
Nutritional Status ................................. 10
Hydration Status ................................... 10
Ration Acceptability ............................... 12
Classification of Cold Experience .................. 12
Statistical Methods ................. ....... ........ 13
RESULTS ............................................... 14
Body Weight Changes ...................... .......... 14
Nutrient Intake .................................... 15
Macronutrients ................................ 21
Micronutrients ....................... ........ 25
Minerals ...................................... 26
Ration Consumption ................................. 26
Iv

Table of Contents
Page
Nutritional Status .............................. .... 27
Water Intake ........................................ 32
Hydration Status ................................. 37
Ration Acceptability ............................... 41
Cold Experience .................................. 58
DISCUSSION .......................................... 59
Nutritional Status ............................... 63
Hydration Status ......................... ........ 69
Ration Acceptability ............................. 71
SUMMARY AND CONCLUSIONS ............................. 73
RECOMMENDATIONS ............................... ..... . 75
REFERENCES .................................... 77
APPENDIX 1 ......................................... . 80Description of Ration, Cold Weather
APPENDIX 2 .......................................... 94Twenty-Four Hour Food Record Card
APPENDIX 3 .......................................... 97
Sample Collection Schedule and Unit Movements
APPENDIX 4 ................................. ......... 99Cold Environment Background Survey Form
APPENDIX 5 ............................. ............. 104Ration, Cold Weather Questionnaire
APPENDIX 6 ............................... ... * ....... 118Categorization of States into 4 Temperate Zones
APPENDIX 7 ................................ 120Percent Nutrient Intake of RCW
APPENDIX 8 .................................. 123Percent Consumption of RCW Components
V
List of Tables
Table Number Page
1. Macronutrient composition of RCW ................. 3
2. Mean anthropometric values ........................ 4
3. Mean body weights .................................. 15
4. Total mean nutrient intake for eight days ........ 18
5. RCW contribution to total nutrient intake ........ 19
6. Blood chemistries .................................. 28
7. Hemoglobin, Hematocrit and serum osmolality ..... 39
8. Mean acceptance of RCW items ...................... 42
9. Rating of RCW by meal time ........................ 44
10. Evaluation of ration serving size ................. 44
11. Evaluation of variety in the RCW ................. 45
12. Mean ratings of satisfaction with the RCW ........ 46
13. Reasons for not getting enough to eat ............ 47
14. Reasons for not getting enough to drink .......... 48
15. Frequency of deprivation ......................... 49
16. Frequency of adding water to various RCWcomponents ....................................... 50
17. Typical temperature at which RCW itemswere consumed ............. .. ...... ............ 51
18. Methods of protecting hands while handling
the RCW outside .................................. 52
19. Methods of heating water for the RCW ............. 53
20. Difficulty of RCW preparation ..................... 54
21. Possible ways of improving the RCW ............... 56
22. Ease of RCW preparation ............................ 57
23. Consumption levels for combined groups ........... 62
Vi

List of Figures
Figure Number Page
1. Study mean values for energy andmacronutrient intake............................. 17
2. Daily energy intake.............................. 20
3. Daily carbohydrate intake........................ 22
4. Daily protein intake............................. 23
5. Daily fat intake................................ 24
6. Frequency of occurrence of positive urinaryacetoacetone in both groups...................29
7. Water intake for GroupI......................... 33
8. Water intake for Group 2.................... 34
9. Daily urinary specific gravity................... 38
10. Daily urinary sodium/potassium................... 40

ABSTRACT
Two squads of Light Infantry volunteered to test the role of
water consumption on consumption of the Ration, Cold Weather
(RCW). One squad was encouraged to drink at least 4 L/man/day
(Group 1) while the other served as the control (Group 2). The
test was conducted in February 1988 in conjunction with the 6th
ID winter warfare training (Callous Warrior). Pre and post
measurements were taken along with daily monitoring of food
intake, water intake, body weight, and hydration status. Both
grcups consumed water in excess of 3 L/man/day and their
hydration status could be described as high normal (elevated
specific gravity and decreased sodium/potassium ratios). There
were no significant differences in the energy intakes of the 2
groups, but they only consumed 54% of the energy required (4700
kcal) to maintain body weight (Group 1 lost 3.2% and Group 2 lost
4.1%). Group 1 and 2 consumed a total of 2734 and 3029 kcal,
respectively. The main reason for periods of low consumption was
the lack of hot water for hydrating ration components whEn the
Yukon stove was not operating. The results of this study
indicate that zinc and folacin need to be increased in the RCW.
To use the RCW as a stand alone ration for the Light Infantry,
modifications are necessary in the delivery of water and in
methods of heating water to allow individuals to produce hot
water. Water consumption needs to be encouraged and containers
issued to allow the troops to carry water inside their clothing
to prevent freezing.
v I

INTRODUCTION
The U.S. Marine Corps has established a required
operational capability (ROC) for an operational cold weather
ration (designated the Ration, Cold Weather or RCW). Natick
Research, Development and Engineering Center (NRD&EC) has
developed a ration which will provide 4500 kcal per day, will
be non-freezing, and lighter in weight (2.75 pounds in two
flexible pouches) than the presently approved Meal, Ready-to-
Eat (MRE). The average weight of the MRE is 1.5 pounds per
meal and four meals are required to provide 4800 kcal.
The U.S. Army has a draft letter requirement, but no
ROC, for the RCW. The present operational ration (MRE) has
experienced problems concerning freezing of the ration which
has caused the pouches to leak (appendix 1) and these
problems may be exacerbated in MRE VIII, which has a higher
water content that makes it more susceptible to freezing.
Previous field tests (9,10,11,14) of the RCW have
identified suboptimal caloric intakes, hypohydration, and
body weight loss as potential problems when the RCW is
considered for use as the operational cold weather ration.
In both the test in Norway (19) and the test with Special
Forces (14), hypohydration existed before deployment even
though the troops were isolated for three days before
deployment and encouraged to hydrate. The relationship
between water intake and caloric intake is not clear, but
Engell (2) has reported that 70% of all fluid is consumed
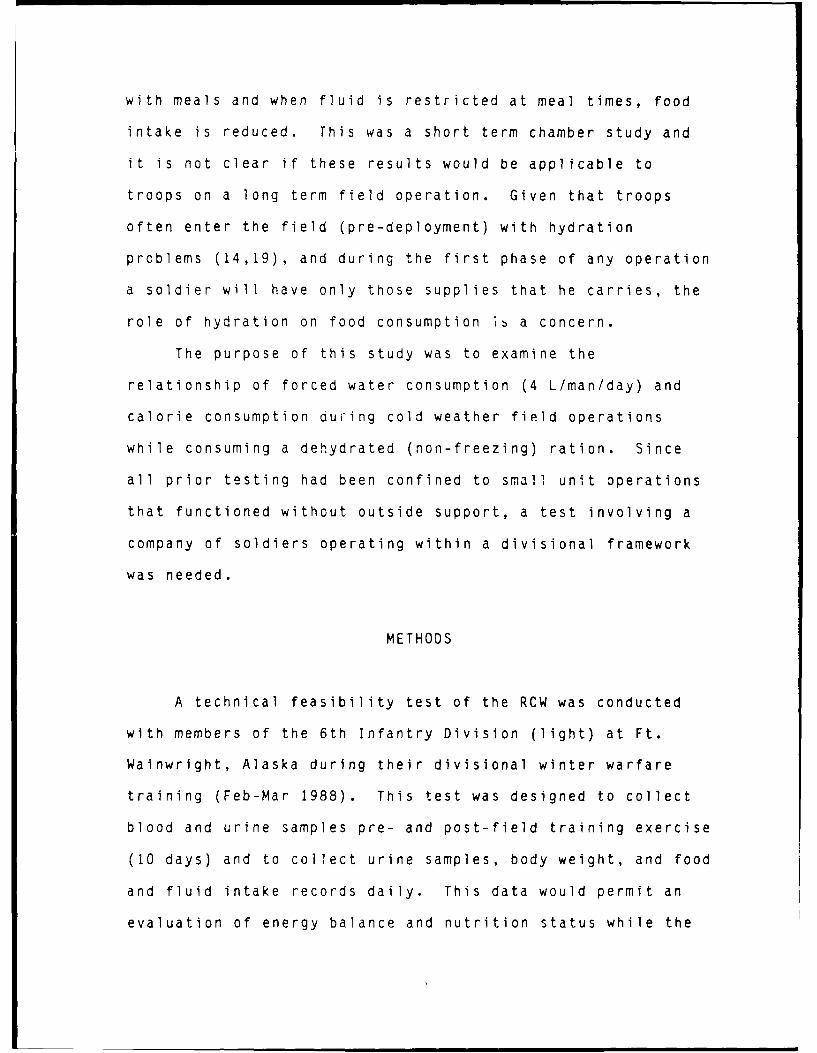
with meals and when fluid is restricted at meal times, food
intake is reduced. This was a short term chamber study and
it is not clear if these results would be applicable to
troops on a long term field operation. Given that troops
often enter the field (pre-deployment) with hydration
problems (14,19), and during the first phase of any operation
a soldier will have only those supplies that he carries, the
role of hydration on food consumption 'i a concern.
The purpose of this study was to examine the
relationship of forced water consumption (4 L/man/day) and
calorie consumption dui-ing cold weather field operations
while consuming a dehydrated (non-freezing) ration. Since
all prior testing had been confined to small unit operations
that functioned without outside support, a test involving a
company of soldiers operating within a divisional framework
was needed.
METHODS
A technical feasibility test of the RCW was conducted
with members of the 6th Infantry Division (light) at Ft.
Wainwright, Alaska during their divisional winter warfare
training (Feb-Mar 1988). This test was designed to collect
blood and urine samples pre- and post-field training exercise
(10 days) and to collect urine samples, body weight, and food
and fluid intake records daily. This data would permit an
evaluation of energy balance and nutrition status while the
RCW was consumed in the field. A description of the RCW is
enclosed as Appendix 1.
Rations
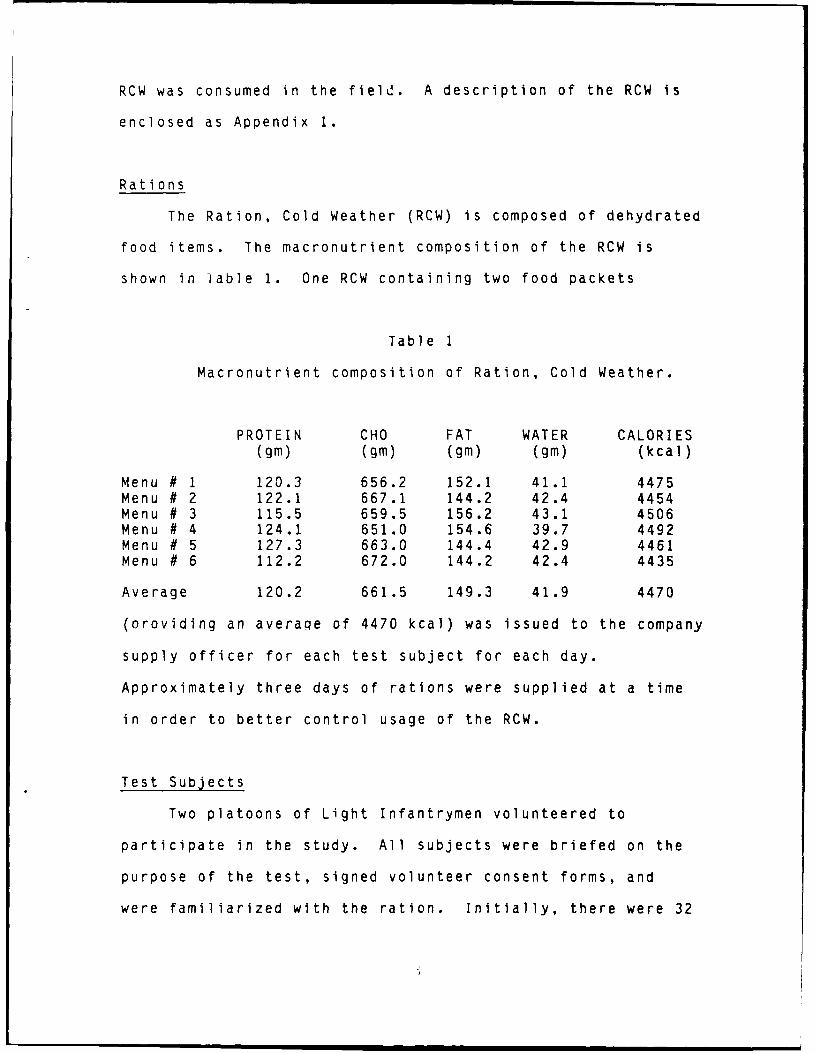
The Ration, Cold Weather (RCW) is composed of dehydrated
food items. The macronutrient composition of the RCW is
shown in !able 1. One RCW containing two food packets
Table 1
Macronutrient composition of Ration, Cold Weather.
PROTEIN CHO FAT WATER CALORIES(gm) (gm) (gm) (gm) (kcal)
Menu # 1 120.3 656.2 152.1 41.1 4475Menu # 2 122.1 667.1 144.2 42.4 4454Menu # 3 115.5 659.5 156.2 43.1 4506Menu # 4 124.1 651.0 154.6 39.7 4492Menu # 5 127.3 663.0 144.4 42.9 4461Menu # 6 112.2 672.0 144.2 42.4 4435
Average 120.2 661.5 149.3 41.9 4470
(oroviding an average of 4470 kcal) was issued to the company
supply officer for each test subject for each day.
Approximately three days of rations were supplied at a time
in order to better control usage of the RCW.
Test Subjects
Two platoons of Light Infantrymen volunteered to
participate in the study. All subjects were briefed on the
purpose of the test, signed volunteer consent forms, and
were familiarized with the ration. Initially, there were 32
men assigned to two groups (15 to the forced fluid group
(Group 1) and 17 to the control group (Group 2)). Data from
one subject of the first group was not used as his non-RCW
food consumption rate was extremely high and his RCW food
consumption was minimal. One member of the second group was
unable to participate in the st'ldy beyond the first day of
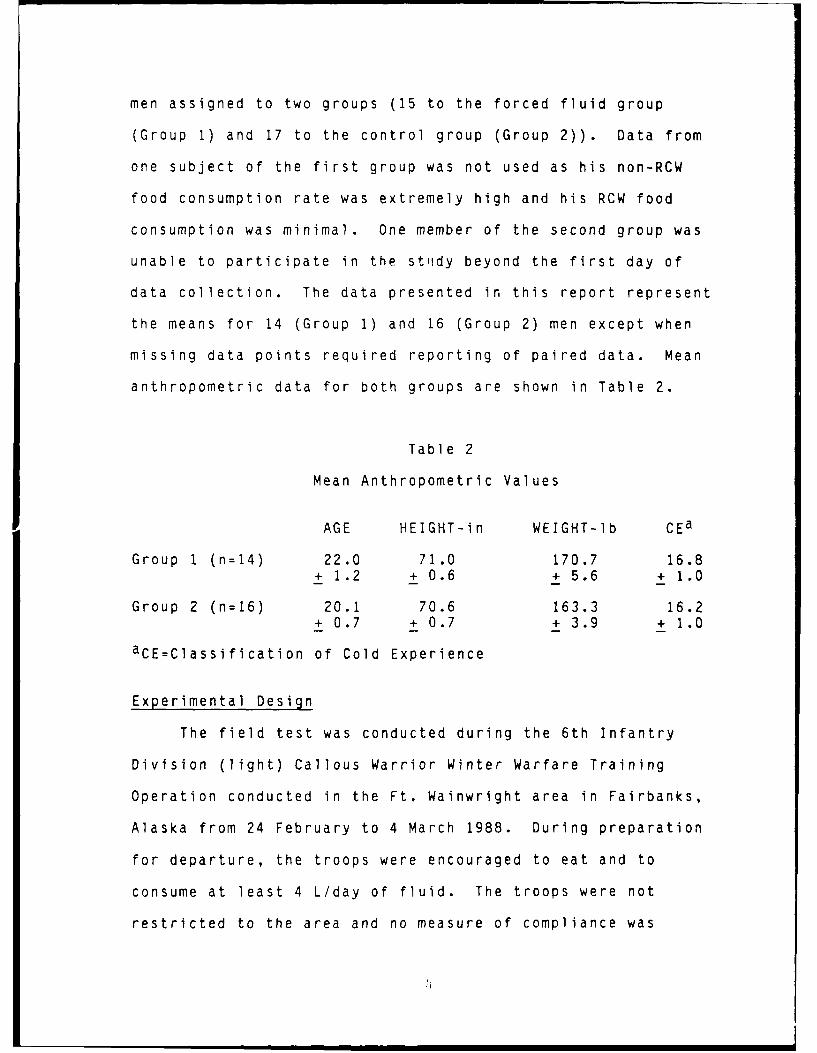
data collection. The data presented in this report represent
the means for 14 (Group 1) and 16 (Group 2) men except when
missing data points required reporting of paired data. Mean
anthropometric data for both groups are shown in Table 2.
Table 2
Mean Anthropometric Values
AGE HEIGHT-in WEIGHT-lb CEa
Group 1 (n=14) 22.0 71.0 170.7 16.8+ 1.2 + 0.6 + 5.6 + 1.0
Group 2 (n=16) 20.1 70.6 163.3 16.2+ 0.7 + 0.7 + 3.9 + 1.0
aCE=Classification of Cold Experience
Experimental Design
The field test was conducted during the 6th Infantry
Division (light) Callous Warrior Winter Warfare Training
Operation conducted in the Ft. Wainwright area in Fairbanks,
Alaska from 24 February to 4 March 1988. During preparation
for departure, the troops were encouraged to eat and to
consume at least 4 L/day of fluid. The troops were not
restricted to the area and no measure of compliance was

attempted. Twenty-four hours before deployment, a body
weight, a blood sample, and a urine sample were obtained.
The soldiers were instructed on the use of the ration and the
method of reporting food and water consumption was clearly
demonstrated (Appendix 2). The soldiers in the forced fluid
group were encouraged to continue drinking at least 4 L/day
of fluid in the field and the investigators provided extra
water to this squad on a daily basis. No special
instructions were given to the soldiers in Group 2 and they
obtained their water through normal channels. Beginning with
Day 2 in the field and for every day thereafter, a first
morning urine sample was collected as were food and water
records. The final sample of body weight, blood, and urine
were obtained on the morning before removal from the field.
During deployment, soldiers were airlifted to an
airfield 30 miles south of Ft. Wainwright (Airhead). Their
initial position (activity consisted of setting up squad
tents and building fortified positions) was set-up within 500
meters of the Airhead. The company-sized unit conducted
winter training for the next 10 days which included four
major movements: road march, cross country skiing, ski-
joring behind Small Unit Supply Vehicle (SUSV), and
helicopter airlift. They also built and defended positions.
The terrain was mostly flat and largely forested with deep
loosely packed snow. During movements, each soldier carried
a 50 pound pack, weapons, and ammo. Their other gear was
carried on the SUSV. During this operation, all water was

supplied from 5 gallon cans (metal with ceramic liner or
plastic). Each soldier carried a single 1 quart Arctic
canteen (usually outside the uniform), and a few carried a
polyethylene bottle inside their uniform.
The activity levels of the teams were similar, but
somewhat variable depending on the tactical movement of the
two groups (Appendix 3). The activity levels were high
during deployment and movement into new training areas due to
the demands of skiing, snowshoeing, marching, and walking
through loose snow. Energy expenditure could not be measured
during the test, but was estimated at an average of 4700
kcal/man/day from daily interviews with the assigned squad
leaders in each group. Information provided by Welch et al.
(18) was used to estimate energy costs of different tasks.
The terrain was snow covered with depths ranging between
12 to 24 inches of snow. There were only trace amounts of
new snow during the exercise. Temperatures were unseasonably
warm ranging from 8°F at night to 440 F during the day with a
mean of 270 F.
Anthropometry
Subjects were weighed in standard clothing for the
climate with outer garments removed and pockets emptied.
Body weights were obtained before, during, and after the 10-
day field exercise. Two calibrated electronic digital
balances, accurate to 0.1 Ib, were used for the data
collection. These scales were calibrated with a known
weight prior to use each day. A record was kept of sizes and
articles of clothing, and size of boots worn by each subject.
Weights of similar clothing articles and boots were then
subtracted from the subjects' weights each day to arrive at
their nude weight. Pre- to post-changes in body weight were
calculated and the change was used as an indicator of
nutritional and hydration status of the two groups.
Height was measured prior to deployment and age
obtained from the background questionnaire (Appendix 4).
Food and Water Intake
Food consumption, water intake, hedonic ratings of food
items, and reasons for not finishing a food item were self-
recorded daily on individual 24-hour food record cards
(Appendix 2), and are shown in Figures 2,3,4,5,7, and 8 as
Day 1 - Day 8. Similar record keeping systems had been used
in previous packaged ration field studies and require minimum
time and effort on the part of the test subject. The test
subject selected the food item he had just consumed from a
list of component ration food items on the card and circled
his estimate of the amount eaten (1/4, 1/2, 3/4, or all).
Water used for rehydration of food items and water
drunk/mixed with drinks were separately estimated in terms of
canteen cups. Water consumption was then calculated as
water used or needed to consume the ration (FDWATER) and
fluid drunk (ADWATER). Total water consumption (TOTALWATER)
was calculated by summing the two together. These cards were
Y1

collected daily by trained dietitians, who reviewed the
previous day's record each morning with each test subject in
order to probe for any omissions and to resolve any
ambiguities in the records. To improve the accuracy of the
24-hour food card, food waste (empty wrappers, left-overs,
and unfinished food items) was collected from each subject
for each 24-hour dietary collection period in plastic trash
bags. Information on food waste was later compared to food
intake on the dietary records, discrepancies were noted, and
resolved with the individual on the following day. The
soldiers participating in the study were supposed to eat only
RCW foods during the 8 days during which dietary data were
collected. However, tray-pack rations (T-rations) and MREs
were served to other members of their platoons and therefore
were readily available. If a test subject did eat other
foods, he was asked to record these foods on his food intake
record. These entries were also reviewed by the dietitians
to determine origin of food (heated T-rations, MRE, or
other), portion sizes, and accuracy of reporting. Food
consumption data were coded and entered into a computer file
for analysis.
Nutrient Intakes
The nutrient data base to analyze the food consumption
data was created from nutrient composition data provided by
NRD&EC, the University of Massachusetts Nutrient Data Bank,
and USDA food composition tables. Micronutrient data was

just recently made available for the RCW. The components
were analyzed by a commercial laboratory, but its scope is
still restricted because of the limited number of components
that were analyzed, missing data (i.e., zinc and cholesterol)
for certain components, because the analysis is based on
only one sample of each component by one laboratory, and
because present methods of analyzing for nutrients are not
reliable (i.e., folacin assay). Comparison of the commercial
laboratory data to other analyses by chemists at NRD&EC
showed that the nutrient contents of fat, iron, zinc, and
vitamin C may actually be higher. Since the RCW components
are presently being modified to correct known deficiencies
and more analyses of the RCW components are being conducted,
these values should be considered accordingly.
The food consumption data were analyzed on a VAX 780
computer by employing a computerized nutrient analysis system
developed by the U.S. Army Research Institute of
Environmental Medicine (USARIEM) for the 1985 CFFS-FDTE
(20). Daily means of nutrient intakes were determined by
group and by pooled subjects and compared to the Military
Recommended Dietary Allowances (MRDA) found in AR 40-25 (1).
All nutrient intakes are reported as the mean value/man/day
for the time period indicated or as 8-day group means.
Food item consumption was factored against known values
for kilocalories (kcal), macronutrients (protein, fat, and
carbohydrate), micronutrients (vitamin A, vitamin C,
thiamin, riboflavin, niacin, vitamin B6, and folacin),
minerals (calcium, phosphorus, magnesium, zinc, iron, and
sodium), and water. The RCW was fortified to meet the
Nutritional Standard for Operational Rations (NSOR) of AR 40-
25 (1) with the exception of sodium, which was purposely set
at a low level (4500 mg) to reduce the water burden of this
ration. Protein percentage was also minimized (but was
within the NSOR levels) in order to reduce the physiological
water requirement to excrete the waste products from
excessive protein intake.
Nutritional Status
Venous antecubital blood samples were taken after an
overnight fast at pre-deployment (Pre) and on the morning of
Day 9 (Post) (Appendix 3). After clotting had occurred, the
serum was separated for a standard clinical panel of blood
chemistry measurements (see Hydration Status section for a
detailed list). Daily first void urine samples were
collected and analyzed for ketone bodies and urinary proteins
(N-Multistix, Ames Division, Miles Laboratories) as indices
of negative energy balance.
Hydration Status
Hydration status was assessed by examination of blood
and urine profiles. Following overnight fasting, a venous
blood sample (24 ml) was collected from each subject pre-
deployment and on the ninth day of the 10-day field operation
(exfiltration occurred on the following day). The following

parameters were measured on these blood samples:
1. Hematocrit2. Hemoglobin3. Osmolality4. Protein5. Albumin6. Globulin7. Total Bilirubin8. SGPT9. SGOT
10. Alkaline Phosphatase11. Lactate Dehydrogenase12. Blood Urea Nitrogen13. Creatinine14. Uric Acid15. Calcium16. Inorganic Phosphorus17. Cholesterol18. Triglycerides19. Glucose20. CO Content21. So ium22. Potassium23. Chloride
Hematocrit was determined by use of heparinized
capillary tubes and read after spinning for 5 minutes on a
Damon/IEC micro hematocrit centrifuge. Hemoglobin was
determined by the cyanmethemoglobin method using a Gilford
Stasar III spectrophotometer. Serum osmolality was
determined by the vapor pressure method using the Wescor
model 5500. All other parameters were analyzed in a blood
chemistry panel provided by Smith-Kline Bioscience Labs.
A first-void-in-the-morning urine sample was collected
at the same time the blood sample was taken on the pre-
deployment day. This urine sample was analyzed for:
1. Potassium2. Sodium3. Specific Gravity
Urinary sodium and potassium concentrations were
1I

measured on an Instrumentation Laboratory model 443 flame
photometer. Urine specific gravity was determined with a
Reichert total solids meter. During the 10-day field test, a
daily first void urine sample was collected alor'g with body
weight and food consumption data and the same measures were
made on these daily urine samples as on the pre- and post-
field exercise samples.
Ration Acceptability
A questionnaire (prepared by the Science and Advanced
Technology Directorate, US Army Natick Research, Development
& Engineering Center) (Appendix 5) was given to each subject
on the last morning in the field and again within a week of
his return to base. The subject was given time to carefully
consider his answers (several included comments). This
questionnaire had been used in other field tests (3,11)
involving the RCW. These previous tests used small teams of
highly trained soldiers, so a comparison to previous data
will reflect the difference in setting (company-sized unit vs
a 10 man team).
Classification of Cold Experience (CE)
The classification of cold experience is an arbitrary
measure in which individuals are placed into "little",
"moderate", or "much" CE categories based on the amount of
prior cold weather exposure or experience an individual has
had. A cold experience score is calculated from answers to 6

questions (#15,16,22,23,26,27) on the Cold Environment
Background Survey Form (Appendix 4). The questions pertain
particularly to the area where the individual has spent most
of his life, to types (classroom instruction and field
training) of cold weather exposures, to the amount of time
spent in cold weather regions, and to a subjective rating of
how one feels about living in cold climates. Scores are
derived from "weights" given to each of the multiple choice
answers from questions 16,22,23,26, and 27. Each question
will therefore give a score of I to 4. Question 15 is given
a weight from I to 4 depending upon the length of time an
individual has spent in a particular zone (Appendix 6).
Zone I has a score of 4, zone 2 rates a 3, zone 3 rates a 2,
and zone 4 is given a 1. When the total score from the 6
questions is compiled, it will range from 6 to 24.
Arbitrarily, a classification of "little" carries a score of
6 to 12 points, "moderate" carries a score of 13 to 18
points, and "much" ranges from 19 to 24 points.
Statistical Methods
Nutrient intakes were analyzed by a MANOVA program
across the eight test days and between the two study groups.
When significant main effects of days or groups were noted, a
Student-Nawman-Keuls post hoc test was conducted. The P<O.05
statistical significance level was used throughout this
report. Anthropometric, blood, and urine data were tested
according to group affiliation (Group 1 or Group 2) and
analyzed by either paired t-test or ANOVA with repeated
measures. All values shown represent the mean + SEM (6).
RESULTS
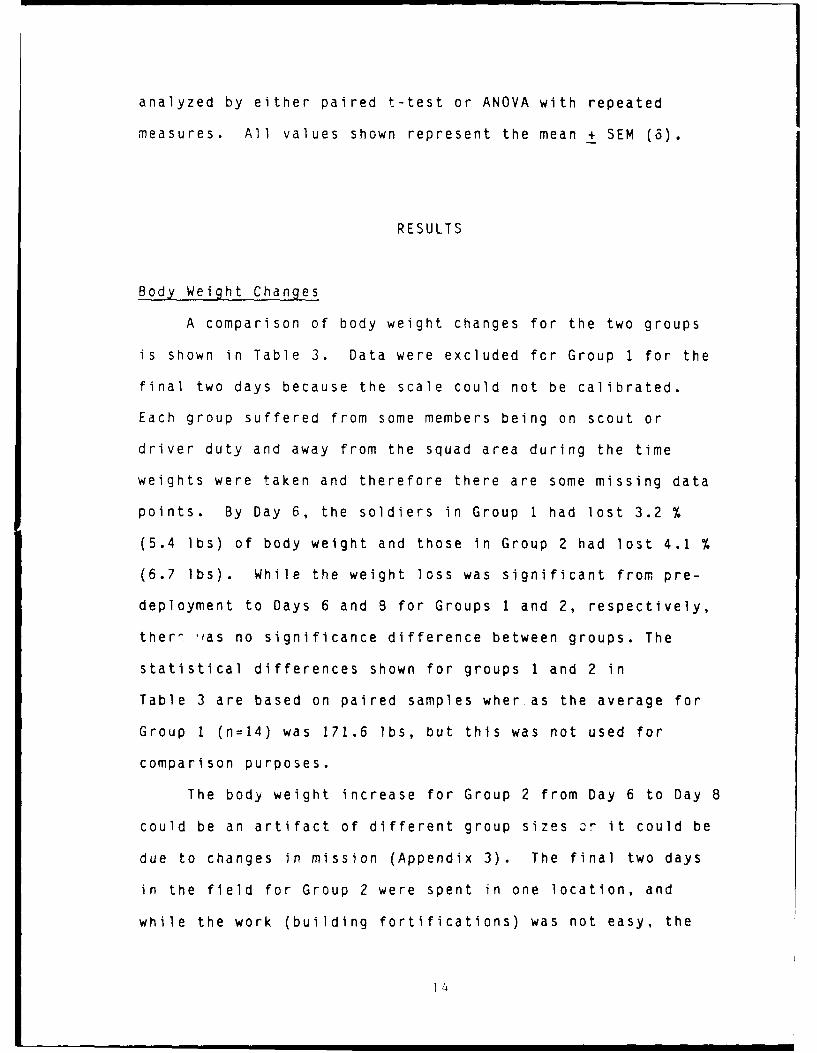
Body Weight Changes
A comparison of body weight changes for the two groups
is shown in Table 3. Data were excluded fcr Group 1 for the
final two days because the scale could not be calibrated.
Each group suffered from some members being on scout or
driver duty and away from the squad area during the time
weights were taken and therefore there are some missing data
points. By Day 6, the soldiers in Group 1 had lost 3.2 %
(5.4 lbs) of body weight and those in Group 2 had lost 4.1 %
(6.7 lbs). While the weight loss was significant from pre-
deployment to Days 6 and 8 for Groups 1 and 2, respectively,
ther, '!as no significance difference between groups. The
statistical differences shown for groups 1 and 2 in
Table 3 are based on paired samples wher as the average for
Group I (n=14) was 171.6 lbs, but this was not used for
comparison purposes.
The body weight increase for Group 2 from Day 6 to Day 8
could be an artifact of different group sizes Or it could be
due to changes in mission (Appendix 3). The final two days
in the field for Group 2 were spent in one location, and
while the work (building fortifications) was not easy, the
-- 14
troops had more time to prepare hot water and to eat the RCW.
TABLE 3
MEAN BODY WEIGHTS--LBS
Group I (n) Group 2 (n)
Pre 170.1 + 8 .7 a 10 163.2 + 4.8 16Day 1Day 2 169.5 + 6.3 13 160.0 + 4.7 16Day 3 169.6 + 5.8 14 160.8 + 4.9 15Day 4 170.3 + 5.8 14 159.7 + 4.7 16Day 5 164.5 + 8.3 11 159.5 + 4.7 16Day 6 164.7 + 7.7 * 10 156.5 + 4.6 13Day 7 158.3 + 4.7 16Day 8 158.2 + 4.6 * 16
aMean+SEM (n)* Significantly different from Pre measurement when usingpaired samples, P < 0.05
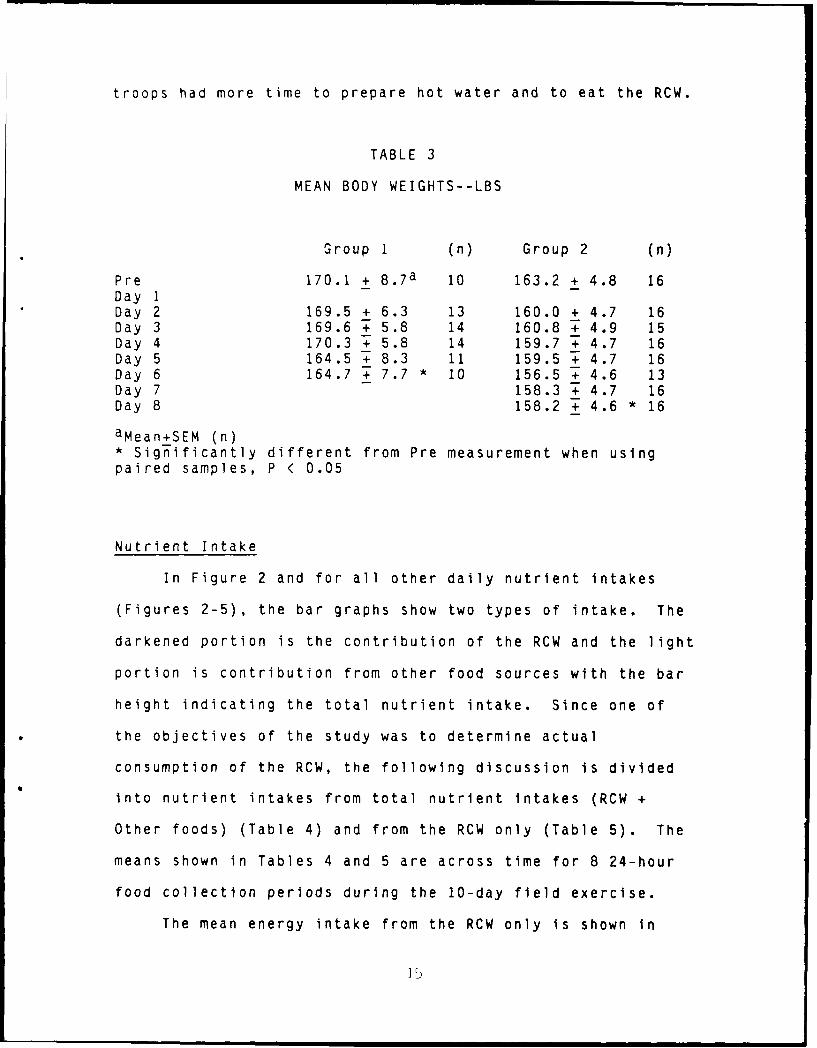
Nutrient Intake
In Figure 2 and for all other daily nutrient intakes
(Figures 2-5), the bar graphs show two types of intake. The
darkened portion is the contribution of the RCW and the light
portion is contribution from other food sources with the bar
height indicating the total nutrient intake. Since one of
the objectives of the study was to determine actual
consumption of the RCW, the following discussion is divided
into nutrient intakes from total nutrient intakes (RCW +
Other foods) (Table 4) and from the RCW only (Table 5). The
means shown in Tables 4 and 5 are across time for 8 24-hour
food collection periods during the 10-day field exercise.
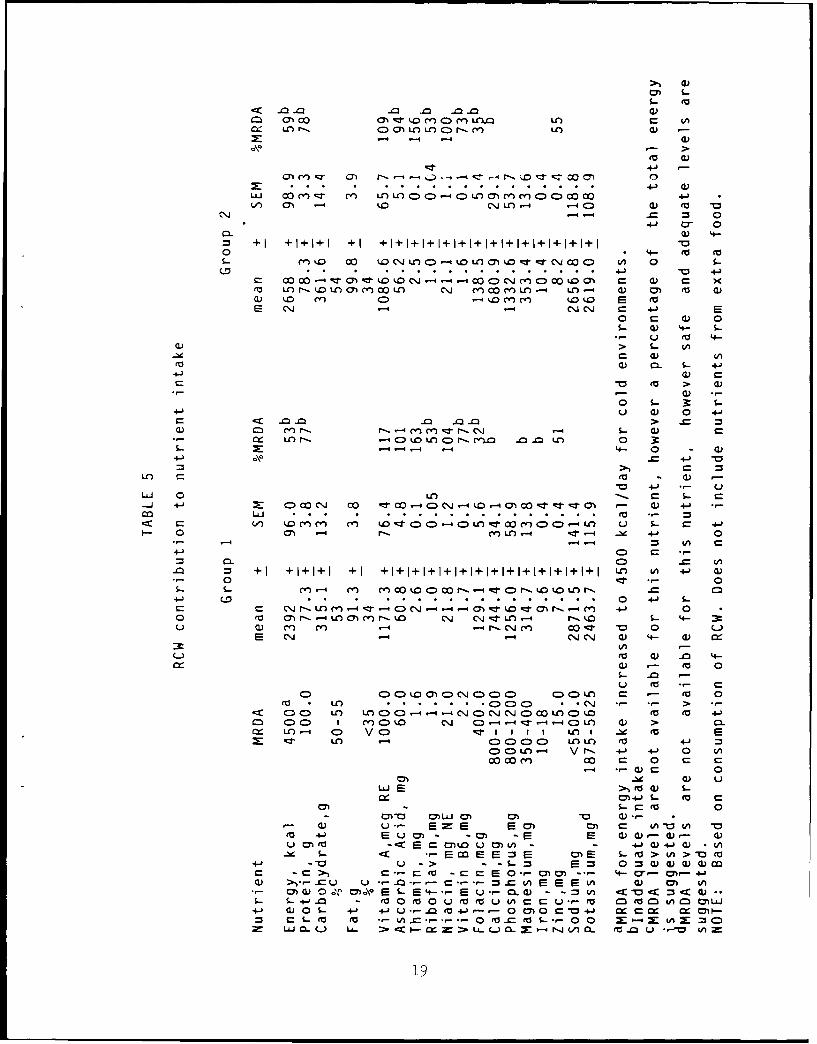
The mean energy intake from the RCW only is shown in
15

Figure 1. The energy consumption for both groups of soldiers
from the RCW only was similar at 2392 and 2658 kcal for
Groups 1 and 2, respectively, and less than 400 kcal higher
for the total energy intake at 2734 and 3029 kcal,
respectively (Tables 5 and 4). Both the RCW only and total
energy intakes were well below the 4500 kcal available in the
RCW and that recommended in the MRDA for work in the cold.
AR40-25 suggests that the energy requirements of soldiers
performing heavy work in a cold environment may be increased
by 25% above that of soldiers who are moderately active and
living in a temperate climate (1). The MRDA for energy
intake is 4500 kcal/day for a soldier in a cold environment
wearing cold weather clothing, heavy footgear, and rucksacks,
and maneuvering for prolonged periods on foot, snowshoes, and
skis (I).
No significant difference exists between the two groups
for energy intake, but there were significant differences
between days. The daily mean values of total energy intake
and RCW intake for both groups are shown in Figure 2. On
those days of movement (1,3,5,6,7), the energy intake was
significantly less than on those days when movement was
minimal. Group 2 movement pattern on Day 3 was quite
different from that of Group 1 which explains the difference
indicated on Figure 2. These significant differences between
days can be attributed directly to activity level and to
availability of water. Day 1 and Day 7 were extreme movement
days for both groups, the water supply was limited, and
1:

1988 6th ID
Energy [3 Group ProteinGroup 2
5000- 80-
70-
21500-
60-
)2000-6)60-
.)
100- 030e 154o- go-
500 0
0-
Carbohydrates Fat
400 100-
300-
4 0-
100-
0 a30
Figure 1. Mean values (across 10 day exercise) for bothgroups for energy and micronutrient intake fromRCW only.
17

0) 0
+j 4
.*L* C ;LD C r a) -LL C=' k- LO CQ--4 - ea
V-4 .- 4 '-.4 14
*4-' a
0a. cuS +1 +1+1+1 +I + 1+I+1+1+I+I+1I I+ I +I + I +I +I1
0 4-. ea1- 0
a,~~~ ~ ~ ~ CZi a)j 00 r*(l com C~ 7 L 4 r- C.0 IQ C )0L E) 0'v
(1) C) ~ -4 C"j 0 -4 Lf z C\jO CD a
(V( -- (
-o~t > -
a)
U a) 0
0 S 00. . 1- a4-- lu U) zl4- O Lo0O)0 0 0
cr kLO ') cl DmlLC 4-- 0 -
m e . r o-- 4-4 CD 4-) oL WC
- CCC
4.--) o*
C; - N-. -La) - ~ C C C 10 . 4--ruk m (V *-L )m :rk nU- )f- r -r
EC - cu. *. . . . . . . . . . . . . . . . . ..00 u %4- C1
0~ 0 CoC> 0) 0Dc DO DC C )C O ae
mJ Lt) .i . . . . )C)C0 Z C) CD1+ +1 +IIIIIII+++++++ C)C - -4-"C (V-iC 0U- D%0(
0'-0 'ej m'~ C~ 00 a -0 .cui 0
E a)~ M- E E- O) ) ~ a - a
(V a) -M -V=
E co E E - .o>0 > -
U > E-V o -wwc ra c r- E 0 01 IX Cy -. 4- - -
)(U ,m -a u L".......... .. .- *n CL\. -' -' = A> = :a
S-- 4-0 0 m r~0o N 0 .44-4- O f a) m > . Mf mV =
Q)0 .-+JU __aeU4- -- 0 0) 0 Vr-. +)=4a 0:S-~~~ ~ ~ ~ Com L c-0M I-MS 0 C
0- ~ ~ ~ ~ ~ ~ ~ ~ ~ ~ -a C. L A - L rjV L MQ U ,-o V
>-,-
CN0 )-* %. C- 0) n rmLOa V0x Ulr C O 0r'.)fl_ m LO ~ W f
*' -4 -4 a
4 4)uQj 000rr) L C ;1 ;L e,1 C 0 -
./) On LO 1. .J7-4 .- 1 CD cu e zS0
+-j a- 0C. 0) 4--
+ +1 +1+1+1 +1I + I+ I+ I+ I+I + I+ I + I+I+ I +I +I +I+ I0 * 4- tv eu
m C\O -4 kD LC\. 0) mJ 00U 5 n0 nL - ) c u c
U '-4
0)~ S .- f
u a) 0 +j
n r- CD. k.0 .C0r- .0 - . LO 3
-j + D.0.j : --~4 C j-4 -M 4-tr rra 0 4- a
C:) a
0 -::r 0
- 41 (D 0CCJ C ) .-a ~ c .l r . M .. . . . . . . . . . . . . . . . .'V W
0 ~ Co (7) r -4 LO040 O C M4 C m r- Co .4JjqrLn0e O n --4 -4 r " M c I.-c -0 .4i
04.44 4/v C- a
0 C
- ~ ~ ~ C CD +11+ (71 +IIII--++IIII++++ U)j C/4 CD- a)C C
0I > .-z C) , o 2)C(D Co C'. CD.U~- r-'o t e 4- 1
U)C) 0) %0 CD -4 -4 : '" CD Ln a) 0>L0rr (J -4 C) C\I). C0)= L O r 4- ja
C) CV an- -, +) +) .0 4-
a) -a ' 0
00'.OO C\J00 00 4 C - tu
0~ 00 r='. cm LA4-4- L a)>04 -) 0 V u - I III LOS (v WV (U-
U > - 0c O -4 Vr- oP = ww 0 umE 0 CM - I-0) 0rh-+
0)WCLN C J* E S-Va 4- -Ca -=- -C a
cSto tOr=es-- 0 x -E X04 LA C: =~/ C
m U04-'V L > -~C n U- L a- X ,4 )a- to a)U---o o'~
-~ - - ~ EE o~ >u O'

>-sFc~- ----------
C,,
S TOI3OOITMT
Figure 2. Daily energy intake for both groups with the RCWcontribution in dark and the total represented bythe height of the bar.

energy intake was decreased. Extreme differences in movement
patterns between groups could also be seen in total energy
consumption on Days 3 and 5. On the days that the soldiers
did not move, their energy intakes increased (Days 2,4,8 for
Group 1; Days 2,3,4,8 for Group 2).
Macronutrients
The mean intake of the macronutrients from the RCW
averaged across the entire study is shown in Figure 1 and
Table 5. Daily mean nutrient intakes (showing total intake
and intake from RCW) of carbohydrate, protein, and fat are
shown in Figures 3,4 and 5 respectively. Although there is
no MRDA for carbohydrate, AR40-25 recommends that 50-55% of
the total dietary energy come from carbohydrate (%CHO). The
two groups of soldiers were consuming an average of 53 and 54
%CHO from the RCW alone (Table 5) and the amount of
carbohydrate consumed was significantly different for the two
groups. Consumption of carbohydrate from the RCW reached a
maximum of 400 g/man/day on Day 4 only. Total carbohydrate
consumption was greater than 400 g/man/day for both groups on
3 days. Soldiers consumed an average of 77 gms of protein
from the RCW (Table 5) which is well below the MRDA level
(100 g/man/day). The total intake of protein met or exceeded
the MRDA only on three days (Figure 4), which coincided with
days of little movement (Days 2,4,8). A possible reason for
the overall low consumption of protein is the erratic
consumption of the entrees, which contain most of the protein
2 1

0 0
(0
It -
0 0 0 0 0 0o 0 0 0 0
Figure 3. Daily carbohydrate intake for both groups with theRCW contribution in dark and the total representedby the height of the bar.
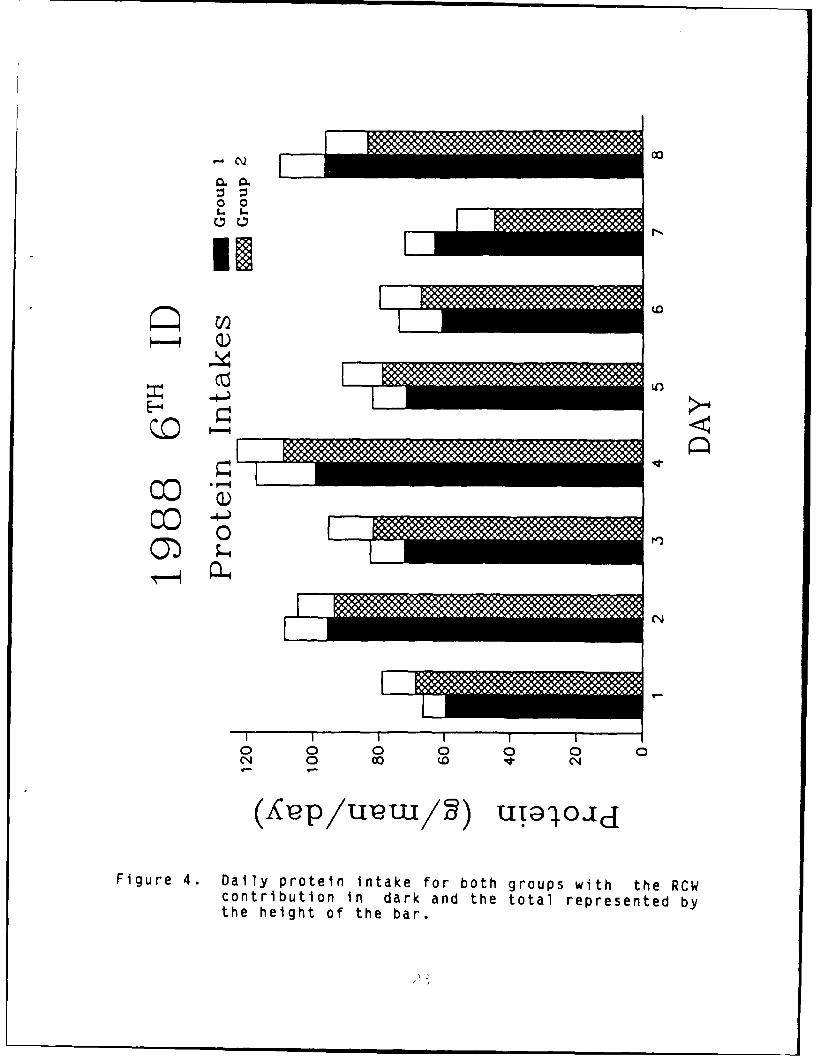
0 0
COL
CC))
IIii II)
I T -
0 0 0 0 0 0 004 0 0 1* 04
Figure 4. Daily protein intake for both groups with the RCWcontribution in dark and the total represented bythe height of the bar.
00
0 0
INM
E-i-
o 0 0 0 0 0 0 01* (4 0 03 (0 (NC1
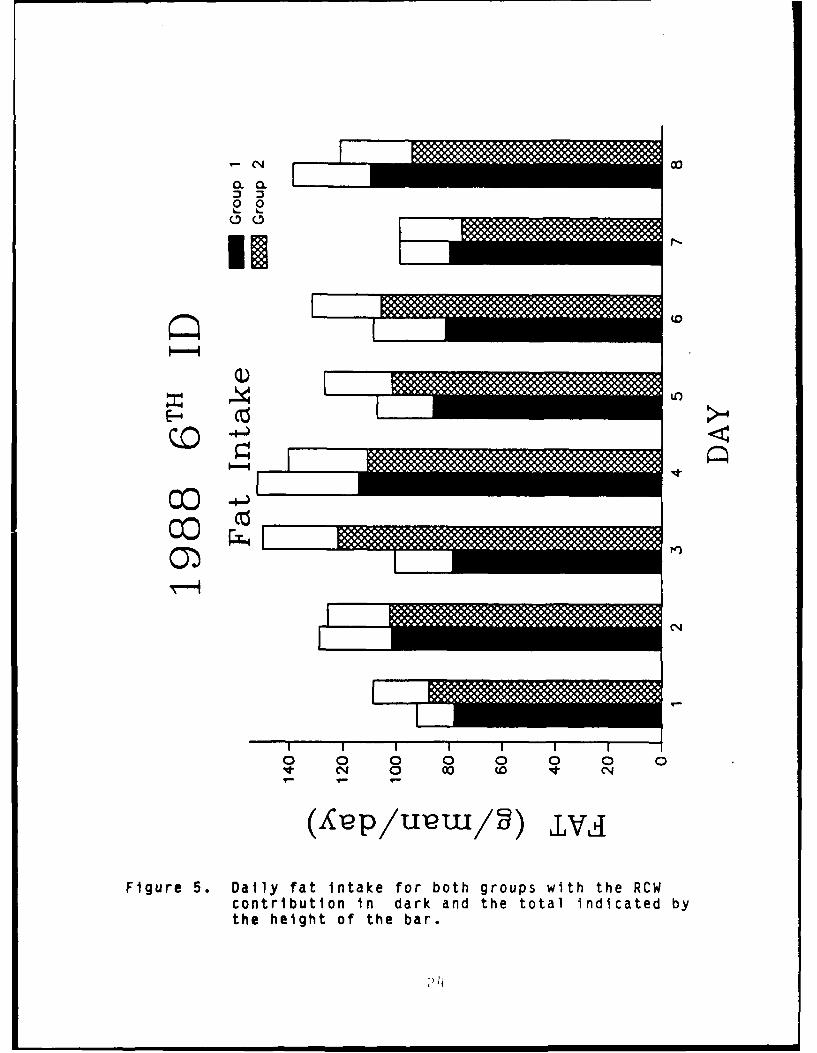
Figure 5. Daily fat intake for both groups with the RCWcontribution in dark and the total indicated bythe height of the bar.

but require hot water for preparation, on the days of heavy
movement. AR40-25 recommends that calories derived from
dietary fat (%FAT) should not exceed 35%, which is equal to a
maximum of 175 g fat for the RCW. Average fat consumption
never reached the maximum recommendation for total fat or RCW
only. The mean intake for Group 1 was 91.3 g/man/day or
34%FAT and 99.8 g/man/day (34%FAT) for Group 2 from the RCW
only.
Micronutrients
Total nutrient intakes for both groups of soldiers met
the MRDA for all micronutrients except riboflavin and
folacin. Folacin intakes were inadequate because adequate
amounts were not available in the RCW (Appendix 7). In
general, the soldiers were receiving sufficient vitamins from
the total foods eaten during the study. However, mean
nutrient intakes from the RCW only met the MRDA for both
groups for vitamin A, niacin, and thiamin only. The soldiers
in Group 1 ingested enough ascorbic acid (60.8 mg) to meet
the MRDA, however those in Group 2 ingested inadequate
amounts (i.e., nutrient intakes were below the MRDA). For
all other micronutrients (riboflavin, vitamin B6 , and
folacin), mean intakes from the RCW only were inadequate
(Table 5) for both groups. Vitamin A intake contributed by
the RCW was adequate for the total mean intakes for both
groups (1171.3 and 1086.6 mcg RE) but some high activity days
(leading to decreased food intake) showed daily values below
the MRDA (1000 mcg RE/man/day) for both groups.
Minerals
Phosphorus was the only mineral whose intakes met or
exceeded the MRDA. Total and RCW sodium intakes (Tables 4 &
5) were excellent and well below the maximum MRDA of 5500
mg/day. Sodium intakes were also well below the 4500 mg
upper limit that evolved from the work of Tappan (17) for
cold environments. Potassium intakes were within the MRDA.
The MRDA were not met for both groups for calcium, magnesium,
and iron when only the RCW was considered but were met when
total food intakes were summed. Mean intakes of zinc from
the RCW were about half the MRDA (15 mg/man/day) but this
inadequacy could be a function of missing information in the
nutrient data bank since many values for this particular
nutrient were left blank. Another reason could be that
inadequate levels of zinc were available in the RCW (range
7.08-16.18 mg/RCW) depending on the menu.
Ration consumption
Appendix 8 shows that all the study subjects were
consuming from 0.4 to 90.2% of the RCW components. Less than
25% of the following RCW components were eaten: gum (0.4%),
cream, sugar, coffee, cocoa, fruit soup, chicken noodle soup,
cider, and orange beverage base. The troops appeared to like
the dessert type items since they consumed 90.2% of the
b.-ownies and chocolate covered cookies and the next highest

percentage was 74.3 and 71.5% for the raisin nut crunch and
chocolate toffee bar, respectively. The consumption pattern
shows the soldiers did not like or were not able to consume
the items that required hot water for preparation such as
cocoa, fruit soup, chicken noodle soup, etc but the reasons
for the low consumption cannot be determined. Only 70% of
the entrees were consumed which reflects the inadequate
protein intakes (Table 5).
Nutritional status
The results of the pre- and post-field exercise blood
chemistries are reported in Table 6. Pre- vs. post-field
exercise changes in blood chemistries within both groups were
compared using a paired t-test with each group serving as
its own control. Significant differences were found in some
pre-to-post comparisons within both groups but all levels
remained well within normal physiological ranges. The post-
field exercise values may not have been an accurate
reflection of the worst state of the soldiers. The final
blood samples were taken two days after a difficult overnight
movement (ski-joring and helicopter airlift). However, both
groups had consumed greater quantities of RCW and other foods
on Day 7, two nights before the post-exercise blood samples
were taken. Of special interest is the fact that post-field
exercise blood values decreased significantly for both groups
for cholesterol, triglycerides, A/G ratio, and glucose and
significantly increased for protein and globulin.

Table 6
Blood Chemistries
Group 1 Group 2
Pre Post Pre Post Normal
Protein, gm/dl 6.7 7.1* 6.7 7.0* 6.0-8.5Albumin, gm/dl 4.6 4.7 4.5 4.5 3.2-5.5Globulin, gm/dl 2.2 2.4* 2.2 2.5* 1.5-3.8A/G ratio 2.2 2.0* 2.1 1.9* 1.0-2.7Bilirubin-T, mg/dl 0.5 0.7 0.5 0.5 0.2-1.2SGPT, IV/L 23.0 18.0* 26.0 16.0* 0.0-55SGOT, IV/L 18.0 28.0* 22.0 27.0* 0.0-50Alkal Phos, IV/L 87.0 80.0 93.0 90.0 20-140Lactic Deh, V/L 128.0 180.0* 142.0 187.0* 0.0-250Urea Nitrog, mg/dl 13.0 14.0 14.0 16.0 7.0-25Creatinine, mg/dl 0.9 1.0 1.0 1.0 0.7-1.4BUN/Creatinine 13.0 13.0 13.0 16.0 10-24Uric Acid, mg/dl 6.2 6.2 5.8 6.1 2.5-8.5Calcium, mg/dl 9.7 10.1* 9.8 9.9 8.5-10.6Inorg Phosph, mg/dl 4.5 4.1* 4.4 4.4 2.5-4.5Cholesterol, mg/dl 175.0 148.0* 172.0 140.0* 140-250Triglycerides,mg/dl 132.0 60.0* 100.0 55.0* 20-160Glucose, mg/dl 100.0 84.0* 98.0 83.0* 70-115Sodium, mEq/L 142.0 141.0 142.0 139.0 135-148Potassium, mEq/L 4.4 4.5 4.6 4.5 3.5-5.3Chloride, mEq 104.0 105.0 104.0 104.0 96-112CO 2 Content,mEq/L 31.0 29.0* 31.0 28.0* 20-34
*P < 0.05
Trace amounts of urinary acetoacetone (ketone) were
detected by use of urinary dipsticks. These data are snown
in Figure 6. The presence of small amounts of ketone in the
urine indicates a caloric deficit requiring body fat
mobilization and oxidation. Although there were slight
differences in the incidence of soldiers with ketosis
between the two groups (notably Days 2,5,6), the differences
were not significant. The differences on the days mentioned
above could be explained by the different movement and

00S.. 6
CC)
a CO r o -
o 0o 0 n0b 0. 0
Figure 6. The frequency of subjects in both groups testing
positive for urinary acetoacetone.
2 r

hydration patterns of the two units in the time preceding the
urine collection. Group I suffered from frozen water
supplies on Day 1, had a hard move (12 miles) into a new area
to prepare for an ambush on Day 4, and did not get supplied
until late on Day 5. This would not normally cause a problem
with consumption of the RCW since this ration was carried on
the soldier, but the troops could not make their own water
and therefore did not have water to rehydrate their food.
Group 2 moved on Day 5, but the new area had been supplied
with water by that time. The entire company had a difficult
move on the night of Day 6, but Group 1 performed this
movement (ski-joring and helicopter airlift) with little or
no water. The energy intake data (Figure 2) did not decrease
on Day 6 which does not appear to support this theory but the
figure shows data accumulated over a 24-hour period while
early morning urine collections show physiological status for
a shorter and more recent period of time. The incidence of
ketone production decreased when food and water were
consumed.
The serum proteins (albumin and globulin) can be
indicators of malnutrition in long term starvation. Elevated
albumin is a moderately good indicator of protein status
while elevated globulin is an indicator of hypohydration,
especially when the albumin/globulin ratio is constant. The
pre- to post-field exercise levels of protein and globulin
were significantly elevated in both groups. Albumin was
essentially constant for both groups. The A/G ratio was

significantly decreased in both groups. This could be an
indication that there was a modest decline in the protein
status of the subjects which could have become more
significant over a greater time frame. It is possible but
unlikely, that hypohydration was a confounding factor in the
protein profile since the specific gravities (Figure 9) of
the subjects, pre- and post-field exercise, were fairly
normal.
Elevated levels of blood urea nitrogen (BUN) are
indicative of increased protein breakdown or dehydration
while decreased levels are associated with decreased protein
ingestion and overhydration. In both groups, there was a
slight, but insignificant increase in BUN, but all values
were within the normal range. An analysis of the urinary
specific gravities indicate that both groups were hydrated
when blood was collected.
Small amounts of protein were detected in the urine of
the soldiers. In healthy individuals, up to 0.1 g/day of
protein can appear in the urine. The larger amounts of
protein in the urine were probably due to the severe muscular
exertion that the troops underwent in the field exercise.
There were no indications of renal disease causing protein
to appear in the urine.
Blood glucose levels were within the normal range (70-
115 mg/dl), but dropped significantly pre- to post-field
exercise in both groups. The decrease appeared to reflect
the low dietary carbohydrate intake for the 8 days. Glucose
31
regulation appeared to be working well and hypoglycemia was
not a problem even in the face of the reduced carbohydrate
intake (<400 gms/day) and heavy activity (increased demand).
Elevated levels of both cholesterol and triglycerides
are considered risk factors in atherosclerotic heart disease.
Cholesterol and triglyceride levels can vary greatly in
blood, but are usually dependent on dietary intake of animal
fat and exercise levels. The data for triglycerides and
cholesterol are shown in Table 6. The values are within the
range of normal for both constituents for both pre- and post-
field exercise samples, but they also show a significant
decrease from pre- to post-field exercise, which was probably
a reflection of the reduced level of fat consumption (Figure
5) and the increased physical exertion associated with the
operational training. The low cholesterol consumption from
the RCW probably contributed to the low blood cholesterol.
The analysis of cholesterol in the RCW is incomplete but
analysis of major sources of cholesterol such as the meat
entrees and cookies show only 183 mg of cholesterol available
in an entire day's ration.
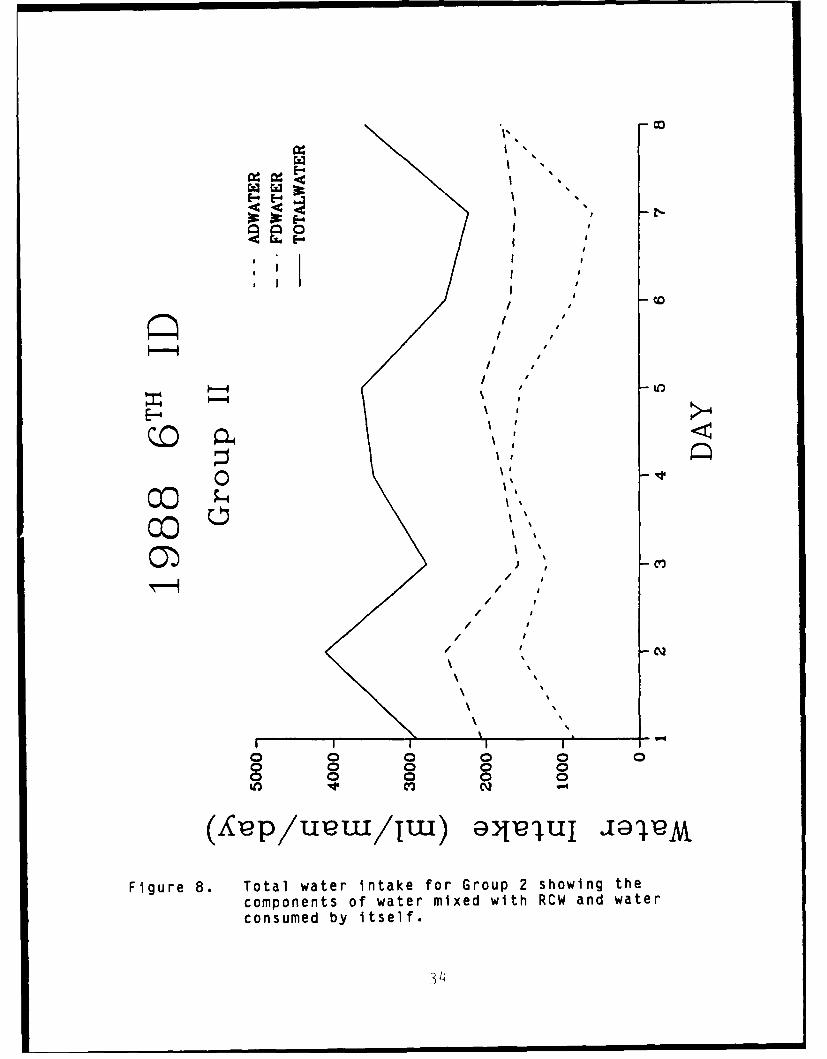
Water Intake
The data for water intake (Figures 7 and 8) were
obtained from the 24-Hour Food and Fluid Record cards
(Appendix 2) and verified daily by interview. This technique
has been utilized in prior studies and has shown a high
correlation when compared to more controlled laboratory

--1
E E-II
I II I
II- -- I
Q0 / -
II
III
C,,
III I I
o o 0 0 0 0o o 0 0 0o o 0 0 0
M0C CZ 'a-1
Figure 7. Total water intake for Group 1 showing thecomponents of water mixed with RCW and waterconsumed by itself.
J)~
*; i I ,
'I I* I I I (
I ,I I
/ ,
/ I- It
00I'
/ I\
I 1\ \ I l " I
00 a 0 0 000 0 0 0o 0 0 0 0
to v 0r 0 V0
Figure 8. Total water intake for Group 2 showing thecomponents of water mixed with RCW and waterconsumed by itself.
34

methods (3).
The 6th ID (L) has an operational standard that each
soldier should consume at least 4 L/day of water. On this
operation, all water was supplied to the company units in 5
gallon cans carried by the SUSV. The source of the water was
an approved supply point (portable water purification plant
or water storage unit), and the individual soldier was not
allowed to melt snow or ice. This company consisted of 120
soldiers and would require at least 480 L (approximately 26
cans) of unfrozen water each day.
For the entire study, the soldiers in Group 1, who were
forcing fluids, ingested an average of 3.68 + 0.14 L/day of
water. The daily water intake data for Group 1 are shown in
Figure 7. The data consist of the water mixed with the
ration components (FDWATER) and that consumed as drinking
water or mixed with drinks (ADWATER). Day 1 was a problem
for this group since their water cans were frozen on the trip
to the Airhead and therefore their intake was reduced.
Starting on Day 2, an additional 15 gallons of water was made
available to Group I to ensure hydration. They maintained
their intake levels above the operational standard for the
next three days and then leveled off around 3 L/day for the
rest of the exercise. In the last half of the study, they
still met the minimLn water intake (3 L/day) recommended for
consumption of this ration by the US Marine Corps (7,17).
Although the soldiers in Group 1 were supposed to be forcing
fluids and were provided with extra water, their mean intake

did not reach the operational standard of 4 L/day.
Group 2 (Figure e started the field exercise drinking
more water (about 500 ml) than Group 1 because they arrived
at the Airhead without their water supply being frozen.
However, their average water intake only reached 4 L/day on
Day 2. For the duration of the study, their intake hovered
between 2.5 and 3.5 L/day. The soldiers in Group 2 did not
meet the minimum recommendation of 3 L/day on a daily basis;
however, their mean water intake of 3.36 + 0.15 L/day was
sufficient to maintain a hydration status that was in the
high normal range (by specific gravity measurement) during
the study. The difference in water intake between the two
groups was less than 0.32 L/day and not statistically
significant. In past studies (7,14,19), voluntary
consumption of water was insufficient to maintain hydration.
In light of this past data, the question should be asked
about whether the troops in both groups were maintaining
hydration because they were being tested or was this level of
hydration normal for the Arctic troop? Specific gravity
measurements of first-void urine collected from soldiers not
involved with the RCW test had an average value of 1.030 on
the two days (Day 7, n=10; Day 10, n=25) it was taken (Figure
9). This indicates that the level of hydration of the test
subjects was higher than that of most of the soldiers that
were not part of the test.
_'O
Hydration Status
The state of hydration was inferred from measures of
urinary specific gravity, analysis of urinary sodium and
potassium, as well as pre- and post-measures of hematocrit
(Hct) and serum osmolality (Osm).
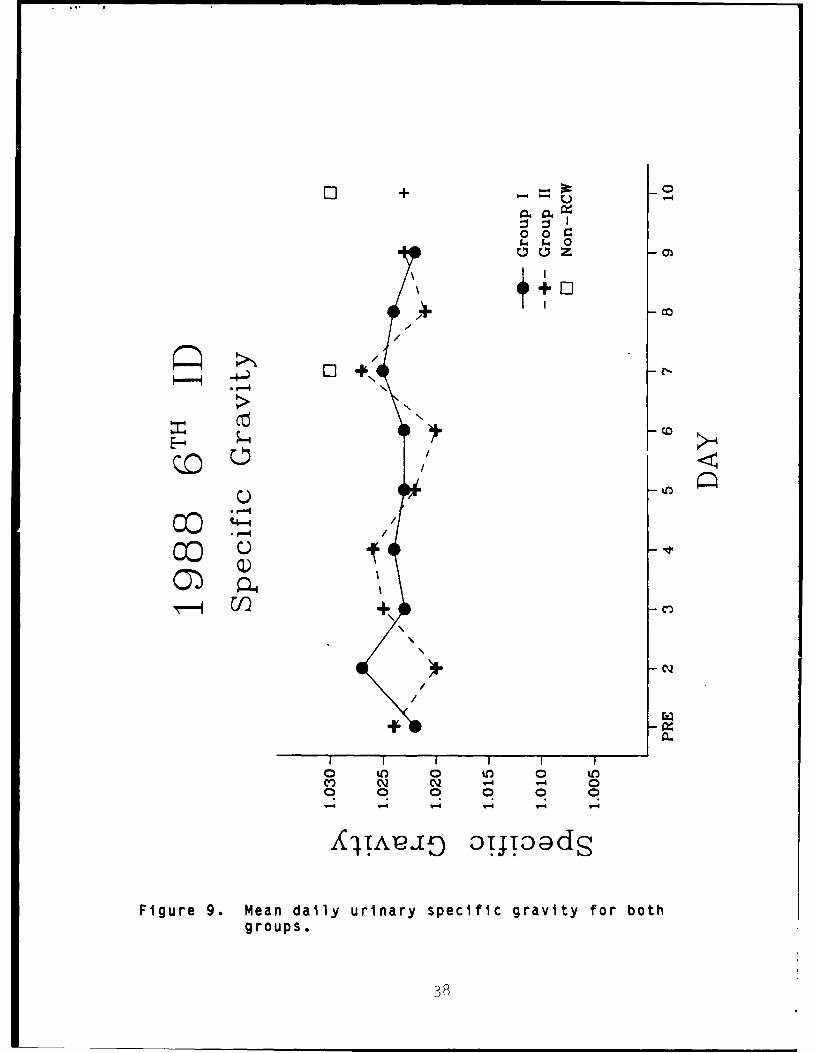
The mean values for urinary specific gravity (SG) are
shown in Figure 9. A "normal" range for urinary specific
gravity values for an overnight urine for a well hydrated
subject is 1.015 to 1.022. Values of 1.030 or greater are
indicative of hypohydration (4). In general, the means show
that the troops in both groups were in the high normal range
of hydration status by SG measurements. Various individuals
were hypohydrated (SG > 1.030), but no individual was
consistently hypohydrated for the entire study. In the 24
hours preceding the exercise, Group 1 (encouraged to force
fluids) had an average SG value (1.022) at the upper limit of
normal with no subjects with SG > 1.030. Group 2 had an
overall higher average (1.024) with 2 subjects (12%) having
SG > 1.030. There were no urine collections on the morning
of Day 1. On the morning of Day 2, the mean values
switched, with the SG value for Group 1 increasing to 1.027
and 6 subjects (40%) have SG values > 1.030. The SG in
Group 2 decreased, but 4 subjects (25%) still had SG above
1.030. The switch in hydration status on Day 2 was probably
due to the water supplies being frozen for Group 1, whereas
Group 2 had water available right after deployment. The
degree of hypohydration was very indicative of the uneven
37
+ -- 0-U
/
Q0 0 z/
CO,-4
II I I I Io 10 0 10 0 10
- -
0 0 0 0 0 0
1Q1A~tD OTJTDodS
Figure 9. Mean daily urinary specific gravity for both
groups.
38

distribution of the water resources on hand. The higher
level of water intake by Group 1 (Figure 7) reduced the level
of hypohydration (down to 20%) by Day 3 and Day 4 and even
lower on Day 5. Because Group 2 had an overall lower water
intake (Figure 8), they maintained a high normal specific
gravity with 15 - 20% of troops having SG greater than 1.030.
The incidence of high SG was low on Day 7, which followed a
night movement, but the mean increased for Group 2. The last
day in a stationary position produced lower SG readings.
Other indices of hypohydration are the sodium/potassium
ratio (Figure 10), hematocrit (Table 7), and serum osmolality
(Table 7) measurements (6). The hematocrit values were
normal and did not change across the study. The same
relationship was true for the serum osmolality values.
Table 7
Hemoglobin, hematocrit, and serum osmolality
Group 1 Group 2
Pre Post Pre Post
Hgb 16.06 15.95 16.30 16.08+ 0.05 + 0.09 + 0.10 + 0.15
Hct 44.6 44.5 45.3 44.0+ 0.4 + 0.3 + 0.3 + 0.4
Osm 284.2 286.3 286.7 286.3+ 1.2 + 1.1 + 1.0 + 1.1
The urinary sodium/potassium ratio decreased from the
39

C4 (7a. 0.I
0 0
(DD
00
0000
LJ
(0 V W N0
+>/,+DN kjD)uL.1jfn
Figure 10. Mean daily urinary sodium and potassium expressed
as a ratio.
40

pre-fleld exercise measures to Day 2 and remained low
thereafter. This is consistent with hypohydration and the
body weight loss reported. The large decrease may be due to
an abnormally heavy salt load due to "junk" food loading
prior to departure for the field.
Ration Acceptability
A total of 29 soldiers were asked to fill out
questionnaires rating the Ration, Cold Weather (Appendix 5)
after consuming the ration for 8 days under field
conditions. Of these, 23 were E-2s, 1 was an E-4, two were
E-5s, one was an E-6, and two were O-2s. These respondents
had an average age of 21.1 years and had served an average of
1.9 years in the Armed Forces.
The first section of this questionnaire asked these
soldiers to indicate how much they liked each of the various
RCW components. The results can be seen in Table 8. In
general, with but one exception (granola bar), the mean
ratings were on the positive side of the nine-point hedonic
scale. However, almost half of the items (11 each) were
rated only slightly above, or within one point of, the
neutral point of 5 on the scale. Fourteen of the items were
rated above point 6 (like slightly) on the scale. The items
with the highest ratings were mostly in the sweet dessert
category, including the fig bar (8.1), the blueberry bar
(7.7), raisin-nut crunch (7.6), chewing gum (7.3), and
chocolate-covered cookies (7.2). This rating was supported
41
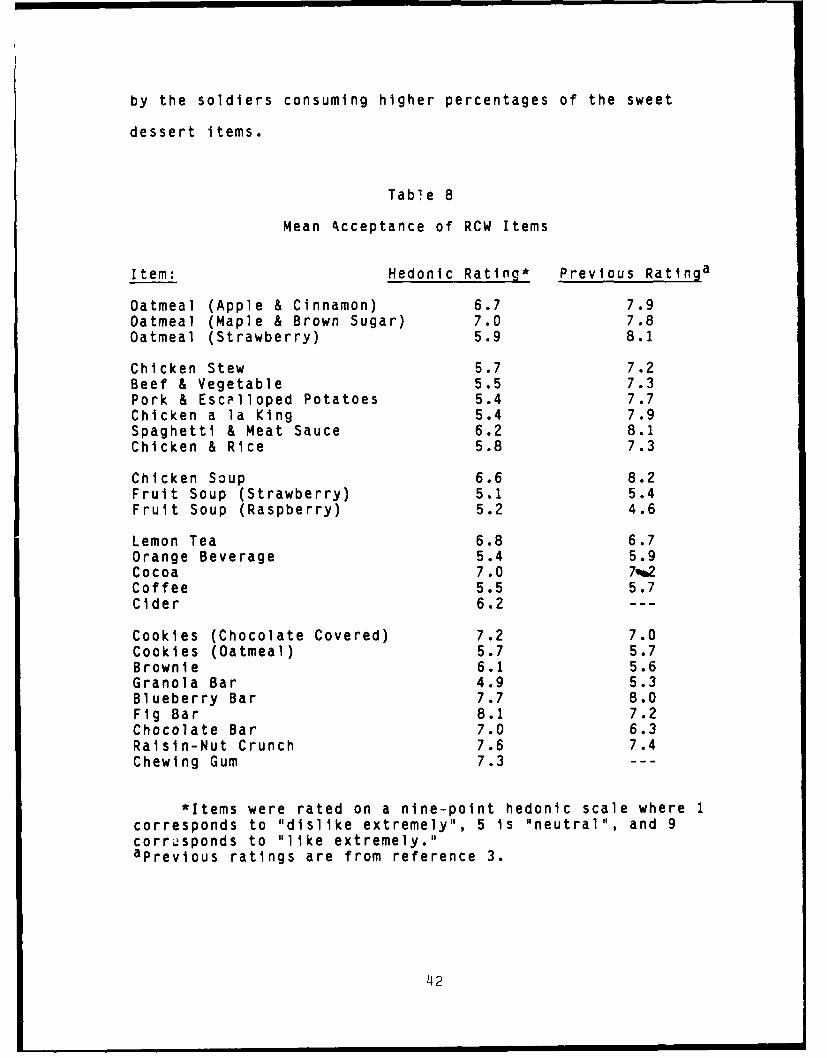
by the soldiers consuming higher percentages of the sweet
dessert items.
Table 8
Mean 4cceptance of RCW Items
Item: Hedonic Rating* Previous Ratinga
Oatmeal (Apple & Cinnamon) 6.7 7.9Oatmeal (Maple & Brown Sugar) 7.0 7.8Oatmeal (Strawberry) 5.9 8.1
Chicken Stew 5.7 7.2Beef & Vegetable 5.5 7.3Pork & Esclloped Potatoes 5.4 7.7Chicken a la King 5.4 7.9Spaghetti & Meat Sauce 6.2 8.1Chicken & Rice 5.8 7.3
Chicken Soup 6.6 8.2Fruit Soup (Strawberry) 5.1 5.4Fruit Soup (Raspberry) 5.2 4.6
Lemon Tea 6.8 6.7Orange Beverage 5.4 5.9Cocoa 7.0 7%62Coffee 5.5 5.7Cider 6.2
Cookies (Chocolate Covered) 7.2 7.0Cookies (Oatmeal) 5.7 5.7Brownie 6.1 5.6Granola Bar 4.9 5.3Blueberry Bar 7.7 8.0Fig Bar 8.1 7.2Chocolate Bar 7.0 6.3Raisin-Nut Crunch 7.6 7.4Chewing Gum 7.3
*Items were rated on a nine-point hedonic scale where 1
corresponds to "dislike extremely", 5 is "neutral", and 9corresponds to "like extremely."aprevious ratings are from reference 3.
42

In comparison with a previous evaluation of the RCW (3),
the ratings of the same items in the present study were
generally lower, often one to two points lower.
Specifically, 16 items were rated lower, one the same as, and
7 higher than before. In general, the entrees were rated
lower in the present study while the desserts were rated
higher than in the previous study. Since these rations were
made at the same time as those in the previous RCW studies
(3,11), a reason for the lower rating could be deterioration
of the RCW quality. However, Morgan et al. (11) used rations
from the same lot (packed January 1986) and conducted their
study at the same time (January 1988) and the hedonic ratings
for those RCW components were much higher than in the present
study and about the same as the 1986 study (3).
Table 9 presents the subjects' ratings of the RCW by the
time of the meal. The RCW was less well accepted at
breakfast, with a mean rating of 4.7, where numbers below the
neutral point of 5 indicate increasing dislike. The RCW was
rated somewhat more favorably at lunch and dinner, though
these mean ratings did not exceed a rating of 6 (like
slightly). Apparently, these soldiers did not like these
kinds of foods for breakfast as they did for other meals.
Since oatmeal was the only breakfast-type component and it
received fairly good ratings (5.9 - 7.0), the scarcity of
breakfast type items could be a contributing factor to the
low breakfast rating.
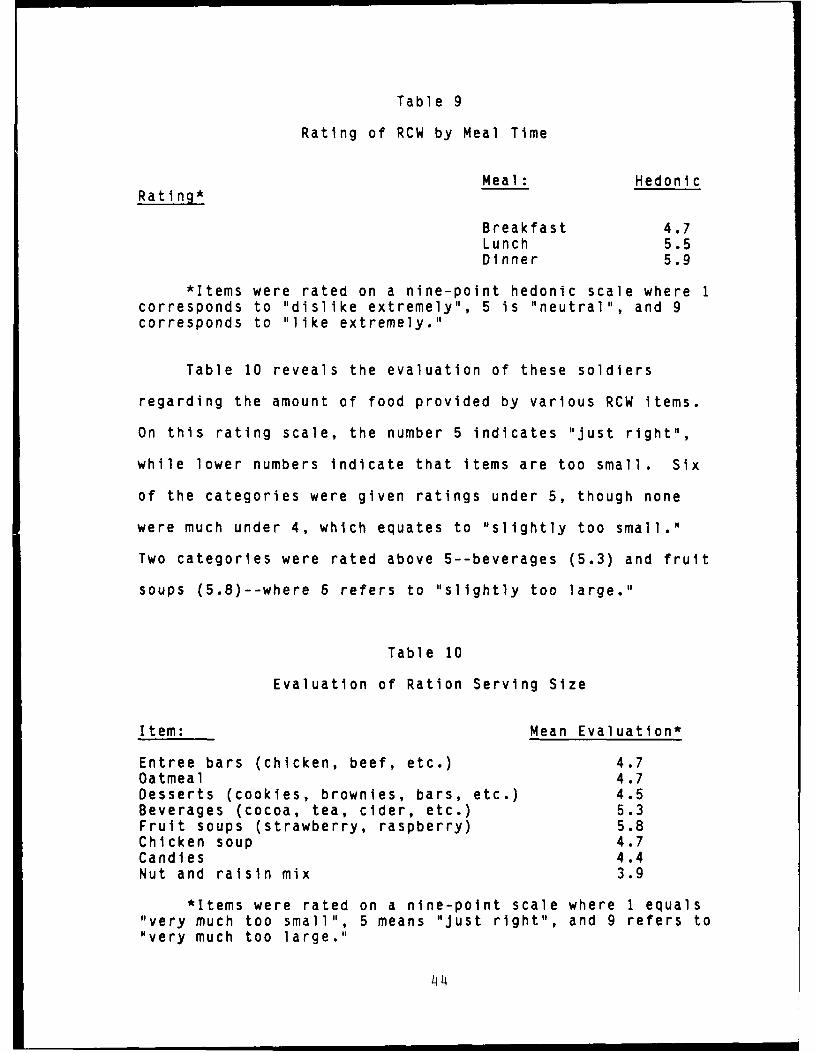
Table 9
Rating of RCW by Meal Time
Meal: HedonicRati fng*
Breakfast 4.7Lunch 5.5Dinner 5.9
*Items were rated on a nine-point hedonic scale where 1
corresponds to "dislike extremely", 5 is "neutral", and 9corresponds to "like extremely."
Table 10 reveals the evaluation of these soldiers
regarding the amount of food provided by various RCW items.
On this rating scale, the number 5 indicates "just right",
while lower numbers indicate that items are too small. Six
of the categories were given ratings under 5, though none
were much under 4, which equates to "slightly too small."
Two categories were rated above 5--beverages (5.3) and fruit
soups (5.8)--where 6 refers to "slightly too large."
Table 10
Evaluation of Ration Serving Size
Item: Mean Evaluation*
Entree bars (chicken, beef, etc.) 4.7Oatmeal 4.7Desserts (cookies, brownies, bars, etc.) 4.5Beverages (cocoa, tea, cider, etc.) 5.3Fruit soups (strawberry, raspberry) 5.8Chicken soup 4.7Candies 4.4Nut and raisin mix 3.9
*Items were rated on a nine-point scale where 1 equals
"very much too small", 5 means "just right", and 9 refers to"very much too large."
44
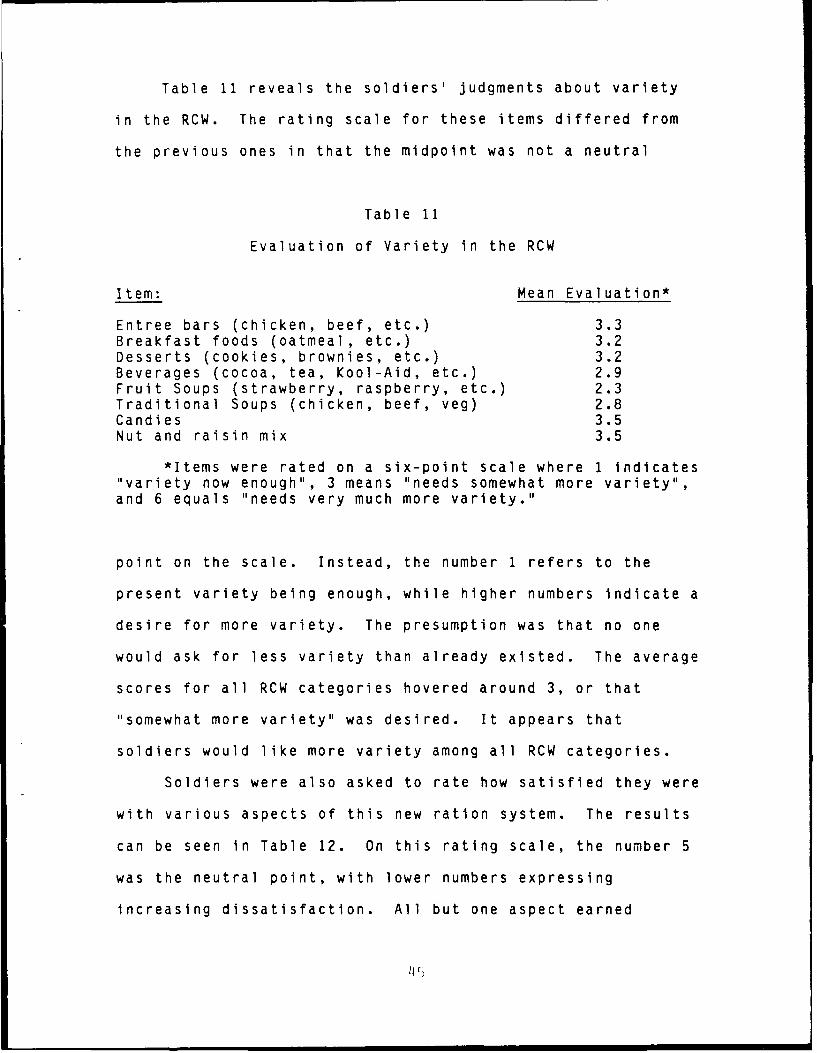
Table 11 reveals the soldiers' judgments about variety
in the RCW. The rating scale for these items differed from
the previous ones in that the midpoint was not a neutral
Table 11
Evaluation of Variety in the RCW
Item: Mean Evaluation*
Entree bars (chicken, beef, etc.) 3.3Breakfast foods (oatmeal, etc.) 3.2Desserts (cookies, brownies, etc.) 3.2Beverages (cocoa, tea, Kool-Aid, etc.) 2.9Fruit Soups (strawberry, raspberry, etc.) 2.3Traditional Soups (chicken, beef, veg) 2.8Candies 3.5Nut and raisin mix 3.5
*Items were rated on a six-point scale where 1 indicates
"variety now enough", 3 means "needs somewhat more variety",and 6 equals "needs very much more variety."
point on the scale. Instead, the number 1 refers to the
present variety being enough, while higher numbers indicate a
desire for more variety. The presumption was that no one
would ask for less variety than already existed. The average
scores for all RCW categories hovered around 3, or that
"somewhat more variety" was desired. It appears that
soldiers would like more variety among all RCW categories.
Soldiers were also asked to rate how satisfied they were
with various aspects of this new ration system. The results
can be seen in Table 12. On this rating scale, the number 5
was the neutral point, with lower numbers expressing
increasing dissatisfaction. All but one aspect earned
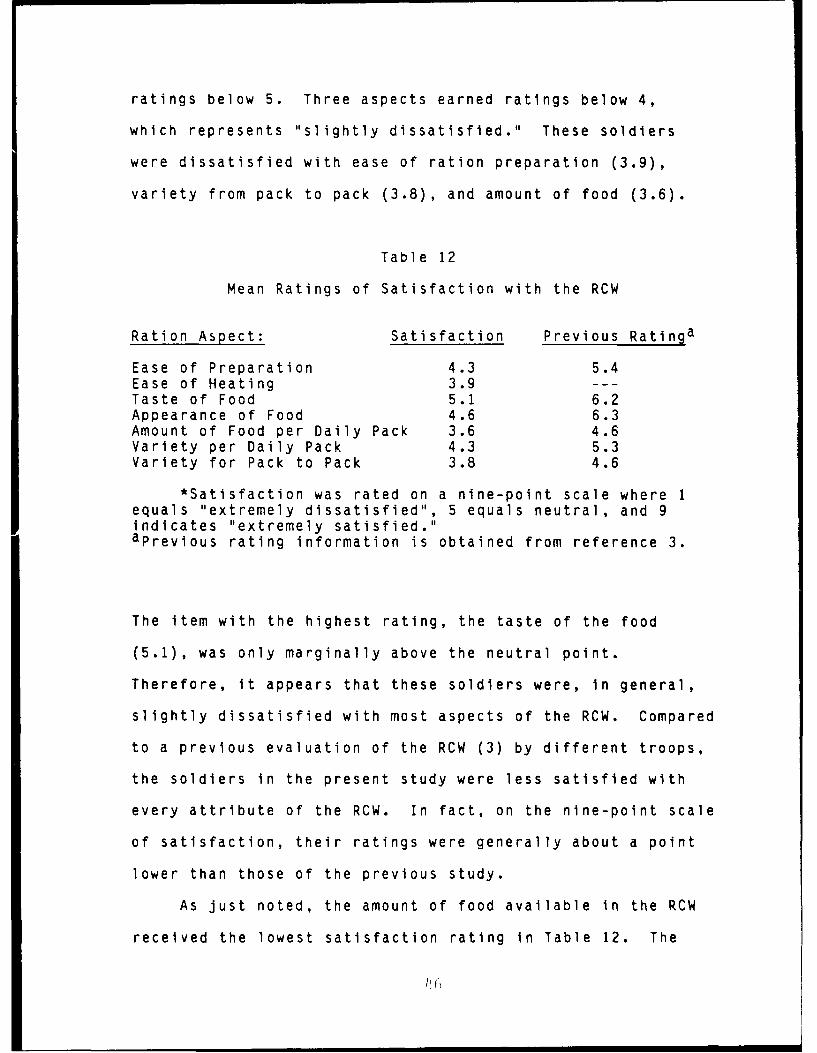
ratings below 5. Three aspects earned ratings below 4,
which represents "slightly dissatisfied." These soldiers
were dissatisfied with ease of ration preparation (3.9),
variety from pack to pack (3.8), and amount of food (3.6).
Table 12
Mean Ratings of Satisfaction with the RCW
Ration Aspect: Satisfaction Previous Ratinga
Ease of Preparation 4.3 5.4Ease of Heating 3.9 ---Taste of Food 5.1 6.2Appearance of Food 4.6 6.3Amount of Food per Daily Pack 3.6 4.6Variety per Daily Pack 4.3 5.3Variety for Pack to Pack 3.8 4.6
*Satisfaction was rated on a nine-point scale where 1equals "extremely dissatisfied", 5 equals neutral, and 9indicates "extremely satisfied."aprevious rating information is obtained from reference 3.
The item with the highest rating, the taste of the food
(5.1), was only marginally above the neutral point.
Therefore, it appears that these soldiers were, in general,
slightly dissatisfied with most aspects of the RCW. Compared
to a previous evaluation of the RCW (3) by different troops,
the soldiers in the present study were less satisfied with
every attribute of the RCW. In fact, on the nine-point scale
of satisfaction, their ratings were generally about a point
lower than those of the previous study.
As just noted, the amount of food available in the RCW
received the lowest satisfaction rating in Table 12. The

answers to these questions support the data in Table 10 in
which the soldiers rated the serving size of the components
as too small. However, soldiers were also asked why they
did not get enough to eat during the exercise. Their
responses are listed in Table 13 in order of decreasing
frequency of response.
Table 13
Reasons for Not Getting Enough to Eat
Item: Frequency: Per Cent:
Insufficient time for preparation 21 72.4No heat source for heating. 21 72.4Not enough water for preparation. 16 55.2Insufficient time to eat. 15 51.7Too much trouble to prepare. 14 48.3Disliked the food in the RCW. 13 44.8Not enough food provided. 10 34.5Too cold to eat. 7 24.1Poor heat source for heating. 7 24.1Boredom due to insufficient variety. 5 17.2
As this table illustrates, the most common reasons for
not getting enough to eat had little to do with the quality
or quantity of the ration itself. Rather, they dealt with
environmental factors such as insufficient time, heat
sources, or water for food preparation. However, the sixth
and seventh most common responses, disliking the food (44.8%)
and insufficient quantity (34.5%), did refer to the ration
itself. Therefore, when these soldiers did not get enough to
eat, the problem was due most commonly to environmental
conditions, and in less than half of the cases, it was due to
47
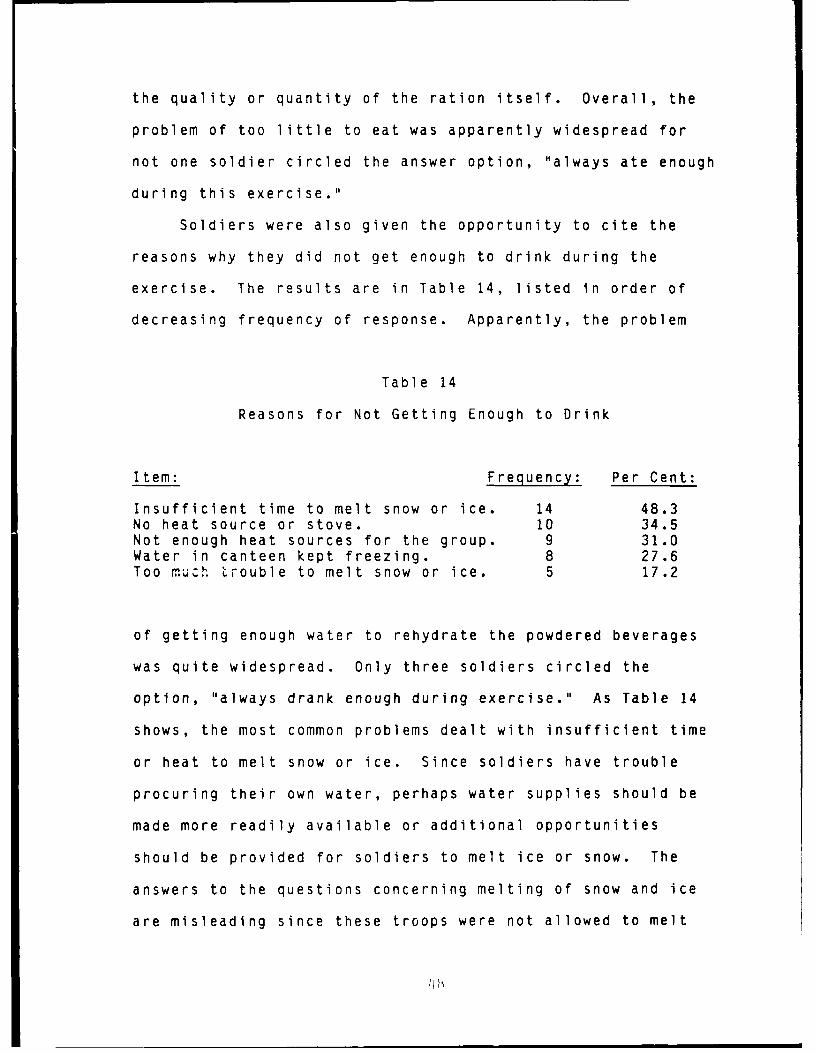
the quality or quantity of the ration itself. Overall, the
problem of too little to eat was apparently widespread for
not one soldier circled the answer option, "always ate enough
during this exercise."
Soldiers were also given the opportunity to cite the
reasons why they did not get enough to drink during the
exercise. The results are in Table 14, listed in order of
decreasing frequency of response. Apparently, the problem
Table 14
Reasons for Not Getting Enough to Drink
Item: Frequency: Per Cent:
Insufficient time to melt snow or ice. 14 48.3No heat source or stove. 10 34.5Not enough heat sources for the group. 9 31.0Water in canteen kept freezing. 8 27.6Too much trouble to melt snow or ice. 5 17.2
of getting enough water to rehydrate the powdered beverages
was quite widespread. Only three soldiers circled the
option, "always drank enough during exercise." As Table 14
shows, the most common problems dealt with insufficient time
or heat to melt snow or ice. Since soldiers have trouble
procuring their own water, perhaps water supplies should be
made more readily available or additional opportunities
should be provided for soldiers to melt ice or snow. The
answers to the questions concerning melting of snow and ice
are misleading since these troops were not allowed to melt

snow or ice and were not supplied with the means to do so.
These soldiers were asked additional questions about how
often they had trouble getting enough to eat and drink, and
the results are in Table 15. On this scale, most of the
results hovered around point 4, or "fairly often." In other
words, these soldiers said that they fairly often went both
hungry and thirsty in the field. However, they also said
that they fairly often had enough water for food preparation.
Table 15
Frequency of Deprivation
Item: Mean Frequency*
How often hungry in the field? 4.5How often thirsty in the field? 3.8How often had enough water for food prep? 4.3
*Questions were answered on a seven-point scale in which
1 equals "never", 4 equals "fairly often", and 7 equals"always."
This supplements the finding in Table 13 that 55.2% of the
soldiers reported at times not having enough water to prepare
their rations. Apparently the frequency of that lack of
water for food preparation was not too high. When asked in
yet another way about the difficulty in obtaining water, the
subjects' average response was 5.3 on a nine-point scale in
which 5 is the neutral point and 6 equals "slightly
difficult."
The need for water in rehydrating various components of
LI 9
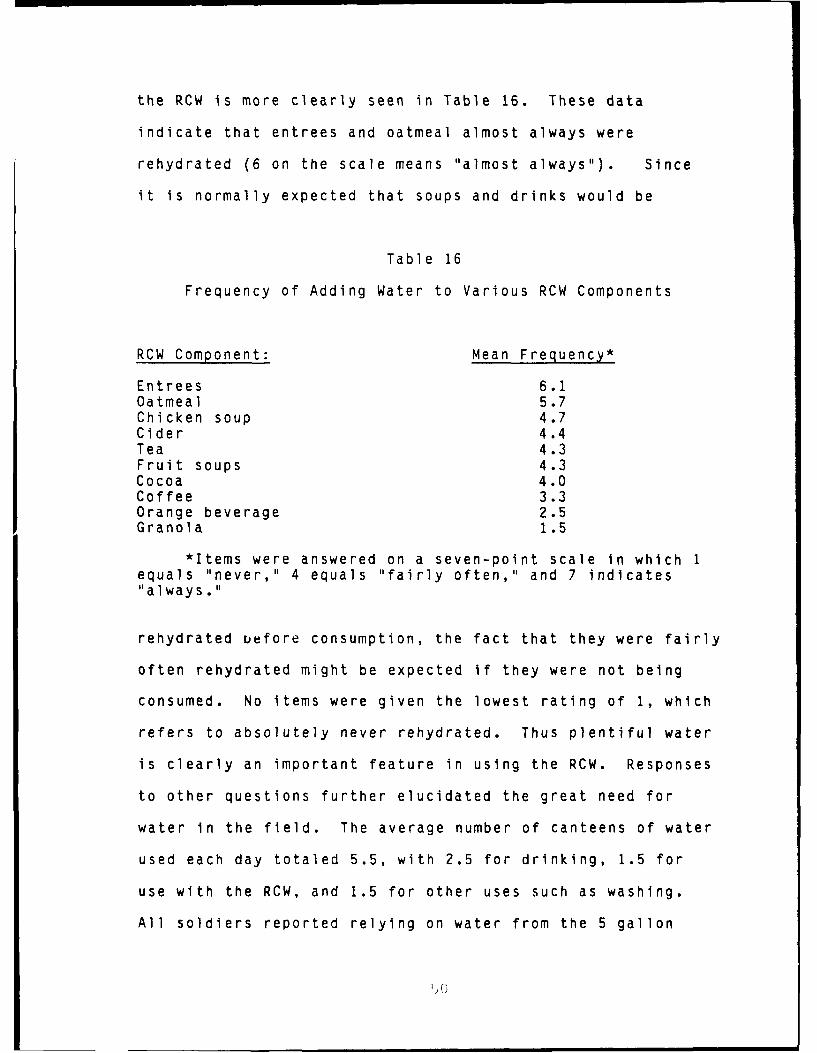
the RCW is more clearly seen in Table 16. These data
indicate that entrees and oatmeal almost always were
rehydrated (6 on the scale means "almost always"). Since
it is normally expected that soups and drinks would be
Table 16
Frequency of Adding Water to Various RCW Components
RCW Component: Mean Frequency*
Entrees 6.1Oatmeal 5.7Chicken soup 4.7Cider 4.4Tea 4.3Fruit soups 4.3Cocoa 4.0Coffee 3.3Orange beverage 2.5Granol a 1.5
*Items were answered on a seven-point scale in which 1equals "never," 4 equals "fairly often," and 7 indicates"always."
rehydrated before consumption, the fact that they were fairly
often rehydrated might be expected if they were not being
consumed. No items were given the lowest rating of 1, which
refers to absolutely never rehydrated. Thus plentiful water
is clearly an important feature in using the RCW. Responses
to other questions further elucidated the great need for
water in the field. The average number of canteens of water
used each day totaled 5.5, with 2.5 for drinking, 1.5 for
use with the RCW, and 1.5 for other uses such as washing.
All soldiers reported relying on water from the 5 gallon
cans, while 5 (17.2%) reported using melted snow and 1 (3.4%)
reported using melted ice. When asked how often they had to
melt snow or ice to obtain water, the average response for
the entire group of soldiers was every fifth day.
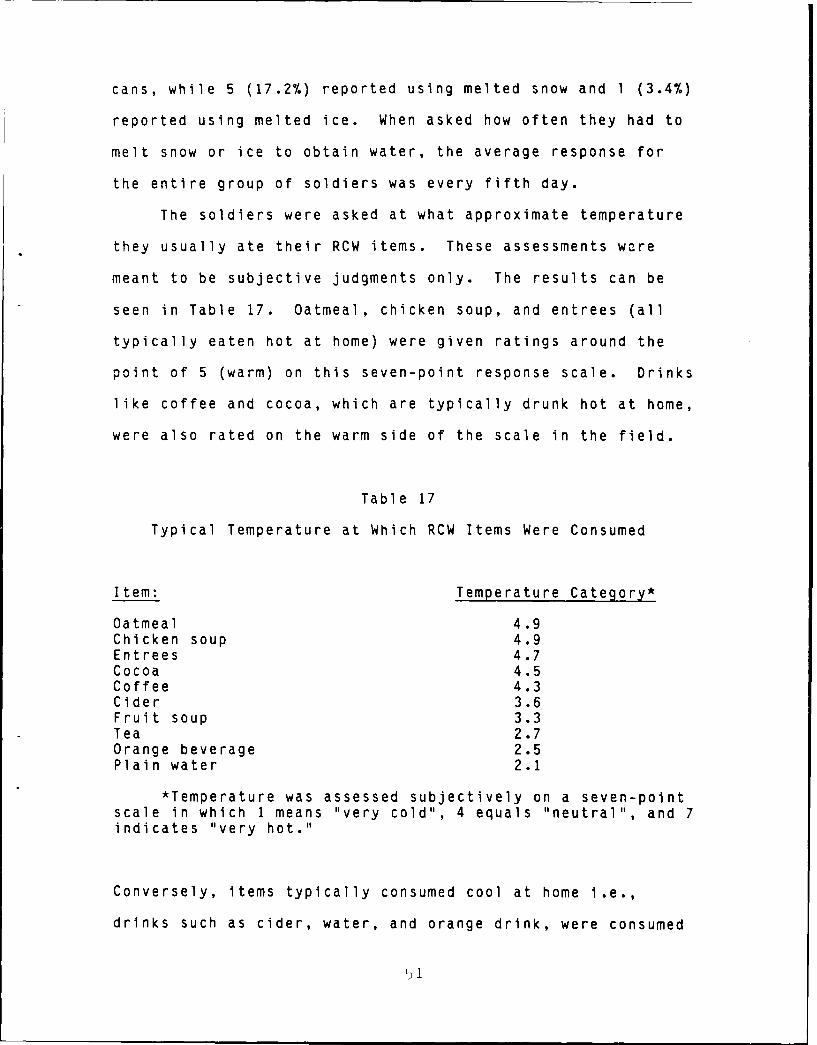
The soldiers were asked at what approximate temperature
they usually ate their RCW items. These assessments were
meant to be subjective judgments only. The results can be
seen in Table 17. Oatmeal, chicken soup, and entrees (all
typically eaten hot at home) were given ratings around the
point of 5 (warm) on this seven-point response scale. Drinks
like coffee and cocoa, which are typically drunk hot at home,
were also rated on the warm side of the scale in the field.
Table 17
Typical Temperature at Which RCW Items Were Consumed
Item: Temperature Category*
Oatmeal 4.9Chicken soup 4.9Entrees 4.7Cocoa 4.5Coffee 4.3Cider 3.6Fruit soup 3.3Tea 2.7Orange beverage 2.5Plain water 2.1
*Temperature was assessed subjectively on a seven-point
scale in which 1 means "very cold", 4 equals "neutral", and 7indicates "very hot."
Conversely, items typically consumed cool at home I.e.,
drinks such as cider, water, and orange drink, were consumed
[)1

cool in the field as well. In short, this table illustrates
that troops tried to consume the RCW in the field under
temperature conditions similar to those at home.
Trying to prepare warm food items in the field involves
some effort. The next two tables relate to some of the
problems involved in accomplishing RCW food preparation.
Table 18 indicates how troops usually protected their hands
while preparing and eating the RCW in a cold environment.
As Table 18 reveals, few soldiers (6.9%) were able to
simply avoid the problem of eating outside. A total of 72.3%
used some form of gloves for hand protection. However,
gloves do cause some difficulty in handling food and so
about a quarter of these soldiers simply did without hand
protection while preparing and consuming the RCW. When asked
how cold their hands got while preparing and eating the RCW,
Table 18
Methods of Protecting Hands While Handling the RCWin the Cold
Method: Frequency: Per Cent:
Wool glove insert 11 37.9Wool mitten insert with trigger finger 9 31.0Black leather outer glove 1 3.4
No protection 7 24.1Did not eat outside 2 6.9
the average response for all subjects was 2.6 on a six-point
scale where two means "slightly cold" and three means
"somewhat cold." This is an average figure, and presumably

those who prepared their meals without gloves got colder than
those who did.
Table 19 presents the methods of heating water for use
in preparing the RCW. The vast majority of soldiers on this
exercise (96.6%) used water heated on the Yukon stove in the
heating tent. Other possible methods were used by none or
only one of these troops. Exactly why these other methods
are less used is unclear.
Table 19
Methods of Heating Water for the RCW
Method: Frequency: Per Cent:
Yukon stove 28 96.6Squad stove 1 3.4Canteen cup stand & heat tabs 1 3.4Zestotherm heat bags 0 0Mounted vehicle heater 0 0Personal stove 0 0Sterno 0 0
Soldiers were also asked to rate how easy or difficult
it was to prepare each aspect of the RCW in the field. A
wide variety of aspects were covered, including some
previously discussed in detail and some new ones. This
allowed an assessment not only of perceived absolute
difficulty, but also of relative difficulty. In other words,
it was possible to determine which of various potential
problem areas the subjects thought were the worst. The
results are in Table 20. These mean judgments were based on
a nine-point scale in which 5 was the neutral point, with
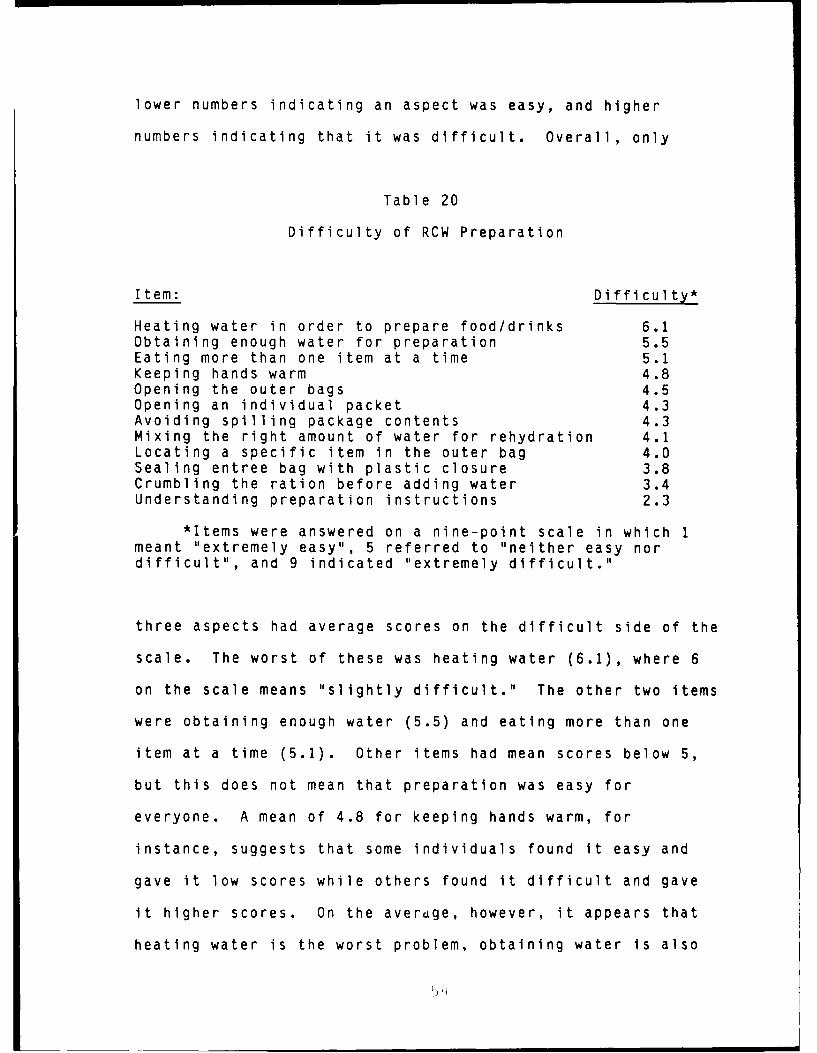
lower numbers indicating an aspect was easy, and higher
numbers indicating that it was difficult. Overall, only
Table 20
Difficulty of RCW Preparation
Item: Difficulty*
Heating water in order to prepare food/drinks 6.1Obtaining enough water for preparation 5.5Eating more than one item at a time 5.1Keeping hands warm 4.8Opening the outer bags 4.5Opening an individual packet 4.3Avoiding spilling package contents 4.3Mixing the right amount of water for rehydration 4.1Locating a specific item in the outer bag 4.0Sealing entree bag with plastic closure 3.8Crumbling the ration before adding water 3.4Understanding preparation instructions 2.3
*Items were answered on a nine-point scale in which 1
meant "extremely easy", 5 referred to "neither easy nordifficult", and 9 indicated "extremely difficult."
three aspects had average scores on the difficult side of the
scale. The worst of these was heating water (6.1), where 6
on the scale means "slightly difficult." The other two items
were obtaining enough water (5.5) and eating more than one
item at a time (5.1). Other items had mean scores below 5,
but this does not mean that preparation was easy for
everyone. A mean of 4.8 for keeping hands warm, for
instance, suggests that some individuals found it easy and
gave it low scores while others found it difficult and gave
it higher scores. On the averdge, however, it appears that
heating water is the worst problem, obtaining water is also

serious, and keeping the hands warm and working with the RCW
items are not terribly difficult.
That the RCW is somewhat difficult to work with is also
seen in the soldiers' responses to a question about how
convenient it was to use the RCW in the field in cold
weather. The average score was 4.2 on a nine-point scale in
which 4 means "slightly inconvenient" and 5 indicates
"neutral." On a seven-point scale the RCW was compared in
convenience with the MRE. The average score was 3.9 which is
almost exactly the neutral point (4) and which means that the
ROW was about as convenient as the MRE. Yet when asked about
the acceptability of the RCW as compared to the MRE, the
average answer was 4.7 on a seven-point scale in which 4
equals "neutral" and 5 means "RCW slightly better."
No matter how superior a system may be to its
predecessors, there is always room for improvement. These
soldiers were therefore asked to assign ranks to a number of
possible ways of improving the RCW, with the number "1"
indicating the most important, and larger numbers indicating
less importance. The results in Table 21 are listed in order
of decreasing importance. In other words, the most important
improvement, as judged by these troops, would be to make the
rations taste better. Increasing variety and adding more
breakfast items tied for second in importance. Increasing
portion size and making the ration easier to prepare were
considered less important. It should be noted, however, that
these mean ranks all hovered near the midpoint of 3,
1 - I-
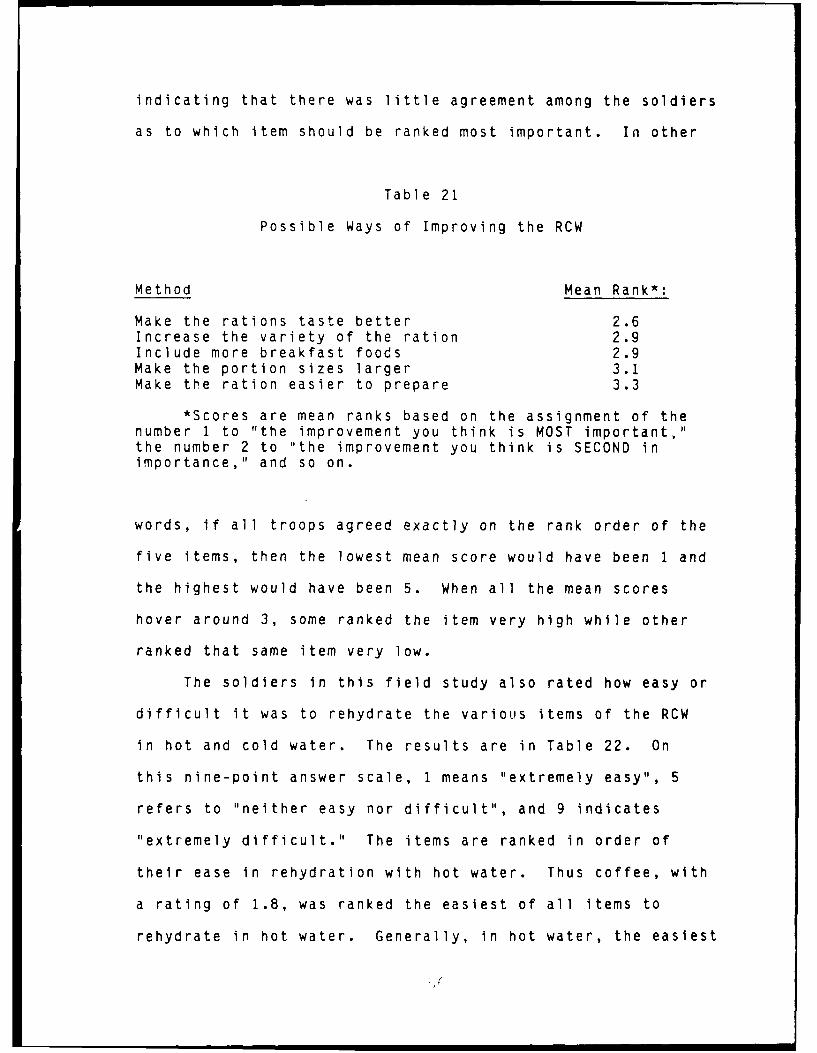
indicating that there was little agreement among the soldiers
as to which item should be ranked most important. In other
Table 21
Possible Ways of Improving the RCW
Method Mean Rank*:
Make the rations taste better 2.6Increase the variety of the ration 2.9Include more breakfast foods 2.9Make the portion sizes larger 3.1Make the ration easier to prepare 3.3
*Scores are mean ranks based on the assignment of thenumber 1 to "the improvement you think is MOST important,"the number 2 to "the improvement you think is SECOND inimportance," and so on.
words, if all troops agreed exactly on the rank order of the
five items, then the lowest mean score would have been 1 and
the highest would have been 5. When all the mean scores
hover around 3, some ranked the item very high while other
ranked that same item very low.
The soldiers in this field study also rated how easy or
difficult it was to rehydrate the various items of the RCW
in hot and cold water. The results are in Table 22. On
this nine-point answer scale, 1 means "extremely easy", 5
refers to "neither easy nor difficult", and 9 indicates
"extremely difficult." The items are ranked in order of
their ease in rehydration with hot water. Thus coffee, with
a rating of 1.8, was ranked the easiest of all items to
rehydrate in hot water. Generally, in hot water, the easiest

items to handle were the beverages, i.e., the items supposed
to be entirely liquid. Soups were somewhat less easy to
rehydrate, and the solid entrees had the worst rating of all.
However, it should be noted that in hot water, all items were
rated on the easy end of the scale, with even the entrees
getting a rating of 3.0, indicating "moderately easy."
Table 22
Ease of RCW Rehydration
Item: Ease with Rank: Ease with Rank:Hot Water*: Cold Water*:
Coffee 1.8 1 3.5 2.5Tea 2.0 2 2.5 1Cider 2.2 3 3.5 2.5Chicken soup 2.4 5 4.8 7Cocoa 2.4 5 4.9 8Fruit soup 2.4 5 4.5 5.5Oatmeal 2.7 7 5.8 9Orange beverage 2.8 8 4.3 4Entrees 3.0 9 4.5 5.5
*Ease was rated on a nine-point scale in which 1 equals"extremely easy", 5 means "neither easy nor difficult", and 9refers to "extremely difficult."
However, the picture was euite different when cold water
was used to rehydrate the foods. Typically, using cold water
raised the difficulty level by one to two points for each
item. The worst change was for oatmeal, which went from a
rating of 2.7 in hot water to 5.8 (slightly difficult) in
cold. Even with cold water, however, oatmeal was the only
item which was rated on the difficult side of the scale. The
rankings chaiged when items were ranked in terms of relative
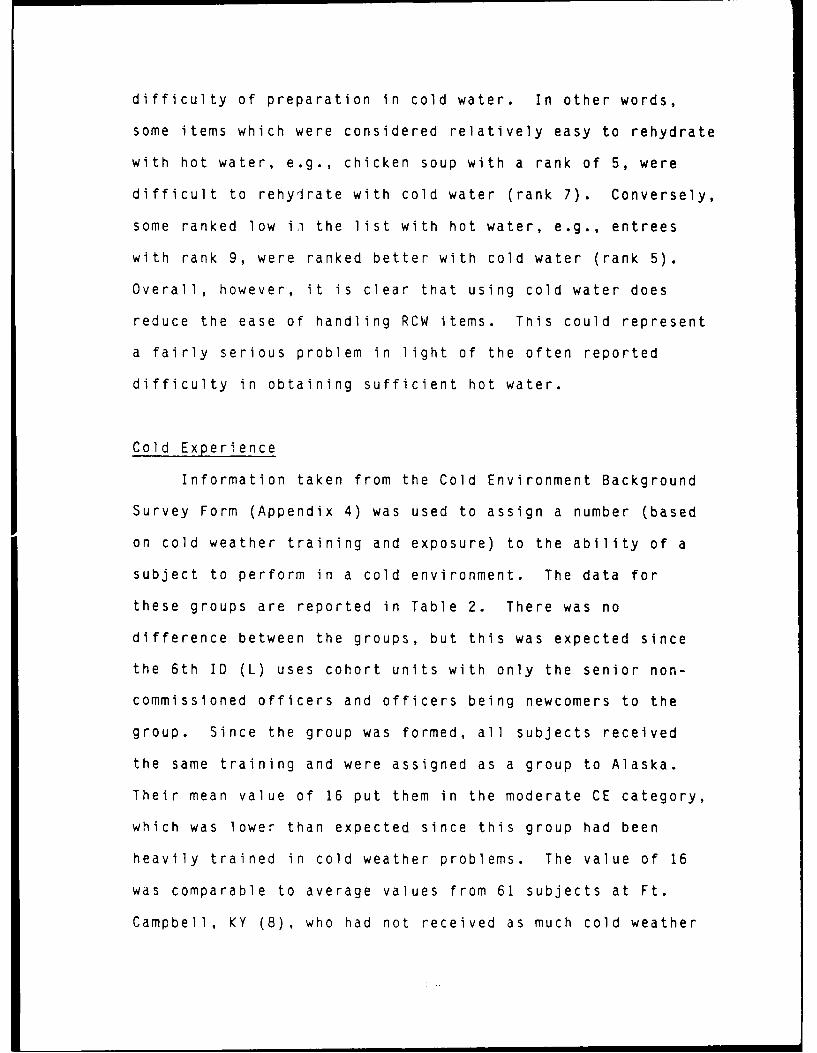
difficulty of preparation in cold water. In other words,
some items which were considered relatively easy to rehydrate
with hot water, e.g., chicken soup with a rank of 5, were
difficult to rehydrate with cold water (rank 7). Conversely,
some ranked low i,1 the list with hot water, e.g., entrees
with rank 9, were ranked better with cold water (rank 5).
Overall, however, it is clear that using cold water does
reduce the ease of handling RCW items. This could represent
a fairly serious problem in light of the often reported
difficulty in obtaining sufficient hot water.
Cold Experience
Information taken from the Cold Environment Background
Survey Form (Appendix 4) was used to assign a number (based
on cold weather training and exposure) to the ability of a
subject to perform in a cold environment. The data for
these groups are reported in Table 2. There was no
difference between the groups, but this was expected since
the 6th ID (L) uses cohort units with only the senior non-
commissioned officers and officers being newcomers to the
group. Since the group was formed, all subjects received
the same training and were assigned as a group to Alaska.
Their mean value of 16 put them in the moderate CE category,
which was lower than expected since this group had been
heavily trained in cold weather problems. The value of 16
was comparable to average values from 61 subjects at Ft.
Campbell, KY (8), who had not received as much cold weather
training, but tended to have a more favorable opinion toward
living in a cold climate.
DISCUSSION
The purpose of this test was to examine the hypothesis
that adequate water intake (forced intake of 4 L/man/day)
would alter consumption of a dehydrated ration (RCW) under
field conditions. In prior studies (14,19), water had been a
problem in that the subjects did not have sufficient supplies
or they did not consume a sufficient quantity (decreased
thirst) to maintain hydration. This study imposed the
additional problem of obtaining an adequate supply of hot
water within a large military (company-sized) operation.
In the three previous field studies in which the RCW has
been used, the caloric intake has been similar (2710 - 3182
kcal or about 60-73% of available calories) while the water
intake has varied from 3 to 5 L/day (7,9,11). In each of
these studies, daily water intake has been sufficient to
reduce long term sodium loading as recommended in the
original studies which tested the RCW (7,17). In all of
these studies, the body weight loss has exceeded 3%, which
has been set as the upper limit for safe body weight loss
(20). It should be noted that other field rations (MRE and
RLW) have not proved to be any better at maintaining body
weight under similar cold weather conditions (11). If
inadequate water consumption has not been the primary reason
for inadequate calorie consumption, then other factors need
to be examined. It has been proposed by other investigators
(13) that there are "environmental and/or situational
factors" that preclude the adequate intake of calories when
the rations contain sufficient calories. Environmental or
situational factors that impact on calorie consumption
include: the distribution of water supplies, timing of water
availability, physical stress, menu boredom, and
psychological stress.
In each of the prior studies (small units) involving use
of the RCW and other rations, the subjects were trained and
equipped to obtain water by melting snow or ice. While this
required extra effort, it gave these troops more flexibility
in eating rations requiring hydration, i.e., RCW. The troops
used in the present study were members of a full company (125
men) operating as part of a division. These troops were not
equipped with individual stoves, and were not allowed to melt
snow or ice to obtain drinking water. All water supplied to
these troops was carried into the troop area (from approved
water supply points) in 5 gallon cans (which were freezing
and required up to 8 hours to thaw). In this situation,
access to hot water for rehydration of entrees and drinks
(coffee, tea, cocoa) was limited by the need to leave combat
positions to return to the squad tent (water heated on Yukon
stove). This caused problems for some of the troops due to
the time lost (time required to undress, heat water, eat, and
then redress) from normal military duties. A greater problem

occurred during movements or simulated combat when the squad
tent was not set up and hot water was not available. One
solution to the problem of water supply during movements is
to allow the soldier to carry more water and to provide a
method of heating the water. In a cold environment, water
should be carried under the uniform to prevent freezing. A
recommended approach is to issue the troops polypropylene
bottles or the 2 qt. soft canteen. The RCW includes high
calorie snack components which allow for consumption while
moving, but adequate nutrition requires consumption of all
parts of the ration.
The problems encountered with consumption of a ration
(i.e. RCW) which requires hot water are detailed in Table 23.
The data shown are the averages for both groups which tends
to mask some of the effects of movements. Day I was the
deployment day for both groups, but one group deployed with
frozen water supplies. Both groups suffered from low
consumption rates which was due to the reduction in time for
preparing meais after a late start in setting up the camps.
On Days 2 and 3, movements were short or non-existent and the
consumption of foods (entrees) requiring hydration increased.
Consumption of the entrees is important since they contain
most of the protein. A large amount of the sodium is
located in the soups (chicken) which was poorly consumed
(less than 1/3). On Day 4 and 5, movement of one group or
the other occurred, but the other group was stationary with
the major difference being in the type of camp. On Day 4,
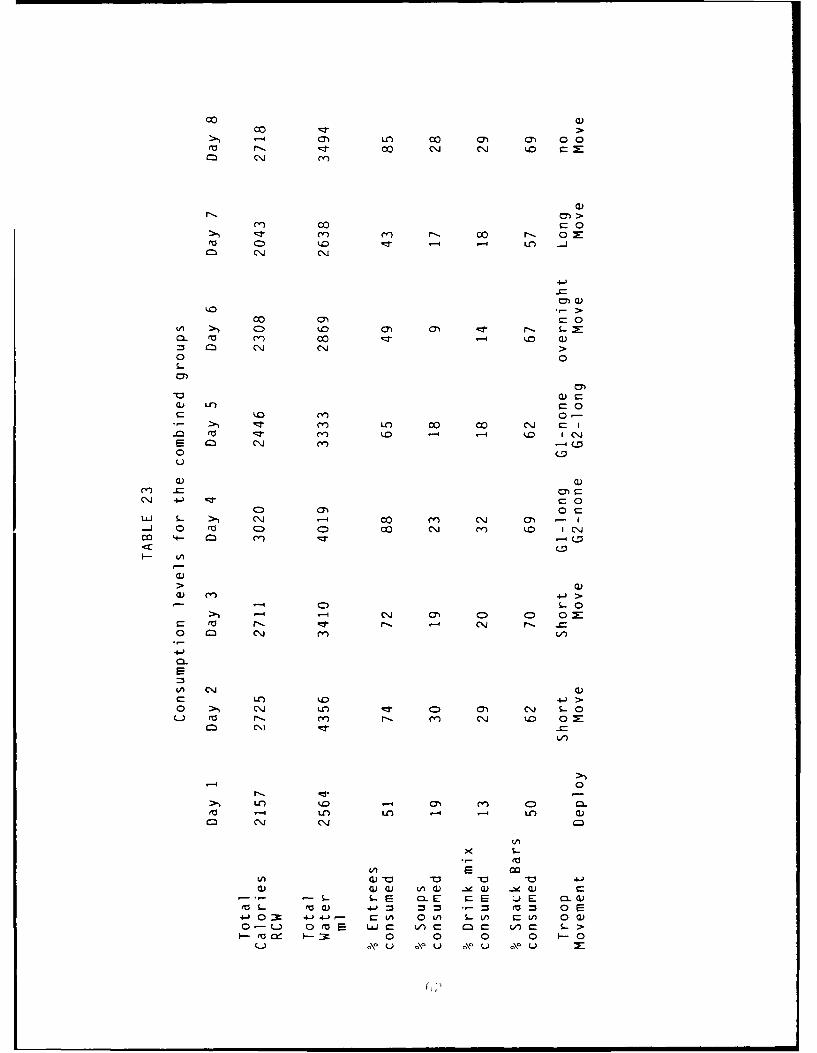
00)
co rr >
C\j
>-. -r I- mc r- 0 xfl C4 -1 : LOl _j
-)
0- m 00 v a)
~CA Ol > i ~ r.
0 0I.-
V))
w) LO) a0
-T > LO 00 co (J c
E 03 Cjr0u
a) V)
C0 CYC0U]I S-~ >1 CNJ 00- C'.j C0 - I-j 0 to C0 0) co (J m ~ I'D NJ
a) )
C- 0>-) - 4 (NJ 0D C 0 x
C tv r-_ 'NJ r=_ 1- c00 1= Njm V-)
.4-)
CLi
0 >-, (NJ ifO 0 0) (NJ S- 0
if)
- 0
1-4 LO 4O 0 0)-4 Ci iCD- f)
x L.
Ln -0 -0
a)a) a) t) a) -Nd ) -1 () cS.- -E 0..E C:E- U)E C0)
eoL oa) 4-) :3 = *= - = u OE+-j0~ _- -)4) c n OLA) SLn a CLA 0 Ca)0-(-) 0 eaE L)c )Ca Oc V) c S->
to cx 0 0 0 0 -A\
00 \u ~u 0 u
Group 2 did not move and rested in their previous camp and
consumed 100% of their entrees. On Day 5, Group 2 moved, and
Group 1 was stationary, but their camp was in an ambush
position with only one tent per company which decreased the
percentage of entree consumption. On Day 6 (overnight move)
and Day 7 (move to hilltop), supplies of water were low and
the opportunity to hydrate troops as well as to prepare meals
was reduced. On Day 8, the troops were stationary with tents
set-up and an increase in consumption was observed.
Since the nutrient content is not evenly spread
throughout the ration, selective consumption of only the
soack bars (easily consumed without rehydration) results in
problems in dietary balance. It is evident that troops must
be given the chance to adequately consume nutrients and
water. Greater emphasis must be placed on giving time and
supplies to ensure adequate nutrition even during times of
intense movement.
Nutritional Status
The mean energy intakes between Groups 1 and 2 were not
significantly different for the RCW or total food intake.
Significant differences of energy intake were observed
between days. These differences could be attributed largely
to the level of activity (energy consumption being lower on
troop movement days) and to the availability of water. Since
the mean energy intakes for the two groups were not
significantly different, the RCW intakes of both groups were
pooled (Appendix 7). The average energy intake from the RCW
only for the pooled group was 2534 + 69 kcal/day which is
approximately 57% of the available energy in one RCW. This
percent consumed was lower than all previous studies
(7,9,11) by 3 to 16%. An estimated energy expenditure of
4700 kcal was calculated from activity data, however
consumption of the RCW accounted for only 54% of the caloric
intake required for energy balance. This would predict a
body weight loss of about 5.7 pounds over an 8-day period,
assuming one pound of body weight lost for every 3500 kcal
below energy requirements. Actual body weight losses were
very similar to this prediction at 5.4 lb and 6.7 lb in 6
days for Groups l and 2, respectively. Accurate field
measurements of body weight were difficult to obtain due to
differences in clothing, moisture content in clothing, uneven
ground, and sloping Arctic tent roofs forcing a crouching
maneuver for weighing.
Subjects consumed an average of 340 + 10 gm/man/day of
the 661.5 grams of carbohydrate available in the RCW. This
represented 54% of the total energy intake and 51% of the
available CHO. Consumption varied with the time available to
eat and with the ability to heat water to prepare the RCW
components. High carbohydrate snacks were eaten extensively
when water was unavailable.
Protein contributed an average of 78 + 3 gm/man/day, 12%
of the total RCW energy intake, and 65% of the available
protein in the RCW. This protein intake is below the 100
gm/man/day recommendation of the MRDA, but meets the current
RDA recommendations (21). Protein and sodium are both
limited in the RCW, compared to other operational rations, as
these nutrients are known to increase metabolic requirements
for water (11,14). Over 50% of the protein provided in the
RCW is found in the entree component. The entrees were often
left unconsumed if hot water was not available, but in
general, a greater percentage of this nutrient was consumed
than the other macronutrients i.e., calories, carbohydrate,
or fat since about 70% of all issued entrees were consumed.
However, only about 40% of the soldiers in Group 1 ate their
entree for 4 days of the study. This situation occurred on 2
days for the soldiers in Group 2. The erratic consumption of
protein is detailed in Appendix 8. While the average
consumption (73.3%) was high, the daily intake varied widely.
This reflects the difficulty of consuming entrees (which
contain most of the protein) when hot water is not available.
Fat contributed 96 + 3 gm/man/day to the diet or 34% of
the total RCW energy intake which is excellent because this
intake of fat falls below the maximum of 35%FAT recommended
in the MRDA. But, it accounts for a greater percentage of
the total energy in the RCW than the original configuration
(30%). About 64% of the fat in the RCW were consumed. The
large contributors of fat were the snack bars tiat could be
consumed without water for rehydration.
Inadequate micronutrient intakes were more prevalent
during consumption of the RCW in the present study compared
6

to reports by Morgan et al. (11). Considering that the
soldiers were eating 57% of the total energy and 51-65% of
the available macronutrients available in the RCW, it is not
surprising that their intake of available micronutrients
were lower (Appendix 7). The consumption of available
micronutrients ranged from a low of 21.6% for vitamin C to a
high of 71.7% for zinc for the subjects in Group 2. The
consumption patterns of micronutrients was affected by the
distribution of vitamins and minerals among the different RCW
components. Certain components which were heavily fortified
with micronutrients e.g., vitamin C (41% of total available)
and riboflavin (26% of total available) in the orange
beverage bar, were not eaten on a regular basis. The mean
nutrient data indicated that the RCW ration did not contain
sufficient nutrients to meet the MRDA for folacin and zinc
even if the soldiers had eaten all of the ration.
Sodium intake from the RCW components averaged 2757 + 92
mg/day. This level of sodium intake was within the range
recommended in the MRDA which was probably due to the reduced
level of sodium in the ration and to the reduced intake of
RCW compared to the amount that was available. Sodium
excretion levels in the urine were high on the 2nd morning in
the field and decreased thereafter. Examination of the
dietary records for the period prior to deployment indicated
that high sodium foods were widely consumed before the troops
entered the field to account for the high excretion on the
2nd morning. The decrease in sodium excretion after Day 2

probably reflected the body's attempt to conserve sodium with
decreased dietary sodium intakes.
In summary, the energy intake may have been inadequate
(54% of energy requirelaents), but the soldiers were eating a
balanced diet in terms of the percent distribution of energy
from carbohydrate (%CHO), protein (%PRO), and fat (%FAT).
The soldiers in the present study were consuming 54%CHO,
12%PRO, and 34%FAT compared to the 59%CHO, 11%PRO, and 30%FAT
available in the present configuration of the RCW. Nutrient
intake data showed that the soldiers in both groups were
ingesting inadequate quantities of a majority of the
micronutrients. The percent consumption of available
nutrients ranged from a low of 22% to a high of 72%. Vitamin
A, phosphorus, sodium, and potassium intakes were adequate
when only RCW consumption was considered. If the consumption
of the RCW had been higher for the 12 (out of 19) components
that had consumption percentages lower than 50%, then the
troops would have had much less trouble consuming adequate
amounts of nutrients. When total nutrient intake was
calculated, the soldiers were eating a fairly balanced diet
with only energy, riboflavin, folacin, and zinc intakes
being inadequate. As stated before, the folacin and zinc
intakes were probably inadequate because the RCW contained
inadequate amounts.
Ketone bodies were seen in the urine of subjects on the
morning of Day 2. This could be an indication of increased
fat metabolism which could be triggered by excessive use of
caffeine (not applicable to this study) as well as an
inadequate carbohydrate supply. Ketone bodies appeared more
frequently on the days when food consumption was low and the
activity level was high. Since the energy (72 - 78% of MRDA)
intakes were inadequate to maintain energy balance, it
appeared that the soldiers were metabolizing body fat for
energy. Ketosis could have affected the ability of the
soldiers to perform mental tasks if the conditions had become
too severe or continued for too long a period of time.
Unfortunately, mental performance tests were not conducted.
Blood chemistries showed significant changes from pre-
to post-field exercise for several variables, but all values
remained within normal ranges. These changes were probably
due to changes in diet and work levels, but the changes were
of little significance. The reduction in cholesterol and
triglyceride levels indicated that the ration would be
acceptable in reducing coronary heart disease risk. The
increase in blood proteins and changes in BUN possibly
indicated a breakdown of body protein due to insufficient
protein and/or energy intake.
In terms of actual food consumption, the RCW was not
ingested in sufficient quantities to meet the energy needs of
soldiers working in the cold. Only 57% of the energy
available in the RCW were consumed. In 6 days, the soldiers
in Groups 1 and 2 had lost 3.2 and 4.1% body weight,
respectively. Considering that the caloric intake was so
much lower than energy expenditure (2534 vs 4700 kcal for the
pooled subjects), the weight loss was probably due to the
inadequate caloric intake. Nutrient intake data showed that
the soldiers in both groups were ingesting inadequate
quantities of a majority of the nutrients. Only vitamin A,
CHO, fat, sodium, potassium, and phosphorus intake met the
MRDA when only RCW consumption was considered.
Hydration Status
There were no significant differences in water intake
between the two groups. Group 1 was supposed to be forcing
water intake to ensure hydration during the study and
consistently drank more water, but Group 2 was able to obtain
and drink enough water so the difference in mean water intake
was only 324 ml/day. It was not possible to fully test the
hypothesis that forced fluids would affect food consumption
in the cold.
There is widespread acceptance that hypohydration exists
in cold climates as well as hot climates and that thirst
alone is not sufficient to compensate for water loss from
perspiration, respiration, and diuresis (12). There is also
agreement on some of the consequences of inadequate hydration
in the cold (15,16). The problems relating to the assessment
of level of hydration in a field situation comes down to the
methodology used. Francesconi et al. (5) have reported that
the usual means of measuring hypohydration (urinary specific
gravity, urinary sodium/potassium ratios, hematocrit, serum
osmolality, body weight loss, and urinary
nitrogen/creatinine ratios) may not be in agreement and may
not be a measure of frank hypohydration, but more a measure
of the body's attempt to prevent hypohydration. The results
reported by Francesconi et. al. highlight the problem of
inferring hydration status of an individual from a single
urine sample rather than from a daily average over the
duration of the field exercise.
The weight loss that occurred in this study could be
explained by insufficient food intake and while the
sodium/potassium ratios and the incidence of occurrence of SG
> 1.030 would be indicative of hypohydration in some
subjects, the pre and post serum osmolality and hematocrit
data were contradictory. The pre and post samples were taken
after quiet times and might be more indicative of steady
state. This data coupled with the water intake data
(estimated from questionnaires) indicated that these subjects
maintained an almost constant physiological adjustment to
avoid hypohydration. The effect of the constant adjustment
to changing levels of hydration on food intake is unclear,
but increasing food consumption is not as simple as
increasing water intake. The trend of daily energy intake
appears to follow trends in water intake for Group 1, but not
for Group 2. However, it cannot be determined whether the
food intake was increasing with increasing water intake
because of a psychological signal; whether having more water
available allowed the soldiers to prepare and eat more of the
dehydrated ration; or whether the high water days were rest

days and the soldiers had time to eat.
It appears that adequate consumption of water is
possible in cold environments, but methods of distribution
and methods of obtaining water for large scale operations
need to be examined. A major issue that continues to reoccur
is the failure of troops to take advantage of water
availability before deployment. The first 24 hours of an
operation could be very important, but the troops continue to
deploy with hydration problems which may be further
exacerbated by alcohol consumption (dehydration producing
substance) prior to deployment. In this particular study,
certain members of the command staff required medical
assistance for hydration problems within the first 24 hours
because their work schedule did not allow time to eat and
drink prior to deployment. The problems of frozen water cans
and uneven distribution of water and food adversely affected
those soldiers who were not part of this test group.
Measurements of urine specific gravity from soldiers
consuming the normal field rations (T-ratiors and MREs)
indicated that they consumed less water than the subjects in
the test. The fact that the test subjects consumed more
water is not surprising and was probably due to the briefings
and reinforcement of seeing the research team on a daily
basis.
Ration Acceptability
On the average, the 29 soldiers in this study rated all

but one item (the granola bar) of the Ration, Cold Weather
(RCW) on the positive side of the hedonic scale. This
indicates at least minimum acceptance of the ration.
However, most average ratings were in the range of "like
slightly," which indicates considerable room for improvement.
And when the troops were asked to rank order possible ways of
improving the ration, the item with the highest overall rank
was to improve the taste of the RCW. It is suggested,
theefore, that further work be done on improving the taste
and appeal of the RCW.
Another of the most significant problem areas dealt with
the use of water with this ration. Soldiers experienced
trouble in obtaining sufficient water, properly heating the
water, and in rehydrating the ration components. This
problem area suggests that more work should be done on the
problems of providing adequate amounts of water and methods
of heating water in a cold environment if the RCW is to be
used as the cold weather ration.
Another significant problem area dealt with the total
amount of food provided by an individual ration. About 4500
kcal were available each day, the soldiers felt satisfied
generally with the size of individual components, and they
only consumed 51-65% of the available macronutrients; but
they felt they did not get enough food to eat overall. When
asked to cite the reasons they sometimes went hungry, the
reasons that were most often mentioned dealt with the
various difficulties encountered in preparing the ration for
consumption (i.e. obtaining water). The provision of
suitable amounts of hot water was again implicated, but
improvements might also focus on increasing the quantity of
food and allowing more time for preparation. There were
minor, but not significant complaints regarding the size of
the individual ration components, the variety of items within
the ration system, and overall ease of preparation.
Therefore, research on improving the ration should not
excessively emphasize these areas.
SUMMARY and CONCLUSIONS
A technical feasibility test was conducted in the Blair
Lakes Training Area, Ft Wainwright, AK for ten days in
February and March, 1988 using volunteers from Alpha Co 5/9,
6th ID (L). The purpose of the test was to determine if
increased consumption of water (4 L/man/day) would result in
an increase in consumption of the Ration, Cold Weather.
Hydration status was assessed by pre and post exercise
blood sample measurements and by daily measurement of urinary
specific gravity and body weight changes. Nutrient intake
was assessed by questionnaire and interview. Water
consumption was assessed by q~uestionnaire.
The results of the hydration measures indicate that the
groups maintained a high level of hydration, but did not
consume the desired level of 4 L/man/day except in a few
cases. Total caloric intake from all sources (RCW and other)
was below the estimated requirement of 4700 kcal/day which

resulted in a body weight loss of greater than 3 % for both
groups. The consumption pattern was erratic and reflected
the availability of hot water for rehydration of ration
components and the time to consume the rations with greater
consumption occurring on those days when movement was
minimal.
It is apparent that other factors besides hydration
influenced the intake of the Ration, Cold Weather. The
ration requires certain modification before it should be
considered for use as a stand-alone cold weather ration for
light infantry troops who have no access to individual water
heaters.
The biggest problem in use of this ration is access to
hot water. In all prior tests, subjects had individual
heaters, but the troops of the Light Infantry are not
equipped with individual heaters. Therefore, access to hot
water was limited to those times when they were in the squad
tent which was unavailable during movements or combat
situations. The use of this ration by Light Infantry (which
would enable individual companies to operate away from their
support) would reauire a restructuring of the mode of water
supply to the troops and provision of individual heating
devices.
In spite of the difficulties of using the ration, the
troops expressed a desire to use the ration as long as a
single hot meal could be provided on a daily basis. This
would help the troops during those times when food delivery

more desirable ration than the MRE currently in use.
Another secondary issue is the problem of water in
canteens freezing. A solution to this problem is to carry
water inside the uniform which can be done by use of plastic
bottles or by use of the US Army 2 quart canteen. This would
have the benefit of doubling the volume of water carried at
about the same weight as the I quart arctic canteen which
does freeze.
RECOMMENDATIONS
1. Divide the RCW entree into two separately packaged
portions to allow for having two entrees available for
two meals.
2. Increase the riboflavin, folacin, and zinc content of
the RCW ration by fortification of several items.
3. Replace unpopular RCW beverage items such as fruit soups
and orange beverage bar with a palatable high
carbohydrate supplement powder.
4. Package the entrees in shorter bags with an "add liquid"
line to avoid having to measure quantities. The
addition of a longer spoon would facilitate better
sanitation.
5. Because of the difficulties experienced with obtaining
hot water, fortification should not be concentrated in
those items that require rehydration. The vitamins
and minerals should be spread among as many items as
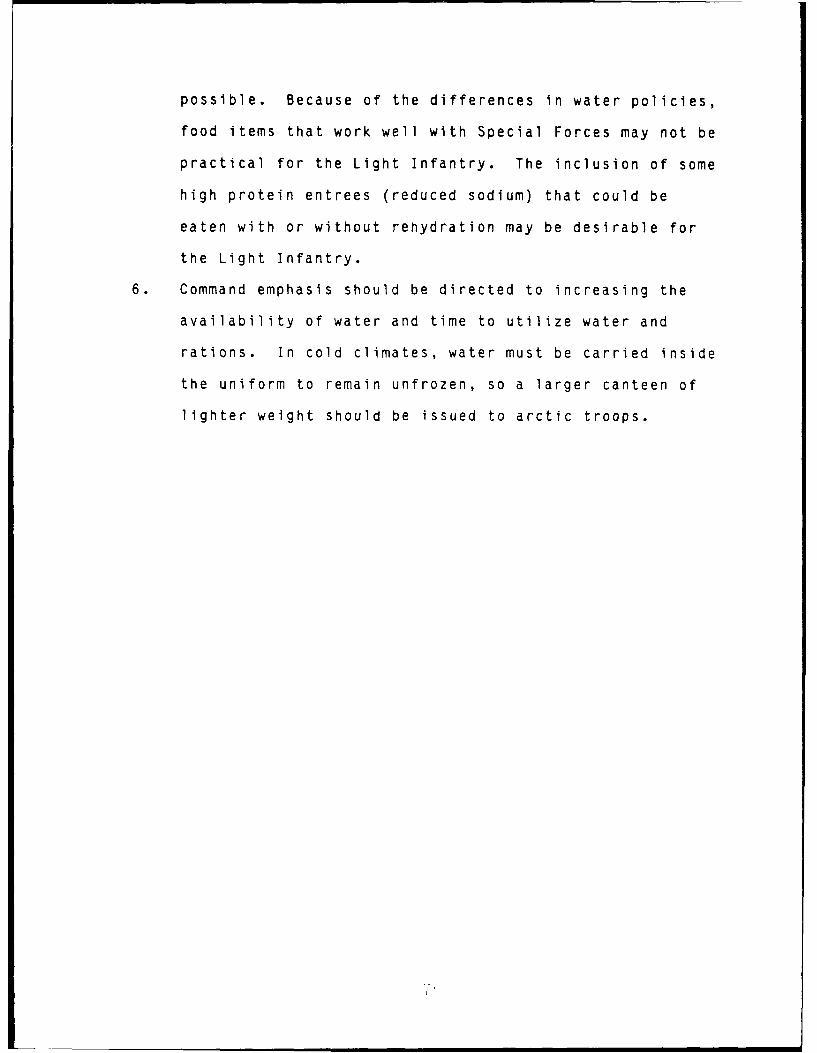
possible. Because of the differences in water policies,
food items that work well with Special Forces may not be
practical for the Light Infantry. The inclusion of some
high protein entrees (reduced sodium) that could be
eaten with or without rehydration may be desirable for
the Light Infantry.
6. Command emphasis should be directed to increasing the
availability of water and time to utilize water and
rations. In cold climates, water must be carried inside
the uniform to remain unfrozen, so a larger canteen of
lighter weight should be issued to arctic troops.

REFERENCES
1. Departments of the Army, the Navy, and the Air Force.Army Regulation 40-25. BUMED Instruction 10110.3E,and Air Force Regulation 160-95, Medical ServicesNutritional Standards, Washington D.C. Department of theArmy, the Navy, and the Air Force. 30 August, 1976.
2. Engell, DB. The interdependency of food and fluidIntake Scientific and Military Perspectives.Proceedings of Natick Science Conference, Natick, MA,1986.
3. Engel1, DB, DE Roberts, EW Askew, MS Rose, J Buchbinder,and MA Sharp. Evaluation of the Ration, Cold Weatherduring a 10-day cold weather field training exercise.USANRDEC Technical Report, Natick/TR-87/030, 1987.
4. Fischbach, FT. A Manual of Laboratory Diagnostic Tests2nd ed. J.B. Lippincott Co. Philadelphia, PA, 1984.
5. Francesconi, RB, RL Hubbard, PC Szlyk, D Schnakenberg, DCarlson, N Leva, I Sils, L Hubbard, V Pease, J Young,and D Moore. Urinary and hematologic indexes ofhypohydration. J. Appl. Physiol. 62(3):1271-1276,1987.
6. Health Sciences Computing Facility, Department ofBiomathematics, School of Medicine, University ofCalifornia, Los Angeles : BMDP Biomedical ComputerPrograms, P-series. Berkley: University of CaliforniaPress, 1976.
7. Jacey, MJ, JJ Wojtowicz, DV Tappan, E Heyder, and PHGray, Acceptance of menu items in the low-salt USMarine Corps arctic ration (prototype). Nav Sub MedRsch Lab Report No. 1017, 1984.
8. Jackson, RL, MW Sharp, JT Fay, and E Kraus.Psychological and physiological response of Blacks andcaucasians to hand cooling. USARIEM Technical Report(in preparation).
9. Mastromarino, AC, Loveridge, VA. Evaluation of theration, cold weather. USANRDEC Technical Report,Natick/TR-86/027, 1986.
10. Mastromarino, AC, Loveridge, VA. Evaluation of theration, cold weather by Navy Seals. USANRDEC TechnicalReport,Natick/TR-86/042, 1986.

11. Morgan, TE, LA Hodgess, D Schilling, RW Hoyt, EJ Iwanyk,G McAninch, TC Wells, VS Hubbard, and EW Askew. Acomparison of the Meal,Ready-To-Eat, Ration,Cold Weatherand Ration, Lightweight nutrient intakes during moderatealtitude cold weather field training operations.USARIEM Technical Report, T5-89, 1989.
12. Myles, WS and SD Livingstone. Physiological studies onNew Viking winter exercises: Dehydration, DCIEMOperations Report #74, OR-1002,1974.
13. Popper, R, E Hirsch, L Lesher, D Engell, B Jezior, BBell, WT Matthew. Field evaluation of improved MRE,MREVII, and MREIV. USANRDEC Technical Report, Natick/TR-87/027, 1987.
14. Roberts, DE, EW Askew, MS Rose,MA Sharp, JS Bruttig,and JC Buchbinder. Nutritional and hydration status ofthe Special Forces soldiers consuming the Ration, ColdWeather or the Meal, Ready-to-Eat ration during a tenday cold weather field training exercise. USARIEMTechnical Report. TR-87/08, 1987.
15. Roberts, DE, and JJ Berberich. The role of peripheralresponse to cold. Military Medicine 153:605-608,1988.
16. Roberts, DE, JF Patton, JW Pennycook, MJ Jacey, DVTappan, P Gray, and E Heyder. Effects of restrictedwater intake on performance in a cold environment.USARIEM Technical Report T2/84,May 1984.
17. Tappan, DV, MJ Jacey, and E. Heyder. Water requirementsin military personnel working in cold environments andreceiving arctic rations containing high salt levels.Technical Report No. 968, Naval Submarine MedicalResearch Laboratory, Groton, CT, 1982.
18. Welch, BE, ER Buskirk, and PF lampietro. Relation ofclimate and temperature to food and water intake in man.Metabolism 7:141-148, 1958.
19. Wyant, KW and PL Caron. Water discipline and an ArcticRation prototype. Military Medicine 148: 435-438, 1983.
20. , Combat Field Feeding System-Force DevelopmentTest and Experimentation (CFFS-FDTE). USANRDEC andUSARIEM Test Report. CDEC-TR-85-006A, 1985.
21., Recommended Dietary Allowances Committee onDietary Allowances, Food and Nutrition Board. Divisionof Biological Sciences, Assembly of Life Sciences,National Academic Press. 1980.

APPENDIX 1
Description of Ration, Cold Weather
INFORMATION PAPER
STRNC-WTP23 Mar 88
SUBJECT: Ration, Cold Weather (Marine Corps Artic Ration)
1. In January 1983, a program was established at Natick RD&E Center todevelop an operational cold weather ration. The requirement originatedwith the Marine Corps, which annually deploys units to Norway for coldweather training. Subsistence items and rations presently available areunsatisfactory because they are too bulky or heavy, produce 50 percentmore trash, contain excesive sodium and protein, or the high water contentmakes them susceptible to freezing, which affects consumption and maydegrade packaging integrity.
2. The Food Packet, Assault (FPA), type classified in March 1986, was thebasis for the initial Ration, Cold Weather (RCW) concept. It included FPAfood bars supplemented by components, which provide extra calories anddrink mixes to encourage increased water consumption.
3. Primary essential characteristics are: 4500 kilocalories per menu;will not freeze; contain entrees, snacks, and numerous hot drinks; flat,flexible waterproof packaging; requires little preparation; lighter andsmaller than four Meal, Ready-to-Eat, Individual (MRE); the mean sodiumcontent per menu must be within the guidelines of Army Regulation 40-25.
4. Prototype testing includes two Marine NATO exercises, climatic chambertests by Navy Submarine Medical Research Lab, three informal evaluationsby Navy SEALs and the U.S. Army Health Clinic, Fort Greely, AK, twotechnical feasibility tests by Cold Regions Test Center, TECOM, and oneoperational test each by 10th Special Forces, the Marine Corps MountainWarfare Training Center, and the 6th Infantry Division. Results indicatethat the prototype meets requirements, is more logistically supportableand acceptable then the MRE for cold weather feeding, but water disciplineneeds more command emphasis.
5. The U.S. Army Quartermaster School (QMS) initiated the Army'srequirement for a cold weather ration. A Joint Working Group (JWG)meeting held in April 1987 addressed a second draft of the Operational andOrganizational (0&o) Plan and a final draft was approved in September1988. The Army pursued the adoption of the U.S.M.C. ROC (RequiredOperational Capability); however at a Test Integration Working Groupmeeting held 16 March 88 to discuss large scale testing of the RCW.the QMS representatives stated that the Army may have no requirement forthe RCW. QMS is currently revalidating the Army's requirement for a coldweather ration.
6. Current efforts include: Providing the Defense Personnel SupportCenter with technical assistance for the U.S.M.C. FY88 procurement(221,000 rations) and monitoring the U.S. Army's position on the RCW viaclose coordination with QMS.
MAJ Schillng/AV256-4050/PHILIP BRLNDLERDirector, Food Engineering Directorate

0 0~ 'o 0 w I-
dC J
Zm at
a
31V~W~mw IA X~
MI.A Z4~~ a~-
I. d 0 ~ x in
NUT )I' WaS
11w wu42 a 1 1
a~~~ o OMcLOUJUI
MI WU

0
0 I)i 0-8 1o WO
in.Uo -(
oo nr.imm o -
0- U')
V)V00
U (N(N~r 0v- o 0 0?') 0*n N
~L) kID IDN M
x M' (N 0\00 L ,
m P- CIO)-u)(No IflI') VN~ -)C -- -- 0 L
N fn
C.3 NN-U 0?' t0 0 -
40 (N. cc0
ILCCN ~ V -0 N In
uoU t 0(
zC v 0 Ni
0'- )U'N Y(ONT w 0
40 NY(N(N(N ?')?') (
3rI -3 C(N L D )
03 (N(N C*?'4 U)
03 ?'0'.O O V 00 -
Wo) 00'?- 0' M' 0 00(N,4 ;
0.N "C(~ 00' ox
LM m)
00 - 10 -
-w NN in
Q Z;C ,3xDwwUC coL ( 0 -0 Lfl( 00 cc- '-L) r- -?1'4 , 0 c- 1 ,> "6
v CA - -X- 1 z0:0 L 0-jM 041 z( 0 U
oa -I. 06'V .9U)lo l 0

u &nN' C qw1 4-L*- !*- V)3 Om r
0-0
V) m 0 0 v rt1ID~0~ V r-M0
CJ-vv -UVt m
4.4-a.M. 0
00~~W 000ya N -or - Iw X- r- 0 m D0) O
u! CC-r V wD0
0 (NV 1, 0 (
49 0 -- -.P ) L
.- -Wm v V ! v -r
ZV ZNr- 0 co to a I
0O-r (1)
V IV P
VV 0E-QOZ~. N-O 0 cc-
co vwwy cc ND C. -
t- ql 0 -Iq C
CV 0 ON U!i 0l 0
uZ N
rsN r a 0C(( 0 0 t49 V)0 C 0O V
~.. (N((N( CNN (N r)Okc~ c v Vc a) C!) 0 0 0 0 c'q ~ ~ ~ N 6)( U) VO -vMT r r-
01 W~( CI vN ZrN
0 cc-C N 0c u.C1 0 6: 0 0. w NIx 0 C N P, ( C 0
0~((( (N 0o '0 0 0cc - . .! V V .! V V
14 1 NN((((N (008000 0 C.
>- fn C,~ C, r- - 0 00 0 '0 ~ ~ C M c ! ~ t~- ra N N-
(N C
oz Ixm ~u
u 0

1.- 0OU 0w to c U(D 0l O 0O 0 a r
u W ccN mw
00 C4t
0 0 0 ( N "M O O M8N
-1 U( -- to
N- (NWU ftoU (NtVO -7C
uJ- M 0 N 0'
z ID( 0
.9 - (N--V (
4 VIN~ N 01 U U m
r c r- -a c N 4 C
01 toIN M ~ N w Nn 0 )0U W -F - I
V0 --- - cc
C). r- ev( , M Ux znm V 4 r
m~ 0 0 0 .)n C1 0O0 a
- (N
-n VOC(Nto ."Ot't 0o V400 -o'r-- vf C,-WO tC n
0 0
L) 0 M~~r0 tt-c c (D-to(
0 ~ ~ U 0 LO ( oC*(* CID- V4In VV- 00 0to C4 C4 t-(0q4 m ( m
z -0 ( N OtD Ind (N0NN ~ n WN-' 0ZNt
I.- 0 r P- P .0 -0nC0Wwto0o
0 ~ ~~~~ m0-t~nn0c Vttt(u0o Cc- 0mWNr - m .J 000000 0 0 0
Z N C In tP
0 > 6- -j0 0 .z> a j 0 00LL CL. 0, Ot IL(0.U W
4l >-C .9a kA-6-0tI-u.>0LM31 0- j U M to1 0Nt 0u>43 iU fj
-a U,-c
.4 3 VjL,0&-i .zI
4o - Q 4 Z0 a 0 41 Z -# . O -000 0 0
toUi (N -z (N - CV9 C of m -9-zF6u0 aOD 4- cc (N ui atu- au & M M 06 u u u-

* 0- OfllO 0 S:l1D010O0w O
-u u
cc F-, 'D In30 'Mr c 0
cc .0 0
uj m-* ~ r
cc 0LMI
a- W- -- v5'. r- v4-r ww m
0C a0~-Uq) 0 w000N 0
0-
Z w C4 Cl00~Il~lO M~0 1
v cal- r)O'w0WDO w in W
wI V~f-0 . VNMN 0 C
0- C ~ - 0 r r- N C m m an l
cm.~ N-001lg~C0 Cll M
ccXU r 0.d~ 0~~ .. 0'14 .. N
- D 10 0C l -' mNr- W -01 0l C.Cl ~ ~ M t 10
0to . . . .
1/~ N
-- W W -W - w vl1
00 M O-C'o-VO NO0
- C~~~~I ID~C W1C~ A 0 W t
0~~l uWw 0 0 vi 00000-Il~ 00 0
01 N 0'
-000l.C0U C
V -0 0 00~-0 ~ ~ 0Cl 1
NZ C- - w0
4 > uOO 0 40 W " 4CXU M %. ( Cl u m. w I
o Cll 100 0 J 0 w00000 0 0>
Z 0 1.- ia 0 ; 1
0 ofI
w c 41 0C)00 0 u -j u . u Cl0 00- w u u
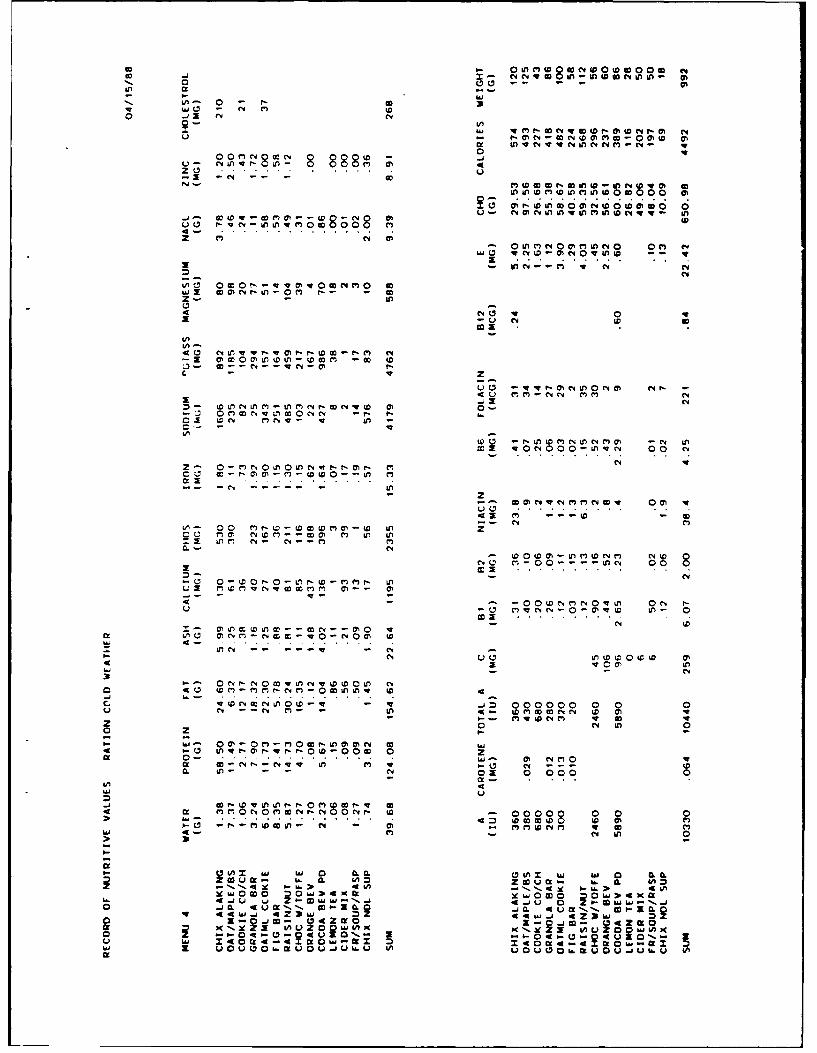
NU(( v 0(ommo m 0 -u
0 300- 0 -
0- LnI LU W -4 r- (
N - mr-u-O m (NqOm M
UC ~ 10 r-( w)IC0 0 0
4,40
vO w(Nwin (N ccn 0-M
/oC OmOf VvmvwucmO wW!J mm~(N-U-0! r-- - M
4 14 0 IV
-!z mmomowo-wc -W 0
m V Ln
wo3 .V-OWM~NMNMM (N -Cto ON0000VN 0' (N
Z- 0- 0 m 0' 0 Nw - - t*
0*~~~~m W.Nt)t.* W I
00 VON0-IVN 0(N a, NwmrV n
-) en Nz-
NU 000 ----~'- ON 00
0(N0 c0-00-- UmcN 00
L~Z wc~, M-- Ol
4 -- 00WNMN0VO O(N I'-u -C N -0-O'w In- 0(N
0~~t 0' 4c0( 0C W
Lu-~wv ~ w o 4N-
VW MO-- 00 00 0.3 ~0C 0Lu (N- -l C)C 4 4 I
z- 00UY '(NVL'w0n (
v r- 0 f- v r -V 0 - 0000 0 0 0- V. . . . . . . . . . . . . .L m
4~~~ 0- -'~o - o0-. Lu 3 (Nl
0. Nn 0 r- cc ox o- C40C 0008 0 0p- ~ ~ ~ ~ ?I M. D0 - C h
4 ~Yo 00' w - CN r MM -. 0 00 0 i 00mum 0 D~ (Ou m; ( 'Lu 4... ('3 .4 U. 00k ,
0 0.0 06n -9 W 0t CI0P.0.jo
aU~ a 0 0 6 nx O0 j 3 ~ uO o w4C
o 00 4U t'-'-. m - U 'A .0 u (~' 0 0 u .0V c.J 2 W44 J 4 3

- 0- 0L 8 N O M O
V) ID Nn 31
8r-( f, !D N Or-0O
L) ID .NNOM mmmIom
to to 0 0G
~~o; 8;0N8 N 8 8~ W?-
WI NO N OMNO
";0r-If-fvmv0w0v0 0W~~' 0 Cpq y m ImD--
z w 0
- N N C I(4 nN mNd M
WO c, NV0Y'UNN
wl z 0 fn N v -) N L ID0- In
4 aC. v ) 0 Lw
NE O N mINy w In M O0L C'.
C4r 0W ID 0C~ 0N 0- L0 comO :E 0I. 00.I.e.. 00.
2-W ON V OIOC0nIVN- CO
OL~ O DIDO- NLID
-; V
cc ~ ~~ ~ ~ ~ tA r-mL NWn q9I L UI C ~ I . .2
0 ~ o 0 w0 v0000 0 0n
C- L 01c N (0 m ~ t m
W; ov~omo owt- MMN n nd
0 04~~~ ~ C- C4~LILtN ~ ~ O
UzLn I-e N c- - q O t'I
CL 40t NOC 00 0 80
W 4..W0 - v m V 4m v c
om cc-n W 4~ 4tO 30U '1 u m4 1QoL OIU I 0 D W 6, -, 00000 0 - 0 0
z I- W 41 - -z4CD D 0 u lV) W.- "VN ' - 4. W U9L - -ZO O.W 0ozz n 0-w za0
U 6 O N- W Ut 49 Nl 4' -- Ii, c0W 4D - - e'e 0 0000
- -

I- -t.-SO 0 0g o v
Ln a
00(~Cl QQ004
Z w l a 5Ul9Cl0 (~Il ol 00~ -
wI ~ k MlJl-f IV' CD 08
Cl~ C 0 IV
z n
CO
0- -
51 C0 cl0 00-r)IV N 0
2- -mm--o-o 0
v- 2
ClV~l0C~Cl5 00
CN~4 Cl -- 0D f- 0 IoP D - C
04ZMVN-w M M--t M
- C NOO 1Ol OCC IDCl(D Ul-00-0-MV ~ 00 0
a 0 MNM-5Sr. c' 0 1- C*LuJ .% . . .
U -O 4 Cl l -lq ID- W -t
z 01
NMClMW-0 0 COva P.0 - p p 00 S l0 0 0 -
v O - 0 z C -
to -0 in f Cl wt
> 3
I-..
a: 1"~~CC O - - u 000000CE 0 0 0Lw -9 Cl C' - -4 U. -951C 0010
0~-- wlC~C > 4 Cl - j0 . 0Ui: 1JU 0m -Mw ,- 4.J oa p n -l
0 ~ W C. 9 "CC0Ia o C 0C) 6-Z0 w L 9u 11 --9 '- ClWz 5 l 0C 00 - 2 JM- .7c
ft Z~~~q in w Cl u- yC 0 010x U20 &a. - - - g o,- o- 01 10 0QiMn4x o za -9 fta...,o -cxlz z IA o M u U. wu 0 O uUO~tuO .Ju~u4

DEPARTMENT OF THE ARMYHIADOUARTERS, oth INPANTRY DIVisiON ILIGHT|
PORT RICHARDION.ALASKA 935054000
AFVR-AS-DS 29 January 1987
SUBJECT: After Action Report (Medical) - Brimirost '87
I. Concept of Operationsg The division surgeon section was dividedinto two teams for this exercise. One team deployed to FRI with the
division surgeon on 15 Jan to provide medical support to the units inthat area prior to the arrival of the USAF Air Transportable Hospital
(ATH). The second team headed by 1LT Collins moved with the G-1sectlon to the command bunker.
The team deplo .ing to FGA departed at 0500 with a 172 Spt Bn convoy,arriving at FWA at 1800. During the convoy an accident was reportedin a later serial. Two patients were maelvaced to Valley Hospital in
Palmer, Ak by a civilian ambulance. One HHC 6ID(L) ambulance was leftto Join the recovery element to respond to other emergencies.
One ambulance accompanied the 172d Spt Bn convoy to FGA on 16 Jan.The division surgeon remained at FWA to coordiante with the CAB,6-327th Inf Bn and MEDDAC. The 6-327 medical personnel were notlocated, arrangements were made to meet the medical platoon leader orthe battalion PA on 20 Jan. The personnel noted above were briefed onthe medical support plan and given the appropriate medevac cardspertaining to their area of operations.
A stop was made at Eielson AFB to talk to the SF Group Surgeon (OPFOR)Maj Christensan to brief him on available medical assets andevacuation procedures. At the conclusion of this meeting he and hisassistant group surgeon had no further questions concerning medicalsupport for the FTX.
Upon arrival at FGA the two ambulances with freezable medical supplieswere stored in the hangar at AAA. The section personal were billetedwith the USAF advanced party from the 363 Tactical Hospital. Theweather was moderate for the time of year. Temperatures ranged fromabout -10 to +30 degrees with winds gusting up to 52 knots. The roadconditions were generally good.
On 17 Jan the HHC Aid Station was operational and began seeingsickcall from field units. 2LT Jardine coordindate with 2d Bde TOC,6th Sig Bn, B FAST, C-Abn (6-327) and the MI Det informing them ofavailable medical assets and medevac procedures. The first traumatreatment team deployed to Gamble, St Lawrence Island on 17 Jan.

AFVR-AG-DSO 29 Jan 87SUBJECT: After Action BF 87
The daily medical'situation report was initially sent by prioritymessage. This was found to exceed the time constraints imposed bycommand briefings. There exists a need to know about real worldcasualities as soon as possible. Due to the need for accurateinformation ASAP the confidential message reporting was disgarded andinformation was called over Class A telephone; in the clear. This wasauthorized in the JTF OPLAN and verbally through 6ID(L) 6-2.
On 23 Jan the trauma treatment teams; medics from 6ID(L) andphysicians from BAH, met at FGA and deployed to Barter Island andOliktok. The HHC 6 ID(L) treatment team redeployed to FRA withoutincident. The following day I was informed that the water atGlenallen was not fit for consumption and water was being contractedfor at Glenallen. A food service NCO, MSG(P) Johnson, was identifiedas the individual who declared the water not potable.
1LT Collins had considerable difficulty locating Maj (Dr) Maguire toinform him of his departure time. Although detailed information wasfinally presented to him he missed his designated aircraft. He diddeploy on a later flight. Maj Maguire redeployed his team two daysprior to the planned redeployment date. He had the consent of thecompany commander to leave the site. This was felt to be poorJudgement on both the part of the physician and the company commander.Medical support should remain in place until the troops have deployedfrom a remote site such as this. The redeployment phase of anexercise has one of the greatest potentials for producing injuries.The temperatures at Lonely were anticlapted to be between -40 and -60during redeployment, making the possibility of injury even greater.The other two physicians from the north slope also redeployed earlywith the consent of the unit commander on site. The medics for eachteam and their medical equipment remained in place to redeploy withthe units.
The division surgeon or his representative presented a daily medicalstatus to the division commander or the chief of staff at 1300 hours.Updated inftrmation was readily available on inpatients by contactingthe fixed medical facilities each morning. Injury reports were aproblem due to the conflicting information throughout the exercise.Accurate information was obtained once the attending medical officerwas contacted.
The three trauma treatment teams deployed to the north slopeencountered very few minor injuries or soldiers reporting to sickcalI.Their facilities were adequate and meals were provided by civilianpersonnel at the sites. The treatment team on St. Lawrence Island washoused in two open rooms, approximately 1600 square feet, with sixtysoldiers. They kept very occupied seeing individuals with a viralillness and several who sustained minor injuries; to include threesuperficial frostbite cases. Each of the frostbite injuries occurredwhile operating a snowmachine in temperatures of 0 to -10 degrees andall occurred on the face or neck. Two patients presented with nauseaand vomiting; one reported to the unit with gastroenteritis and thesecond did not appear to be acutely i11, responding to compazine andclear liQuids in twenty-four hours. There were several cases of viralillness, involving the upper respiratory tract, but there was noindication of foodborne disease. At the request of Health Services

AFVR-AG-DSO 29 Jan 87SUBJECT: After Action BF 87
Command all thirty seven SF 600s prepared on patients seen by themedical officer were reviewed by the division surgeon to verify thatthere was no evidence of a foodborne disease outbreak. This wasnecessitated by the numerous packaqes of rations (MREs) that wereidentified as leakers, bloaters or otherwise not fit for consumption.CW3 Peters found two meals putrified, four packages of beans with gasbubbles and two applesauce containers with gas bubbles. The report ofseventeen "cases" of bad rations was first interpreted as seventeencases (patients) of foodborne illness; causing considerable concern inheadouarters elements and consideration for medical evacuation beforethe situation was clearly understood. The veterinary corps wasnotified and an extended inspection of field rations began at thetroop issue support activity. Subsequently, several lots of MREs wereidentified with a higher than acceptable rate of unsealed packages.Many of these meals did not appear in any way unfit for consumption,however, seals were not completely closed and "pinholes" were found oncompression of containers. What appeared to be a maggot was found inone meal A complete report will be requested from the veterniaryofficers and attached to this afteraction report. MREs from anotherlot were supplied to the unit, however, this lot also produced MREswith the same problem as identified with the lot already on hand.There did not appear to be consistency in the type of meal involved orthe manufacturing company as stamped on the packages. This mayindicate a problem in the material used in the packaging process; afirm answer has not been estabilished at this time.
2. Discussion. The overall concept of medical operations, asoutlined in the exercise directives and OPLAN, are considered to beadequate. The treatment teams attached to the 207th AKNG (Scout) werefunctional and stated to have been provided adequate equipment andsuoplies. The medical officer at St. Lawrence Islana preventedevacuation of over 20% of that unit that suffered from viral illnessand provided accurate information on the status of MREs.
Medical evacuation was a coordinated effort between the Army, USAF,USCG and the Civil Air Patrol. Due to the time required forevacuating casual ities it is imperative that medical officers belocated with treatment teams in the most remote locations.
There were a total of 462 soldiers and airmen seen on sickcall duringthe exercise, only 31 were admitted to a medical facility. There wereno deaths as a result of this exercise.
Medical resuoply was to be on an emergency basis only due to thelength of the exercise. Two requests were initiated for Class VIIIresupply. One from A Co 6-327 Infantry attached to the 207th AKNG at
or near Kotzebue, the company medics were in excess of 250 miles from
their supporting aid station and requested cold madlcations. Anattempt was made to get the medicine aboard a C-130, scheduled supplyrun, but, appropriate forms were not completed and the effort failed.
The unit redeployed to their home station the following day. A second
request was made by the treatment team at Gamble, St Lawrence Island
and the supplies were received two days later on a scheduled resupplyaircraft.

AJ V R-AG-DSOSUBJECT: After Action BF 87
The treatment facility estabilished by the USAF at Fort Greelyconsisted of temoeW tents designed for a desert environment. Erectingthe A-frame tentage was complicated by the high winds; destroying onesection of the hospital. The Interior of the tentage was spacious andprovided work space without poles or obs acles. The modules that wereused for the lab, x-ray and surgery were excellent, but, weighed 3000lbs or more in each case. The facility was placed within the mainpost area and there was no attempt made for light or noise discipline:the objective was to test this configuration and equipment in anarctic environment. The tent material allowed light to pass throughmaking light discipline impossible. Flaps on the top of the tent weredesigned to allow hot air to escape, not desirable in a coldenvironment. The heating system was marginally adequate in moderatetemperatures (above 0 degrees), also, there were no holes in thecanvas that would allow stove pipes to extend through. Withmodifications these structures may be useful in the tacticalenvironment as anticipated by Army forces. The "boxes" that expandedfor the lab, x-ray and surgery (in particular) provided excellent workspaces. A simillar structure could be mounted on a 5-ton truck andprovide an excellent expandable area for Corp Surgical Squads.
3. Recowimendationss The concept of trauma traatment teams deployedin such a manner as to provide the earliest possible care isparticularily useful in the Alaska Theater. The extended medicalevacuation times and delays for weather have a great potential forcausing extended morbidity and/or mortality.
Specifi _ ..-u!renemt- for placing a package aboard a USAF aircraftneed to be identified prior to the FTX pi4z.
Reporting procedures be identified separately for "real world"casualities/patients. The requirement of the commanders to know anyand all information ASAP is not feasible with the tacticle play andthe length of time required to obtain messages or encrypting suchinformation does not satisfy the chai Q cc...an-41 requirement tostay abreast of the situation.
TABS: ROBE T M .Exercise Directive CPT, MCOPLAN Division SurgeonMapMedevac freq (REDCOM Directive)Medevac cardsHighway EMS handoutLtr to OPFOR SurgeonLtr from IHSTask Organization - Medical TeamsTreatment Team FormularyMed Rpt StatusIccident RotVeternarian Rpt (MREs)Critique Comments
APPENDIX 2
Twenty-four Hour Food Record Card
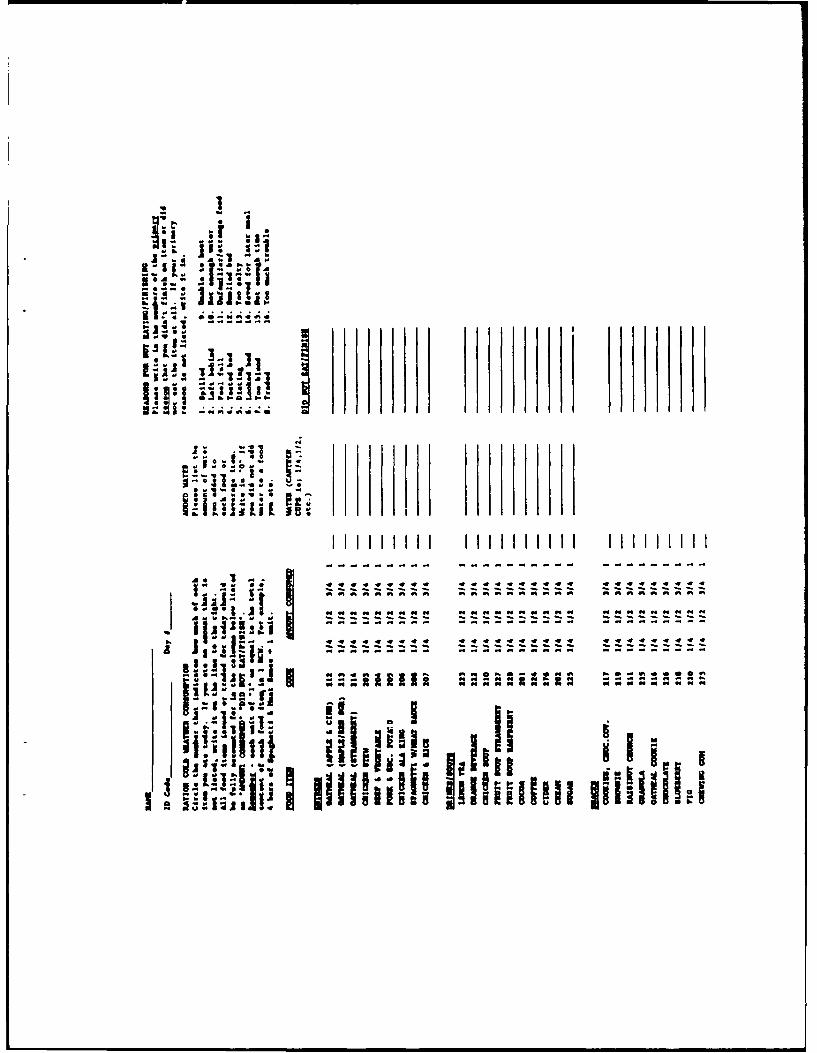
d i!
*t. -ll-..J.
* ii -i; lI
1 Ia . - b. .44 4 4 4 4 4 4 4 4 4 4 4 4 4 4 4 4 4 4
,.' , , -:! : ......f. . .. ... ....lI i!, :I -. .! - "-
* - R.I nonnniI - .I . " _i1:,I aS, I.."1I"II" .-.'., il ,' I I
.. JI &II,

MATER COPSUWTIOH
Please estimte the number of canteen cups of PLAN water (nothing In it) youdrank during each time period lasted below. If you drank more than 2 canteencups during any one time period, write In the total ainunt on the line to theright of the number "2*.
TIM PRIOD NUM O CANTEE cups
0400-1000 0 114 112 314 1 11/4 1 1/2 1 3/4 21000-100 0 114 112 314 1 1 114 1 112 1 314 21500-2000 0 114 112 3/4 1 1 114 1 117 1 514 22000-0400 0 1/4 112 314 1 1 114 1 ' . 314 2
PLEASE AwSwR THE FOLLOwIxG qIJESTIoNS trEOu GOInG TO SUE?. CIRCLE ON Itot w1
TO AW EACH QOESTION.
1. Sow LIGHT or DARK to your urine today?
ESTRIUMY MD0UATELY SLIGHTLY NIITHER SLIGHTLY MDERATEZLY EZTR -ELYLIGHT LIGHT LIGHT LIGHT NOR DARK DARK DARE
DARK1 2 3 4 6 7
1. Rate the COLOR of your urine &a it Iba occurred today.
LIGHT 1ELO DARK YELLOW ORANGE IROWN1 2 2 4
3. Are you urinating roe or less OF than usual?
maTRFELT NODBRATELY SLIGHTLY EITHERM SLIGHTLY M1DEATELY EZTDMELYLESS LESS LESS MORE NOR NRS MlRURE
LESS
1 2 3 A $ 6 7
4. 1& the *MOw you are urinating swre or loe than usual?
URh1LY NWODATELY SLIGHTLY NEITHER SLIGHTLY UDEIRAT9LY UTRDELYLaSS LESS LESS WR NOR "n MUtE NDRE
LESS1 2 3 4 $ 6 7

APPENDIX 3
Sample Collection Schedule and Unit Movement
'97

Appendix 3. Sample collection schedule and unit movement
Day Collections Movement
0 pre blood sample in base campinitial urine sample
1 no contact with troops air deployment
2 day 1 food intake in initial campday 2 urine
3 day 2 food intake G1 moved 1 mileday 3 urine G2 no change
4 day 3 food intake G1 no changeday 4 urine G2 joined GI
5 day 4 food intake G1 moved 12 milesday 5 urine G2 no change
6 day 5 food intake GI no changeday 6 urine G2 joined GI
7 day 6 food intake both groups togetherday 7 urine after overnight move
8 day 7 food intake both groups moveday 8 urine to top of hill
9 day 8 food intake no changeday 9 urinepost blood sample
10 no collections both groups marchto base (10 miles)

APPENDIX 4
Cold Enviroment Background Survey Form
(99

Cold Environment 3ackground Survey Form
NAME: I DATZ:___
(Last, First, Middle Initial) (Oay/Mo./fr.J
PART I: BASIC DEMOGRAPHIC INFORMATION
INSTRUCTIONS: For each of the items below FILL in the blank or CIRCLE the ipprorl ,t.*
code number, answering each item to the best of your knowledge. Please makO Sur,. ,i
answered every item.
1. Age:
2. Gender: 1. Male 2. Female
3. Race: 1. White/Caucasian2. Black/Negroid3. Other:
4. Height: (ft./in.)
5. Weight: (lbs)
6. Marital Status: 1. Single J. Divorced2. Married 5. Widow/Widower3. Separated
7. Indicate your highest level of formal civilian education:
1. Less than High School 5. Some College2. Some High School 6. College Graduate
3. High School Graduate 7. Some Graduate School. G.E.D. Credit for H.S. Advanced Graduate Degree
8. Civilian Occupation:___ _ _
9. Rank: E- WO- 0-,
10. Years active military service:
11 Primary MOS: Title:.
12. Duty MOS:__ Title:_
13. Duty Station: (Post/Location)-__ .
14. Unit:
15. Name and location of the community in which you spent most of your lite,:
Number of years spent there
(Town/State/Na-tion)

16. ndicat ...: ;er:entaie of your lire spent where during the colde3t month:
usually didn't go below 500F. (warm or hot all year, mild wintcr3
usually didn't go below 32*F. (warm or hot summers, cool winters)
usually didn't go below 1 40F. (mild summers, cold winter3)
___ usually went below 140F. (mild summers, cold winters)
17. Indicate the percentage of your life spent in the following SqSr3ph1c locattrLin3:
Urban Area
Suburban Area
Rural Area
18. indicate the amount of regular daily consumvtion:
Specify1 no-I-Ir
Small Moderate Large of cup. /iiritiv-None Amount Amount Amount per l'i
Caffeinated coffee or tea 0 1 2 3(without sugar)
Caffeinated coffee or tea 0 1 2 3 _ |(with sugar)
Colas 0 1 2 3 .
Sugar free colas 0 1 2 3 _
Other sugared soft drinks 0 1 2 3 . . .
Alcoholic beverages 0 1 2 3 , ' _
Salt/Salty foods 0 1 2 3
Cigarettes 0 1 2 3
Pipes/cigars/chews 0 1 2 3
Stimulant/drug medication 0 1 2 3
Relaxant/drug medication 0 1 2 3
Allergy/hay fever medication 0 1 2 3
Cold medicines 0 1 2 3
Other medication: .. 0 1 2 3

19. How often do you take part in physical activity or sports?
1. Not at all 2. days per month
20. How would you compare yourself to others of your own sex and age in-terms of physicalability and fitness?
1. Poor 2. Fair 3. Average 4. Above Average 5. Superior
21. Describe yourself in terms of physical activity.
1. Inactive 2. Active 3. Very Active
PART I: COLD ENVIRONMENT HISTORY
(Temperatures at freezing (32*F.) or below)
22. How much experience have you had with freezing weather or cold climates?
1. No Experience 3. A Moderate Amount
2. A Slight Amount 4. A Great Amount
23. In general, how do (would) you feel about living in a geographical area having cold
winters?
1. I (would) really enjoy it. 3. I don't (wouldn't) care for it.
2. I (would) tolerate it. 4. I (would) dislike it very much.
24. Check the activities you have done in cold weather:
Snow Skiing Ice Fishing - Snowmobiling
- Snow Shoeing - Ice Skating _ Shoveling Snow
__. Making a Snowman _._ Ice Sailing Other! ___.
- Camping Snow Sledding .._ None of these
25. Compared to others around you, in a cool or cold environment, hc do you generally
feel?
1. Colder than others 3. Warmer than others
2. About the same as others 4. Have no idea how I differfrom others in this respect
26. How much military classroom Instruction have you had for taking care of yourself in
cold weather?
1. No Instruction 3. A Moderate Amount
2. A Slight Amount 4. A Great Amount

27. How much field training have you had or. taking care of yourself in eel A weather^
1. No Field Training 3- A Moderate Amount
2. A Slight Amount 1. * Great Amount
28. Do you have any special problem when you are exposed to cool or cold conditions?
1. No 2. Yes, specify:_ ,_
29. How many times have you been treated by medical personnel for any of the following cold related injuries? Please give exact number.
Frostnip——- Chilblains , Check if none of these
frro^uo Hypothermia , Other; . „ —„
30. How many times untreated? Please give exact number.
Frostnip— Chilblains _- Check if none of these ..
Frostbite- — Hypothermia Other:

APPENDIX 5
Ration, Cold Weather Questionnaire
1011
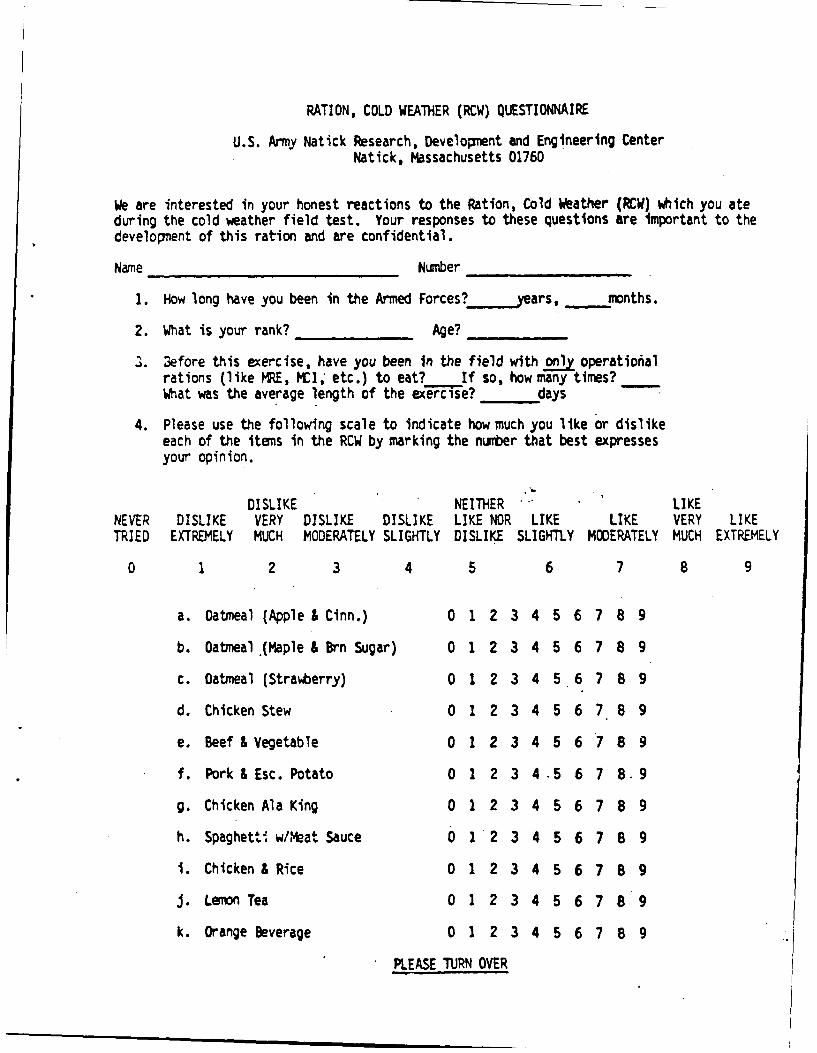
RATION, COLD WEATHER (RCW) QUESTIONNAIRE
U.S. Army Natick Research, Development and Engineering CenterNatick, Massachusetts 01760
We are interested in your honest reactions to the Ration, Cold Weather (RCW) which you ateduring the cold weather field test. Your responses to these questions are important to thedevelopnent of this ration and are confidential.
Name Number
1. How long have you been in the Armed Forces? years, months.
2. What is your rank? Age?
e. fore this exercise, have you been In the field with only operationalrations (like MRE, MCI, etc.) to eat? If so, how many times?What was the average length of the exe-FIise? days
4. Please use the following scale to indicate how much you like or dislikeeach of the items in the RCW by marking the number that best expressesyour opinion.
DISLIKE NEITHER -LIKE
NEVER DISLIKE VERY DISLIKE DISLIKE LIKE NOR LIKE LIKE VERY LIKETRIED EXTREMELY MUCH MODERATELY SLIGHTLY DISLIKE SLIGHTLY MODERATELY MUCH EXTREMELY
0 1 2 3 4 5 6 7 8 9
a. Oatmeal (Apple & Cinn.) 0 1 2 3 4 5 6 7 8 9
b. Oatmeal .(Maple &Brn Sugar) 0 1 2 3 4 5 6 7 8 9
c. Oatmeal (Strawberry) 0 1 2 3 4 5. 6 7 8 9
d. Chicken Stew 0 1 2 3 4 5 6 7 8 9
e. Beef&Vegetable 0 1 2 3 4 5 6 7 8 9
f. Pork& Esc. Potato 0 1 2 3 4.5 6 7 8.9
g. Chicken Ala King 0 1 2 3 4 5 6 7 8 9
h. Spaghetti w/,eat Sauce 0 1 2 3 4 5 6 7 8 9
i. Chicken & Rice 0 1 2 3 4 5 6 7 8 9
J. Lemon Tea 0 1 2 3 4 5 6 7 8 9
k. Orange Beverage 0 1 2 3 4 5 6 7 8 9
PLEASE TURN OVER

DISLIKE NEITHER LIKENEVER DISLIKE VERY DISLIKE DISLIKE LIKE NOR LIKE LIKE VERY LIKETRIED EXTREMELY MUCH MODERATELY SLIGHTLY DISLIKE SLIGHTLY MODERATELY MUCH EXTREMELY
0 2 3 4 5 6 7 B 9
1. Chicken Soup 0 1 2 3 4 5 6 7 8 9
m. Fruit Soup (Straberry) 0 1 2 3 4 5 6 7 8 9
n. Fruit Soup (Raspberry) 0 1 2 3 4 5 6 7 8 9
o. Cocoa 0 1 2 3 4 5 6 7 8 9
p. Coffee 0 1 2 3 4 5 6 7 8 9
q. Cider 0 1 2 3 4 5 6 7 8 9
r. Cookies, Choc. Coy. 0 1 2 3 4 5 6 7 8 9
s. Brownie 0 1 2 3 4 5 6 7 8 9
t. Raisinut Crunch 0 1 2 3 4 5 6 7 8 9
u. Granola Bar 0 1 2 3 4 5 6 7 8 9
v. Oatmeal Cookie 0 1 2 3 4 5 6 7 6 9
w. Chocolate Bar 0 1 2 3 4 5 6 7 8 9
x. Blueberry Bar 0 1 2 3 4 5 6 7 8 9
y. Fig Bar, 0 1 2 3 4 5 6 7 8 9
z. Chewing Gun 0 1 2 3 4 5 6 7 8 9
5. Do you think that any foods or beverages should be DROPPED from the RCW?. Circle one:
YES/NO. If yes, list the item(s).
6. Do you think that any items should be ADDED to the RCW? Circle one: YES/NO.If yes, list the item(s). Be realistic!

7. Please rate how much you like or dislike the RCW for breakfast, lunch, and dinner. Circleone rmnber for each of the three meals.
DISLIKE NEITHER LIKENEVER DISLIKE VERY DISLIKE DISLIKE LIKE NOR LIKE LIKE VERY LIKETRIED EXTREMELY MUCH MODERATELY SLIGHTLY DISLIKE SLIGHTLY MODERATELY MUCH EXTREMELY
0 1 2 3 4 5 6 7 8 9
a. For breakfast 0 1 2 3 4 5 6 7 8 9
b. For lunch 0 1 t 3 4 5 6 7 8 9
c. For dinner 0 1 2 3 4 5 6 7 8 9
8. We would like to know what you think of the AMOUNT of food provided by each part of theRCW. Was there too little, too much or just- te-right amount? Please circle onenurnber for each part of the ration.
VERY MUCH MUCH MODERATELY SLIGHTLY JUST SLIGHTLY MODERATELY MUCH VERY MUCH
TOO SMALL TOO M4ALL TOO SMALL TOO SMALL RIGHT TOO LARGE TOO LARGE TOO LARGE TOO LARGE
1 2 3 4 5 6 7 8 9
a. Entree bars (chicken, beef, etc.) 1 2 3 4 5 6 7 8 9
b. Oatneal 1 2 3 4 5 6 7 8 9
c. Desserts (cookies, brownies, bars, etc) 1 2 3 4 5 6 7 8 9
d. Beverages (cocoa, tea, cider, etc.) 1 2 3 4 5 6 7 8 9
e. Fruit soups (strawberry, raspberry) 1 2 3 4 5 6 7 8 9
f. Chicken Soup 1. 2 3 4 5 6 7 8 9
g. Candies 1 2 3 4 5 6 7 8 9
h. Nuts and raisin mix 1 2 3 4 5 6 7 8 9
9. We would like to know your opinion of the amount of VARIETY in the RCW. Please circlenumber I if the awnt of variety is sufficient. Circle one of the other nunbers (2-6)to represent how much more variety should be increased. (List continued on next page).
VARIETY SLIGHTLY SOMEWHAT MUCH VERY MUCHNOW MORE MORE MODERATELY MORE MORE
ENOUGH VARIETY VARIETY MORE VARIETY VARIETY VARIETY
1 2 3 4 5 6
a. Entree bars (chicken, beef, etc.) 1 2 3 4 5 6
PLEASE TURN OVER
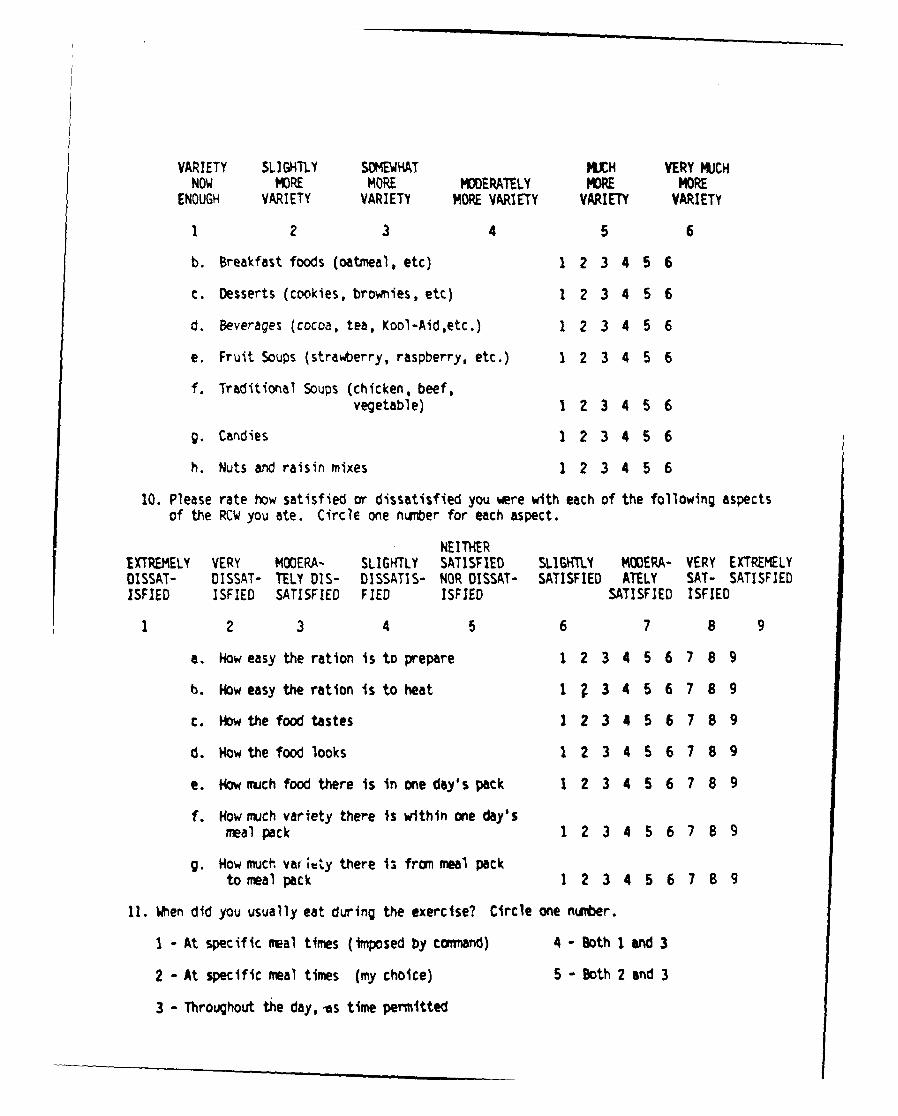
VARIETY SLIGHTLY SOMEWHAT MUCH VERY MUCHNOW MORE MORE MODERATELY MORE MORE
ENOUGH VARIETY VARIETY MORE VARIETY VARIETY VARIETY
1 2 3 4 5 6
b. Breakfast foods (oatmeal, etc) 1 2 3 4 5 6
c. Desserts (cookies, brownies, etc) 1 2 3 4 5 6
d. Beverages (cocoa, tea, Kool-Aid,etc.) 1 2 3 4 5 6
e. Fruit Soups (strawberry, raspberry, etc.) 1 2 3 4 5 6
f. Traditional Soups (chicken, beef,vegetable) 1 2 3 4 5 6
g. Candies 1 2 3 4 5 6
h. Nuts and raisin mixes 1 2 3 4 5 6
10. Please rate how satisfied or dissatisfied you were with each of the following aspectsof the RCW you ate. Circle one number for each aspect.
NEITHEREXTREMELY VERY MODERA- SLIGHTLY SATISFIED SLIGHTLY MOXERA- VERY EXTREMELYDISSAT- DISSAT- TELY DIS- DISSATIS- NOR DISSAT- SATISFIED ATELY SAT- SATISFIEDISFIED ISFIED SATISFIED FIED ISFIED SATISFIED ISFIED
2 3 4 5 6 7 8 9
a. How easy the ration is to prepare 1 2 3 4 5 6 7 8 9
b. ow easy the ration is to heat I g 3 4 5 6 7 8 9
c. How the food tastes 2 2 3 4 5 6 7 8 9
d. How the food looks 1 2 3 4 5 6 7 8 9
e. ow much food there is in one day's pack 1 2 3 4 5 6 7 8 9
f. Now much variety there is within one day'smeal pack 1 2 3 4 5 6 7 8 9
g. How much vaf ;tty there is from meal packto meal pack 1 2 3 4 5 6 7 8 9
11. When did you usually eat during the exercise? Circle one numter.
I - At specific meal times (imposed by command) 4 - Both I and 3
2 - At specific real times (my choice) 5 - Both 2 aind 3
3 - Throughout the day, ts time permitted

12. How many meals did you usually eat a day? . ...
13. When did you usually drink the following beverages? Check the appropriate line orlines for each beverage.
DID NOT WITHi WITH WITH BETWEENDRINK BREAKFAST LUNCH DINNER _,MEALS
a. Cider
b. Fruit Soup
c. Chicken soup
d. Cocoa
e. Coffee
f. Tea
g. Orange Beverage
h. Water (no flavor)
14. On a typical day, did you eat alone or in a group? Circle one.
a. alone c. with tvv peopleb. with one person d. with more than two peoDle
15. On a typical day, did you drink alone or in a group? Circle one.
a. alone c. with two peopleb. with one person d. with more than two people
16. For what reasons did you NOT eat enough during the exercise? Circle ALL thethe reasons thit apply to you. If you ALWAYS ate enough during this exercise, circlew"lo only.
a. Disliked the food in the ration.
b. Not enough food provided in the r'aLion.
c. Not enough time to prepare ration.
d. Too much trouble to prepare ration.
e. Too cold to eat.
f. Not enough time to eat the ration.
g. No heat source to heat the ration.
PLEASE TURN OVER

h. Poor heat source to heat the ration.
i. Not enough water to prepare the ration.
j. Got bored with the food in the ration-not enough variety.
k. Other - please explain
1. Always ate enough during this exercise.
17. if you circled more than one reason in the preceding question (#16), what was theMOST FREQUENT reason you did not eat enough? Please write the letter from the listabove.
18. For what reason did you not drink enough during the exercise? Circle ALL the reasons that
apply to you. If you ALWAYS drank enough during this exercise, circle "k" only.
a. Too much trouble to melt snow or ice.
b. Not enough time to melt snow or ice.
c. Stream water too far from site.
d. No equipment (pots, pans) to melt snow.
e. Not enough equipment to melt snow.
f. No heat source or stove.
g. Not enough heat sources or stoves for the group.
h. Water in canteen kept freezing.
i. Not enough lbeverages (cocoa, cider, etc.) in RCW.
J. Other
k. Always drank enough during exercise.
19. If you circled more than one reason in the preceding question (#18) what was theMST FREQUENT reason you did not drink enough? Please write in the letter fromthe list above.
20. How often were you HUNGRY during the field exercise? Circle one number.
ALMOST FAIRLY ALMO.rNEVER NEVER SOtETIMES OFTEN OFTEN ALWAYS ALWAYS
1 2 3 4 5 6 7

21. How often were you THIRSTY during the field exercise? Circle one number.
ALMOST FAIRLY ALMOSTNEVER NEVER SOMETIMES OFTEN OFTEN ALWAYS ALWAYS
1 2 3 4 5 6 7
22. How often were you able to get enough water to prepare foods and beverages? Circle one.
ALMOST FAIRLY ALMOSTNEVER NEVER SOMETIMES OFTEN OFTEN ALWAYS ALWAYS
1 2 3 4 5 6 7
23. How often did you add water to the RCW foods and beverages? Write the ntjrberthat best expresses your answer next to each food or beverage.
ALMOST FAIRLY ALMOSTNEVER NEVER SOMETIMES OFTEN OFTEN ALWAYS ALWAYS
1 2 3 4 5 6 7
a. entrees (chicken, etc.) f. oatmeal
b. tea g. cocoa
c. coffee h. cider
d. chicken soup i. fruit soup
e. --- orange beverage J. _ granola
24. How easy/difficult was it to obtain water? Circle one.
VERYEXTREMELY VERY MODERATELY SLIGHTLY SLIGHTLY MODERATELY DIFFI- EXTREMELY
EASY EASY EASY EASY NEUTRAL DIFFICULT DIFFICULT CULT DIFFICULT
1 2 3 4 5 6 7 B 9
23. On the average, how many canteens (one canteen - 32 ounces I 1 quart) of water did youuse each day for drinking, eating, and other uses such as washing? Write your best esti-mate using wihole numrbers and fractions, if necessary.
Drinking ---_ canteens/day
Eating _-.. canteens/day
Other -___ canteens/day
PLEASE TURN OVER

26. How did you obtain water? Circle all the ways you obtained water.
a. Melted snow e. 5 gallon cans
b. Melted ice f. water buffalo
c. Fran an unfrozen strew g. other
d. From an unfrozen lake or pond
27. If you circled more than one way of obtaining water, which was the MOST FREQUENT?Please write in the letter from the list above:
28. How many times did you have to melt snow or ice to obtain water during the exercise?Please circle one.
EVERY EVERY ONCE EVERY TWICE THREE FUR FIVE ORFIFTH THIRD EACH OTHER EACH TIMES TIMES MORE TIMES
NEVER DAY DAY DAY DAY DAY EACH DAY EACH DAY EACH DAY
1 2 3 4 5 6 7 8 9
29. If you had to melt snow or ice did you work alone or in teams? Circle one.
a. alone c. two other people
b. one other person d. more than two other people
30. If you melted snow or ice, did you do it by choice or were you conmanded to melt it?Circle one.
a. by choice b. by command c. both d. other
31. iat was the typical twperature of the RCW foods and beverages that you consumed?Write the nwuber that describes the average temperature next to each food and beverage.
VERY VERY
COLD CULD COOL NEUTRAL WARM HOT HOT
1 2 3 4 5 6 7
a. entrees (chicken, beef, etc.) f. oatmeal
b. tea g. cocoa
c. coffee h. cider
d. chicken soup 1. fruit soup
e. - orange beverage J. _ plain water
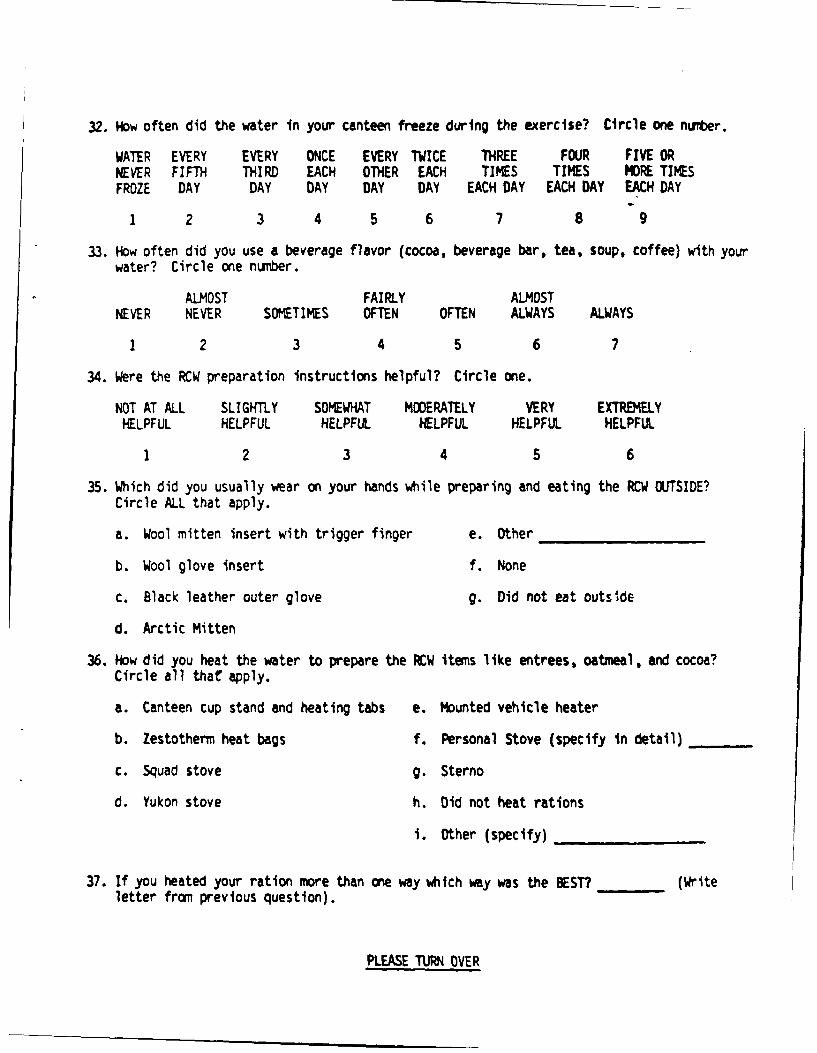
32. How often did the water in your canteen freeze during the exercise? Circle one number.
WATER EVERY EVERY ONCE EVERY TWICE THREE FOUR FIVE ORNEVER FIFTH THIRD EACH OTHER EACH TIMES TIMES MORE TIMESFROZE DAY DAY DAY DAY DAY EACH DAY EACH DAY EACH DAY
1 2 3 4 5 6 7 8 9
33. How often did you use a beverage flavor (cocoa, beverage bar, tea, soup, coffee) with yourwater? Circle one number.
ALMOST FAIRLY ALMOSTNEVER NEVER SOMETIMES OFTEN OFTEN ALWAYS ALWAYS
1 2 3 4 5 6 7
34. Were the RCW preparation instructions helpful? Circle one.
NOT AT ALL SLIGHTLY SOMEWHAT MODERATELY VERY EXTREMELYHELPFUL HELPFUL HELPFUL HELPFUL HELPFUL HELPFUL
1 2 3 4 5 6
35. Which did you usually wear on your hands while preparing and eating the RCW OUTSIDE?Circle ALL that apply.
a. Wool mitten insert with trigger finger e. Other
b. Wool glove insert f. None
c. Black leather outer glove g. Did not eat outside
d. Arctic Mitten
36. How did you heat the water to prepare the RCW items like entrees, oatmeal, and cocoa?Circle all that apply.
a. Canteen cup stand and heating tabs e. Mounted vehicle heater
b. Zestotherm heat bags f. Personal Stove (specify In detail)
c. Squad stove g. Sterno
d. Yukon stove h. Did not heat rations
i. Other (specify) . .. .
37. If you heated your ration more than one way which way was the BEST? (Writeletter from previous question).
PLEASE TURN OVER
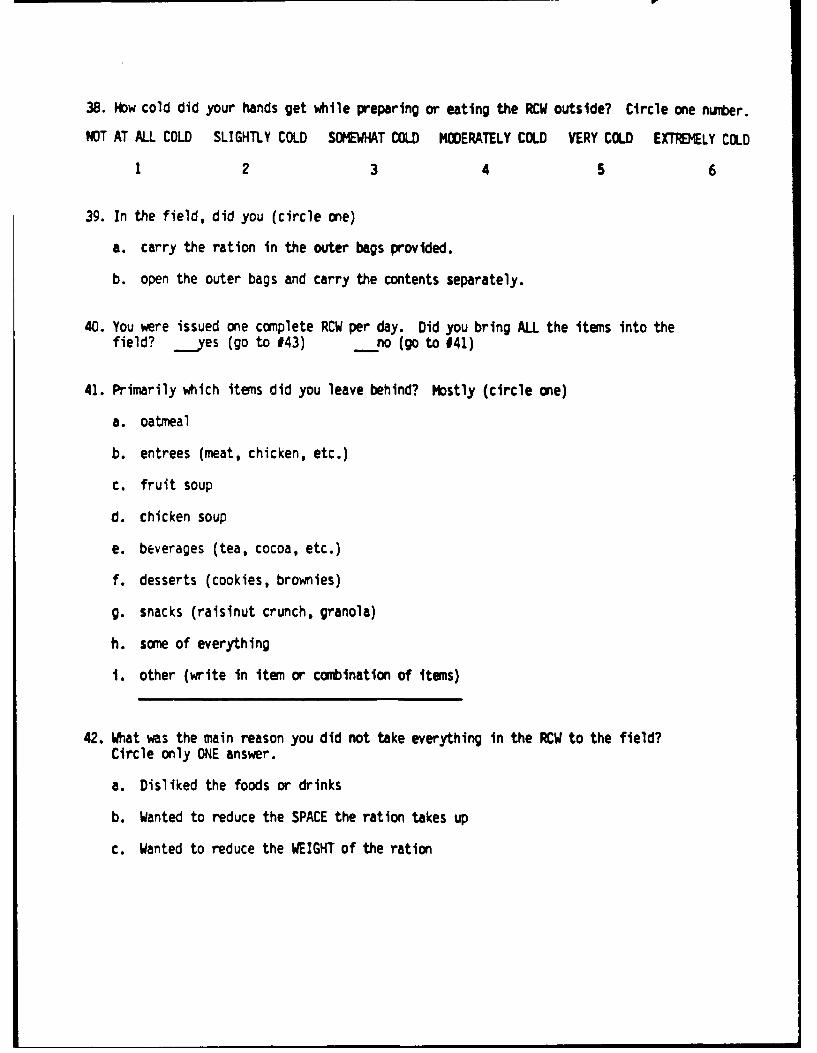
38. How cold did your hands get while preparing or eating the RCW outside? Circle one number.
NOT AT ALL COLD SLIGHTLY COLD SOtWHAT COLD MODERATELY COLD VERY COLD EXTREMELY COLD
1 2 3 4 5 6
39. In the field, did you (circle one)
a. carry the ration in the outer bags provided.
b. open the outer bags and carry the contents separately.
40. You were issued one complete RCW per day. Did you bring ALL the items into thefield? yes (go to #43) no (go to #41)
41. Primarily which items did you leave behind? Mostly (circle one)
a. oatmeal
b. entrees (meat, chicken, etc.)
c. fruit soup
d. chicken soup
e. beverages (tea, cocoa, etc.)
f. desserts (cookies, brownies)
g. snacks (raisinut crunch, granola)
h. some of everything
i. other (write in item or conination of items)
42. What was the main reason you did not take everything in the RCW to the field?
Circle only ONE answer.
a. Disliked the foods or drinks
b. Wanted to reduce the SPACE the ration takes up
c. Wanted to reduce the WEIGHT of the ration
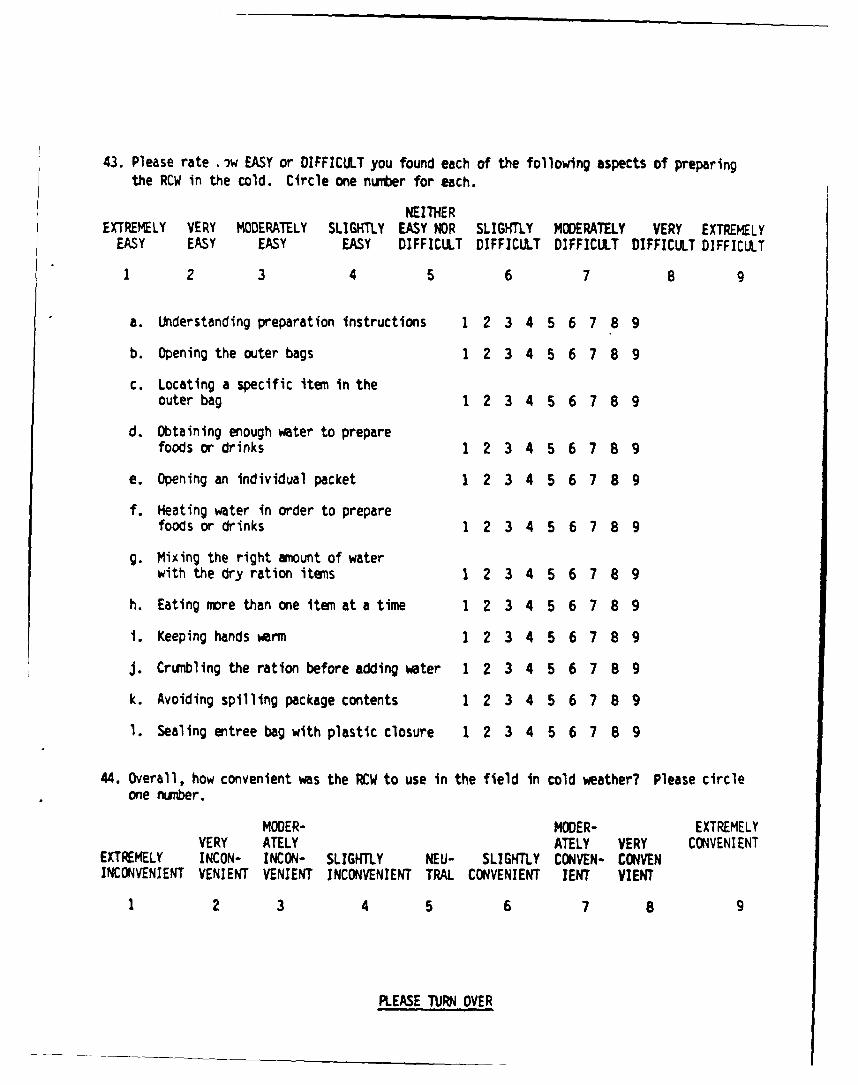
43. Please rate ',)w EASY or DIFFICULT you found each of the following aspects of preparingthe RCW in the cold. Circle one numter for each.
NEITHEREXTREMELY VERY MODERATELY SLIGHTLY EASY NOR SLIGHTLY MODERATELY VERY EXTREMELY
EASY EASY EASY EASY DIFFICULT DIFFICULT DIFFICULT DIFFICULT DIFFICULT
2 3 4 5 6 7 8 9
a. Understanding preparation instructions 1 2 3 4 5 6 7 8 9
b. Opening the outer bags 1 2 3 4 5 6 7 8 9
c. Locating a specific item in theouter bag 1 2 3 4 5 6 7 8 9
d. Obtaining enough water to preparefoods or drinks 1 2 3 4 5 6 7 8 9
e. Opening an individual packet 1 2 3 4 5 6 7 8 9
f. Heating water in order to preparefoods or &inks 1 2 3 4 5 6 7 8 9
g. Mixing the right amount of waterwith the dry ration items 1 2 3 4 5 6 7 8 9
h. Eating more than one item at a time 1 2 3 4 5 6 7 8 9
I. Keeping hands warm 1 2 3 4 5 6 7 8 9
J. Crunbling the ration before adding water 1 2 3 4 5 6 7 8 9
k. Avoiding spilling package contents 1 2 3 4 5 6 7 8 9
1. Sealing entree bag with plastic closure 1 2 3 4 5 6 7 8 9
44. Overall, how convenient was the RCW to use in the field in cold weather? Please circleone nunber.
MODER- MODER- EXTREMELYVERY ATELY ATELY VERY CONVENIENT
EXTREMELY INCON- INCON- SLIGHTLY NEU- SLIGHTLY CONVEN- CONVENINCONVENIENT VENIENT VENIENT INCONVENIENT TRAL CONVENIENT IENT VIENT
1 2 3 4 5 6 7 8 9
PLEASE TURN OVER

45. Compare the CONVENIENCE of the RCW with the WRE (Meal, Ready to Eat). Please circleone number.
NEVER RCW RCW RCW RCW RCW RCWUSED MUCH SOMEWHAT SLIGHTLY SLIGHTLY SOMEHT MICHM4E LESS LESS LESS NEUTRAL MORE MORE MORE
0 1 2 3 4 5 6 7
46. Compare the ACCEPTABILITY (taste, looks, etc.) of the RCW with the MRE. Pleasecircle one number.
NEVER RCW RCW RCW RCW RCW RCWUSED MUCH SOMEWHAT SLIGHTLY SLIGHTLY SOMEWHAT MUCHMRE WORSE WORSE WORSE NEUTRAL BETTER BETTER BETTER
0 1 2 3 4 5 6 7
47. Below is a list of possible ways of improving the RCW. Please write the number "1"next to the improvement you think is MOST important, the number "2" next to the improve-ment you think is SECOND in importance, the number N3" next to the THIRD most importantimprovenent, "4" next to the FOURTH, and "5" next to the FIFTH most important.
Make the rations taste better
Increase the variety of the ration
Make the ration easier to prepare
Include more breakfast foods in the ration
Make the portion sizes larger
Other (write in)
Please write additional comments on the RCW or on problems associated with cold weathereating/drinking in this space.__
IHMA YOU

LS. For each category of food, if you could replace (the most unpopular item),what would you replace it with?
49. If you could get rid of the entree you like least, what would you like
to have replace it?
50. Did you use hot sauce while in the field? If so, would you like to have
hot sauce included in the ration?
51. Please rate how EASY or DIFFICULT you found making a solution when preparing
the following foods in the RCW. Please fill in the number for each item
listed below.
EXTREMELY VERY MODERATELY SLIGHTLY EP T SLIGHTLY MODERATELY VERY EXTREMEL"
EASY EASY EASY EASY DIFFICULT DIFFICULT DIFFICULT DIFFICULT DIFFIC:
1 2 3 4 5 6 7 8 9
WITH HOT WATER WITH COLD WATER
a. entrees (chicken, etc.)
b. tea
c. coffee
d. chicken soup
e. orange beverage
f. oatmeal
g. cocoa
h. cider
i. fruit soup
52. Since the delivery of threi hot meals a day in a Light Infantry field
situation is not possible, please suggest the best feeding system.
APPENDIX 6
Categorization of States into 4 Temperate Zones
1.18

Categorization of States into 4 Temperature Zones
Zone I Cold States : (average temperature for the winter months is below 14
degrees Fahrenheit) score = 4.
Alaska, Wisconsin, Montana, North Dakota, South Dakota, Maine, Vermont,
Michigan, Wyoming and Minnesota.
Zone 2 Cool States : (average temperature for the winter months is below 32
degrees Fahrenheit) score - 3.
New Hampshire, Massachusetts, Iowa, Illinios, Kansas, Idaho, Colorado,
Connecticut, Nebraska, Nevada, New York and Utah.
Zone 3 Mild States : (average temperature for the winter months is below 50
degrees Fahrenheit) score a 2.
Missouri, New Jersey, Mew Mexico, Ohio, Pennsylvania, Rhode Island, District
of Columbia, Kentucky, Maryland, Oklahoma, North Carolina, Virginia, Arkansas,
Oregon, Tennessee, Washington, West Virginia and Delaware.
Zone 4 Warm States : (average temperature for the winter months is above 50
degrees Fahrenheit) score - 1.
Georgia, Arizona, Mississippi, South Carolina, Texas, Alabama, California,
Louisiana, Florida and Hawaii.

APPENDIX 7
Percent Nutrient Intake of RCW
120

APPENDIX 7-1
Mean nutrient intake compared tonutrients available in the RCW
Available Group 1 Group 2Nutrient Nutrients Intake %Eaten Intake %Eaten
Energy,kcal 4470 2392 54 2658 59Protein,g 120.2 77.3 64 78.3 65Carbohydrate,g 661.5 315.1 48 361.6 55Fat,g 149.3 91.3 61 99.8 67Vitamin A,mcg RE 2455.6 1171.3 48 1086.6 44Ascorbic Acid, mg 260.0 60.8 23 56.222Thiamin,mg 6.3 2.6 41 2.5 40Riboflavin,mg 2.0 1.0 50 1.0 50Niacin,mg NE 32.7 21.8 67 21.1 65Vitamin B6,mg 4.2 1.7 40 1.6 38Folacin,mcg 216.0 129.1 60 138.5 64Calcium,mg 1189 744.4 63 680.9 57Phosphorus,mg 2406 1256.0 52 1332.6 55Magnesium,mg 586 314.7 54 353.4 60Iron,mg 16.6 9.6 58 10.4 63Zinc,mg 11.4 7.6 67 8.2 72Sodium,mg 4547 2871.5 63 2656.8 58Potassium,mg 4554 2463.7 54 2619.0 58
NOTE: Based on consumption of RCW. Does not include nutrientsfrom extra food.
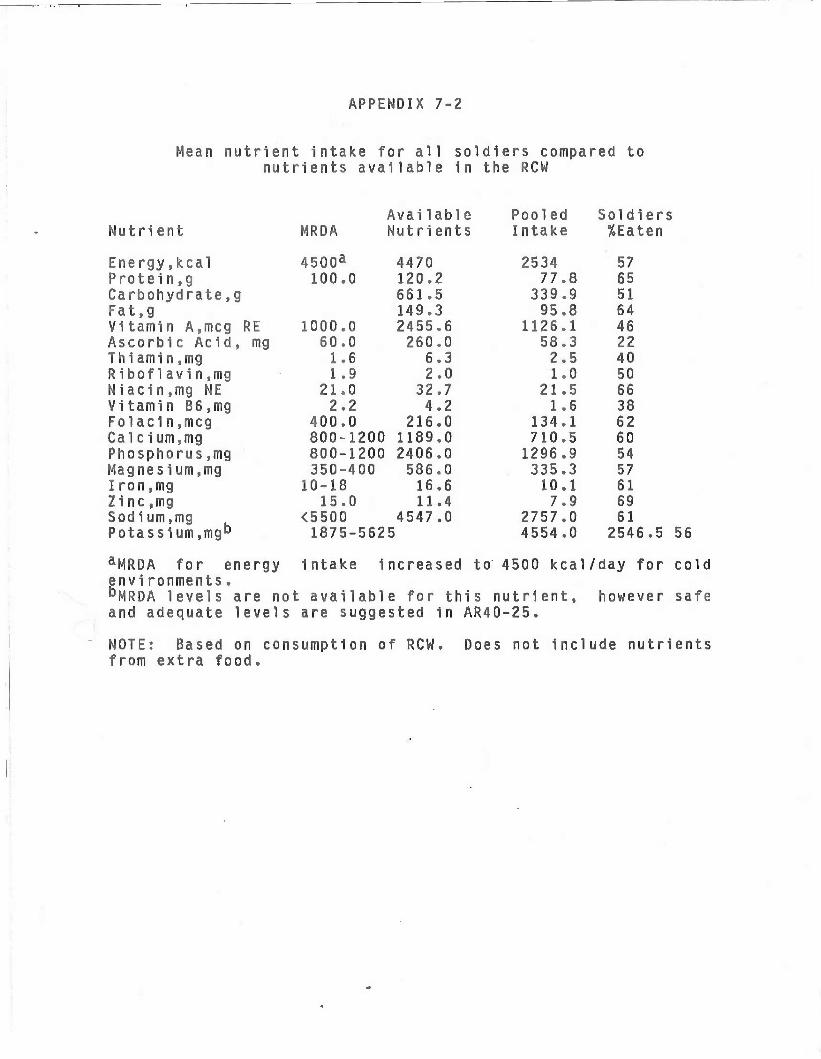
APPENDIX 7-2
Mean nutrient intake for all soldiers compared to nutrients available in the RCW
Nutrient
Energy,kcal Protein ,g Carbohydrate, g Fat.g Vitamin A,meg Ascorbic Acid, Thi amin.mg Ri bof1avi n,mg Niacin.mg NE Vitamin B6,mg Folaci n,mcg Ca1cium9mg Phosphorus,mg Magnesium,mg Iron,mg Zi nc,mg Sodi um,mg Potassium,mgD
RE mg
MR DA
4500a
100.0
1000.0 60.0 1.6 1.9
21.0 2.2
400.0 800-12 800-12 350-40
10-18 15»0
< 5 5 0 0 1875-5
00 00 0
Aval 1 ab 1e Nutrients
447 0 120.2 661.5 149.3 24 55 „6 260.0
6.3 2.0
32.7 4.2
216.0 1189.0 2406.0 586.0 16.6 11.4
4547.0 625
Pooled Intake
2534 77.8
339,9 95.8
1126.1 58.3 2.5 1.0
21.5 1.6
134.1 710.5 1296.9 335.3 10 A 7.9
2757.0 4554.0
Soldiers %Eaten
57 65 51 64 46 22 40 50 66 38 62 60 54 57 61 69 61
2546.5 56
aMRDA for energy intake Increased to' 4500 kcal/day for cold envi ronments„ bMRDA levels are not available for this nutrient, however safe and adequate levels are suggested in AR40-25.
i
NOTE: Based on consumption of RCW. Does not include nutrients from extra food.
APPENDIX 8
Percent Consumption of RCW Components

PERCENT CONSUMPTION OF RCW BY ALL SOLDIERS
n PORTION INTAKE ISSUED %CONSUMEDSIZE (g) (g) (g)
Cider 48 50 2600 12000 21.7
Or Bev Bar 68 60 3668.4 14400 25.5
Cocoa 54 86 3719.5 20640 18.0
Tea 48 28 2362.64 6720 35.2
Coffee 7 3 48 720 6.7
Cream 4 4 16 960 1.7
Sugar 11 6 72 1440 5.0
Entrees 184 120 20145.6 28800 70.0
Oatmeal 155 125 18578.75 30000 61.9
Raisin Nut 194 112 19964 26880 74.3
Granola Bar 154 86 12341 20640 59.8
Oatmeal Bar 150 100 14225 24000 59.3
Bluebly Bar 93 60 5782.2 14400 40.2
Brn/Cooky 205 46.5 10063.5 11160 90.2
Toffee 145 56 9604 13440 71.5
Fig Bar 101 58 6148 13920 44.2
Fruit Soup 51 50 2425 12000 20.2
Chix Soup 45 18 922.5 4320 21.4
Gum 1 1.7 1.7 408 0.4
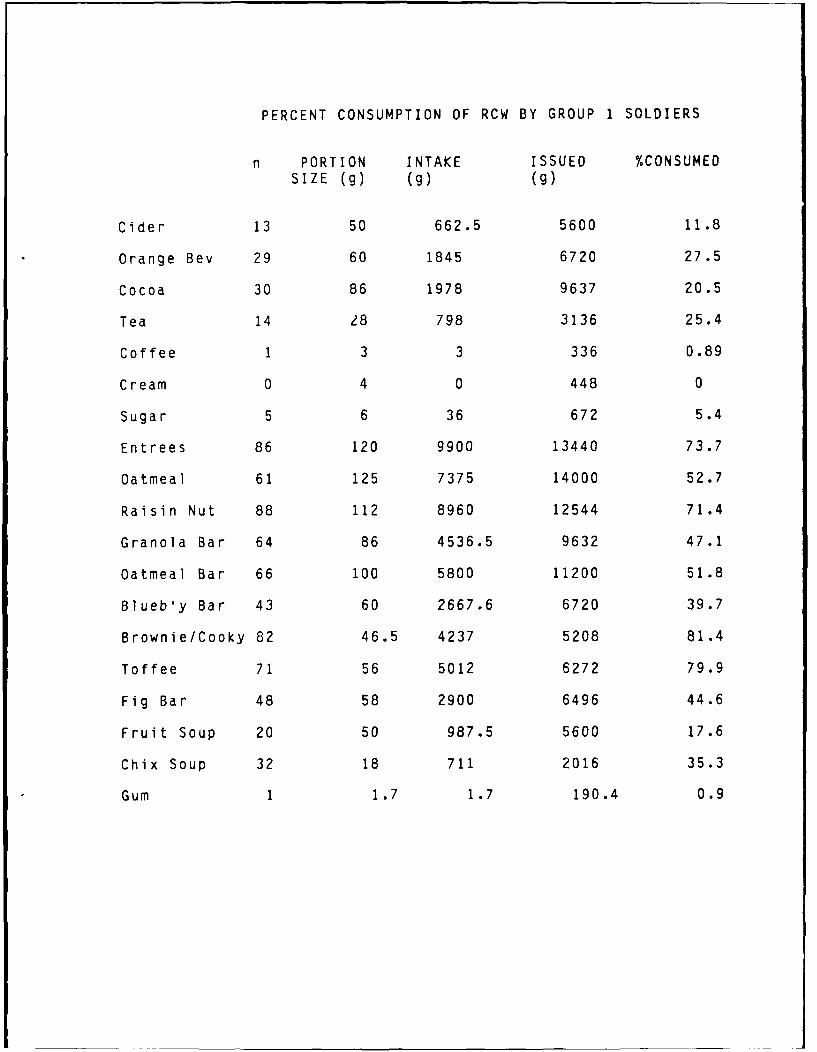
PERCENT CONSUMPTION OF RCW BY GROUP 1 SOLDIERS
n PORTION INTAKE ISSUED %CONSUMEDSIZE (g) (g) (g)
Cider 13 50 662.5 5600 11.8
Orange Bev 29 60 1845 6720 27.5
Cocoa 30 86 1978 9637 20.5
Tea 14 28 798 3136 25.4
Coffee 1 3 3 336 0.89
Cream 0 4 0 448 0
Sugar 5 6 36 672 5.4
Entrees 86 120 9900 13440 73.7
Oatmeal 61 125 7375 14000 52.7
Raisin Nut 88 112 8960 12544 71.4
Granola Bar 64 86 4536.5 9632 47.1
Oatmeal Bar 66 100 5800 11200 51.8
Blueb'y Bar 43 60 2667.6 6720 39.7
Brownie/Cooky 82 46.5 4237 5208 81.4
Toffee 71 56 5012 6272 79.9
Fig Bar 48 58 2900 6496 44.6
Fruit Soup 20 50 987.5 5600 17.6
Chix Soup 32 18 711 2016 35.3
Gum 1 1.7 1.7 190.4 0.9

PERCENT CONSUMPTION OF RCW BY GROUP 2 SOLDIERS
n PORTION INTAKE ISSUED %CONSUMEDSIZE (g) (g) (g)
Cider 35 50 1937.5 6400 30.3
Orange Bev 39 60 1823.4 7680 23.7
Cocoa 24 86 1741.5 11008 15.8
Tea 34 28 1564.64 3584 43.7
Coffee 6 3 45 336 13.4Cream 4 4 16 512 3.1
Sugar 6 6 36 768 4.7
Entrees 98 120 10245.6 15360 66.7
Oatmeal 94 125 11203.75 16000 70.0
Raisin Nut 106 112 11004 14336 76.8
Granola Bar 90 86 7804.5 11008 70.9
Oatmeal Bar 84 100 8425 12800 65.8
Blueb'y Bar 50 60 3114.6 7680 40.6
Brownie/Cooky 123 46.5 5826.5 5952 97.9
Toffee 74 56 4592.0 7168 64.1
Fig Bar 53 58 3248 7424 43.8
Fruit Soup 31 50 1437.5 6400 22.5
Chix Soup 13 18 211.5 2304 9.2
Gum 0 1.7 0 217.6 0.

DAILY RCW INTAKE (POOLED DATA)
GROUP 1 GROUP 2NAME DAY N INTAKE N INTAKE
(g) (g)
Cider1 1 50 4 2002 5 212.5 4 2003 2 100 6 3004 2 100 6 3755 1 50 4 2006 1 50 4 2007 1 100 3 162.58 0 0 4 300
Orange Beverage
1 2 75 9 293.42 6 345 8 3003 5 210 6 4204 3 195 5 2705 3 300 2 1206 3 240 1 307 3 180 6 2708 4 300 2 120
Cocoa
1 1 43 3 107.52 5 387 5 3443 2 86 3 1724 7 559 4 3015 3 129 2 1726 3 172 2 1297 4 172 1 868 5 430 4 430
Tea
1 1 14 4 1192 2 140 6 283.63 0 0 4 1544 4 252 4 1965 2 112 5 1966 2 56 3 1407 1 56 4 2248 2 168 4 252
Coffee1 0 0 0 02 0 0 0 03 0 0 0 04 0 0 1 35 0 0 1 66 0 0 2 97 0 0 1 128 1 3 1 15
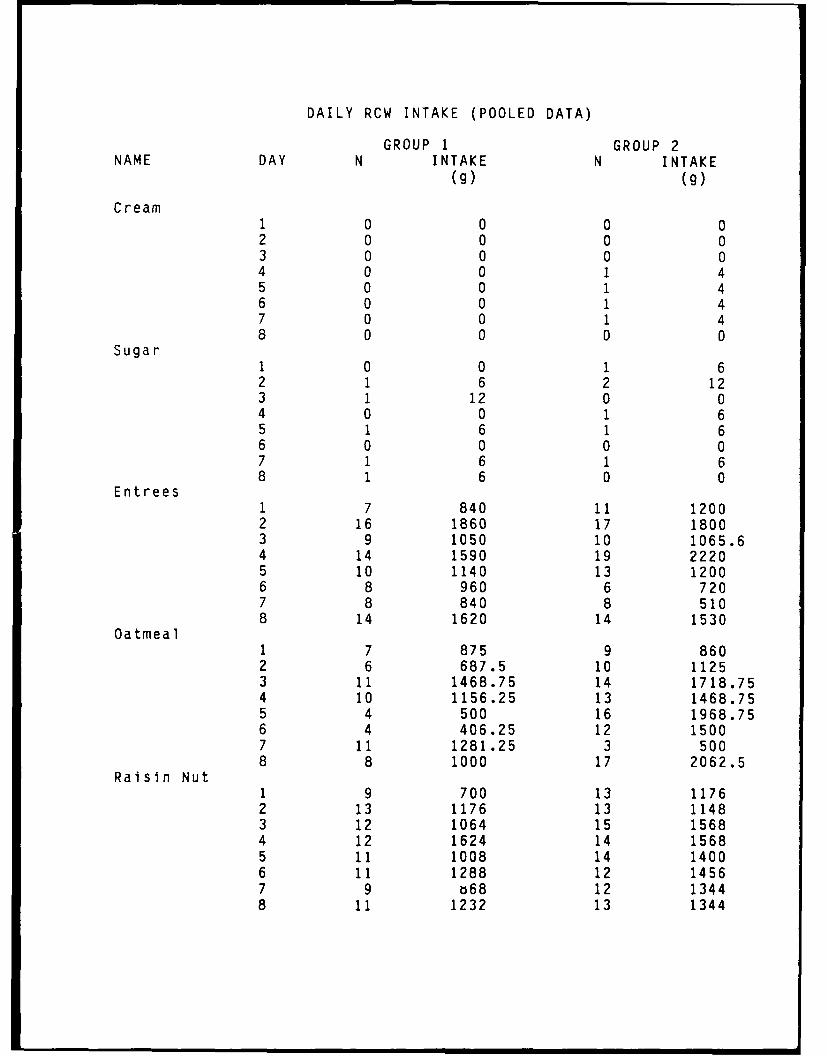
DAILY RCW INTAKE (POOLED DATA)
GROUP I GROUP 2NAME DAY N INTAKE N INTAKE
(g) (g)
Cream1 0 0 0 02 0 0 0 03 0 0 0 04 0 0 1 45 0 0 1 46 0 0 1 47 0 0 1 48 0 0 0 0
Sugar1 0 0 1 62 1 6 2 123 1 12 0 04 0 0 1 65 1 6 1 66 0 0 0 07 1 6 1 68 1 6 0 0
Entrees1 7 840 11 12002 16 1860 17 18003 9 1050 10 1065.64 14 1590 19 22205 10 1140 13 12006 8 960 6 7207 8 840 8 5108 14 1620 14 1530
Oatmeal1 7 875 9 8602 6 687.5 10 11253 11 1468.75 14 1718.754 10 1156.25 13 1468.755 4 500 16 1968.756 4 406.25 12 15007 11 1281.25 3 5008 8 1000 17 2062.5
Raisin Nut1 9 700 13 11762 13 1176 13 11483 12 1064 15 15684 12 1624 14 15685 11 1008 14 14006 11 1288 12 14567 9 o68 12 13448 11 1232 13 1344
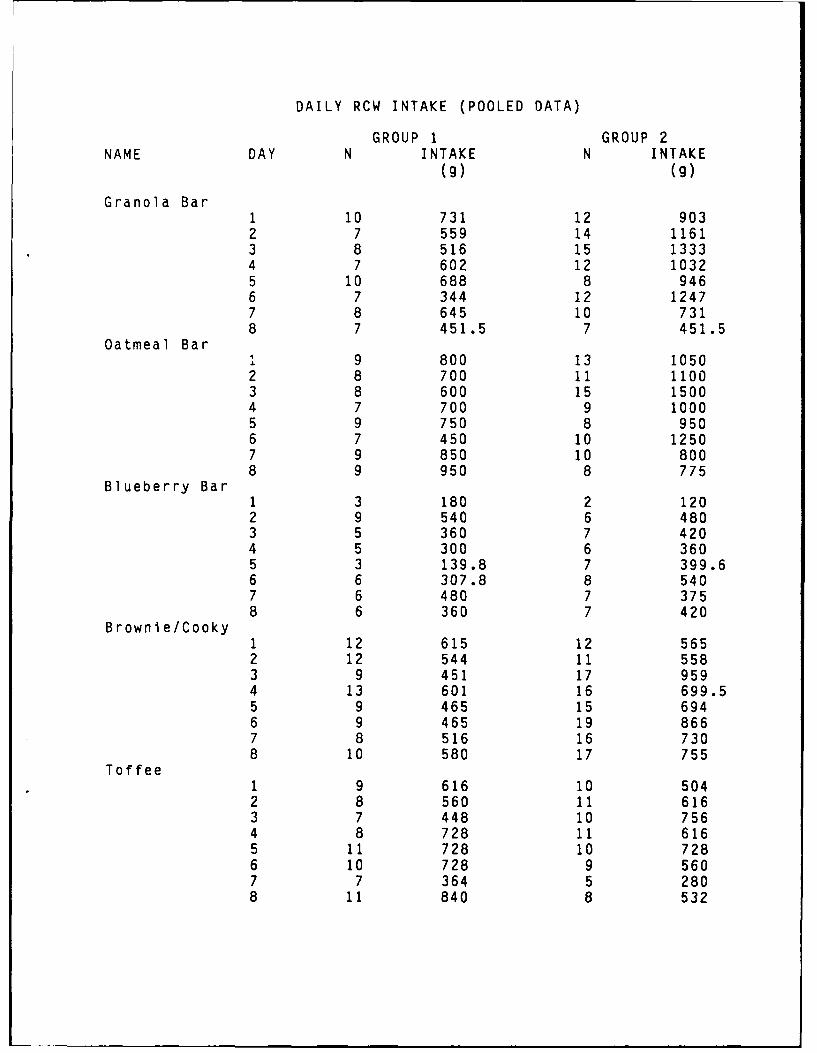
DAILY RCW INTAKE (POOLED DATA)
GROUP 1 GROUP 2NAME DAY N INTAKE N INTAKE
(g) (g)
Granola Bar1 10 731 12 9032 7 559 14 11613 8 516 15 13334 7 602 12 10325 10 688 8 9466 7 344 12 12477 8 645 10 7318 7 451.5 7 451.5
Oatmeal Bar9 800 13 1050
2 8 700 11 11003 8 600 15 15004 7 700 9 10005 9 750 8 9506 7 450 10 12507 9 850 10 8008 9 950 8 775
Blueberry Bar1 3 180 2 1202 9 540 6 4803 5 360 7 4204 5 300 6 3605 3 139.8 7 399.66 6 307.8 8 5407 6 480 7 3758 6 360 7 420
Brownie/Cooky1 12 615 12 5652 12 544 11 5583 9 451 17 9594 13 601 16 699.55 9 465 15 6946 9 465 19 8667 8 516 16 7308 10 580 17 755
Toffee1 9 616 10 5042 8 560 11 6163 7 448 10 7564 8 728 11 6165 11 728 10 7286 10 728 9 5607 7 364 5 2808 11 840 8 532
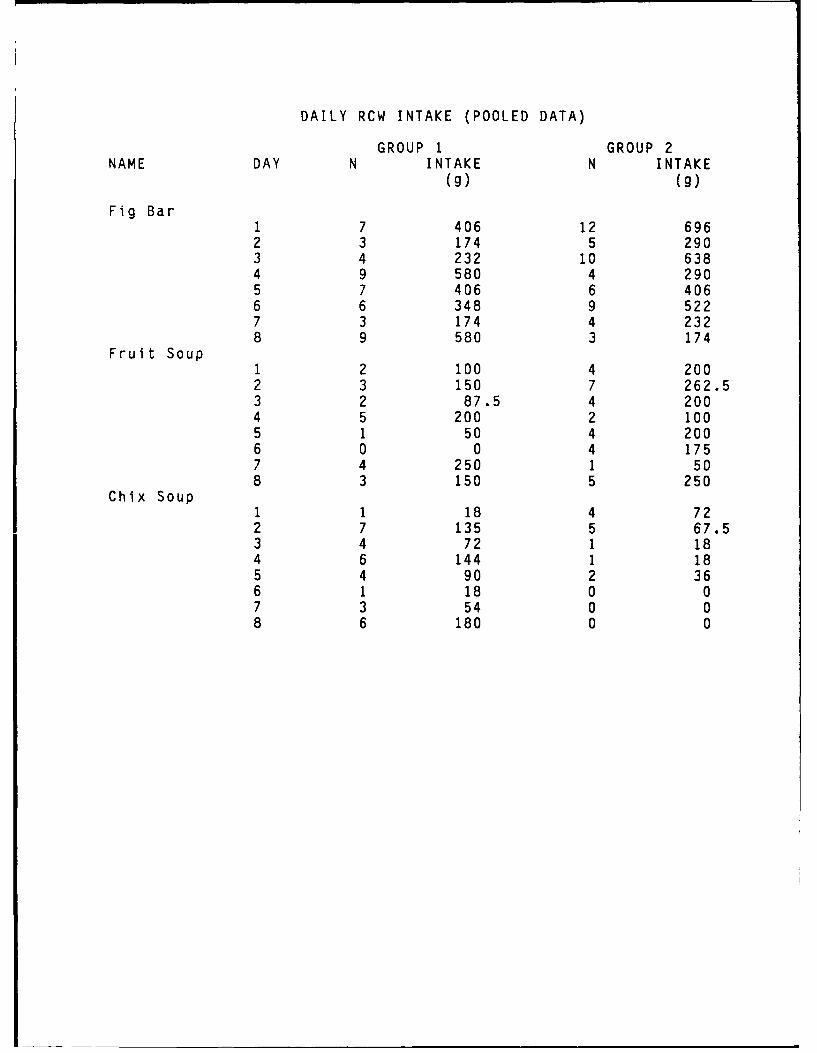
DAILY RCW INTAKE (POOLED DATA)
GROUP 1 GROUP 2NAME DAY N INTAKE N INTAKE
(g) (g)
Fig Bar1 7 406 12 6962 3 174 5 2903 4 232 10 6384 9 580 4 2905 7 406 6 4066 6 348 9 5227 3 174 4 2328 9 580 3 174
Fruit Soup1 2 100 4 2002 3 150 7 262.53 2 87.5 4 2004 5 200 2 1005 1 50 4 2006 0 0 4 1757 4 250 1 508 3 150 5 250
Chix Soup1 1 18 4 722 7 135 5 67.53 4 72 1 184 6 144 1 185 4 90 2 366 1 18 0 07 3 54 0 08 6 180 0 0

DAILY RCW TNTArF BY INDIVIDUAL COMPONENTS
GROUP 1 GROUP 2
NAME DAY N INTAKE N INTAKE(g) (g)
Cider1 1 50 4 2002 5 212.5 4 2003 2 100 6 3004 2 100 6 3755 1 50 4 2006 1 50 4 2007 1 100 3 162.58 0 0 4 300
Orange Beverage1 2 75 9 293.42 6 345 8 3003 5 210 6 4204 3 195 5 2705 3 300 2 1206 3 240 1 307 3 180 6 2708 4 300 2 120
Cocoa1 1 43 3 107.52 5 387 5 3443 2 86 3 1724 7 559 4 3015 3 129 2 1726 3 172 2 1297 4 172 1 868 5 430 4 430
Tea1 1 14 4 1192 2 140 6 283.63 0 0 4 1544 4 252 4 1965 2 112 5 1966 2 56 3 1407 1 56 4 2248 2 168 4 252
Coffee1 0 0 0 02 0 0 0 03 0 0 0 04 0 0 1 35 0 0 1 66 0 0 2 97 0 0 1 12
8 1 3 1 15
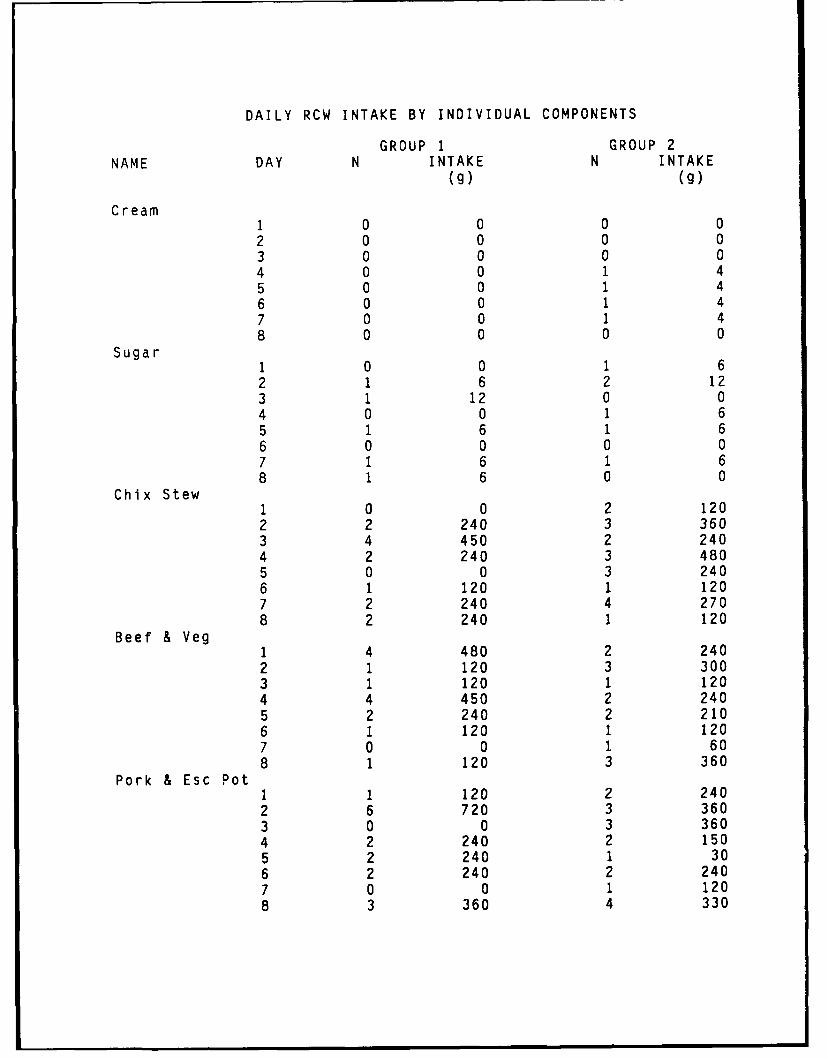
DAILY RCW INTAKE BY INDIVIDUAL COMPONENTS
GROUP 1 GROUP 2NAME DAY N INTAKE N INTAKE
(g) (g)
Cream1 0 0 0 02 0 0 0 03 0 0 0 0
4 0 0 1 45 0 0 1 46 0 0 1 47 0 0 1 48 0 0 0 0
Sugar1 0 0 1 62 1 6 2 123 1 12 0 04 0 0 1 65 1 6 1 66 0 0 0 07 1 6 1 68 1 6 0 0
Chix Stew1 0 0 2 1202 2 240 3 3603 4 450 2 2404 2 240 3 4805 0 0 3 2406 1 120 1 1207 2 240 4 2708 2 240 1 120
Beef & Veg1 4 480 2 2402 1 120 3 3003 1 120 1 1204 4 450 2 2405 2 240 2 2106 1 120 1 1207 0 0 1 608 1 120 3 360
Pork & Esc Pot1 1 120 2 2402 6 720 3 3603 0 0 3 3604 2 240 2 1505 2 240 1 306 2 240 2 2407 0 0 1 1208 3 360 4 330
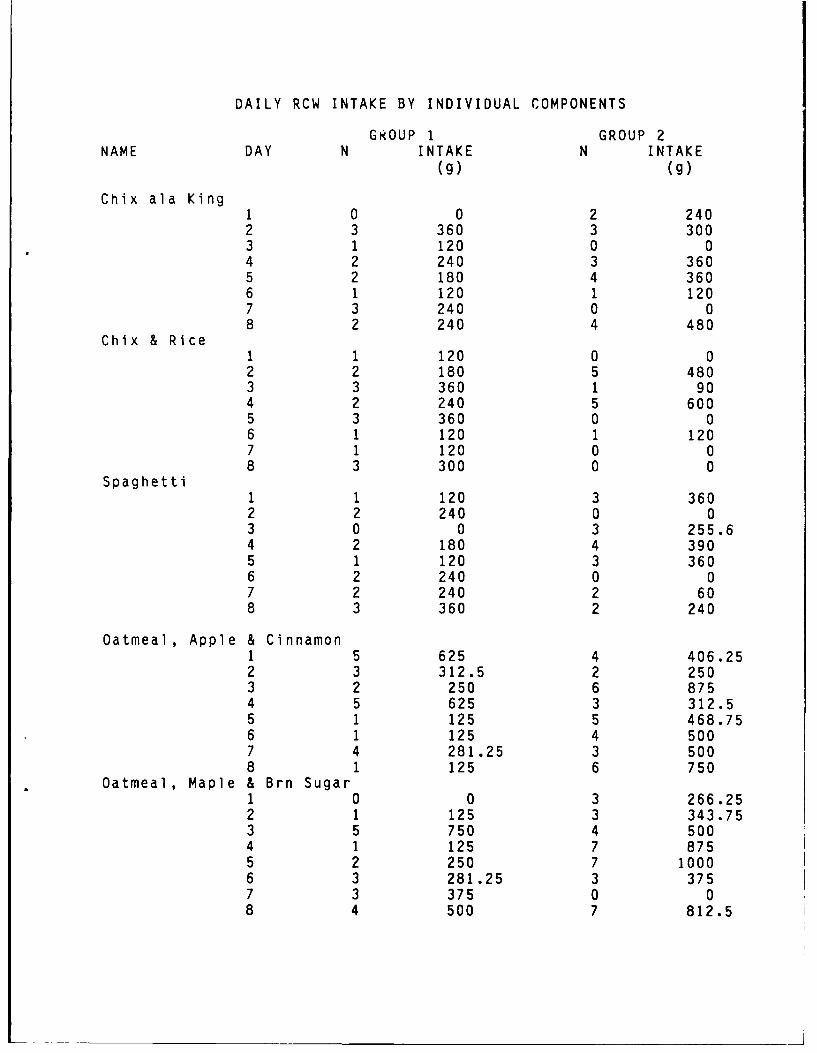
DAILY RCW INTAKE BY INDIVIDUAL COMPONENTS
GkOUP 1 GROUP 2NAME DAY N INTAKE N INTAKE
(g) (g)
Chix ala King1 0 0 2 2402 3 360 3 3003 1 120 0 04 2 240 3 3605 2 180 4 3606 1 120 1 1207 3 240 0 08 2 240 4 480
Chix & Rice1 1 120 0 02 2 180 5 4803 3 360 1 904 2 240 5 6005 3 360 0 06 1 120 1 1207 1 120 0 08 3 300 0 0
Spaghetti1 1 120 3 3602 2 240 0 03 0 0 3 255.64 2 180 4 3905 1 120 3 3606 2 240 0 07 2 240 2 608 3 360 2 240
Oatmeal, Apple & Cinnamon1 5 625 4 406.252 3 312.5 2 2503 2 250 6 8754 5 625 3 312.55 1 125 5 468.756 1 125 4 5007 4 281.25 3 5008 1 125 6 750
Oatmeal, Maple & Brn Sugar1 0 0 3 266.252 1 125 3 343.753 5 750 4 5004 1 125 7 8755 2 250 7 10006 3 281.25 3 3757 3 375 0 08 4 500 7 812.5

DAILY RCW INTAKE BY INDIVIDUAL COMPONENTS
GROUP 1 GROUP 2NAME DAY N INTAKE N INTAKE
(g) (g)
Oatmeal, Strawberry1 2 250 2 187.52 2 250 5 531.253 4 468.75 4 343.754 4 406.25 3 281.255 1 125 4 5006 0 0 5 6257 4 625 0 08 3 375 4 500
Raisin Nut1 9 700 13 11762 13 1176 13 11483 12 1064 15 15684 12 1624 14 15685 11 1008 14 14006 11 1288 12 14567 9 868 12 13448 11 1232 13 1344
Granola Bar1 10 731 12 9032 7 559 14 11613 8 516 15 13334 7 602 12 10325 10 688 8 9466 7 344 12 12477 8 645 10 7318 7 451.5 7 451.5
Oatmeal Bar1 9 800 13 10502 8 700 11 11003 8 600 15 15004 7 700 9 10005 9 750 8 9506 7 450 10 12507 9 850 10 8008 9 950 8 775
Blueberry Bar1 3 180 2 1202 9 540 6 4803 5 360 7 4204 5 300 6 3605 3 139.8 7 399.66 6 307.8 8 5407 6 480 7 3758 6 360 7 420
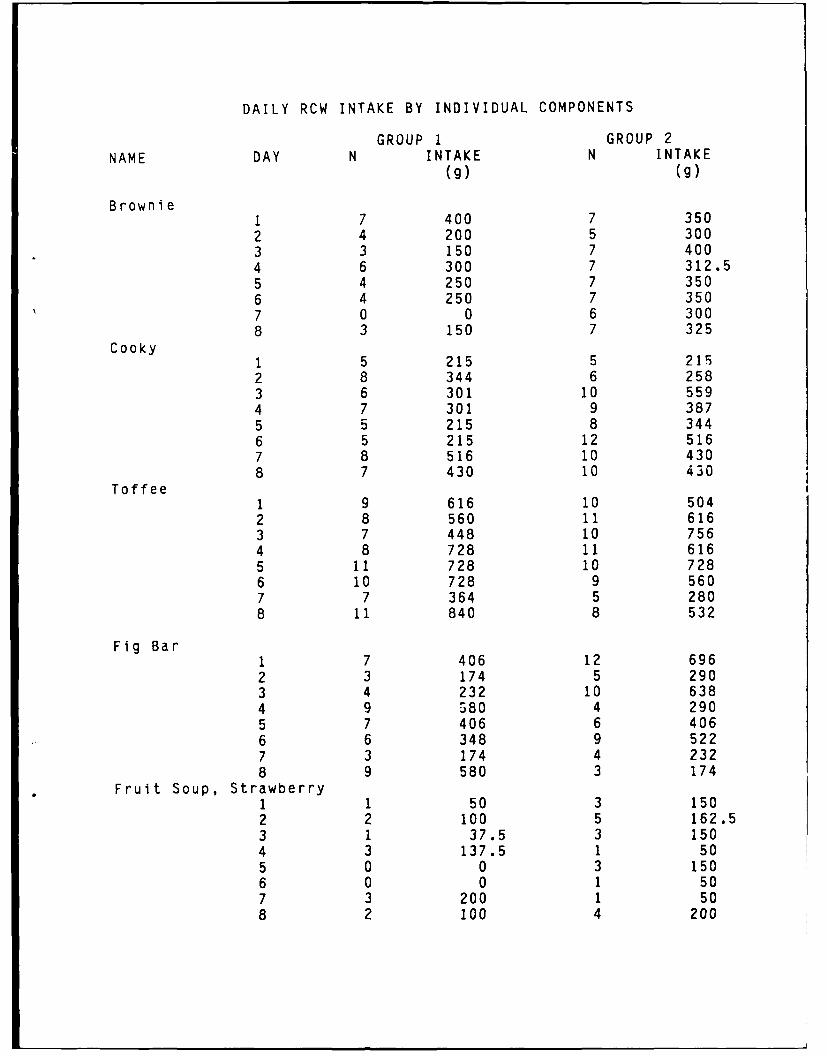
DAILY RCW INTAKE BY INDIVIDUAL COMPONENTS
GROUP I GROUP 2
NAME DAY N INTAKE N INTAKE(g) (g)
Brownie1 7 400 7 3502 4 200 5 3003 3 150 7 4004 6 300 7 312.55 4 250 7 3506 4 250 7 3507 0 0 6 3008 3 150 7 325
Cooky1 5 215 5 2152 8 344 6 2583 6 301 10 5594 7 301 9 3875 5 215 8 3446 5 215 12 5167 8 516 10 4308 7 430 10 430
Toffee1 9 616 10 5042 8 560 11 6163 7 448 10 7564 8 728 11 616
5 11 728 10 7286 10 728 9 5607 7 364 5 2808 11 840 8 532
Fig Bar1 7 406 12 6962 3 174 5 2903 4 232 10 6384 9 580 4 2905 7 406 6 4066 6 348 9 5227 3 174 4 2328 9 580 3 174
Fruit Soup, Strawberry1 1 50 3 1502 2 100 5 162.53 1 37.5 3 150
4 3 137.5 1 505 0 0 3 1506 0 0 1 507 3 200 1 508 2 100 4 200
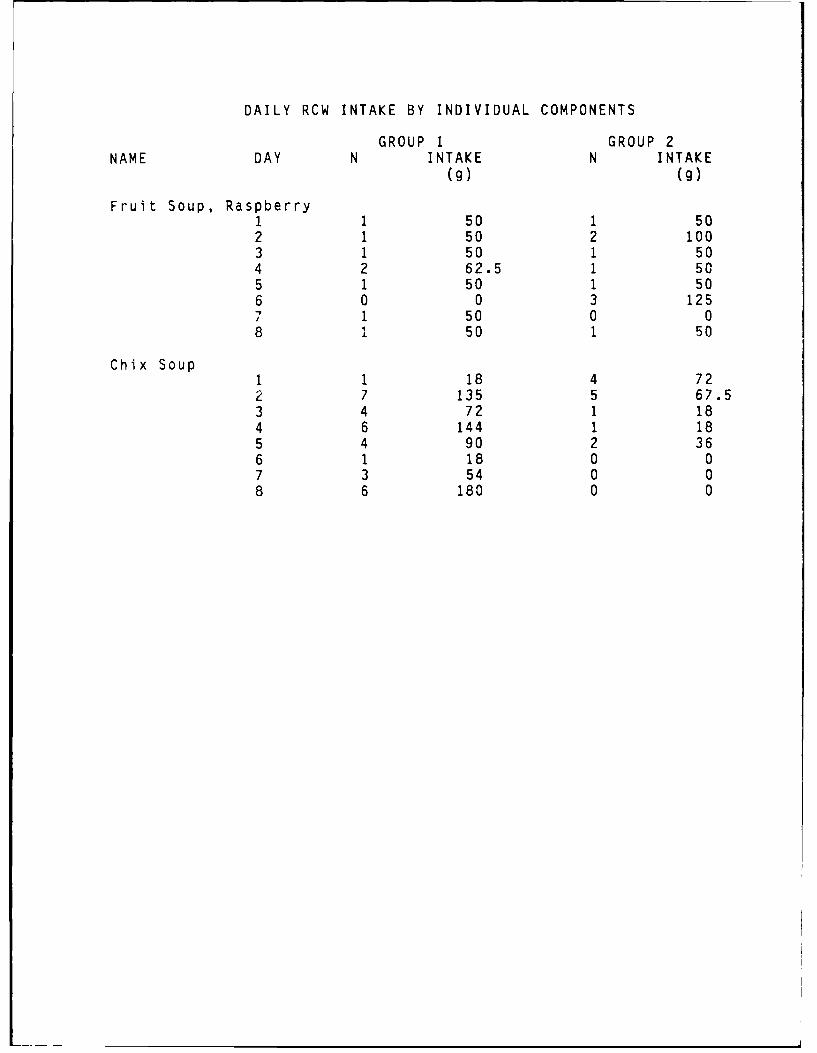
DAILY RCW INTAKE BY INDIVIDUAL COMPONENTS
GROUP 1 GROUP 2NAME DAY N INTAKE N INTAKE
(g) (g)
Fruit Soup, Raspberry1 1 50 1 502 1 50 2 1003 1 50 1 504 2 62.5 1 505 1 50 1 506 0 0 3 1257 1 50 0 08 1 50 1 50
Chix Soup1 1 18 4 722 7 135 5 67.53 4 72 1 184 6 144 1 185 4 90 2 366 1 18 0 07 3 54 0 08 6 180 0 0
DISTRIBUTION LIST
NO. OF COPIES
Defense Technical Information CenterATTN; DTIC-DDA 12Alexandria, VA 22304-61554
CommanderUS Army Medical Research and Development CommandSGRD-RMS 1SGRD-PLC 1Fort DetrickFredick, MD 21701-5012
CommardantAcademy of Health Sciences, US ArmyATTN: AHS-CDM 1ATTN: HSHA-CDM 1ATTN: HSHA-CDS 1Fort Sam Houston, TX 78234
Dir of Biol & Med Sciences Division 1Office of Naval Research800 N. Quincy StreetArlington, VA 22217
CO, Naval Medical R&D Command 1National Naval Medical CenterBethesda, MD 20014
HQ AFMSC/SGPA 1Brooks AFB, TX 78235
Under Secretary of Defense Research and Engineering 1ATTN: OUSDRE(RAT)E&LSWashington, D.C. 20310
Dean 1School of Medicine Uniformed ServicesUniversity of Health Sciences4301 Jones Bridge RoadBethesda, MD 20014
Assistant Secretary of Defense (Health Affairs) 1ATTN: ASD(HA) PA&QAWashington, DC 20310
Commander 1US Army Operational Test Evaluation AgencyATTN: CSTE-ZX500 Columbia PikeFalls Church, VA 22041
DISTRIBUTION LIST (CONTINUED)
NO. OF COPIES
Commander 1Us Army Training and Doctrine CommandATTN: ATCD-SFort Monroe, VA 23651
CommanderUS Army Material CommandATTN: AMCDE-SAlexandria, VA 22333
HQDA OTSGATTN: DASG-DBDRm. 617, Bldg 5 Skyline PlaceFalls Church, VA 22041-3258
HQDAATTN: DASG-RDZWashington, DC 20310-2300
HQDA DCSLOGATTN: DALO-TSTWashington, DC 20310-2300
CommanderUS Army Natick Research, Development andEngineering CenterATTN: STRNC-W 1ATTN: STRNC-Y 1ATTN: STRNC-T 1ATTN: STRNC-E 1ATTN: STRNC-TAA 1Natick, MA 01760-5000
CommandantUS Army Quartermaster SchoolATTN: ATSM-CDT 1ATTN: ATSM-SFS-FM 1Fort Lee. VA 23801
CommandantUS Army Troop Support AgencyATTN: DALO-TAF IATTN: DALO-TAF-F 1Ft Lee, VA 23801
DISTRIBUTION LIST (CONTINUED)
NO. OF COPIES
HQ US Marine Corps 1Code LSF-4Washington, DC 20380-0001
Dept of Clinical Investigation 1Chief, Army Medical Specialist Corp-CISWRAMCWashington, DC 20307-5001
USDA, ARS Human Nutrition Research CenterAttn: Dr. Henry LukaskiP.O. Box 7166 University Station2420 2nd Ave. NorthGrand Forks, ND 58202-7166
HQ, V CorpsACofs, GIATTN: AETV-GAD,Lynne Man, RD, MPHAPO NY 09079
Health/Fitness NutritionistATTN: Dr. Bernadette Feist-FiteNDH-A-EDFort McNair, DC 20319-6000
Commander 26th Infantry Division (Light)Ft. Richardson, AK 99505
Commander 1U.S. Army Soldier Support CenterFt. Benjamin Harrison, IN 46216
Assistant Secretary of Defense (Aquisition & Logistics)ATTN: OASD (A&L) SD 1Washington, DC 20310
Commander 1U.S. Army Troop Support CommandATTN: AMSTR-E4300 Goodfellow BoulevardSt. Louis, MO 63120-1798
MAJ Robert Stretch 1DCIEM1133 Shepard Ave. WestP.O. Box 2000Downsview, Ontario, Canada M3M 3B9

DISTRIBUTION LIST (continued)
NO. OF COPIES
Commander 1Troop Support AgencyDFS-DPD (ATTN: J. Lawrence)Bldg 12400Fort Lee, VA 23801-6020