ENVIRONMENTAL IMPACTS OF ONE POT METHAMPHETAMINE ...
148
ENVIRONMENTAL IMPACTS OF ONE POT METHAMPHETAMINE CLANDESTINE LABORATORIES – CHARACTERIZATION AND DETECTION OF TRACE MATERIALS By MATTHEW KEVIN GREEN Bachelor Science in Forensic Biology Ohio Northern University Ada, Ohio 2012 Master of Science in Forensic Science Oklahoma State University Tulsa, Oklahoma 2014 Submitted to the Faculty of the Graduate College of the Oklahoma State University in partial fulfillment of the requirements for the Degree of DOCTOR OF PHILOSOPHY May, 2017 brought to you by CORE View metadata, citation and similar papers at core.ac.uk provided by SHAREOK repository
Transcript of ENVIRONMENTAL IMPACTS OF ONE POT METHAMPHETAMINE ...

ENVIRONMENTAL IMPACTS OF ONE POT
METHAMPHETAMINE CLANDESTINE
LABORATORIES – CHARACTERIZATION AND
DETECTION OF TRACE MATERIALS
By
MATTHEW KEVIN GREEN
Bachelor Science in Forensic Biology
Ohio Northern University
Ada, Ohio
2012
Master of Science in Forensic Science
Oklahoma State University
Tulsa, Oklahoma
2014
Submitted to the Faculty of the
Graduate College of the
Oklahoma State University
in partial fulfillment of
the requirements for
the Degree of
DOCTOR OF PHILOSOPHY
May, 2017
brought to you by COREView metadata, citation and similar papers at core.ac.uk
provided by SHAREOK repository
ii
ENVIRONMENTAL IMPACTS OF ONE POT
METHAMPHETAMINE CLANDESTINE
LABORATORIES – CHARACTERIZATION AND
DETECTION OF TRACE MATERIALS
Dissertation Approved:
Jarrad R. Wagner, Ph.D., F-ABFT
Dissertation Advisor
Lara K. Maxwell, DVM, Ph.D., DACVCP
David R. Wallace, Ph.D.
Mark E. Payton, Ph.D.
.

iii Acknowledgements reflect the views of the author and are not endorsed by committee
members or Oklahoma State University.
ACKNOWLEDGEMENTS
Any individual mentioned in this section deserves the utmost praise for continued
support throughout this research project. First, I would like to thank my dissertation
advisor, Dr. Jarrad Wagner, for giving me the opportunity and resources to complete this
doctoral program. Next, I would like to thank the Center for Veterinary Health Sciences,
and particularly my dissertation chair, Dr. Lara Maxwell, for providing a model and
pathway for success. The academic opportunities both on campus and remotely were
greatly appreciated. I would also like to thank the other committee members, Drs. David
Wallace and Mark Payton, for sharing their enthusiasm and knowledge within the
classroom and in collaborative efforts towards my research. I, both personally and
professionally, have greatly benefited from the leadership and outstanding guidance from
these graduate committee members.
Recognition must be given to Savannah River National Laboratory, in
conjunction with the National Institute of Justice, specifically David Pretorius and Dr.
Frances Scott. Without the financial support through a grant-funded contract, my
research and any continuing investigation would not have been possible. I would also
like to thank the School of Forensic Sciences at Oklahoma State University, particularly
the Forensic Toxicology and Trace Laboratory, for providing a platform and all necessary
equipment to perform the research projects. An additional sign of gratefulness must be
given to Austin Ciesielski, who provided continual outstanding effort towards the goals
of this research.
And lastly, for all of the individuals that helped paved who I am today, shared
encouraging or consoling words, and/or simply smiled back, I would like to share my
thanks and gratitude. Without your presence, either physical or figurative, any and all
achievements have no value. Thank you for providing reason and giving me purpose.

iv
Name: MATTHEW KEVIN GREEN
Date of Degree: MAY, 2017
Title of Study: ENVIRONMENTAL IMPACTS OF ONE POT METHAMPHETAMINE
CLANDESTINE LABORATORIES – CHARACTERIZATION AND
DETECTION OF TRACE MATERIALS
Major Field: VETERINARY BIOMEDICAL SCIENCES
Abstract: The One Pot methamphetamine production method has become the primary
method of choice in clandestine drug laboratories across the United States, due to its
simplicity and the availability of required materials. While the method is simple, it also
generates risk to innocent bystanders within the community from flammability and
toxicity hazards. Previous studies have determined the adverse effects of
methamphetamine consumption, but there has been little research exploring the health
impact of being in close proximity to methamphetamine manufacturing. Despite
investigative efforts, clandestine laboratories may not be discovered for an extended
period of time, after which, numerous methamphetamine productions will have been
completed. As a result, the probability of exposure to toxic substances involved with the
One Pot method increase significantly. This study was undertaken to determine and
quantify the characteristic products and byproducts of the One Pot methamphetamine
method. In addition, studies were conducted to determine the feasibility of detection of
methamphetamine clandestine laboratories through monitoring waste water effluents.
Methamphetamine was produced by the One Pot method and the methamphetamine
hydrochloride product was filtered out. All post-reaction liquids and solids were
characterized. In collaboration with local authorities, simulated One Pot
methamphetamine waste disposal was performed using a representative lift station.
Waste water samples were collected post-distribution to determine a time course
detection window and analyzed via solid phase extraction with liquid chromatography-
tandem mass spectrometry. Methamphetamine, pseudoephedrine, and ephedrine were all
detectable in the waste water. Also, an over-reduced product, characteristic of the One
Pot synthesis, CMP [1-(1',4'-cyclohexadienyl)-2-methyl-aminopropane] was detected.
As a means to determine the value of CMP as a unique identifier, urine samples that
previously tested positive for methamphetamine were analyzed, and only one sample
demonstrated positive results for the primary One Pot byproduct. This work identifies
the components produced following One Pot methamphetamine production.
Additionally, results demonstrate the possibility and potential for analyzing waste water
to monitor and detect clandestine One Pot methamphetamine laboratories within
communities.

v
TABLE OF CONTENTS
CHAPTER I ........................................................................................................................ 1
INTRODUCTION .............................................................................................................. 1
CHAPTER II ....................................................................................................................... 9
ONE POT METHAMPHETAMINE CHARACTERIZATION ........................................ 9
2.1 Introduction ............................................................................................................................ 9
2.2 Review of the Literature ....................................................................................................... 12
2.3 Methodology ......................................................................................................................... 25
2.4 Findings ................................................................................................................................ 33
2.5 Discussion ............................................................................................................................. 38
CHAPTER III ................................................................................................................... 42
ONE POT WASTE DEPOSIT SIMULATION – SEWAGE EFFLUENT ANALYSIS . 42
3.1 Introduction .......................................................................................................................... 42
3.2 Review of the Literature ....................................................................................................... 45
3.3 Methodology ......................................................................................................................... 56
3.4 Findings ................................................................................................................................ 72
3.5 Discussion ........................................................................................................................... 107
CHAPTER IV ................................................................................................................. 112
CMP DETECTION IN URINE SAMPLES ................................................................... 112
4.1 Introduction ........................................................................................................................ 112
4.2 Review of the Literature ..................................................................................................... 115
4.3 Methodology ....................................................................................................................... 119
4.4 Findings .............................................................................................................................. 123
4.5 Discussion ........................................................................................................................... 127
CHAPTER V .................................................................................................................. 130
CONCLUSION ............................................................................................................... 130
REFERENCES ............................................................................................................... 134

vi
LIST OF TABLES
Table 1. Mass Spectrometry Parameters. ......................................................................... 31 Table 2. LC-MS/MS quantification results for the product salts. .................................... 33 Table 3. Percent of methamphetamine, CMP, pseudoephedrine, and ephedrine found in
each product salt with LC-MS/MS. .................................................................................. 34 Table 4. Statistical Comparison of Ether and Camp Fuel Product Salt Samples. ............ 34 Table 5. LC-MS/MS quantification results for sludge samples. ...................................... 35 Table 6. Percent of methamphetamine, CMP, pseudoephedrine, and ephedrine found in
each sludge sample with LC-MS/MS. .............................................................................. 35 Table 7. Statistical Comparison of Ether and Camp Fuel Sludge Samples. .................... 36 Table 8. LC-MS/MS quantification results for post-salt solvents. ................................... 36 Table 9. Percent of methamphetamine, CMP, pseudoephedrine, and ephedrine found in
each post-salt solvent with LC-MS/MS. ........................................................................... 37 Table 10. Statistical Comparison of Ether and Camp Fuel Post-Salt Solvent Samples. .. 37 Table 11. Sewage Water Sample Collection. ................................................................... 64 Table 12. Solid Phase Extraction Procedure. ................................................................... 65 Table 13. Matrix Effects Study Sample List. ................................................................... 69 Table 14. Weight and volume of sewage water samples prepared for ICPMS analysis. . 70 Table 15. Methamphetamine Linearity ............................................................................ 72 Table 16. Pseudoephedrine Linearity ............................................................................... 73 Table 17. Ephedrine Linearity .......................................................................................... 73 Table 18. Amphetamine Linearity ................................................................................... 74 Table 19. CMP Linearity .................................................................................................. 75 Table 20. Within-Run and Between Run Precision for QC points. ................................. 76 Table 21. Interday and Intraday Precision for QC points. ............................................... 76 Table 22. Within-Laboratory Precision and Accuracy for QC points.............................. 76 Table 23. Matrix Effects, Recovery Efficiency, and Process Efficiency. ........................ 77 Table 24. Matrix Effects, Recovery Efficiency, and Process Efficiency. ........................ 78 Table 25. EE1 Time Course Samples............................................................................... 79 Table 26. EE2 Time Course Samples............................................................................... 80 Table 27. EE3 Time Course Samples............................................................................... 81 Table 28. CE1 Time Course Samples. ............................................................................. 82 Table 29. CE2 Time Course Samples. ............................................................................. 83 Table 30. CE3 Time Course Samples. ............................................................................. 84 Table 31. EE2 Pulse Samples. .......................................................................................... 85 Table 32. EE3 Pulse Samples. .......................................................................................... 86 Table 33. CE2 Pulse Samples. ......................................................................................... 87 Table 34. CE3 Pulse Samples. ......................................................................................... 88 Table 35. Average maximum concentrations (ng/mL) observed for methamphetamine,
CMP, pseudoephedrine, ephedrine, and amphetamine in sewage water samples collected
after diethyl ether and camp fuel One Pot waste deposits. ............................................... 89 Table 36. Statistical Comparison of Ether and Camp Fuel Effluent Samples. ................ 90 Table 37. Lithium Concentration from ICP-MS analysis. ............................................... 91 Table 38. Characterization results from EE4 and CE4 reaction waste samples. ........... 106 Table 39. Mass Spectrometry Parameters. ..................................................................... 122

vii
Table 40. LC-MS/MS results of 47 urine samples that previously tested positive for
methamphetamine. .......................................................................................................... 124

viii
LIST OF FIGURES
Figure 1. Number of Methamphetamine Laboratories Seized from 2010-2015. ............. 10 Figure 2. Diagram of Various Routes to Produce Methamphetamine. ............................ 12 Figure 3. Reaction schematic of the production of CMP. ................................................ 20 Figure 4. Mass Spectra of CMP. ...................................................................................... 21 Figure 5. OSU-FTTL One Pot Reaction Setup. ............................................................... 25 Figure 6. Off-gassing apparatus used during the One Pot methamphetamine syntheses. 27 Figure 7. Product Salt. An example of a product salt sample from a One Pot synthesis. 28 Figure 8. LC-MS/MS Instrumentation Setup at OSU-FTTL. .......................................... 30 Figure 9. Police image of One Pot laboratory within kitchen sink. ................................. 47 Figure 10. Image taken at clandestine methamphetamine laboratory. ............................. 48 Figure 11. Interior view of wet well at low flow lift station. ........................................... 58 Figure 12. Automated waste water sampler placed at ground level beside wet well. ..... 60 Figure 13. Lift station wet well sewage inflow point during dye test. ............................. 61 Figure 14. Collected Waste Water Samples Within Autosampler Rack.......................... 62 Figure 15. Change in methamphetamine concentration (ng/mL) observed in sewage
water samples taken every 15 minutes after ether cook waste deposits. .......................... 93 Figure 16. Change in pseudoephedrine concentration (ng/mL) observed in sewage water
samples taken every 15 minutes after ether cook waste deposits. .................................... 94 Figure 17. Change in ephedrine concentration (ng/mL) observed in sewage water
samples taken every 15 minutes after ether cook waste deposits. .................................... 94 Figure 18. Change in CMP concentration (ng/mL) observed in sewage water samples
taken every 15 minutes after ether cook waste deposits. .................................................. 95 Figure 19. Change in amphetamine concentration (ng/mL) observed in sewage water
samples taken every 15 minutes after ether cook waste deposits. .................................... 96 Figure 20. Change in methamphetamine concentration (ng/mL) observed in sewage
water samples taken every 15 minutes after camp fuel cook waste deposits. .................. 96 Figure 21. Change in pseudoephedrine concentration (ng/mL) observed in sewage water
samples taken every 15 minutes after camp fuel cook waste deposits. ............................ 97 Figure 22. Change in ephedrine concentration (ng/mL) observed in sewage water
samples taken every 15 minutes after camp fuel cook waste deposits. ............................ 98 Figure 23. Change in CMP concentration (ng/mL) observed in sewage water samples
taken every 15 minutes after camp fuel cook waste deposits. .......................................... 98 Figure 24. Change in amphetamine concentration (ng/mL) observed in sewage water
samples taken every 15 minutes after camp fuel cook waste deposits. ............................ 99 Figure 25. Comparison of the concentration of methamphetamine (ng/mL) observed in
sewage water samples every 15 minutes for all One Pot waste deposits........................ 100 Figure 26. Average concentration of methamphetamine (ng/mL) observed every 15
minutes after One Pot waste deposits. ............................................................................ 101 Figure 27. Comparison of the concentration of pseudoephedrine (ng/mL) observed in
sewage water samples collected every 15 minutes for all One Pot waste deposits. ....... 101 Figure 28. Average concentration of pseudoephedrine (ng/mL) observed every 15
minutes after One Pot waste deposits. ............................................................................ 102 Figure 29. Comparison of the concentration of ephedrine (ng/mL) observed in sewage
water samples collected every 15 minutes for all One Pot waste deposits. .................... 103

ix
Figure 30. Average concentration of ephedrine (ng/mL) observed every 15 minutes after
One Pot waste deposits. .................................................................................................. 103 Figure 31. Comparison of the concentration of CMP (ng/mL) observed in sewage water
samples collected every 15 minutes for all One Pot waste deposits. .............................. 104 Figure 32. Average concentration of CMP (ng/mL) observed every 15 minutes after One
Pot waste deposits. .......................................................................................................... 104 Figure 33. Comparison of the concentration of amphetamine (ng/mL) observed in
sewage water samples collected every 15 minutes for all One Pot waste deposits. ....... 105 Figure 34. Average concentration of amphetamine (ng/mL) observed every 15 minutes
after One Pot waste deposits. .......................................................................................... 105 Figure 35. LC-MS/MS Instrument Setup at OSU-FTTL. .............................................. 121

1
CHAPTER I
INTRODUCTION
Methamphetamine, perhaps the most widely known illicit substance, continues to
be a drug of major concern. From its first synthesis in 1893 to becoming a Drug
Enforcement Administration (DEA) Schedule II compound in 1971, methamphetamine
has been used in many applications due to the drug’s stimulant properties. During World
War II, for example, soldiers were administered methamphetamine to reduce fatigue.1 In
addition to nonmedical use, doctors in the United States were prescribing
methamphetamine, and other related amphetamines, to help treat certain conditions like
hyperactivity and obesity, to name a few.2 In fact, one prescribed form of
methamphetamine still exists, that being the brand name Desoxyn. While an argument
can be made for drug administration in the scenarios listed above, the true problem with
methamphetamine arises in the illicit and abusive use of the drug. Around the 1980s, the
illegal use of methamphetamine began to gain popularity.2 From these scenarios, and
with consumption levels well above previously reported therapeutic ranges,
methamphetamine use became a widespread problem.
As mentioned above, methamphetamine is a powerful stimulant. According to
the National Institute on Drug Abuse, it is a synthetic drug that can be used as a white
powder or crystal glass. Additionally, this stimulant is typically smoked, but can be

2
administered via other possible routes.3 As with many biology and molecular processes,
exposure to foreign objects can alter normal function. Literature has shown that
methamphetamine causes such alterations with dopamine and its molecular players,
including dopamine receptor and dopamine transporter. Methamphetamine can increase
dopamine release and function in the brain.4 Historically, methamphetamine was used
for medicinal purposes, but with the strong majority of this drug unavailable through
legal action, it is more recently abused as an illicit substance. And instead of
administering therapeutic levels, unmonitored methamphetamine use has the potential
and in most cases, likelihood of reaching high or toxic drug concentrations. Before any
interaction can take place, methamphetamine, as is the case with other drugs, must first
enter the neuron. The dopamine transporter controls the active re-uptake of dopamine
from the synapse, which is the part of a neuron that allows for signal transfer.5 In
addition to increasing dopamine release, methamphetamine also blocks re-uptake of
dopamine, thus cancelling the function of the transporter. In this sense, the combination
of extra dopamine release and dopamine not being able to be transferred back into the
terminal creates an additive-like effect. The pleasure and reward system associated with
dopamine is intensified when under the influence of methamphetamine. This intensity is
commonly referred to as the euphoria or “high” that users will describe. The molecular
characteristics listed above contribute greatly to the continued used and addiction
commonly associated with methamphetamine.
Historical and prescription uses for methamphetamine have displayed minor
prevalence and success, but illicit use has witnessed increasing popularity. Several
hypotheses may explain this trend, but one likely cause is the formation of clandestine
3
laboratories. While the majority of these “laboratories” do not resemble a typical
academic or research laboratory, they are considered such because they perform a
chemical reaction, i.e. converting a starting material into methamphetamine. Clandestine,
by definition, means hidden or operated in secrecy. Individuals, either looking to use or
sell methamphetamine, can manufacture the drug within a residence or other dwelling of
choice. Despite the incentive to produce methamphetamine individually, the process and
its ingredients create a hazardous environment, which has the potential to become
severely dangerous. The unsafe conditions are exposed to family, friends, and pets living
within the immediate area, but also any first responders and law enforcement personnel
who may enter the scene. A study conducted in 1996, reviewed the adverse medical
effects in clandestine laboratory investigators. Findings from the retrospective study
indicated that methamphetamine laboratories accounted for 81-97% of all law
enforcement responses and if health issues were reported, symptoms primarily included
headache and respiratory, mucous membrane, and skin irritation.6 While safety measures
within law enforcement communities have likely increased over the past 20 years,
innocent bystanders within dangerous clandestine environments are unlikely to be
equipped with the proper personal protective equipment. An additional note is that the
law enforcement personnel are only exposed to potential dangers for a short, limited time
period. Residents living within, on the other hand, may experience exposure for weeks,
and possibly months. Due to the abundant health risks, research needs to be conducted to
determine the amounts of contamination within typical clandestine laboratories.
In 2005, VanDyke et al. developed a study within an actual household to examine
the clandestine scene over a 24-hour period.7 To replicate an actual clandestine scene,

4
methamphetamine was manufactured in one room or region of the household. On day 1,
two methamphetamine reactions were produced using a previously common procedure
called the “Red Phosphorus” method, which will be discussed further in Chapter 2.7
Although the technique is not the same as the more recent and popular “One Pot”
method, the study still provides insight about possible contamination levels. On day 2,
the researchers started collecting evidence, which included atmosphere and wipe samples.
Based on the results, methamphetamine can be detected within the atmosphere for at least
24 hours after production.7 Depending on the frequency of methamphetamine
manufacturing, anyone dwelling nearby may have a constant exposure, or at the very
least, consistent exposure to toxic methamphetamine fumes. The authors noted that the
airborne methamphetamine particles were rather small and had the ability to be inhaled
by anyone near the production site.7 Another sample type collect was wipes or swabs.
As the name suggests, a piece of material can be swiped across a hard surface, furniture,
piece of clothing, etc. and then extracted to detect the presence of drugs collected on the
wipe. Results for this type of sample collection demonstrated positive methamphetamine
detection in every room of the house, and even on the clothing of the researchers.7 The
findings from this study confirm the presence of methamphetamine and related chemicals
throughout the immediate area surrounding a manufacturing reaction. Additionally, the
detection of toxic fumes and surface contamination in adjoining or adjacent rooms of the
house, provided understanding that health risks associated with clandestine laboratories
can spread to nearby areas. An important note, as discussed by the authors, is that there
is high variability amongst methamphetamine laboratories, in terms of production and
exposure.7 Therefore, any controlled research results must be interpreted individually.

5
Although prior work has been done to help fully understand clandestine
laboratory contamination potentials, continued research is needed to characterize results
from more recent methamphetamine manufacturing methods. As briefly mentioned
above, the One Pot method has become the primary method of choice for quick and easy
methamphetamine manufacture. Expanded details on this specific method will be further
discussed in Chapter 2. While research within the literature pertain to older
manufacturing techniques, very few projects have been conducted to understanding not
only the potential contamination levels, but also the hazards produced by the One Pot
method. Additionally, the health and environmental hazards created during
methamphetamine manufacturing has produced a demand to proactively locate
clandestine laboratories within the community. To achieve this goal, distance monitoring
appears to be a practical technique to pursue. One potential pathway to detect the
presence of clandestine laboratories is following reaction waste disposal. Disposal routes
include, but are not limited to, private property, public areas, and the sewer system.
“There are two significant issues relating to such dumps of materials; they might contain
valuable evidence as to drug manufacture, and they might be a source of pollution.”8
Analysis of waste water for target drug compounds has shown continued success, and
will be explained in Chapter 2. Therefore, if drug compounds associated with
methamphetamine, specifically the One Pot manufacturing method, can be detected
within sewage effluent, determination of the location or general area of clandestine
laboratories may be possible.
A signature byproduct of the One Pot method has been identified as 1-(1',4'-
cyclohexadienyl)-2-methyl-aminopropane, commonly referred to as CMP. Before this

6
study, the amount of byproduct produced in a One Pot method and its potential use as a
clandestine laboratory identifier had not been documented. The goals of this study
include the following:
1) characterize the One Pot methamphetamine method,
2) develop waste water analysis methodologies to detect One Pot waste in sewage
effluent, and
3) determine the significance of detecting the primary One Pot byproduct, CMP,
within environmental samples.
Each goal, as expected, has an associated hypothesis. Respectively, the hypotheses
include:
1) the One Pot methamphetamine method produces signature impurities, within both the
final product and waste materials, that can uniquely identify the manufacturing
technique,
2) One Pot waste products and byproducts are detectable in sewage effluent, and
3) CMP, following consumption within a One Pot methamphetamine salt, can be
detected within urine.
For the first study, as completely explained in Chapter 2, One Pot
methamphetamine was produced using two solvent types, diethyl ether and camp fuel, as
the reaction medium. Reactions were conducted at the Oklahoma State University –
Forensic Toxicology and Trace Laboratory (OSU-FTTL), and methamphetamine
products and waste materials were analyzed using liquid chromatography-tandem mass
spectrometry (LC-MS/MS). Results establish potential yields found within One Pot
methamphetamine laboratories, and discover the detectable presence of target compounds

7
within reaction waste. The second study, discussed in Chapter 3, was achieved by
creating a simulated One Pot waste disposal experiment. The One Pot reaction wastes,
from the two solvent types mentioned above, were deposited into a local waste water
system, with coordination through local authorities. Sewage effluent samples were
collected downstream over time. Waste water samples were then prepared for
instrumental analysis through solid phase extraction (SPE). Results indicate a significant
increase or spike in One Pot target compound concentrations following a simulated
disposal. The findings from this experiment demonstrate the potential to further improve
and implement waste water analysis as a means to track and locate One Pot clandestine
laboratories. And lastly, the third study, as detailed in Chapter 4, was investigated by
analyzing human urine samples that had previously tested positive for methamphetamine.
The approach was developed to understand if the primary One Pot byproduct, CMP, was
detectable in urine post-methamphetamine consumption. Findings confirm the possibility
of detection, but further research is needed to completely understand CMP and its
interaction within the human body.
Overall, the research conducted within the three following chapters provides both
previously unknown knowledge and a demand for continued investigation into the One
Pot methamphetamine method. For the first time, One Pot methamphetamine product
and reaction waste yields have been reported. Although clandestine laboratory yields can
be highly variable, the results established the primary compounds of interest that would
be important to monitor in any detection campaign. Additionally, a waste water analysis
method was developed and validated to detect the target compounds of the One Pot
method. Finally, investigation was performed to begin the process of understanding

8
CMP within human subjects. Continued efforts and research in all three facets of this
study, will continue to increase the awareness of the law enforcement and scientific
communities in regards to the One Pot manufacturing method, with the end goal of being
able to proactively remove the dangerous clandestine laboratories from the community
and environment before more harm is done.

9
CHAPTER II
ONE POT METHAMPHETAMINE CHARACTERIZATION
2.1 Introduction
Throughout the decades of methamphetamine manufacturing, there have been
numerous methodologies to produce the illicit stimulant. Among these production
techniques, include more popular methods such as the “Phenyl-2-Propanone”, “Red
Phosphorus”, and “Birch Reduction” methods, to name a few. The aforementioned
methodologies all result in the production of methamphetamine. However, each method
utilizes varying ingredients, requires a different step-wise procedure, and produces
signature byproducts. Through examination of the ingredients used, waste materials left
behind, and trace detection of unique identifiers, law enforcement and the scientific
community have had the ability to determine the method of production. Not only does
this knowledge assist in understanding drug manufacturing trends within a certain
population or region, understanding the production method can assist in tracking down
the clandestine laboratory and/or the individual(s) producing methamphetamine. The
Drug Enforcement Administration (DEA), with the assistance of several research
projects, created a Methamphetamine Profiling Project (MPP) to track and monitor
methamphetamine production within the country.9 Byproducts, indicative of the
manufacturing technique, have been identified by analyzing the final methamphetamine

10
product or salt. Although the majority of the salt is, in fact, methamphetamine, trace
impurities can be detected with analytical instrumentation. Updated and complete
knowledge of a methamphetamine production method can enhance identification within
the community, and support research projects designed to improve detection capabilities.
As of recent, the “One Pot” method has emerged as the production technique of
choice within clandestine methamphetamine laboratories. Due to the simplistic
procedure and easy access to required ingredients, the One Pot method has become a
widespread problem across the United States. As shown in Figure 1, the DEA released
statistics in the 2016 National Threat Assessment regarding methamphetamine
laboratories.10
Figure 1. Number of Methamphetamine Laboratories Seized from 2010-2015. Bar graph obtained from DEA 2016
National Threat Assessment.
According the bar graph, the number of seized clandestine laboratories have actually
decreased. However, two adjoining factors indicate that One Pot methamphetamine is

11
still prevalent throughout the country. The first is that the number of seizures each year
does not account for clandestine laboratories left unfound. The second is that a strong
majority, 86 percent, of laboratories seized each year had less than two ounces of final
product present. Small quantities of methamphetamine, less than 2 ounces, are indicative
of a One Pot laboratory. “Generally, these laboratories are small-scale, easy to conceal,
and produce.”10 However, with all the risks associated with methamphetamine itself, the
dangers of drug production create the opportunity for additive hazards. The popularity of
One Pot laboratories within communities demonstrates a need to fully understand all
products and byproducts created during the process. Until this project, little to no
research has been done to fully characterize the One Pot methamphetamine method.
The purpose of this study was to investigate every aspect of the One Pot
methamphetamine method post-reaction. Methamphetamine was manufactured in a safe,
laboratory environment at the Oklahoma State University – Forensic Toxicology and
Trace Laboratory (OSU-FTTL). The One Pot method developed by OSU-FTTL was
adjusted from a One Pot method available through the Internet. Minor adjustments were
performed in regards to increasing safety, but did not alter the overall reaction.
Following One Pot syntheses, all components, including the final product, were analyzed
using liquid chromatography-tandem mass spectrometry (LC-MS/MS).
Methamphetamine, pseudoephedrine, ephedrine, and CMP [1-(1',4'-cyclohexadienyl)-2-
methyl-aminopropane], a documented byproduct, were detected and quantified.
Concentrations and percentages of target compounds present within the products and
waste materials obtained provide awareness of the One Pot methamphetamine method,
and insight regarding potential environmental contamination.

12
2.2 Review of the Literature
Methamphetamine in its useable form, typically a salt, will show little to no
deviation in appearance regardless of the manufacturing method. Figure 2, below,
demonstrates examples of the possible pathways.11 As a side note, the goal of this
section is not to discuss, in detail, all of the pathways illustrated, but review the discovery
of unique identifiers for each.
Figure 2. Diagram of Various Routes to Produce Methamphetamine. Figure obtained from Stojanovska et al. 2013.
While visual observation of the final methamphetamine salt proves unsuccessful,
laboratory analysis can reveal unique byproducts or impurities within the product that
indicate the technique or precursors used to produce the drug. The importance of the
ability to track the type manufacturing method used is that the information gained can be
used in a variety of applications, within the law enforcement community for example.
“Impurity profiling can provide information to help identify relationships between drug
seizures, drug sources and trafficking routes.”12 Organizations within the United States,
as well as the rest of the world, have created programs and/or research projects to

13
establish the ability to monitor methamphetamine byproducts. The following section will
review literature pertaining to the identification of unique identifiers that link a
methamphetamine drug sample to its corresponding manufacturing process. Several
research projects have explored the impurities of the P2P, Red Phosphorous, and Birch
Reduction methods. However, the One Pot method, which has shown continued
popularity in clandestine laboratories, and potential signature byproducts, has yet to be
fully investigated.
As mentioned above, there have been several methamphetamine production
techniques implored throughout the 20th century. The first prominent technique will be
referred to as the “Phenyl-2-Propanone” or P2P method, named after the precursor used
to produce methamphetamine. The two major routes of manufacture are termed the
“Reductive Amination” and “Leuckart” methods.13 While these two specific
methodologies have differing procedures, they both utilize phenyl-2-propanone as the
precursor in the reaction. A 1980s report based on 190 methamphetamine laboratories
seized by the DEA, established that the P2P method was implored in over 50 percent of
the cases.14 In a laboratory seizure, identification of the manufacturing method is
typically not a challenge due to the presence of all the ingredients, and occasionally, a
signature smell or odor. For example, a laboratory with precursor, methylamine,
hydrochloric acid, formic acid, and mercury, as well as distinct cat urine odor, would be
indicative of the P2P method.15 While knowledge of laboratory specifics can provide
confirmatory results of the manufacturing technique, the information is not always
available. The final product of methamphetamine salt may be the only evidence seized or
intercepted. However, trace components within the final product can indicate the method

14
of production. “As the synthesis proceeds, various impurities are accumulated: reactants,
byproducts, and intermediates, as well as contaminants rising from within the reagents
themselves.”16 A demand for identification of production route-specific impurities found
in methamphetamine final products spurred several research projects.
As early as 1977, research was being conducted to better understand the P2P
method, and identify manufacturing impurities. Kram and Kruegel utilized gas
chromatography-mass spectrometry (GC-MS) and nuclear magnetic resonance (NMR)
spectroscopy to identify several impurities of the P2P method, the Leuckart method in
particular. The identified trace components included the following compounds: methyl
benzyl ketone, amphetamine, N,N-dimethylamphetamine, dibenzylketone, ,-
dimethyldiphenethylamine, N-methylformamide, formic acid, methylamine, and N-
formylamphetamine.16 While not all trace components may be present in every sample,
the knowledge of these possible contaminants within the methamphetamine salt can assist
future investigations and research. In 1984, a separate research group continued the
research above, but solely focused on the N-methylformamide impurity. Conclusions
within this study stated that N-methylformamide was readily detected via GC-MS in
methamphetamine samples from multiple P2P reactions.17 An important note resulting
from this project is that the authors experienced variable amounts of impurities between
product samples. While the P2P reactions were performed in a controlled setting, the
differing levels of impurities can be predicted to be present within the clandestine
community as well. In contrast to P2P methamphetamine produced “in house”, Dyrit and
Dumlao conducted a study of impurities within seized methamphetamine using GC-MS
and GC with a flame ionization detector (GC-FID). The research group reported four

15
previously unidentified impurities, those being p-bromotoluene, N-benzyl amphetamine,
N-ethyl amphetamine, and N-ethyl methamphetamine.18 Despite the methamphetamine
samples coming from an unknown origin or manufacturing technique, the research group
was also able to detect trace amounts of P2P, N,N-dimethylamphetamine, and N-
formylamphetamine, which has been identified or is similar to contaminants already
identified as originating from a P2P reaction.
A more recent study confirmed the aforementioned work, and provided a more
decisive conclusion with regards to specific identifiers of the P2P manufacturing process.
According to Kunalan et al., three compounds were likely to be unique identifiers of this
manufacturing technique: ,-dimethyldiphenethylamine, N-,-
trimethyldiphenethylamine, and 1-phenyl-2-propanol.19 The research group utilized GC-
MS to obtain and compare the known methamphetamine impurities based on two varying
P2P production methods. Another review pertaining to the P2P method concluded that
other unique identifiers of this production type included amphetamine, 1,3-diphenyl-2-
methaminopropane, and N-cyanomethyl-N-methyl-1-phenyl-2-propylamine.11 While any
of the compounds listed above may not be commonly found substances, the mere
identification for future monitoring provided desired assistance for the detection and
tracking of this type of manufactured methamphetamine.
Due to the popularity and widespread use of the P2P method, the DEA designated
phenyl-2-propanone as a Schedule II compound in 1980. While some manufacturers
sought to avoid this restriction by creating phenyl-2-propanone themselves, the majority
of individuals and/or groups switched methodologies to using ephedrine and/or
pseudoephedrine as the starting material.15 As a reading note, any use of the word

16
“pseudoephedrine” implies that of pseudoephedrine and/or ephedrine, thus combining the
two compounds into one name for simplicity. However, both compound names will be
mentioned if necessary for listings in methodology, results, interpretations, etc.
Incentives to switch to using pseudoephedrine as the methamphetamine precursor
obviously included elusion from law enforcement surveillance, but also, elimination of
precursor production steps. Pseudoephedrine, a common nasal decongestant, is available
for purchase at most pharmacy stores. In fact, the amount an individual could purchase
was seemingly unlimited until the mid 2000s. The Combat Methamphetamine Epidemic
Act of 2005 was enacted, which limited the amount of pseudoephedrine an individual
could purchase in a specific timeframe.20 Therefore, from about 1980 through 2005,
clandestine laboratories individuals, once learning of the pseudoephedrine pathway to
methamphetamine, had unregulated access to the starting material. The readily available
over-the-counter medication gave rise to the increasing number of pseudoephedrine-
based laboratories throughout the country, as introduced in the previous section. Shortly
following the implemented monitoring and limitations of pseudoephedrine purchases in
2005, clandestine laboratory seizures did experience a drop, but an obtainment method
called “smurfing” continued methamphetamine manufacturing popularity.21 Essentially,
a clandestine laboratory can hire or persuade outside individuals to purchase the
maximum allowable amount of pseudoephedrine and provide it to the laboratory. Once
the limited timeframe has passed, the same individual(s) can return the store to buy
another set of the maximum allowable amount and the cycle continues. Regardless of the
various techniques to obtain the starting material, pseudoephedrine was being used to
produce methamphetamine through a variety of different routes.

17
While the P2P method has a couple general routes of synthesis, the
pseudoephedrine-based method contains many variations. Returning to Figure 2, the
generally accepted names include the Nagai, Moscow, Hypo, and Birch Reduction
methods.11 A more recent addition to this list is the One Pot method which has also been
termed the “Shake and Bake” method. However, for the purposes of this review, the One
Pot method will be discussed separately in a following segment. Despite the many
names, the various techniques can be sectioned into groups that will be referred to in this
chapter as “Red Phosphorus” and “Birch Reduction” methods. Similar to the P2P
method, several research projects have been conducted to identify the impurities or
byproducts within the product methamphetamine salts of each of these two
manufacturing groups.
For the Red Phosphorus method, named after one of the main ingredients, red
phosphorus along with hydriodic acid or iodine are used to convert pseudoephedrine into
methamphetamine. Around the 1990s, this manufacturing method was the most
commonly used in the United States, in part, because it produced a more potent form of
methamphetamine than the P2P method.22 Methamphetamine has two isomers, d- and l-
methamphetamine. The Red Phosphorus method produces strictly d-methamphetamine,
rather than a mixture of the two isomers.22 Although the P2P method product can be
further manipulated to isolate the more potent form, d-methamphetamine, the extra time
and effort does not make the endeavor desirable. Despite a more potent
methamphetamine produced via the Red Phosphorus method, byproducts within the final
product still exist.

18
One researcher reported that two impurities following the Red Phosphorus
method are phenyl-2-propanone and naphthalene.22 This result is potentially a very
crucial finding, in that, the presence of phenyl-2-propanone within a methamphetamine
salt sample, could indicate both the utilization of a P2P or Red Phosphorus method. The
author also mentioned that pseudoephedrine was detectable if the reaction did not reach
completion. In 1995, Windahl continued investigation into the Red Phosphorus method,
and reviewed and confirmed the presence of previously identified impurities. The list of
identifiers included phenyl-2-propanone, cis and trans-1,2-dimethyl-3-phenylaziridine, 1-
benzyl-3-methylnapthlaene, and 1,3-dimethyl-2-phenylnapthalene.23 The majority of
these findings were conducted on a GC-MS system, and some groups utilized NMR as
well. However, the contributors of this review, were able to discover two previously
unidentified byproducts. These specific impurities include N-methyl-N-(-
methylphenethyl)amino-1-phenyl-2-propanone and a cis-cinnamoyl derivative of
methamphetamine.23 As stated previously, the impurities identified may be uncommon
and irregular, but in attribution to the research above, identification via GC-MS database
can help identify the methamphetamine manufacturing route.
A more recent study, conducted in 2006, further investigated the impurities of the
Red Phosphorus method. Lee et al. discovered previously identified byproducts, such as
phenyl-2-propanone, but also found N-formylmethamphetamine and N-
acetylmethamphetamine.24 These two compounds had only been identified as impurities
of the P2P manufacturing method. The interpretations from this project confirm the
importance to consider the possibility of impurities that are not definitively
manufacturing route-specific. In 2007, a group analyzed the Red Phosphorus method

19
during their efforts to compare the various alkaloids of Ephedra, the plant from which
pseudoephedrine and ephedrine naturally originate. The reactions pertaining to the Red
Phosphorus method produced the following intermediates and byproducts according to
GC-MS: cis- and trans-1,2-dimethyl-3-phenyl-aziridine, 1-phenyl-2-propanone, 1,3-
dimethyl-2-phenylnaphthalene, and 1-benzyl-3-methylnaphthalene.25 These findings
confirm the presence of unique identifiers of the Red Phosphorus method to manufacture
methamphetamine.
As mentioned above, one of the key ingredients to the Red Phosphorus method is
iodine. However, the Comprehensive Methamphetamine Control Act in 1996 placed
iodine on a list with compounds closely associated with methamphetamine production.26
Increased surveillance and consequential reduction of iodine availability, forced
clandestine laboratories to seek out another technique to produce methamphetamine. The
second general manufacturing method utilizing pseudoephedrine is called the Birch
Reduction method. Typically, this method utilizes the reaction of lithium and liquid
ammonia, in combination with the pseudoephedrine precursor.27 With increased use of
this methodology, post-1996, another demand was created for identification of the Birch
Reduction byproducts and impurities. In 1999, Bremer and Woolery produced a study
focused on a Birch Reduction byproduct that had been tentatively identified. The
authors, with assistance from Dal Cason28, confirmed the identity of 1-(1’,4’-
cyclohexadienyl)-2-methylaminopropane, referred to as CMP, in the methamphetamine
product of Birch Reduction reactions.29 Unlike the previous manufacturing methods with
many potential impurities, the focal byproduct of the Birch Reduction is CMP.
According to the aforementioned study, “It is not likely that an operator would achieve a

20
yield of 80% or higher in a typical clandestine laboratory.” 29 The authors continued to
explain that a typical yield could be as low as 15-30% due to large amounts of CMP
being produced when performing the Birch Reduction method. Following this study, the
actual structure of CMP was only tentatively predicted in an anonymous publication.30
In 2005, a research group sought to confirm the structural identity of CMP.
Person et al. determined the chemical structure utilizing GC-MS and NMR.27 The
structure of CMP is shown on the far right in Figure 3, below.
Figure 3. Reaction schematic of the production of CMP. Figure obtained from Person et al. 2005.
While confirming the structure previously hypothesized, this work increased the ability to
detect CMP on multiple analytical platforms. In 2007, Barker and Antia, in their study
introduced above, also identified CMP as a route-specific indicator of the Birch
Reduction method.25 The mass spectra of CMP from the study’s findings is shown in
Figure 4.

21
Figure 4. Mass Spectra of CMP. Figure obtained from Barker and Anita, 2007.
The ability to identify CMP based on comparison with GC-MS database profile greatly
assisted the identification of methamphetamine being produced via Birch Reduction
method.
Following these research projects, the unique identifiers for the Birch Reduction
method had been primarily narrowed down to one compound, CMP. However, in 2012, a
more comprehensive study was conducted to identify other byproducts of this
methamphetamine production method. Kunalan et al. reported a finding of a previously
undocumented impurity designated as “Unknown 3.”31 While the identity of this
compound could not be determined, the results demonstrated the potential for a second
unique identifier of the Birch Reduction method. In regards to CMP, the research group
above successfully detected the known byproduct, but only when a pseudoephedrine salt
was used as the starting material. If pseudoephedrine was used in freebase form, CMP
was not detectable in the final product.31 Although the findings of this specific study
provided another compound to monitor when investigating a methamphetamine sample,
they also provided an alert that the absence of CMP may not eliminate the Birch
Reduction method as the manufacturing technique. In support of this claim, the DEA

22
performed a study about a method to isolate methamphetamine from any CMP impurity.
Results demonstrated that treating the Birch Reduction method product salt with
potassium permanganate and an aqueous base would result in sufficient separation of the
methamphetamine and CMP.32 Although the research was conducted to help create a
cleaner sample for analysis, the methodologies could be implored in a clandestine setting
as well to provide a more potent methamphetamine product. Consequently, this could
eliminate CMP from being detected in seized methamphetamine from a Birch Reduction
method.
In continuing the trend of clandestine methamphetamine laboratories switching
manufacturing methodologies following legislative action, the One Pot method became
increasingly common. “Newer methods of manufacturing appear as restrictions are
placed on common manufacturing ingredients.”33 The previous statement has been true
for the products such as phenyl-2-propanone, iodine, and pseudoephedrine. The Combat
Methamphetamine Epidemic Act of 2005, spurred the switch from the Birch Reduction
method, to a simpler, modified version, being the One Pot method. A limit was set in
regards to the amount of pseudoephedrine that could be purchased. With many of the
Birch Reduction method procedures utilizing at least 30 grams of pseudoephedrine,
clandestine laboratories began performing smaller quantity reactions, thus beginning the
rise in the One Pot method popularity.34
The One Pot method is a modified Birch Reduction reaction. Essentially,
ammonia, a key ingredient in the Birch Reduction method, is generated within the
reaction of a One Pot. From there, the generated ammonia reacts with lithium and, in the
same fashion as the Birch Reduction method, converts pseudoephedrine into

23
methamphetamine. A desirable characteristic of the One Pot method is that a smaller
quantity of precursor material is required. The popularity of this manufacturing
methodology is proven based on the DEA statistics provided in the previous section.
According to 2015 statistics, 86% of seized laboratories within the United States had less
than 2 ounces of methamphetamine.10 To reiterate, small quantities of product within a
clandestine environment are indicative of a One Pot laboratory. Due to the widespread
use of the One Pot method, a couple research projects have been conducted to better
understand the production yield. In 2006, Heegel et al. performed One Pot reactions with
several sources of pseudoephedrine. Results indicated that many forms of
pseudoephedrine can successfully be converted to methamphetamine, and without pre-
extraction, unlike the Birch Reduction method.33 An important note is that the quality of
methamphetamine varied among sources of starting material, which suggests clandestine
samples may exhibit similar variability. CMP, one of the signature byproducts of the
Birch Reduction method, was detected in some of the One Pot reaction products.
However, the GC-MS results from this study were only semi-quantitative. Since the One
Pot method is a mere adjustment and down-scale of the Birch Reduction method, it is
unsurprising to find the same byproduct.
A more recent project, performed in 2016 in conjunction with this chapter’s study,
investigated the impurities found within the One Pot method via GC-MS. According to
results, three major byproducts were detected following One Pot syntheses: CMP, 1,2-
dimethyl-3-phenylaziridine, and an unknown compound.35 The first two compounds
listed have been previously identified in the literature for the Birch Reduction and Red
Phosphorus methods, respectively. The unknown compound, found to be structurally

24
similar to pseudoephedrine, produced results comparable to that of impurity of Unknown
3 from the Kunalan et al. in 2012.35 The results from this study confirm the presence
CMP within One Pot reactions. On the other hand, the quantitative amounts of CMP
produced in a One Pot reaction have yet to be explored.
In summary, the majority of methamphetamine manufacturing routes have been
studied analytically. Impurities in the methamphetamine salts have been investigated as a
means to provide identifiable information about the production method. While some
impurities carry over, or are shared, amongst various manufacturing techniques, the
ability to detect the unique byproducts can assist in several ways. Windhal et al.
describes the avenues as such, “(i) it can reveal information on the synthetic methods
used to the produce the drug, (ii) it may link samples to a common source dealer or illicit
laboratory, (iii) their identification is essential so that they do not interfere with the
analytical techniques used for drug analysis and (iv) the toxicity of these impurities may
have potential harmful effects on methamphetamine users.”23 In continuation of the
fourth comment, the impurities can also affect individuals in close proximity to
clandestine production of methamphetamine. Due to the lack of literature regarding the
quantities of One Pot byproducts, CMP in particular, the current study was conducted to
better understand and provide an example of clandestine methamphetamine yield using
this method. In addition, all waste products of the One Pot reaction were analyzed and
quantitated for the target compounds. Again, the overall goal was to determine the extent
of byproduct formation and provide interpretation into the amount of possible
contamination of innocent bystanders and the environment.

25
2.3 Methodology
To create One Pot methamphetamine and associated waste materials, a
laboratory-safe production method was performed at OSU-FTTL. All reactions took
place within glass reaction vessels rated for 100 pounds per square inch (psi), placed into
a laboratory fume hood with overpressure relief valves set to depressurize the cook at 90
psi. The ingredients procured for the OSU-FTTL proprietary One Pot method include an
organic solvent, ammonium nitrate, sodium hydroxide, lithium, water, a mixture of
pseudoephedrine-HCl and ephedrine-HCl, and hydrochloric acid. For the reaction
solvent, ether (diethyl ether) and camp fuel (light petroleum distillate) were used in side-
by-side syntheses as shown in Figure 5.
Figure 5. OSU-FTTL One Pot Reaction Setup. The side-by-side reactions had identical setups, with the exception of
solvent type.
Ammonium nitrate was obtained from instant cold compress packs
(GoGoods.com, Inc., Columbia, MD). The camp fuel (Light Petroleum Distillate, CAS
Number 68410-97-9) was obtained from a local hardware store as Coleman® Camp Fuel
(Model: 5103B253 Coleman®, Wichita KS). Ground pseudoephedrine/ephedrine tablets

26
were obtained from a government source. Sodium hydroxide beads, hydrochloric acid
(37%), and ACS grade diethyl ether (CAS Number 60-29-7) were purchased from VWR
Analytical (VWR, Sugar Land, TX). Lithium ribbon and 99+% hydrogen chloride (HCl)
gas were purchased from Sigma (Sigma-Aldrich Corp, St. Louis, MO).
For each synthesis, one gram of ground pseudoephedrine-HCl/ephedrine-HCl
tablets was added to 250 milliliters of solvent, along with a proprietary ratio of water,
ammonium nitrate, sodium hydroxide, and lithium ribbon pieces. All ingredients were
added to a 400-milliliter pressurized, glass reaction flask, thus initiating the start of the
One Pot reaction. An off-gassing apparatus, consisting of valve tubing rated for 150 psi,
was inserted into the lid of the reaction vessel and included a pressure gauge (SSI
Technology, Inc., Janesville, WI), an emergency pressure release valve set for 90 psi, and
a manual valve. Valve tubing coming from the manual valve was inserted into a
receptacle filled with water. The off-gassing apparatus setup is shown in Figure 6,
below. Immediately following the start of the reaction, the manual valve was left open to
the fume hood atmosphere. After 30 seconds, the manual valve was closed, sealing the
system for two hours.

27
Figure 6. Off-gassing apparatus used during the One Pot methamphetamine syntheses. From left to right, the setup
consisted of a digital pressure gauge, an emergency pressure release valve, and a manual valve.
Post-reaction, the head space overpressure was slowly released into a receptacle
filled with water via slight opening of the manual valve closed during the reaction. Once
the reaction vessel headspace was fully opened to atmosphere and depressurized, the off-
gassing apparatus was removed, the round-bottom flask lid was unscrewed and removed.
Lithium was removed from the reaction vessel via forceps and placed into a safe disposal
or sampling container. The vessel lid was loosely placed on top of the reaction vessel to
allow overnight ventilation. Following the allotted time period, the solvent within the
reaction vessel was filtered using coffee filters (Farmer Bros Co., Ft. Worth, TX) that had
been pre-moistened with un-reacted solvent of the respective synthesis. After filtration,
the coffee filter was dunked into water to react any trace lithium present. The solvent
filtered, deemed “pre-salt” solvent, was poured into a separate, clean bottle. The

28
remaining solid waste, or sludge, at the bottom of the reaction vessel was dissolved in
250 mL of water, poured into a separate, clean bottle, and stored for subsequent analysis.
After collection of the sludge, the pre-salt solvent was purged with hydrogen chloride gas
from a lecture bottle to convert methamphetamine, any remaining precursor, as well as
formed byproducts, into hydrochloride salts. An example of a product salt can be seen in
Figure 7. Once precipitation visually ceased, the product salt was recovered with another
coffee filter, dried and weighed. The remaining solvent was poured into a separate, clean
bottle and labeled “post-salt solvent.”
Figure 7. Product Salt. An example of a product salt sample from a One Pot synthesis.
Six identical reactions were performed, differing only in selection of solvent:
three syntheses used laboratory-grade diethyl ether and three used camp fuel. On each

29
synthesis day, an ether reaction was performed alongside a camp fuel reaction to help
reduce variability between the two cooks. Diethyl ether syntheses are designated E1, E2
and E3, and camp fuel syntheses are designated C1, C2 and C3. All chemicals were
weighed prior to reaction to a measured precision of less than 0.1 g difference per
weighed ingredient between the two reaction types. Following the 2-hour reaction
explained above, the lithium pieces from the first synthesis of each solvent type, E1 and
C1, were removed from the reaction vessel, dissolved in 100 mL of deionized water, and
saved for potential future analysis. For the remaining reactions, E2-E3 and C2-C3, the
lithium was removed and quickly immersed into mineral oil for safe disposal. Sludge,
post-salt solvent, and product salt samples were collected for analysis in the manner
described in the previous subsection. Following a dilution of every sample to eliminate
instrument saturation, all characterizations samples were placed into injection vials for
LC-MS/MS analysis.
Shimadzu UFLC pumps paired with an Applied Biosystems 4000 Q Trap MS/MS
was used for the LC-MS/MS analysis, shown in Figure 8.

30
Figure 8. LC-MS/MS Instrumentation Setup at OSU-FTTL. Shimadzu UFLC pumps on the left, and Applied
Biosystems 4000 Q Trap MS/MS on the right.
For liquid chromatography, separation was achieved with a Restek Raptor Biphenyl 2.7
µm column (50 x 2.1 mm) with a Restek Raptor Biphenyl 2.7µm guard cartridge (5 x 3.0
mm) (Restek Corporation, Bellefonte, PA). Mobile Phase A consisted of 2mM
ammonium formate and 0.1% formic acid in LC-MS grade water, while Mobile Phase B
consisted of 2mM ammonium formate and 0.1% formic acid in LC-MS grade methanol.
Ammonium formate was purchased from Alfa Aesar (Alfa Aesar, Ward Hill, MA).
Formic Acid was purchased from EDM (EDM Millipore Corp, Billerica, MA). Methanol
was purchased from JT Baker (Avantor Performance Materials Inc., Center Valley, PA).
Nanopure water was obtained using a Barnstead Nanopure Diamond laboratory water
system (Thermo Scientific, Waltham, MA). The LC method had a total flow rate of
0.700 ml/min. Mobile Phase B concentration was held at 7.2% for 3.5 minutes, increased

31
to 35% for 1 minute, lowered to 7.2% for 0.25 minutes, increased to 100% for 0.5
minutes, and then lowered to 7.2% for 1.75 minutes, for a total run time of 7 minutes.
All changes in mobile phase B concentrations were set to immediately occur and end
with no ramp. Injections were set at 20 µL and the oven temperature was set to 30 oC.
For mass spectrometry, Table 1, below, shows the ion transitions and LC-MS/MS
instrument parameters for the compounds of interest. Amphetamine, Amphetamine-d6,
Methamphetamine, Methamphetamine-d5, 1S,2S(+)-Pseudoephedrine, and 1S,2R(+)-
Ephedrine-HCl standards were all purchased at a concentration of 1 mg/mL from
Cerilliant (Cerilliant Corp, Round Rock, TX). Pseudoephedrine-d3 HCl and 1S,2R(+)-
Ephedrine-d3 HCl standards were also bought from Cerilliant at a concentration of 100
µg/mL. One gram of CMP-HCl standard was purchased from Cayman (Cayman
Chemical, Ann Arbor, MI). For simplicity, the naming of all analytes will be as follows:
methamphetamine, pseudoephedrine, ephedrine, amphetamine, and CMP. Additionally,
there are four deuterated internal standards, methamphetamine-d5, pseudoephedrine-d3,
ephedrine-d3, and amphetamine-d6.
Table 1. Mass Spectrometry Parameters. Target analytes Methamphetamine, Pseudoephedrine, Ephedrine,
Amphetamine, and CMP were identified using two mass ion fragments each. Internal standards include
Methamphetamine-d5, Pseudoephedrine-d3, Ephedrine-d3, and Amphetamine-d6.
Compound
Q1 Mass
(Da)
Q3 Mass
(Da)
DP
(volts)
CE
(volts)
CXP
(volts)
Methamphetamine 150.100 91.000 56.000 25.000 14.000
150.100 119.000 56.000 15.000 4.000
Methamphetamine-d5 155.000 91.100 60.000 20.000 4.000

32
Trueness of the compound identity was confirmed through comparing the areas of the
two MRM transitions, resulting in an identification or ID ratio, also known as an MRM
ratio. Every Q1 Mass and Q3 Mass pairing generated a chromatographic peak. MRM
ratios for each compound, with the exception of internal standards, were calculated by
dividing the peak area of the second pairing by the peak area of the first pairing. To build
an acceptable ID ratio range, the ratios observed for every calibrator were averaged. For
results to be accepted, the ID ratio must be within 30% of the ID ratio average using two
significant figures for the percentage value.
Pseudoephedrine 166.180 148.024 41.000 15.000 6.000
166.180 90.961 41.000 43.000 12.000
Pseudoephedrine-d3 169.200 151.040 26.000 21.000 26.000
Ephedrine 166.108 117.085 41.000 27.000 18.000
166.108 114.796 41.000 35.000 18.000
Ephedrine-d3 168.980 116.999 31.000 29.000 6.000
Amphetamine 136.200 119.000 36.000 13.000 18.000
136.200 91.000 36.000 25.000 14.000
Amphetamine-d6 142.100 125.100 41.000 13.000 6.000
CMP 152.163 79.114 41.000 27.000 12.000
152.163 77.071 41.000 45.000 0.000

33
To generate a quantitative value for each compound, a calibration curve
containing all target compounds was utilized. The linear range for all non-internal
standard compounds in the LC-MS/MS method mentioned above contained the following
calibrator points: 100, 50, 25, 5, 1, and 0.5 ng/mL of each drug compound. To calculate
the concentration of all calibrators, quality controls, and research samples, MultiQuant
software (SCIEX, Foster City, CA) was utilized, which is specifically designed for LC-
MS/MS result analysis. All other values and statistical comparisons were obtained by
utilizing Microsoft Excel (Microsoft Corporation, Redmond, WA).
2.4 Findings
LC-MS/MS analysis was performed using Shimadzu UFLC pumps paired with an
Applied Biosystems 4000 Q Trap MS/MS. As mentioned in the Methodology section
above, the sample types collected from the characterization syntheses included product
salt, sludge, and post-salt solvent samples.
For product salt samples, methamphetamine, CMP, pseudoephedrine, and
ephedrine were all detected. The LC-MS/MS quantification results are shown in Table 2.
All values are listed in ng/mL and an asterisk designation refers to a result that met
identification criteria, but did not quantitate above the limit of quantitation (LOQ).
Table 2. LC-MS/MS quantification results for the product salts. All concentrations given in ng/mL. Concentration
below the LOQ of 0.5 ng/mL are designated with an asterisk.
Compound E1 E2 E3 C1 C2 C3
Methamphetamine 21.8 56.3 35.9 23.1 35.6 25.8
CMP 1.62 2.19 2.28 0.22* 0.24* 0.16*
Pseudoephedrine 8.60 8.39 12.0 14.7 10.4 14.2
Ephedrine 36.9 44.2 52.1 59.8 33.4 49.7

34
The percentage of methamphetamine, CMP, pseudoephedrine, and ephedrine found in the
product salts were calculated to compare the amounts of product and impurities present in
each product salt; these percentages are summarized in Table 3.
Table 3. Percent of methamphetamine, CMP, pseudoephedrine, and ephedrine found in each product salt with LC-
MS/MS. All values listed are percentages based on 100% for complete drug composition within the sludge sample.
Compound E1 E2 E3 C1 C2 C3
Methamphetamine 31.6 50.7 35.1 23.6 44.7 28.7
CMP 2.35 1.97 2.23 0.23 0.30 0.18
Pseudoephedrine 12.5 7.56 11.7 15.0 13.1 15.8
Ephedrine 53.6 39.8 50.9 61.2 41.9 55.3
Statistical analysis of a two-population t-test, comparing average compound
concentrations in product salt samples of ether and camp fuel One Pot syntheses,
produced the corresponding results listed in Table 4. Based on the p-values, the mean
concentrations of all drug compounds between ether and camp fuel syntheses are not
statistically different. CMP was not statistically compared because the average value of
camp fuel samples was below LOQ.
Table 4. Statistical Comparison of Ether and Camp Fuel Product Salt Samples. A two-population t-test was performed
to compare the mean average concentration of ether and camp fuel for methamphetamine, psuedoephedrine, and
ephedrine. A generated p-value less than 0.05 translates to a statistical difference between the two solvent types. A p-
value less than 0.01 or less than 0.001, indicate a high statistical difference or extreme statistical difference,
respectively.
Product Salts (ng/mL) Ether Camp Fuel p-value
Methamphetamine 37.96 28.16 0.412
Pseudoephedrine 9.66 13.08 0.126
Ephedrine 44.39 47.65 0.732

35
p –values used to calculate the mean met acceptance criteria, but the concentrations
quantitated below the LOQ set at 0.5 ng/mL.
*p-values<0.05 signifying a statistical difference between the concentrations observed in the
ether cooks and the camp fuel cooks.
**p-values<0.01 signifying a high statistical difference between the concentrations observed
in the ether cooks and the camp fuel cooks.
***p-values<0.001 signifying an extreme statistical difference between the concentrations
observed in the ether cooks and the camp fuel cooks.
For sludge samples, the quantification results are displayed in Table 5. All values
listed are in mg/mL. Methamphetamine, pseudoephedrine, and ephedrine were observed
in all samples and quantitated. CMP, however, was only detected in the sludge from the
diethyl ether One Pot syntheses.
Table 5. LC-MS/MS quantification results for sludge samples. All concentrations given in mg/mL.
Compound E1 E2 E3 C1 C2 C3
Methamphetamine 4.46 8.78 2.66 0.31 1.14 0.78
CMP 0.31 0.35 0.19 - - -
Pseudoephedrine 0.94 0.57 0.82 0.39 0.45 0.61
Ephedrine 4.30 2.46 3.05 1.86 2.15 3.24
The percentages of methamphetamine, CMP, pseudoephedrine, and ephedrine found in
the sludge were calculated to compare the amounts of product and precursor left behind
from the methamphetamine syntheses. These percentages are summarized in Table 6.
Percentages from the LC-MS/MS data were calculated by using the determined
concentrations of each chemical.
Table 6. Percent of methamphetamine, CMP, pseudoephedrine, and ephedrine found in each sludge sample with LC-
MS/MS. All values listed are percentages based on 100% for complete drug composition within the sludge sample.
Compound E1 E2 E3 C1 C2 C3
Methamphetamine 44.6 72.3 39.6 12.0 30.5 16.9
CMP 3.07 2.89 2.8 0.00 0.00 0.00
Pseudoephedrine 9.35 4.66 12.2 15.3 12.2 13.1

36
Ephedrine 43.0 20.2 45.4 72.7 57.3 70.0
Statistical analysis of a two-population t-test, comparing average compound
concentrations in sludge samples for ether and camp fuel One Pot syntheses, produced
the corresponding results listed in Table 7. Based on the p-values, the mean
concentrations of all drug compounds between ether and camp fuel syntheses are not
statistically different. CMP was not statistically compared because this compound was
not detected in the camp fuel samples.
Table 7. Statistical Comparison of Ether and Camp Fuel Sludge Samples. A two-population t-test was performed to
compare the mean average concentration of ether and camp fuel for methamphetamine, psuedoephedrine, and
ephedrine. A generated p-value less than 0.05 translates to a statistical difference between the two solvent types. A p-
value less than 0.01 or less than 0.001, indicate a high statistical difference or extreme statistical difference,
respectively.
Sludge (mg/mL) Ether Camp Fuel p-value
Methamphetamine 5.30 0.74 0.068
Pseudoephedrine 0.77 0.48 0.084
Ephedrine 3.27 2.41 0.283
*p-values<0.05 signifying a statistical difference between the concentrations observed in the
ether cooks and the camp fuel cooks.
**p-values<0.01 signifying a high statistical difference between the concentrations observed
in the ether cooks and the camp fuel cooks.
***p-values<0.001 signifying an extreme statistical difference between the concentrations
observed in the ether cooks and the camp fuel cooks.
For post-salt solvent samples, the quantification results are displayed in Table 8.
All values listed are in ng/mL. Methamphetamine, pseudoephedrine, and ephedrine were
found and quantitated. CMP, however, was only detected in the post-salt solvent from
the diethyl ether One Pot syntheses.
Table 8. LC-MS/MS quantification results for post-salt solvents. All concentrations given in ng/mL.
Compound E1 E2 E3 C1 C2 C3
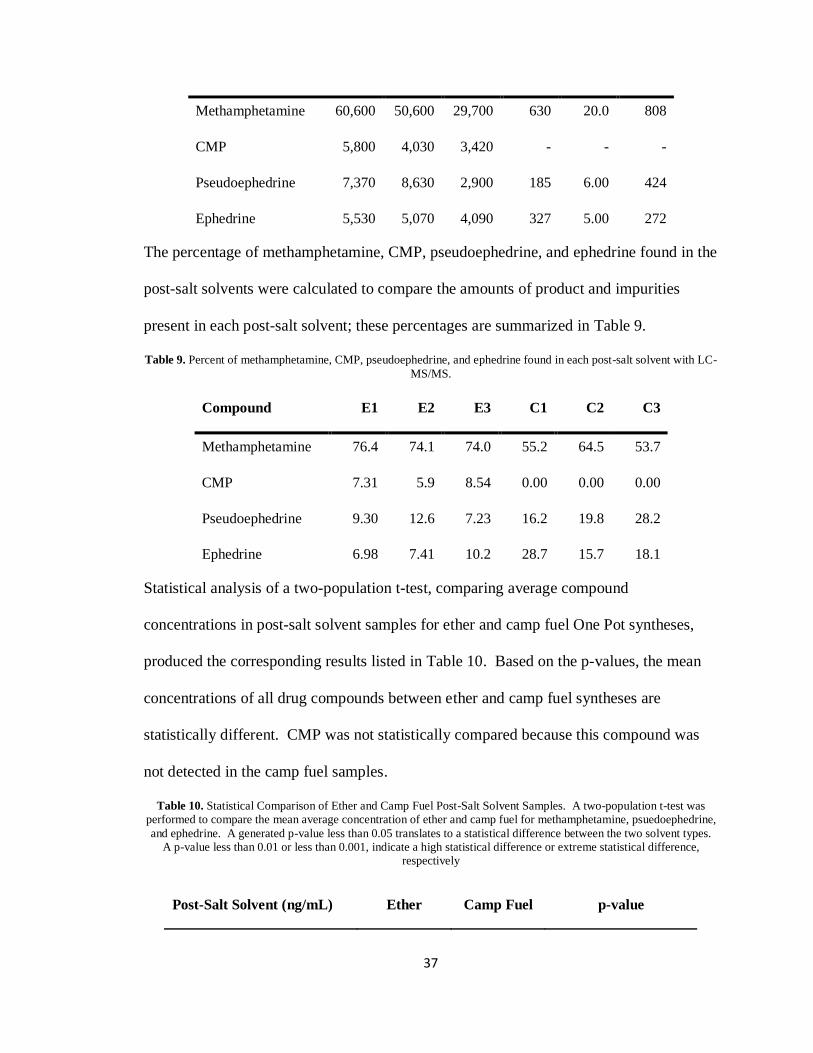
37
Methamphetamine 60,600 50,600 29,700 630 20.0 808
CMP 5,800 4,030 3,420 - - -
Pseudoephedrine 7,370 8,630 2,900 185 6.00 424
Ephedrine 5,530 5,070 4,090 327 5.00 272
The percentage of methamphetamine, CMP, pseudoephedrine, and ephedrine found in the
post-salt solvents were calculated to compare the amounts of product and impurities
present in each post-salt solvent; these percentages are summarized in Table 9.
Table 9. Percent of methamphetamine, CMP, pseudoephedrine, and ephedrine found in each post-salt solvent with LC-
MS/MS.
Compound E1 E2 E3 C1 C2 C3
Methamphetamine 76.4 74.1 74.0 55.2 64.5 53.7
CMP 7.31 5.9 8.54 0.00 0.00 0.00
Pseudoephedrine 9.30 12.6 7.23 16.2 19.8 28.2
Ephedrine 6.98 7.41 10.2 28.7 15.7 18.1
Statistical analysis of a two-population t-test, comparing average compound
concentrations in post-salt solvent samples for ether and camp fuel One Pot syntheses,
produced the corresponding results listed in Table 10. Based on the p-values, the mean
concentrations of all drug compounds between ether and camp fuel syntheses are
statistically different. CMP was not statistically compared because this compound was
not detected in the camp fuel samples.
Table 10. Statistical Comparison of Ether and Camp Fuel Post-Salt Solvent Samples. A two-population t-test was
performed to compare the mean average concentration of ether and camp fuel for methamphetamine, psuedoephedrine,
and ephedrine. A generated p-value less than 0.05 translates to a statistical difference between the two solvent types.
A p-value less than 0.01 or less than 0.001, indicate a high statistical difference or extreme statistical difference,
respectively
Post-Salt Solvent (ng/mL) Ether Camp Fuel p-value

38
Methamphetamine 46957 486 0.007**
Pseudoephedrine 6297 205 0.025*
Ephedrine 4896 201 0.000***
*p-values<0.05 signifying a statistical difference between the concentrations observed in the
ether cooks and the camp fuel cooks.
**p-values<0.01 signifying a high statistical difference between the concentrations observed in
the ether cooks and the camp fuel cooks.
***p-values<0.001 signifying an extreme statistical difference between the concentrations
observed in the ether cooks and the camp fuel cooks.
2.5 Discussion
Following One Pot reactions, LC-MS/MS quantitative results were obtained in the
product salt, sludge, and post-salt solvent samples. Compounds that were detected
included methamphetamine, pseudoephedrine, ephedrine, and CMP. Based on the
results, the analytical instrument of choice was successful in characterizing each aspect of
a One Pot synthesis. In addition to obtaining values of yield within the
methamphetamine final product, concentrations within One Pot method waste were
collected to understand contamination potentials for individuals in the immediate area.
Also, contamination potential exists for the environment, assuming negligent disposal of
clandestine laboratory waste. And in summary, values were obtained for two commonly
used One Pot method solvents, thus providing comparisons, as well as a more in-depth
and characteristic interpretation of clandestine methamphetamine laboratories.
For the product salt samples, no statistical difference in yield was present. The
minimal detection of the byproduct CMP, and absence within clandestine
methamphetamine samples, could indicate the solvent used within the One Pot reaction.
According to the literature, “The protons required for the reduction of the hydroxyl group

39
and the partial reduction of the aromatic ring arise because of damp or impure solvents or
even water absorbed into the reaction from the atmosphere.”25 Therefore, the amount of
water present within the One Pot reaction can impact the levels of CMP produced.
However, careful precautions within the methodology of this study were taken to ensure
equal treatment of both solvent types. In discussions about the differences in the solvent
types, diethyl ether versus camp fuel, a former DEA chemist explained the fact that any
water added, present, or produced within the reaction is more easily soluble in diethyl
ether.36 As a result, any methamphetamine produced is more likely to continuing
reducing into CMP when suspended in diethyl ether versus camp fuel. An equal amount
of water was added to the camp fuel syntheses, which explains CMP being still produced.
The byproduct concentrations are much lower in the camp fuel syntheses because the
methamphetamine did not come into contact with water as readily due to camp fuel’s
immiscibility with water. Another contributing factor may be the duration of the One Pot
reaction. All controlled syntheses were performed over a period of two hours. With
knowledge that camp fuel does not allow CMP to be produced as easily, future tests of
extending the reaction time may increase the formation of CMP.
The trend of lower CMP detections in the other sample types, sludge and post-salt
solvent, continued with the camp fuel reactions. In fact, CMP was not detected in camp
fuel waste samples. For sludge comparisons of solvent type, there were no statistically
significant differences for the other compounds present. All p-values generated were
above a 0.5 value. However, all sludge samples were much more concentrated with
target compounds, units of mg/mL, when comparing them to the other sample types, units
of ng/mL. This phenomenon cannot be fully explained and will require additional

40
research, but one hypothesis is that the de-pressurized One Pot allotted waiting time
before the salting out process allowed the drug compounds to settle towards the bottom of
the reaction vessel. Since the solvent was decanted into a separate container the
following day, a higher concentration of compounds may be present in residual solvent
present in the sludge samples.
For post-salt solvent comparisons of solvent type, every compound targeted was
statistically different, with two compounds categorized as highly different and another
categorized as extremely different. In order of statistical difference, pseudoephedrine,
methamphetamine, and ephedrine had p-values of 0.025, 0.003, and 0.000, respectively.
Despite the statistical differences between the diethyl ether and camp fuel post-salt
solvents, the percentages of drug compounds present, at an observational level, seem to
be relatively consistent. This similarity may imply that while the conversion of
pseudoephedrine and ephedrine to methamphetamine was comparable, differences within
the post-salt solvent samples can be attributed to another aspect of the One Pot method
process. Two potential sources of the deviation are the salting out process and filtration
of product from solvent. Further studies will need to be conducted to confirm and better
understand the variability.
Overall, the One Pot methamphetamine method, in two variations based on
solvent type, was characterized using LC-MS/MS. The syntheses performed at OSU-
FTTL were representative of a clandestine laboratory procedure, adjusted slightly for
safety precautions within a research facility. An important note is that clandestine
laboratory reactions are likely to be highly variable in regards to the amount of
ingredients used and reaction duration. Until more research is gathered, any

41
interpretations of illicit methamphetamine samples should focus more on the presence of
specific compounds, instead of compound quantities. Based on this study’s results, a
signature byproduct of the One Pot reaction, CMP, as established in the literature, was
successfully quantitated in diethyl ether syntheses, for both product and waste samples.
CMP was also detected in trace amounts within camp fuel syntheses product samples.
With the likelihood of high procedural and production variability within clandestine
laboratories, the absence of CMP within this study’s camp fuel waste samples cannot
exclude CMP from being present in clandestine laboratories that utilize camp fuel. The
study’s findings contribute knowledge and awareness to both the law enforcement and
scientific communities towards the goal of improving detection and tracking capabilities
of One Pot clandestine laboratories. In addition, the target compounds detected in One
Pot waste materials indicates a real possibility of contamination within the surrounding
area and in the environment. However, the ability to detect product methamphetamine,
precursor pseudoephedrine, and byproduct CMP (diethyl ether samples only) in
manufacturing waste, provides an opportunity to track the location of clandestine One Pot
laboratories within the community via waste disposal routes.

42
CHAPTER III
ONE POT WASTE DEPOSIT SIMULATION – SEWAGE EFFLUENT ANALYSIS
3.1 Introduction
Methamphetamine has manufactured into a continual problem over the past
several decades. Despite the dangers and health risks commonly associated with the
stimulant’s use, individuals can easily produce methamphetamine in an area of their
choosing, thus creating clandestine, or secret, laboratories. From 2004 to 2011, the Drug
Enforcement Administration (DEA) reported an estimate of over 85,000
methamphetamine laboratory incidents.37 Among these statistics, Tulsa County in
Oklahoma proved to be the national leader of incidents over the 8-year time period.
However, other areas of the United States of America have experienced similar
methamphetamine popularity, even in more recent years. According to the World Drug
Report, over 30,000 clandestine methamphetamine laboratories have been detected across
the nation from 2011-2014.38
Examination of clandestine methamphetamine laboratories over the course of
time has shown multiple techniques for producing the drug of interest. While new
production methods may be a result of increased yield or simplicity, the major reason to
develop new techniques has been after legislative restriction on the manufacturing
ingredients.33 Recently, the One Pot methamphetamine method has become the most

43
common manufacturing process. Along with a short and simple procedure, the One Pot
method is popular due to the use of obtainable household ingredients. Pseudoephedrine,
the starting material in the One Pot method, is the only item that may provide an
acquisition challenge. As mentioned earlier, legislation has attempted to restrict access to
methamphetamine production ingredients. Many states, in an attempt to reduce the
number of clandestine methamphetamine laboratories, have limited the amount of
pseudoephedrine that an individual can purchase.39 Since pseudoephedrine is still
available in limited quantities, in part for its medicinal decongestive properties,
individuals are still utilizing the One Pot methamphetamine manufacturing method. In
fact, most of the seized domestic laboratories in 2014 were determined to be One Pot or
“Shake and Bake” methamphetamine labs.40
Continual popularity of methamphetamine laboratories does not reduce associated
dangers. The One Pot method, like an older methamphetamine manufacturing procedure
called the Birch Reduction method, explained in Chapter 2, uses lithium as an electron
source to reduce the hydroxyl group of pseudoephedrine, thus creating
methamphetamine.27 Lithium and other ingredients involved in the One Pot method, like
a flammable organic solvent, causes the methamphetamine production to become
severely dangerous. Environmental exposure and the possibility of a fire are two risks
introduced to the nearby community. Even with successful methamphetamine cooks,
toxic waste disposal can have detrimental effects to the surrounding area and residents.
According to some reports, approximately five to seven pounds of waste accompanies
every pound of methamphetamine produced.41 Common disposal routes include trash
service, negligent dumping into outdoor areas, and introduction to the waste water
44
system. While waste disposal has case-by-case variability, several reports and case
studies prove that methamphetamine laboratory waste has been deposited in sink drains,
flushed down toilets, etc. One police detective wrote that it is not uncommon for
methamphetamine laboratory individuals to pour toxic liquids down the drain in order to
avoid detection.42 Before this study, the possibility of using waste water to locate
methamphetamine laboratories had yet to be determined.
Trace detection of drugs in waste water, as further discussed in the following
section, has been primarily used to monitor pharmaceutical and illicit drug use in a
community. Parent, or unaltered, drug compounds and metabolites have successfully
been detected in small amounts utilizing various sample extractions and analytical
instrumentations. While waste water analysis has contributed to understanding
population drug trends and/or waste water treatment improvements, the possibility of
detecting drug compounds to identify or assist in identifying clandestine laboratories has
yet to be investigated. The focal points of this research are to first, identify the potential
hazards and health impacts of exposure to One Pot methamphetamine and manufacturing
byproducts. A second goal is to determine the possibility of monitoring One Pot
methamphetamine laboratory products and waste materials after introduction to the waste
water system. And the last goal is to confirm or deny the usefulness of CMP as a unique
identifier of methamphetamine manufacturing.
Simulated One Pot methamphetamine laboratory products were developed and
produced at the Oklahoma State University – Forensic Toxicology and Trace Laboratory
(OSU-FTTL). Methamphetamine product salts were produced, filtered, and removed.
All remaining reaction waste, both solids and liquids, were deposited into a local waste

45
water system. Time course waste water samples were collected downstream using an
autosampler provided by the Savannah River National Laboratory (SRNL). Sample
analysis included solid phase extraction (SPE) followed by liquid chromatography-
tandem mass spectrometry (LC-MS/MS) to quantitate target compounds within sewage
effluent. Results proved the ability to detect methamphetamine, pseudoephedrine, and
over-reduced methamphetamine, CMP. Analyses provided additional information, such
as concentration levels and window of detection within sewage effluent. This research
demonstrated the possibility and potential of monitoring clandestine One Pot
methamphetamine laboratories in the community through the use waste water analysis.
In combination with continued research, the following study provides a method for law
enforcement to assist in proactively detecting and seizing clandestine drug laboratories in
the community.
3.2 Review of the Literature
The One Pot method has become the primary method of choice for quick
methamphetamine production. Similar to all drug production methods that came before,
laboratory waste can be a huge concern. With the continual number of clandestine
methamphetamine laboratories in communities, the possibility of environmental exposure
to harmful and toxic chemicals has drawn public attention. This awareness has
developed a need to locate and consequently, eliminate One Pot methamphetamine
laboratories within states, cities, and neighborhoods. Identification of clandestine drug
operations has been limited to first-hand reports, gathered intel, or laboratory incidents
that reveal the presence of methamphetamine production. For example, a study
conducted in 2013 determined that trace amounts of methamphetamine and

46
pseudoephedrine could be detected following a methamphetamine laboratory fire.43
While these results provided a useful tool for investigators, any and all law enforcement
action would take place post-discovery of a clandestine drug laboratory.
A need has been identified to assist in location of One Pot methamphetamine
laboratories before potential environmental exposure. Proactively seeking clandestine
laboratories, especially those utilizing the One Pot method, has produced limited success.
Although the Drug Enforcement Administration reported over 9,000 methamphetamine
laboratory discoveries in 2014, many clandestine operations may continue to be kept in
secrecy.40 The high availability of the One Pot method ingredients reduces the
effectiveness of product monitoring. Therefore, other means of clandestine laboratory
identification must be researched.
Of all the possible routes of disposing clandestine laboratory waste, the sewage
system provides the most optimistic pathway for the law enforcement and scientific
communities to achieve remote detection. As noted in the introductory section,
individuals have been known to pour methamphetamine and manufacturing waste down
household water drains to avoid detection. Figure 9, below, is an image taken by a police
officer in Gladwin City, Michigan. According to the news report, the police discovered a
One Pot methamphetamine laboratory in a household kitchen.44

47
Figure 9. Police image of One Pot laboratory within kitchen sink. Figured obtained from Dan Firnbach, 2015.
Of significant importance is the use of the sink to perform the methamphetamine
synthesis. Whether the individual was pouring any unwanted materials down the drain,
or just utilizing the sink as a receptacle for any chemical spills, One Pot
methamphetamine waste is likely to reach the sewage system. Another case, which
provides more concrete proof of clandestine laboratory waste being introduced to the
sewage system comes from a former Chief of Police in Stillwater, Oklahoma. At one
particular scene, the sink drain pipes were severely corroded due to methamphetamine
waste exposure, to a point where the sink drain could not be used. Therefore, the
individual in this circumstance configured a piece of tubing from the sink to the drain of
the dishwasher so that methamphetamine waste could be washed away.45 The
configuration at this clandestine laboratory is shown in Figure 10, specifically the right
side of the image where a single piece of white tubing can be observed.
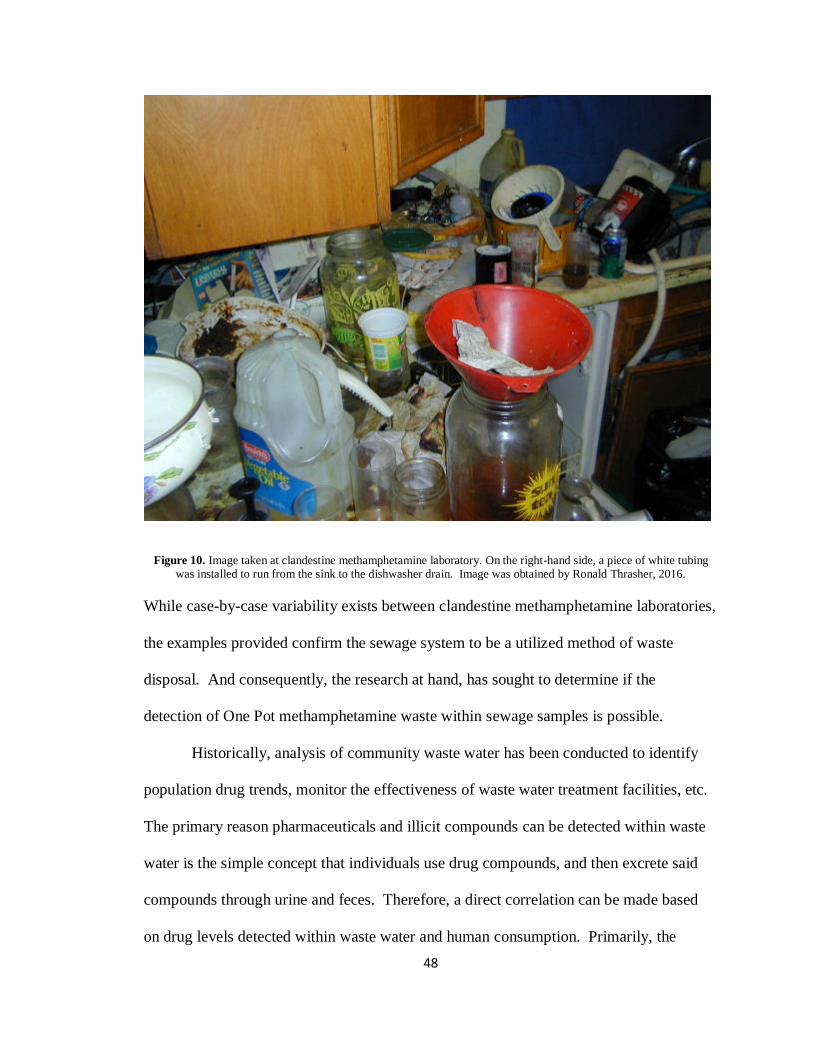
48
Figure 10. Image taken at clandestine methamphetamine laboratory. On the right-hand side, a piece of white tubing
was installed to run from the sink to the dishwasher drain. Image was obtained by Ronald Thrasher, 2016.
While case-by-case variability exists between clandestine methamphetamine laboratories,
the examples provided confirm the sewage system to be a utilized method of waste
disposal. And consequently, the research at hand, has sought to determine if the
detection of One Pot methamphetamine waste within sewage samples is possible.
Historically, analysis of community waste water has been conducted to identify
population drug trends, monitor the effectiveness of waste water treatment facilities, etc.
The primary reason pharmaceuticals and illicit compounds can be detected within waste
water is the simple concept that individuals use drug compounds, and then excrete said
compounds through urine and feces. Therefore, a direct correlation can be made based
on drug levels detected within waste water and human consumption. Primarily, the

49
methods utilized to perform this type of research include SPE and gas chromatography-
mass spectrometry (GC-MS) or LC-MS/MS, although others techniques exist. SPE is a
sample preparation technique that uses a solid packing material within a column to
separate different chemical compounds within a sample.46 In addition to the ability to
separate and/or isolate target drugs, SPE typically concentrates the compounds. A larger
volume of sample is added to a SPE cartridge than is eluted as a final prepared sample for
analysis. Essentially, and ideally, all of the target drug compounds within a sample will
be captured by the solid packing material within the SPE cartridge. As a result, the more
sample added to the cartridge, the higher the concentration of drug compounds within the
sample analyzed. For this reason, and the purpose of purifying dirty waste water, SPE
has been the primary sample preparation technique within this area of research.
As explained above, sewage waste, commonly referred to as effluent, has been
used in many instances to detect trace amounts of pharmaceuticals and illicit compounds.
Among these studies include methamphetamine. When performing waste water studies,
additional information, such as the drug’s interaction with the body and excretion from
the body, can be crucial to instrumental detection and result interpretation. Many sewage
effluent drug studies include methamphetamine, but in addition to monitoring the parent
compound, amphetamine levels are examined as well. “Between 30-54% of an oral dose
is excreted in urine as unchanged methamphetamine and 10-23% as unchanged
amphetamine. Following an intravenous dose, 45% is excreted as unchanged parent drug
and 7% amphetamine.”47 With this, drug metabolism as well as route of administration
are important factors in result interpretation. However, methamphetamine to
amphetamine ratios in sewage water will not likely follow expected or theoretical values

50
due to other potential sources of these compounds. Amphetamine is available as a
prescription drug. Increased use of this prescription drug in a given area or population
would increase amphetamine concentrations in sewage effluent, thus creating a challenge
for methamphetamine to amphetamine ratio determinations. A second possible
contributor to increased concentrations include compounds that metabolize to
amphetamine or methamphetamine. According to one report, benzphetamine, selegeline,
and famprofazone are among this group.47 While the aforementioned substances may not
be commonly used, the knowledge of their potential impact is important to consider when
reviewing waste water results.
Another important source of methamphetamine is those using the stimulant as
prescribed. Desoxyn is the only brand name methamphetamine available via
prescription. With LC-MS/MS analysis, Desoxyn use cannot be distinguished from illicit
use. An abundance of legal Desoxyn users within a given area, may skew illicit
consumption interpretations. However, a method to predict the amount of prescription
methamphetamine use has been implored in the literature. A study conducted in 2011,
for example, focused on the interpretation of methamphetamine concentrations in sewage
effluent.48 This group utilized DEA drug records to estimate the amount of prescription
methamphetamine used within a population. Since Desoxyn is not a commonly
prescribed drug and sewage effluent analysis is highly variable to begin with, conclusions
from this study indicated that calculated Desoxyn intake and excretion values would, for
the most part, confidently estimate the amount of prescription methamphetamine present
within the total methamphetamine concentration found in waste water. The
aforementioned study estimated that in a particular region of the State of Washington,

51
only 3-8% of the methamphetamine found in waste water could be attributed to
Desoxyn.48 Although this value is theoretical and dependent on prescribed individuals
ingesting and excreting Desoxyn within the given area, it provides a relatively close
estimate of the maximum prescription methamphetamine that could be introduced to
sewage effluent.
The last potential contributor to methamphetamine within waste water, which is
the focal point of this chapter, are clandestine production laboratories. As explained
above, the One Pot methamphetamine production method is the primary technique of
choice among clandestine laboratories. Additionally, each manufacture of
methamphetamine has associated waste. Based on the results from Chapter 2, trace
amounts of product and byproducts are contained within the waste materials. If
individuals are disposing One Pot reaction waste down a sink drain, toilet, bath tub, etc.,
methamphetamine and related manufacturing compounds would be introduced to sewage
effluent.
Despite the many factors and sources of methamphetamine into the sewage water
system, the majority of studies attempting to monitor the use of methamphetamine
typically report the total concentrations found. For the purposes of this review, only
studies involving methamphetamine will be discussed. In 1999, Daughton, one of the
pioneers of waste water research, and a co-author Ternes, published a review that
essentially established the demand to detect pharmaceuticals in the environment.49
Following this call for research, several groups, across the United States and
internationally, began creating waste water projects. Recent work begins in 2008, where
a group developed a special technique to combine SPE and LC-MS/MS into one

52
workflow system. SPE was performed in such a way that the final step of eluting the
target compounds with a sample, traveled directly into the LC-MS/MS. Based on the
results, Postigo et al. were able to reach a limit of detection (LOD) within waste water for
amphetamine, methamphetamine, and ephedrine at 0.34, 0.28, and 0.78 ng/L,
respectively. And the limit of quantitation (LOQ) within waste water for the same
compounds were 0.92, 0.75, and 2.21 ng/L, respectively.50 An important note in this
project’s methodology is the use of only 5 mL per sample, which is likely attributed to
the combined SPE and LC-MS/MS system. The authors referenced that previous
research typically used between 100 and 500 mL of sample.50 Another impactful finding
from this project was the fact that the analysis of fortified chemistry-grade water
produced significantly better results than analysis of waste water samples. In conclusion,
this result demonstrates that the waste water itself, is suppressing the ability to detect
certain drug compounds. In 2014, research was done to further investigate the identified
suppression. According to Ostman et al., a 45-78% signal repression of drugs exists
within waste water analysis when compared to chemistry-grade water.51 Further
research, such as altering methodology, will need to be completed to avoid or reduce the
suppression.
While the research projects above demonstrated signal suppression and potential
drug LOD and LOQ values in waste water utilizing LC-MS/MS, another research group
utilized GC-MS/MS to perform a similar study. Gonzalez-Marino et al. compared and
determined the LOD of various drug compounds for different water sample types: river
water, treated waste water, and raw waste water. The LOD values for amphetamine were
determined to be 0.8, 3, and 7 ng/L, respectively, while the LOD values for

53
methamphetamine were 2, 7, and 7 ng/L, respectively.52 The detection cutoffs are not as
low as seen with LC-MS/MS, but this research demonstrates the ability to use different
instrumentation to achieve analytical detection. An additional benefit, as noted by the
authors, is that GC-MS/MS allows for a full spectra scan, which may be helpful in
research designed to detect as many drug compounds as possible. For a more direct
comparison of GC-MS and LC-MS/MS, Mwenesongle et al. performed a study in 2013
comparing the two instruments in regards to the ability to monitor drugs of abuse and
their metabolites using SPE followed by GC-MS. The results showed that GC-MS, in
this instance, produced better results than the LC-MS/MS. The LOQ for
methamphetamine was 0.33 picograms using GC-MS, and 208 picograms with LC-
MS/MS. Although this finding contradicts previous literature, it confirms the ability of
both instruments to detect trace amounts of methamphetamine within waste water.
In addition to research performed to determine the capabilities of analytical
instrumentation to quantify drugs of interest within waste water, other projects were
being conducted to determine drug consumption trends. In 2009, Banta-Green et al.
utilized waste water analysis to survey drug trends, particularly cocaine,
methamphetamine, and ecstasy, within a chosen population. Study design and results
primarily focused on regions within the population, and categorized them as urban,
suburban, and rural areas. Indicators and metabolites of cocaine and ecstasy were more
prominent in urban areas, but methamphetamine was present equally in all areas.53 Not
only do these findings demonstrate a successful campaign to detect target drug
compounds, but they also contribute to the confirmation of methamphetamine prevalence.
Shortly after this research, another group focused on illicit substances as well, but had the

54
goal of determining day-to-day consumption patterns. Zuccato et al. established that
“party-drugs” such as cocaine and ecstasy were more prominent in waste water collected
over the weekend as opposed to weekdays. Conversely, methamphetamine demonstrated
similar concentrations throughout the entire week.54 Another finding was the upward
trend of methamphetamine concentrations within waste water from 2005-2009.54 While
these two findings contribute to the capability of detecting drugs within sewage effluent,
the results also elaborate on methamphetamine prevalence within the community, similar
to the conclusions mentioned above.
In summary, many studies within the literature provide examples and processes of
analyzing both pharmaceutical and illicit compounds in waste water samples.
Additionally, several studies have focused on the amount or concentrations present for
specific compounds. As for methamphetamine, the studies above demonstrate high and
continued prevalence within populations. However, the methamphetamine values
obtained were attributed solely to human consumption. The research groups discussed
above either mentioned the potential for other sources of methamphetamine, or ignored
the fact completely. As stated earlier, another source of methamphetamine into sewage
effluent is clandestine laboratories. Whether individuals are dumping methamphetamine
product down the drain to avoid detection, or discarding manufacturing waste, indicators
of such activity could be identified via waste water analysis. Again, the overall goal of
this chapter is to determine the possibility of detecting One Pot method identifiers within
waste water as a means to locate the presence of a clandestine laboratory.
The One-Pot methamphetamine waste has only been quantitatively characterized
in the findings presented in Chapter 2. Based on LC-MS/MS results, the target

55
compounds to identify the presence of methamphetamine manufacturing would be
methamphetamine, pseudoephedrine, ephedrine, and CMP. Since three of the four
compounds present within One Pot manufacturing waste are commonly used and
excreted drugs, a challenge exists in distinguishing drug consumption versus drug
production. On the other hand, methamphetamine detection, in conjunction with the
detection of other manufacturing byproducts, could indicate the presence of
methamphetamine manufacturing. Since CMP was also identified within One Pot waste,
the detection of this byproduct may prove to be a key indicator of a clandestine
laboratory. The waste water analysis also needs to examine amphetamine, due to the
result of metabolism. Methamphetamine, in most instances, will be excreted 50%
unchanged or un-metabolized, while 10-20% of the methamphetamine will be converted
to amphetamine before excretion.47 Although the focal point of the waste water results
will be on the concurrent detection of methamphetamine and CMP, the amount of
amphetamine present may reveal the quantity of methamphetamine that should be
attributed to human consumption. Based on review of the literature, no research has been
conducted on sewage effluent to detect the presence of methamphetamine manufacturing.
As explained earlier, the prevalence of One Pot methamphetamine has created a public
and environmental safety demand to proactively find clandestine laboratories. With
knowledge of negligent dumping of hazardous reaction waste into sewage effluent, waste
water analysis may provide a means to locate and consequently remove One Pot
clandestine laboratories from communities before they can cause more harm to innocent
bystanders.

56
3.3 Methodology
Two side-by-side One Pot reactions were completed over a course of four days
for a total of 8 syntheses, labeled EE1-EE4 and CE1-CE4; “EE” and “CE” respectively
indicate “Ether Effluent” or “Camp Fuel Effluent” and the number indicates the
sequence. Following each reaction, lithium was removed and placed into 250 mL water
in a container labeled with the appropriate One Pot reaction designation and deemed
“lithium-in-water solution.” Sludge and post-salt solvent samples were collected as
described above in the methodology section of Chapter 2. Pre-salt solvent was
completely purged with hydrogen chloride gas and the filtered product salts were
removed and stored solely for laboratory analysis. In total, the One Pot reaction waste
materials recovered from each of the 8 methamphetamine salt syntheses included:
1) lithium-in-water solution,
2) sludge,
3) post-salt solvent.
These three liquid solutions together constituted the full methamphetamine production
waste from each One Pot reaction. EE1-EE3 and CE1-CE3 materials were set aside for
subsequent, controlled deposit into a municipal sewage water system. EE4 and CE4 were
stored for laboratory characterization analysis as described in Chapter 2.
A municipal lift station located within a mixed zone of commercial and industrial
buildings was chosen for sewage water sampling to attempt detection of the three
prepared liquid components of One Pot laboratory waste generated per synthesis. The
gravity-fed lift station is described as low flow (roughly 1500-3000 gallons per day) and
discharges to a 4-inch forced main. The lift station is comprised of an underground

57
concrete catchment tank, or wet well, which collects sewage water from the surrounding
commercial-industrial zone. The wet well is open to atmosphere and is fitted with a
ground level hatch opening, raised in the interior image seen in Figure 11.

58
Figure 11. Interior view of wet well at low flow lift station.

59
The wet well is equipped with submerged pumps to periodically pump the sewage water
to a higher elevation, ultimately directed towards the sewage water treatment plant, with
at least one additional and larger lift station downstream ahead of the waste treatment
plant in the municipality.
Lift station historical data logging statistics from the one-month time period prior
to the field study indicate approximately 3-4 pumpdowns of the wet well occur per day.
A pumpdown is the initiation of water pumps that activate when the water level in the
wet well reaches a certain maximum level. The pumps will continue pushing water out
of the lift station until a minimum water level is reached, thus ceasing the pump down. 3-
4 pumpdowns is an average number for this site, but 6 discrete pump starts were reported
to have occurred prior to one study day. Also available was an estimated discharge of
2666 gallons over the 6 reported pumpdowns for that day, so 444 gallons may be
calculated as an approximate volume per pumpdown. A monthly average suggests a
similar value of 438 gallons per pumpdown. An important note is the presence of a large
unknown volume of sewage water remaining in the wet well after each pumpdown.
Provided lift station design drawings suggest if roughly 400-450 gallons are pumped out
of the wet well as reported each pump cycle, that would closely match the volume that
always remains in the bottom of the well, serving, in part, as an important cooling fluid
surrounding the submersible pumps. Therefore, any compound concentrations generated
from laboratory results may potentially be skewed due to this unknown variable.
Prior to any experiments, several tests were performed to ensure experimental success. A
24-cartridge automated waste water sampler (Teledyne ISCO, Model 3700, Lincoln, NE)

60
was installed. The autosampler was placed at ground level beside the lift station wet well
hatch opening, see Figure 12.
Figure 12. Automated waste water sampler placed at ground level beside wet well.
The autosampler was modified to integrate a level transmitter and small programmable
electronic controller to sense falling water in the wet well and direct the sampler to
collect one sample during each pumpdown of the wet well; however, this modification
was unsuccessful during the study. Another autosampler program is collection of waste
water samples at designated time intervals, which demonstrated repeated success when
set to collect a sample every 15 minutes. Next, dye tests were performed to identify
sewage water travel time to the lift station from the selected manhole One Pot waste

61
material deposit site. Fluorscein Green Dye (Brainerd Chemical Company, Tulsa, OK)
was deposited into the sewage manhole located 646 feet upstream, and visible indication
of dyed water entry to the wet well, see Figure 13, was observed 21.5 minutes later.
Figure 13. Lift station wet well sewage inflow point during dye test.
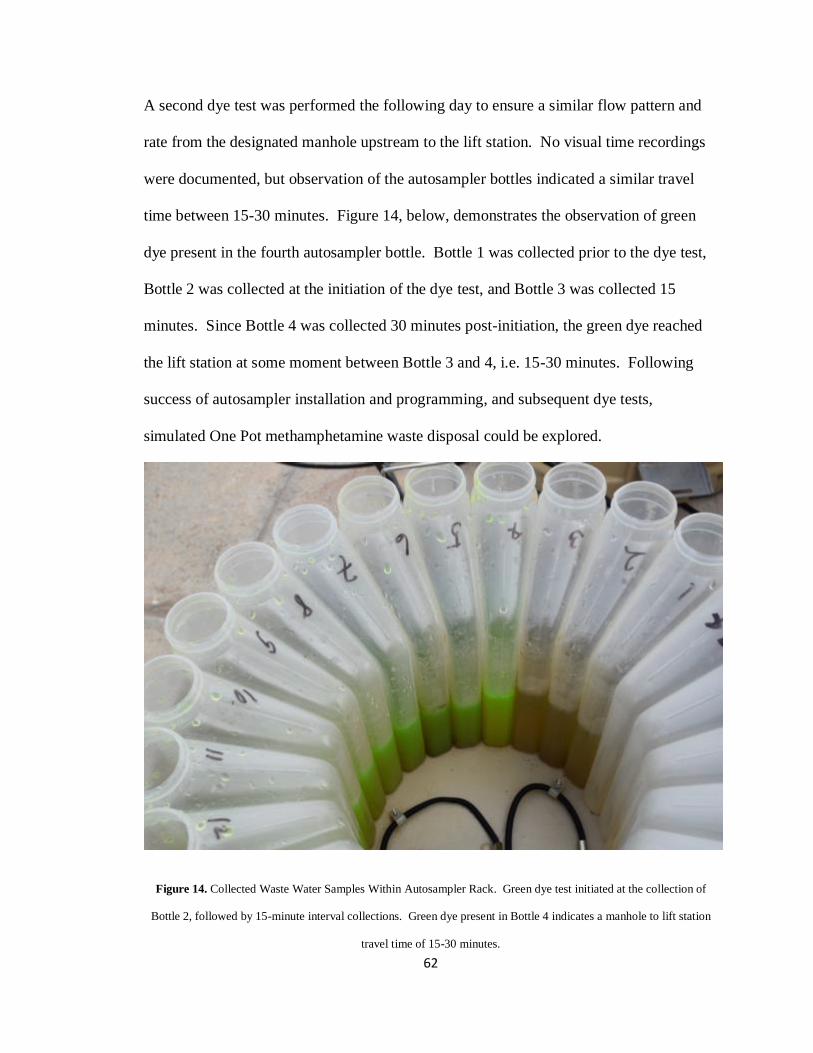
62
A second dye test was performed the following day to ensure a similar flow pattern and
rate from the designated manhole upstream to the lift station. No visual time recordings
were documented, but observation of the autosampler bottles indicated a similar travel
time between 15-30 minutes. Figure 14, below, demonstrates the observation of green
dye present in the fourth autosampler bottle. Bottle 1 was collected prior to the dye test,
Bottle 2 was collected at the initiation of the dye test, and Bottle 3 was collected 15
minutes. Since Bottle 4 was collected 30 minutes post-initiation, the green dye reached
the lift station at some moment between Bottle 3 and 4, i.e. 15-30 minutes. Following
success of autosampler installation and programming, and subsequent dye tests,
simulated One Pot methamphetamine waste disposal could be explored.
Figure 14. Collected Waste Water Samples Within Autosampler Rack. Green dye test initiated at the collection of
Bottle 2, followed by 15-minute interval collections. Green dye present in Bottle 4 indicates a manhole to lift station
travel time of 15-30 minutes.

63
One Pot methamphetamine reaction wastes were deposited once per day, over a
Tuesday, Wednesday, and Thursday period, into the street manhole located 646 feet
upstream of the low flow lift station over two consecutive weeks; diethyl ether reaction
wastes, EE1-EE3, were deposited the first week, camp fuel wastes, CE1-CE3, the
following week. One Pot reaction wastes were deposited each morning immediately
following collection of a background sewage water sample with the 24-cartridge
automated waste water sampler mentioned above.
After a background sample was collected each morning, One Pot waste liquids
were then deposited. The deposits included three One Pot waste products previously
explained, lithium-in-water solution, sludge, and post-salt solvent. Following initiation
of each experiment, 500 mL of sewage water were collected at 15-minute intervals from
the downstream lift station wet well for a period of three to four hours, resulting in 12-16
“Time Course” samples collected. Time Course samples were labeled with the
corresponding synthesis designation, EE or CE and reaction number, followed by a
period and autosampler bottle number. The bottle number corresponded to the
chronology at which the sewage water sample was collected. Bottle 1 was collected as a
background sample pre-deposit, Bottle 2 was collected at time equals 0 minutes, Bottle 3
was collected at time equals 15 minutes, and so on, in chronological order.
At mid-day, the Time Course sampling was halted and the autosampler was then
set to collect a sample upon receiving a “Pulse” signal from detection of falling water in
the wet well, i.e. a pumpdown event, reducing the sample collection burden over the
remainder of a 24-hour total collection period per waste deposit. However, this
modification was unsuccessful during the study as previously mentioned. The Pulse

64
program of the autosampler was inconsistent, and resulted in variable collection of
samples, if any, during each deposit experiment. Any Pulse samples collected were
labeled following the same chronological pattern as mentioned above, but the bottle
numbers began sequentially after the last Time Course sample collected for that specific
deposit. For example, if the last Time Course sample was collected in bottle 12, the first
Pulse sample collected would be labeled as 13, with of course, additional designating
information like solvent type and deposit number.
A sampling summary, of both Time Course and Pulse samples, can be found in
Table 11. All samples listed below were transferred to new and separate containers for
transport back to OSU-FTTL. Each sample was stored in a freezer until laboratory
analysis.
Table 11. Sewage Water Sample Collection. Included for each One Pot methamphetamine waste deposit are the date,
time of deposit, sample collection start time, number of time course samples collected, and number of pulse samples
collected.
Deposit Date
Deposit
Start Time
Sample Collection
Start Time
Time Course
Samples
Pulse
Samples
EE1 7/26/16 8:20 AM 8:05 AM 12 0
EE2 7/27/16 7:35 AM 7:24 AM 15 7
EE3 7/28/16 7:26 AM 7:18 AM 16 24
CE1 8/2/16 7:29 AM 7:19 AM 12 0
CE2 8/3/16 7:29 AM 7:21 AM 12 10
CE3 8/4/16 7:29 AM 7:23 AM 12 16

65
For SPE, the following materials and machines were utilized: Oasis MCX 3 cc
cartridges (Waters Corporation, 60 mg, 30 m), CEREX 48 Flow Control (SPEware
Corporation, Baldwin Park, CA), and CEREX 48 Sample Concentrator (SPEware). The
following solutions were utilized: Internal Standard Mix (1000 ng/mL solution of all four
deuterated internal standards in LC-MS grade water), 10 mM hydrochloric acid solution
prepared with 37% HCl and LC-MS grade water, LC-MS grade methanol, and Mobile
Phase A. For every sample, 10 L of Internal Standard Mix and 200 µL of 10 mM
hydrochloric acid solution were added to 2 mL of sample. Following sample preparation,
Table 12 ,below, outlines each section of the solid phase extraction procedure. SPE
cartridges were conditioned prior to sample addition. After a rinse step, cartridges were
dried under positive pressure for 20 minutes at approximately 80 psi. After being
vacuum dried, elution buffer was added and the eluent was collected into labeled test
tubes. Samples were dried to complete dryness under nitrogen at 40 oC. Reconstitution
buffer was added to each test tube and following thorough vortexing, every sample was
transferred to an LC injection vial for LC-MS/MS analysis. The LC-MS/MS instrument
methodology is the same as described in Chapter 2.
Table 12. Solid Phase Extraction Procedure.
SPE Step Parameter
Sample Preparation 10 L Internal Standard Mix
200 L 10 mM HCL
Condition 2 mL LC-MS grade methanol

66
2 mL 10 mM HCL
2 mL 10 mM HCL
Sample Addition 2 mL sample
Rinse 2 mL 10 mM HCL
Cartridge Dry Down 20 min at ~80 psi
Elution 2 mL 2% ammonium hydroxide in methanol
Elution Dry Down Under nitrogen at 40ºC
Reconstitution 100 L Mobile Phase A
The validation of the SPE method contained three tests: linearity, accuracy and
precision, and matrix effects. Each of these is explained below. The quantitation ratios,
the ratio of the larger transition area to the internal standard transition area, from the
calibrators that met the identification criteria were plotted versus concentration. After the
data were plotted, they were fitted with a best fit line, and weightings were adjusted to
assure the best correlation, or highest R-squared or R2 value. The R2 for this line was
required to be greater than 0.9. For the calibration points to be included in this study,
they had to have an accuracy and precision within 30% when applied to the line of best
fit. The limit of quantitation, or LOQ, was allowed to be within 30% for both accuracy
and precision, though its instrument response had to be at least five times greater than the
response of a blank. The linear range for all non-internal standard compounds in the LC-
MS/MS method mentioned above contained the following calibrator points: 100, 50, 25,
5, 1, 0.5, and 0.1 ng/mL of each drug compound.

67
Six replicates of the calibration curve were extracted and concentrations values
were calculated for each calibrator. Accuracy for each calibrator was calculated by
averaging the concentration of the six replicates and dividing that average by the
theoretical concentration of each calibrator. Precision for each calibrator was calculated
by dividing the standard deviation average by the calculation average and subtracting that
value from 1. R2 values for each calibration curve were obtained after applying a best fit
line, and all values averaged for a given compound. The concentration values, mentioned
above, were obtained utilizing MultiQuant software (SCIEX, Foster City, CA), which is
specifically designed for LC-MS/MS result analysis. All other values and statistical
parameters were obtained by utilizing Microsoft Excel (Microsoft Corporation,
Redmond, WA).
An accuracy and precision study was performed to provide information regarding
the accuracy and precision, or variability, in the SPE process. To pass the accuracy and
precision study, the average values for each point had to be within 30% of the true value.
Two quality control (QC) points were used for the accuracy and precision study. QCA
had a concentration of 50 ng/mL and QCB had a concentration of 1 ng/mL. Each QC
was analyzed four times a day for six days. The first two analyses occurred at the
beginning of the day and the second two occurred at the end of the day. Values for QC
points were obtained using MultiQuant software. Concentrations for each QC analysis
were used in Microsoft Excel to obtain accuracy, within-run precision, between run
precision, intraday precision, interday precision and within-laboratory precision.
Matrix effects are a type of assay interference caused by ion suppression or ion
enhancement in the matrix. To test for matrix effects, the analytical results of five

68
injections of compounds that did not undergo extraction, labeled as “neat,” were
compared to injections of five individual water samples that were from different sources,
were known to be free of the compounds of interest, and were fortified with compounds
after extraction. The neat and post-extraction fortified samples were designated as
sample set 1 and sample set 2, respectively. Matrix effect (ME) was calculated by
dividing the average peak area of the water samples fortified after extraction by the
average peak area of the compound in neat solution and multiplying by 100. The ME
value takes into account any ion suppression or enhancement. The 10 ng/mL calibrator
was used in this experiment. To prepare sample set 1, methamphetamine, CMP,
pseudoephedrine, ephedrine, and amphetamine drug standards, mentioned above, were
diluted in deionized water at 200 ng/mL. Although this concentration does not match the
calibrator being using in this study, the fortification of the neat sample is increased to 200
ng/mL to account for the simulation of a sample with 100% extraction efficiency, being a
2 mL sample at 10 ng/mL. For sample set 2, the known blank water samples were spiked
with 200 ng/mL of the same five compounds used in sample set 1.
During the matrix effects study, recovery efficiency (RE) was also performed.
RE demonstrates how well the sample is recovered during SPE. To test for RE, the
analytical results of five individual water samples from different sources, which were
known to be free of the compounds of interest and were fortified at the 10 ng/mL level
before extraction, designated as sample set 3, were compared to sample set 2 in the ME
study. RE was calculated by dividing the average peak area of water samples fortified
before the extraction by the average peak area of water samples fortified after extraction
and multiplying by 100.

69
Process efficiency (PE) or how well the SPE process functions in the way of
detecting the compounds of interest, was also determined during the matrix effects study.
To test for PE, the analytical results of five injections of compounds that were in sample
set 1 were compared to injections of five individual water samples that were in sample set
3. PE was calculated by dividing the average peak area of water samples fortified before
extraction by the average peak area of the compounds in neat solution and multiplying by
100.
Currently, there is no defined limit for acceptable matrix effects, recovery
efficiency, or process efficiency. For this study, a range of 60-140% was considered
acceptable. If values were out of the plus or minus 40% range when averaged across
each matrix source, the compounds were evaluated in the other precision and accuracy
studies to determine that there was sufficient sensitivity and selectivity in the method for
sewage water analysis. In summary, Table 13 outlines sample specifics in each sample
set.
Table 13. Matrix Effects Study Sample List. Table includes the water sample source, as well as the concentration at
which each sample was fortified with drug compounds of interest.
Sample Set Water Sample Drug Concentration
1 LC-MS Grade 200 ng/mL, un-extracted
2 Source 1 200 ng/mL, post-extraction
Source 2 200 ng/mL, post-extraction
Source 3 200 ng/mL, post-extraction
Source 4 200 ng/mL, post-extraction

70
Source 5 200 ng/mL, post-extraction
3 Source 1 10 ng/mL, pre-extraction
Source 2 10 ng/mL, pre-extraction
Source 3 10 ng/mL, pre-extraction
Source 4 10 ng/mL, pre-extraction
Source 5 10 ng/mL, pre-extraction
Sewage water samples, selectively chosen from each One Pot waste deposit, were sent to
SRNL for analysis. The samples included a background sample from each deposit as well as two
samples that were likely to exhibit the largest concentration of target compounds. After arriving
at SRNL, the waste water samples were dissolved and heated in 5% nitric acid in preparation for
lithium analysis; sample weights and volumes are as listed in Table 14. In addition, the table
provides a list of which samples were sent to and analyzed by SRNL staff. The dissolutions were
analyzed on an Agilent 7700x Inductively Coupled Plasma Mass Spectrometer (ICP-MS)
equipped with a helium collision cell. High Purity standard solutions that consisted of 52
elements at concentrations of blank, 1, 5, 10, 25, and 50 parts-per-billion (ppb) in 2% nitric acid
were used to calibrate the instrument. The dissolutions were diluted by a factor of ten in 2%
nitric acid for analysis on the instrument.
Table 14. Weight and volume of sewage water samples prepared for ICPMS analysis.
Sample Sample Weight (g) Total Volume (mL)
CE 1-1 4.83 100

71
CE 1-4 4.75 100
CE 1-5 4.72 100
CE 2-1 4.78 100
CE 2-4 4.77 100
CE 2-5 4.75 100
CE 3-1 3.72 100
CE 3-4 4.71 100
CE 3-5 4.81 100
EE 2-1 4.78 100
EE 2-4 4.84 100
EE 2-5 4.42 100
EE 4-1 4.75 100
EE 4-4 4.71 100
EE 4-5 4.70 100
EE 6-1 4.83 100
EE 6-4 4.84 100
EE 6-5 4.80 100
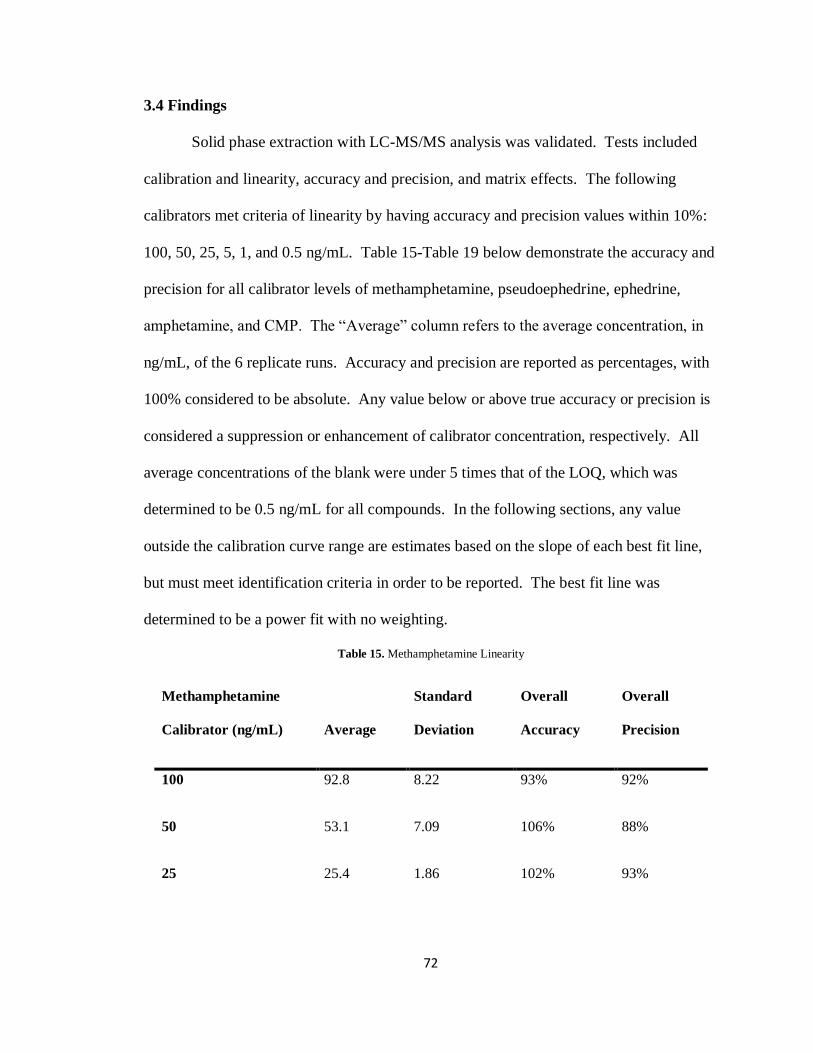
72
3.4 Findings
Solid phase extraction with LC-MS/MS analysis was validated. Tests included
calibration and linearity, accuracy and precision, and matrix effects. The following
calibrators met criteria of linearity by having accuracy and precision values within 10%:
100, 50, 25, 5, 1, and 0.5 ng/mL. Table 15-Table 19 below demonstrate the accuracy and
precision for all calibrator levels of methamphetamine, pseudoephedrine, ephedrine,
amphetamine, and CMP. The “Average” column refers to the average concentration, in
ng/mL, of the 6 replicate runs. Accuracy and precision are reported as percentages, with
100% considered to be absolute. Any value below or above true accuracy or precision is
considered a suppression or enhancement of calibrator concentration, respectively. All
average concentrations of the blank were under 5 times that of the LOQ, which was
determined to be 0.5 ng/mL for all compounds. In the following sections, any value
outside the calibration curve range are estimates based on the slope of each best fit line,
but must meet identification criteria in order to be reported. The best fit line was
determined to be a power fit with no weighting.
Table 15. Methamphetamine Linearity
Methamphetamine
Calibrator (ng/mL) Average
Standard
Deviation
Overall
Accuracy
Overall
Precision
100 92.8 8.22 93% 92%
50 53.1 7.09 106% 88%
25 25.4 1.86 102% 93%

73
5 4.55 0.45 91% 91%
1 0.94 0.10 94% 90%
0.5 0.54 0.04 107% 94%
Blank* 0.01
R2 0.98
Table 16. Pseudoephedrine Linearity
Pseudoephedrine
Calibrator (ng/mL) Average
Standard
Deviation
Overall
Accuracy
Overall
Precision
100 96.6 9.37 97% 91%
50 52.2 6.37 104% 89%
25 26.0 2.34 104% 92%
5 4.97 0.55 99% 90%
1 0.91 0.10 91% 90%
0.5 0.49 0.03 98% 94%
Blank* 0.00
R2 0.99
Table 17. Ephedrine Linearity
Ephedrine Calibrator (ng/mL) Average Standard Overall Overall

74
Deviation Accuracy Precision
100 102 9.83 102% 91%
50 52.3 3.49 105% 94%
25 25.0 1.95 100% 93%
5 4.65 0.30 93% 94%
1 0.95 0.08 95% 93%
0.5 0.52 0.04 104% 92%
Blank* 0.08
R2 1.00
Table 18. Amphetamine Linearity
Amphetamine Calibrator
(ng/mL) Average
Standard
Deviation
Overall
Accuracy
Overall
Precision
100 96.6 8.98 97% 92%
50 51.6 3.74 103% 93%
25 25.6 2.51 102% 91%
5 4.85 0.27 97% 95%
1 0.98 0.07 98% 93%
0.5 0.53 0.06 107% 89%
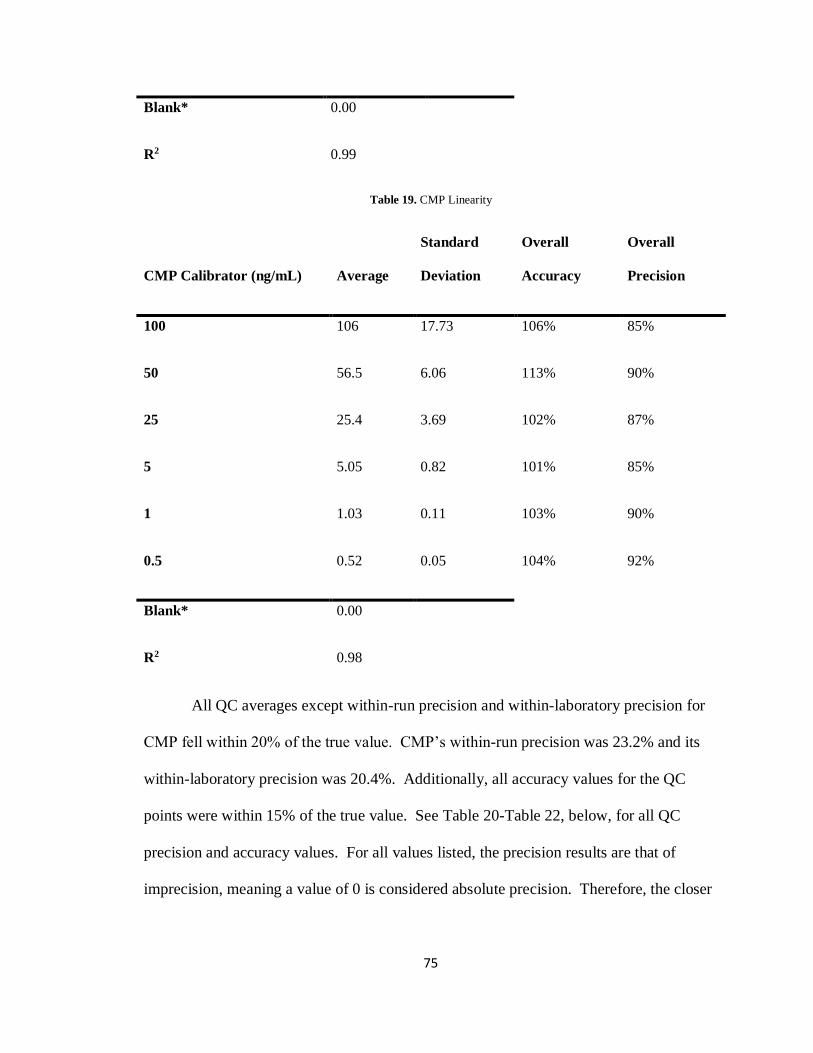
75
Blank* 0.00
R2 0.99
Table 19. CMP Linearity
CMP Calibrator (ng/mL) Average
Standard
Deviation
Overall
Accuracy
Overall
Precision
100 106 17.73 106% 85%
50 56.5 6.06 113% 90%
25 25.4 3.69 102% 87%
5 5.05 0.82 101% 85%
1 1.03 0.11 103% 90%
0.5 0.52 0.05 104% 92%
Blank* 0.00
R2 0.98
All QC averages except within-run precision and within-laboratory precision for
CMP fell within 20% of the true value. CMP’s within-run precision was 23.2% and its
within-laboratory precision was 20.4%. Additionally, all accuracy values for the QC
points were within 15% of the true value. See Table 20-Table 22, below, for all QC
precision and accuracy values. For all values listed, the precision results are that of
imprecision, meaning a value of 0 is considered absolute precision. Therefore, the closer
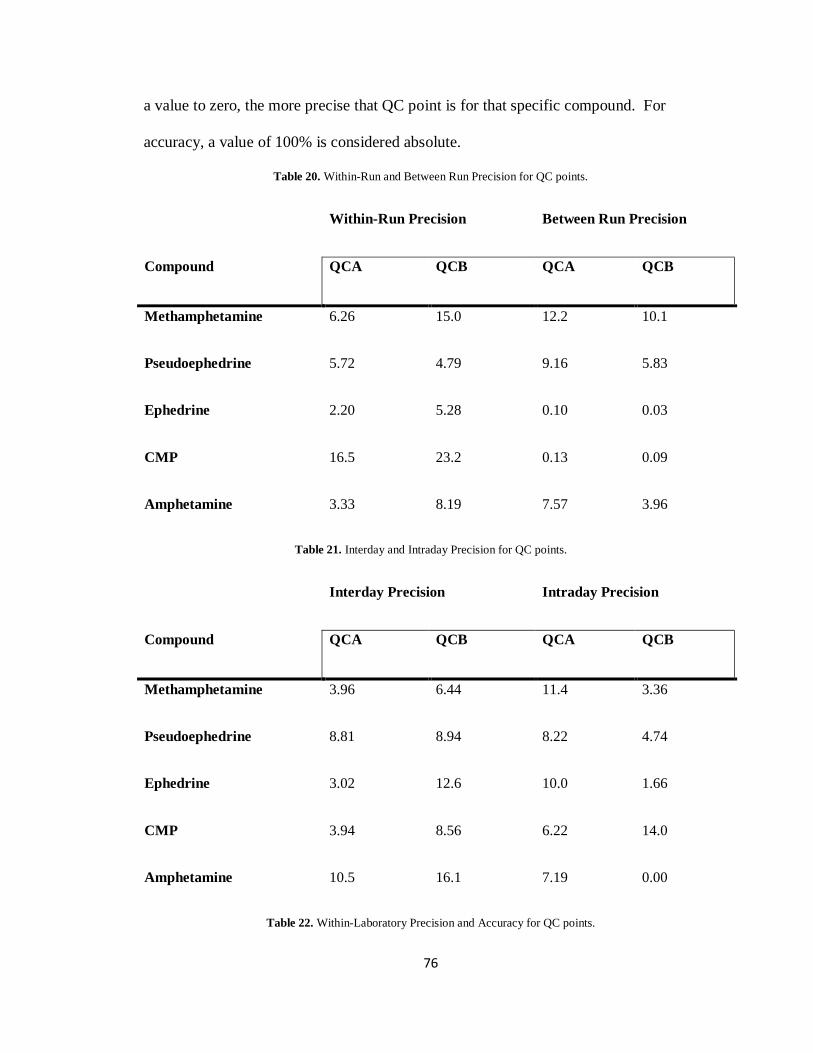
76
a value to zero, the more precise that QC point is for that specific compound. For
accuracy, a value of 100% is considered absolute.
Table 20. Within-Run and Between Run Precision for QC points.
Within-Run Precision Between Run Precision
Compound QCA QCB QCA QCB
Methamphetamine 6.26 15.0 12.2 10.1
Pseudoephedrine 5.72 4.79 9.16 5.83
Ephedrine 2.20 5.28 0.10 0.03
CMP 16.5 23.2 0.13 0.09
Amphetamine 3.33 8.19 7.57 3.96
Table 21. Interday and Intraday Precision for QC points.
Interday Precision Intraday Precision
Compound QCA QCB QCA QCB
Methamphetamine 3.96 6.44 11.4 3.36
Pseudoephedrine 8.81 8.94 8.22 4.74
Ephedrine 3.02 12.6 10.0 1.66
CMP 3.94 8.56 6.22 14.0
Amphetamine 10.5 16.1 7.19 0.00
Table 22. Within-Laboratory Precision and Accuracy for QC points.

77
Within-Laboratory Precision Accuracy
Compound QCA QCB QCA QCB
Methamphetamine 13.6 16.0 105% 89%
Pseudoephedrine 13.3 11.2 104% 97%
Ephedrine 10.7 13.6 105% 99%
CMP 18.1 20.4 113% 112%
Amphetamine 13.2 17.6 106% 100%
All five compounds of interest passed the matrix effect (ME) study, but the same
is not true for recovery efficiency (RE) and process efficiently (PE). Methamphetamine
and CMP both failed RE and PE tests, while amphetamine only failed PE. All values
listed in Table 23 were calculated using the peak area for all compounds. All matrix
effect samples had ME, RE, and PE corrected by dividing the peak area observed for
each compound by the peak area of the corresponding internal standard. The resulting
ratio, known as the quantitation ratio, was then used in place of the respective sets used in
ME, RE, and PE calculations. The quantitation ratios obtained from the internal standard
correction passed all ME, RE, and PE studies. All ME, RE, and PE percentages for the
peak area comparisons and the quantitation ratio comparisons are given in Table 24.
Table 23. Matrix Effects, Recovery Efficiency, and Process Efficiency. All calculations used peak areas for
methamphetamine, pseudoephedrine, ephedrine, CMP, and amphetamine.
Area

78
Compound Matrix Effects Recovery Efficiency Process Efficiency
Methamphetamine 84% 55% 46%
Pseudoephedrine 101% 78% 78%
Ephedrine 93% 75% 70%
CMP 99% 32% 32%
Amphetamine 93% 62% 58%
Table 24. Matrix Effects, Recovery Efficiency, and Process Efficiency. All calculations used quant ratios for
methamphetamine, pseudoephedrine, ephedrine, CMP, and amphetamine.
Quant Ratio
Compound Matrix Effects Recovery Efficiency Process Efficiency
Methamphetamine 103% 105% 109%
Pseudoephedrine 99.0% 96.5% 95.5%
Ephedrine 98.4% 97.3% 95.8%
CMP 117% 65.4% 76.4%
Amphetamine 103% 98.9% 102%
Time course samples were collected for every One Pot methamphetamine waste
deposit. These included three reactions using diethyl ether and three using camp fuel,
labeled EE1-3 and CE1-3, respectively. Table 25-Table 30 below lists all time course
sample concentrations following SPE and LC-MS/MS analysis. For all tables, samples
are labeled with deposit type and number, followed by the autosampler bottle number

79
after the period. As explained previously, Bottle 1 was collected before each deposit and
the consecutive bottle numbers were collected at succeeding 15 minute-intervals. All
values listed are in ng/mL. Any result listed below a value of 0.5 ng/mL, or the LOQ, is
outside of the calibration range; however, an estimated value was listed if the
chromatographic peak met identification criteria. These values are denoted with a single
asterisk in the tables below. All negative samples are listed as 0.00.
Table 25. EE1 Time Course Samples. All values reported in ng/ml.
Sample
Time
from
Deposit
(min) Methamphetamine Pseudoephedrine Ephedrine CMP Amphetamine
EE1.1 -15 0.10* 0.09* 0.05* 0.00 0.25*
EE1.2 0 0.09* 0.04* 0.02* 0.00 0.14*
EE1.3 15 0.11* 0.05* 0.05* 0.00 0.20*
EE1.4 30 5.37 1.78 7.67 0.70 0.18*
EE1.5 45 2.16 1.02 3.65 0.35* 0.13*
EE1.6 60 1.71 0.63 2.36 0.28* 0.17*
EE1.7 75 1.13 0.43* 1.75 0.26* 0.12*
EE1.8 90 1.24 0.43* 1.74 0.23* 0.15*
EE1.9 105 1.17 0.36* 1.63 0.21* 0.16*

80
EE1.10 120 0.96 0.32* 1.26 0.17* 0.18*
EE1.11 135 0.91 0.66 1.14 0.14* 0.14*
EE1.12 150 0.80 0.38* 1.11 0.17* 0.38*
Table 26. EE2 Time Course Samples. All values reported in ng/ml.
Sample
Time
from
Deposit
(min) Methamphetamine Pseudoephedrine Ephedrine CMP Amphetamine
EE2.1 -15 0.34* 1.19 0.53 0.00 0.33*
EE2.2 0 0.28* 1.54 1.08 0.00 0.29*
EE2.3 15 0.27* 1.03 0.48* 0.00 0.28*
EE2.4 30 0.31* 0.99 0.29* 0.00 0.30*
EE2.5 45 3.09 1.73 5.74 0.28* 0.33*
EE2.6 60 2.47 1.50 4.45 0.25* 0.30*
EE2.7 75 5.10 1.97 10.0 0.44* 0.33*
EE2.8 90 5.86 2.42 12.5 0.56 0.25*
EE2.9 105 6.05 2.19 11.4 0.57 0.25*
EE2.10 120 5.38 2.00 10.2 0.51 0.24*
EE2.11 135 4.46 1.72 8.70 0.46* 0.24*

81
EE2.12 150 4.50 1.81 8.35 0.43* 0.24*
EE2.13 165 3.24 1.38 5.99 0.33* 0.22*
EE2.14 180 1.40 0.59 2.61 0.18* 0.18*
EE2.15 195 1.33 0.62 2.43 0.14* 0.53
Table 27. EE3 Time Course Samples.
Sample
Time
from
Deposit
(min) Methamphetamine Pseudoephedrine Ephedrine CMP Amphetamine
EE3.1 -15 0.62 0.40* 1.01 0.00 0.26*
EE3.2 0 0.60 0.34* 1.00 0.00 0.26*
EE3.3 15 0.45* 0.29* 0.69 0.00 0.21*
EE3.4 30 0.74 0.51 1.45 0.05* 0.28*
EE3.5 45 6.90 2.41 13.8 0.35* 0.24*
EE3.6 60 6.56 2.50 12.5 0.38* 0.19*
EE3.7 75 4.23 1.35 7.35 0.24* 0.26*
EE3.8 90 2.98 0.97 5.66 0.16* 0.19*
EE3.9 105 2.91 1.06 5.42 0.17* 0.19*
EE3.10 120 2.71 0.96 4.93 0.18* 0.21*

82
EE3.11 135 2.43 0.80 4.53 0.15* 0.24*
EE3.12 150 2.19 0.73 3.87 0.13* 0.20*
EE3.13 165 1.89 0.72 3.63 0.12* 0.17*
EE3.14 180 1.62 0.54 2.97 0.13* 0.16*
EE3.15 195 1.54 0.57 3.16 0.09* 0.61
EE3.16 210 1.32 0.54 2.47 0.10* 0.39*
Table 28. CE1 Time Course Samples
Sample
Time
from
Deposit
(min) Methamphetamine Pseudoephedrine Ephedrine CMP Amphetamine
CE1.1 -15 0.96 0.84 1.28 0.00 0.18*
CE1.2 0 0.92 0.87 0.98 0.00 0.16*
CE1.3 15 0.87 0.79 0.84 0.00 0.13*
CE1.4 30 1.12 0.85 1.02 0.00 0.16*
CE1.5 45 41.4 18.1 68.9 0.25* 0.21*
CE1.6 60 18.0 7.11 26.3 0.17* 0.23*
CE1.7 75 16.3 6.59 24.4 0.17* 0.21*
CE1.8 90 15.4 5.78 22.2 0.13* 0.20*

83
CE1.9 105 14.8 8.37 22.0 0.15* 0.21*
CE1.10 120 9.60 7.41 14.3 0.10* 0.16*
CE1.11 135 7.83 6.83 11.2 0.08* 0.17*
CE1.12 150 7.18 4.81 10.7 0.08* 0.14*
Table 29. CE2 Time Course Samples.
Sample
Time
from
Deposit
(min) Methamphetamine Pseudoephedrine Ephedrine CMP Amphetamine
CE2.1 -15 0.74 1.53 0.94 0.00 0.15*
CE2.2 0 0.74 1.41 0.90 0.00 0.14*
CE2.3 15 0.55 1.08 0.64 0.00 0.10*
CE2.4 30 1.43 2.38 3.55 0.00 0.14*
CE2.5 45 17.1 18.9 88.4 0.19* 0.16*
CE2.6 60 7.78 10.6 36.4 0.11* 0.14*
CE2.7 75 6.50 7.48 25.1 0.10* 0.26*
CE2.8 90 5.81 6.96 23.7 0.08* 0.24*
CE2.9 105 5.06 7.05 21.7 0.05* 0.24*
CE2.10 120 5.01 6.45 21.7 0.07* 0.22*
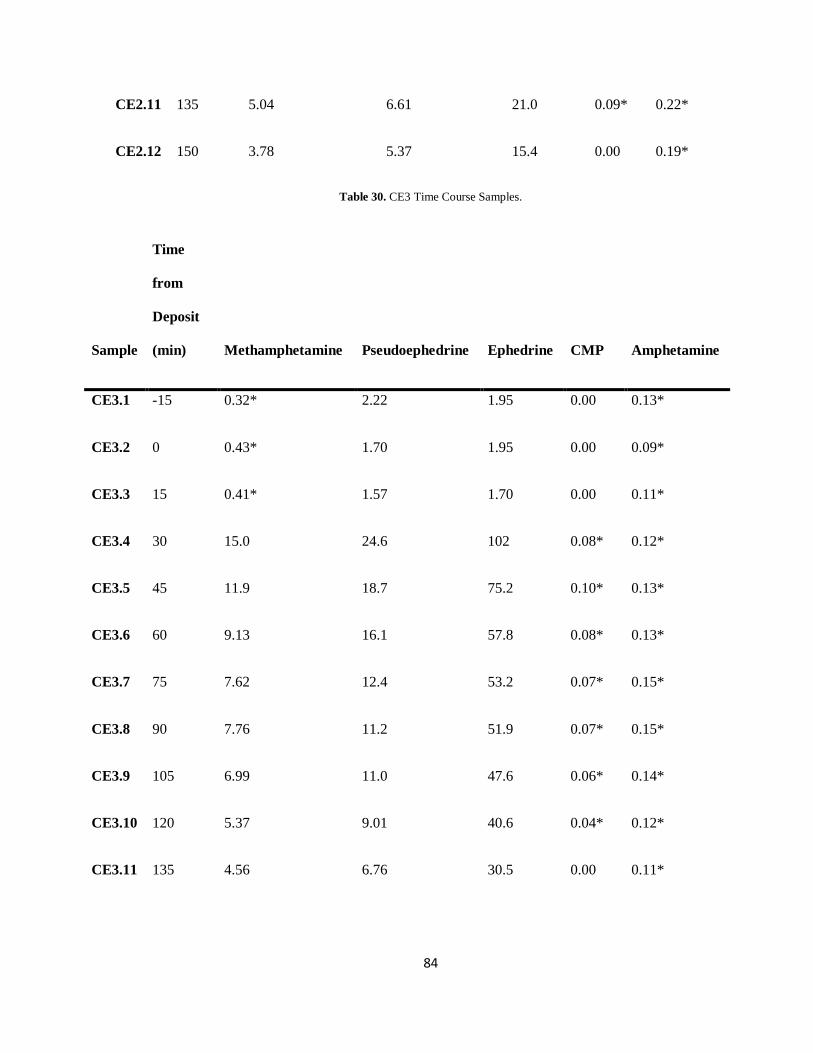
84
CE2.11 135 5.04 6.61 21.0 0.09* 0.22*
CE2.12 150 3.78 5.37 15.4 0.00 0.19*
Table 30. CE3 Time Course Samples.
Sample
Time
from
Deposit
(min) Methamphetamine Pseudoephedrine Ephedrine CMP Amphetamine
CE3.1 -15 0.32* 2.22 1.95 0.00 0.13*
CE3.2 0 0.43* 1.70 1.95 0.00 0.09*
CE3.3 15 0.41* 1.57 1.70 0.00 0.11*
CE3.4 30 15.0 24.6 102 0.08* 0.12*
CE3.5 45 11.9 18.7 75.2 0.10* 0.13*
CE3.6 60 9.13 16.1 57.8 0.08* 0.13*
CE3.7 75 7.62 12.4 53.2 0.07* 0.15*
CE3.8 90 7.76 11.2 51.9 0.07* 0.15*
CE3.9 105 6.99 11.0 47.6 0.06* 0.14*
CE3.10 120 5.37 9.01 40.6 0.04* 0.12*
CE3.11 135 4.56 6.76 30.5 0.00 0.11*

85
Additionally, Pulse samples were collected for deposits EE2, EE3, CE2, and CE3.
EE1 and CE1 experienced sampling errors during the pulse collection period and no
Pulse samples were collected by the autosampler. Table 31-Table 34 below lists all Pulse
sample concentrations following SPE and LC-MS/MS analysis. For all tables, samples
are labeled with deposit type and number, followed by the autosampler bottle number
after the period. The bottle number begins after each deposit’s Time Course sample
count. As noted previously, Pulse samples are chronological, but not associated with a
known time within the final 20-21 hour collection window. All values listed are in
ng/mL. Any result listed below a value of 0.5 is outside of the calibration range;
however, an estimated value was listed if the chromatographic peak met identification
criteria. These values are denoted with a single asterisk in the tables below. All negative
samples are listed as 0.00.
Table 31. EE2 Pulse Samples.
Sample Methamphetamine Pseudoephedrine Ephedrine CMP Amphetamine
EE2.16 0.32* 0.19* 0.76 0.00 0.25*
EE2.17 0.29* 0.10* 0.34* 0.00 0.19*
EE2.18 0.48* 0.26* 0.56 0.00 0.24*
EE2.19 0.19* 0.08* 0.14* 0.00 0.12*
EE2.20 0.22* 0.09* 0.18* 0.00 0.19*
CE3.12 150 4.14 6.87 37.0 0.00 0.10*

86
EE2.21 0.28* 0.11* 0.33* 0.00 0.30*
EE2.22 0.18* 0.09* 0.17* 0.00 0.19*
Table 32. EE3 Pulse Samples.
Sample Methamphetamine Pseudoephedrine Ephedrine CMP Amphetamine
EE3.17 0.62 0.15* 0.42* 0.00 0.17*
EE3.18 0.43* 0.12* 0.39* 0.00 0.14*
EE3.19 0.50 0.15* 0.46* 0.00 0.16*
EE3.20 1.59 0.81 0.28* 0.00 0.16*
EE3.21 1.02 0.55 0.29* 0.00 0.17*
EE3.22 1.38 0.71 0.33* 0.00 0.20*
EE3.23 0.35* 0.18* 0.25* 0.00 0.11*
EE3.24 0.47* 0.19* 0.28* 0.00 0.13*
EE3.25 0.45* 0.22* 0.27* 0.00 0.13*
EE3.26 0.73 0.41* 0.47* 0.00 0.13*
EE3.27 1.37 0.22* 0.45* 0.00 0.36*
EE3.28 0.65 0.12* 0.32* 0.00 0.18*
EE3.29 1.26 0.36* 0.57 0.00 0.32*
EE3.30 0.62 0.49* 0.35* 0.00 0.19*

87
EE3.31 0.25* 0.25* 0.24* 0.00 0.15*
EE3.32 0.30* 0.26* 0.24* 0.00 0.11*
EE3.33 0.25* 0.28* 0.24* 0.00 0.10*
EE3.34 0.19* 0.28* 0.24* 0.00 0.15*
EE3.35 0.17* 0.27* 0.27* 0.00 0.17*
EE3.36 0.16* 0.31* 0.29* 0.00 0.14*
EE3.37 0.18* 0.40* 0.30* 0.00 0.12*
EE3.38 0.26* 0.56 0.26* 0.00 0.18*
EE3.39 0.13* 0.43* 0.27* 0.00 0.14*
EE3.40 0.20* 0.80 0.36* 0.00 0.17*
Table 33. CE2 Pulse Samples.
Sample Methamphetamine Pseudoephedrine Ephedrine CMP Amphetamine
CE2.13 1.26 2.85 5.11 0.00 0.34*
CE2.14 0.57 1.16 1.84 0.00 0.18*
CE2.15 0.45* 1.05 1.62 0.00 0.15*
CE2.16 0.44* 0.87 2.13 0.00 0.15*
CE2.17 0.54 1.60 1.92 0.00 0.22*
CE2.18 1.47 3.62 5.01 0.00 0.30*

88
CE2.19 1.28 4.14 4.80 0.00 0.32*
CE2.20 0.30* 0.67 0.51 0.00 0.15*
CE2.21 0.32* 0.63 0.69 0.00 0.18*
CE2.22 0.31* 0.78 0.94 0.00 0.11*
Table 34. CE3 Pulse Samples.
Sample Methamphetamine Pseudoephedrine Ephedrine CMP Amphetamine
CE3.13 4.63 7.59 21.9 0.00 0.27*
CE3.14 3.21 5.17 17.7 0.00 0.22*
CE3.15 2.50 4.78 12.7 0.00 0.23*
CE3.16 2.32 4.18 9.70 0.00 0.25*
CE3.17 1.68 2.73 5.52 0.00 0.22*
CE3.18 1.03 1.77 2.96 0.00 0.19*
CE3.19 2.92 5.06 5.71 0.00 0.37*
CE3.20 3.34 5.04 5.24 0.00 0.19*
CE3.21 3.48 5.07 5.32 0.00 0.18*
CE3.22 1.57 2.54 2.59 0.00 0.30*
CE3.23 1.18 1.81 2.27 0.00 0.19*
CE3.24 3.32 1.39 1.89 0.00 0.31*

89
CE3.25 2.01 0.64 0.84 0.00 0.32*
CE3.26 2.30 0.55 0.79 0.00 0.34*
CE3.27 2.24 0.61 0.79 0.00 0.36*
CE3.28 0.71 0.88 0.45* 0.00 0.23*
In comparing the two solvent types, the highest or maximum concentrations for
each One Pot methamphetamine waste deposit type, diethyl ether or camp fuel, are listed
in Table 35 below. Any result listed below a value of 0.5 ng/mL is outside of the
calibration range; however, an estimated value was listed if the chromatographic peak
met identification criteria. These values are denoted with a single asterisk in the table
below. All values are listed in ng/mL.
Table 35. Average maximum concentrations (ng/mL) observed for methamphetamine, CMP, pseudoephedrine,
ephedrine, and amphetamine in sewage water samples collected after diethyl ether and camp fuel One Pot waste
deposits.
Compound EE Max Conc. CE Max Conc.
Methamphetamine 6.11 24.50
CMP 0.55 0.18*
Pseudoephedrine 2.33 20.53
Ephedrine 11.32 86.43
Amphetamine 0.51 0.21*
Statistical analysis of a two-population t-test, comparing the average maximum
compound concentrations of EE1-EE3 and CE1-CE3, produced the corresponding results

90
listed below in Table 36. Calculated p-values demonstrated no significant difference in
the maximum concentration detected for methamphetamine, but the remaining
compounds proved to be statistically different. CMP and amphetamine were not
statistically compared because the average value of Camp Fuel samples was below the
LOQ.
Table 36. Statistical Comparison of Ether and Camp Fuel Effluent Samples. All values listed in the “EE” and “CE” are
in ng/mL and represent the average maximal concentration of the corresponding drug detecting in waste water. A two-
population t-test was performed to compare the mean average concentration of ether and camp fuel for
methamphetamine, pseudoephedrine, and ephedrine. A generated p-value less than 0.05 translates to a statistical
difference between the two solvent types. A p-value less than 0.01 or less than 0.001, indicate a high statistical
difference or extreme statistical difference, respectively
Sewage Effluent (ng/mL) EE CE p-value (two-tailed)
Methamphetamine 6.11 24.50 0.10
Pseudoephedrine 2.33 20.53 0.0009***
Ephedrine 11.32 86.43 0.002**
*p-values<0.05 signifying a statistical difference between the concentrations observed
in the ether cooks and the camp fuel cooks.
**p-values<0.01 signifying a high statistical difference between the concentrations
observed in the ether cooks and the camp fuel cooks.
***p-values<0.001 signifying an extreme statistical difference between the
concentrations observed in the ether cooks and the camp fuel cooks.

91
For lithium analysis, Table 37 below lists lithium concentration in microgram per
gram for autosampler bottles 1, 4, and 5 of each deposit. These bottles were collected at
time equals -15, 45, and 60 minutes, respectively.
Table 37. Lithium Concentration from ICP-MS analysis
Sample Lithium Concentration (µg/g)
CE 1-1 ND
CE 1-4 ND
CE 1-5 0.25
CE 2-1 ND
CE 2-4 ND
CE 2-5 0.30
CE 3-1 ND
CE 3-4 0.23
CE 3-5 0.17
EE 1-1 ND
EE 1-4 0.12
EE 1-5 0.08

92
EE 2-1 0.01
EE 2-4 ND
EE 2-5 0.06
EE 3-1 0.02
EE 3-4 0.02
EE 3-5 0.18
Figure 15-Figure 19 shows graphical representation of the concentration (ng/mL) of
methamphetamine, pseudoephedrine, ephedrine, CMP, and amphetamine observed in the
sewage water time course samples collected after the ether One Pot waste deposits. EE1
and EE3 followed the same rise-fall pattern, where the highest concentration of each
drug, except amphetamine, was observed between 45 and 60 minutes. After this peak,
the concentration dropped significantly for 30 minutes and then the rate of the decline
began to lessen over time. For example, EE2 showed a large increase in all drug
concentrations, except amphetamine, over the first two hours and then a large decrease in
all drug concentrations, except amphetamine, over the second two-hour period. For all
three ether One Pot waste deposits, amphetamine remained at the same concentration,
visually, throughout the 3 to 4-hour timeframe.

93
Figure 15. Change in methamphetamine concentration (ng/mL) observed in sewage water samples taken every 15
minutes after ether cook waste deposits.
0.00
1.00
2.00
3.00
4.00
5.00
6.00
7.00
8.00
0 50 100 150 200 250
Co
nce
ntr
atio
n (
ng/
mL)
Time (minutes)
EE Methamphetamine Conc. vs. Time
EE1
EE2
EE3
0.00
0.50
1.00
1.50
2.00
2.50
3.00
0 50 100 150 200 250
Co
nce
ntr
atio
n (
ng/
mL)
Time (minutes)
EE Pseudoephedrine Conc. vs. Time
EE1
EE2
EE3

94
Figure 16. Change in pseudoephedrine concentration (ng/mL) observed in sewage water samples taken every 15
minutes after ether cook waste deposits.
Figure 17. Change in ephedrine concentration (ng/mL) observed in sewage water samples taken every 15 minutes after
ether cook waste deposits.
0.00
2.00
4.00
6.00
8.00
10.00
12.00
14.00
16.00
0 50 100 150 200 250
Co
nce
ntr
atio
n (
ng/
mL)
Time (minutes)
EE Ephedrine Conc. vs. Time
EE1
EE2
EE3

95
Figure 18. Change in CMP concentration (ng/mL) observed in sewage water samples taken every 15 minutes after
ether cook waste deposits.
0.00
0.10
0.20
0.30
0.40
0.50
0.60
0.70
0.80
0 50 100 150 200 250
Co
nce
ntr
atio
n (
ng/
mL)
Time (minutes)
EE CMP Conc. vs. Time
EE1
EE2
EE3
0.00
0.10
0.20
0.30
0.40
0.50
0.60
0.70
0 50 100 150 200 250
Co
nce
ntr
atio
n (
ng/
mL)
Time (minutes)
EE Amphetamine Conc. vs. Time
EE1
EE2
EE3

96
Figure 19. Change in amphetamine concentration (ng/mL) observed in sewage water samples taken every 15 minutes
after ether cook waste deposits.
Figure 20-Figure 24 show a graphical demonstration of the concentration (ng/mL) of
methamphetamine, pseudoephedrine, ephedrine, CMP, and amphetamine observed in the
time course sewage water samples collected after the camp fuel One Pot waste deposits.
All three camp fuel deposits followed the same rise-fall pattern, where the highest
concentration of each drug, except amphetamine, was observed between 30 and 60
minutes. After this, the concentration dropped significantly for 30 minutes and then the
rate of decline began to lessen over time. For all three camp fuel One Pot waste deposits,
amphetamine remained at the same concentration, visually, throughout the 3 to 4-hour
timeframe.
Figure 20. Change in methamphetamine concentration (ng/mL) observed in sewage water samples taken every 15
minutes after camp fuel cook waste deposits.
0.00
5.00
10.00
15.00
20.00
25.00
30.00
35.00
40.00
45.00
0 20 40 60 80 100 120 140 160 180
Co
nce
ntr
atio
n (
ng/
mL)
Time (minutes)
CE Methamphetamine Conc. vs. Time
CE1
CE2
CE3

97
Figure 21. Change in pseudoephedrine concentration (ng/mL) observed in sewage water samples taken every 15
minutes after camp fuel cook waste deposits.
0.00
5.00
10.00
15.00
20.00
25.00
30.00
0 20 40 60 80 100 120 140 160 180
Co
nce
ntr
atio
n (
ng/
mL)
Time (minutes)
CE Pseudoephedrine Conc. vs. Time
CE1
CE2
CE3
0.00
20.00
40.00
60.00
80.00
100.00
120.00
0 20 40 60 80 100 120 140 160 180
Co
nce
ntr
atio
n (
ng/
mL)
Time (minutes)
CE Ephedrine Conc. vs. Time
CE1
CE2
CE3
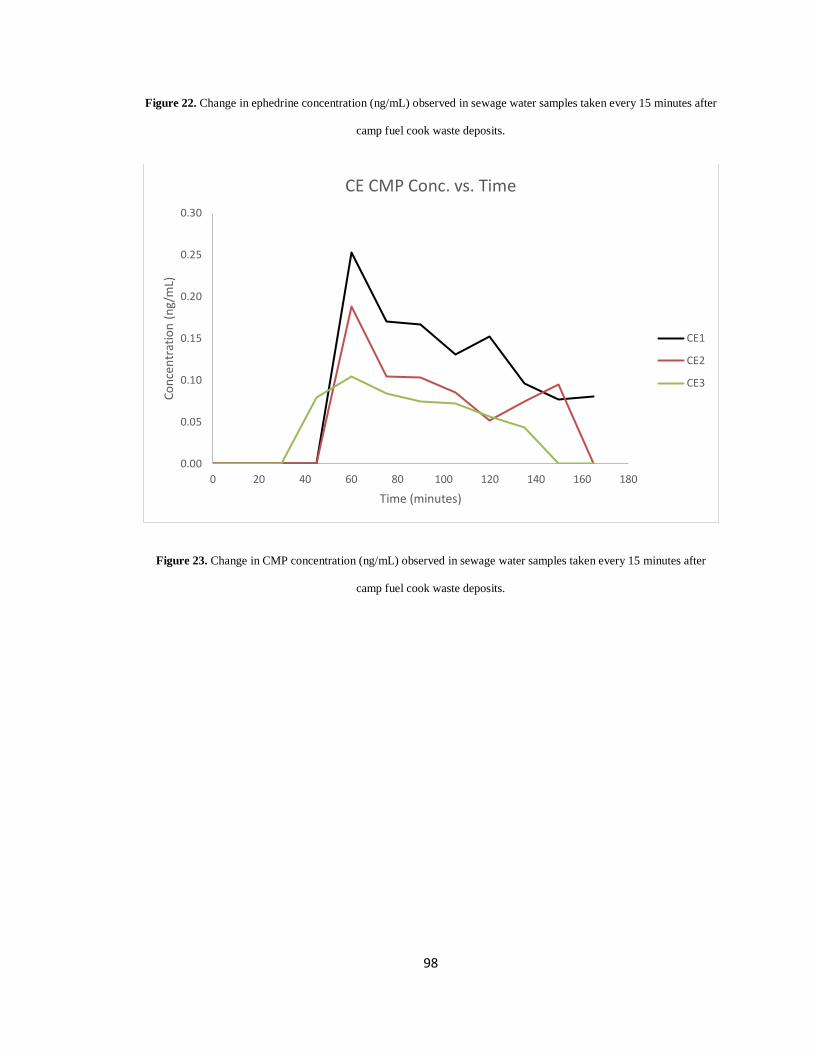
98
Figure 22. Change in ephedrine concentration (ng/mL) observed in sewage water samples taken every 15 minutes after
camp fuel cook waste deposits.
Figure 23. Change in CMP concentration (ng/mL) observed in sewage water samples taken every 15 minutes after
camp fuel cook waste deposits.
0.00
0.05
0.10
0.15
0.20
0.25
0.30
0 20 40 60 80 100 120 140 160 180
Co
nce
ntr
atio
n (
ng/
mL)
Time (minutes)
CE CMP Conc. vs. Time
CE1
CE2
CE3

99
Figure 24. Change in amphetamine concentration (ng/mL) observed in sewage water samples taken every 15 minutes
after camp fuel cook waste deposits.
Figure 25-Figure 34 are alternating figures. The odd numbered figures show the
concentration (ng/mL) of methamphetamine, pseudoephedrine, ephedrine, CMP, and
amphetamine observed in the time course sewage water samples collected after all six
One Pot waste deposits. The even numbered figures compare the average concentrations
(ng/mL) of these compounds observed in sewage water samples after the ether One Pot
waste deposits to the average concentrations observed in sewage water samples after the
camp fuel One Pot waste deposits. Higher methamphetamine, pseudoephedrine, and
ephedrine concentrations were observed, visually, in sewage water samples collected
after camp fuel One Pot waste deposits.
0.00
0.05
0.10
0.15
0.20
0.25
0.30
0 20 40 60 80 100 120 140 160 180
Co
nce
ntr
atio
n (
ng/
mL)
Time (minutes)
CE Amphetamine Conc. vs. Time
CE1
CE2
CE3

100
Figure 25. Comparison of the concentration of methamphetamine (ng/mL) observed in sewage water samples every 15
minutes for all One Pot waste deposits.
0.00
5.00
10.00
15.00
20.00
25.00
30.00
35.00
40.00
45.00
0 20 40 60 80 100 120 140 160 180
Co
nce
ntr
atio
n (
ng/
mL)
Time (minutes)
Methamphetamine Conc. vs. Time
EE1
EE2
EE3
CE1
CE2
CE3
0.00
5.00
10.00
15.00
20.00
25.00
0 20 40 60 80 100 120 140 160 180
Co
nce
ntr
atio
n (
ng/
mL)
Time (minutes)
Average Methamphetamine Conc. vs. Time
EE (avg)
CE (avg)

101
Figure 26. Average concentration of methamphetamine (ng/mL) observed every 15 minutes after One Pot waste
deposits.
Figure 27. Comparison of the concentration of pseudoephedrine (ng/mL) observed in sewage water samples collected
every 15 minutes for all One Pot waste deposits.
0.00
5.00
10.00
15.00
20.00
25.00
30.00
0 20 40 60 80 100 120 140 160 180
Co
nce
ntr
atio
n (
ng/
mL)
Time (minutes)
Pseudoephedrine Conc. vs. Time
EE1
EE2
EE3
CE1
CE2
CE3

102
Figure 28. Average concentration of pseudoephedrine (ng/mL) observed every 15 minutes after One Pot waste
deposits.
0.00
2.00
4.00
6.00
8.00
10.00
12.00
14.00
16.00
18.00
20.00
0 20 40 60 80 100 120 140 160 180
Co
nce
ntr
atio
n (
ng/
mL)
Time (minutes)
Average Pseudoephedrine Conc. vs. Time
EE (avg)
CE (avg)
0.00
20.00
40.00
60.00
80.00
100.00
120.00
0 20 40 60 80 100 120 140 160 180
Co
nce
ntr
atio
n (
ng/
mL)
Time (minutes)
Ephedrine Conc. vs. Time
EE1
EE2
EE3
CE1
CE2
CE3

103
Figure 29. Comparison of the concentration of ephedrine (ng/mL) observed in sewage water samples collected every
15 minutes for all One Pot waste deposits.
Figure 30. Average concentration of ephedrine (ng/mL) observed every 15 minutes after One Pot waste deposits.
0.00
10.00
20.00
30.00
40.00
50.00
60.00
70.00
80.00
90.00
0 20 40 60 80 100 120 140 160 180
Co
nce
ntr
atio
n (
ng/
mL)
Time (minutes)
Average Ephedrine Conc. vs. Time
EE (avg)
CE (avg)

104
Figure 31. Comparison of the concentration of CMP (ng/mL) observed in sewage water samples collected every 15
minutes for all One Pot waste deposits.
Figure 32. Average concentration of CMP (ng/mL) observed every 15 minutes after One Pot waste deposits.
0.00
0.10
0.20
0.30
0.40
0.50
0.60
0.70
0.80
0 20 40 60 80 100 120 140 160 180
Co
nce
ntr
atio
n (
ng/
mL)
Time (minutes)
CMP Conc. vs. Time
EE1
EE2
EE3
CE1
CE2
CE3
0.00
0.05
0.10
0.15
0.20
0.25
0.30
0.35
0 20 40 60 80 100 120 140 160 180
Co
nce
ntr
atio
n (
ng/
mL)
Time (minutes)
Average CMP Conc. vs. Time
EE (avg)
CE (avg)
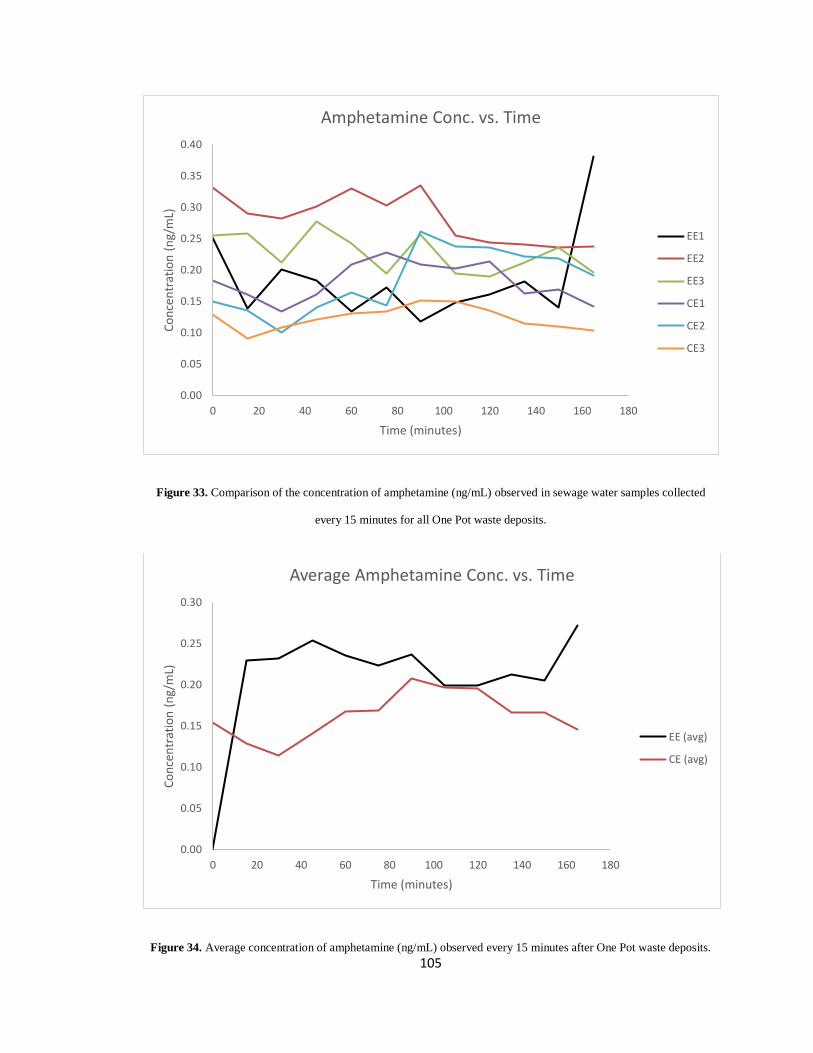
105
Figure 33. Comparison of the concentration of amphetamine (ng/mL) observed in sewage water samples collected
every 15 minutes for all One Pot waste deposits.
Figure 34. Average concentration of amphetamine (ng/mL) observed every 15 minutes after One Pot waste deposits.
0.00
0.05
0.10
0.15
0.20
0.25
0.30
0.35
0.40
0 20 40 60 80 100 120 140 160 180
Co
nce
ntr
atio
n (
ng/
mL)
Time (minutes)
Amphetamine Conc. vs. Time
EE1
EE2
EE3
CE1
CE2
CE3
0.00
0.05
0.10
0.15
0.20
0.25
0.30
0 20 40 60 80 100 120 140 160 180
Co
nce
ntr
atio
n (
ng/
mL)
Time (minutes)
Average Amphetamine Conc. vs. Time
EE (avg)
CE (avg)

106
The final laboratory results pertain the samples obtained from EE4 and CE4
syntheses. As mentioned in the methodology section, post-salt solvent, sludge, and
product salts samples were stored for laboratory analysis, and not to be used within waste
water deposit experiments. The characterization results from Chapter 2 provided drug
compound concentrations within One Pot reaction waste. However, an additional
synthesis of each solvent type was conducted to verify the results established in the
previous chapter. Upon LC-MS/MS analysis, the following results were observed, as
listed in Table 38.
Table 38. Characterization results from EE4 and CE4 reaction waste samples. All values listed in ng/mL.
Post-Salt Solvent Sludge Product Salt
Compound EE4 CE4 EE4 CE4 EE4 CE4
Methamphetamine 102.4 2698 14.52 10.33 32.12 42.56
CMP 10.17 5.05 0.98 0.34 2.45 0.52
Pseudoephedrine 7.17 410.9 0.44 1.23 1.38 4.56
Ephedrine 28.7 1570 3.75 4.16 12.47 26.84
Amphetamine 0.00 0.00 0.00 0.00 0.00 0.00
The results indicate a much greater presence of drug compounds, with the exception of
CMP, within the CE4 post-salt solvent than the EE4 post-salt solvent. As for the sludge
and product salt samples, the two solvent types produced visually similar results.
107
3.5 Discussion
Based on the results of the SPE validation, a successful method was developed
and implemented within OSU-FTTL to detect and quantitate One Pot methamphetamine
related compounds. A LOQ was successfully established at 0.5 ng/mL for all target
compounds. Accuracy and precision of both the calibrator and quality control levels fell
within plus or minus 30% of the actual concentration. The matrix effects study
demonstrated success with plus or minus 20% calculated values for all compounds.
Additionally, recovery and process efficiencies were calculated for increased intel
regarding the extraction process.
Following method validation, One Pot methamphetamine syntheses, were
successfully performed. Overall, eight reactions were conducted, four utilizing diethyl
ether and four utilizing camp fuel as the reaction solvent. As described above, the
simulated laboratory waste solutions that were combined to create the total One Pot waste
deposit were a lithium-in-water solution, sludge, and a post-salt solvent. After waste
water collection, lithium was detectable with ICP-MS analysis. Based on the samples
tested for the presence of lithium, a baseline sample, or sample collected prior to deposit,
was compared with a peak sample, or sample likely to contain the highest abundance of
the target compound. The peak samples were determined based on the results of the
green dye tests, which provided approximate travel times of the One Pot manufacturing
waste from the deposit site to the sampling location. According to the results obtained by
SRNL ICP-MS analysis, lithium was not detected in two thirds of the base line samples.
The only positive detections were EE2.1 and EE3.1, with concentrations of 0.01 and 0.02
ug/g, respectively. On the other hand, every deposit detected lithium in one or both of

108
the peak samples tested. The highest detected concentration of lithium was 0.30 ug/g,
while the average of all detections, excluding baseline samples, was 0.16 ug/g. More
research will need to be conducted, but based on the ICP-MS results, a spike in lithium
concentrations within waste water could contribute to the identification of a One Pot
methamphetamine laboratory.
Based on the waste water analysis of SPE with LC-MS/MS, methamphetamine,
pseudoephedrine, ephedrine, CMP, and amphetamine were detected following One Pot
waste deposit. As shown in the graph figures above, the time course samples
demonstrated a low baseline of target compound, a sharp spike or increase, and then
gradual decrease in concentration. Continued research is needed to determine if a similar
spike in One Pot signature compounds and byproducts can be observed in uncontrolled or
community situations.
A statistical test was performed on Time Course samples, with this analysis
comparing EE and CE results of the average maximum concentrations obtained from
each deposit. According to the results, every compound, with the exception of
methamphetamine, was significantly different when comparing the two solvents
commonly used in the One Pot method. For pseudoephedrine and ephedrine, a great
statistical divide was experienced with p-values of 0.009 and 0.002, respectively. A
similar argument can be made for methamphetamine, but based solely on visual
observation of the concentrations obtained. For these three compounds, concentrations
within the camp fuel effluent were much higher than those within the diethyl ether
effluents. CMP and amphetamine, were not included in the statistical comparison, but
demonstrated higher concentrations in favor of the diethyl ether deposits. The LC-

109
MS/MS characterization of EE4 and CE4 provides some explanation for the statistical
differences observed within the two solvent type deposits. In contrast to the
characterization results in Chapter 2, with the diethyl ether samples demonstrating a
higher concentration of target compounds, the results from EE4 and CE4 exhibited the
opposite. For the post-salt solvent sample, in particular, methamphetamine,
pseudoephedrine, and ephedrine were roughly ten times the concentration within the CE4
sample when compared to the EE4 sample. Since these two One Pot reactions were
performed in conjunction with EE1-EE3 and CE1-CE3, a safe assumption is that the
reactions used for each waste water deposit, contained similar drug concentrations. The
identification of the increased concentrations within CE post-salt solvents is a probable
cause for the statistical difference of the average maximum concentration of
methamphetamine, pseudoephedrine, and ephedrine observed following waste water
analysis.
Additional waste water samples tested using LC-MS/MS analysis included those
referred to as Pulse samples. As mentioned above, the Pulse feature on the waste water
autosampler did not function properly. A varying number of samples were collected
following each deposit, if any at all. For the samples collected at each pumpdown of the
lift station, methamphetamine, pseudoephedrine, ephedrine, and amphetamine were
detected at varying concentrations post-deposit. No noticeable trends were observed in
the results, as concentrations would increase and decrease sporadically over the course of
sample collection. An additional finding is that CMP was not detectable after an
extended period of time. Since CMP was not detected in any of the Pulse samples, the
Time Course samples were examined for the longest detection window of CMP in this

110
study. For diethyl ether and camp fuel deposits, the largest detection window is 195 and
150 minutes, respectively. The true detection window would require an additional test
with an increased volume of time course samples. Knowledge that a window of detection
exists for CMP could potentially be problematic for the implementation of the current
reported methodology into the law enforcement community.
An important note based on all the LC-MS/MS waste water results is that the
volume of sample utilized was only 2 mL, as compared to common sample volumes in
the literature ranging up to hundreds of milliliters. With the controlled experimental
setting and relatively small waste water system, 2 mL of sample was sufficient to detect
compounds of the One Pot methamphetamine method. However, continued research,
specifically increased sample volume extraction, will enhance the detection capabilities.
For the signature manufacturing byproduct, CMP, improvements in methodology would
only increase the window of detection for this compound. Future studies will not only
need to conduct waste water testing for all target compounds within community settings,
but confirm, or help to assign, drug concentrations within waste water being attributed to
the disposal of One Pot methamphetamine waste material. As of now, the primary
demand for continuing research lies with the determination of any other possible sources
of CMP introduction into sewage effluent.
In summary, a simulated One Pot waste disposal experiment was successful in
detecting the target compounds of methamphetamine manufacturing, which include,
methamphetamine, pseudoephedrine, ephedrine, and CMP. The main metabolite of
methamphetamine, amphetamine, was included in the detection method as a potential
indicator of methamphetamine concentrations attributed to human consumption. Based

111
on the results, collected waste water over time demonstrated a dramatic increase or spike
in all target compounds of the One Pot method. Additionally, no similar increase in
amphetamine was observed. This successful experiment demonstrates the potential to
implement waste water analysis as means to track and monitor clandestine laboratories
within communities. Further research into this matter will increase detection capabilities,
assist in assigning the source of the target compounds, and potentially, help locate and
remove dangerous One Pot methamphetamine laboratories throughout the country.
Consequently, this removal would also eliminate the likely harm that the hazardous and
toxic chemicals associated with the One Pot method would cause to innocent bystanders
and the environment.

112
CHAPTER IV
CMP DETECTION IN URINE SAMPLES
4.1 Introduction
1-(1’,4’-cyclohexadienyl)-2-methylaminopropane, or CMP, has been identified as
a signature byproduct of both the Birch Reduction and One Pot methamphetamine
manufacturing methods, as explained in Chapter 2. The results from the second chapter
confirmed the presence of CMP within One Pot reaction products, as well as waste
material. In Chapter 3, the focus was centered around the ability to detect One Pot target
compounds within waste water as a means to identify the location of clandestine
laboratories within a community. Although CMP was detectable in sewage effluent
following simulated waste disposal, a significant uncertainty exists in regards to whether
the detection of the byproduct definitively identifies the presence of One Pot reaction
waste. If CMP is detectable in trace amounts within the final methamphetamine salt that
individuals are illicitly using, and potentially abusing, it is possible that CMP would
excreted from the human body, thus contributing to any concentrations found within
waste water.
One Pot methamphetamine product will potentially contain three compounds:
methamphetamine, pseudoephedrine, and CMP. Depending on a variety of
manufacturing factors, the amount of pseudoephedrine and CMP may be great or small.
113
Also, a product salt may have the possibility of not containing any starting material or
byproduct. The results from Chapters 2 and 3, demonstrate a fairly large amount of
pseudoephedrine following a 2-hour reaction. However, the OSU-FTTL One Pot
method, as mentioned, is a scaled-down version for safety purposes. In a clandestine
setting, an individual may use excess materials to ensure a more quality product.
Additionally, due to the wide-range of One Pot procedures available online, a multitude
of yields is likely present within the clandestine laboratory community. CMP, on the
other hand, demonstrated higher amounts in One Pot reactions that utilized diethyl ether.
Camp fuel syntheses, as discussed above, will not produce CMP as readily as diethyl
ether due to increased immiscibility with water. Regardless of the amounts of
pseudoephedrine and CMP within a One Pot product salt, the compounds, in addition to
methamphetamine, may be consumed with illicit use. And as a result, knowledge of the
consumed compounds’ metabolism and excretion characteristics is paramount to any
waste water analysis designed to detect or locate the presence of One Pot laboratory
waste.
As previously discussed, methamphetamine is primarily excreted unchanged, with
only approximately 10-20% metabolizing into amphetamine. Pseudoephedrine is
excreted approximately 70% as the parent compound, and minor amounts are
metabolized into nor-pseudoephedrine.55 While the pharmacokinetics of starting material
and the illicit product are well understood, CMP has not been studied within living
subjects. The majority of research within the literature pertaining to CMP are focused on
detection within the environment or clandestine laboratories. “Chemicals associated with
clandestine drug laboratories are often disposed of covertly into soil, sewerage systems,

114
or public waste management facilities.”8 Typically, the studies are conducted as a means
to identify potential pollution within the environment. While several studies have been
focused on detecting manufacturing byproducts within soil and monitoring degradation,
little to no research has been conducted that relate to the last two disposal routes
mentioned in the quote above. Human consumption and excretion, as proven with the
many studies discussed in Chapter 3, have demonstrated drug and metabolite
contamination of the waste water system. As a result, any consumed manufacturing
byproducts would be excreted, providing a detection potential in sewage effluent.
However, a void in the literature creates uncertainty as to how the primary One Pot
manufacturing byproduct interacts, i.e. metabolism and excretion patterns, within the
human body.
Knowledge of the signature byproduct’s interactions within the body, may not
only identify other potential compounds to monitor within waste water, but may
substantiate the significance of a CMP detection. If CMP is metabolized completely or
primarily, detection in sewage effluent provides evidence of One Pot methamphetamine
manufacturing. CMP metabolism has yet to be fully investigated. The following study
was conducted to test urine samples that had previously tested positive for
methamphetamine. Anonymized samples were collected from three different sources,
two being pain management laboratories and another from a medical examiner’s office.
In total, 47 urine samples were received. OSU-FTTL, as part of another service, provides
urine drug testing, therefore each sample received underwent a modified extraction
process of the validated procedure. LC-MS/MS analysis provided drug detection results
for amphetamine, methamphetamine, pseudoephedrine, and CMP only. Results

115
demonstrate the potential for CMP to be consumed and excreted, as a result of illicit
methamphetamine use, which has yet to be confirmed in the literature. However, the
very low prevalence of CMP within the urine samples indicates that CMP detection in
waste water may still verify the presence of a One Pot clandestine laboratory.
4.2 Review of the Literature
Since the first discoveries of 1-(1’,4’-cyclohexadienyl)-2-methylaminopropane,
CMP has been the focal point of several research projects. As mentioned above, this
byproduct is signature of methamphetamine manufacturing that utilizes a lithium and
ammonia reduction.27 The associated clandestine procedures that have been proven to
result in CMP are the Birch Reduction and One Pot methods. While the Birch Reduction
has the potential to produce greater amounts of CMP, the One Pot method, as
demonstrated in Chapter 2, can have detectable amounts of the byproduct within the final
methamphetamine salt. Individuals using an illicit substance produced from either of the
two manufacturing methods, could potentially be ingesting CMP.
Analysis of urine for the presence of drug compounds is not a new endeavor.
Urine drug testing can be applied to many scenarios, including, but not limited to,
clinical, research, and forensic settings. Additionally, urine is typically analyzed to
ensure individuals within a workplace setting are not abusing drugs that are illegal and/or
may impair their ability to perform daily tasks. In fact, in 2003, more than 90% of U.S.
companies decided to use urine as the specimen to be analyzed for drugs.56 Other bodily
fluids can be analyzed as well, such as blood or oral fluid, but urine testing is well
established. The two primary confirmatory instruments to quantitate drugs within urine
is GC-MS and LC-MS/MS. While GC-MS may be the most common, a rise in LC-

116
MS/MS prevalence and preference has been documented.57 For the purposes of this
review, only LC-MS/MS will be discussed as it is the instrument of choice for this study.
One of the first uses of LC-MS to analyze illicit drugs in human urine was
validated in 1996. Tatsuno et al. developed an LC-MS method due to the challenges
observed with GC-MS analysis. The challenges referenced included the demands of
extensive sample treatment and/or derivatization to detect nonvolatile compounds.58 The
sample preparation implored for the LC-MS analysis was SPE. Results indicated
successful analysis of illicit compounds within urine and demonstrated advantages over
GC-MS.58 Following initial research determining the possibility and potential of LC-MS,
many research projects have been conducted to not only improve detection capabilities,
but also expand the number of compounds that can be detected in a single run.
According to one report, many groups continued to use traditional GC-MS methodologies
despite learning of successful implementation of LC-MS. The reasoning behind this
“considerable resistance” was not discussed by the authors.60 However, possible sources
could include immediate and already implemented availability of GC-MS, cost and time
to acquire and validate LC-MS, and issues with sample interference of closely related
drug compounds. Regardless, the discovery of LC-MS/MS, an increase in analytical
confirmation, and its potential in drug testing became the focal point of many research
projects, and helped evade the resistance seen with LC-MS. In 1999, a research group
utilized LC-MS/MS to analyze several illicit drug compounds in urine samples. The
group reported, in describing the instrumentation setup, “a rapid, simple, sensitive LC-
ESI-MS-MS analysis…using specific transitions for each compound of interest.”59

117
Enhanced sensitivity, with the addition of specific transitions, proved to play an
important role in the growth of LC-MS/MS analysis prevalence in urine drug testing.
With the increasing implementation of LC-MS/MS in the drug testing
community, many research groups sought to improve detection capabilities, expand the
number of drugs that could be tested in a single run, and decrease overall analysis time.
The majority of these goals are not surprising from a business perspective. LC-MS/MS
methodologies were developed within laboratories to have the ability to detect many
numerous drug compounds, both of illicit and pharmaceutical nature. However, other
methodologies were developed to focus on the detection of a select group of related
compounds and/or metabolites. For instance, Ming-Ren Fuh et al., in 2006, developed a
method to detect amphetamine and methamphetamine using SPE with LC-MS-MS, and
successfully reached a detection limit of 1 ng/mL.57 Another group later expanded the
amphetamine and methamphetamine group to include 3,4-
methylenedioxymethamphetamine or MDMA, and 3,4-methylenedioxyamphetamine or
MDA. For these four compounds, Andersson et al. reported LOD values of 43, 8, 8, and
2 ng/mL, respectively.61 Variable detection limits are pursued depending on the nature of
the research or business goals. For instance, a drug testing method designed to analyze
prescription methamphetamine, Desoxyn, may not necessarily need a low limit of
detection or quantification, if the goal is to simply confirm or deny an individual’s use of
the prescription. On the other hand, if a drug testing method is developed for sewage
effluent analysis, such as those discussed in Chapter 3, the limit of detection for
methamphetamine would need to be much lower to detect trace amounts of the illicit
substance within a vast waste water system.

118
Despite the many varying limits of detection reported for amphetamine and
methamphetamine, LC-MS/MS analysis of these two compounds within the literature is
extensive. For example, method development and LC-MS/MS product design has moved
beyond the mere detection and quantification of drug compounds. Several groups have
conducted studies in regards to enantiomeric separation. Foster et al., in 1998, developed
a method to separate, quantitate and compare the presence of d- and l-amphetamine and
methamphetamine within urine samples. Results indicated successful separation with an
ingredient called Marfey’s reagent, and produced limits of detection and quantitation of
0.16 and 0.40 mg/L, respectively for each enantiomer.62 The successes of this study have
helped pave the way for research in regards to comparing the amount of illicit versus
over-the-counter use of methamphetamine. For instance, a study conducted in 2014
attempted to separate and quantitate enantiomers to substantiate any claims that a positive
methamphetamine result was due to use of a nasal decongestant containing the l-
methamphetamine form of the compound. Newmeyer et al., although not testing urine
samples, was successful in distinguishing the enantiomer of methamphetamine
consumed.63 These findings indicate the potential to apply a similar procedure to a
multitude of samples types such as urine or even waste water.
Besides methamphetamine and amphetamine, the One Pot manufacturing product
and metabolite, the precursor pseudoephedrine has also been successfully detected within
urine. A recent LC-MS/MS study, conducted in 2015, was able to reach 0.1 ng/mL limit
of detection for pseudoephedrine, all while analyzing for over 70 other compounds.64
Other research groups have had similar success. In fact, the methodology in the
following section was adopted from an OSU-FTTL method that was developed and is

119
currently being validated to detected a multitude of illicit and pharmaceutical drugs,
including pseudoephedrine.
The literature discussed above relates to compounds that will, methamphetamine
and amphetamine, and may be, pseudoephedrine, detected following the use of One Pot
methamphetamine product. However, and as previously mentioned, no research has been
conducted in regards to detecting CMP, the Birch Reduction and One Pot signature
byproduct, in urine specimens. A demand exists for this research to not only potentially
gather intelligence about the source of the methamphetamine product an individual
consumed, but also confirm or deny the importance of detecting CMP in waste water as a
means to identify the presence of a clandestine laboratory. Until this study, no research
has been published with regards to CMP’s interaction within the human body. Further
and more extensive research is needed to fully understand CMP metabolism and
potentially identify metabolites that can differentiate methamphetamine consumption
versus manufacturing waste.
4.3 Methodology
Urine samples that had previously tested positive for methamphetamine with LC-
MS/MS were delivered to OSU-FTTL to analyze for the presence of CMP. The sample
collection process did not involve interaction with a human subject nor did it provide
access to identifiable personal and private information. All urine samples collected were
completely anonymized. According to 45 CFR 46.102 (d) and (f) of the Code of Federal
Regulations for Human Research, this project did not qualify as human subject research
and was not subject to oversight by the Oklahoma State University Institutional Review
Board. Approximately 1 mL of 47 urine samples was delivered to OSU-FTTL, and

120
arrived in tubes labeled as “Urine” with a number designation of 1 through 47. All
samples were stored in a freezer until sample preparation and extraction.
For laboratory analysis, a different extraction and instrument setup was used when
compared to the characterization and waste water samples, in Chapters 2 and 3,
respectively. A simpler extraction and a different LC-MS/MS platform was utilized
because of prior and continued success with urine drug testing within OSU-FTTL.
LC-MS/MS calibrators and quality controls were prepared using
methamphetamine, pseudoephedrine, amphetamine, and CMP drug standards mentioned
previously. The calibrators included levels of 250, 150, 100, 75, 25, 10, 5, 1, and 0.5
ng/mL of each compound. Four QC levels were prepared and included 150, 25, 1, and
0.1 ng/mL of each compound, and were labeled A, B, C, and D, respectively. All
dilutions for the drug levels mentioned above were performed in certified drug-free urine
(UTAK Laboratories Inc., Valencia, CA). An un-fortified, drug-free urine sample was
set aside to be utilized as a negative control. For an internal standard, a solution was
prepared using methamphetamine-d5, pseudoephedrine-d3, and amphetamine-d5, all
purchased from Cerilliant (Cerilliant Corp, Round Rock, TX).
For all calibrators, quality controls, and urine sample extractions, 50 L of sample
was aliquoted into a new tube, alongside 20 L of the prepared Internal Standard
solution. Additionally, 180 L of sample diluent, 5% methanol in water, was added to
each urine sample. The tube was then capped, vortexed for 10 seconds, and centrifuged
for 10 minutes at 13,000 revolutions per minute (rpm). Following centrifugation, 200 L
of each sample was then transferred to a separate injection vial and stored in a
refrigerator until LC-MS/MS analysis.

121
Shimadzu UFLC pumps paired with Shimadzu 80-40 MS/MS was used for the
LC-MS/MS analysis, shown in Figure 35.
Figure 35. LC-MS/MS Instrument Setup at OSU-FTTL. Shimadzu UFLC pumps on the left and Shimadzu 80-40
MS/MS on the right.
For liquid chromatography, separation was achieved with a Restek Raptor Biphenyl 2.7
µm column (50 x 2.1 mm) with a Restek Raptor Biphenyl 2.7µm guard cartridge (5 x 3.0
mm) (Restek Corporation, Bellefonte, PA). Mobile Phase A consisted of 2mM
ammonium formate and 0.1% formic acid in LC-MS grade water, while Mobile Phase B

122
consisted of 2mM ammonium formate and 0.1% formic acid in LC-MS grade methanol.
Ammonium formate was purchased from Alfa Aesar (Alfa Aesar, Ward Hill, MA).
Formic Acid was purchased from EDM (EDM Millipore Corp, Billerica, MA). Methanol
was purchased from JT Baker (Avantor Performance Materials Inc., Center Valley, PA).
Nanopure water was obtained using a Barnstead Nanopure Diamond laboratory water
system (Thermo Scientific, Waltham, MA). The LC method had a total flow rate of
0.500 ml/min. Mobile Phase B concentration began at 5.0% and increased at a consistent
rate until reaching 95% after 8.5 minutes. The concentration was then immediately
increased to 100%, sustained for 45 seconds, immediately decreased back to 5.0%, and
then held until the conclusion of the sample run at 11 minutes. Injections were set at 10
µL and the oven temperature was set to 30 oC.
For mass spectrometry, two product ions, fragments of the precursor ion, for each
compound were selected given the mass-to-charge (m/z) ratios that produced optimal
instrument response, see Table 39.
Table 39. Mass Spectrometry Parameters. Target analytes Methamphetamine, Pseudoephedrine, Amphetamine, and
CMP were identified using two mass ion fragments each. Internal standards include Methamphetamine-d5,
Pseudoephedrine-d3, and Amphetamine-d6.
Compound
Precursor
(m/z)
Product
(m/z)
Q1 Pre Bias
(volts) CE (volts)
Q3 Pre Bias
(volts)
CMP 151.65 58.15 -30.0 -11.0 -21.0
151.65 79.15 -30.0 -18.0 -30.0
Methamphetamine 149.75 119.05 -16.0 -25.0 -44.0
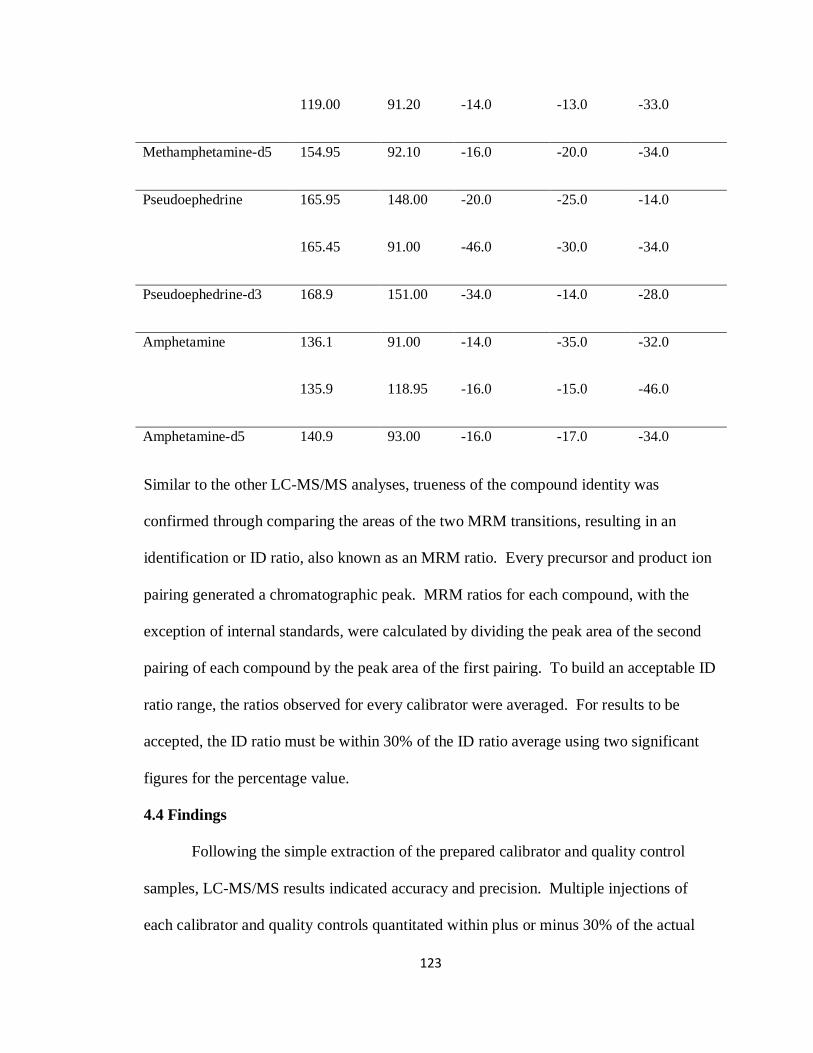
123
119.00 91.20 -14.0 -13.0 -33.0
Methamphetamine-d5 154.95 92.10 -16.0 -20.0 -34.0
Pseudoephedrine 165.95 148.00 -20.0 -25.0 -14.0
165.45 91.00 -46.0 -30.0 -34.0
Pseudoephedrine-d3 168.9 151.00 -34.0 -14.0 -28.0
Amphetamine 136.1 91.00 -14.0 -35.0 -32.0
135.9 118.95 -16.0 -15.0 -46.0
Amphetamine-d5 140.9 93.00 -16.0 -17.0 -34.0
Similar to the other LC-MS/MS analyses, trueness of the compound identity was
confirmed through comparing the areas of the two MRM transitions, resulting in an
identification or ID ratio, also known as an MRM ratio. Every precursor and product ion
pairing generated a chromatographic peak. MRM ratios for each compound, with the
exception of internal standards, were calculated by dividing the peak area of the second
pairing of each compound by the peak area of the first pairing. To build an acceptable ID
ratio range, the ratios observed for every calibrator were averaged. For results to be
accepted, the ID ratio must be within 30% of the ID ratio average using two significant
figures for the percentage value.
4.4 Findings
Following the simple extraction of the prepared calibrator and quality control
samples, LC-MS/MS results indicated accuracy and precision. Multiple injections of
each calibrator and quality controls quantitated within plus or minus 30% of the actual

124
concentration. Additionally, all negative control samples were negative for the target
compounds. Based on peak qualifying criteria, listed in the methodology section, the
following limit of quantitation (LOQ) for amphetamine, methamphetamine,
pseudoephedrine, and CMP were 5, 75, 5, and 0.5 ng/mL, respectively. The upper limit
of quantitation (ULOQ) was 250 ng/mL for all compounds. The results obtained from
LC-MS/MS analysis of all 47 urine specimens are listed in Table 40.
Table 40. LC-MS/MS results of 47 urine samples that previously tested positive for methamphetamine. The drug
compounds monitored were amphetamine, methamphetamine, pseudoephedrine, and CMP. All values listed in the
table are in ng/mL. Any positive value above the ULOQ, 250 ng/mL, was reported with a result of >250. All negative
values or concentrations that quantitated below the LOQ for each compound, listed in row 2, are designated with five
hyphen marks.
Amphetamine
Concentration
Methamphetamine
Concentration
Pseudoephedrine
Concentration
CMP
Concentration
ULOQ 250 250 250 250
LOQ 5 75 5 0.5
Urine 1 >250 >250 ----- -----
Urine 2 15.536 135.208 ----- -----
Urine 3 152.729 ----- ----- -----
Urine 4 210.353 ----- ----- -----
Urine 5 >250 >250 ----- -----
Urine 6 >250 >250 ----- -----

125
Urine 7 223.527 >250 ----- -----
Urine 8 27.288 >250 ----- -----
Urine 9 >250 ----- ----- -----
Urine 10 74.819 >250 7.415 1.483
Urine 11 >250 >250 ----- -----
Urine 12 >250 ----- ----- -----
Urine 13 >250 ----- ----- -----
Urine 14 >250 ----- ----- -----
Urine 15 >250 >250 ----- -----
Urine 16 49.634 98.975 ----- -----
Urine 17 >250 >250 ----- -----
Urine 18 >250 >250 ----- -----
Urine 19 >250 >250 ----- -----
Urine 20 58.801 168.936 ----- -----
Urine 21 106.179 >250 ----- -----
Urine 22 ----- 121.392 ----- -----
Urine 23 >250 >250 ----- -----
Urine 24 234.415 >250 ----- -----

126
Urine 25 179.209 >250 ----- -----
Urine 26 >250 >250 ----- -----
Urine 27 ----- 204.14 ----- -----
Urine 28 >250 >250 ----- -----
Urine 29 ----- >250 ----- -----
Urine 30 >250 >250 ----- -----
Urine 31 >250 >250 ----- -----
Urine 32 >250 ----- ----- -----
Urine 33 130.768 >250 ----- -----
Urine 34 ----- >250 ----- -----
Urine 35 >250 >250 ----- -----
Urine 36 >250 >250 ----- -----
Urine 37 >250 >250 ----- -----
Urine 38 >250 >250 ----- -----
Urine 39 >250 >250 ----- -----
Urine 40 >250 >250 ----- -----
Urine 41 >250 >250 ----- -----
Urine 42 >250 >250 ----- -----

127
Urine 43 222.539 >250 ----- -----
Urine 44 83.463 >250 ----- -----
Urine 45 ----- ----- ----- -----
Urine 46 245.182 >250 ----- -----
Urine 47 >250 >250 ----- -----
Only one urine sample, Urine 10, demonstrated positive results for pseudoephedrine and
CMP. The majority of the remaining samples tested positive for both methamphetamine
and amphetamine. Urine 3-4, 9, 12-14, 32, and 45 tested negative for methamphetamine
while testing positive for amphetamine. Urine 22, 27, 29, 34, and 45 tested negative for
amphetamine while testing positive for methamphetamine. The only sample to test
negative for every target compound was Urine 45.
4.5 Discussion
Based on the results above, a relatively low LOQ was achieved for all
compounds, 5 ng/mL or less, with the exception of methamphetamine. Two important
factors negate concern on this matter. The first is that the LC-MS/MS method was
slightly modified from a current urine drug testing method of over 70 compounds, that
had already been validated within OSU-FTTL. This methodology, in an attempt to avoid
instrument saturation or over-detection, adjusted several compounds such as
methamphetamine to not exhibit the optimal response in terms of sensitivity. As a result,
methamphetamine is still accurately identified, but large concentrations within a patient
sample will not overload the instrument detector. The second reason is that the urine

128
samples received had already been verified to contain methamphetamine. CMP, the focal
compound of this study, had the lowest LOQ at 0.5 ng/mL. As discussed in the chapters
above, CMP was determined to be present in very small amounts within One Pot
methamphetamine products. Therefore, CMP was optimized on the LC-MS/MS to
generate the best detection results.
The analysis of urine samples demonstrated a positive result in every sample,
except for Urine 45. This specific sample was the only specimen to observe no peaks for
any of the target compounds. A possible explanation for this is that the instruments used
for the initial and subsequent analyses vary. While Urine 45 may have tested positive for
methamphetamine initially, the results did not meet identification criteria on the
instrumentation at OSU-FTTL. The majority of samples contained high concentrations
of both methamphetamine amphetamine, as expected. Samples delivered to OSU-FTTL
were previously reported as methamphetamine positive, and as explained above,
amphetamine is a major metabolite. All remaining samples tested positive for either
amphetamine or methamphetamine alone. However, one sample, Urine 10, demonstrated
positive results for all four target compounds, amphetamine, methamphetamine,
pseudoephedrine, and CMP. The findings within this single sample confirm the
possibility that CMP can be ingested, as a byproduct of One Pot methamphetamine, and
then excreted in urine. This confirmation is the only definitive interpretation of the
results. Many unknowns remain unanswered. Every urine sample, with the exception of
Urine 10, was negative for both pseudoephedrine and CMP. Unfortunately, this does not
eliminate the consumption of One Pot methamphetamine. With the high variability
reports in clandestine communities, pseudoephedrine may be completely converted into

129
methamphetamine. As for CMP, the levels within the consumed methamphetamine salt,
of unknown origin, may be low enough to avoid detection with the current LOQ of 0.5
ng/mL. Additionally, with no prior research or evidence of byproduct’s interaction
within the body, the results above do not account for any metabolized or degraded CMP
before excretion. Perhaps, the methamphetamine consumed in User 10 had significant
levels of CMP, and thus, could be detected despite compound metabolism.
Although several unknowns still exist following this study, a few notions can be
interpreted from the findings. CMP has been successful identified in a human urine
specimen. While this specific finding, after continued research, may eliminate CMP as
definitive identifier of a One Pot clandestine laboratory in waste water, the detection does
provide the law enforcement community with an additional compound to monitor. The
presence of CMP within a user’s urine may help indicate or confirm the source of
methamphetamine manufacturing. On the other hand, with only a single detection of
CMP in 47 different urine samples, there lies a possibility that the majority of consumed
methamphetamine was not produced with the One Pot method. Further research can
confirm this notion, but if true, detection of CMP within sewage effluent may still
uniquely identify the presence of a One Pot methamphetamine laboratory within the
community.

130
CHAPTER V
CONCLUSION
In summary, the research projects above were designed to characterize and
develop methodology to proactively detect One Pot clandestine laboratories within the
population. The One Pot method has been shown to be the primary manufacturing
technique over the past decade. A signature byproduct of the One Pot method was
previously identified as 1-(1',4'-Cyclohexadienyl)-2-methyl-aminopropane, commonly
referred to as CMP, and its presence within One Pot methamphetamine products and
waste materials was confirmed. To revisit the goals of this study, they included:
1) characterize the One Pot methamphetamine method,
2) develop waste water analysis methodologies to detect One Pot waste in
sewage effluent, and
3) determine the significance of detecting the primary One Pot byproduct, CMP,
within environmental samples.
Based on the findings from the first study in Chapter 2, potential yields found within One
Pot methamphetamine laboratories were established, and the detectable presence of target
compounds within reaction waste was discovered and quantified. CMP, although
demonstrating greater concentration with diethyl ether reactions, was detectable in both
final product salts, as well as waste material samples like sludge and post-salt solvent.

131
The intelligence gathered from these findings will assist future yield and detection studies
of the One Pot methamphetamine manufacturing method.
Based on the findings from the second study in Chapter 3, sewage effluent
samples were collected downstream over time, following a simulated One Pot waste
disposal into a local waste water system. As hypothesized, results indicated a significant
increase or spike in One Pot target compounds. CMP was determined to have the
smallest window of detection, but with increased detection capabilities, such as
increasing sample volume, the byproduct could be detected within sewage effluent for a
longer period of time following a clandestine laboratory waste disposal. Additionally, no
spike in amphetamine, the major metabolite of methamphetamine, was observed. This
finding indicates the possibility of monitoring other drug compounds un-related to the
One Pot method as a means to distinguish methamphetamine consumption versus
methamphetamine production. The results from the second study, in general,
demonstrate the potential to further improve and implement waste water analysis as a
means to track and locate One Pot clandestine laboratories.
Based on the results from the third study, CMP can be detected in urine following
illicit One Pot methamphetamine consumption. Although a single detection within a
relatively small sample size cannot provide definitive interpretations, the investigation
has never been completed and/or documented within the literature. The findings from the
analysis of urine samples created a demand and incentive to further study CMP within
human subjects. Research projects pertaining to the byproduct’s metabolism and
excretion patterns, as well as improving analytical detection limits, will help substantiate
CMP as a unique identifier of clandestine methamphetamine production within

132
environmental samples, and possibly unveil other potential metabolites to monitor during
waste water analysis.
Overall, the results from the three individual, yet related, studies provide both
previously unknown knowledge and a demand for continued investigation into the One
Pot methamphetamine method. One Pot methamphetamine product and reaction waste
yields have been reported. Although clandestine laboratory yields can be highly variable,
the results established the primary compounds of interest that would be important to
monitor in any detection campaign, whether pertaining to health risks or the environment.
Additionally, a waste water analysis method was developed and validated to detect the
target compounds of the One Pot method. Methodologies from the simulated experiment
will need to be applied within communities, and detection capabilities increased.
However, the successful detection of a noticeable and significant increase or spike in
target compounds post-deposit create the potential to implement waste water analysis in a
law enforcement setting. And lastly, urine samples, which had previously tested positive
for methamphetamine, were analyzed for the presence of the One Pot precursor and
primary byproduct. Results demonstrated one sample out of 47 was positive for both
compounds. In addition to providing potential information in regards to the source of
consumed methamphetamine, the findings could potentially indicate that the majority of
methamphetamine users tested did not consume One Pot methamphetamine. Depending
on the trends in the studied community or population, a CMP detection, and most
certainly a spike, within sewage effluent could indicate the presence of One Pot
methamphetamine waste.

133
Expanded research of the manufacturing process, produced target compounds and
byproducts, potential sources of related compounds into the environment, and detection
capabilities will continue to increase the awareness of the law enforcement and scientific
communities in regards to the One Pot methamphetamine method. Due to this method’s
popularity and reported dangers, clandestine laboratories, from a public safety standpoint,
need to be identified before the reactions and toxic chemicals cause adverse health effects
for family members, friends, and neighbors. And the overall goal of continued research
is to assist in the investigation and removal of clandestine laboratories from the
community and environment before more harm is done. The accomplishments of this
research provide the initial pathway to the development of a method to proactively detect
dangerous One Pot methamphetamine clandestine laboratories.
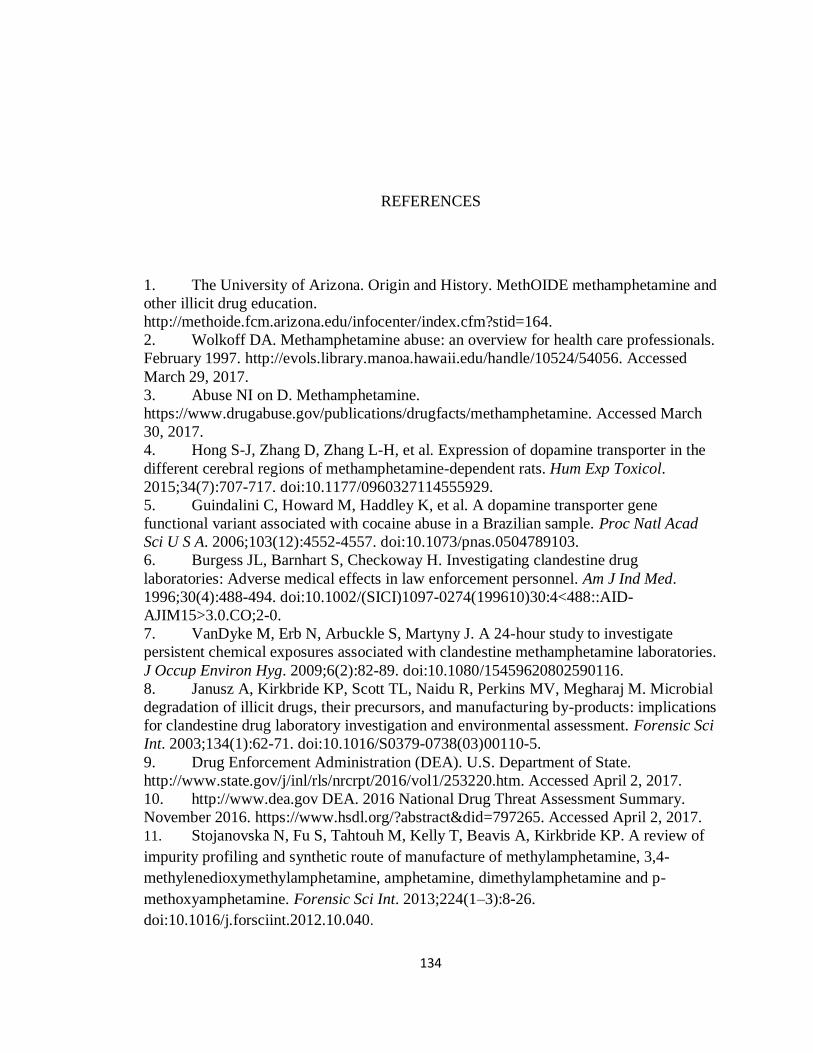
134
REFERENCES
1. The University of Arizona. Origin and History. MethOIDE methamphetamine and
other illicit drug education.
http://methoide.fcm.arizona.edu/infocenter/index.cfm?stid=164.
2. Wolkoff DA. Methamphetamine abuse: an overview for health care professionals.
February 1997. http://evols.library.manoa.hawaii.edu/handle/10524/54056. Accessed
March 29, 2017.
3. Abuse NI on D. Methamphetamine.
https://www.drugabuse.gov/publications/drugfacts/methamphetamine. Accessed March
30, 2017.
4. Hong S-J, Zhang D, Zhang L-H, et al. Expression of dopamine transporter in the
different cerebral regions of methamphetamine-dependent rats. Hum Exp Toxicol.
2015;34(7):707-717. doi:10.1177/0960327114555929.
5. Guindalini C, Howard M, Haddley K, et al. A dopamine transporter gene
functional variant associated with cocaine abuse in a Brazilian sample. Proc Natl Acad
Sci U S A. 2006;103(12):4552-4557. doi:10.1073/pnas.0504789103.
6. Burgess JL, Barnhart S, Checkoway H. Investigating clandestine drug
laboratories: Adverse medical effects in law enforcement personnel. Am J Ind Med.
1996;30(4):488-494. doi:10.1002/(SICI)1097-0274(199610)30:4<488::AID-
AJIM15>3.0.CO;2-0.
7. VanDyke M, Erb N, Arbuckle S, Martyny J. A 24-hour study to investigate
persistent chemical exposures associated with clandestine methamphetamine laboratories.
J Occup Environ Hyg. 2009;6(2):82-89. doi:10.1080/15459620802590116.
8. Janusz A, Kirkbride KP, Scott TL, Naidu R, Perkins MV, Megharaj M. Microbial
degradation of illicit drugs, their precursors, and manufacturing by-products: implications
for clandestine drug laboratory investigation and environmental assessment. Forensic Sci
Int. 2003;134(1):62-71. doi:10.1016/S0379-0738(03)00110-5.
9. Drug Enforcement Administration (DEA). U.S. Department of State.
http://www.state.gov/j/inl/rls/nrcrpt/2016/vol1/253220.htm. Accessed April 2, 2017.
10. http://www.dea.gov DEA. 2016 National Drug Threat Assessment Summary.
November 2016. https://www.hsdl.org/?abstract&did=797265. Accessed April 2, 2017.
11. Stojanovska N, Fu S, Tahtouh M, Kelly T, Beavis A, Kirkbride KP. A review of
impurity profiling and synthetic route of manufacture of methylamphetamine, 3,4-
methylenedioxymethylamphetamine, amphetamine, dimethylamphetamine and p-
methoxyamphetamine. Forensic Sci Int. 2013;224(1–3):8-26.
doi:10.1016/j.forsciint.2012.10.040.

135
12. Dujourdy L, Dufey V, Besacier F, et al. Drug intelligence based on organic
impurities in illicit MA samples. Forensic Sci Int. 2008;177(2–3):153-161.
doi:10.1016/j.forsciint.2007.11.013.
13. Ko BJ, Suh S, Suh YJ, In MK, Kim S-H, Kim J-H. (1S,2S)-1-Methylamino-1-
phenyl-2-chloropropane: Route specific marker impurity of methamphetamine
synthesized from ephedrine via chloroephedrine. Forensic Sci Int. 2012;221(1–3):92-97.
doi:10.1016/j.forsciint.2012.04.008.
14. 1990 Census of Population and Housing: Summary Population and Housing
Characteristics. North Carolina. U.S. Department of Commerce, Economics and
Statistics Administration, Bureau of the Census; 1991.
15. MAKING METHAMPHETAMINE* - ProQuest.
http://search.proquest.com/openview/054d047bb3b4d86bde3ec0aadeac8617/1?pq-
origsite=gscholar&cbl=27022. Accessed April 3, 2017.
16. Kram TC, Kruegel AV. The Identification of Impurities in Illicit
Methamphetamine Exhibits by Gas Chromatography/Mass Spectrometry and Nuclear
Magnetic Resonance Spectroscopy. J Forensic Sci. 1977;22(1):10366J.
doi:10.1520/JFS10366J.
17. Lambrechts M, Klemetsrud T, Rasmussen KE, Storesund HJ. Analysis of
Leuckart-specific impurities in amphetamine and methamphetamine. J Chromatogr A.
1984;284:499-502. doi:10.1016/S0021-9673(01)87855-9.
18. Dayrit FM, Dumlao MC. Impurity profiling of methamphetamine hydrochloride
drugs seized in the Philippines. Forensic Sci Int. 2004;144(1):29-36.
doi:10.1016/j.forsciint.2004.03.002.
19. Kunalan V, Nic Daéid N, Kerr WJ, Buchanan HAS, McPherson AR.
Characterization of Route Specific Impurities Found in Methamphetamine Synthesized
by the Leuckart and Reductive Amination Methods. Anal Chem. 2009;81(17):7342-7348.
doi:10.1021/ac9005588.
20. Drug Enforcment Administration. CMEA (Combat Methamphetamine Epidemic
Act of 2005). Diversion Control Division.
https://www.deadiversion.usdoj.gov/meth/cma2005_general_info.pdf. Published 2006.
21. Brzeczko AW, Leech R, Stark JG. The advent of a new pseudoephedrine product
to combat methamphetamine abuse. Am J Drug Alcohol Abuse. 2013;39(5):284-290.
doi:10.3109/00952990.2013.821476.
22. Skinner HF. Methamphetamine synthesis via hydriodic acid/red phosphorus
reduction of ephedrine. Forensic Sci Int. 1990;48(2):123-134. doi:10.1016/0379-
0738(90)90104-7.
23. Windahl KL, McTigue MJ, Pearson JR, Pratt SJ, Rowe JE, Sear EM.
Investigation of the impurities found in methamphetamine synthesised from
pseudoephedrine by reduction with hydriodic acid and red phosphorus. Forensic Sci Int.
1995;76(2):97-114. doi:10.1016/0379-0738(95)01803-4.
24. Lee JS, Han EY, Lee SY, et al. Analysis of the impurities in the
methamphetamine synthesized by three different methods from ephedrine and
pseudoephedrine. Forensic Sci Int. 2006;161(2–3):209-215.
doi:10.1016/j.forsciint.2006.02.054.

136
25. Barker WD, Antia U. A study of the use of Ephedra in the manufacture of
methamphetamine. Forensic Sci Int. 2007;166(2–3):102-109.
doi:10.1016/j.forsciint.2006.04.005.
26. Comprehensive Methamphetamine Control Act of 1996; Possession of List I
Chemicals, Definitions, Record Retention, and Temporary Exemption From Chemical
Registration for Distributors of Combination Ephedrine Products. Federal Register.
https://www.federalregister.gov/documents/1997/02/10/97-3086/comprehensive-
methamphetamine-control-act-of-1996-possession-of-list-i-chemicals-definitions-record.
Published February 10, 1997. Accessed April 5, 2017.
27. Person EC, Meyer JA, Vyvyan JR. Structural Determination of the Principal
Byproduct of the Lithium-Ammonia Reduction Method of Methamphetamine
Manufacture. J Forensic Sci. 2005;50(1):1-9. doi:10.1520/JFS2004204.
28. Dal Cason T. A Review of the Birch - Benkeser Reduction Method. Clandestine
Laboratory Investigating Chemists
29. Bremer N, Woolery R. The Yield of Methamphetamine, Unreacted Precursor and
Birch By-Product with the Lithium-Ammonia Reduction Method as Employed in
Clandestine Laboratories. MAFS Newsl. 1999;(Fall 1999):8-16.
30. Methamphetamine byproduct from birch reduction tentatively identified. J
Clandestine Investig Chem Assoc. 1997;7(2):7-10.
31. Kunalan V, Kerr WJ, NicDaéid N. Clarification of route specific impurities found
in methylamphetamine synthesised using the Birch method. Forensic Sci Int.
2012;223(1–3):321-329. doi:10.1016/j.forsciint.2012.10.008.
32. Martinez F, Roesch D, Jacobs J. Isolation of Methamphetamine From 1 (1’,4’
Cyclohexadienyl) 2 Methyl. J Clandestine Investig Chem Assoc. 2008;18(1):18-22.
33. Heegel R, Northrop D. “One-Pot” Methamphetamine Manufacture via the
Lithium-Ammonia Method with Multi-Ingredient, Liquid, and/or Soft-gel
Pseudoephedrine Preparations. J Clandestine Lab Investig Chem Assoc. 2006;16(1):25-
28.
34. Brzeczko AW, Leech R, Stark JG. The advent of a new pseudoephedrine product
to combat methamphetamine abuse. Am J Drug Alcohol Abuse. 2013;39(5):284-290.
doi:10.3109/00952990.2013.821476.
35. Wagner J, Green M, Ciesielski A, Pretorius D. One Pot Methamphetamine
Production Source Term Characterization. National Institute of Justice; 2016.
36. McKibben TD. Discussions About Water Solubility - Diethyl Ether versus
Camping Fuel. 2017.
37. Shukla RK, Crump JL, Chrisco ES. An evolving problem: Methamphetamine
production and trafficking in the United States. Int J Drug Policy. 2012;23(6):426-435.
doi:10.1016/j.drugpo.2012.07.004.
38. United Nations Office on Drugs and Crime. World Drug Report 2016 - Number
of clandestine laboratories detected, 2011-2013.
http://www.unodc.org/wdr2016/field/11.1._Clandestine_laboratories_detected_and_dism
antled.pdf. Published 2016. Accessed August 19, 2016.
39. Synthetic Drug Control Strategy: A Focus on Methamphetamine and Prescription
Drug Abuse. DIANE Publishing; 2011.
40. 2015 National Drug Threat Assessment Summary. 2015.
https://www.dea.gov/docs/2015%20NDTA%20Report.pdf.

137
41. Bartos L. Meth Production is Toxic to Communities. NEBLINE Newsletter.
http://lancaster.unl.edu/family/methtoxic.shtml. Published July 2005.
42. Street D. An Investigator’s Guide to the Methamphetamine Lab. Police: The Law
Enforcement Magazine. http://www.policemag.com/channel/patrol/articles/2000/12/an-
investigator-s-guide-to-the-methamphetamine-lab.aspx. Published 2000. Accessed
September 11, 2016.
43. Green M, Kuk R, Wagner J. Collection and Analysis of Fire Debris Evidence to
Detect Methamphetamine, Pseudoephedrine, and Ignitable Liquids in Fire Scenes at
Suspected Clandestine Laboratories. J Forensic Chem. IN PRESS.
44. Firnbach D. Gladwin City Police Discover One-Pot Meth Lab.
http://www.9and10news.com/story/30131687/gladwin-city-police-discover-one-pot-
meth-lab. Accessed April 6, 2017.
45. Thrasher R. Methamphetamine Waste Introduced To The Waste Water System.
2016.
46. Waters Corporation. Beginnger’s Guide to SPE - Solid-Phase Extraction. Waters.
https://waters.com/waters/en_US/Beginner%27s-Guide-to-SPE-%5BSolid-Phase-
Extraction%5D/nav.htm?cid=134721476.
47. Couper F, Logan B. Drugs and Human Performance Fact Sheets. National
Highway Traffic Safety Administration; 2014. https://www.epa.gov/foia/national-
highway-traffic-safety-administration. Accessed September 13, 2016.
48. Chiaia-Hernandez AC, Banta-Green CJ, Field JA. Interpreting methamphetamine
levels in a high-use community. Environ Sci Pollut Res. 2011;18(9):1471-1477.
doi:10.1007/s11356-011-0495-3.
49. Daughton CG, Ternes TA. Pharmaceuticals and personal care products in the
environment: agents of subtle change? Environ Health Perspect. 1999;107(Suppl 6):907-
938.
50. Postigo C, Lopez de Alda MJ, Barceló D. Fully Automated Determination in the
Low Nanogram per Liter Level of Different Classes of Drugs of Abuse in Sewage Water
by On-Line Solid-Phase Extraction-Liquid Chromatography−Electrospray-Tandem Mass
Spectrometry. Anal Chem. 2008;80(9):3123-3134. doi:10.1021/ac702060j.
51. Östman M, Fick J, Näsström E, Lindberg RH. A snapshot of illicit drug use in
Sweden acquired through sewage water analysis. Sci Total Environ. 2014;472:862-871.
doi:10.1016/j.scitotenv.2013.11.081.
52. González-Mariño I, Quintana JB, Rodríguez I, Cela R. Determination of drugs of
abuse in water by solid-phase extraction, derivatisation and gas chromatography–ion
trap-tandem mass spectrometry. J Chromatogr A. 2010;1217(11):1748-1760.
doi:10.1016/j.chroma.2010.01.046.
53. Banta-Green CJ, Field JA, Chiaia AC, Sudakin DL, Power L, De Montigny L.
The spatial epidemiology of cocaine, methamphetamine and 3,4-
methylenedioxymethamphetamine (MDMA) use: a demonstration using a population
measure of community drug load derived from municipal wastewater. Addiction.
2009;104(11):1874-1880. doi:10.1111/j.1360-0443.2009.02678.x.
54. Zuccato E, Castiglioni S, Tettamanti M, et al. Changes in illicit drug consumption
patterns in 2009 detected by wastewater analysis. Drug Alcohol Depend. 2011;118(2–
3):464-469. doi:10.1016/j.drugalcdep.2011.05.007.
55. Hillier K. Pseudoephedrine. XPharm Compr Pharmacol Ref.:2007.

138
56. Levine B. Principles of Forensic Toxicology. Amer. Assoc. for Clinical
Chemistry; 2003.
57. Fuh M-R, Wu T-Y, Lin T-Y. Determination of amphetamine and
methamphetamine in urine by solid phase extraction and ion-pair liquid chromatography–
electrospray–tandem mass spectrometry. Talanta. 2006;68(3):987-991.
doi:10.1016/j.talanta.2005.06.057.
58. Tatsuno M, Nishikawa M, Katagi M, Tsuchihashi H. Simultaneous Determination
of Illicit Drugs in Human Urine by Liquid Chromatography-Mass Spectrometry. J Anal
Toxicol. 1996;20(5):281-286. doi:10.1093/jat/20.5.281.
59. Cailleux A, Bouil AL, Auger B, Bonsergent G, Turcant A, Allain P.
Determination of Opiates and Cocaine and Its Metabolites in Biological Fluids by High-
Performance Liquid Chromatography with Electrospray Tandem Mass Spectrometry. J
Anal Toxicol. 1999;23(7):620-624. doi:10.1093/jat/23.7.620.
60. Jeanville PM, Estapé ES, Torres-Negrón I, Martí A. Rapid
Confirmation/Quantitation of Ecgonine Methyl Ester, Benzoylecgonine, and Cocaine in
Urine Using On-Line Extraction Coupled with Fast HPLC and Tandem Mass
Spectrometry. J Anal Toxicol. 2001;25(1):69-75. doi:10.1093/jat/25.1.69.
61. Andersson M, Gustavsson E, Stephanson N, Beck O. Direct injection LC–MS/MS
method for identification and quantification of amphetamine, methamphetamine, 3,4-
methylenedioxyamphetamine and 3,4-methylenedioxymethamphetamine in urine drug
testing. J Chromatogr B. 2008;861(1):22-28. doi:10.1016/j.jchromb.2007.11.025.
62. Foster BS, Gilbert DD, Hutchaleelaha A, Mayersohn M. Enantiomeric
Determination of Amphetamine and Methamphetamine in Urine by Precolumn
Derivatization with Marfey’s Reagent and HPLC. J Anal Toxicol. 1998;22(4):265-269.
doi:10.1093/jat/22.4.265.
63. Newmeyer MN, Concheiro M, Huestis MA. Rapid quantitative chiral
amphetamines liquid chromatography–tandem mass spectrometry: Method in plasma and
oral fluid with a cost-effective chiral derivatizing reagent. J Chromatogr A.
2014;1358:68-74. doi:10.1016/j.chroma.2014.06.096.
64. Dong Y, Yan K, Ma Y, et al. A Sensitive Dilute-and-Shoot Approach for the
Simultaneous Screening of 71 Stimulants and 7 Metabolites in Human Urine by LC–MS-
MS with Dynamic MRM. J Chromatogr Sci. 2015;53(9):1528-1535.
doi:10.1093/chromsci/bmv048.

VITA
Matthew Kevin Green
Candidate for the Degree of
Doctor of Philosophy
Thesis: ENVIRONMENTAL IMPACTS OF ONE POT METHAMPHETAMINE
LABORATORIES – CHARACTERIZATION AND DETECTION OF TRACE
MATERIALS
Major Field: Veterinary Biomedical Sciences
Biographical:
Education:
Completed the requirements for the Master of Science in Forensic Science at
Oklahoma State University, Tulsa, Oklahoma in 2014.
Completed the requirements for the Bachelor of Science in Forensic Biology at
Ohio Northern University, Ada, Ohio in 2012.
Experience:
Oklahoma State University Forensic Toxicology and Trace Laboratory
Integrated Toxicology – General and Technical Supervisor
Omega Laboratories, Inc. – Laboratory Intern
NES Clandestine Laboratory Safety Certification Program – Level A
NES Clandestine Laboratory Safety Certification Program – Level B
Professional Memberships:
American Academy of Forensic Sciences Student Affiliate – 2010-Present
Society of Forensic Toxicologists Student Member – 2014-Present