Environmental Impacts Analysis of Different Aircraft ...docs.trb.org/prp/14-3325.pdfEnvironmental...
15
Environmental Impacts Analysis of Different Aircraft Ground Propulsion Systems at Airport Rui Guo Graduate Research Assistant* Phone: 813-974-8906 [email protected] Yu Zhang 1 Assistant Professor* Phone: 813-974-5846 [email protected] Qing Wang Graduate Research Assistant* Phone: 813-974-8906 [email protected] 1 Corresponding Author *Department of Civil and Environmental Engineering University of South Florida 4202 E. Fowler Ave, ENB 118 Tampa, FL 33620 Fax: 813-974-2957 Total Words = 5226 + 250*6(3 Figures + 3 Tables) =6726 TRB 2014 Annual Meeting Original paper submittal - not revised by author
-
Upload
trinhquynh -
Category
Documents
-
view
218 -
download
4
Transcript of Environmental Impacts Analysis of Different Aircraft ...docs.trb.org/prp/14-3325.pdfEnvironmental...

Environmental Impacts Analysis of Different Aircraft Ground Propulsion Systems at Airport
Rui Guo
Graduate Research Assistant* Phone: 813-974-8906 [email protected] Yu Zhang1
Assistant Professor* Phone: 813-974-5846 [email protected] Qing Wang Graduate Research Assistant* Phone: 813-974-8906 [email protected] 1Corresponding Author *Department of Civil and Environmental Engineering University of South Florida 4202 E. Fowler Ave, ENB 118 Tampa, FL 33620 Fax: 813-974-2957
Total Words = 5226 + 250*6(3 Figures + 3 Tables) =6726
TRB 2014 Annual Meeting Original paper submittal - not revised by author
Guo, Zhang and Wang 1
ABSTRACT 1
The continuing increase of global air travel makes the environmental impact of aviation a 2
worldwide concern for sustainable development. To reduce fuel consumption and emissions 3
during surface movement at airport, different technologies of engineless taxiing have been 4
emerging in recent years. In this paper, we summarize the pros and cons of alternative aircraft 5
ground propulsion systems (AGPS) at airports and estimate the impacts they may have on the 6
environment. Given the operational data at the 10 busiest U.S. airports, a comparison of 7
environmental impacts is performed for four kinds of AGPS: conventional, single engine-on, 8
external, and on-board systems. The study quantifies the benefits of alternative AGPS at airports. 9
This study also provides some insights of future trends about adequately modeling and 10
quantifying environmental impacts of AGPS. In addition, this study provides stakeholders a 11
decision support tool for whether to proceed with the emerging technologies. 12
TRB 2014 Annual Meeting Original paper submittal - not revised by author

Guo, Zhang and Wang 2
1. INTRODUCTION 1
With the continuous growth of global air travel, the environmental impacts of aviation have 2
become a worldwide concern for sustainable development. In particular, aircraft operation at the 3
surface movement level contributes significantly to fuel consumption and emissions at airports. 4
To reduce fuel consumption and emissions during surface movement at airports, different 5
technologies of engineless taxiing have emerged in recent years. The consequent question is 6
whether and how to proceed with these emerging technologies in the aviation community. Thus 7
the ability to adequately measure and quantify fuel consumption and emissions of operational 8
alternatives at the airport level as well as system wide is of high importance. 9
At airports, aircraft emission amounts vary by aircraft operation modes and depend on the time 10
spent at each mode/phase during the Landing and Take Off cycle (LTO). LTO includes all 11
activities near the airport that take place below the altitude of 3000 feet (1000 m), which consists 12
of taxiing-out, taking-off and climbing out for departures, and descending, touching down, and 13
taxiing-in for arrivals, as illustrated in Figure 1 (1). Pushback is a procedure during which an 14
aircraft is pushed backwards away from an airport gate. Traditionally, pushbacks are carried out 15
by special, low-profile vehicles called pushback tractors or tugs, or by the aircraft itself with 16
engines on. Taxiing is the movement of an aircraft on the ground using taxiways between the 17
terminal gate and runway. Currently, an aircraft moves under its own power during both taxi-out 18
and taxi-in phases. The taxi-out time is defined as the time between the actual pushback and 19
wheels-off, and the taxi-in time is the time between actual wheels-on and gate-in. After exiting 20
from the taxiway, a departure aircraft sometimes stop at the end of the runway. Alternative 21
AGPS aims to change the current operations of taxi-in and taxi-out. Thus in this study, we focus 22
on the taxi-in and taxi-out phases during LTO at the surface movement level, without 23
consideration of the aircraft climb-out and descent. 24
25
FIGURE 1 Landing and Take-off Cycle at Airport (Source: ICAO). 26
Taxiing times are not negligible compared to flight time, especially at large, busy airports. On 27
average, a 21 percent taxi-out time increase has been reported from 1995 to 2007 (4). Table 1 28
shows the 10 airports with the largest taxi-out times in 2007 in the United States (4). At low 29
power settings during the current taxiing mode, combustion aircraft engines operate at low 30
TRB 2014 Annual Meeting Original paper submittal - not revised by author

Guo, Zhang and Wang 3
efficiency and generate a host of emissions at airports and adjacent areas. Due to congestion on 1
the airport surface, elongated taxiing delays also contribute to excessive fuel burn and emissions. 2
A recent study suggests that excessive taxiing delays account for nearly 50% of fuel burn and 3
emission at airports (2). The emissions escape into the local environment and lead to public 4
health concerns. There are two primary approaches to mitigating extra aircraft fuel usage and 5
emissions at airports. One is to develop more efficient operational strategies on airport surface 6
movement so as to optimize the operational performance and reduce the taxiing delay. The 2010 7
operational performance report (3) indicates that the average additional taxiing out time at major 8
U.S. airports is estimated to be 5 minutes per flight. Compared with other flight phases, the 9
excess fuel burn during taxiing out is estimated to be 75 kg per flight, accounting for about 26% 10
of fuel savings among the estimated benefit pool actionable by Air Navigation Service. Various 11
airport surface management methods have been tested at several airports in the US. The second 12
approach involves the development of aircraft technologies (such as, engineless taxiing, fuel 13
efficient engine design, and alternative jet fuels). Such improvements require significant 14
technology breakthroughs and capital investment, among which, engineless taxiing has shown 15
the most promising progress and could be ready in the very near future. Hence, this study focuses 16
on emerging engineless taxiing technologies and estimates their environmental benefits. Given 17
the operational data at the top 10 busiest airports, this paper performs a comparison of the 18
environmental impacts for four kinds of AGPS systems: conventional, single engine-on, external 19
and on-board systems. 20
TABLE 1 Top 10 Airports with the Largest Taxi-out Times in 2007(4) 21
Airport Average Taxi-Out Time (mins)
1 New York, JFK, NY (JFK) 37.1
2 Newark, NJ (EWR) 29.6
3 New York, La Guardia, NY (LGA) 29.0
4 Philadelphia, PA (PHL) 25.5
5 Detroit, Metro Wayne County, MI (DTW) 20.8
6 Boston, Logan, MA (BOS) 20.6
7 Houston, George Bush, TX (IAH) 20.4
8 Minneapolis-St. Paul, MN (MSP) 20.3
9 Atlanta, Hartsfield-Jackson, GA (ATL) 19.9
10 Washington, Dulles, DC (IAD) 19.7
NOTE: Average taxi out time at Nantucket, MA was 19.8 minutes for 2007. However, service was provided only seasonally with an average of only two departures per day, and thus it is not included in this table.
22
The remainder of this paper is organized as follows. The next section reviews the literature 23
relative to alternative AGPS including single-engine taxiing, external, and on-board AGPS 24
systems. Afterwards, different scenarios are generated and the methodology to quantify fuel 25
consumption and different emissions in each scenario is proposed. Meanwhile, the data sources 26
of airport operations at top 10 airports and emission factors for each scenario are introduced. 27
Next, the results are presented and discussed, along with a comparison of different scenarios 28
TRB 2014 Annual Meeting Original paper submittal - not revised by author

Guo, Zhang and Wang 4
based on a normalization procedure. Finally, the summary and future work of this research is 1
discussed to provide insights of future trends about modeling and quantifying the environmental 2
impacts of AGPS at airports. The study results provide a decision support tool for stakeholders 3
that will be involved in deciding whether and how to proceed with the emerging technologies at 4
airports. 5
2. LITERATURE REVIEW 6
As mentioned before, the aircraft engines during conventional taxiing are operating at a low 7
speed, which results in very low efficiency and extensive emissions. In addition, landing gear 8
brakes are used during this phase, resulting in a considerable waste of energy and high brake 9
heating. Given the increasing concerns of climate change, energy saving and human health, eco-10
friendly operational strategies and alternative AGPS technologies have become an attractive 11
perspective in recent years. According to Re (5), the required functions for AGPS include: a) 12
performing gate pushback; b) moving the aircraft from standstill with a sufficient acceleration, 13
and c) driving the aircraft along the assigned taxi route. In this section, the single-engine taxiing 14
strategy, external AGPS that can be connected to the aircraft, and integrated on-board AGPS will 15
be reviewed, followed by the discussion of the pros and cons of each system. 16
2.1 Single-engine Taxiing 17
Single-engine taxiing is one of the most straightforward operational strategies. Single-engine 18
taxiing means taxiing with less than all engines, i.e. only using one engine for taxiing twin-19
engine aircrafts, or two engines for four-engine aircrafts (6). Studies have shown the benefits in 20
fuel consumption and emission reduction of this operational strategy during taxiing (6, 7). 21
Meanwhile, the use of a single engine during taxi-in and taxi-out phases can achieve a certain 22
level of engine life economy. 23
However, there are some issues with single-engine taxiing, especially the responsibility of such a 24
procedure to the airlines (5). Aircraft manufactures like Airbus pointed out that such procedures 25
need to be considered carefully, and operators have to define their field of application. For 26
example, this procedure is not recommended for uphill slopes or slippery surfaces, or when 27
deicing operations are required (7, 8). Besides, pilots must consider which engine, inner or outer 28
engine, to use for achieving the required operational performance. There are also safety concerns 29
such as jet blast and Foreign Object Damage (FOD) risk, especially for large engine, heavy 30
aircraft (e.g. A330, A380,B777 etc.) since they need more thrust for starting the aircraft and 31
steering when maneuvering sharp turns with engines not operating (9). 32
Single-engine taxiing is rarely used now in aircraft operations. Besides the concerns described 33
above, another reason that prevents pilots from using single-engine taxiing is the engine warm-34
up time (typically 2-5 mins) needed for other engines to be warmed for take-off (6, 7, and 8). 35
The engine warm-up time adds to the complexity of handling aircraft during the taxiing phase. 36
At busy airports where demand is close to and sometimes exceeds capacity, pilots cautiously 37
keep their positions in the take-off queue and intend to eliminate any additional uncertainties. 38
2.2 External AGPS 39
TRB 2014 Annual Meeting Original paper submittal - not revised by author

Guo, Zhang and Wang 5
External AGPS systems are tractors or vehicles that can be attached to aircrafts for towing 1
between airport gates and runways. They are different from conventional pushback tugs, which 2
are only used for backward movement from gates to hand-off points. The emerging automated 3
systems are proposed to tow the aircraft for the entire ground movement. This procedure is also 4
known as dispatch towing (5, 7). While aircraft engines can use limited alternative jet fuel, the 5
tractors in external systems can be powered by many different kinds of renewable energy. 6
In the class of external systems, the TaxiBot system, developed by Israel Aerospace Industries, 7
has been tested at France’s Chateauroux airport, with service entry scheduled for 2016 (10). 8
TaxiBot system, a semi-robotic towbarless tractor, is featured with a diesel engine and 9
electrically-driven wheels. It is connected to the aircraft by embracing the Nose Landing Gear 10
(NLG) and loading it onto a platform instead of using a conventional towbar (5). The nose-wheel 11
platform also allows for some lateral movement to absorb loads and avoid nose-gear damage 12
(10).The potential benefits of the TaxiBot system include reduced fuel consumption, emissions, 13
noise, and levels of FOD, which could result in substantial savings for airline operators and the 14
commercial airline industry (11). 15
Aforementioned external systems, however, also have some disadvantages. It is suggested in 16
Cleansky 2011(12) that the TaxiBot system may need a grid of roads parallel to the taxiways that 17
tractors would use for non-towing travels. Similarly, dedicated parking areas may be needed to 18
provide a safe place near the runway for tractors waiting for a landing aircraft (5). Besides the 19
construction costs, the maintenance of additional infrastructure and operating costs (e.g. 20
additional drivers of tractors, advanced guidance systems) at airports would increase 21
simultaneously. The airport, and eventually airport users, will have to bear the capital cost of 22
infrastructure investment, the purchasing expenses of such systems, and additional operating cost. 23
Furthermore, such external systems add tractor traffic on the ground and increase the 24
complexities of airport operations. Although the complexity of additional traffic can be 25
alleviated by the grid of roads dedicated to external systems, it requires the consolidation of the 26
control of ramp operations and active movement area (taxiways and runways) operations, which 27
are currently controlled by different entities. 28
2.3 On-board AGPS 29
The integrated on-board AGPS systems eliminate the use of airplane engines during taxi-in and 30
until immediately prior to take-off during taxi-out, which is similar to external systems. The 31
difference is that on-board systems are based on electric traction from additional electric motors 32
installed in the wheels of the landing gear or main gears. They also have the great potential of 33
reducing emissions, fuel usage, and foreign object engine damage from runway debris. 34
Representatives of this class of systems are WheelTug and Electric Green Taxiing System 35
(EGTS). 36
WheelTug, a subsidiary of Borealis Exploration Limited, is a fully integrated AGPS for aircraft, 37
which is driven by a twin induction machine from Chorus Motors integrated within the NLG 38
(13). The integration can be easier in NLG because of its simpler structure, in particular because 39
of the absence of the brakes (5). In 2005, the feasibility of WheelTug has been successfully 40
demonstrated in a proof-of-concept ground test using a Boeing 767 aircraft. In 2010, the 41
WheelTug system was tested on a Boeing 737-800 under winter conditions at Prague airport. 42
TRB 2014 Annual Meeting Original paper submittal - not revised by author

Guo, Zhang and Wang 6
Different from WheelTug, EGTS, developed in partnership by Honeywell and Safran, is featured 1
with a direct-drive motor integrated within the main gears (14, 15). The feasibility and 2
electromagnetic design of this direct drive wheel actuator for green taxiing is discussed in (15). 3
As pointed out by Re (5), the challenges are the thermal behavior of the motor, the thermal 4
influence of the neighboring brakes and dealing with the takeoff and landing phases as no 5
mechanical clutch is foreseen. 6
WheelTug and EGTS systems use the onboard Auxiliary Power Unit (APU) to power motors in 7
the aircraft wheels, which allows aircraft to taxi without turning on the main engines. They aim 8
to improve the operational efficiency by reducing fuel and other taxi related costs, as well as 9
providing environmental benefits by slashing the emissions created during engine-on taxiing 10
operations. Nevertheless, besides the aforementioned challenges from the thermal behavior of 11
the motor, a key issue of on-board AGPS is the additional weight added to the aircraft. The 12
added weight includes, but is not limited to, the weights from the on-board generator, the motor 13
controllers and the electric motors (5). Although engineless taxiing would potentially save fuel 14
during the LTO mode, the additional weight from on-board AGPS would result in relatively 15
lower fuel efficiency during cruise mode. Some studies conducted the analysis of global fuel 16
saving from on-board AGPS, with the consideration of the trade-off of fuel burn between en-17
route phase and taxiing phase due to additional weight of the systems (16, 17). The comparison 18
analysis showed global fuel reduction of up to 2.5% for mid-sized aircraft with a 500kg on-board 19
AGPS in reference (16) and the global fuel savings between 1.1% and 3.9% based on US 20
domestic flights in 2007 with a 1,000kg on-board AGPS in reference (17). 21
In summary, the recent emerging alternative AGPS systems are developed mainly to gain 22
environmental benefits. Table 2 summarizes the features as well as the pros and cons of each 23
AGPS. It is very likely that some or all of the systems will be implemented at airports in the near 24
future. To help stakeholders make decisions on which system to implement, more quantitative 25
analysis and comparison of the benefits of AGPS are needed. With the concern of sustainable 26
development, this paper focuses on the environmental impact of these innovative systems. 27
TABLE 2 Features, Pros and Cons for Different AGPS at Airport 28
Alternative AGPS Main Features Pros Cons
Single-engine less than all engines operating
Energy efficiency
Emission reduction
Less noise
Extra infrastructure costs Congestion and safety issues
External Systems
TaxiBot Hybrid diesel-electric tractor Extensive equipment investment, system development and operations & congestion and safety concerns
Others Potentially using alternative energy
On-board Systems
WheelTug Additional motor at nose landing gear powered by onboard APU Extra weight and fuel
consumptions in en-route phase & APU modification needs
EGTS Additional motor at the main wheels powered by onboard APU
Others Powered by alternative energy, electricity, fuel cell (18), etc.
TRB 2014 Annual Meeting Original paper submittal - not revised by author
Guo, Zhang and Wang 7
3. METHODOLOGY & DATA SOURCES 1
The environmental impact of air transportation can be categorized into global and local groups. 2
The global environmental impact is mainly associated with greenhouse gas emission, which 3
contributes to global warming and climate change. The local environmental impact is usually 4
associated with air pollutant emissions, noise and water contamination. Air pollutant emissions 5
have been attracting increasing concerns from the public, because they affect air quality and are 6
detrimental to human health, especially in the local area. In this study, we focus on three 7
pollutant species, namely, carbon monoxide (CO), Nitrogen oxides (NOx) and Hydrocarbon 8
(HC). CO emission is a colorless, odorless, non-irritating but very poisonous gas. It is a product 9
from incomplete combustion of fuel and vehicular exhaust is a major source of this type of 10
pollutant. HC emissions result from fuel that does not burn completely in the engine. It reacts 11
with nitrogen oxides and sunlight to form ozone, which is the major component of smog. NOx 12
refers to nitric oxide (NO) and nitrogen dioxide (NO2), which lead to the formation of ozone and 13
contribute to the formation of smog and acid rain (19). NOx also causes irritation to human 14
mucus membranes, reduces lung function and increases risks of respiratory problems. All of 15
these emissions have negative impacts on local air quality (e.g. smog and acid rain) and cause 16
health problems to human beings at airports and its adjacent areas. 17
3.1 Methodology for Emissions Estimation 18
Four scenarios are generated for quantifying and comparing the environmental impacts of airport 19
surface movement: 1) Baseline scenario-conventional taxiing; 2) The single-engine taxiing 20
scenario; 3) External AGPS scenario: TaxiBot system; and 4) On-board AGPS scenario: 21
WheelTug and EGTS. In these four scenarios, emissions at airports can be generated from the 22
backward movement (pushback phase), forward movement (taxi-out and taxi-in phases) and 23
engine start. Since the emissions from backward movement and engine start are usually fixed 24
and almost the same in all scenarios, this study only conducts a comparison of emissions from 25
forward movement based on taxi-out and taxi-in times of airport surface movement. Furthermore, 26
single-engine operation and emerging systems all claim their taxiing speeds are no less than the 27
speed of conventional taxiing (10, 11, 13 and 14), thus the potential environmental benefits of 28
alternative AGPS are conservatively estimated based on the current operating time assuming the 29
taxiing speeds with different AGPS are the same. 30
Scenario 1-Conventional taxiing 31
For conventional taxiing, the International Civil Aviation Organization (ICAO) suggests three 32
approaches to quantify aircraft engine emissions: simple approach, advanced approach and 33
sophisticated approach (1, 20). Note that the sophisticated approach still needs further 34
development with the expectation of more accurate emission estimation (20). In our study, the 35
advanced approach, which reflects an increased level of refinement regarding aircraft types, 36
emission indices calculations and time-in-mode, is adopted. Compared with the simple approach, 37
this approach represents a more accurate estimation of aircraft engine emissions. 38
Based on the ICAO fuel burn indices, the fuel burn during taxiing of flight i in kg, denoted Fi, 39
could be estimated by 40
Fi =∑ ∗ 60 ∗ ∗ (1) 41
TRB 2014 Annual Meeting Original paper submittal - not revised by author

Guo, Zhang and Wang 8
Where Tim is the time-in-mode for mode m (e.g. taxi-in and taxi-out), in minutes, for flight i, Ni is 1
the number of engines on flight i and FFim is the fuel flow index in mode m (e.g. taxi-in and taxi-2
out), for each engine used on flight i (in kg/sec). 3
The emissions from flight i for each pollutant j (e.g. NOx, CO or HC), denoted Eij, in grams, for 4
taxiing, are calculated by 5
Eij =∑ ∗ 60 ∗ ∗ ∗ (2) 6
Where EIim is the emission index for pollutant j (e.g. NOx, CO or HC) from each engine on flight 7
i, measured in grams of pollutant per kilogram of fuel consumed (g/kg of fuel), in mode m (e.g. 8
taxi-in and taxi-out). By summing the above quantities over all departures and arrivals in the 9
system or at any particular airport, the total fuel consumption and emissions can be obtained. 10
Scenario 2-Single-engine taxiing 11
In the single-engine taxiing scenario, aircrafts taxi with less than all engines operating. Assuming 12
the use of one engine for taxiing twin-engine aircrafts and two engines for four-engine aircrafts, 13
the single-engine taxiing fuel consumption of flight i in kg, denoted as , can be estimated 14
by 15
= ∑ ∗ 60 ∗ 2⁄ ∗ (3) 16
The single-engine taxiing emissions from flight i for each pollutant j (denoted Eij, in kg) is 17
calculated by 18
=∑ ∗ 60 ∗ 2⁄ ∗ ∗ (4) 19
Scenario 3- External AGPS 20
In Scenario 3, fuel consumption and emissions from engineless taxiing are generated from 21
towing vehicles. For external AGPS, similar to push-back tugs, the emissions depend on the type 22
of energy powering the towing vehicles as well as required engine horsepower. The following 23
equations calculate the fuel consumption (in kg) and emissions of pollutant j from the towing 24
vehicle type t (in grams), for flight i respectively. 25
=∑ ∗ 60 ∗ ∗ ∗ (5) 26
=∑ ∗ 60 ∗ ∗ ∗ (6) 27
Where is the fuel flow index in mode m (e.g. taxi-in and taxi-out), corresponding to the 28
engine-fuel type of vehicle t used to tow aircraft i (in kg/BHP-sec), BHP is the average rated 29
brake horsepower (BHP) of the towing vehicle engine, LF is the load factor utilized in the 30
operation. And is the emission index for each pollutant j, in grams per BHP-sec, which is 31
specific to a given engine-fuel type of vehicle t. 32
In this scenario, a particular case, TaxiBot system featured with hybrid diesel-electric vehicle is 33
considered. The case study can be potentially extended to include other alternative energy for 34
TRB 2014 Annual Meeting Original paper submittal - not revised by author

Guo, Zhang and Wang 9
powering the external system. To simplify the problem, the possible additional travel time and 1
excess delays due to the increase of traffic from external systems are not considered in this study. 2
Scenario 4- On-board AGPS 3
In Scenario 4, the on-board systems are driven by electric motors integrated with the wheels, 4
with power supplied by the onboard APUs. According to Re (5), only minor, if any, 5
modifications of the APUs would be required for on-board AGPS. Instead, a change would be 6
needed in the usage procedures of APU and the details can be found in reference (5). Thus, we 7
assume the fuel flow and emission index for different APU models keep the same as those of 8
conventional APUs. APUs burn a certain amount of jet fuel and create exhaust emissions like 9
aircraft main engines. The methodology for calculating emissions from APUs is adapted from 10
the U.S. EPA’s Procedures for Emissions Inventory Preparation (21). Equations (7) and (8) 11
calculate the fuel consumption and pollutant emissions from an APU on flight i based on APU 12
operating time, fuel flow, and the emission indices for the specific APU. 13
=∑ ∗ 60 ∗ (7) 14
=∑ ∗ 60 ∗ ∗ (8) 15
Where is the fuel flow index in mode m, for specific APU used on flight i (in kg/sec), 16
is the emission index for pollutant j, for each APU used on flight i, measured in grams of 17
pollutant per kilogram of fuel consumed (g/kg of fuel). 18
3.2 Data Sources 19
Based on the above methodology, we summarize the types of data needed for emission 20
estimations: 1) aircraft type, number of engine, engine type or APU model; 2) operating time; 3) 21
number of operations/flights; and 4) fuel and emission index for each scenario. 22
The first three types of data can be obtained from the Aviation System Performance Metrics 23
(ASPM), which provides operational data of flights to and from the ASPM airports (22). The 24
ASPM dataset provides individual flight data including each flight’s scheduled and actual gate 25
departure time, runway wheel-off time, runway wheel-on time and gate arrival time, etc. Besides 26
operational data, detailed data of aircraft is retrieved from airline-fleets reference book, which 27
provides administrative information for all known commercial aircraft operators, plus technical 28
information on every aircraft over 3,000 lbs. For instance, current registration, type, serial 29
number, engine type and number, and maximum take-off weight can all be found in this 30
reference book (23). 31
The last type of data is gathered from different resources for each scenario. For the first two 32
scenarios, fuel and emission indices are obtained from ICAO Engine Emission Databank (24). 33
For Scenario 3, the BHP values for each aircraft and vehicle engine type, the corresponding fuel 34
consumption and emission coefficients are based on the data from FAA technical report (25). For 35
Scenario 4, ACRP Report 64 (26) provides the latest data on fuel flow and emission index from 36
onboard APUs for three distinct power settings: No-Load (lowest power setting used during the 37
“APU Start” mode), Environmental Control System (normal running condition used to support 38
the “Gate In” and “Gate Out” modes), and Main Engine Start (highest power setting used to 39
TRB 2014 Annual Meeting Original paper submittal - not revised by author
Guo, Zhang and Wang 10
support the start of the main engines). For Scenario 4, we use the highest power settings to 1
estimate the APU emissions. 2
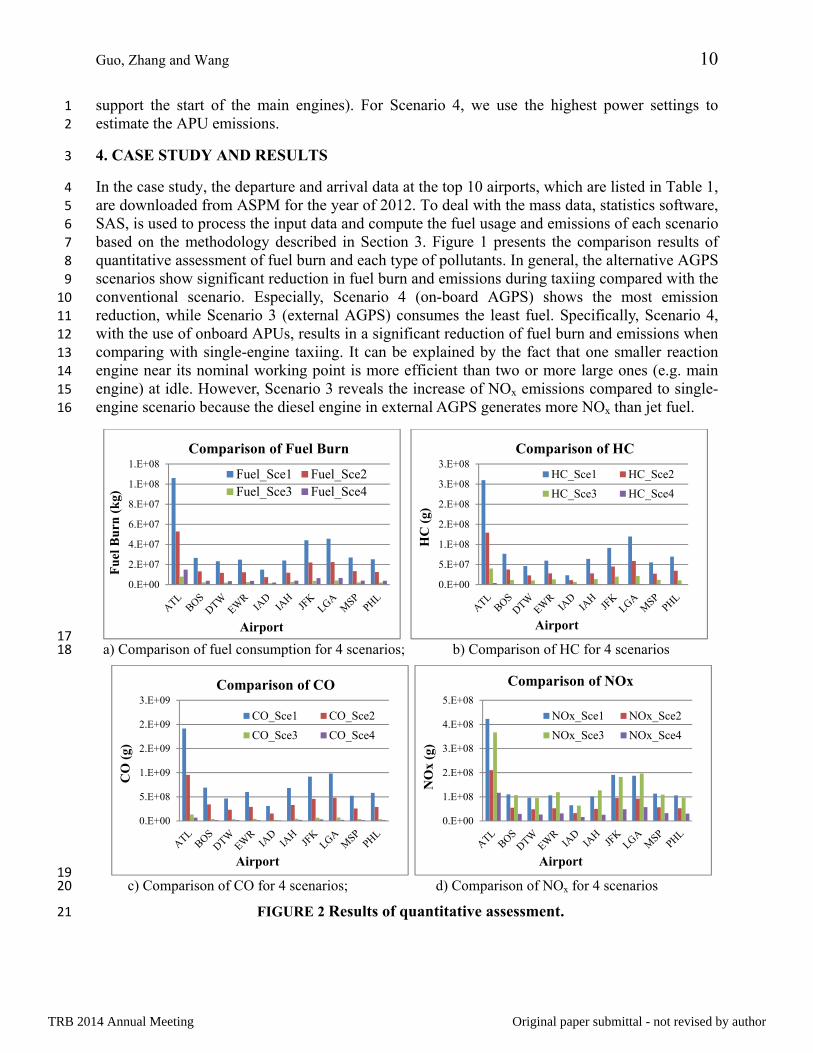
4. CASE STUDY AND RESULTS 3
In the case study, the departure and arrival data at the top 10 airports, which are listed in Table 1, 4
are downloaded from ASPM for the year of 2012. To deal with the mass data, statistics software, 5
SAS, is used to process the input data and compute the fuel usage and emissions of each scenario 6
based on the methodology described in Section 3. Figure 1 presents the comparison results of 7
quantitative assessment of fuel burn and each type of pollutants. In general, the alternative AGPS 8
scenarios show significant reduction in fuel burn and emissions during taxiing compared with the 9
conventional scenario. Especially, Scenario 4 (on-board AGPS) shows the most emission 10
reduction, while Scenario 3 (external AGPS) consumes the least fuel. Specifically, Scenario 4, 11
with the use of onboard APUs, results in a significant reduction of fuel burn and emissions when 12
comparing with single-engine taxiing. It can be explained by the fact that one smaller reaction 13
engine near its nominal working point is more efficient than two or more large ones (e.g. main 14
engine) at idle. However, Scenario 3 reveals the increase of NOx emissions compared to single-15
engine scenario because the diesel engine in external AGPS generates more NOx than jet fuel. 16
17 a) Comparison of fuel consumption for 4 scenarios; b) Comparison of HC for 4 scenarios 18
19 c) Comparison of CO for 4 scenarios; d) Comparison of NOx for 4 scenarios 20
FIGURE 2 Results of quantitative assessment. 21
0.E+00
2.E+07
4.E+07
6.E+07
8.E+07
1.E+08
1.E+08
Fu
el B
urn
(k
g)
Airport
Comparison of Fuel Burn
Fuel_Sce1 Fuel_Sce2Fuel_Sce3 Fuel_Sce4
0.E+00
5.E+07
1.E+08
2.E+08
2.E+08
3.E+08
3.E+08
HC
(g)
Airport
Comparison of HC
HC_Sce1 HC_Sce2
HC_Sce3 HC_Sce4
0.E+00
5.E+08
1.E+09
2.E+09
2.E+09
3.E+09
CO
(g)
Airport
Comparison of CO
CO_Sce1 CO_Sce2
CO_Sce3 CO_Sce4
0.E+00
1.E+08
2.E+08
3.E+08
4.E+08
5.E+08
NO
x (g
)
Airport
Comparison of NOx
NOx_Sce1 NOx_Sce2
NOx_Sce3 NOx_Sce4
TRB 2014 Annual Meeting Original paper submittal - not revised by author

Guo, Zhang and Wang 11
As mentioned above, Scenarios 3 and 4 show the best performance in different indicators (fuel 1
consumption or emissions). To allow different scenarios to be compared with a general indicator, 2
a normalization procedure is performed. The value of a normalized indicator of 1 is chosen to 3
correspond to the best environmental performance among the scenarios considered. Therefore, 4
normalized indicator, (N_Ind)i, for indicator i (fuel and air pollution emissions) is proposed 5
according to the following equation: 6
(N_Ind)i = (9) 7
Where are the reciprocal values of the indicator of fuel consumption and air pollution 8
emissions. denotes the maximum of the reciprocal values of these indicators. 9
Figure 3 and Table 3 present the normalized indicators and normalized general indicator for four 10
scenarios at 10 airports. The normalized general indicator is the normalization of general 11
indicator, which is the product of all normalized indicators. This is a simple geometrical 12
aggregation of criteria when the weighting coefficients are absent. The scenario with the best 13
environmental performance is associated with a generalized indicator of 1; as such a scenario 14
possesses all the advantages of the factors considered. Figure 3 shows the same trend of all the 15
normalized indicators for the 10 study airports. The calculated values of normalized general 16
indicators, in Table 3, indicate clearly that Scenario 4 (on-board AGPS) is the best in term of 17
environmental performance for all airports in this study. 18
19
20
FIGURE 3 Normalized indicators for four scenarios. 21
0
0.2
0.4
0.6
0.8
1
1.2
1 2 3 4
Nor
mal
ized
Val
ue
Scenario
Normalized Fuel Consumption
ATL BOS DTW EWR IADIAH JFK LGA MSP PHL
0
0.2
0.4
0.6
0.8
1
1.2
1 2 3 4
Nor
mal
ized
Val
ue
Scenario
Normalized HC
ATL BOS DTW EWR IADIAH JFK LGA MSP PHL
0
0.2
0.4
0.6
0.8
1
1.2
1 2 3 4
Nor
mal
ized
Val
ue
Scenario
Normalized CO
ATL BOS DTW EWR IADIAH JFK LGA MSP PHL
0
0.2
0.4
0.6
0.8
1
1.2
1 2 3 4
Nor
mal
ized
Val
ue
Scenario
Normalized NOx
ATL BOS DTW EWR IADIAH JFK LGA MSP PHL
TRB 2014 Annual Meeting Original paper submittal - not revised by author

Guo, Zhang and Wang 12
TABLE 3 Normalized General Indicator for Four Scenarios at 10 Airports 1
Airport ATL BOS
Scenarios Sce 1 Sce 2 Sce 3 Sce 4 Sce 1 Sce 2 Sce 3 Sce 4 Normalized general
indicator 2.3E-05 3.7E-04 3.2E-02 1.00 1.6E-05 2.6E-04 2.2E-02 1.00
Airport DTW EWR
Scenarios Sce 1 Sce 2 Sce 3 Sce 4 Sce 1 Sce 2 Sce 3 Sce 4 Normalized general
indicator 3.1E-05 4.9E-04 2.0E-02 1.00 2.0E-05 3.6E-04 1.1E-02 1.00
Airport IAD IAH
Scenarios Sce 1 Sce 2 Sce 3 Sce 4 Sce 1 Sce 2 Sce 3 Sce 4 Normalized general
indicator 3.2E-05 5.4E-04 1.6E-02 1.00 2.8E-05 5.5E-04 1.3E-02 1.00
Airport JFK LGA
Scenarios Sce 1 Sce 2 Sce 3 Sce 4 Sce 1 Sce 2 Sce 3 Sce 4 Normalized general
indicator 2.4E-05 4.0E-04 1.9E-02 1.00 1.4E-05 2.4E-04 1.1E-02 1.00
Airport MSP PHL
Scenarios Sce 1 Sce 2 Sce 3 Sce 4 Sce 1 Sce 2 Sce 3 Sce 4 Normalized general
indicator 2.8E-05 4.6E-04 2.1E-02 1.00 2.2E-05 3.6E-04 3.0E-02 1.00
2
5. CONCLUSIONS AND FUTURE WORK 3
In this study, local environmental impacts of different AGPS are evaluated by examining selected 4
air pollution emissions at the 10 busiest airports in the U.S. The main features of alternative 5
AGPS, as well as their pros and cons are discussed. Given the operational data at the 10 airports, 6
a comparison of environmental impacts is performed for four kinds of AGPS: conventional, 7
single engine-on, external and on-board systems. The study demonstrates that the alternative 8
AGPS can significantly reduce fuel burn and emissions during taxiing compared with the 9
conventional scenario. On-board AGPS shows the best performance in the emission reduction, 10
while external AGPS consumes the least fuel (diesel in the case study). When a general indicator 11
is considered, on-board AGPS shows the best potential of reducing local environmental impacts. 12
Although the manufactures provided benefit analysis during the testing of innovative AGPS, this 13
study provides a comprehensive comparison of different AGPS and provides a decision support 14
tool for stakeholders to determine whether and how to proceed with the emerging technologies. 15
One extension of this study could be generating more scenarios assuming some of the systems 16
(e.g. external AGPS) can be powered by alternative energy, such as biodiesel, hydrogen, and 17
electricity from wind or solar farms. In addition, noise, as one of the local environmental impacts 18
should also be considered. With more data and technical specifications of alternative AGPS 19
becoming available, the modeling and quantification of environmental impacts of alternative 20
AGPS will be more promising. In the future when the technologies are more mature, the study 21
can be extended to a more complete Environmental Impact Analysis (EIA) including economic 22
aspects and Life Cycle Analysis (LCA). 23
TRB 2014 Annual Meeting Original paper submittal - not revised by author

Guo, Zhang and Wang 13
REFERENCES 1
(1) International Civil Aviation Organization (ICAO). International Standards and 2
Recommended Practices, Annex 16, Environmental Protection: Aircraft Engine 3
Emissions. ICAO, 2008. 4
(2) Simaiakis, I., and H. Balakrishnan. Impact of congestion on taxi times, fuel burn, and 5
emissions at major airports. Transportation Research Record: Journal of the 6
Transportation Research Board, 2184, no. 1, 2010, pp22-30. 7
(3) Gulding, J., D. Knorr, M. Rose, J. Bonn, P. Enaud, and H. Hegendoerfer. US/Europe 8
comparison of ATM-related operational performance. Europe 4, no6, 2010, pp8. 9
(4) U.S. Department of Transportation, Research and Innovative Technology Administration, 10
Bureau of Transportation Statistics, Airline On-Time Performance Database. 11
(5) Re, F. Viability and state of the art of environmentally friendly aircraft taxiing systems. 12
In Electrical Systems for Aircraft, Railway and Ship Propulsion (ESARS), 2012b. IEEE, 13
2012, pp1-6. 14
(6) Kumar V, L. Sherry and T. Thompson. Analysis of Emissions Inventory for “Single-15
Engine Taxi-out” Operations. ICRAT-2008, Fairfax, VA, 2008. 16
(7) Deonandan, I., and H. Balakrishnan. Evaluation of Strategies for Reducing Taxi-out 17
Emissions at Airports. In 10th AIAA Aviation Technology, Integration and Operations 18
Conference 2010 (ATIO), Curran Associates, Inc., Red Hook, 2011, pp2251-2264. 19
(8) Airbus Customer Services, Flight Operations Support & Line Assistance: Getting to 20
Grips with Fuel Economy, July 2004. 21
(9) Heathrow Airport. An Industry Code of Practice: Reducing the Environmental Impacts 22
of Ground Operations and Departing Aircraft, Departures Code of Practice, 2012. 23
(10) Michael Gubisch. Flightglorbal: Pilots evaluate Taxibot before planned certification in 24
2013. http://www.flightglobal.com/news/articles/pilots-evaluate-taxibot-before-25
planned-certification-in-2013-379491/. Accessed July 23, 2013. 26
(11) Michael Gubisch. IN FOCUS: Manufacturers aim for electric taxi EIS by 2016. 27
http://www.flightglobal.com/news/articles/in-focus-manufacturers-aim-for-electric-28
taxi-eis-by-2016-368554/. Accessed July 23, 2013. 29
(12) Cleansky. TaxiBot, Cleansky "Dispatch Towing Vehicle (DTV)". CleanSky. [Online]. 30
Available: http://www.cleansky.eu/content/interview/taxibot-clean-sky-dispatch-31
towing-vehicle-dtv, 2011. Accessed July 23, 2013. 32
(13) WheelTug plc. WheelTug Driving Aerospace. http://www.wheeltug.gi/. Assessed July 33
23, 2013. 34
(14) SAFRAN. EGTS (electric green taxiing system). http://www.safranmbd.com/systems-35
equipment-178/electric-green-taxiing-system/. Accessed July 23, 2013. 36
(15) Raminosoa, T., T. Hamiti, M. Galea and C. Gerada. Feasibility and electromagnetic 37
design of direct drive wheel actuator for green taxiing. Energy Conversion Congress 38
and Exposition (ECCE), IEEE, 2011, pp2798-2804. 39
(16) Re, F. Assessing Environmental Benefits of Electric Aircraft Taxiing through Object-40
Oriented Simulation. SAE International Journal of Aerospace, 5(2), 2012, pp503-512. 41
(17) Dzikus, N., j. Fuchte, A. Lau and V. Gollnick. Potential for Fuel Reduction through 42
Electric Taxiing. 11th 26 AIAA Aviation Technology, Integration and Operations (ATIO) 43
Conference, including the AIAA 27 Balloon Systems Conference and 19th AIAA 44
Lighter-Than-Air Technology Conference, 2011, pp1829-1837. 45
TRB 2014 Annual Meeting Original paper submittal - not revised by author
Guo, Zhang and Wang 14
(18) German Aerospace Center DLR. DLR Airbus A320 ATRA taxis using fuel cell-powered 1
nose wheel for the first time. 2
http://www.dlr.de/dlr/en/desktopdefault.aspx/tabid-10204/296_read-931.Accessed July 3
23, 2013. 4
(19) U.S. Environmental Protection Agency (EPA). Air quality planning and standards, 5
EPA, 2012. 6
(20) Kurniawan, J. S., and S. Khardi. Comparison of methodologies estimating emissions of 7
aircraft pollutants, environmental impact assessment around airports. Environmental 8
Impact Assessment Review 31, no3, 2011, pp240-252. 9
(21) U.S. Environmental Protection Agency (EPA). Procedures for Emissions Inventory 10
Preparation, Volume IV , Chapter 5, 1992. 11
(22) Federal Aviation Administration (FAA). ASPM System Overview. 12
http://aspmhelp.faa.gov/index.php/ASPM_System_Overview. Accessed July 23, 2013. 13
(23) JP Airline-Fleets International 2010/11, Buchair UK Ltd, 44th edition (1 Jun 2010) 14
(24) International Civil Aviation Organization (ICAO). ICAO Engine Emissions Databank, 15
July 2007. 16
(25) Energy and Environmental Analysis, Inc. Technical Data to Support FAA's Advisory 17
Circular on Reducing Emissions from Commercial Aviation, September 1995. 18
(26) Environmental Science Associates. Handbook for Evaluating Emissions and Costs of 19
APUs and Alternative Systems. Vol. 64. Transportation Research Board National 20
Research, 2012. 21
TRB 2014 Annual Meeting Original paper submittal - not revised by author