
Environmental Impact and Risk Assessment for drilling of...
186
Environmental Impact and Risk Assessment for drilling of Five Appraisal well in the NELP-VII block MB-OSN-2005/3 of Western Offshore Basin Corporate Health, Safety and Environment Management New Delhi April 2017
-
Upload
truongphuc -
Category
Documents
-
view
227 -
download
3
Transcript of Environmental Impact and Risk Assessment for drilling of...

Environmental Impact and Risk Assessment for drilling of
Five Appraisal well in the NELP-VII block MB-OSN-2005/3
of Western Offshore Basin
Corporate Health, Safety and Environment Management
New Delhi
April 2017

Pre-drill EIA for the NELP block MB-OSN-2005/3 (5-Appraisal Wells) 2017
i
Executive summary
ONGC has acquired NELP-VII block MB-OSN-2005/3 as operator with 70% PI while the rest
30% is retained by Essar Energy. The exploratory block MB-OSN-2005/3 was initially awarded to M/s
Essar Energy as Operator along with M/s Noble Energy with 50% PI each. However, M/s Noble Energy
backed out from the consortium therefore, M/s Essar Energy became the sole operator with 100% PI.
Later on, a firm-out agreement was signed between ONGC and Essar Energy on 24.12.2014 whereby
ONGC acquired NELP- block MB-OSN-2005/3.
During the year 2015-16, a Well MBS053NAA-1 was drilled in this block for which EC was
obtained vide J11011/171/2015-1A II(I) DTD 04.01.2016. Testing of object-I in the interval (932- 938 m)
and object-II in the interval (581-583m & 585- 589m) flowed gas @ 47,128 m³/d and gas @ 21,282
m³/d respectively through ½” choke from Chinchini formation of Pliocene age in well MBS053NAA-1 .
This is the first discovery beyond the shelf margin and also in Pliocene formation in Mumbai Offshore
Basin.
The NELP-VII Block MB-OSN-2005/3 is located in the southwest of the Mumbai High-DCS
platform of Mumbai Offshore Basin, having an area of 1685 km2. Two wells, viz., SM-1-1 and SM-1-2
were drilled in the early nineties on the western flank of the block. It is approximately 44 km north-north-
east due SM-86 structure and about 80 Km north-west of D-1 hydrocarbon bearing structure. Deep
water nomination block BB-OS-DW-1 lies in the west of the block. The block is located in the shallow
water western offshore. In view of Hydrocarbon discovery in this block, five appraisal locations have
been planned for drilling during appraisal period, commencing from 1st April, 2016.
The Production Sharing Contract (PSC) requires conducting EIA studies and obtaining its
approval from MoEF&CC. It is also emphasized in the PSC that the contractor shall conduct its
petroleum operations with due regard to and concern with respect to protection of the environment and
conservation of natural resources.
The area in and around the block had been extensively explored for hydrocarbon prospectivity.
To assess the baseline environmental status of the block, data from the adjacent area and wells have
been gathered and analyzed by IPSHEM, ONGC, Goa. In addition, secondary information on
meteorology, biological characteristics of nearest beaches and coastal area and ocean hydrography
have been obtained from literature reviews and information available in the public domain.
The baseline data comprise of chemical characteristics dissolved oxygen, nutrients like nitrate,
nitrite, phosphate and silicate and presented briefly in the following lines.
Temperature is found to vary from 26.2 to 28.3 °C with the average 27.31 °C. The surface
layer showed higher temperature at all the sampling stations varying from 26.0-26.9 °C. The observed
range of temperature variation is well in normal limits for the coastal waters.
pH is found to vary from 7.12-8.30 the average pH values were detected of 7.78 and 7.67
respectively. No particular trend is followed regarding the distribution of pH, though all the observed pH
values are well within normal limits.

Pre-drill EIA for the NELP block MB-OSN-2005/3 (5-Appraisal Wells) 2017
ii
Salinity around the points of observation depicts variation from 31.5-37.5 PSU the average
salinity values were detected of 34.4 PSU and 35.57 PSU respectively. The observed salinity values
are similar to those observed at the reference stations and the values are well within acceptable limits.
Turbidity is found to vary from 3.4 – 17.4 NTU. The variation of turbidity has followed no trend
and the observed turbidity indicate normal values for the seawater at the site.
TDS vary from 9-38 mg/l. However comparing the values with reference point; disturbance of
operational activity cannot be concluded. The observed values are within normal limits for the coastal
seawater
Dissolved Oxygen (DO) concentrations are considered to be very vital parameter to assess the
health of the marine environment especially where exploration and production activities are in progress.
DO variation from 3.24-5.38 mg/l with an average 4.42 mg/l. It is observed that all obtained values are
most similar to the values obtained at reference station values and well within acceptable limits for the
coastal seawater.
Nutrients - Phosphate– Phosphorus (PP)’s variation is from 0.042–0.84 μmol/l with an average
PP values at 0.21 μmol/l. The vertical variation of phosphates at these stations showed no regular trend
of phosphorous. The values observed however are normal for the coastal seawater.
Nitrite–Nitrogen have been found to vary within the range of 0.008 – 0.026 μmol/l with an
average value 0.017 μmol/l. The Nitrite – Nitrogen values follow no particular trend and they are similar
at all the observation columns. The values observed are well within normal acceptable limits. Nitrate –
Nitrogen, on the other hand, vary from 0.015 – 4.5 μmol/l. The Nitrate – Nitrogen values follows no
particular trends and values are at lower side. The values are within normal acceptable limits.
Silicates are found to vary from 0.12-0.57 μmol/L. The observed values are normal for the
coastal seawater. Petroleum Hydrocarbons (PHC) values come under non detection level. The
distribution of PHC in the sediment samples has shown minute contamination, though all observed
valued values are acceptable limits.
Sediment Quality - The Total Phosphorous and Total Nitrogen’s concentration was measured
in the sediment samples has shown variation from 19.7—40.2 μg/g with the average 29.2 μg/g. The
Total Organic Carbon’s concentration was measured to vary from 1.9% to 4.7% with average value of
3.0%. The PHC’s concentration in the sediment samples has shown variation from 45.62– 86.74 mg/g
with an average of 64.055 mg/g. The values are within acceptable limits. The texture of sediment
samples has been analyzed and it has been observed that the composition of clay varies from 30% -
42% with average value of 36.71%.
The meteorological and climatological environment has been assessed from secondary data
available in the public domain and scouting the literature. The average rainfall in the Arabian sea is of
the order of 1-2 mm /day while the mean wind speed lies in the range of 6.1 to 6.8 m/sec. Maximum
and minimum value of mean air temperature in the Arabian Sea is of the order of 30.2 ºC and 24.4 ºC,
respectively. Mean air temperature of the area of exploratory block lies in the range of 26.5 ºC to 27.5
ºC. It is observed that monthly frequency of depression, cyclonic storm and severe cyclonic storm in the
Arabian Sea was highest for June followed by November and May in a year.

Pre-drill EIA for the NELP block MB-OSN-2005/3 (5-Appraisal Wells) 2017
iii
In addition, potential impacts on the environment have been assessed and duly incorporated in
the report. ONGC has an elaborate Disaster Management Programme (DMP) with an exhaustive
manual of disaster management methodologies that are capable of taking care of an eventuality of any
magnitude with the primal objective to impact the environment the least. Activities related to exploratory
drilling, namely, operational discharges like sanitary waste water, food waste and residuals, washing
fluids (deck drainage, rig floor washing etc.), cooling water, non-routine discharges that may be caused
by ballast water, chemical spills has the potential to impact marine water quality.
ONGC is committed to protect the environment through improving the effectiveness of
management and reporting systems and ensuring the reduction of local environmental impact from
operations by improving environmental performance and implementing initiatives for the conservation of
biodiversity and the resource recovery and reuse. ONGC places high emphasis on health and safety
aspects of workers and staff and will ensure that all activities will be conducted in a safe and skillful
manner with staff appropriately trained and equipment maintained in safe condition. ONGCs QHSE
management system entails continuous monitoring to be carried out for various aspects of the project,
environmental, safety and health impacts and the performance of EMP implementation.

Pre-drill EIA for the NELP block MB-OSN-2005/3 (5-Appraisal Wells) 2017
iv
To insert the certificate of Accreditations (from Corporate-HSE)

Pre-drill EIA for the NELP block MB-OSN-2005/3 (5-Appraisal Wells) 2017
v
To insert the table of functional experts (Corporate-HSE)

Pre-drill EIA for the NELP block MB-OSN-2005/3 (5-Appraisal Wells) 2017
vi
Contents
SL.NO. PAGE NO.
CHAPTER 1 INTRODUCTION 1
1.1 PURPOSE 1
1.2 IDENTIFICATION OF THE PROJECT PROPONENT & THE PROJECT
2
1.3 SCOPE OF STUDY 4
CHAPTER 2 TERMS OF REFERENCE 5
2.1 POINTWISE COMPLIANCE OF TOR 5
CHAPTER 3 PROJECT DESCRIPTION
3.1 TYPE OF THE PROJECT 10
3.2 LOCATION OF PROJECT 11
3.2.1 CRZ REGULATION APPLICABILITY 13
3.2.2 DRILLING WELL LOCATION 13
3.3 PROPOSED PROJECT SCHEDULE FOR APPROVAL AND IMPLEMENTATION
14
3.4 TECHNOLOGY AND PROCESS DESCRIPTION 14
3.4.1 SOURCE OF WATER 20
3.4.2 WATER USAGE PLAN 20
3.4.3 WASTEWATER GENERATION & DISCHARGE 21
3.4.4 CHEMICAL REQUIREMENTS AND THEIR STORAGE AT RIG 22
3.5 LITIGATIONS & COURT DIRECTIONS / ORDERS 23
3.6 ASSESSMENT OF NEW AND UNTESTED TECHNOLOGY 23
3.7 CLIMATOLOGY & METEOROLOGY OF THE ARABIAN SEA 24
CHAPTER 4 DESCRIPTION OF ENVIRONMENT 30
4.1 STUDY AREA 30
4.2 STUDY COMPONENTS 30
4.3 BASELINE ENVIRONMENT 31
4.3.1 OBJECTIVES AND SCOPE OF THE STUDY 31
4.3.2 SCOPE OF WORK 32
4.3.3 METHODOLOGY 32
4.3.4 ASSOCIATION OF BIOLOGICAL EXPERTISE 33
4.3.5 DESCRIPTION OF STUDY AREA AND SAMPLING LOCATIONS 34
4.3.6 EQUIPMENT USED FOR SAMPLING: 36
4.3.7 METHODOLOGY FOLLOWED FOR HYDROGRAPHICAL AND CHEMICAL PARAMETERS
40
4.3.7.1 HYDROGRAPHICAL PARAMETERS 40
4.3.7.2 CHEMICAL PARAMETERS 41
4.3.8 RESULTS AND DISCUSSION 43
4.3.8.1 TEMPERATURE 43
4.3.8.2 PH 43
SL.NO. PAGE NO.
4.3.8.3 SALINITY 43
4.3.8.4 TURBIDITY 44
4.3.8.5 TOTAL SUSPENDED SOLIDS 44
4.3.8.6 DISSOLVED OXYGEN DO 44
4.9 BIOLOGICAL MONITORING OF OFFSHORE STATIONS 59

Pre-drill EIA for the NELP block MB-OSN-2005/3 (5-Appraisal Wells) 2017
vii
4.3.9.1 METHODOLOGY OF BIOLOGICAL ANALYSIS 59
4.3.9.1.1 COLLECTION AND ANALYSIS OF CHLOROPHYLL-A 59
4.3.9.1.2 COLLECTION AND ANALYSIS OF PHYTOPLANKTON: 59
4.3.9.1.3 ZOOPLANKTON COLLECTION AND ANALYSIS 60
4.3.9.1.4 FISH & FISHERY 61
4.3.9.2 RESULTS AND DISCUSSION 61
CHAPTER 5 ANTICIPATED ENVIRONMENTAL IMPACTS AND MITIGATION MEASURES
79
5.1 ENVIRONMENTAL IMPACTS IDENTIFIED 82
5.1.1 IMPACTS ON AIR ENVIRONMENT 82
5.1.2 IMPACTS OF NOISE 83
5.1.3 IMPACTS ON MARINE WATER AND SEDIMENT 85
5.1.4 IMPACTS ON MARINE WATER QUALITY 85
5.1.5 DISPOSAL OF DRILL CUTTINGS AND RESIDUAL WBM 86
5.1.6 IMPACT ON BENTHIC FAUNA 87
5.1.7 NON ROUTINE DISCHARGES 89
5.1.8 MARINE ECOLOGICAL IMPACTS 89
5.1.9 IMPACT EVALUATION 89
5.2 RIG MOVEMENT AND ANCHORING 90
5.2.1 SPUDDING THE WELL 90
5.2.2 DISCHARGE OF DRILLING MUD AND CUTTINGS 90
5.2.3 OTHER AQUEOUS DISCHARGES 91
5.3 DIESEL SPILLS 91
5.3.1 BLOW OUTS AND OTHER OIL SPILLS 91
5.4 IMPACT SIGNIFICANCE 92
5.5 IMPACT MITIGATION MEASURES 93
5.5.1 AIR ENVIRONMENT 94
5.5.2 WATER ENVIRONMENT 95
5.5.3 IMPACT ON BIOTA 95
5.5.4 5.5.4 OCCUPATIONAL HEALTH HAZARDS FROM NOISE POLLUTION
96
5.5.5 NOISE IMPACTS DUE TO DRILLING ACTIVITIES 96
5.5.6 WASTE GENERATION AND MANAGEMENT 96
5.5.7 RESPONSE OF MARINE ECOSYSTEMS TO OIL SPILLS 97
5.6 RESOURCE SENSITIVITY ASSESSMENT 97
CHAPTER 6 ENVIRONMENTA MANAGEMENT PLAN 96
6.1 PHYSICAL PRESENCE OF DRILLING RIG AND MOVEMENT OF VESSELS
99
6.2 EMISSIONS AND DISCHARGES FROM DRILLING OPERATIONS
99
6.2.1 ATMOSPHERIC EMISSIONS 99
6.2.2 NOISE LEVELS AND NOISE ABATEMENT 100
6.2.3 MARINE DISCHARGES 100
6.3 OIL SPILL CONTINGENCY PLAN 102
6.4 OCCUPATIONAL HEALTH 105
6.5 H2S PROTECTION IN DRILLING OPERATIONS 107
6.6 SUMMARY OF ENVIRONMENTAL MANAGEMENT PLAN 110
CHAPTER 7 ANALYSIS OF ALTERNATIVES (TECHNOLOGY AND SITE)
7.1 DRILLING LOCATIONS 112

Pre-drill EIA for the NELP block MB-OSN-2005/3 (5-Appraisal Wells) 2017
viii
CHAPTER 8 ENVIRONMENTAL MONITORING PROGRAMM 113
8.1 BUDGET AND PROC. SCHEDULES OF ENVIRONMENTAL MONITORING
114
CHAPTER 9 ADDITIONAL STUDIES
9.1 RISK ASSESSMENT 115
9.1.1 STAGES FOR WHICH RISK ASSESSMENTS ARE UNDERTAKEN
115
9.1.1.1 OBJECTIVE OF QRA 116
9.1.1.2 RISK ASSESSMENT METHODOLOGY 117
9.1.1.3 HAZARD IDENTIFICATION 117
9.1.1.4 FREQUENCY ANALYSIS 119
9.1.1.5 CONSEQUENCE ANALYSIS 120
9.1.1.6 RISK EVALUATION 121
9.1.2 KEY RISKS INVOLVED 122
9.1.2.1 BLOWOUTS 123
9.1.2.2 COLLISIONS INVOLVING MODU (JACK-UP DRILLING RIG) 125
9.1.2.3 HELICOPTER CRASHES 127
9.1.3 RISK MITIGATION MEASURES 129
9.1.3.1 WELL PLANNING & DESIGN 129
9.1.3.2 SELECTION OF EQUIPMENT, SYSTEMS AND PEOPLE 132
9.1.3.3 TESTING AND MAINTENANCE OF CRITICAL EQUIPMENT 134
9.1.3.4 SELECTION OF SUPPORT SERVICES 135
9.1.3.5 ENSURING MARINE INTEGRITY 135
9.1.4 H2S EMISSION CONTROL PLANS 137
9.1.4.1 DETECTION AND ALARM SYSTEMS 137
9.1.4.2 VISUAL WARNING SIGNS 138
9.1.4.3 MUSTER STATION AND ESCAPE ROUTE 138
9.1.4.4 VENTILATION 138
9.1.4.5 H2S KICK CONTROL 139
9.2 DISASTER MANAGEMENT PLAN 139
9.2.1 PURPOSE & SCOPE OF THE PLAN 140
9.2.1.1 UPDATING AND EXERCISES 140
9.2.1.2 DISASTER MANAGEMENT PREPAREDNESS 141
9.2.1.3 ON SCENE COORDINATOR 141
9.2.1.4 SITE CONTROL ROOM 142
9.2.1.5 COMMUNICATION 142
9.3 OIL SPILL RISK ASSESSMENT 143
9.3.1 OIL SPILL SCENARIOS 143
9.3.1.1 MARINE & COASTAL FEATURES SENSITIVE TO OIL SPILLS 143
9.3.1.2 ASSESSMENT OF RISKS DUE TO OIL SPILLS 144
9.3.1.3 OIL SPILL CONTINGENCY PLAN 144
9.3.1.4 PROJECT NEED & BENEFITS 150
CHAPTER 10 ENVIRONMENT MANAGEMENT PLAN 152
10.1 SELECTION OF DRILLING LOCATION AND NAVIGATIONAL PATH WAYS
152
10.2 ATMOSPHERIC EMISSIONS 153
10.3 STORAGE AND HANDLING OF CHEMICALS AND SUPPLIES 154
10.4 MANAGEMENT OF DRILL CUTTINGS & DRILLING MUD 154

Pre-drill EIA for the NELP block MB-OSN-2005/3 (5-Appraisal Wells) 2017
ix
10.5 OILY WATER DISCHARGES AND OTHER WASTES 155
10.6 MANAGEMENT MANUAL 158
10.7 MANAGEMENT SYSTEM PROCEDURES AND DOCUMENTATION
159
Chapter 11 ORGANISATIONAL STRUCTURE AND IMPLEMENTATION FRAME WORK
162
11.1 CAPITAL AND RECURRING COST FOR ENV. POLLUTION CONTROL MEASURES
163
11.2 DISCLOSURES OF CONSULTANTS ENGAGED 163
11.3 EIA CONSULTANT ENGAGED 163
11.4 AGENCY ENGAGED FOR CRZ MAPPING 163
Chapter 12 BIBLIOGRAPHY 164
ANNEXURE-I TOR ISSUED BY MOEF&CC FOR THE NELP VII BLOCK MB-OSN-2005/3 (SCANNED COPY)
167
ANNEXURE-II LETTER FROM DGH (SCANNED COPY) 170
ANNEXURE-III EQUIPMENT AND APPLICABLE STANDARDS 171
ANNEXURE-IV COMPARATIVE ECOTOXICITIES 174

Pre-drill EIA for the NELP block MB-OSN-2005/3 (5-Appraisal Wells) 2017
x
Acknowledgement
Environmental Impact Assessment and Risk assessment report for proposed exploratory drilling activity
in MB-OSN-2005/3 in Western Offshore Basin has been prepared by the HSE Team of Western
Offshore Basin, Mumbai under the guidance and support from the Corporate HSE, ONGC, New Delhi.
The primary baseline data with the analytical observations has been provided by IPSHEM, Goa. The
report incorporates the offshore environmental baseline data acquired under the project Western
Offshore Environment Monitoring conducted and carried out by IPSHEM, Goa.
We express our sincere gratitude to Shri A.K. Dwivedi, Director (Exploration), I/c HSE, ONGC for his
encouragement and support in preparation of this report. Our sincere thanks are due to Shri G.C.
Katiyar, ED-Basin Manager, Western Offshore Basin and Shri S. Kumar, ED-HOI, IPSHEM for
providing guidance during the course of this work.
Project Team
Pre-drill EIA for the NELP block MB-OSN-2005/3 (5-Appraisal Wells) 2017
xi
Project personnel
Guidance & Support Shri G.C. Katiyar, ED-BM, WOB, Mumbai
Shri S. Kumar, ED-HOI, IPSHEM, Goa
Team IPSHEM Shri R. Sitaraman, DGM (Chemistry) Shri G.L. Das, Chief Chemist
Corporate HSE Dr. J. S. Sharma, GM, Head Environment Team of functional area experts from CHSE
Team HSE, WOB, Mumbai Shri U. Bhattacharjee, DGM (GP-S) I/c HSE
Dr. Ashutosh Kumar, DGM (Chemistry)- Coordinator

Pre-drill EIA for the NELP block MB-OSN-2005/3 (5-Appraisal Wells) 2017
1
Chapter -1
INTRODUCTION
1.1 PURPOSE
The exploratory block MB-OSN-2005/3 was awarded to M/s Essar Energy as Operator
along with M/s Noble Energy with 50% PI each. Afterward, M/s Noble Energy backed out from the
consortium therefore, M/s Essar Energy became the sole operator with 100% PI.
Later on, a firm-out agreement was signed between ONGC and Essar Energy on
24.12.2014 whereby ONGC acquired NELP- block MB-OSN-2005/3 as operator with 70% PI while
Essar Energy with 30% PI.
During the year 2015-16, a Well MBS053NAA-1 was drilled in this block for which EC was
obtained vide J11011/171/2015-1A II (I) DTD 04.01.2016. Testing of object-I in the interval (932- 938
m) and object-II in the interval (581-583m & 585- 589m) flowed gas @ 47,128 m³/d and gas @ 21,282
m³/d respectively through ½‖ choke from Chinchini formation of Pliocene age in well MBS053NAA-1 .
This is the first discovery beyond the shelf margin and also in Pliocene formation in Mumbai Offshore
Basin. With drilling one well, MWP commitment of Phase-II exploration has been completed.
In view of Hydrocarbon discovery in this block, five appraisal locations have been planned
for drilling during appraisal period, commencing from 1st April, 2016. In this regard, EC is required at
the earliest possible to start the drilling operation in time to complete the exploratory wells before the
due date for which EIA study of the block is required.
The NELP-VII Block MB-OSN-2005/3 is located in the southwest of the Mumbai High-DCS
platform of Mumbai Offshore Basin, having an area of 1685 sq. km. The water depth within 3D seismic
area, where prospects are likely to be drilled, ranges from 90 m to 100 m. Well SM-1-2 is near western
boundary of the block. It is approximately 44 Km north of SM-86 structure and about 80 Km north-west
of D-1 hydrocarbon bearing structure. Deep water nomination block BB-OS-DW-1 lies in the west of the
block. The block is located in the shallow water area. (Fig-1.1: Location Map).
It may be emphasized that the EIA notification 2006, which requires prior Environmental
Clearance from the Ministry of Environment & Forest (MOEF&CC), before carrying out exploratory
drilling, is not applicable in the block as the block is located beyond territorial waters (beyond the
stipulated 12 nautical miles). However, the Production Sharing Contract (PSC) requires conducting of
EIA studies and obtaining its approval from MOEF&CC. It is also emphasized in the PSC that the

Pre-drill EIA for the NELP block MB-OSN-2005/3 (5-Appraisal Wells) 2017
2
contractor shall conduct its petroleum operations with due regard to and concern with respect to
protection of the environment and conservation of natural resources.
ONGC had applied for EC in Form-I to MoEF&CC on 23.05.2016. The project was
discussed in 11th Expert Appraisal Committee (Industry-2) on 20-21.07.2016 Terms of Reference
(ToR) for the preparation of Environmental Impact Assessment has been issued by MoEF&CC to
ONGC vide File No. J-11011/176/2016- IA II (I) dated 23.09.2016 (Annexure-I).
Fig. 1.1: Location Map showing position of NELP Block MB-OSN-2005/3
1.2 IDENTIFICATION OF THE PROJECT PROPONENT & THE PROJECT
Oil and Natural Gas Corporation Limited is a premier national hydrocarbon E & P company
having Maharatna status. ONGC was founded in the year 1956 to power a new born republic making
rapid strides towards growth and development. Discovering 6 (six) out of 7 (seven) oil and gas
producing basins, adding 8.6 billion tons of oil and gas reserves, it has led India‘s quest for national

Pre-drill EIA for the NELP block MB-OSN-2005/3 (5-Appraisal Wells) 2017
3
energy security. Today ONGC is the world‘s No.3 Exploration and Production Company as per Platts
ranking. In FY 2015-16, ONGC made 17 hydrocarbon discoveries (in the areas operated by ONGC – 7
in NELP blocks): [Oil and gas-7; gas and condensate-10; Onshore-7, Offshore-10]. Established 74% of
in-place hydrocarbon in the country on standalone basis. It is the largest exploration acreage and
mining lease holder in the country. It has achieved Reserve Replacement Ration (RRR) of more than 1
for the last 10 years. It contributed 70% of O+OEG production of the country: 48.46 MMTOE, crude
22.36 MMT and natural gas 21.18 BCM includes share in PSC JVs. ONGC‘s wholly owned subsidiary
ONGC Videsh Ltd(OVL) is the nation‘s biggest E&P multinational, managing 35 overseas hydrocarbon
properties in 16 countries, with a cumulative investment of over US$22 billion.
As for as oil discoveries done by ONGC is concerned, it has made 14 oil and gas
discoveries in domestic fields (operated by ONGC). Out of these, 12 discoveries were made in the new
prospects whereas 10 were new pool discoveries. Nine discoveries were made in NELP blocks and
thirteen in the nomination blocks. Mangalore Refinery & Petrochemical Ltd. (MRPL) and ONGC Videsh
Limited (OVL) are two fully owned direct subsidiary of ONGC. OVL is the biggest Indian multinational,
with 40 oil & Gas projects (9 of them producing) in 17 countries i.e. Vietnam, Sudan, Iraq, Iran, Russia,
Myanmar, Libya, Cuba, Colombia, Nigeria, Nigeria Sao Time JDZ, Egypt, Brazil, Syria and Venezuela.
ONGC Videsh achieved Oil Production of 5.533 MMT & Natural Gas production of 3.341 BCM for FY
2015. On an average, ONGC drills about 20 exploratory wells every year in the Arabian Sea. The
Western Offshore area has been the main contributor of domestic hydrocarbon production in India. This
endeavor will continue in the Block MB-OSN-2005/3 which is located in the Mumbai Offshore, having
an area of 1685km2. The average cost of drilling a well is estimated at approximately Rs. 140 crores.
The project block is located in Arabian Sea due southwest off the state of Maharashtra.
5-appraisal wells will be drilled by the ONGC is in this block which is about ~138 nm from
the coast. Offshore Floater Drillship rigs will be deployed for the proposed drilling. ONGC has its
centralized warehouse/ stores at Nhava. Accordingly, all the material will be brought to the site from
Nhava supply base by sea route through Offshore Supply Vessel (OSVs). However, the personnel will
be transported to the rig by helicopters from the Juhu Helibase, Mumbai.

Pre-drill EIA for the NELP block MB-OSN-2005/3 (5-Appraisal Wells) 2017
4
1.3 SCOPE OF STUDY
Terms of Reference (ToR) assigned by MoEF&CC would be the basis of scope of EIA study along with
understanding of the project and its implication, assessing the marine physical environment where the project
would be located and probable interactions that are expected to occur as a result of execution of the project.
The scope of work includes:
Review of regulatory and institutional framework to ensure that ONGC is aware of
regulatory obligations and make compliance while undertaking project activities.
Collate and analyze primary and secondary data on environmental components like
meteorology, marine water quality, levels of pollution, marine and coastal ecology, etc.
Assess potential environmental impacts that may arise as a result of the project and
evaluate them.
Table 1.2.1: Project at Glance
Sl. No. Parameter Particulars
1 Area Shallow offshore due south and southwest Mumbai, 1685 km2
2 No. of Wells 05
3 Depth of the wells (m) 1650-2300 m
4 Water Depth (Bathymetry) (m) ~ 102 to 107 m
5 Distance from the Coast (m) 138 nm
6 Water Consumption 40 m3/day
7 HSD consumption 60 kl / day
8 Drill Cuttings 3 – 8 m3 / day, i.e., about 20 – 50 bbls / day
9 Cost of the Project INR 140 crores per well
10 Sensitive Areas No sensitive or legally protected areas lie in the close vicinity of the block which is located about 250 km southwest off the coast of Mumbai, Maharashtra.

Pre-drill EIA for the NELP block MB-OSN-2005/3 (5-Appraisal Wells) 2017
5
Chapter-2
Terms of reference
2.1 POINTWISE COMPLIANCE OF TOR:
Terms of Reference (ToR) for the preparation of Environmental Impact Assessment issued
by MoEF&CC to ONGC vide File No. J-11011/176/2016- IA II (I) dated 23.09.2016 has been duly
addressed in EIA-EMP Report. Summary of the same is tabulated below:
TABLE 2.1: COMPLIANCE WITH TERMS OF REFERENCE PROVIDED BY 44th EXPERT
APPRAISAL COMMITTEE (INDUSTRY-2) OF MOEF
Sl Points of TOR Issues Addressed In EIA-EMP and RA Report
1 Executive summary of the
project
Executive summary included in EIA report of the project (p. i-
iii)
2 No. of exploratory wells for
which environmental
clearance is accorded and no.
of new wells proposed during
expansion. Status and no. of
the wells which are completed
and closed.
This is a fresh proposal for drilling 5- exploratory appraisal
wells in the same block.
EC for drilling only one well was obtained vide J-
11011/171/2015 –IA II (I) dtd 07.01.2016 and ONGC have
successfully drilled this well in this block during 2015-16.
3 Project Description and
Project Benefits;
Initially the exploratory block MB-OSN-2005/3 was awarded
to M/s Essar Energy as operator along with M/s Noble
Energy with 50% PI each. However, M/s Noble Energy left
the consortium thereby M/s Essar Energy was having 100%
PI with it. Later, a firm-out agreement was signed between
ONGC and Essar Energy on 24.12.2014 whereby ONGC
agreed to acquiring the NELP-VII block MB-OSN-2005/3 as
operator with 70% PI while Essar Energy would retain 30%
PI. The block comprises of an area of 1685 Km2. It is a
shallow water offshore block in the West Coast of India. As
per the Minimum Work Programme (MWP), during the
Phase-II, from 04.08.2013 to 03.02.2016, one well was
drilled in the block which produces Gas.
(Chapter 3, p. 10-23)
4 Cost of project and period of
completion
Rs. 140 crores per well, Time of completion : 4-5 Months
per wells

Pre-drill EIA for the NELP block MB-OSN-2005/3 (5-Appraisal Wells) 2017
6
5 Employment to generated Well will be drilled hiring a Floater (MODU) drilling rig.
6 Distance from coast line The block is located on the continental shelf west off the
coast of Mumbai about 250 km from the coast.
7 Details of sensitive areas such
as coral reef, marine water
park, sanctuary and any other
eco-sensitive area.
No sensitive areas such as coral reef, marine water park,
sanctuary and any other eco-sensitive area lie within 10 km
from the block boundary.
8 Recommendation of SCZMA/
CRZ Clearance as per CRZ
notification dated 6th January
2011 (if applicable).
CRZ notification is not applicable on this project, as the block
is beyond territorial waters.
(Section 3.2.1, p.14)
9 Details of support
infrastructure and vessel in
study area.
Operational personnel shall be commuted to and fro to the
rig by helicopter from the service base at Juhu-Helipad,
Mumbai. The material will be transported to the rig by OSVs
from the Nhaba Supply base-the frequency of OSVs shall
depend on the actual requirement, never more than once per
day.
10 Climatology and meteorology
including wind speed, wave
and currents, rainfall etc.
Section 3.7, p. 24 – Climatology and Meteorology of Mumbai
Offshore.
11 Details on establishment of
Base line on air quality of
areas immediately affected by
the exploratory drilling and
also particularly with reference
to hydrogen sulphide, sulphur
dioxide NOx and background
levels hydrocarbons.
Baseline data on marine water quality generated by analysis
of 23 water samples gathered in and around the project area
and the probable drilling location.
(Chapter 4, p.31).
12 Details on estimation and
computation of air emissions
(such as nitrogen oxide,
sulphur dioxides, carbon
mono oxides, hydrocarbons,
etc.) resulting from flaring, DG
set, combustion etc. during all
project phases.
(Section 5.1.1, p.81).
13 Base line data collection for
surface water for one season
leaving the monsoon season
Baseline data on marine water quality generated by analysis
of 23 water samples gathered in and around the project area
and the probable drilling location.

Pre-drill EIA for the NELP block MB-OSN-2005/3 (5-Appraisal Wells) 2017
7
within one Km for each
exploratory well, particularly in
respect of oil content in water
sample and sediments
sample.
(Chapter 4, p.31).
14 Fisheries study w.e.t. benthos
and marine organic material
and coastal fisheries.
(Chapter 4, p. 31).
15 Source of fresh water.
Detailed water balance, waste
water generation and
discharge.
The average daily water consumption will be about 40
m3/day and will be supplied from Nhava supply base of
ONGC. Wastewater generation from the drilling well is
expected to be around 10 m3/day. The dirty oil from bilge
fluid will be periodically sent to shore in drums or special
containers by supply vessels deployed for the purpose.
(Section 3.4.2; p.20, Section 3.4.3, p.21-Waste Water
Generation and Discharge)
16 Noise abatement measures
and measures to minimize
disturbance due to light and
visual intrusions in case of
project site closed to coast.
Discussed under Section 5.1.2, p.82
17 Procedure for handling oily
water discharges from deck
washing, drainage systems,
bilges etc.
Section 10.5 - Oily Water Discharges and Other Wastes,
p. 154
18 Procedure for preventing spills
and spill contingency plans
Section 10.5, p. 154
Chapter 11, p.161
19 Procedure for treatment and
disposal of produced water
During well testing oil is stored in storage tanks, gas is
flared, and water is discharged to sea after treatment. Oil is
transported to base facility.(Section 3.4.3,p.21)
20 Procedure for sewage
treatment and disposal and
also for kitchen waste
disposal.
Sanitary waste: Disposal, p.101
21 Details on solid waste
management drill cutting,
drilling mud and oily sludge
produced sand, radioactive
materials, other hazardous
materials, etc including its
handling options during all
The disposal of the drill cuttings will be conforming to the
guidelines pertaining to the ―Disposal of Drill Cuttings and
Drilling Fluids for Offshore Installations‖ provided by the
Ministry of Environment & Forests (MoEF) G.S.R. 546(E)
August 2005.
Section 6.2, p.88 – Membership of Common Disposal
facilities.

Pre-drill EIA for the NELP block MB-OSN-2005/3 (5-Appraisal Wells) 2017
8
project phases.
22 Storage of chemicals on site Section 3.4.4 – Chemical Storage at Rig, p-22
23 Commitment for the use of
WBM and synthetic oil based
mud in special case
ONGC is committed to using only Water Based Mud (WBM)
for the offshore exploratory drilling operations. However,
synthetic oil based mud (SOBM) will be used to combat
specific hole problems. Refer to Mud System and Cuttings,
p.18.
24 Details of blowout preventer
installation
It is standard oil-well drilling practices to install BOP at the
well head (section 3.1-Technology and Process Description,
p.17).
25 Risk assessment and
mitigation measures including
whether any independent
reviews of well design,
construction and proper
cementing and casing
practices have been followed
Risk assessment – Section 9.1, p.114
26 Handling of spent oils and oil
from well test operations.
Section : Well fluid and deck drainage P: 101
27 H2S emissions control plans, if
required
Section 9.1.4, p.136
28 Details of all environment and
safety related documentation
within the company in the
form of guidelines, manuals,
monitoring programmes
including Occupational Health
Surveillance Programme etc.
Section 10.7–Management System Procedure and
Documentation, p.158
29 Restoration plans and
measures to be taken for
decommissioning of the rig
and restoration of on-shore
support facilities on land
After drilling and initial testing, if the well does not contain
commercial quantities of hydrocarbon, the site is
decommissioned to a safe and stable condition and restored.
Open rock formations are sealed with cement plugs to
prevent upward migration of wellbore fluids. The casing
wellhead and the top joint of the casings are cut at the
ground level and capped with a cement plug. The hazardous
waste will be sent to authorize hazardous waste disposal
facility.
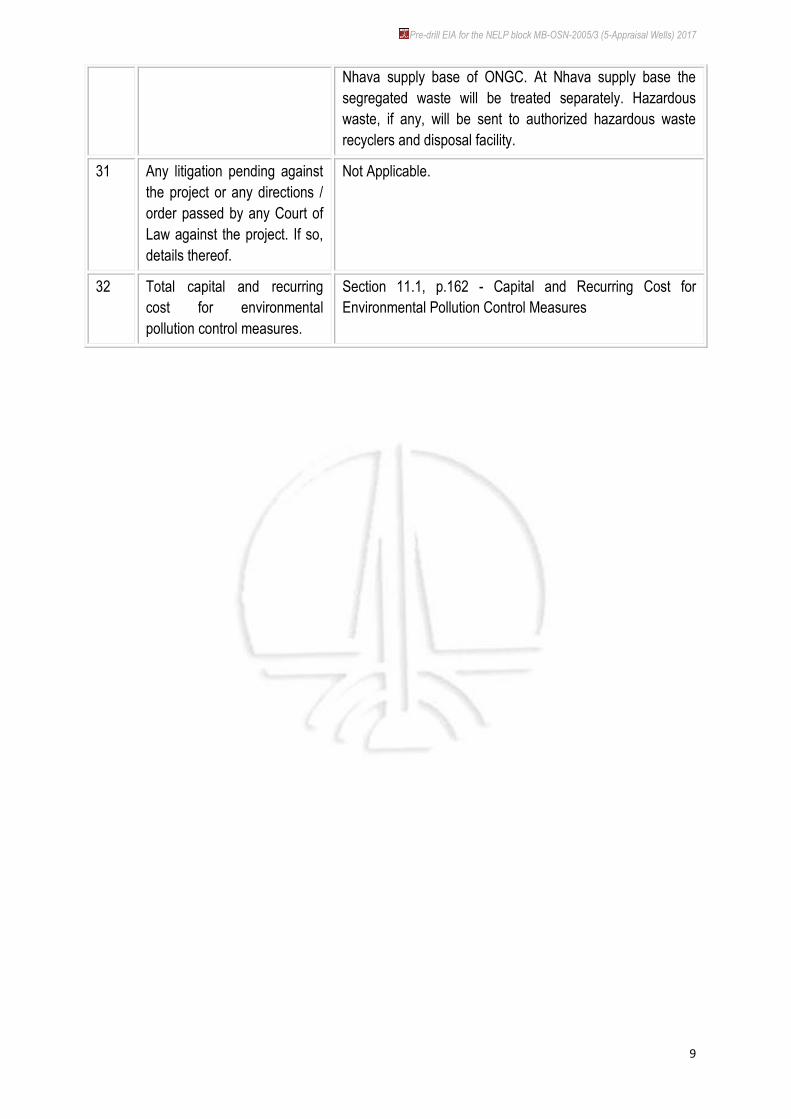
30 Documentary proof for
membership of common
disposal facilities, if required
The solid waste generated on the rig will be segregated and
stored in colour coded bags. The solid waste will be
transported back using support vessels or with the rig, to the
Pre-drill EIA for the NELP block MB-OSN-2005/3 (5-Appraisal Wells) 2017
9
Nhava supply base of ONGC. At Nhava supply base the
segregated waste will be treated separately. Hazardous
waste, if any, will be sent to authorized hazardous waste
recyclers and disposal facility.
31 Any litigation pending against
the project or any directions /
order passed by any Court of
Law against the project. If so,
details thereof.
Not Applicable.
32 Total capital and recurring
cost for environmental
pollution control measures.
Section 11.1, p.162 - Capital and Recurring Cost for
Environmental Pollution Control Measures
Pre-drill EIA for the NELP block MB-OSN-2005/3 (5-Appraisal Wells) 2017
10
Chapter 3
PROJECT DESCRIPTION
3.1 TYPE OF THE PROJECT
Initially the exploratory block MB-OSN-2005/3 was awarded to M/s Essar Energy as
Operator along with M/s Noble Energy with 50% PI each. Due to withdrawal of M/s Noble Energy, M/s
Essar Energy was having 100% PI with it. Later on, a farm out agreement between ONGC and ESSAR
for JV partnership was signed on 24th December 2014 with ONGC as operator. The participating
interest of ONGC is 70% and for ESSAR 30%. Vide letter No. DGH/PSC/ (MB-OSN-2005/3)/Phase-
II/Assignments/2015 dated 28th April 2015, MOPNG has approved the proposed assignment of 70% to
ONGC and transfer of ownership (Letter from DGH: Annexure - II).
GEOLOGICAL SETUP:
The Block MB-OSN-2005/3 falls in the Shelf Margin block of Mumbai Offshore Basin. Shelf
Margin is demarcated to the east by Paleocene shelf edge, to the west by West Margin basement arch,
to the north by Saurashtra Arch and to the south by Vengurla Arch. Major structural elements within the
block from north to south are Saurashtra low to the north, followed by Alibagh saddle to the south of it
(DCS platform and south Bombay low fall just to the east of it), Murud low, Mahabaleshwar high and
Rajapur low to the south. The shelf is characterized by NNW-SSE trending parallel sets of longitudinal
faults giving rise to series of horst-graben features.
Basement associated anticlinal highs of Paleocene-Eocene sequence and tilted fault blocks
of oligo-miocene section formed due to gravity slide are the two main structural styles in the block.
The generalized litho-stratigraphy (Fig. 3.1) of the shelf margin block is established based
on the information of the wells SM-1-1 and SM-1-2, following the framework of lithostratigraphic
classification of Mumbai offshore basin. In general the area received dominantly finer clastic of
claystone and and shale except for medium to thick carbonate deposits of Eocene and upper Miocene
times which are laterally less extensive.

Pre-drill EIA for the NELP block MB-OSN-2005/3 (5-Appraisal Wells) 2017
11
Fig.3.1: Generalized stratigraphy of the Shelf margin area
3.2 LOCATION OF PROJECT
The initial 2D seismic interpretation indicates six probable locations for drilling wells as
shown in the Map at Fig. 3.2 and Fig. 3.3 given below. However, initially, only one well is to be drilled,
out of identified 6 prospects. The exact position of the well would be decided on the basis of 3D
interpretation of seismic data being acquired in the block.
WATER DEPTH AND TD OF WELL
Water depth (bathymetry map. Fig. 3.4) of the 3D area (within the block) where prospects
are identified and to be drilled, falls within the range of 102 m to 107 m. The total depth of the well to be
drilled will be 1600 m to 2300 m.
Pre-drill EIA for the NELP block MB-OSN-2005/3 (5-Appraisal Wells) 2017
12
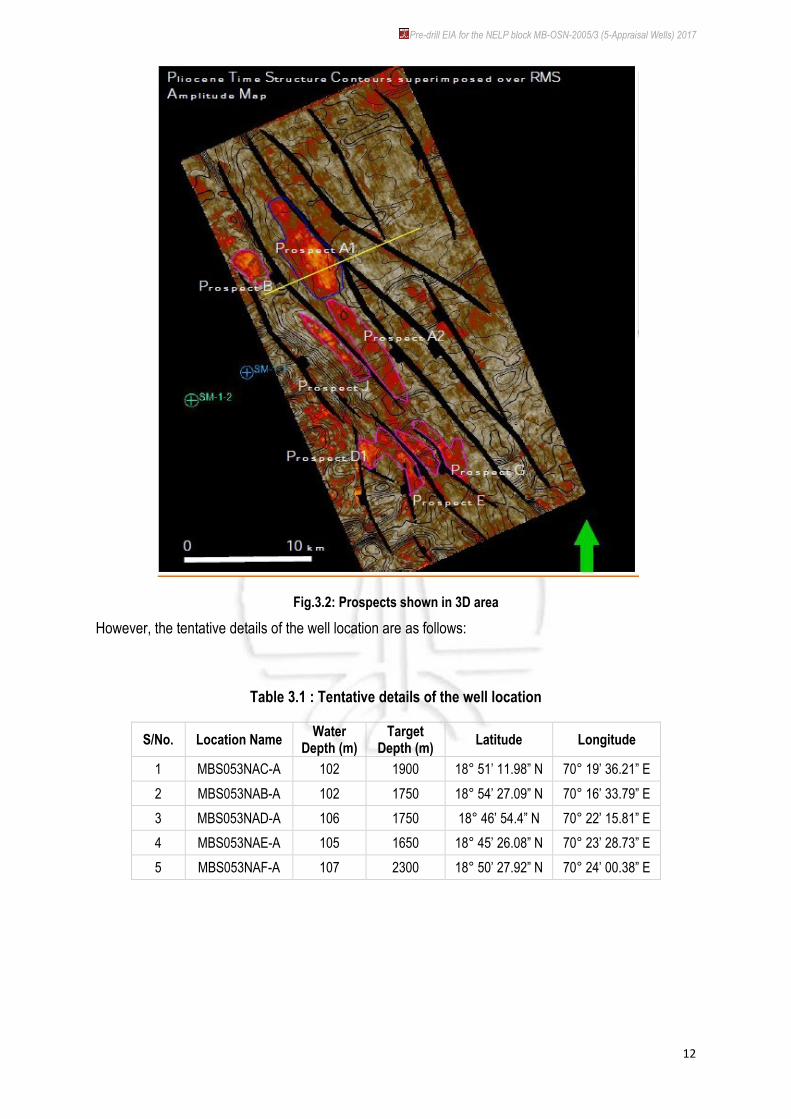
Fig.3.2: Prospects shown in 3D area
However, the tentative details of the well location are as follows:
Table 3.1 : Tentative details of the well location
S/No. Location Name Water
Depth (m) Target
Depth (m) Latitude Longitude
1 MBS053NAC-A 102 1900 18° 51‘ 11.98‖ N 70° 19‘ 36.21‖ E
2 MBS053NAB-A 102 1750 18° 54‘ 27.09‖ N 70° 16‘ 33.79‖ E
3 MBS053NAD-A 106 1750 18° 46‘ 54.4‖ N 70° 22‘ 15.81‖ E
4 MBS053NAE-A 105 1650 18° 45‘ 26.08‖ N 70° 23‘ 28.73‖ E
5 MBS053NAF-A 107 2300 18° 50‘ 27.92‖ N 70° 24‘ 00.38‖ E

Pre-drill EIA for the NELP block MB-OSN-2005/3 (5-Appraisal Wells) 2017
13
Fig. 3.3: Block Map with tentative prospects.
Fig-3.4 Map indicating coastal land near the block MB-OSN-2005/3
The geographical coordinates of the boundary of the NELP exploratory block MB-OSN-2005/3 are
provided in the Table 3.2.
MAP INDICATING COASTAL LAND NEAR BLOCK MB-OSN-2005/3 MAP SHOWING THE BAATHYMETRY OF THE AREA

Pre-drill EIA for the NELP block MB-OSN-2005/3 (5-Appraisal Wells) 2017
14
TABLE 3.2.: Geographical coordinates of Block MB-OSN-2005/3.
Longitude Latitude
Pt. Deg. Min. Sec. Deg. Min. Sec.
A 70 05 11.27 19 04 16.54
B 70 20 17.00 19 06 56.00
C 70 45 53.78 18 30 17.00
D 70 35 00.00 18 30 17.00
E 70 35 00.00 18 40 00.00
F 70 21 07.13 18 40 00.00
A 70 05 11.27 19 04 16.54
3.2.1 CRZ REGULATION APPLICABILITY
The block MB-OSN-2005/3 is located beyond 12 nautical miles from the coast line, CRZ
regulations, therefore, is not applicable.
3.2.2 DRILLING WELL LOCATION
S/No. Location Name Water
Depth (m) Target
Depth (m) Latitude Longitude
1 MBS053NAC-A 102 1900 18° 51‘ 11.98‖ N 70° 19‘ 36.21‖ E
2 MBS053NAB-A 102 1750 18° 54‘ 27.09‖ N 70° 16‘ 33.79‖ E
3 MBS053NAD-A 106 1750 18° 46‘ 54.4‖ N 70° 22‘ 15.81‖ E
4 MBS053NAE-A 105 1650 18° 45‘ 26.08‖ N 70° 23‘ 28.73‖ E
5 MBS053NAF-A 107 2300 18° 50‘ 27.92‖ N 70° 24‘ 00.38‖ E
3.3 PROPOSED PROJECT SCHEDULE FOR APPROVAL AND IMPLEMENTATION
The project activities for the proposed offshore drilling processes have been divided into
three phases- Mobilization of drilling rig, Drilling and finally Decommissioning. Drilling activity under
normal conditions would continue for about 40-60 days to drill one well. Casing will be lowered in the
well drilled and tested by perforation if indications of hydrocarbons are noticed. The well will be sealed
for further development if the prospect so discovered is found to be a successful hydrocarbon bearing
structure.
3.4 TECHNOLOGY AND PROCESS DESCRIPTION:
The different phases, as mentioned above, for the exploratory drilling are
Mobilization of the drilling rigs

Pre-drill EIA for the NELP block MB-OSN-2005/3 (5-Appraisal Wells) 2017
15
Drilling and testing
Decommissioning
These phases are explained in the subsequent sections. A flow chart describing the major phases of
‗Oil exploration‘ is sketched in the Fig. 3.5.
Fig 3.5: Flow chart describing in nutshell the ‗Oil Exploration Process‘
DRILLING AND TESTING PHASE
Seismic data acquisition is the initial process of Exploitation of hydrocarbons followed by
processing and interpretation for identification of viable prospect. The prospect so identified is required
to be probed by drilling to ascertain the accumulation and, in the eventuality, the extent of the prospect.
Wells are drilled, offshore or onshore, using a rig and ancillary tools and equipment.
There are two basic categories of offshore drilling rigs; those that can be moved from place
to place, allowing for drilling in multiple locations, MODU (Mobile Offshore Drilling Unit), and those rigs
that are temporarily or permanently placed on a fixed platform (Platform Rigs). In the present case, the

Pre-drill EIA for the NELP block MB-OSN-2005/3 (5-Appraisal Wells) 2017
16
water depth of proposed location is about 90-100 meter therefore, drilling will be done by deploying a
floater rig where in a rig is mounted on a ship. ONGC will use Mobile Offshore Drilling Unit (Floater/Jack
up Rig, Fig. 3.6, Fig. 3.7) for drilling the well.
Fig. 3.6: Typical picture of jack-up rig
Fig 3.7: Typical picture of floater rig

Pre-drill EIA for the NELP block MB-OSN-2005/3 (5-Appraisal Wells) 2017
17
INITIAL WELL CONSTRUCTION
Offshore wells are drilled in sections, with the diameter of each section decreasing with
increasing depth. Lengths and diameters of each section are determined prior to drilling and depend on
geological conditions through which the well is to be drilled. The conduit or pipe section will be set in
place by jetting operations. Drilling starts with spudding a hole of diameter 26" on the sea bed, followed
by lining it with a metal casing of 20". The above structural section is likely to be drilled using sea water.
Next hole will be of 17-1/2" diameter and casing will be 13-3/8". Further hole will be of 12-1/2" diameter
with 9-5/8" casing.
Well head equipment is installed thereafter followed by marine riser including the Blowout
Preventer (BOP, Fig. 3.8). The blowout preventer is a large underwater assembly of control valve that
prevents high pressure from the well escaping through the water and oil column into the surface at the
derrick floor. The release of this pressure is called a ―blowout‖ and can result in an explosion and could
cause large scale damage to the environment. If a blowout were to occur with a BOP in place, giant
valves inside it seal off the well, containing any excessive pressure and putting it back into the ground.
Maintaining the BOP and continually testing it is a very high priority for both ONGC and its drilling
contractor.
The BOP is placed on top of the wellhead (the top of the well), which is why it is important to
make sure the casing is properly cemented in place. A marine riser is a type of offshore drilling tool that
is used as a temporary extension connecting the oil well to the rig.
Fig. 3.8: A Typical drawing of a BOP (Blow out Preventer)

Pre-drill EIA for the NELP block MB-OSN-2005/3 (5-Appraisal Wells) 2017
18
As drill pipe is lowered down through the marine riser, through the BOP, into the wellhead,
and then further down into the well, drill fluid or mud (fluid that helps clear the rock bits or ―cuttings‖ that
are being chipped away when drilled) is pumped back up through the pipe annulus and out through the
drill bit. The mud eventually circulates around up through the marine riser and back to the surface of the
oil rig. As each section is drilled, casing is run and cemented into place ready for drilling the next
smaller diameter section. Operations continue in this way until target depth is reached.
MUD SYSTEM AND CUTTINGS
During drilling operations, the drilling fluid (or mud) is pumped through the drill string down
to the drilling bit and returns via the drill pipe – casing annulus up to surface back into the circulation
system. After separation of drill cuttings /solids through solids control equipment, the mud is circulated
back.
Drilling fluid is essential to drilling operations in order to:
Control down-hole pressure
Lift soil/rock cuttings from the borehole bottom and carry them to settling pit
Prevent cuttings to settle rapidly.
Prevent caving
Seal the borehole wall to reduce fluid loss. (Formation of filter cake)
Cool and clean the drill bit and lubricate drill bit, bearings, mud pumps and drill pipes
ONGC is committed to using Water Based Mud (WBM) for the offshore exploratory drilling
operations. However, synthetic oil based mud (SOBM) will be used to address specific down-hole
issues, if so warranted. Otherwise, keeping in view the environmental factors in the backdrop, only
water based mud is proposed to be used in the drilling the exploratory wells in the block. Water-based
mud is made up of clay (bentonite) and water; it may include barite, a heavy mineral to increase specific
gravity of the mud system. Chemical additives are mixed in to stabilize the drilling fluid during use, and
to reduce corrosion and bacterial activity. Chemical additives viz. glycols and salts may be used in
conjunction to mitigate potential problems related to hydrate formation.
The mud is subjected to continuous testing for its physical parameters, namely, density,
viscosity, yield point, water loss, pH value, etc. to ensure that drilling operations are successful and
continued without any down-hole complication. The mud will be prepared onsite (drill location) using
centrifugal pumps, hoppers and treatment tanks.

Pre-drill EIA for the NELP block MB-OSN-2005/3 (5-Appraisal Wells) 2017
19
Drill-cuttings that circulate back to the surface will be separated from drilling mud using
control equipment comprising of linear motion vibrating screens called shale shakers, hydro-cyclones
(including de-sanders and de-silters), and centrifuges to mechanically separate cuttings from the mud.
Once cuttings have been separated, drilling fluid will be processed or reused after further treatment.
The total mud-circulation is depicted in a sketch in Fig. 3.9.
The time taken to drill a bore hole depends on the depth of the hydrocarbon bearing
formation and the geological conditions, but it is commonly of the order of 50 to 60 days. Where
hydrocarbon formations is found, initial well tests—possibly lasting for another 20 to 30 days—are
conducted to establish flow rates and formation pressure.
Fig. 3.9: Typical drilling fluid circulation system
After drilling and initial testing, the rig is usually dismantled and moved to the next site. If the
exploratory drilling has discovered commercial quantities of hydrocarbons, a wellhead valve assembly
may be stalled. If the well does not contain commercial quantities of hydrocarbon, the site is
decommissioned to a safe and stable condition and restored to its original state. Open rock formations
are sealed with cement plugs to prevent upward migration of fluids. The casing wellhead and the top
joint of the casings are cut at the ground level and capped with a cement plug.

Pre-drill EIA for the NELP block MB-OSN-2005/3 (5-Appraisal Wells) 2017
20
3.4.1. SOURCE OF WATER
Water requirement in a drilling rig is mainly meant for preparation of drilling mud apart from
washings and domestic use. The average daily water consumption is of the order of 40 m3/day will be
drawn from Nhava supply base of ONGC (which is a main material supply base for offshore
installations of western region) along with other materials through sea route. Nhava supply base of
ONGC receives water from Industrial Development Corporation of Maharashtra Limited (CIDCO).
3.4.2. WATER USAGE PLAN
The average daily water consumption is about 40 m3/day including water requirement for
mud preparation, washing and domestic activities. Wastewater generation from the proposed drilling
activity is from domestic activity @ 80 percent of the domestic water requirement and from washing
@100 percent of the washing water requirement. Thus, wastewater generation from the drilling well is
expected to be 9 m3/day (Table 3.3).
TABLE 3.3: WATER USAGE PLAN
Sr. No. Particulars Water requirement (m3/day)
Water Requirement
1 Mud preparation 20
2 Washing activities 5
3 Shale Shaker 10
4 Domestic purpose 5
Total water requirement 40
Wastewater generation
1 Domestic activity 4
2 Washing 5
Total Wastewater Generation 9
Typical drill rig module (schematic) is shown in figure below.

Pre-drill EIA for the NELP block MB-OSN-2005/3 (5-Appraisal Wells) 2017
21
Fig. 3.10: A sketch of a typical drilling rig module
3.4.3. WASTEWATER GENERATION & DISCHARGE
Waste water generated at the rig will be of three types and its disposal methodologies are
explained in the subsequent sections. The International Convention for the Prevention of Pollution from
Ships (MARPOL) is the primary regulations/ guidelines on prevention of pollution of the marine
environment by ships. The Convention includes regulations aimed at preventing and minimizing
pollution from ships - both accidental pollution and that from routine operations.
BILGE FLUIDS
Bilge fluids are a mix of sea water, petroleum products and other brackish material that
settles to the bottom of a ship. The collection and disposal system for this fluid will be done in
compliance with the International Convention for Prevention of Pollution from Ships, 1973 as modified
by the protocol of 1978 (MARPOL 73/78). The rig will be having provision to collect bilge fluids into a
sludge tank and then to a water/oil separator. Separated oil will then be diverted into "dirty oil" tank,
where exhaust oil from engine lubricant change is collected. The dirty oil will be periodically sent to
shore in drums or special containers by supply vessels. Separated water can be directly discharged
overboard, provided that oil content does not exceed 15 ppm as per MARPOL standards.
DECK DRAINAGE
Drainage water generated from precipitation or routine operations, such as deck, rig floor
and equipment cleaning will be routed to separate drainage systems on the rig. This includes drainage

Pre-drill EIA for the NELP block MB-OSN-2005/3 (5-Appraisal Wells) 2017
22
water from process/non-process areas that could be contaminated with oil. These waste fluids will be
collected by gravity in a tank and subsequently pumped into tanks installed below the main deck. The
tank will be periodically emptied, pumping waste fluid to the supply vessel for shipment to shore. Waste
water, wherever feasible, can be recycled to condition new mud and hence may be connected to the
mud tanks circulating system.
GREY AND BLACK WATER
Grey and Black Water is generated from showers, toilets, laundry and kitchen facilities on
the rig and will primarily contain waste material, paper, soap, etc. Rig operations will typically result in
the generation of sewage and wastes. Once collected through headers, they will be passed through a
sewage treatment plant (STP). The wastes will then be passed through a screen of less than 25 mm
diameter and an extended aeration system prior to their discharge into the marine environment.
Sewerage treatment on-site will be carried out in compliance with MARPOL 73/78 requirements.
3.4.4. CHEMICAL REQUIREMENTS AND THEIR STORAGE AT RIG
Chemicals are required for preparation of WBM, giving the drilling mud the desired
characteristics to facilitate drilling at different depths. A variety of drilling chemicals and additives are
stored on the drilling rig with storage places clearly marked with safe operating facilities and practices.
Some of the common drilling and cementing fluid, chemicals likely to be used during drilling includes
cement, surfactants, de-foamers, lignin, inorganic salts, bentonite and barite, etc. as elucidated in the
Table 3.4.
TABLE 3.4: CHEMICALS USED FOR PREPARATION OF DRILLING FLUIDS
S. No. Name of Chemical S. No. Name of Chemical
1 BARYTES 21 MOD. GUAR GUM
2 BENTONITE 22 PAC-LV
3 BIOCIDE 23 PAC-RG
4 CAL. CARB, COARSE 24 PGS
5 LIME STONE POWDER (Marble) 25 PHPA
6 CAL. CARB, MICRONISED 26 POT. CHLORIDE
7 CAL.CHLORIDE 27 RESINATED LIGNITE
8 CAUSTIC SODA 28 SAW DUST
9 CITRIC ACID 29 SODIUM BICARBONATE
10 CMC 30 SODA ASH

Pre-drill EIA for the NELP block MB-OSN-2005/3 (5-Appraisal Wells) 2017
23
11 COMMON SALT 31 SP. FLUID (N.W.)
12 DEFOAMER 32 SP. FLUID (W)
13 DRILLING DETERGENT 33 SUL. ASPHALT
14 E.P. LUBE 34 THERMOGEL
15 GLYCERENE 35 WALNUT SHELL
16 HEC 36 XC-POLYMER
17 HYDRATED LIME 37 ZINC CARBONATE
18 IRONITE SPONGE 38 GLYCOL
19 LIGNITE 39 SOBM
20 MICA FLAKES
3.5. LITIGATIONS & COURT DIRECTIONS / ORDERS
There is no litigation pending against the project or any directions/order passed by any
Court of Law against the project. The project has been awarded to ONGC (70%) as the operator in
partnership with Essar Energy (30%) by the Ministry of Petroleum and Natural Gas (MoPNG), Govt. of
India under NELP VII.
3.6. ASSESSMENT (FOR RISK OF TECHNOLOGICAL FAILURE) OF NEW AND UNTESTED TECHNOLOGY
Over five decades of its existence ONGC has grown to be one of the largest E&P
companies in the world in terms of reserves and production. ONGC as an integrated Oil & Gas
Corporate has developed in-house capability in all aspects of exploration and production business, i.e.,
Acquisition, Processing and Interpretation (API) of Seismic data, drilling, work-over and well stimulation
operations, engineering and construction, production, processing, refining, transportation, marketing,
applied R&D and training, etc.
ONGC has planned to use Floater Drillship type mobile offshore drilling unit on hire-contract
basis for the Block MB-OSN-2005/3. The drilling technology and process to be used by ONGC, as
described in Section 3.4, is well established in Indian conditions. ONGC has used this technology and
process in many of its offshore exploration and drilling projects. No new or untested technology will be
used in the present case of drilling in MB-OSN-2005-3. ONGC generally use SOPs that are tested and
are used worldwide. The rigs to be used in the proposed exploratory block will be hired globally from
experienced vendors to ensure standard tested technologies. Thus the risk of technological failure of
new and untested technology does not arise.

Pre-drill EIA for the NELP block MB-OSN-2005/3 (5-Appraisal Wells) 2017
24
3.7 CLIMATOLOGY & METEOROLOGY OF THE ARABIAN SEA
Climate and meteorology of a place can play an important role in the implementation of any
developmental project. Meteorology (weather and climate) plays a key role in understanding local air
quality as there is an essential relationship between meteorology and atmospheric dispersion involving
the wind speed/direction, stability class and other factors. The block falls in the Mumbai offshore of
Maharashtra. Mumbai offshore experiences tropical monsoon climate with an average rainfall of
approximately 14 inches.
The following are the well-defined seasons of the region:
Summer: February to June
Monsoon: July to September
Winter: October to January
The average rainfall during the last 10 years has been more than 300 mm. The general weather
conditions are not good for agriculture harvest.
AVERAGE RAINFALL
Average rainfall of the proposed exploratory block is in the range of 1mm to 2 mm /day as per ‗Physical
Sciences Division, Earth System Research Laboratory, NOAA, Boulder, Colorado, from their Web site
at http://www.esrl.noaa.gov/psd/‘.
Maximum value of average rainfall in the region is 8.3 mm/day and minimum value is 0.045 mm/day.
Figure 3.11 given below reciprocates the mean rainfall of the area in mm/day.
FIG. 3.11: MEAN RAINFALL (MM/DAY)

Pre-drill EIA for the NELP block MB-OSN-2005/3 (5-Appraisal Wells) 2017
25
MEAN WIND SPEED
As per Physical Sciences Division, Earth System Research Laboratory, NOAA, Boulder, Colorado, from
their Web site at http://www.esrl.noaa.gov/psd/, mean wind speed measured in m/sec for the period of
January 2011 to December 2011 for the study area lies in the range of 6.1 to 6.8 m/sec. Minimum and
maximum value of the same in the region is 3.5 m/sec and 9.98 m/sec. Figure 3.13 given below shows
the mean wind speed (m/s) of the Arabian sea.
FIG. 3.12: WIND PATTERN OF INDIAN OCEAN
―V‖ COMPONENT OF WIND
"V" component represents the north-south component. The positive V component answer indicates a
southerly component to the wind, or in other words, a wind that blows from south to north. A negative V
component would mean that the wind is blowing from north to south. Mean value of V component of
wind in the region of proposed exploratory block lies in the range of -1m/s to 0 m/s as per ‗Physical

Pre-drill EIA for the NELP block MB-OSN-2005/3 (5-Appraisal Wells) 2017
26
Sciences Division, Earth System Research Laboratory, NOAA, Boulder, Colorado,
(http://www.esrl.noaa.gov/psd/). Figure 3.14 below shows the V component of wind speed (m/s)
showing the tentative location of block.
FIG. 3.13: MEAN WIND SPEED (M/S)
Fig.3.14: Mean V component of the wind

Pre-drill EIA for the NELP block MB-OSN-2005/3 (5-Appraisal Wells) 2017
27
―U‖ COMPONENT OF WIND
The "U" component represents the east-west component of the wind. The minus sign in front of
the U component answer indicates an easterly component to the wind, or in other words, a wind that
blows from east to west. A positive U component would mean that the wind is blowing from west to
east. According to Physical Sciences Division, Earth System Research Laboratory, NOAA, Boulder,
Colorado (http://www.esrl.noaa.gov/psd/), mean value of u component of wind, averaged over January
2011 to December 2011 in the region of proposed exploratory block lies in the range of 2 m/s to 3.5
m/s. Figure 3.15 given below shows the U component of wind speed (m/s) of the Arabian Sea indicating
the tentative location of block.
MEAN AIR TEMPERATURE
Maximum and minimum value of mean air temperature in the Arabian Sea is of the order of
30.2 ºC and 24.4 ºC, respectively. Mean air temperature of the area of exploratory block lies in the
range of 26.5 ºC to 27.5 ºC as per data available with Physical Sciences Division, Earth System
Research Laboratory, NOAA, Boulder, Colorado. Figure 3.15 given below indicates the mean air
temperature of the Arabian Sea showing tentative location of block.
FIG. 3.15: U COMPONENT OF WIND (M/S)

Pre-drill EIA for the NELP block MB-OSN-2005/3 (5-Appraisal Wells) 2017
28
MEAN SEA SURFACE TEMPERATURE
Maximum and minimum value of mean sea surface temperature in the Arabian Sea is of the
order of 30.8 ºC and 26.04 ºC, respectively. Mean air temperature of the area of exploratory block lies
in the range of 27 ºC to 27.5 ºC as per data available with Physical Sciences Division, Earth System
Research Laboratory, NOAA, Boulder, Colorado.
TIDES
The tides in the offshore area are of mixed semi-diurnal type with a large diurnal inequality. The
tidal range in the gulf is about 4 m at the mouth and increase to around 7 m in the inner gulf. This
macro-tidal range is associated with strong water flows during ebb and flood tides. The gulf waters
behave as homogeneous one-layered structure due to high tidal range, low run-off from land, shallow
depth and irregular bottom topography – all suitable for turbulent flow field; however the impacts of the
complex physiographic features on the shelf circulation and shelf sediment dynamics remain
unexplained. This behaviour of the gulf is in sharp contrast to the estuaries on the west coast of the
India, which show seasonal stratification, sometimes with salt –wedge formation associated with the
height of the two monsoons. Figure given in Fig 3-17 indicates the mean sea surface temperature of the
Arabian Sea showing tentative location of block.
FIG. 3.16: MEAN AIR TEMPERATURE (ºC)

Pre-drill EIA for the NELP block MB-OSN-2005/3 (5-Appraisal Wells) 2017
29
FIG. 3.17: MEAN SEA SURFACE TEMPERATURE (ºC)
CIRCULATION
Circulation in the gulf is mainly controlled by tidal flows and bathymetry. Strong currents
normally occur during mid-tide, i.e. 2-3 hrs. before and after low and high tides. The spring currents are
60-65% stronger than the neap currents. The surface currents are moderate (0.7 to 1.2 m/s), but
increases considerably (2.0-2.5 m/s) in the central portion of the gulf. The bottom currents are
periodically strong with bimodal directions generally parallel to the uneven bottom contour. The
associated tidal currents are fairly strong and bimodal in nature having two dominant directions –
upstream during flood and downstream during ebb in all-encompassing oscillatory motions.
The circulation pattern in the near shore areas however is modified considerably due to the
presence of creeks and inlets.

Pre-drill EIA for the NELP block MB-OSN-2005/3 (5-Appraisal Wells) 2017
30
Chapter- 4
DESCRIPTION OF ENVIRONMENT
This chapter describes the existing environmental settings in the block MB-OSN-2005/3 and
its immediate surroundings comprising of physical environment, namely, air, water and land
components, the biological environment. Attributes of the physical environment were assessed primarily
through collection and analyses of surface water samples by IPSHEM, ONGC Goa. Records and
literature available in public domain were studied for amassing information about physical and
ecological features of marine environment.
4.1. STUDY AREA
The NELP VII Block MB-OSN-2005/3 is located in the southwest of the Mumbai High-DCS
platform of Mumbai Offshore Basin, having an area of 1685 km2 having 90-100 meter bathymetry
range. The distance between block boundary and the coastal area is about 138 NM.
4.2. STUDY COMPONENTS:
The components for EIA study of the proposed exploratory block include Climate &
Meteorology, Physico-chemical parameters of sea surface water and ecologically sensitive marine
areas. The details of the study parameter, its study area and study components are given in Table 4.1.
TABLE 4.1: DETAILS OF STUDY COMPONENTS, STUDY AREA AND STUDY PARAMETER
Sr. No. Study Components Study Area Study Parameters
1. Climate & Meteorology MB-OSN-2005/3 and Mumbai high offshore
Wind pattern, ocean currents, rainfall, wave height and direction.
2. Physico-Chemical characteristics of marine surface water
MB-OSN-2005/3 block area within 1 km2 from the proposed drilling locations.
Physical parameters – pH, Salinity, temperature. Chemical Parameters – Oil & Grease, Total Petroleum Hydrocarbon (TPH), Petroleum aromatic Hydrocarbon (PAH)
3 Ecology MB-OSN-2005/3 and Mumbai high offshore
Marine ecology for the Mumbai Offshore and coastal areas near the block.
4 Marine Sensitive Areas No sensitive areas fall within 1 km from the project activity area.

Pre-drill EIA for the NELP block MB-OSN-2005/3 (5-Appraisal Wells) 2017
31
4.3. BASELINE ENVIRONMENT
INTRODUCTION
It was early 70's, when Oil and Natural Gas Corporation Limited (ONGC) started oil
exploration activities in western offshore region. After the discovery of oil at Bombay High in 1974, from
the first offshore rig - Sagar Samrat, ONGC increased its attention towards Bombay High. True to
expectations, ONGC has delineated several major and minor oil fields on the western continental shelf.
During the various phases of development of Oil and Gas fields in western offshore, ONGC has
deployed several drilling rigs and commissioned process complexes besides more than a hundred
unmanned platforms. Strict controls by the Government necessitated ONGC to device plans to
minimize impacts from the offshore activities on the environment.
Though ONGC developed its own self control strategies in the initial phases of oil field
development by following international norms and practices, enactment of environment legislation and
regulation by the Ministry of Environment & Forests (MoEF) culminated in closer scrutiny of operations
by both governmental and non-governmental agencies. The Government also imposed several
conditions viz. incorporating preventive measures in the design, emergency preparedness for
accidental pollution and regular environment monitoring around the installations.
IPSHEM, Goa had carried out the first ever such environment monitoring as a two season
study (post monsoon season and pre monsoon season) during November 1994 and March 1995. As
the variation of result is not significant, it was decided to carry out once in a year and since the year
2003, the offshore environment monitoring around the ONGC‘s installations in the western offshore
region is being conducted every year regularly.
4.3.1 OBJECTIVES AND SCOPE OF THE STUDY
As mentioned above, ONGC as per the directives of the Government has started regular
environment monitoring around its installations in the western offshore region, to identify if there are any
impacts on the marine life due to its oil field activities. The objectives of the study are;
To generate a data bank of various important parameters by monitoring the water column
near the offshore installations and beyond 6 km from the installations, can be considered
as reference points.
To assess the spatial and temporal effects on marine benthic communities by sea bed
monitoring.

Pre-drill EIA for the NELP block MB-OSN-2005/3 (5-Appraisal Wells) 2017
32
4.3.2 SCOPE OF WORK
Collection of water samples in water column for monitoring hydrographical chemical and
biological characteristics including pollutants like hydrocarbons and heavy metals.
Collection of sediment samples for quantifying hydrocarbon deposition, heavy metal
concentrations and benthic biota.
Collection of a few samples of zooplankton and fish in the vicinity of oil fields to
understand and estimate the possible bioaccumulation of pollutants.
In general, the parameters to be studied and the frequency of monitoring are decided by
the local authorities. These guidelines are useful in fixing of sampling locations around the
platforms. The guidelines are based on the overall objective of environmental monitoring,
namely to assess the effects and extent of the spreading of oil and chemicals discharged
from the offshore industry into the marine environment.
4.3.3 METHODOLOGY
The task of offshore environment monitoring is needed the coordination of various agencies like,
A survey vessel to go around the offshore area for sample collection, analysis on board
and preservation of some samples;
A biological team for collection and interpretation of marine biological samples;
Fixing of sampling locations around offshore installation — these were governed by the
Paris commission guidelines as detailed above.
The survey vessel would cruise to the locations where samples were desired as per the given
geographical coordinates (lat/long) were collected and preserved for analysis. The typical sample
collection sketch conforming to international standards is shown in Fig. 4.1.
In view of this, IPSHEM adopted the following methods to execute the project.

Pre-drill EIA for the NELP block MB-OSN-2005/3 (5-Appraisal Wells) 2017
33
Fig. 4.1: Typical lay out of sampling locations based on Paris Commission Guidelines
4.3.4 ASSOCIATION OF BIOLOGICAL EXPERTISE:
Agency, having well experienced in Offshore Environment Monitoring and engaged in all
types of Oceanographic studies like Physical, Chemical, Biological and Geological studies was
approached for this study. A senior scientist working in the Biological division of the agency was
associated for the biological part of the study. He has carried out similar biological work in the past in
the coastal and offshore marine environment.
CRUISE VESSEL
A research vessel scrutinized by ONGC offshore security and offshore Defense Advisory
Group was hired by the agency. It should have bow and stern thrusters, auto steering system, radio
communication and satellite telephone etc. in addition to GPS and Radar for accurate positioning of the
vessel. It will be equipped with computerized weather monitoring system and a well-set laboratory for
analysis and preservation of samples. The cruise route and the sample locations along the cruise route
is depicted in the Fig. 4.2.

Pre-drill EIA for the NELP block MB-OSN-2005/3 (5-Appraisal Wells) 2017
34
4.3.5 DESCRIPTION OF STUDY AREA AND SAMPLING LOCATIONS:
The sampling locations around these installations were fixed based on Paris Commission
Guidelines, 1989 and was also guided by the following criteria.
Pipeline network in the immediate vicinity of the platform
Sea state and maneuverability of the vessel near the installation
In this study, two locations viz. Location-1 and Location-2 were covered to know the
environmental status of specific portion of Western Offshore. The sampling locations around all these
locations are given below.
Fig. 4.2: Cruise Sailing Route
Location-2
Location-1

Pre-drill EIA for the NELP block MB-OSN-2005/3 (5-Appraisal Wells) 2017
35
Coordinates of the Sampling Location-1:
Approach
towards
Installation/
Direction
Distance from
the location
Sample
number Location Code Latitude Longitude
North- 1
2 km RA4-1 RA4/2/1 19007‘26‖ 70056‘24‖
1 km RA4-2 RA4/1/1 19006‘53‖ 70056‘39‖
0.5 km RA4-3 RA4/0.5/1 19006‘32‖ 70056‘37‖
South West -2
2 km RA4-4 RA4/2/2 19005‘38‖ 70055‘26‖
1 km RA4-5 RA4/1/2 19005‘48‖ 70056‘13‖
0.5 km RA4-6 RA4/0.5/2 19006‘04‖ 70056‘26‖
South East-3
2 km RA4-7 RA4/2/3 19005‘29‖ 70057‘27‖
1 km RA4-8 RA4/1/3 19005‘44‖ 70056‘48‖
0.5 km RA4-9 RA4/0.5/3 19005‘58‖ 70056‘48‖
Reference Point >6 Km RA4-10 RA4/6/1 19002‘38 70057‘15‖
Coordinates of Sampling Location-2:
Installation Latitude Longitude
Location -2 19014‘26‖ 70058‘52‖
Approach
towards
Installation/
Direction
Distance from
the location
Sample
number Location Code Latitude Longitude
North- 1
2 km RGD-1 RGD/2/1 19015‘28‖ 70058‘47‖
1 km RGD-2 RGD/1/1 19015‘01‖ 70058‘47‖
0.5 km RGD-3 RGD/0.5/1 19014‘44‖ 70058‘57‖
South West -2
2 km RGD-4 RGD/2/2 19013‘35‖ 70058‘20‖
1 km RGD-5 RGD/1/2 19013‘54‖ 70058‘32‖
0.5 km RGD-6 RGD/0.5/2 19014‘14‖ 70058‘37‖
South East-3
2 km RGD-7 RGD/2/3 19013‘37‖ 70059‘46‖
1 km RGD-8 RGD/1/3 19013‘52‖ 70059‘17‖
0.5 km RGD-9 RGD/0.5/3 19014‘09‖ 70059‘08‖
Reference Point >6 KM RGD-10 RGD/6/1 19010‘52‖ 70059‘05‖
Installation Latitude Longitude
Location-1 19006‘05‖ N 70056‘26‖ E

Pre-drill EIA for the NELP block MB-OSN-2005/3 (5-Appraisal Wells) 2017
36
4.3.6 EQUIPMENT USED FOR SAMPLING:
Mechanical Instruments
Electro-hydraulic winch
Hydrographic winch
Van Veen Grab
Single arm davits
Nishkin Bottle Sampler
Plankton nets
Electronic Instrument
Echo Sounder
CTD
DGPS
AWS
UPS
pH meter
Spectrophotometer
Spectroflouro meter
Computer
SAMPLING OF WATER:
All Seawater samples were collected from three levels of the water column-surface (1 m
below the surface), mid depth and near bottom (3 - 4 m above the sea bed) using PVC Niskin type
samplers of 5 L capacity. Depth measurements were made to the nearest 1 m using a digital counter
attached to the pulley and counter checked by marking the cable.
SAMPLING OF SEDIMENTS:
A Van Veen grab of 25 cm x 30 cm dimension and approximately 1.5 kg capacity having a
penetration depth of 10 cm was used for collection of sediments. This medium version of the grab was
used to prevent likely damage to pipelines etc. in case of any accidental strike on flow lines.
SAMPLING OF PLANKTON AND BENTHOS:
Zooplankton samples were collected with a modified Heron-Tranter (HT) net; having 0.25m2
mouth areas and 330m mesh size. A horizontal haul of similar plankton net of 60 mesh size was
used for collection of mixed plankton. The collections were made during the period sunrise to sunset
only.
STORAGE AND PRESERVATION:
Samples of sea water (1 L) were preserved in polythene bottle after addition of metal free
hydrochloric acid for further analysis of heavy metals in the laboratory. Two aliquots of 1 L, each were
filtered through GF/F filters (pore size 0.70pm) and extracted with 10mL of 90% acetone under cold
dark conditions after an extraction period of 18 to 20 hours. The extract (g.L -1) was determined using
fluorometer. Column chlorophyll-a (mg m-2) was calculated by integrating the depth values. Zooplankton
samples were preserved in 5% neutral formalin for further identification and quantification. Sediment

Pre-drill EIA for the NELP block MB-OSN-2005/3 (5-Appraisal Wells) 2017
37
samples were made to stand in 5% buffered Rose- Bengal formalin for 24 hours and then sieved
onboard the vessel using standard sieves for collection of benthic organisms. The fauna thus collected
were stored in 4% neutral formalin for subsequent analysis. Samples for sediments were also collected
in aluminum foil and preserved at -20° C for hydrocarbon analysis. Another set of sediment samples
were collected in pre washed polythene bags and preserved at room temperature for grain size analysis
and the determination of heavy metals. Samples of fish and fish tissues were collected onboard in
aluminum foils and polythene bags and stored at -20° C for subsequent determination of hydrocarbons
and heavy metals in the laboratory.
ANALYTICAL METHODS:
Immediately after collection, seawater samples were analyzed for pH and nutrients (Nitrate,
Nitrite, Phosphate and Silicate). Nutrients were analyzed using chemical methods (Grasshoff, 1987).
Petroleum Hydrocarbons were extracted immediately after collection of seawater onboard the vessel
from 500 ml of seawater with spectroscopic grade n-hexane and the extract was preserved at 5°C for
further analysis in the laboratory. Parameters like temperature, salinity, dissolved oxygen were
determined, onboard the vessel, using the CTD profiler and the values were double-checked using
manual methods. At each of the location, zooplankton was collected, by deploying a Heron-Tranter net
fitted with calibrated TSK flow meter at the mouth area. The net was towed horizontally at a uniform
speed of 1.5 knots for five minutes. After initial processing onboard the ship, zooplankton samples were
further studied for population density, biomass, faunal composition and taxon diversity by using
standard procedures.
Sea bottom dwelling organisms or benthos were collected, at each of the location, by
lowering a Van Veen Grab having penetration depth of 10 cm and variable surface coverage of 587.5
cm2 (small grab) and 1035 cm2 (large grab). Meiobenthos sampling was done by using a plexiglass
core of 4.5 cm diameter. Macrobenthos samples were processed onboard the vessel, by sieving
through 500 micron stainless steel mesh screen for 48 hours whereas the samples for meiobenthos
were passed through a 63 micron sieve. Organisms - micro and macro were treated with Rose Bengal
stain and further preserved, in 5% seawater formalin.
Bottom deposits were classified into dominant sediment type by visual touch-on method.
Silty - clay followed by sand were the dominant sediment types. The methods followed for analyzing

Pre-drill EIA for the NELP block MB-OSN-2005/3 (5-Appraisal Wells) 2017
38
various parameters have been taken from standard books on the subject of seawater analysis and
conform to US EPA standards.
WINDS:
The meteorology of the study area is governed by the monsoon system inducing alternating
winds and currents. The Northeast monsoon winds (November-February) are rather moderate,
compared to the Southwest monsoon winds (June to September). The meteorological data recorded in
the vicinity of these two locations are given in table No: 1.
SEDIMENT CHARACTERISTICS
The continental shelf of western offshore region is approximately 140 nautical miles of the
coast of Mumbai. The shelf is distinguished as an inner and outer part, the demarcation being the 60 m
isobaths (Nair & Hashmi, 1980). The inner shelf is dominated by recent terrigenous deposits while the
outer shelf is characterized by relict oolite sand (Satyaprakash and Agarwal, 1981). The sedimentary
cover of the continental shelf exhibits a seaward succession of increasing granulometry from clay to silt
and sand (Nair and Hashmi, 1980)
The sediment samples collected at various locations during the present study also revealed
that the sediments were not uniformly distributed in the study area.
4.3.7 Methodology Followed for the analysis of Hydrographical and Chemical Parameters
4.3.7.1 HYDROGRAPHICAL PARAMETERS
TEMPERATURE:
Temperature was measured using the centigrade thermometer with a graduation of 0 - 100
°C. This is an important parameter since the characteristics of water column like the density, viscosity,
solubility, of gases and dissolved oxygen are related to temperature of the water column. The variation
in temperature of a water body has great impact upon the biological productivity. The organism
including fishes show limited tolerance for variation in temperature for processes such as feeding,
reproduction and movement. Distribution of aquatic organism is greatly influenced by water
temperature.
During the survey it was revealed that the water column experienced homogeneous and
uniform distribution of temperature indicating that the impact of the offshore operation on the thermal
regime of the water column is insignificant.

Pre-drill EIA for the NELP block MB-OSN-2005/3 (5-Appraisal Wells) 2017
39
pH: pH was measured using a portable pH meter ( Systronics) with an accuracy of ± 0.01 pH units.
pH meter was first calibrated with standard pH buffers of pH 7.0 and pH 4.0.
SALINITY: Salinity was measured directly by Systronics water analyzer with an accuracy of 0.1ppt. Prior to
the sample, standard seawater was used to calibrate the salinometer.
TURBIDITY:
Turbidity was measured by Nephelometric method and the results are expressed in
Nephelometric Turbidity units (NTU). This method was based on a comparison of an intensity of light
scattered by the sample under defined conditions with the intensity of light scattered by a standard
reference suspension under the same conditions. The greater the intensity of the scattered light, the
higher is the turbidity. Standard turbidity suspensions for calibration were prepared by using hydrazine
sulphate and hexamethylene tetramine and the analysis were carried out using turbidity meter.
SUSPENDED SOLIDS:
A known volume of seawater was filtered through a pre-weighed 0.45m Millipore filter
paper. This paper was dried till constant weight was obtained. The difference in initial weight and the
weight after filtration and drying was taken and the amount of suspended solids calculated.
4.3.7.2 CHEMICAL PARAMETERS
Dissolved Oxygen: Dissolved Oxygen (DO) was measured directly by Systronics water analyzer with an accuracy of
0.1ppm. The values of DO are expressed in mg/L.
NUTRIENTS
Phosphate — Phosphorus
Dissolved reactive phosphate was measured by the method of Murphy & Riley in which the
seawater samples were made to react with acidified molybdate reagent and reduced using ascorbic
acid. The absorbance of the resultant blue complex was measured at 880 nm using HACH (DR- 3900)
spectrophotometer.
Nitrite — Nitrogen:
Nitrite was measured by the method of Bendschneider and Robinson wherein the nitrite in
the samples was determined by diazotising with sulfanilamide and coupling with N (1-Naphthy)-

Pre-drill EIA for the NELP block MB-OSN-2005/3 (5-Appraisal Wells) 2017
40
ethylene diamine-dihydrochloride. The absorbance of the resultant azo-dye was measured at 543 nm
by a HACH (DR- 3900) spectro-photometer.
Nitrate — Nitrogen:
Nitrate in the samples was first reduced quantitatively to nitrite by heterogeneous reduction
by passing the buffered seawater samples through an amalgamated cadmium column and the resultant
nitrite was analyzed as above. The measured absorbance was due to the initial nitrite in the sample and
nitrite obtained after the reduction of nitrate. Necessary correction was therefore made for any nitrite
initially present in the sample.
Silicates:
The determination of silicates in seawater was based on the formation of a yellow
silicomolybdic acid when a nearly acidic sample was treated with a molybdate reagent. The yellow
silicomolybdic acid was reduced to an intensely colored blue complex using ascorbic acid as the
reductant and the colour was measured spectrophoto metrically.
Petroleum Hydrocarbons:
Dissolved / dispersed petroleum hydrocarbons were extracted from seawater with Methylene
Chloride followed by GC- FID Analysis using Thermo (GC- 1000) GCFID.
Sediment:
Total Phosphorus:
The organic phosphorus was converted into inorganic form by digestion of sediment with
perchloricacid and the phosphorous was estimated using standard methods applicable for the
estimation of inorganic phosphate phosphorus by spectrophotometric method.
Total Nitrogen:
Total nitrogen was estimated by the persulphate oxidation technique in which the nitrogen
compounds were converted to nitrates by alkaline persulphate at 115 °C (in an autoclave under
pressure) and the resultant NO3 was reduced to NO2 by passing through the cadmium amalgamated
column. Finally the NO2 was estimated by diazotization and coupling with aromatic amines and
measured at 543 nm by a spectrophotometer.

Pre-drill EIA for the NELP block MB-OSN-2005/3 (5-Appraisal Wells) 2017
41
Total Organic Carbon:
Total carbon present in organic material in sea sediment is estimated with the help of muffle furnace
using semi- quantitative method and finally total organic carbon is calculated in percentage.
Petroleum Hydrocarbons:
Dried sediment sample was digested with the perchloricacid and PHC was measured with Thermo (GC-
1000) GC-FID.
4.3.8 RESULTS AND DISCUSSION
Identified sampling locations are retitled as Location-1 and Location-2 respectively during
the following discussion to avoid complexity. The data of chemical characteristics, dissolved oxygen,
nutrients like nitrate, nitrite, phosphate and silicate as recorded around these locations of Western
offshore are presented in following Tables.
4.3.8.1 Temperature
Sampling Points around the Location-1 and Location-2 have shown temperature‘s variation
from 26.2-28.3 °C and 26.2-28.3 °C respectively and an average temperatures were detected of 27.31
°C and 27.11 °C respectively. The surface layer showed higher temperature at all the locations, which
decreased towards the bottom. At location1 reference point, temperature was varying from 26-26.9 °C
whereas at location-2 reference point, temperature was 26.1-26.8 °C. The observed range of
temperature variation is well in normal limits for the coastal waters.
4.3.8.2 pH
Sampling Points around the Location-1 and Location-2 have shown pH‘s variation from
7.12-8.3 and 6.75-8.25 respectively and an average pH values were detected of 7.78 and 7.67
respectively. At location-1 reference point, pH was varying from 7.21-8.28 whereas at location-2
reference point, temperature was 7.1-8.26. No particular trend is followed regarding the distribution of
pH, though all the observed pH values are well within normal limits.
4.3.8.3 Salinity
Sampling Points around the Location-1 and Location-2 have shown salinity‘s variation from
31.5-37.5 PSU and 31.6-38.4 PSU respectively and an average salinity values were detected of 34.4
PSU and 35.57 PSU respectively. At location-1 reference point, salinity was varying from 33.8-36.8
PSU whereas at location-2 reference point, salinity was 36.7-37.5 PSU. The observed salinity values
are similar to those observed at the reference locations and the values are well within acceptable limits.

Pre-drill EIA for the NELP block MB-OSN-2005/3 (5-Appraisal Wells) 2017
42
4.3.8.4 Turbidity:
Sampling Points around the Location-1 and Location-2 have shown turbidity‘s variation from
4.6 – 16.8 NTU and 3.4 – 17.4 NTU respectively and an average turbidity values were detected of
10.31 NTU and 9.02 NTU respectively. At location-1 reference point, turbidity was varying from 8.4-10.9
NTU whereas at location-2 reference point, turbidity was 4.6-9.6NTU. The variation of turbidity has
followed no trend and the observed turbidity indicate normal values for the seawater at the site.
4.3.8.5 Total Suspended Solids:
Sampling Points around the Location-1 and Location-2 have shown the Total Suspended
Solids (TSS)‘s variation from 10-38 mg/L and 9-34 mg/L respectively and an average TSS values were
detected of 24.98 mg/L and 18.63 mg/L respectively. At location-1 reference point, TSS was varying
from 20-41 mg/L whereas at location-2 reference point, TSS was 13-16 mg/L. The vertical variation of
suspended solids shows no characteristic trend, however comparing the values with reference point;
disturbance of operational activity cannot be concluded. The observed values are within normal limits
for the coastal seawater
4.3.8.6 Dissolved Oxygen ( DO):
Dissolved Oxygen (DO) concentrations are considered to be very vital parameter to assess
the health of the marine environment especially where exploration and production activities are in
progress. The measured DO concentrations around Location-1 and Location-2 have almost shown
predictable a variation depends on depth at which sample was collected (In general, DO concentrations
are decreased when depth is increased).
Sampling Points around the location-1 and Location-2 have shown the DO‘s variation from
3.24-5.38 mg/L and 3.25-5.34 mg/L respectively and an average DO values were detected of 4.42 mg/L
and 4.30 mg/L respectively. At location-1 reference point, DO was varying from 3.52-5.38 mg/L
whereas at location-2 reference point, DO was 3.67-4.67mg/L. Subsequently, studying all these
experimental results carefully, it is observed that all obtained values are most similar to the values
obtained at reference location values and well within acceptable limits for the coastal seawater.

Pre-drill EIA for the NELP block MB-OSN-2005/3 (5-Appraisal Wells) 2017
43
Nutrients
i. Phosphate – Phosphorous:
Sampling Points around the Location-1 and Location-2 have shown Phosphate–
Phosphorus (PP)‘s variation from 0.042–0.84 μmol/L and 0.045–0.75 μmol/L respectively and an
average PP values were detected of 0.21 μmol/L and 0.21 μmol/L respectively. At location-1 reference
point, PP was varying from 0.10-0.19 μmol/L whereas at location-2 reference point, PP was 0.16-0.19
μmol/L. The vertical variation of phosphates at these locations showed no regular trend of phosphate
phosphorous. The values observed however are normal for the coastal seawater.
ii. Nitrite – Nitrogen:
Sampling Points around the Location-1 and Location-2 have shown Nitrite – Nitrogen (NN)‘s
variation from 0.008 – 0.026 μmol/L and 0.007 – 0.027 μmol/L respectively and an average NN values
were detected of 0.016 μmol/L and 0.015 μmol/L respectively. At location-1 reference point, NN was
varying from 0.013-0.017 μmol/L whereas at location-2 reference point, NN was 0.015-0.016 μmol/L.
The Nitrite – Nitrogen values follows no particular trends and they are similar at all the locations and at
all the water columns. The values observed as well within normal acceptable limits
iii. Nitrate – Nitrogen:
Sampling Points around the Location-1 and Location-2have shown Nitrate – Nitrogen (NN)‘s
variation from 0.015 – 4.5 μmol/L and 0.022 – 0.67 μmol/L respectively and an average NN values were
detected of 0.85 μmol/L and 0.30 μmol/L respectively. At location-1 reference point, NN was varying
from 0.014-0.34 μmol/L whereas at location-2 reference point, NN was 0.037-0.043 μmol/L. The Nitrate
– Nitrogen values follows no particular trends and values are at lower side. The values are within
normal acceptable limits.
iv. Silicates :
Sampling Points around the Location-1 and Location-2have shown Silicate‘s variation from
0.12-0.57 μmol/L and 0.16-0.45 μmol/L respectively and an average Silicate values were detected of
0.31μmol/L and 0.29 μmol/L respectively. At location-1 reference point, Silicate was varying from 0.28-
0.51 μmol/L whereas at location-2 reference point, Silicate was 0.29-0.35 μmol/L. The observed values
are normal for the coastal seawater.

Pre-drill EIA for the NELP block MB-OSN-2005/3 (5-Appraisal Wells) 2017
44
v. Petroleum Hydrocarbons (PHC) :
Sampling Points around the Location-1 and Location-2 have shown (Table-4.1) PHC‘s
concentration very minimal at majority of points which comes under non detection limit. At both the
reference locations also, the PHC comes under non detection level. The distribution of PHC in the
sediment samples at and around the both locations has shown (Table.7) minute contamination, though
all observed valued values are acceptable limits.
SEDIMENT QUALITY:
Total Phosphorous and Total Nitrogen
The Total Phosphorous and Total Nitrogen‘s concentration was measured in the sediment
samples collected around the sampling points of Location-1 and Location-2 has shown variation from
19.7—40.2 μg/g and 8.6—30.1 μg/g respectively and an average values were detected of 29.2 μg/g
and 25.2 μg/g respectively. At location-1 reference point, the concentration was 92.4 μg/g whereas at
location-2 reference point, it was 64.2 μg/g.
Total organic carbon :
The Total Organic Carbon‘s concentration was measured in the sediment samples collected
around the sampling points Location-1 and Location-2has shown variation from 1.9% to 4.7% and 2.0%
to 4.2% respectively and an average values were detected of 3.0% and 3.0%μg/g respectively. At
location-1, the concentration was 3.1% whereas at location-2 reference point, it was 1.4%.
PHC content in Sediment :
The PHC‘s concentration was measured in the sediment samples collected around the
sampling points of Location-1 and Location-2has shown variation from 45.62– 86.74 g/g and 42.81–
89.67 g/g respectively and an average values were detected of 64.055 g/g and 69.42 g/g
respectively. At location-1 reference point, the concentration was 34.51g/g whereas at location-2
reference point, it was 46.52g/g. Though all the locations are contaminated with PHC‘s, the values are
within acceptable limits.
Sediment textures:
The texture of sediment samples collected around the Location-1 and Location-2 have been
analyzed systematically and it has been observed that the composition of clay varies from 30% -42%

Pre-drill EIA for the NELP block MB-OSN-2005/3 (5-Appraisal Wells) 2017
45
and 57% -80% respectively with average value of 36.71% and 69.7% respectively. At location-1
reference point, it was 31% whereas at location-2 reference point, it was 36%.
f
Table - 4.1:: Meteorological parameters
Sr. No. Parameter Unit Location: 1
Date : 26.10.13
Time : 07:30 am
Location: 2
Date : 26.10.13
Time : 01:45 pm
1 Latitude - 19° 05‘ 69‖ N 19° 13‘ 157‖ N
2 Longitude - 70° 57‘ 46‖ E 70° 57‘ 714‖ E
3 Speed Knots 1.2 1.3
4 Heading ° C 220 15
5 Coarse ° C 214 10
6 Depth m 84 79
7 Wind Crest m/sec 2.7 3.4
8 Wind Speed m/sec 7.72 8.75
9 Wind Direction - NE NE
10 Air Temp. °C 30 29
11 Pressure mbar 1009.3 1010.7
Table-4.2 :: Hydrographical Parameters of Sea Water Column around Offshore Locations
Location: 1
Location Distance from Location Depth Temp Salinity pH Turbidity Suspended solids
°C PSU pH Unit NTU mg/l
1 0.5 km
S 28.3 33.4 7.94 5.9 24
M 27.7 32.5 7.21 4.6 20
B 27.5 31.5 7.51 7.6 36
2 1 km
S 27.8 35.9 7.68 11.2 19
M 27.5 34.8 8.14 10.6 17
B 27 33.4 7.14 12.7 15
3 2 km
S 27.6 35.6 7.65 5.4 25
M 27.2 33.2 7.58 8.3 27
B 26.9 31.6 8.16 15.4 16
4 0.5 km
S 27.4 33.8 8.14 12.6 23
M 27.1 35.6 8.16 14.3 10
B 26.9 33.9 7.95 12.5 18
5 1 km S 27.5 34.5 8.16 11.6 29

Pre-drill EIA for the NELP block MB-OSN-2005/3 (5-Appraisal Wells) 2017
46
M 26.7 36.8 8.13 13.8 37
B 26.2 37.5 7.79 11.4 28
6 2 km
S 27.9 34.6 7.54 12.6 36
M 27.4 36.8 8.15 5.6 38
B 27 34.2 7.68 8 21
7 0.5km
S 27.5 32.1 7.45 14.7 16
M 27.8 36.7 8.3 6.8 18
B 26.9 34.7 7.54 5.6 28
8 1 km
S 27.4 31.7 7.68 8.4 26
M 27.6 36.8 7.84 11.2 19
B 27.1 32.9 7.31 13.5 34
9 2 km
S 27.6 34.7 8.19 16.8 25
M 27.2 32.8 8.02 9.8 31
B 26.7 36.8 7.12 7.5 37
R R
S 26.9 33.8 8.28 8.4 20
M 26.4 35.7 8.09 10.9 21
B 26 36.8 7.21 9.6 41
Location: 2
Location Distance from Location Depth Temp Salinity pH Turbidity Suspended solids
°C PSU pH Unit NTU mg/l
1 0.5 km
S 27.9 34.2 6.75 14.3 16
M 27.4 31.7 7.42 3.6 10
B 26.7 36.1 7.21 4.6 19
2 1 km
S 27.3 34.8 7.52 12.7 24
M 26.8 35.9 7.31 4.8 27
B 26.2 37.4 8.24 6.9 14
3 2 km
S 27.5 36.7 7.98 4.7 18
M 27 37.8 7.42 6.4 16
B 26.8 35.9 7.86 8.2 14
4 0.5 km
S 27.3 34.2 7.81 12.3 24
M 26.8 36.7 7.58 10.2 29
B 26.5 32.7 7.68 9.5 27
5 1 km
S 27.8 31.6 7.24 5.6 16
M 27.2 32.7 8.25 4.6 16
B 26.7 33.7 8.12 3.4 16
6 2 km S 27.2 37.6 8.2 4.7 15
M 26.7 36.9 7.86 5.8 21

Pre-drill EIA for the NELP block MB-OSN-2005/3 (5-Appraisal Wells) 2017
47
B 26.3 34.8 7.25 4.5 12
7 0.5km
S 28.3 35.9 7.61 6.7 24
M 27.5 37.4 7.82 13.8 10
B 26.7 35.9 7.95 15.6 14
8 1 km
S 27.9 36.8 8.13 17.4 16
M 27.3 37.1 7.43 13.8 28
B 26.8 36.4 8.1 14.8 34
9 2 km
S 27.7 38.4 7.51 12.9 24
M 27.2 36.4 7.62 11.8 10
B 26.7 34.8 7.41 10.2 9
R R
S 26.8 36.7 7.1 9.6 13
M 26.4 37.5 8.26 4.6 14
B 26.1 36.9 8.2 7.6 16
S-Surface, M-Middle, B- Bottom, R-Reference
Table-4.3: Chemical Parameters of Sea Water Column around Offshore Locations
Location: 1
Location Distance from
Location Depth
Dissolved oxygen Nutrients
Nitrite-N Nitrate-N Phosphate-P Silicate-Si
mg/l mg/l mg/l mg/l mg/l
1 0.5 km
S 5.32 0.019 0.22 0.042 0.43
M 4.6 0.014 2.51 0.12 0.45
B 3.5 0.013 0.39 0.19 0.23
2
` 1 km
S 5.24 0.018 0.21 0.12 0.25
M 4.65 0.018 3.45 0.084 0.26
B 3.24 0.009 0.21 0.14 0.28
3 2 km
S 5.31 0.012 0.29 0.21 0.19
M 4.38 0.021 4.51 0.24 0.24
B 3.65 0.014 0.25 0.23 0.37
4 0.5 km
S 5.31 0.019 0.87 0.21 0.42
M 4.7 0.013 2.6 0.074 0.2
B 3.8 0.014 0.18 0.14 0.26
5 1 km
S 5.37 0.02 0.24 0.19 0.27
M 4.57 0.025 2.63 0.84 0.19
B 3.68 0.017 0.54 0.21 0.32
6 2 km S 5.1 0.008 0.19 0.16 0.25
M 4.63 0.01 0.015 0.17 0.16

Pre-drill EIA for the NELP block MB-OSN-2005/3 (5-Appraisal Wells) 2017
48
B 3.57 0.011 0.16 0.18 0.36
7 0.5km
S 4.75 0.015 0.28 0.25 0.31
M 3.85 0.021 1.3 0.24 0.36
B 3.52 0.02 0.28 0.29 0.45
8 1 km
S 4.75 0.008 0.54 0.27 0.29
M 4.67 0.026 0.015 0.26 0.23
B 3.57 0.013 0.19 0.095 0.32
9 2 km
S 5.26 0.022 0.42 0.27 0.31
M 4.6 0.024 0.017 0.16 0.26
B 3.68 0.012 0.53 0.18 0.27
R R
S 5.38 0.016 0.32 0.19 0.34
M 4.6 0.013 0.014 0.16 0.35
B 3.52 0.017 0.34 0.1 0.29
S-Surface, M-Middle, B- Bottom, R-Reference
Location: 2
Locatio
n
Distance from
Location
Dept
h
Dissolved
oxygen
Nutrients
Nitrite-
N
Nitrate-
N
Phosphate-
P
Silicate-
Si
mg/l mg/l mg/l mg/l mg/l
1 0.5 km
S 5.26 0.019 0.46 0.23 0.26
M 4.87 0.023 0.61 0.16 0.42
B 3.97 0.027 0.31 0.17 0.16
2 1 km
S 4.36 0.016 0.2 0.24 0.34
M 4.24 0.019 0.29 0.36 0.12
B 3.56 0.012 0.34 0.26 0.21
3 2 km
S 4.85 0.018 0.38 0.75 0.18
M 4.25 0.013 0.25 0.16 0.31
B 3.52 0.014 0.29 0.23 0.51
4 0.5 km
S 5.34 0.021 0.34 0.16 0.42
M 4.37 0.014 0.36 0.075 0.31
B 3.67 0.007 0.38 0.19 0.42
5 1 km
S 5.21 0.009 0.21 0.52 0.21
M 4.37 0.012 0.27 0.21 0.35
B 3.59 0.015 0.25 0.16 0.14
6 2 km S 4.92 0.017 0.29 0.19 0.26
M 4.25 0.019 0.23 0.089 0.49

Pre-drill EIA for the NELP block MB-OSN-2005/3 (5-Appraisal Wells) 2017
49
B 3.61 0.016 0.25 0.23 0.25
7 0.5 km
S 4.86 0.015 0.21 0.25 0.27
M 4.23 0.012 0.049 0.21 0.34
B 3.64 0.008 0.67 0.075 0.32
8 1 km
S 5.3 0.014 0.41 0.15 0.39
M 4.31 0.007 0.022 0.045 0.34
B 4.13 0.014 0.54 0.19 0.46
9 2 km
S 4.67 0.019 0.24 0.12 0.35
M 3.69 0.024 0.041 0.069 0.33
B 3.25 0.02 0.16 0.095 0.25
R R
S 4.38 0.013 0.38 0.19 0.28
M 4.67 0.16 0.037 0.18 0.39
B 3.67 0.015 0.43 0.16 0.51
S-Surface, M-Middle, B- Bottom, R-Reference
Table - 4.4 :: Petroleum Hydrocarbon (mg/L) in water samples
Location Depth 0.5 km 1 km 2 km 0.5 km 1 km 2 km 0.5 km 1 km 2 km R
1 2 3 4 5 6 7 8 9 10
Location-1
S ND ND ND ND ND ND ND ND ND ND
M ND ND ND ND ND ND ND ND 0.24 ND
B ND ND ND ND ND ND ND ND ND ND
Location-2
S ND ND ND ND ND ND ND ND ND ND
M ND ND 0.18 ND ND ND ND ND ND ND
B ND ND ND ND ND ND ND ND ND ND
Table - 4.5 :: Total Nitrogen (µg/g), Total Phosphorous (µg/g) and Organic carbon (%) in sediments
(Loc-1) Distance Total
Phosphorus
Total
Nitrogen
Total
Org.
Carbon
GD
Chayya
(Loc-2)
Distance Total
Phosphorus
Total
Nitrogen
Total
Org.
Carbon
( Km) µg/g µg/g % ( Km) µg/g µg/g %
1 0.5 27.2 66.4 4.7 1 0.5 20.7 57.8 2.6
2 1 36.1 52.1 2.6 2 1 9.4 67.5 2
3 2 21.3 78.3 3.2 3 2 18.9 86.9 3.4
4 0.5 30.6 88.4 3.6 4 0.5 8.6 43.7 2.1
5 1 40.2 73.5 2 5 1 23.2 76.1 4.2
6 2 19.7 51.8 1.9 6 2 15.8 51.4 3.7
R R 25.2 92.4 3.1 7 0.5 11.2 39.3 2.9
8 R 30.1 64.2 1.4

Pre-drill EIA for the NELP block MB-OSN-2005/3 (5-Appraisal Wells) 2017
50
R-Reference
Table - 4.6 :: Sediment Texture Analysis around Sampling Locations
Location1 Distance
(Km)
Silt Clay Location 2 Distance
( Km)
Silt Clay
% % % %
1 0.5 42 39 1 0.5 27 73
2 1 39 35 2 1 39 60
3 2 36 30 3 2 42 57
4 0.5 40 36 4 0.5 21 79
5 1 49 42 5 1 36 68
6 2 44 38 6 2 26 80
R R 36 30 7 0.5 29 71
8 R 31 62
R-Reference
Table - 4.7:: Petroleum Hydrocarbon (μg/g) in sediment samples
Location 0.5 km 1 km 2 km 0.5 km 01 km 02 km 0.5 km 01 km 02 km R
1 2 3 4 5 6 7 8 9 10
Loc-1 86.74 75.62 45.62 72.34 46.87 57.14 - - - 34.51
Loc-2 87.68 76.58 86.64 48.67 53.89 42.87 89.67 - - 46.52
HEAVY METAL CONCENTRATIONS:
Various heavy metals are present in small concentrations in the marine environment. Metal
pollution in the seas is invisible and insidious and does not attract enough attention as compared to oil
pollution, unless catastrophic events like the Minamata case of Japan occurs (which was due to
Mercury poisoning). In aquatic environments – metals can be termed as ‗conservative pollutants‘, which
once added to the environment are there forever and cannot be broken down to harmless substances
by bacterial action as many of the organic pollutants are. Most of them are however, perfectly natural
substances occurring in seawater, though often in extremely low concentrations. They are leached or
introduced into the aquatic systems as a result of the weathering of soils and rocks, from underwater
volcanic activities, and from a variety of manmade sources, which involve mining, processing or use of
metals or substances that contain metal contaminants. This is which changes the natural
concentrations of metals in seawater resulting in a ten or even a hundred fold increase near the source
of an effluent discharge. Although many metals are poisonous at quite low concentration, they are often
vital as trace elements. Hence, while manganese, copper, iron, zinc etc. are considered essential

Pre-drill EIA for the NELP block MB-OSN-2005/3 (5-Appraisal Wells) 2017
51
micronutrients, mercury, cadmium and lead are not required for any important biological function by any
organisms and are termed as non-essential elements.
Generally speaking, except at a few places, metal pollution in the sea is not and never was
at dangerous levels, but the potential threat it offers is sufficient to merit a careful watch, in terms of
monitoring programs. Metals once introduced in the seawater, either naturally or as contaminants
undergo various alternatives. Apart from dilution and dispersion there are biogeochemical processes
which remove metals from the seawater, or in other words reduce the concentrations of the added
metal in seawater. These are precipitation, adsorption by suspended matter and absorption by
organisms. It is the last process that includes removal by zooplankton ‗debris‘ and other organisms
which is of prime concern to man. This has led to much interest in determining the levels of heavy
metals in a wide variety of commercially important marine fishes more as a food hygiene study.
Because of these factors, monitoring the concentrations of heavy metal in water, sediments and fishes
is very important. The toxicity limits (LC50 values) of some heavy metals towards fish in the open sea
are given below:
Table - 4.8 :: Heavy metal and Toxicity Limit
Metal Toxicity Limit (µg/L)
Chromium >10000
Zinc >1000
Cadmium 6400 – 16400
Mercury 67
Lead >1000
Since the concentration of heavy metals in seawater is very low (usually in the parts per
billion levels), accurate determination of their concentration is a very delicate and cumbersome task.
The analytical methods using normal flame atomic absorption cannot detect the low concentrations of
heavy metals in seawater (in µg – ng ranges) and do not give reproducible results. Hence all the
seawater samples were analyzed using inductively coupled Plasma emission spectrophotometer (ICP-
OES) available at IPSHEM.
The heavy metal contents in sediments were analyzed after digestion with hydrofluoric acid
and perchloric acid, using same ICP- OES available at IPSHEM. These methods were standardized
and calibrations done using standard metal solutions and standard reference samples. The same
equipment was used for the determination of heavy metals.

Pre-drill EIA for the NELP block MB-OSN-2005/3 (5-Appraisal Wells) 2017
52
HEAVY METALS IN SEAWATER:
The range of concentration (in µg/L) of heavy metals viz. Zinc, Iron, Cadmium, Lead,
Barium, Manganese, Chromium and Mercury in the sea water sampled at surface, mid depth and
bottom of various sampling locations are given in Table 14. Ranges of some significant heavy metals
like Zinc, Iron, Manganese and Lead which are usually present in higher concentrations (in ppb) than
the other heavy metals, and which require close watch from pollution point of view, have been
tabulated.
Table - 4.9 : Heavy Metal Concentrations at Reference Locations
Heavy Metal Range of Concentration (µg/L) Heavy Metal Range of Concentration (µg/L)
Ba 1.5-2.2 Mn 0-12.6
Cd 0.2-0.5 Pb 1.25-3.22
Cr 1.6-2.5 Zn 2.7-8.3
Fe 0.23 % - 0.43% Hg 5.8-9.9
The distribution of heavy metals in water column did not reveal any clear pattern either
vertically or horizontally. The spatial distribution also did not yield any clear trend of either enrichment or
depletion.
For some of the heavy metals, the ranges of concentrations (µg/L) in the Indian Ocean have
been reported by various authors is given in Table:4.10.
Table - 4.10 :: Heavy metals concentration in the Indian Ocean
Authors Fe Mn Zn
Sen Gupta et.al. (1978) 7.2 – 66.9 - 0.5 – 42.4
Sanzgiri and Moraes (1979) 8.5 – 96 1.8 – 80 1.2 – 29.7
Braganca and Sanzgiri (1980) 6.2 – 131.5 1.8 – 40.8 2.4 - 20
Though the iron contents in seawater recorded in this study are relatively higher in
concentration comparable to the standard values as described above, the concentrations observed in
the reference locations around Bombay High are quite identical to the values recorded near the
installations. This is inferred that there is no enrichment in the heavy metal concentration due to oil field
activities in spite of the fact that the drilling mud discharges and the disposal of produced water are
sources of heavy metals around an oil field installation. Literature review gives an idea of concentration
of heavy metals in various oceans of the world, which is given in Table:4.11

Pre-drill EIA for the NELP block MB-OSN-2005/3 (5-Appraisal Wells) 2017
53
Table - 4.11 :: Concentration (µg/l) of heavy metals in oceans of the world
Metal Open
N.Atlantic
Continental
Coastal
Northern and
Central North sea
Western Atlantic Shelf
Cd 0.002– 0.007 0.04 – 0.068 0.014 – 0.026 0.022
Cu 0.064– 0.096 0.346– 0.666 0.15 – 0.30 0.252
Mn 0.033– 0.073 0.40 – 1.04 0.027 – 0.673 1.155
Another exhaustive study records following values for heavy metals (values in µg/L):
Table - 4.12:: Concentration (µg/l) of heavy metals in oceans of the world
Metal Open ocean Coastal, Bay and Estuary
Cd Pacific = 0.02 – 0.04
Norwegian sea = 0.02 – 0.025
North sea = 0.2 – 0.4
Cr Pacific = 0.06 – 1.26
Mediterranean = 0.07 – 0.97
North sea = 0.4
Cu Pacific = 0.3 – 2.8
North sea = 0.208
Norwegian sea = 0.08 – 0.1
North sea = 2.82 – 9.7
Fe Pacific = 140 – 320 Sea water = 3.2 – 3.4
Pb Pacific = 0.6 – 0.8 North sea = 1.8 – 7.44
Mn Open ocean = 0.018
Hg Atlantic = 0.021 – 0.078
Zn Pacific = 1.9 – 3.0 North sea = 7.0 – 22.0
Though, it is observed that values in open oceans are less than those found near the oil
installations, as per data available for the permissible limits of heavy metals in coastal marine water, as
given bellow, it can be safely concluded that the values observed near Bombay High and other fields
are very much below the toxicity limits for metals given in the literature.
Table - 4.13: Limits of Heavy metal concentrations
Heavy Metal Limit (ppb) Heavy Metal Limit (ppb)
As 200 Cu 3000
Hg 10 Zn 15000

Pre-drill EIA for the NELP block MB-OSN-2005/3 (5-Appraisal Wells) 2017
54
Pb 2000 Ni 5000
Cd 2000 Mn 2000
Cr 2000 Fe 3000
(Source: Kerala pollution control board: www.keralapcb.org/)
Table - 4.14:: Heavy metals in sea water
Location Distance Depth Barium Cadmium Chromium Iron Manganese Lead Zinc Mercury
Loc-1 from location
µg/L µg/L µg/L µg/L µg/L µg/L µg/L µg/L
1
0.5 km
S 2.058 0.261 2.437 48.96 2.408 0 1.961 2.908
M 1.582 0.182 2.346 34.79 1.534 0.37 4.341 7.749
B 1.742 0.273 2.657 35.81 1.498 0 5.369 4.929
2
0.5 km
S 1.51 0.247 2.246 31.83 2.685 0 5.515 4.844
M 2.214 374 2.521 36.49 2.383 0 3.558 19.93
B 1.154 0.265 1.48 23.48 1.847 1.626 3.54 10.12
3
0.5 km
S 1.246 29.24 1.666 27.55 2.014 1.189 10.8 41.65
M 1.2 0.222 1.586 45.9 2.928 1.529 4.31 10.09
B 1.25 0.306 1.637 25.47 2.019 0.902 3.709 7.597
4
1 km
S 1.709 0.307 2.989 32.95 1.771 0.081 4.142 16.67
M 1.608 0.288 2.367 48.6 1.676 0.371 13.18 12.86
B 1.727 0.321 2.497 62.52 2.292 1.074 4.285 5.66
5
1 km
S 1.297 9.208 1.608 21.81 2.734 1.389 4.728 8.942
M 1.35 0.351 1.765 36.75 4.461 2.072 9.043 8.806
B 1.229 0.642 1.65 21.46 2.437 1.826 7.336 7.42
6
1 km
S 1.152 0.277 1.773 24.54 4.095 1.773 2.677 5.171
M 1.397 0.294 1.71 19.59 6.541 2.503 7.441 11.52
B 1.384 0.399 1.788 33.62 9.47 3.305 3.476 8.123
7
2 km
S 2.614 0.395 2.872 57.97 8.334 1.67 12.41 11.89
M 2.113 0.463 2.422 36.85 7.693 1.613 8.028 7.906
B 1.41 0.307 2.527 38.86 12.31 3.014 3.789 10.66
8
2 km
S 1.592 0.243 2.725 34.67 10.31 1.221 4.821 13.15
M 1.86 0.288 2.348 39.05 8.979 1.327 7.861 8.639
B 1.315 0.26 1.668 42.54 2.226 1.972 4.996 7.81
9
2 KM
S 0.104 828 0.989 21.61 2.947 1.36 2.945 6.47
M 1.48 252.6 1.592 28.49 6.423 2.578 7.363 0
B 1.913 0.452 1.744 28.26 12.59 3.215 6.466 10.09
R S 1.533 0.399 2.132 33.11 11.33 2.974 8.142 9.931
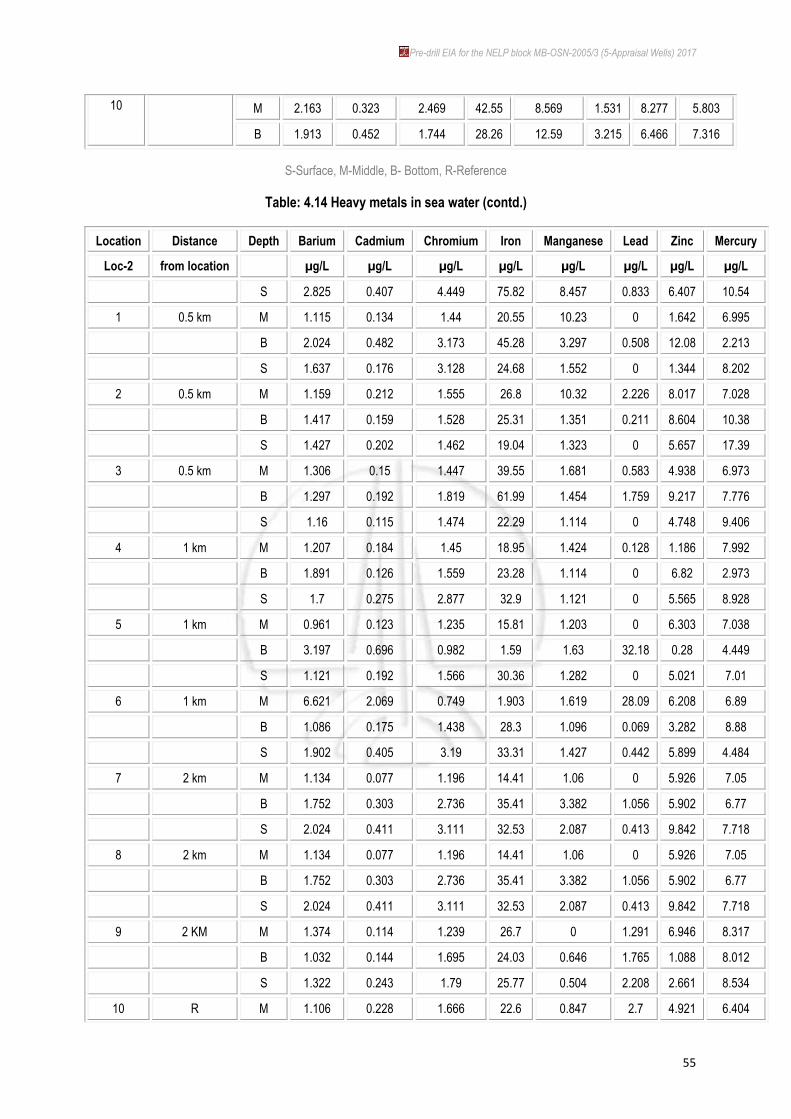
Pre-drill EIA for the NELP block MB-OSN-2005/3 (5-Appraisal Wells) 2017
55
10
M 2.163 0.323 2.469 42.55 8.569 1.531 8.277 5.803
B 1.913 0.452 1.744 28.26 12.59 3.215 6.466 7.316
S-Surface, M-Middle, B- Bottom, R-Reference
Table: 4.14 Heavy metals in sea water (contd.)
Location Distance Depth Barium Cadmium Chromium Iron Manganese Lead Zinc Mercury
Loc-2 from location
µg/L µg/L µg/L µg/L µg/L µg/L µg/L µg/L
S 2.825 0.407 4.449 75.82 8.457 0.833 6.407 10.54
1 0.5 km M 1.115 0.134 1.44 20.55 10.23 0 1.642 6.995
B 2.024 0.482 3.173 45.28 3.297 0.508 12.08 2.213
S 1.637 0.176 3.128 24.68 1.552 0 1.344 8.202
2 0.5 km M 1.159 0.212 1.555 26.8 10.32 2.226 8.017 7.028
B 1.417 0.159 1.528 25.31 1.351 0.211 8.604 10.38
S 1.427 0.202 1.462 19.04 1.323 0 5.657 17.39
3 0.5 km M 1.306 0.15 1.447 39.55 1.681 0.583 4.938 6.973
B 1.297 0.192 1.819 61.99 1.454 1.759 9.217 7.776
S 1.16 0.115 1.474 22.29 1.114 0 4.748 9.406
4 1 km M 1.207 0.184 1.45 18.95 1.424 0.128 1.186 7.992
B 1.891 0.126 1.559 23.28 1.114 0 6.82 2.973
S 1.7 0.275 2.877 32.9 1.121 0 5.565 8.928
5 1 km M 0.961 0.123 1.235 15.81 1.203 0 6.303 7.038
B 3.197 0.696 0.982 1.59 1.63 32.18 0.28 4.449
S 1.121 0.192 1.566 30.36 1.282 0 5.021 7.01
6 1 km M 6.621 2.069 0.749 1.903 1.619 28.09 6.208 6.89
B 1.086 0.175 1.438 28.3 1.096 0.069 3.282 8.88
S 1.902 0.405 3.19 33.31 1.427 0.442 5.899 4.484
7 2 km M 1.134 0.077 1.196 14.41 1.06 0 5.926 7.05
B 1.752 0.303 2.736 35.41 3.382 1.056 5.902 6.77
S 2.024 0.411 3.111 32.53 2.087 0.413 9.842 7.718
8 2 km M 1.134 0.077 1.196 14.41 1.06 0 5.926 7.05
B 1.752 0.303 2.736 35.41 3.382 1.056 5.902 6.77
S 2.024 0.411 3.111 32.53 2.087 0.413 9.842 7.718
9 2 KM M 1.374 0.114 1.239 26.7 0 1.291 6.946 8.317
B 1.032 0.144 1.695 24.03 0.646 1.765 1.088 8.012
S 1.322 0.243 1.79 25.77 0.504 2.208 2.661 8.534
10 R M 1.106 0.228 1.666 22.6 0.847 2.7 4.921 6.404

Pre-drill EIA for the NELP block MB-OSN-2005/3 (5-Appraisal Wells) 2017
56
B 1.272 0.186 1.558 28.35 0 1.249 7.754 8.858
S-Surface, M-Middle, B- Bottom, R-Reference
HEAVY METALS IN SEDIMENTS
Heavy metal concentrations in sediments sampled around the installations in Bombay High
South are given in Table 15. Concentrations of Zinc, Copper, Cobalt, Lead, Chromium, Nickel and
Barium are given in units of µg/g (ppm) while that of iron in percentage of dry weight.
Table: 4.15 Heavy metals in sea sediments
Station Barium Cobalt Chromium Copper Iron Nickel Lead Zinc
Loc-1 µg/g µg/g µg/g µg/g %(w/w) µg/g µg/g µg/g
1 0.117 0.008 0.093 0.035 46.9 0.022 0.015 0.027
2 0.111 0.008 0.096 0.039 49.2 0.022 0.017 0.022
4 0.113 0.008 0.092 0.032 46.79 0.021 0.016 0.02
5 0.135 0.009 0.093 0.045 46.1 0.027 0.026 0.026
7 0.105 0.007 0.076 0.03 43.07 0.018 0.022 0.012
8 0.127 0.007 0.075 0.028 40.48 0.021 0.014 0.01
10 0.08 0.006 0.064 0.031 36.04 0.016 0.018 0.01
Table: 4.15 Heavy metals in sea sediments (contd.)
Station Barium Cobalt Chromium Copper Iron Nickel Lead Zinc
Loc-2 µg/g µg/g µg/g µg/g %(w/w) µg/g µg/g µg/g
1 0.108 0.009 0.078 0.022 40.4 0.037 0.013 0.045
2 0.085 0.013 0.076 0.017 38.31 0.054 0.068 0.023
3 0.078 0.018 0.085 0.014 43.79 0.067 0.052 0.016
4 0.074 0.016 0.087 0.013 44.02 0.02 0.036 0.02
5 0.161 0.025 0.149 0.039 82.66 0.067 0.059 0.041
7 0.102 0.012 0.087 0.017 47.02 0.068 0.136 0.033
8 0.097 0.003 0.0991 0.018 46.93 0.054 0.086 0.034
10 0.207 0.032 0.108 0.034 49.13 0.075 0.047 0.045

Pre-drill EIA for the NELP block MB-OSN-2005/3 (5-Appraisal Wells) 2017
57
4.9 BIOLOGICAL MONITORING OF OFFSHORE LOCATIONS
4.9.1 METHODOLOGY OF BIOLOGICAL ANALYSIS
4.9.1.1 COLLECTION AND ANALYSIS OF CHLOROPHYLL-A
For chlorophyll-a (Chl-a), water samples were collected from surface and bottom according
to the standard protocols. One litre of water from each depth was filtered through GF/F filters (pore size
0.7 µm), and extracted with 10 ml of 90% acetone under cold dark conditions after an extraction period
of 18 to 20 hours. The extract (µg.l-1) was determined using fluorometer. Column Chl-a (mg m-2) was
calculated by integrating the depth values.
4.9.1.2 COLLECTION AND ANALYSIS OF PHYTOPLANKTON:
Single celled plant communities floating in the surface water are collectively termed as
phytoplankton. The communities mainly comprise of diatoms and dinoflagellates. They form the first link
in the oceanic food chain. This food web is the most complex as it constitutes of 5 or more links. Almost
entire marine life directly or indirectly depends on the microscopic algae, found at the surface. Due to
the availability of food source, most of the animals either live in this region or migrate towards the
surface in search of food. As such, the top layer of the ocean is considered as most diverse and highly
productive. Diatoms are estimated to contribute up to 45% of the total oceanic primary production
(Mann, 1999). Diatoms and dinoflagellates serve as food for the zooplanktons like molluscs, tunicates
and also for small fishes. One of the significant roles of phytoplankton is in the ocean‘s carbon cycle.
Feeding of the zooplanktons on these producers marks the entry of photosynthetically fixed carbon into
the food web. This carbon gets accumulated as biomass or detritus or provides energy. Organic matter
being denser than sea water tends to sink, leading to the transport of carbon from surface to the bottom
(called biological pumping) which subsequently acts as food source for bottom living organisms.
Dinoflagellates when present in large number give rise to ―red tide‖ (as the colour of the
water is changed). At such times they are known to produce neurotoxins. These toxins are fatal to
fishes and also to the humans consuming such fishes. They can flourish well in phosphate rich
conditions (as a result of anthropogenic activity), as well as in increasing temperatures due to global
warming. Hence, they are also considered as environmental indicator. Samples were collected 1m
below the surface and 2-3 m above the seabed using Niskin sampler. All the samples were fixed by
adding Lugol‘s iodine and 5% formalin solution. In laboratory, the phytoplankton samples were
concentrated to 25ml using a siphoning tube. The tube consists of a 10 µm Nytex filter at one end. This

Pre-drill EIA for the NELP block MB-OSN-2005/3 (5-Appraisal Wells) 2017
58
concentrated sample was then taken in 3 aliquots of 1ml each, on Sedgwick-Rafter Counting Chamber
for taxonomic identification and quantification of the phytoplankton (cells per liter). Olympus BX 41
inverted binocular microscope was used for identification and counting.
The total number of phytoplankton cells present in a litre of water sample calculated using the formula:
N= n x v x 1000 / V
Where,
N: total number of phytoplankton cells per liter of water filtered. n: average number of phytoplankton cells in 1 ml of plankton sample. v: volume of plankton concentrate (ml) V: volume of total water filtered (l).
Water samples for estimation of chlorophyll were collected from surface and bottom using
Niskin‘s sampler. A known quantity of water sample (1 L) was filtered through GF/F Whatman filter
paper. Chlorophyll was extracted using 10ml of 90% acetone in cold condition after a period of 18 – 20
hours. The acetone extract was read on fluorometer.
The data for the phytoplankton was analyzed using MS-Excel package and Primer. Primer
was mainly used for analyzing diversity. Attempts have been made to estimate the natural variability of
phytoplankton especially that of diatoms and dinoflagellates, in the surface and bottom water.
4.9.1.3 ZOOPLANKTON COLLECTION AND ANALYSIS
Zooplankton samples were collected with a modified Heron-Tranter (HT) net; having 0.25m2
mouth areas and 330m mesh size. A calibrated TSK flow meter was fitted at the net mouth to
measure the volume of water filtered. The stratified horizontal vertical haul of 5 minutes in the upper 10-
15 m water depth was sampled. All the samples were preserved in 5% neutralized formaldehyde
solution. The zooplankton biomass was later estimated by displacement volume method and readings
were converted for 100m3. Different zooplankton taxa were sorted from an aliquot of the sample,
identified and enumerated under stereoscopic zoom binocular microscope. The numbers were
calculated for the whole samples and given for 100m3 of water.
SEDIMENT SAMPLING FOR BENTHIC COMMUNITIES - ESTIMATION OF SEDIMENT
CHLOROPHYLL-A AND ORGANIC CARBON
Bottom dwelling organisms or benthos were collected, at each locations, by lowering a van
Veen grab. Sub-sampling for meiofauna was done using Plexiglas core of 4.5 cm diameter. The

Pre-drill EIA for the NELP block MB-OSN-2005/3 (5-Appraisal Wells) 2017
59
standard height of corer that is used for sampling is 5 cm. All the sub-samples were preserved in 5%
buffered Rose bengal formalin solution.
Meiobenthos: The meiofauna in the sediment were separated using a 63-micron sieve and placed in plastic
bottles for detailed identification. The meiofauna taxa were picked using a sorting needle and temporary glycerol
mounts were made on glass slides. All specimens were identified up to group level following identification key of
Higgins and Thiel (1988), under a stereo zoom binocular microscope.
Macrobenthos: The sediment samples were collected by van Veen grab (area: 0.11 m-2; Plate 1). Metallic
quadrant of 151510 cm was used for macrofaunal sub sampling from grab sample and preserved in 5%
buffered formalin rose Bengal solution. Aminimum of 2-5 replicates were taken from each location.
All the macrofauna samples were sieved on-board after 48hrs of collection using 500µ size
mesh sieve in filtered seawater and material retained on sieve mesh were fixed in 5% formalin Rose
Bengal. In the laboratory, all the fauna was sorted, identified upto the lower possible level under the
microscope. Biomass (wet weight) was measured by blotting the sample on a blotting paper and weight
was taken by direct weighing on balance. The biomass was calculated in g m-2.
4.9.1.4 FISH & FISHERY:
Experimental fishing was done along three transects, in the depth zone of 30 - 50 meters.
Fish and shellfish samples were obtained with modified beam trawl, specially designed for deep-water
trawling.
Finfish and shellfish samples were brought in iceboxes to the field laboratory and kept
frozen for further study. Species-wise sorting was done following FAO species identification sheets for
fisheries purposes, western Indian Ocean (Fisher and Bianchi, 1984). Each sorted sample then
counted, weighed and preserved in 70% alcohol for further analysis. Fishes were identified up to
species level Species occurrence (total number of species); abundance (number of fishes and catch
rate per hour) was calculated.
4.9.2 RESULTS AND DISCUSSION
Location-1 Coordinates: 19006‘05‖ E 70056‘26‖
Date of sampling: 26th October 2013
Time of sampling: 6:00 - 12:00

Pre-drill EIA for the NELP block MB-OSN-2005/3 (5-Appraisal Wells) 2017
60
Sampling locations 1 2 3 4 5 6 7 8 9 R
Depth in meter 84.6 83.8 84.2 84.7 84.1 84.8 83.5 84.4 84.7 84.2
Secchi disc depth in meter Not measured as sea was rough
Sampling
Location
Coordinates Sampling
Location
Coordinates
Latitude Longitude Latitude Longitude
RA-1 19007‘26‖ 70056‘24‖ RA-6 18032‘12‖ 72015‘21‖
RA-2 19006‘53‖ 70056‘39‖ RA-7 18031‘43‖ 72016‘30‖
RA-3 19006‘32‖ 70056‘37‖ RA-8 - -
RA-4 19005‘39‖ 72014‘44‖ RA-9 18032‘12‖ 72015‘50‖
RA-5 18032‘01‖ 72015‘09‖ RA-10 18037‘16‖ 72016‘50‖
BIOLOGICAL PARAMETERS SEA WATER COLUMN AROUND LOCATION -1
Chlorophyll-a
In the sub surface water chlorophyll-a was varying from 1.98-2.83-mg/M3 and in the above
bottom water, chlorophyll –a concentration was varying as 0.55-0.98 mg/m3.
PHYTOPLANKTON POPULATION
For evaluation of Phytoplankton population in the surroundings of the Location-1, Sampling
was conducted from 10 sampling locations within 2km radius from the station. The phytoplankton
community of the sub surface water and above bottom water near the station was represented by two
species Blue green Algae, (Richelia intracellularis and Trichodesmium sp.),9 species of Diatoms ;10
species of Dinoflagellates and one member of green algae (Pterosperma sp). Phytoplankton of the
sampling locations at sub surface layer was varying from 166- 210 units/ L with an average of185.2
units/L (SD 16.41).
Phytoplankton from the above bottom samples are very high compare to the other
installations sampled. Phytoplankton population from the various locations around station was varying
from 54-84 units /L. with an average of 67.6 units/L (SD. 12.06).

Pre-drill EIA for the NELP block MB-OSN-2005/3 (5-Appraisal Wells) 2017
61
ZOOPLANKTON POPULATION:
Zooplankton sample collected from the sub surface layer in different sampling locations.
Zooplankton population near the location -1 was represented by 8 groups of plankton; Tintinids,
Polychaete worms, Molluscan larvae, Cindaria( Medusa and Polyp). Molluscans, Urochordata
copepods and Arrow worms. Among these holoplankton of this region Protozoans Tintinids was
dominant group followed by Copepods and Urochordata members. The zooplankton density was
varying from 78-130 N/L at an average of 108.8 (S.D-15.78) among these sampling locations. The
biomass of zooplankton by displacement volume was varying from 0.14ml/m3- 0.14 ml/m3.
BENTHIC COMMUNITIES
Chlorophyll content in the sediment:
Chlorophyll content in the sediment extracted in acetone was below detectable limits.
Benthic organisms
The Mieo benthic organism collected along with sediments by using the Vanveen grabs
were represented by 2 groups of meio fauna , Nematode worms, Polychate worms.The total number of
meio benthic organisms were varying from 0 -0.14/ 10 cm2.The macro benthic organisms were
represented by the same four groups the abundance was varying from11-55 no/M2.

Pre-drill EIA for the NELP block MB-OSN-2005/3 (5-Appraisal Wells) 2017
62
Table: 4.16 (a) :: Phytoplankton variation in abundance and Diversity of marine phytoplankton in sub surface water between the sampling locations near Location1
Sampling
Location
Surface water Above Bottom water
Abundance
In units/L
No of Species observed
/total species % of diversity
Abundance
In units/
No of Species observed
/total species % of diversity
1 166 20/23 86.95 76 13/23 56.52
2 190 22/23 95.65 78 14/23 60.86
3 210 21/23 91.30 78 16/23 69.56
4 198 19/23 82.60 84 13/23 56.52
5 164 19/23 82.60 72 12/23 52.17
6 200 21/23 91.30 56 13/23 56.52
7 170 21/23 91.30 62 12/23 52.17
8 200 19/23 82.60 68 12/23 52.17
9 178 20/23 86.95 48 12/23 52.17
R 176 20/23 86.95 54 13/23 56.52
Table: 4.16(b) Abundance of phytoplankton near Location 1
Installation Surface No of Sampling location Group of phytoplankton Range
Units/L
Mean
units/L SD
Location-1
Sub surface
10
Blue green algae 50-84 63.6 13.12
Green algae 2-12 5.8 3.58
Diatoms 40-80 64.6 12.03
Dinoflagellates 34-62 51.2 9.43
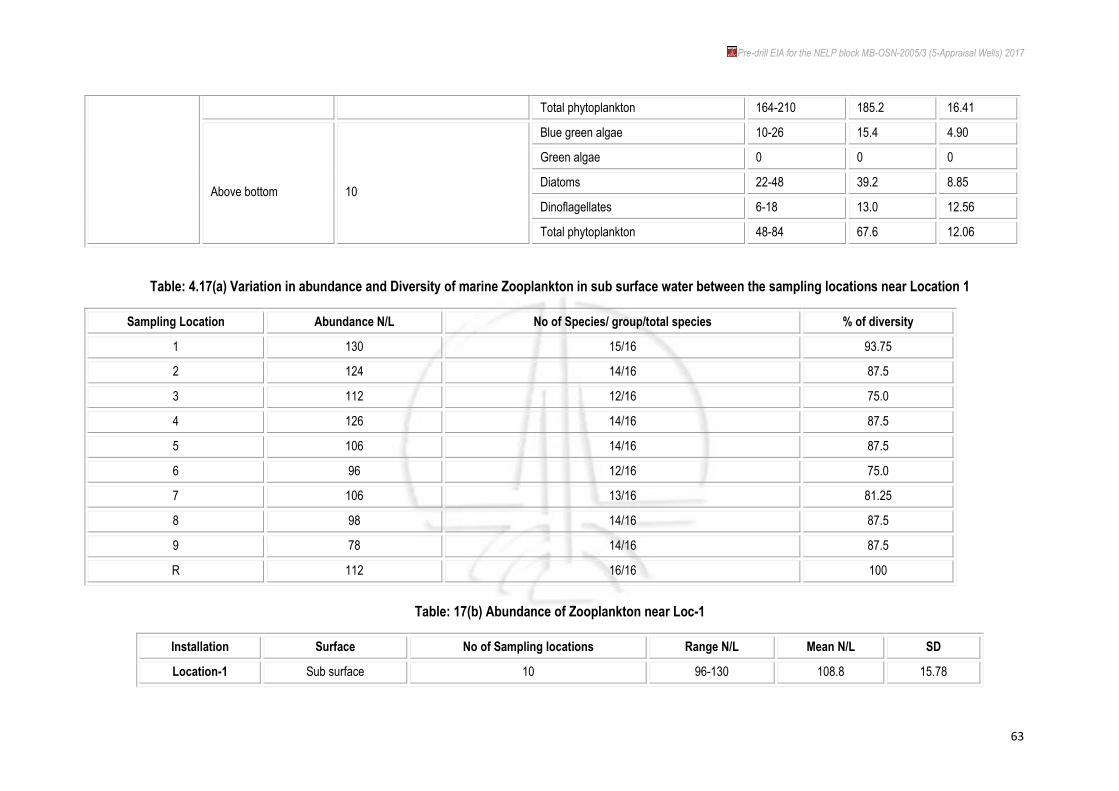
Pre-drill EIA for the NELP block MB-OSN-2005/3 (5-Appraisal Wells) 2017
63
Total phytoplankton 164-210 185.2 16.41
Above bottom
10
Blue green algae 10-26 15.4 4.90
Green algae 0 0 0
Diatoms 22-48 39.2 8.85
Dinoflagellates 6-18 13.0 12.56
Total phytoplankton 48-84 67.6 12.06
Table: 4.17(a) Variation in abundance and Diversity of marine Zooplankton in sub surface water between the sampling locations near Location 1
Sampling Location Abundance N/L No of Species/ group/total species % of diversity
1 130 15/16 93.75
2 124 14/16 87.5
3 112 12/16 75.0
4 126 14/16 87.5
5 106 14/16 87.5
6 96 12/16 75.0
7 106 13/16 81.25
8 98 14/16 87.5
9 78 14/16 87.5
R 112 16/16 100
Table: 17(b) Abundance of Zooplankton near Loc-1
Installation Surface No of Sampling locations Range N/L Mean N/L SD
Location-1 Sub surface 10 96-130 108.8 15.78

Pre-drill EIA for the NELP block MB-OSN-2005/3 (5-Appraisal Wells) 2017
64
Table.4.18: Systematic Account of Phytoplankton in the sea near Location1
GROUP PHYLUM CLASS ORDER FAMILY GENUS/SPECIES #
BLUE GREEN ALGAE
(Desikachary, 1959)
CYANOPHYTA
CYANOPHYCEAEA
NOSTOCALES
NOSTOCACEAE Sub Family Anabanae
Richelia intracellularis
B1
OSCILLATORIACEAE Trichodesmium sp B2
Oscillatoria sp. B3
DIATOMS (Hendey,1937)
BACILLARIOPHYTA CHRYSOPHYTA
BACILLARIOPHYCEAE
ORDER BACILLARIALES Sub Order COSCINODISCACEAE
COSCINODISCACEAE
Coscinodiscus sp. D1
SUB ORDER BIDDULPHINEAE
BIDDULPHIACEAE Eucambia sp. D2
Biddulphia sp. D3
CHATOCERACEAE Chaetoceros costatus D4
SUB ORDER: RHIZOSOLENIINEAE RHIZOSOLENIACEAE Rhizosolenia sp. D5
SUB –ORDER FRAGILARINEAE FRAGILARIACEAE Synreda sp. D6
SUB ORDER NAVICULINEAE
NAVICULACEAE Navicula sp. D7
BACILLARIACEAE Nitzschia sp. D7
DINO FLAGELLATES
PYRROPHYTA
DESMOPHYCEAE
GONYAULACALES
CERATIACEAE
Ceratium breve F1
Ceratium furca F2
Ceratium fusus F3
Ceratium triops F4
CLADOPYXIDACEAE Cladopyxis F5
GONIODOMATACEAE Alexandrium sp. F6
PYROCYSTACEAE Pyrocystis sp. F7
PERIDINIALES PROTOPERIDINIACEAE Protoperidinium sp. F8
NOCTILUCALES NOCTILUCACEAE Naoutiluca F9
GYMNODINIALIS POLYKRIKACEAE Polkrikos sp. F10
GREEN ALGAE CHLOROPHYTA PARSINOPHYCEAE CHLORODENTRALES HALOSPHAERACEAE Pterosperma sp. G1

Pre-drill EIA for the NELP block MB-OSN-2005/3 (5-Appraisal Wells) 2017
65
Table: 4.19.Quantitative evaluation of marine phytoplankton in sub surface water near Location-1 GENUS/SPECIES Abundance in units/cells / l of marine water from different sampling locations Rep. by group and individual genus/species
1 2 3 4 5 6 7 8 9 R TOTAL AVG %of Group % Total SD
B BLUE GREEN ALGAE
B1 Richelia intracellularis 32 52 60 64 38 58 46 60 44 48 502 50.2 78.93 27.10 10.47
B2 Trichodesmium sp 4 8 6 10 4 8 6 10 6 8 70 7.0 11.00 3.77 2.16
B3 Oscillatoria sp 6 4 12 10 8 2 4 6 10 2 64 6.4 10.06 3.45 3.50
Total Blue green algae units/l 42 64 78 84 50 68 56 76 60 58 636 63.6 34.34 13.12
I DIATOMS
D1 Coscinodiscus sp. 10 8 2 4 0 4 8 6 2 4 48 4.8 7.43 2.59 3.15
D2 Eucambia sp. 12 4 8 0 2 6 2 8 4 10 56 5.6 8.66 3.02 3.86
D3 Biddulphia sp. 12 10 16 10 8 10 14 12 10 8 110 11.0 17.02 5.94 2.54
D4 Chaetoceros costatus 4 8 12 6 10 14 4 8 12 10 88 8.8 13.62 4.75 3.42
D5 Chaetoceros sp. 6 4 2 2 6 8 10 2 4 2 46 4.6 7.12 2.48 2.84
D6 Rhizosolenia sp. 16 18 12 10 14 8 12 10 12 8 120 12.0 18.57 6.48 3.26
D7 Synreda sp. 12 8 10 4 8 6 12 10 6 2 78 7.8 12.07 4.21 3.32
D8 Navicula sp. 6 4 2 0 0 4 2 8 10 12 48 4.8 7.43 2.59 4.13
D9 Nitzschia sp. 2 4 8 4 2 8 10 8 2 4 52 5.2 8.04 2.80 3.01
Total Datoms units/L 80 68 72 40 50 68 74 72 62 60 646 64.6 34.88 12.03
II DINO FLAGELLATES
F1 Ceratium breve 8 12 10 10 6 8 4 10 12 16 96 9.6 18.75 5.18 3.37
F2 Ceratium furca 4 8 10 12 6 10 2 6 8 4 70 7.0 13.67 3.78 3.16
F3 Ceratium fusus 0 4 0 6 0 10 2 0 4 0 26 2.6 5.08 1.40 3.40
F4 Ceratium triops 8 4 10 6 10 12 8 12 10 12 92 9.2 17.96 4.97 2.69
F5 Cladopyxis 0 4 2 4 0 6 0 0 0 6 22 2.2 4.29 1.18 2.57
F6 Alexandrium sp. 6 2 0 0 10 6 12 8 6 10 60 6.0 11.71 3.24 4.21
F7 Pyrocystis sp. 0 6 8 10 12 8 2 4 4 2 56 5.6 10.93 3.02 3.86
F8 Protoperidinium sp. 4 8 10 6 8 2 4 8 4 2 56 5.6 10.93 3.02 2.79
F9 Naoutiluca 2 0 4 0 2 0 0 0 0 0 8 0.8 1.56 1.56 1.39
F10 Polkrikos sp. 2 6 4 8 2 0 4 0 0 0 26 2.6 5.08 1.40 2.83
Total Dinoflagellates units/L 34 54 58 62 56 62 38 48 48 52 512 51.2 27.65 9.43
G GREEN ALGAE
G1 Pterosperma sp. 10 4 2 12 8 2 2 4 8 6 58 5.8 100 3.13 3.58
Total Green Algae Units/L 10 4 2 12 8 2 2 4 8 6 58 5.8 3.13 3.58
Total phytoplankton units/l 166 190 210 198 164 200 170 200 178 176 185.2 185.2 16.41
Chlorophyll –a Content mg/m3 2.61 2.55 1.98 2.22 2.44 2.17 2.83 2.24 1.98 2.12 0.28

Pre-drill EIA for the NELP block MB-OSN-2005/3 (5-Appraisal Wells) 2017
66
Table: 4.20. Quantitative evaluation of marine phytoplankton in above bottom water near Location-1
GENUS/SPECIES Abundance in units/cells / l of marine water from different sampling locations Representation by group and individual genus/species
1 2 3 4 5 6 7 8 9 R TOTAL AVG %of Group % Total SD
B BLUE GREEN ALGAE
B1 Richelia intracellularis 12 8 10 16 6 4 6 8 12 10 92 9.2 59.74 13.6 3.55
B2 Trichodesmium sp 6 4 8 10 12 6 4 4 4 4 62 6.2 40.26 9.17 2.89
B3 Oscillatoria sp 0 0 0 0 0 0 0 0 0 0 0 0 0 0 0
Total Blue green algae units/l 18 12 18 26 18 10 10 12 16 14 154 15.4 22.78 4.9
I DIATOMS
D1 Coscinodiscus sp. 6 6 4 2 10 8 4 6 4 8 58 5.8 14.79 8.58 2.39
D2 Eucambia sp. 4 6 2 8 4 2 6 10 6 4 52 5.2 13.26 7.69 2.52
D3 Biddulphia sp. 10 8 12 16 8 12 10 8 4 2 90 9 22.96 13.31 4.02
D4 Chaetoceros costatus 6 4 2 2 0 4 2 0 0 2 22 2.2 5.61 3.25 1.98
D5 Rhizosolenia sp. 10 8 8 12 6 4 8 8 4 10 78 7.8 19.89 11.54 2.57
D6 Synreda sp. 0 0 0 0 2 0 0 0 0 0 2 0.2 0.51 0.29 0.63
D7 Navicula sp. 2 4 2 0 4 2 0 4 2 0 20 2 5.1 2.95 1.63
D8 Nitzschia sp. 10 12 8 6 14 4 4 6 2 4 70 7 17.85 10.35 3.91
Total Datoms units/L 48 48 38 46 48 36 34 42 22 30 392 39.2 8.85
II DINO FLAGELLATES
F1 Ceratium breve 0 0 2 0 0 0 4 2 2 2 12 1.2 9.23 1.77 1.39
F2 Ceratium furca 0 2 2 4 0 0 0 0 0 0 8 0.8 6.15 1.18 1.39
F3 Ceratium fusus 0 0 0 0 0 0 0 0 0 0 0 0 0 0 0
F4 Ceratium triops 4 6 6 4 2 6 8 10 4 2 52 5.2 40 7.69 2.53
F5 Cladopyxis 0 0 4 0 0 0 0 0 0 0 4 0.4 3.08 0.59 1.26
F6 Alexandrium sp. 0 0 0 0 0 0 0 0 0 0 0 0 0 0 0
F7 Pyrocystis sp. 2 4 4 2 0 2 0 0 2 4 20 2 15.38 2.96 1.63
F8 Protoperidinium sp. 4 6 4 2 4 2 6 2 2 2 34 3.4 26.15 5.02 1.64
F9 Naoutiluca 0 0 0 0 0 0 0 0 0 0 0 0 0 0 0
F10 Polkrikos sp. 0 0 0 0 0 0 0 0 0 0 0 0 0 0 0
Total Dinoflagellates units/L 10 18 22 12 6 10 18 14 10 10 130 13 100 69.08 12.56
G GREEN ALGAE
G1 Pterosperma sp. 0 0 0 0 0 0 0 0 0 0 0 0 0 0 0
Total Green Algae Units/L 0 0 0 0 0 0 0 0 0 0 0 0 0 0
TOTAL PHYTOPLANKTON UNITS/L 76 78 78 84 72 56 62 68 48 54 676 67.6 - 12.06
CHLOROPHYLL –a Content mg/m3 0.98 0.78 0.67 0.55 0.66 0.9 0.9 0.8 0.64 0.6 0.14

Pre-drill EIA for the NELP block MB-OSN-2005/3 (5-Appraisal Wells) 2017
67
Table: 4.21. Systematic account of marine zooplankton in the subsurface water near –Location1
GROUP PHYLUM CLASS ORDER FAMILY GENUS/SPECIES #
TINTINIDS PROTOZOA
CILIOPHORA
SPIROTRICHEA TINTINNIDA TINTINNIDAE Eutintinnus sp. T1
Amphorides sp..
XYSTONELLIDAE Favella SP.
POLYCHAETE WORMS
ANNELIDA POLYCHAETA PHYLLODOCIDA LOPADORHYNCHIDAE Lopadorhynchus sp.
P1
MOLLUSCANS MOLLUSCA GASTROPODA MESOGASTROPODA ATLANTIDAE Atlanta sp. MO1
COPEPODS
ARTHROPODA
CRUSTACEA
SUB CLASS COPEPODA
CALANOIDA CALANIDAE Canthocalanus sp. C1
ACARTIIDAE Acartia sp. C2
CENTROPAGIDAE Centropages sp. C3
CYCLOPOIDA ONCAEIDAE Oncaea sp. C4
HARPACTICOIDA ECTINOSOMATIDAE Microsetella sp. C5
POLYP CNIDARAIA HYDROZOA
HYDROIDA
THECATA CAMPANULARIIDAE Clytia sp. P1
HYDROIDOMEDUSAE CNIDARAIA HYDROZOA
Proboscoida Campanulariidae Obelia sp. M1
UROCHORDATA CHORDATA
SUB PHYLUM UROCHORDATA
APPENDICULARIA OIKOPLEURIDAE Oikopleura sp. U1
FRITILLARIIDAE Fritillaria sp. U2
ARROW WORMS CHAETOGNATHA SAGITTOIDEA APHRAGMOPHORA SAGITTIDAE Sagitta sp. A1
NUPLIUS LARVAE ARTHROPODA
SUB PHYLM CRUSTACEA
COPEPODA - - Nauplius larvae L1

Pre-drill EIA for the NELP block MB-OSN-2005/3 (5-Appraisal Wells) 2017
68
Table.4.22: Quantitative evaluation of marine zooplankton in sub-surface water near Location1
GENUS/SPECIES Abundance in n/l marine water from different sampling locations Representation by group and individual genus/species
1 2 3 4 5 6 7 8 9 R TOTAL AVG % of Group % of Total SD
T TINTINIDS
T1 Eutintinnus sp. 22 14 16 30 14 18 20 24 12 16 186 18.6 51.38 17.09 5.50
T2 Amphorides sp.. 12 10 8 12 18 6 10 12 8 10 106 10.6 29.28 9.74 3.27
T3 Favella SP. 4 8 10 6 12 4 2 8 10 6 70 7.0 19.34 6.43 3.16
Total Tininids N/L 38 32 34 48 44 28 32 44 30 32 362 36.2 33.27 6.89
P POLYCHAETE WORMS
P1 Lopadorhynchus sp. 2 4 4 2 2 6 2 2 4 4 32 3.2 100 2.94 1.39
Polychaete worms N/L 2 4 4 2 2 6 2 2 4 4 32 3.2 2.94 1.39
MO MOLLUSCANS
MO1 Atlanta Sp. 4 0 0 2 0 0 0 2 0 6 14 1.4 100 1.29 2.11
Molluscans total N/L 4 0 0 2 0 0 0 2 0 6 14 1.4 1.29 2.11
C COPEPODS
C1 Canthocalanus sp. 8 2 6 4 2 4 6 2 4 2 40 4.0 12.19 3.67 2.10
C2 Acartia sp. 10 14 8 18 6 12 10 4 6 8 96 9.6 29.27 8.82 4.19
C3 Centropages sp. 4 2 4 2 2 2 8 2 4 6 36 3.6 10.98 3.30 2.06
C4 Oncaea sp. 12 16 10 8 12 6 12 10 4 8 98 9.8 29.88 9.00 3.45
C5 Microsetella sp. 6 8 12 4 10 4 6 2 2 4 58 5.8 17.68 5.33 3.32
Total copepods N/L 40 42 40 36 32 28 42 20 20 28 328 32.8 30.14 8.54
MY CNIDARAIA
MY1 Clytia sp. 4 2 2 4 2 2 6 2 2 2 28 2.8 77.77 2.57 1.39
MY2 Obelia sp. 0 0 0 2 0 0 0 0 2 4 8 0.8 22.22 0.74 1.39
Total cindarians N/L 4 2 2 6 2 2 6 2 4 6 36 3.6 3.30 1.69
UROCHORDATA
U1 Oikopleura sp. 10 8 6 4 2 4 8 4 6 2 54 5.4 72.97 4.96 2.67
U2 Fritillaria sp. 4 2 0 0 4 4 0 2 2 2 20 2.0 27.03 1.84 1.63
Total Urochordata N/L 14 10 6 4 6 8 8 6 8 4 74 7.4 6.80 2.98
A ARROW WORMS CHA ETOGNATHA
A1 Sagitta sp. 2 4 0 0 2 4 2 0 0 2 16 1.6 100 1.47 1.57
ARROW WORMS TOTAL NO/L 2 4 0 0 2 4 2 0 0 2 16 1.6 1.47 1.57
L NUPLIUS LARVAE
L1 Nauplius larvae of Copepods 26 30 26 28 18 20 14 22 12 30 226 22.6 100 20.77 6.46
LARVAE TOTAL N/L 26 30 26 28 18 20 14 22 12 30 226 22.6 20.77 6.46
ZOOPLANKTON TOTAL N/L 130 124 112 126 106 96 106 98 78 112 1088 108.8 15.78
BIOMASS DISPLACMENT VOLUMEml / m3 0.14 0.12 0.12 0.12 0.12 0.10 0.12 0.14 0.12 0.12 0.011

Pre-drill EIA for the NELP block MB-OSN-2005/3 (5-Appraisal Wells) 2017
69
Table.4.23 Quantitative evaluation of macro fauna near the near Location-1
TAXA
ABUNDANCE IN N/M2 DIFFERENT SAMPLING LOCATIONS REPRESENTATION BY GROUP
1 2 3 4 5 6 7 8 9 R TOTAL MEAN % OF
COMPOSITION SD
POLYCHATES 11 22 11 0 0 11 22 0 11 11 99 9.9 32.24 8.12
NEMATODES 11 11 22 11 0 0 22 11 11 32 131 13.1 42.67 9.89
CRUSTACEANS 0 0 22 0 11 22 0 22 0 0 77 7.7 25.08 10.43
TOTAL NUMBERS
N/ m2 22 33 55 11 11 33 44 33 22 44 307 30.7 14.48
BIOMASS gm/m2
4.17 4.46 8.75 0.75 2.73 6.08 7.1 3.41 4.19 5.26 2.26
Table 4.24 Macro fauna taxon diversity near Loc-1
LOCATION NUMBER OF TAXA TOTAL DENSITY N/m2 % OF DIVERSITY
1 2/3 22 66.6
2 2/3 33 66.6
3 3/3 55 100
4 1/3 11 33.3
5 1/3 11 33.3
6 2/3 33 66.6
7 2/3 44 66.6
8 2/3 33 66.6
9 2/3 22 66/6
R 2/3 44 66.6
Location-2
Geographical coordinates :: 19014‘26‖ E 70058‘52‖N
Date of sampling: 26th October, 2013 Time of sampling: 14:00- 19:30
Sampling
Locations
1 2 3 4 5 6 7 8 9 R
Depth in meter 79 78.8 79.7 79.4 78.7 79.4 79.4 78.9 79.3 78.3
Sechi disc
depth in meter Not measured as sea was rough
R – Reference location

Pre-drill EIA for the NELP block MB-OSN-2005/3 (5-Appraisal Wells) 2017
70
Sampling Location
Coordinates Sampling Location
Coordinates
Latitude Longitude Latitude Longitude
RGD-1 19038‘06‖ 71024‘51‖ RGD-6 19036‘46‖ 71024‘28‖
RGD-2 19037‘33‖ 71024‘40‖ RGD-7 19036‘20‖ 71025‘50‖
RGD-3 19037‘17‖ 71024‘43‖ RGD-8 19036‘41‖ 72025‘22‖
RGD-4 19036‘03‖ 71023‘42‖ RGD-9 19036‘47‖ 72025‘03‖
RGD-5 19036‘31‖ 71024‘17‖ RGD-10 19038‘16‖ 72028‘47‖
BIOLOGICAL PARAMETERS IN SEA WATER COLUMN AROUND LOCATION-2
Chlorophyll-a
In the sub surface water chlorophyll-a was varying from 1.98-2.83-mg/M3 and in the above
bottom water chlorophyll –a concentration was below detectable limit.
Phytoplankton Population
For evaluation of Phytoplankton population in the surroundings of the location-2. Sampling
was conducted from 9 sampling locations within 2km radius. The phytoplankton community of the sub
surface water and above bottom water near the location was represented by two species Blue green
Algae, (Richelia intracellularis, Trichodesmium sp.),9 species of Diatoms and 10 species of
Dinoflagellates. Phytoplankton of the sampling locations at sub surface layer was varying from 178-254
units/ L with an average of 211.2 units/L (SD 23.70).
Blue green algae Richelia intracellularis was present in large number in the sub surface
water along with one associated diatom Rhizosolenia sp. These two algae were the dominant among
the phytoplankton in the surface water around these region. Phytoplankton from the above bottom
samples the various locations was very low varying from 24-58 units /L. with an average of 44.0 units/L
(SD. 11.07).
Zooplankton Population
Zooplankton samples were collected from the sub surface layer in different sampling
locations around the location -1. Zooplankton population near the location was represented by 6 groups
of plankton; Tintinids copepods, Cindararians (medusa and polyp), Urochordata members and arrow
worms. Among these, Protozoans Tintinids was dominant group followed by Copepods, The
zooplankton density was varying from 56-100 No/L with an average value of 81.2 N/L (S.D-14.70)

Pre-drill EIA for the NELP block MB-OSN-2005/3 (5-Appraisal Wells) 2017
71
among the sampling locations. The biomass of zooplankton by displacement volume was varying from
0.02ml/m3- 0.05 ml/m3.
BENTHIC COMMUNITIES
Chlorophyll content in the sediment
Chlorophyll content in the sediment extracted in acetone was below detectable limits.
Benthic organisms
The Mieo benthic organism collected along with sediments by using the Vanveen grabs
were represented by 2 groups of meio fauna, Nematode worms, Polychaete worms, The total number
of meio benthic organisms were varying from 0 -0.06 / 10 cm2.The macro benthic organisms were
represented by Nematode worms, Polychaete worms and crustaceans groups but the abundance was
s varying from 11 -55 no/M2.
Table: 24 (a) Phytoplankton variation in abundance and Diversity in subsurface and above bottom water
between the sampling locations near Location-2
Sampling
Location
Surface water Above Bottom water
Abundance
In units/L
No of Species observed
/total species
% of diversity Abundance
In units/L
No of Species observed
/total species
% of diversity
1 232 20/22 90.90 58 10/22 45.45
2 218 18/22 81.81 60 9/22 40.90
3 188 18/22 81.81 50 9/22 40.90
4 202 16/22 72.72 42 6/22 27.27
5 188 19/22 86.36 46 7/22 31.81
6 254 17/22 77.27 38 7/22 31.81
7 222 16/22 72.72 38 5/22 22.72
8 228 17/22 77.27 50 6/22 27.27
9 202 14/22 63.63 24 5/22 22.72
R 178 15/22 68.18 34 5/22 22.72
Table: 24 (b) Abundance of phytoplankton near Location2
Installation Surface No of Sampling location
Group of phytoplankton
Range Units/L
Mean units/L
SD
(Loc-2)
Sub surface 10 Blue green algae 48-88 67.6 15.22
Green algae 2-12 7.2 3.12

Pre-drill EIA for the NELP block MB-OSN-2005/3 (5-Appraisal Wells) 2017
72
Diatoms 72-114 91.4 10.28
Dinoflagellates 26-68 45.0 11.39
Total phytoplankton 178-254 211.2 23.70
Above bottom 10
Blue green algae 8-22 13.4 4.2
Green algae 2-4 0.6 1.28
Diatoms 10-26 16.8 4.99
Dinoflagellates 4-22 13.2 5.81
Total phytoplankton 24-58 44.0 11.07
Table: 25 (a) Variation in abundance and Diversity of marine Zooplankton in sub surface water between
the sampling locations near Installation Location -2
Sampling
Location
Abundance N/L No of Species/ group/total species
% of diversity
1 80 17/20 85
2 94 18/20 90
3 82 17/20 85
4 66 14/20 70
5 56 17/20 85
6 64 16/20 80
7 86 15/20 75
8 90 16/20 80
9 94 16/20 80
R 100 18/20 90
Table: 25 (b) Abundance of Zooplankton near Location-2
Installation Surface No of Sampling locations
Range
N/L
Mean
N/L
SD
(Loc-2) Sub surface 10 56-100 81.2 14.70

Pre-drill EIA for the NELP block MB-OSN-2005/3 (5-Appraisal Wells) 2017
73
Table: 4.26: Systematic account of marine phytoplankton in the subsurface water in the sea near Location-2
GROUP PHYLUM CLASS ORDER FAMILY GENUS/SPECIES #
BLUE GREEN
ALGAE (Desikachary,
1959)
CYANOPHYTA
CYANOPHYCEAEA
NOSTOCALES
NOSTOCACEAE Sub Family Anabanae
Richelia intracellularis
B1
OSCILLATORIACEAE Trichodesmium sp B2
DIATOMS (Hendey,1937)
BACILLARIOPHYTA CHRYSOPHYTA
BACILLARIOPHYCEAE
ORDER BACILLARIALES Sub Order
COSCINODISCACEAE COSCINODISCACEAE Coscinodiscus sp. D1
SUB ORDER BIDDULPHINEAE
BIDDULPHIACEAE Eucambia sp. D2
Biddulphia sp. D3
CHATOCERACEAE Chaetoceros costatus D4
Chaetoceros sp. D5
SUB ORDER: RHIZOSOLENIINEAE
RHIZOSOLENIACEAE Rhizosolenia sp. D6
SUB –ORDER FRAGILARINEAE
FRAGILARIACEAE Synreda sp. D7
SUB ORDER NAVICULINEAE
NAVICULACEAE Navicula sp. D8
BACILLARIACEAE Nitzschia sp. D9
DINO FLAGELLATES
PYRROPHYTA
DESMOPHYCEAE
GONYAULACALES
CERATIACEAE
Ceratium breve F1
Ceratium furca F2
Ceratium fusus F3
Ceratium triops F4
CLADOPYXIDACEAE Cladopyxis F5
GONIODOMATACEAE Alexandrium sp. F6
PYROCYSTACEAE Pyrocystis sp. F7
PERIDINIALES PROTOPERIDINIACEAE Protoperidinium sp. F8
NOCTILUCALES NOCTILUCACEAE Naoutiluca F9
GYMNODINIALIS POLYKRIKACEAE Polkrikos sp. F10
GREEN ALGAE CHLOROPHYTA PARSINOPHYCEAE CHLORODENTRALES HALOSPHAERACEAE Pterosperma sp. G1

Pre-drill EIA for the NELP block MB-OSN-2005/3 (5-Appraisal Wells) 2017
74
Table: 4.27: Quantitative evaluation of marine phytoplankton in sub surface water near Location-2
GENUS/SPECIES Abundance in units/cells / l of marine water from different sampling locations Rep. by group and individual genus/species
1 2 3 4 5 6 7 8 9 R TOTAL AVG %of Group. % Total SD
B BLUE GREEN ALGAE
B1 Richelia intracellularis 60 48 42 76 40 78 68 84 60 48 604 60.4 89.35 28.59 14.93
B2 Trichodesmium sp 12 8 4 10 12 0 14 4 8 0 72 7.2 10.65 3.40 4.75
Total Blue green algae units/L 72 56 46 86 52 78 82 88 68 48 676 67.6 15.22
I DIATOMS
D1 Coscinodiscus sp. 8 4 0 0 4 8 6 2 0 10 42 4.2 4.59 1.98 3.52
D2 Eucambia sp. 8 10 4 12 6 10 8 12 10 2 82 8.2 8.97 3.88 3.15
D3 Biddulphia sp. 12 14 10 10 6 4 16 12 14 12 110 11.0 12.03 5.21 3.49
D4 Chaetoceros costatus 10 18 12 8 16 4 12 10 12 8 110 11.0 12.03 5.21 3.82
D5 Chaetoceros sp. 8 0 0 4 0 0 0 0 0 0 12 1.2 1.31 0.56 2.56
D6 Rhizosolenia sp. 42 28 36 24 34 40 30 32 46 50 362 36.2 39.60 17.14 7.82
D7 Synreda sp. 4 0 12 2 4 6 0 0 0 2 30 3.0 3.28 1.42 3.60
D8 Navicula sp. 12 8 6 2 4 12 6 4 2 4 60 6.0 6.56 2.84 3.46
D9 Nitzschia sp. 10 12 8 10 12 16 10 14 8 6 106 10.6 11.59 5.02 2.83
Total Datoms units/L 114 94 88 72 86 100 88 86 92 94 914 91.4 43.28 10.28
II DINO FLAGELLATES
F1 Ceratium breve 10 12 8 10 16 14 22 10 14 8 124 12.4 27.55 5.87 4.08
F2 Ceratium furca 4 4 2 0 2 4 10 4 0 0 30 3.0 6.66 1.42 2.86
F3 Ceratium fusus 2 0 6 0 6 0 4 6 0 0 24 2.4 5.33 1.14 2.65
F4 Ceratium triops 6 8 2 4 6 4 0 2 6 10 48 4.8 10.66 2,27 2.86
F5 Cladopyxis 0 4 0 0 2 0 0 0 0 0 6 0.6 1.33 0.28 1.28
F6 Alexandrium sp. 4 6 2 0 8 4 6 10 6 4 50 5.0 11.11 2.36 2.72
F7 Pyrocystis sp. 0 4 0 0 0 0 0 0 0 0 4 0.4 0.88 0.19 1.2
F8 Protoperidinium sp. 4 8 12 10 2 6 14 8 6 2 72 7.2 16.0 3.41 3.81
F9 Naoutiluca 4 0 8 2 0 6 0 0 0 0 20 2.0 4.44 0.94 2.82
F10 Polkrikos sp. 6 12 8 6 4 10 12 4 8 2 72 7.2 16 3.41 3.24
Total Dinoflagellates units/L 40 58 48 32 46 48 68 44 40 26 450 45.0 21.31 11.39
G GREEN ALGAE
G1 Pterosperma sp. 6 10 6 12 4 8 4 10 2 10 72 7.2 100 3.41 3.12
Total Green Algae Units/L 6 10 6 12 4 8 4 10 2 10 72 7.2 100 3.41 3.12
Total phytoplankton units/l 232 218 188 202 188 254 222 228 202 178 2112 211.2 23.70
CHLOROPHYLL –a Content mg/m3
2.61 2.55 1.98 2.22 2.44 2.17 2.83 2.24 2.12 1.98 0.28

Pre-drill EIA for the NELP block MB-OSN-2005/3 (5-Appraisal Wells) 2017
75
Table.4.28: Quantitative evaluation of marine phytoplankton in above bottom water near Location-2
GENUS/SPECIES Abundance in units/cells / l of marine water from different sampling locations Representation by group and individual genus/species
1 2 3 4 5 6 7 8 9 R TOTAL AVG %of Group. % Total SD
B BLUE GREEN ALGAE
B1 Richelia intracellularis 10 20 12 16 18 10 12 16 8 10 132 13.2 98.51 30.0 3.82
B2 Trichodesmium sp 0 2 0 0 0 0 0 0 0 0 2 0.2 1.49 0.45 0.6
Total Blue green algae units/l 10 22 12 16 18 10 12 16 8 10 134 13.4 4.2
I DIATOMS
D1 Coscinodiscus sp. 2 0 4 0 0 0 0 0 0 0 6 0.6 3.57 1.36 1.28
D2 Eucambia sp. 0 2 0 0 0 0 0 0 0 0 2 0.2 1.19 0.45 0.6
D3 Biddulphia sp. 6 8 2 10 4 2 0 4 2 6 44 4.4 26.19 10.0 2.93
D4 Chaetoceros costatus 0 0 0 0 0 0 0 0 0 0 0 0 0 0 0
D5 Chaetoceros sp. 0 0 0 0 0 0 0 0 0 0 0 0 0 0 0
D6 Rhizosolenia sp. 18 12 10 6 12 8 10 16 10 14 116 11.6 69.04 26.36 3.44
D7 Synreda sp. 0 0 0 0 0 0 0 0 0 0 0 0 0 0 0
D8 Navicula sp. 0 0 0 0 0 0 0 0 0 0 0 0 0 0 0
D9 Nitzschia sp. 0 0 0 0 0 0 0 0 0 0 0 0 0 0 0
Total Datoms units/L 26 22 16 16 16 10 10 20 12 20 168 16.8 38.18 4.99
II DINO FLAGELLATES
F1 Ceratium breve 8 2 6 0 4 6 4 6 2 2 40 4.0 30.30 9.09 2.36
F2 Ceratium furca 2 6 6 4 2 2 8 2 2 2 36 3.6 27.27 8.18 2.15
F3 Ceratium fusus 0 0 2 0 4 0 0 0 0 0 6 0.6 4.54 1.36 1.28
F4 Ceratium triops 4 4 4 4 0 0 4 0 0 0 20 2.0 15.15 4.54 2.0
F5 Cladopyxis 0 0 0 0 0 0 0 0 0 0 0 0 0 0 0
F6 Alexandrium sp. 0 0 0 0 0 0 0 0 0 0 0 0 0 0 0
F7 Pyrocystis sp. 0 0 0 0 0 0 0 0 0 0 0 0 0 0 0
F8 Protoperidinium sp. 2 4 4 0 2 6 0 6 0 0 24 2.4 18.18 5.45 2.33
F9 Naoutiluca 2 0 0 0 0 4 0 0 0 0 6 0.6 4.54 1.36 1.28
F10 Polkrikos sp. 0 0 0 0 0 0 0 0 0 0 0 0 0 0 0
Total Dinoflagellates units/L 18 16 22 8 12 18 16 14 4 4 132 13.2 330.0 5.81
G GREEN ALGAE
G1 Pterosperma sp. 4 0 0 2 0 0 0 0 0 0 6 0.6 100 1.36 1.28
Total Green Algae Units/L 4 0 0 2 0 0 0 0 0 0 6 0.6 - - 1.28
Total phytoplankton units/l 58 60 50 42 46 38 38 50 24 34 440 44.0 - - 11.07
Chlorophyll –a Content mg/m3 ND ND ND ND ND ND ND ND ND ND 0.26

Pre-drill EIA for the NELP block MB-OSN-2005/3 (5-Appraisal Wells) 2017
76
Table - 4.29: Systematic account of marine zooplankton in the subsurface water near Location-2
GROUP PHYLUM CLASS ORDER FAMILY GENUS/SPECIES #
TINTINIDS PROTOZOA CILIOPHORA
SPIROTRICHEA TINTINNIDA TINTINNIDAE Eutintinnus sp. T1
Amphorides sp..
XYSTONELLIDAE Favella SP.
RHABDONELLIDAE Rhabdonella sp.
CODONELLIDAE Tintinnopsis acuminata
COPEPODS
ARTHROPODA
CRUSTACEA
SUB CLASS COPEPODA
CALANOIDA CALANIDAE Canthocalanus sp. C1
ACARTIIDAE Acartia sp. C2
CENTROPAGIDAE Centropages sp. C3
CYCLOPOIDA ONCAEIDAE Oncaea sp. C4
HARPACTICOIDA ECTINOSOMATIDAE Microsetella sp. C5
POLYP CNIDARAIA HYDROZOA HYDROIDA
THECATA CAMPANULARIIDAE Clytia sp. P1
HYDROIDOMEDUSAE CNIDARAIA HYDROZOA
Proboscoida Campanulariidae Obelia sp. M1
UROCHORDATA CHORDATA SUB PHYLUM
UROCHORDATA
APPENDICULARIA OIKOPLEURIDAE Oikopleura sp. U1
FRITILLARIIDAE Fritillaria sp. U2
ARROW WORMS CHAETOGNATHA SAGITTOIDEA APHRAGMOPHORA SAGITTIDAE Sagitta sp. A1
NUPLIUS LARVAE ARTHROPODA SUB PHYLM CRUSTACEA
COPEPODA - - Nauplius larvae L1

Pre-drill EIA for the NELP block MB-OSN-2005/3 (5-Appraisal Wells) 2017
77
Table.4.30: Quantitative evaluation of marine zooplankton in sub surface water near Location-2
GENUS/SPECIES Abundance in n/l marine water from different sampling locations Representation by group and individual genus/species
1 2 3 4 5 6 7 8 9 R TOTAL AVG % of Group % of Total SD
T TINTINIDS
T1 Eutintinnus sp. 8 6 10 4 2 10 6 8 10 12 76 7.6 32.47 9.36 2.93
T2 Amphorides sp.. 0 2 0 0 0 0 4 0 0 6 12 1.2 5.13 1.48 2.04
T3 Favella SP. 4 10 6 2 4 2 6 10 2 4 50 5.0 21.37 6.16 2.86
T4 Rhabdonella sp. 2 0 0 2 6 4 0 0 0 2 16 16 6.84 1.97 1.95
T5 Tintinnopsis acuminata 10 8 12 6 4 2 8 12 10 8 80 8.0 34.18 9.85 3.09
Total Tininids N/L 24 26 28 14 16 18 24 30 22 32 234 28.82 5.66
C COPEPODS
C1 Canthocalanus sp. 4 8 6 2 4 6 10 6 12 6 64 6.4 21.33 7.88 2.8
C2 Acartia sp. 6 12 2 4 2 6 6 4 10 12 64 6.4 21.33 7.88 3.55
C3 Centropages sp. 2 4 2 0 2 2 0 6 8 4 30 3.0 10.0 3.69 2.40
C4 Oncaea sp. 10 6 8 12 6 2 8 12 4 2 70 7.0 23.33 8.62 3.49
C5 Microsetella sp. 8 6 6 10 4 2 6 8 10 12 72 7.2 24.0 8.86 2.85
Total copepods N/L 30 36 24 28 18 18 30 36 44 36 300 30.0 - 36.94 7.95
M CNIDARAIA
M1 Clytia sp. 2 0 2 0 0 0 0 0 0 2 6 0.6 75.0 0.74 0.92
M2 Obelia sp. 0 2 0 0 0 0 0 0 0 0 2 0.2 25.0 0.25 0.6
Total cindarians N/L 2 2 2 0 0 0 0 0 0 2 8 0.8 - 0.98 0.98
U UROCHORDATA
U1 Oikopleura sp. 6 10 8 12 6 8 10 2 8 10 80 8.0 83.33 9.85 2.68
U2 Fritillaria sp. 0 4 2 0 4 0 0 4 2 0 16 1.6 16.67 1.97 1.74
Total Urochordata N/L 6 14 10 12 10 8 10 6 10 10 96 9.6 - 11.82 2.33
A ARROW WORMS CHA ETOGNATHA
A1 Sagitta sp. 2 4 2 0 2 6 2 4 2 2 26 2.6 100 3.20 1.56
ARROW WORMS TOTAL NO/L 2 4 2 0 2 6 2 4 2 2 26 2.6 - 3.20 1.56
L NUPLIUS LARVAE
L1 Nauplius larvae of Copepods 16 12 16 12 10 14 20 14 16 18 148 14.8 100 18.23 2.85
LARVAE TOTAL N/L 16 12 16 12 10 14 20 14 16 18 148 14.8 - 18.23 2.85
ZOOPLANKTON TOTAL N/L 80 94 82 66 56 64 86 90 94 100 812 81.2 - 14.70
BIOMASS DISPLACMENT VOLUMEml / m3
0.04 0.04 0.03 0.02 0.03 0.04 0.05 0.04 0.04 0.05 - - - - 0.008

Pre-drill EIA for the NELP block MB-OSN-2005/3 (5-Appraisal Wells) 2017
78
Table.4.31: Quantitative evaluation of macro fauna on rig near Location2
TAXA
ABUNDANCE IN N/M2 DIFFERENT SAMPLING LOCATIONS REPRESENTATION BY GROUP
1 2 3 4 5 6 7 8 9 R TOTAL MEAN % OF
COMPOSITION SD
POLYCHATES 0 0 11 0 11 22 0 11 11 11 77 7.7 27.02 7.42
NEMATODES 22 11 32 11 11 22 11 0 22 22 164 16.4 57.54 9.15
CRUSTACEANS 0 0 11 0 0 11 0 0 0 22 44 4.4 15.44 7.69
TOTAL NUMBERS NO/
m2 22 11 54 11 22 55 11 11 33 55 285 28.5 - 19.39
BIOMASS gm/m2
3.01 1.39 5.68 1.82 4.60 8.66 1.39 1.07 4.03 7.21 2.64
Table.4.32: Macro fauna taxon diversity of the rig Near Location-2
Location Number Of Taxa Total Density No/m2 % Of Diversity
1 1/3 22 33.3
2 1/3 11 33.3
3 3/3 54 100
4 1/3 11 33.3
5 2/3 22 66.6
6 3/3 55 100
7 1/3 11 33.3
8 1/3 11 33.3
9 2/3 33 66.6
R 3/3 55 100
Fish and Fisheries
Coastal fishery is an important commercial activity as it plays a vital role in regional and
national economy of a maritime state. However, coastal fishery is facing many problems largely due to
the increased level of pollution and management. It has been successfully demonstrated that coastal
pollution can seriously affect the fishable stocks. Consequently, significant efforts are put in assessing
fishery resources both on the regional as well as local level. In this context, the presence or absence of
particular fish species and their standing stock has been widely used as a biological indicator of the
degree of pollution. The success of any fishery depends upon the prevailing' physicochemical and
biological conditions and hence the study of environmental factors is important for the assessment of

Pre-drill EIA for the NELP block MB-OSN-2005/3 (5-Appraisal Wells) 2017
79
fishery resources. The effect of effluent or waste disposal in the aquatic environment inevitably includes
modifications and changes in the physico-chemical and biological characteristics of the ecosystem.
These changes are more pronounced in the semi-enclosed water bodies such as estuaries and bays
where water circulation is limited. The toxic effluent once discharged into the environment produces
characteristic response and sometimes mortality among the biota including fish and fishery. Such
responses can be measured on the biological scale. Hence, evaluation of biological productivity
(microbes, phytoplankton, zooplankton and benthos) of an ecosystem is an integral part of any
environmental impact assessment. Such studies are concerned with identifying, predicting and
evaluating the environmental effects of waste water/effluent discharge. It employs the scientific
methodologies and techniques for collecting baseline data which at later stage will be useful in planning
and decision making.
Experimental fishing was done along two transects, at 30~ 50 m water depth zone Finfish
and shellfish samples were brought in iceboxes to the field laboratory and kept deep frozen for
identification. Samples of each species were sorted, counted and weighed. Fishes were identified up to
species level following FAO species identification sheets for fisheries purposes, western Indian Ocean
(Fisher and Bianchi, 1984). Species occurrence (total number of species), abundance (number of fishes
and catch rate per hour) were calculated.
ABUNDANCE AND DENSITY :
The relative abundance (total fish number and biomass) and number of demersal fishes
caught in the selected area is presented below. A catch rate of 120 kg/hr and 65 kg/hr was obtained in
depth zones of 50 m and 30 m, respectively. Even though the weight was higher, trawl catch obtained
from 50 m depth zone was of poor quality and mainly consisted of gastropods, jellyfish etc., Hence, only
catch from 30 m depth zone was considered for detailed fishery assessment.
SPECIES OCCURRENCE:
The fish community was typical of Indio-Pacific type. The demersal fish assemblage was
dominated in terms of abundance by members of the family, Penaeidae (19.4%), Trichiuridae (16.2%),
Portunidae (15%) Scienidae (14%), Synodontidae (7%), Leognanthidae (5.8%) and Cynoglossidae
(5.4%) were the main contributos. Others such as families Tetradontidae, Carcharinidae together
contributed to the remainder of the catch (~ 13%). Different crustacean and molluscan species were
recorded in the trawl catch. Amongst crustaceans, prawns were the most dominant. Prawns belonging

Pre-drill EIA for the NELP block MB-OSN-2005/3 (5-Appraisal Wells) 2017
80
to family Penaeidae, Solenoceridae, Sergestidae, Sicyonidae consistently occurred. Crustacean
species in order to the abundance were Acetus Indiicus, Deep sea shrimp, Solenocera sp. and
Metapenaeus sp and crab species (Porunus sp. and Charybdis sp.). While two species Charybdis
annulata and Cryptopodia angulata were reported first time from the Mumbai High region.
The high population density of bottom fauna (demersal fish and benthos) in the study area
reflects on the high biological productivity and rich fishing grounds. The occurrence of large number of
juveniles in the trawl samples indicate that the area may serve as nursery ground for commercially
important fin and shellfishes. Furthermore, high occurrence of decapod larvae, fish eggs and larvae in
zooplankton samples substantiates it. The mean catch rate of 80 kg/hour is well comparable to some of
the nearshore fishing grounds along the west coast of India (Parulekar et al., 1982).
Table 4.33: Relative abundance in the fishes during the sampling
# Scientific name Common name Relative abundance
no/Haul
Relative Biomass gm/ haul
1 Combionella buitendijki Jelly fish 20 -
2 Octopus sp. Octopus 12 3500
3 Sepia elliptica Cuttle Fish 7 560
4 Loligo duvauceli Indian squid 4 450
5 Penaeus indicus Indian White Prawn 12 1000
4 Penaeus monodon TigerPrawn 20 800
5 Eugomphodus Taurus Sand Tiger Shark 2 1400
6 Carcharhinus dussumieri White Cheeked Shark
1 1100
7 Sardinella longiceps Sardine 12 1800
8 Congresox telabonoides Common Ell 2 600
9 Hardpodon nehereus Bombay Duck 32 3000
10 Trichiurus lepturus Ribbon Fishes 4 400
11 Lepturacanthus savla Ribbon Fishes 2 300
12 Arius sp. Arius sp. 4 1500
13 Rastrelliger kanagurta Indian Mackerel 10 2500

Pre-drill EIA for the NELP block MB-OSN-2005/3 (5-Appraisal Wells) 2017
81
Chapter 5
ANTICIPATED ENVIRONMENTAL IMPACTS
& MITIGATION MEASURES
5.1. ENVIRONMENTAL IMPACTS IDENTIFIED:
This section identifies and attempts at assessing the aspects arising due to drilling activity which may
have environmental impact (Physical and Biological). The following factors which were analyzed for the
impact study based on secondary data constituting the baseline study of.
Offshore air and noise quality
Marine water quality & temperature
Biological environment
Benthic community
Marine micro-organisms, fish, reptiles, mammals, seabirds
Marine ecology
Occupational safety of personnel
Environmental aspects (based on phases of activities pre drilling, drilling, decommissioning
and potential accidental events) and impacts on offshore environment have been taken into
consideration in line with standard management system terminology. It is imperative that an
environmental or socio-economic impact may result from any of the project activity.
5.1.1 IMPACT ON AIR ENVIRONMENT There are a number of sources of emissions in the offshore exploratory drilling which Include:
Emissions from MODU and support vessels
Emissions from DG sets
Helicopter emissions
Fugitive emissions from diesel storage tanks
The expected pollutants raise from these sources are carbon di-oxide (CO2), oxides of nitrogen (NOX),
Sulphur dioxide (SO2), Carbon Monoxide (CO), Hydrocarbons (HCs), PM10 and PM 2.5. Drilling
consumes a considerable amount of electric power and the MODU is equipped with a power generating
capacity of 1430 kVA of each from 4 nos. of DG sets. Anticipated levels of emissions of these gases
are low. The dispersive wind conditions in the area and low emissions levels expected suggest
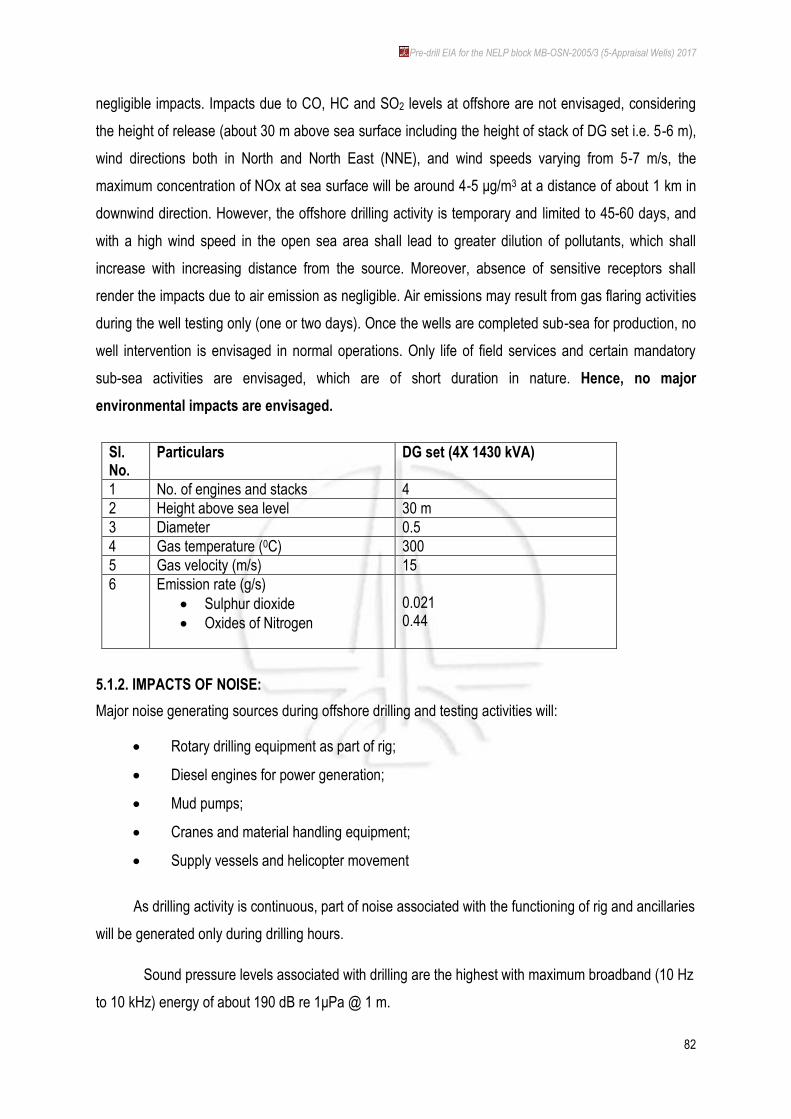
Pre-drill EIA for the NELP block MB-OSN-2005/3 (5-Appraisal Wells) 2017
82
negligible impacts. Impacts due to CO, HC and SO2 levels at offshore are not envisaged, considering
the height of release (about 30 m above sea surface including the height of stack of DG set i.e. 5-6 m),
wind directions both in North and North East (NNE), and wind speeds varying from 5-7 m/s, the
maximum concentration of NOx at sea surface will be around 4-5 μg/m3 at a distance of about 1 km in
downwind direction. However, the offshore drilling activity is temporary and limited to 45-60 days, and
with a high wind speed in the open sea area shall lead to greater dilution of pollutants, which shall
increase with increasing distance from the source. Moreover, absence of sensitive receptors shall
render the impacts due to air emission as negligible. Air emissions may result from gas flaring activities
during the well testing only (one or two days). Once the wells are completed sub-sea for production, no
well intervention is envisaged in normal operations. Only life of field services and certain mandatory
sub-sea activities are envisaged, which are of short duration in nature. Hence, no major
environmental impacts are envisaged.
Sl. No.
Particulars
DG set (4X 1430 kVA)
1 No. of engines and stacks 4
2 Height above sea level 30 m
3 Diameter 0.5
4 Gas temperature (0C) 300
5 Gas velocity (m/s) 15
6 Emission rate (g/s)
Sulphur dioxide
Oxides of Nitrogen
0.021 0.44
5.1.2. IMPACTS OF NOISE:
Major noise generating sources during offshore drilling and testing activities will:
Rotary drilling equipment as part of rig;
Diesel engines for power generation;
Mud pumps;
Cranes and material handling equipment;
Supply vessels and helicopter movement
As drilling activity is continuous, part of noise associated with the functioning of rig and ancillaries
will be generated only during drilling hours.
Sound pressure levels associated with drilling are the highest with maximum broadband (10 Hz
to 10 kHz) energy of about 190 dB re 1μPa @ 1 m.

Pre-drill EIA for the NELP block MB-OSN-2005/3 (5-Appraisal Wells) 2017
83
NOISE IMPACTS
Project related activities including offshore drilling will lead to considerable local level
emission of noise that may have significant impact on the occupational health of drilling crew and
personnel housed on the drilling rig. Potential impacts on noise quality may arise from air borne noise
generated during drilling operations of rotary drilling equipment, diesel engines for power generation
and mud pumps, leading to perceptible increase in ambient noise levels in immediate vicinities. Noise is
also likely to be generated during rig mobilization and also during operation of supply vessels and
helicopter. However, noise so generated will be comparable in level to other drilling related activities
and would be continuous in places (drilling location and ports) and intermittent along transportation
routes. The value range of noise generated from various sources during offshore exploratory drilling
operations is as follows:
Helicopter : 103 to 105 dB(A)
Diesel Generators : 60 to 70 dB(A)
Mud Pumps at the Rig : 90 to 100 dB(A)
Upper Decks : 65 to 73 dB(A)
Control Room & Quarters : 50 to 60 dB(A)
In addition, drilling would also result in generation of underwater noise which has the
potential to affect the marine ecology in and around the drill locations. The quantum of noise, its quality
and related impacts and their significance is discussed in the following paragraph.
Atmospheric Noise Emanated from Rig and DG Sets Drilling rig and associated machinery,
including high power DG sets, mud pumps, shakers, etc., will emit very high noise during drilling
operations. Typical noise levels emanated from drilling rig and DG sets are of the order of 95 – 100 db
(A) and 100 -105 db (A) respectively.
Moreover, as drilling is a continuous (24x7) activity, such noise will be emitted during both
daytime and nighttime and may lead to significant impact on drilling crew on rig, unless proper
mitigation measures are implemented. The offshore project block is located in shallow sea but at a
considerable distance from the coastal area, so the above impacts are expected to be localized and
have potential effect only on workers at site.
NOISE EMANATED FROM SUPPLY VESSELS AND HELICOPTER MOVEMENT
Supply vessels and helicopters will be deployed for transportation of resources (water, fuel
and equipment, etc.) and personnel to the drilling rig respectively. This will result in an incremental

Pre-drill EIA for the NELP block MB-OSN-2005/3 (5-Appraisal Wells) 2017
84
increase of noise levels because of additional maritime traffic along the supply routes. However, noise
levels increase will be intermittent having only localized impacts along the corridor of no or low
significance. Also, since there exist predefined shipping routes near to Nhava base, it is expected that
marine animals in this region are accustomed to noise generated from passing vessels. Although
vessel activity along the shipping route between shore and offshore block would increase, it is expected
that if animals initially displayed avoidance behavior, they would eventually return to the affected area
once they become accustomed to the increased noise levels or once noise source had moved or
ceased. Taking into account limited movement of such vessels and helicopters any cumulative noise
related impacts arising from vessel activities are therefore considered to be negligible.
In addition, noise impacts are measured in terms of logarithmic equivalent (LeQ) averaged
over hours, considering transient nature of project and intermittent plying of transport vessels and
helicopters (moving sources), no significant impact is envisaged.
5.1.3. IMPACTS ON MARINE WATER AND SEDIMENT:
Number of activities related to various phases of the proposed drilling activity has the
potential to impact marine water quality and consequently marine ecology adjacent to the drilling
locations. Some marine water quality impacts will also occur along corridors that are proposed to be
used for providing logistic support to the drilling rig, though they are anticipated to be minimal. Some
near shore activities like handling of chemicals and oil may also impact marine environment. The
important potential anticipated impacts to marine environment are discussed under the following major
heads:
Physical presence of the drilling rig
Disposal of drill cuttings and WBM
Operational discharges like sanitary waste water, washing fluids (deck drainage, rig floor
washing, etc.,), cooling water,, etc.,
Non-routine discharges that may be caused by ballast water, chemical spills, etc.
Food waste and residuals.
5.1.4 IMPACTS ON MARINE WATER QUALITY:
Number of activities related to various phases of the proposed drilling has the potential to
impact marine water quality and consequently marine ecology adjacent to the drilling locations. Some
near shore activities like handling of chemicals and oil may also impact marine environment. The main
physical impacts on seawater from the discharge of cuttings and drilling fluids are associated with a

Pre-drill EIA for the NELP block MB-OSN-2005/3 (5-Appraisal Wells) 2017
85
localized increase in water turbidity (due to increase in suspended solids) in the vicinity of discharge
point and minor changes in local water quality.
The base line water quality parameters are well below the minimum prescribed limits. The
average D.O. is 4.42 mg/L is close to saturation levels and the heavy metals (Hg, Cr, Pb, Cd, Zn) were
very low. The concentration of iron was in the range of 0.23-0.43 % (w/w). Oil content was in the range
of non-detectable. As it is confirmed by ICMAM (Integrated Coastal and Marine Area Management) that
the quality of the sea water beyond 2 km from shore is clean.
Offshore deployment of floater rig and other sub-sea facilities (BOP) has been envisaged to
cause short term and local increase in turbidity levels due to disturbance of seabed sediments.
Displacement of sea bed sediments may lead to oxidation of anoxic intertidal and offshore mud. This
shall cause local chemical changes in water quality by a subsequent decrease in pH (due to oxidation
of sulphides to sulphate). However, these impacts have been envisaged to be local and temporary and
water is expected to regain its original characteristics within short span of time. Water quality can also
be affected due to the discharge of drill cuttings, drilling mud, accidental spillage of chemicals, oil &
lubricants during the deployment of rigs, operation of generators and transportation of vessels.
However, impacts from these sources have been envisaged to be insignificant due to adoption of good
work ethics and suitable mitigation measures throughout the drilling activities.
5.1.5 DISPOSAL OF DRILL CUTTINGS AND RESIDUAL WBM:
Drill cuttings, composed of rocky substrate like shale, clay, sandstone, etc. are produced
during the drilling process and are separated from the mud. Typically, the solid medium used in the
drilling mud is barite (barium sulfate) as weighing agent, with bentonite clays as a thickener.
Sl. No Hole diameter (Inches)
Drilled depth (M) Qty. of cuttings (M3)
1 26 100 32.7
2 17.5 100 14.9
3 12.25 100 7.5
4 8.5 100 3.5
Table-: Quantity of drill cuttings generated
Drilling mud also contains a number of chemicals that are added depending on down-hole
formation conditions. Thoroughly washed drill cuttings are dispersed into the sea.

Pre-drill EIA for the NELP block MB-OSN-2005/3 (5-Appraisal Wells) 2017
86
ONGC instituted a study on the drill cuttings and their toxicity through CRRI (Central Road
Research Institute, New Delhi) which reveals that there is no toxicity in any of the samples
of drill cuttings analyzed and the drill cuttings were found to be inert in nature.
Mud system analyses data has been found to be much below the prescribed toxicity limit;
the relevant portion from the report published by Institute of Drilling Technology, ONGC,
Dehradun is annexed at Annexure – IV at the end of the report.
Impacts on Marine Water and Sediment as given below.
5.1.6 IMPACT ON BENTHIC FAUNA:
The main impact on benthic fauna will be from physical smothering and restricted to areas
where cuttings are deposited. Studies suggest that biological effects of WBM contaminated cuttings will
be confined within 100 m from well location (Effects of Exploratory Drilling Discharges on the Benthos.
Gillmor R. B. Et al.). Re-colonization of biota and recovery will be well established within a year after
disposal has stopped.
Under less energetic wave and current conditions, impacts recovery may take more time;
however taking into account that project site is located in high waters of Arabian Sea characterized by a
high energy environment, impacts on benthos due to smothering and physical disturbance are
anticipated to be minimal and of short duration.
Toxic effects on marine species of this substratum are also not anticipated due to low
toxicity of mud formulation to be used for the proposed project. Data from previous studies indicate that
major biological changes in benthic communities mostly extend to a maximum of 500 – 1000 m
(GESAMP, 1993); in addition to minor detectable changes extending to a maximum of about 3 – 5 km
from the drilling location (Gray et al., 1999).
DISCHARGE OF GREY AND BLACK WATER
It is estimated that Drilling rig operations will result in the generation of about 10 m3/day of
sewage and wastes from kitchen, shower and laundry area. Sewage will be subsequently discharged
into marine environment after passing it through a screen less than 25 mm diameter prior to discharge.
It is likely that such discharge can result in localized organic enrichment in the vicinity of the discharge
point that in turn can result in potential oxygen depletion in the discharge plume resulting in some minor

Pre-drill EIA for the NELP block MB-OSN-2005/3 (5-Appraisal Wells) 2017
87
disturbance to the marine ecosystem close to point of discharge - treatment/maceration of effluents will
be carried out in compliance with MARPOL 73/78 requirements.
Water currents would also assist dilution and dispersion of discharged material and would
eventually restore oxygen and nutrient levels to background conditions. Impacts on marine water quality
and marine organisms are therefore considered to be significantly low.
DISPOSAL OF BILGE FLUIDS AND DRAINAGE WATER
Bilge and drainage waters generated on Drilling rig have the potential to be contaminated
with oily wastes. Drilling rig will be having designated containment and bounding zones where oil
products will be used and stored. While no wastes will be routinely discharged by deck drains, wash
down of the decks, rig floor, pipe rack,, etc., may result in minor quantities of chemical residues
(primarily oil and grease) entering into the marine environment. Drainage water discharges would
therefore contain very low levels of oil and would be readily dispersed after discharge resulting only in
some minor localized impact on marine species. Bilge fluids generated will be treated on-site on Drilling
rig in water/oil separator.
Effluents of separated oil will be shipped to onshore periodically in special drums/containers
whereas effluent of separated water will be discharged in sea. Concentration of oil in water discharged
will be restricted in accordance with the International Convention for the Prevention of Pollution from
Ships, 1973, as modified by the Protocol of 1978 (MARPOL 73/78). Meeting requirements for disposal
of oil or oily mixtures at sea, any impact arising from discharge of such treated effluent is therefore
considered to be negligible.
DISPOSAL OF KITCHEN & FOOD WASTES
Kitchen & Food waste generated from drilling rig would be macerated (by passing it through
25 mm screen) and discharged directly to water column. Large-scale discharges of organic material can
result in increased biological productivity in the vicinity of the discharge point with a resultant reduction
in dissolved oxygen in receiving waters. Given the limited number of personnel that would be onboard
rig (i.e. maximum 100) combined with the anticipated level of dispersion and mixing of wastes in water
column, it is considered that impacts on marine water ecosystem from discharge of such wastes may
be incrementally positive.

Pre-drill EIA for the NELP block MB-OSN-2005/3 (5-Appraisal Wells) 2017
88
5.1.7 Non Routine Discharges:
Ballast Water Discharges:
The discharge of ballast water from vessels coming into the area can be categorized as a
non-routine discharge and may lead to introduction of exotic species contained in ballast water and
displacement of native species. Discharge of ballast water from Drilling rig and vessels, while in the
area of operations, may also lead to release of low levels of oils and chemicals into marine
environment. Although the probability of ballast water being discharged during the project is considered
to be high, scope of impact will be local with intensity of such impact varying from low to medium.
However, it will be ensured that any discharge of ballast water would be carried out following
international maritime guidance and legal requirements.
5.1.8. MARINE ECOLOGICAL IMPACTS:
Impacts from Physical Presence of Rig
Drilling rig to be utilized for the offshore exploratory project is a floater type of MODU, which
will be locationed at each of the drilling locations. Underwater structures and apparatus like risers will
be sunk from rig to the sea floor to enable drilling operations. It is a well-established fact that such sub-
sea structures can provide new stable areas for marine flora and fauna to colonize. Development of
colonies may in fact be beneficial for the local fish populations. In this event, the structures may attract
marine species to the area as the structures in effect form artificial reefs where fish can seek food,
shelter and protection. Such positive effects have been confirmed by research studies conducted on
fish population near offshore installations. Such studies have revealed that fish growing around the
manned and unmanned installations were found to grow better than those caught at a remote site
unaffected by manmade structures (Mathers et al., 1992b). It was also found that fish caught around
the man-made installations were in good condition with no evidence of lesions or other defects on their
skin (Mathers et al., 1992b).
5.1.9 IMPACT EVALUATION
OPERATIONAL IMPACTS
Offshore rig deployment shall temporarily affect the local seabed habitats and species but the area
affected being a small percentage of the total area of similar habitats in this offshore location and
consequently the loss of areas of muddy/salty habitat is considered to be of low magnitude at a
community ecology level. The magnitude of these changes will be low. Any change to habitat conditions
is anticipated to be small and expected to only slightly alter the conditions and dependent community

Pre-drill EIA for the NELP block MB-OSN-2005/3 (5-Appraisal Wells) 2017
89
structure. Also, the negative impacts of seabed structures on benthic communities are assessed as
being of minor significance. Stages of drilling and their impact on environment as given below
5.2 RIG MOVEMENT AND ANCHORING.
The use of a DP rig (proposed for deep water exploratory drilling) is likely to cause suspension and
movement of sediments and hence may result in damage of suitable habitats in which organisms live.
The perturbations may however not be significant at these depth recovery time is expected to be short.
Additionally, drilling operations will increase the potential for pollution from vessels transporting supplies
and personnel to and from the rig. The resultant pollution is however considered relatively small and
short termed. The physical presence of the rig could be an obstacle to passing ships and an attraction
to roosting birds and may act as a fish aggregating device. On the whole drilling operations are not
expected to have any deleterious effects on the environment.
5.2.1 SPUDDING THE WELL.
Initial drilling into the sea bed (spudding the well), results in the direct discharge to sediments. This
would lead to suspension, movement and relocation of the sediments which may cause destruction of
suitable habitats for some biological organisms and expose fauna to predators and hostile environs.
The sediment suspension and relocation can also lead to the introduction of pollutant materials into the
water column of the area. The amount of pollutant materials will be negligible and the impact is
temporary as the area affected is expected to be localized within a few meters of the activity.
5.2.2 DISCHARGE OF DRILLING MUD AND CUTTINGS
The water based drilling mud and cuttings would have low toxicity with LC 50 > 30,000 mg/l. All the mud
additives also have low toxicity levels. Mud system is a closed circulatory system. Mud coming out from
the well bore with cuttings is passed through solid control equipment (shale shaker, de-sander, de-silter
and mud cleaner) and circulated back into the hole after treating for the rheological parameters. Only
small quantity of mud is wasted during drilling approx. 5% coated with drill cuttings. Un used water
based mud after completion of the drilling is discharged to sea after dilution as per GSR 546 (E).
Experimental studies conducted in various offshore regions indicate that even in bulk discharges
involving 1000 barrels/h, the resultant turbidity in water rapidly decreases with distance leaving very low
suspended matter beyond 100 m in the sea surface. Depending on the quantity of cuttings disposed,
the bottom dwelling organisms may be smothered or be forced to migrate to far distances. Water based
muds may have a relatively high level of organic components which can give rise to an organic
enrichment that can modify the benthic fauna in various levels.

Pre-drill EIA for the NELP block MB-OSN-2005/3 (5-Appraisal Wells) 2017
90
5.2.3 OTHER AQUEOUS DISCHARGES.
Aqueous discharges from rigs are usually from segregated caissons situated either above or below
mean sea level. They include sewage, domestic waters, deck drainage and ballast. Sewage discharges
include sanitary waste and grey water, that is, water from showers, sinks, garbage disposal etc.
Generally, it is assumed that one person produces 0.1 m3 per day of sewage effluent (including
flushing). This is in addition to 0.2 m3 per person per day which is mostly water with traces of edible oils
and soaps. The impacts of such discharges depend on the factors that affect the dispersion and diluting
of such effluents. Close to the point of discharge, the effluent characteristics is dependent on the
discharge density, the flow rate and the ambient water current. At various distances from the point of
discharge, the environmental effects are dependent on recipient environmental conditions in the
particular area including winds, surface and sub-surface currents.
5.3 DIESEL SPILLS.
The likely points of spill for diesel are loading points during ship to rig transfer and leaks from storage
facilities. Diesel is light oil with many aromatic components; as such evaporative losses after a spill will
be very high. Up to 70- 80% of the spilled oil is expected to be lost to evaporation within the first 24
hours of release. Factors that will affect rate of evaporation include prevailing environmental conditions.
5.3.1 BLOW OUTS AND OTHER OIL SPILLS.
Oil spills include base oil, lube oil or crude oil from a blow-out. During well testing operations, an
oil/condensate spill would occur if incomplete burning at the test flare allowed oil droplets to fall into the
sea. A blow out which results in the sudden uncontrolled gushing of oil out of a well is perhaps the most
potentially ecologically damaging of accidents. In such situations, the sea is sprayed with an oil jet for a
period of time until the blow out is controlled. Crude oil spills from blowouts can cover a wide area
depending on the amount spilled. They are less toxic and easily evaporated. The direction of the spill
movement depends upon the ocean surface winds and ocean current speeds. The rest may be
emulsified with wave action and travel in the direction of surface currents. This need to be contained
recovered and safely disposed.
The south west monsoon period (June-September) is the worst period from the point of view of spill
management in which the spill may approach the coast of Andhra Pradesh. The spill may affect the
mangroves and prawn culture being carried out along the coast.

Pre-drill EIA for the NELP block MB-OSN-2005/3 (5-Appraisal Wells) 2017
91
5.4 IMPACT SIGNIFICANCE
Evaluation of impacts signifies the potential impacts in terms of its likelihood nature as per the following
criteria:
1. The impacts are further classified based on their spatial distribution, i.e. local, when impacting
an area of approximately 1 km radius from the project area, moderate spread, when impacting
an area of 1 to 2 km radius and regional beyond 2 km;
2. The impacts are classified as short term, moderate term and long term in terms of their
existence in temporal scale. Impacts less than 1 year existence as short term, while those with
1 to 3 years as moderate term and more than 3 years as long term;
3. The negative impacts are termed as adverse impacts while positive impacts as beneficial;
The significance of environmental impacts of various involved activities has been evaluated based on
the criteria outlined in Table 4.3.
Impact Significance
Criteria
Major Adverse When the impact is of high intensity with high spread and high duration or of high intensity with medium spread and medium duration
Moderate Adverse When the impact is of moderate intensity with high spread and high duration or of high intensity with low/ moderate spread and low duration
Minor Adverse When the impact is of low intensity but with moderate spread and moderate duration or of moderate intensity
Insignificant Adverse When the impact is of low intensity, low spread and low duration
Beneficial When the impacts are positive
Table-4.3: Impact Significance Criteria
Based on the above-specified criteria, Tables 4.4 and 4.5 describes potential environmental impacts
due to exploratory drilling and associated activities, without or with mitigation measures respectively. It
is important to note that one activity may have varying impacts on different receptors i.e. different
components of the environment. To avoid repetitions, this section describes various activities, which
may have wide impacts on many receptors. For example, waste generation and disposal will have
impacts on aquatic ecology, sea water surface, odor nuisance etc, therefore, the impacts of waste
generation and disposal have been considered as one of the key areas of impacts. Similarly, gaseous
emissions may be adverse to air quality; which on exposure may impact upon health of individuals and
ecology in the surroundings.

Pre-drill EIA for the NELP block MB-OSN-2005/3 (5-Appraisal Wells) 2017
92
Sensitivities Environmental
Nature of Likely Impacts
Impact Significance
Low
Inte
nsity
Mod
erat
e In
tens
ity
Hig
h In
tens
ity
Loca
l
Mod
erat
e S
prea
d
Reg
iona
l
Sho
rt T
erm
Mod
erat
e T
erm
Long
Ter
m
Adv
erse
Ben
efic
ial
Insi
gnifi
cant
Min
or
Mod
erat
e
Maj
or
Air Quality
Noise
Water Quality
Sediment Quality
Aquatic Flora
Aquatic Fauna
Local fish population
Local Economy
Note: For color coding refer Table 4.3 Table-4.4: Potential Environmental Impacts of Proposed Project activity
(Without Mitigation Measures)
5.5 IMPACT MITIGATION MEASURES
During the drilling process, the major environmental hazard emanates from the discharge of drilling
wastes and oil spillage from an accidental blowout. Surface spills are considered to be less harmful
than underwater spills. The presence of the rig in the deep sea environment has an overall positive
impact as it can be used as a fish aggregating device. Available environment, information in this area
does not indicate the presence of any protected habitat or endangered species. Compliance with the
existing regulations on the disposal of drilling wastes would reduce their impacts on the environment.
In initial phase of drilling, ONGC will use water based mud which is more eco-friendly due to its low
toxicity and lesser impact upon its discharge into the sea. Chemicals to be used in water based mud
will have LC50 > 30,000 mg/l. Drilling mud after completion of drilling will be used in drilling operations
at other locations. Bulk discharges of drilling fluids are prohibited in offshore except in emergency
situations. Synthetic Oil Based Mud (SOBM) is used to mitigate the specific bottom hole problems.
The SOBM will have low toxicity and meet LC50 > 30,000 mg/l as per mysid toxicity test or toxicity test
conducted on locally available sensitive species. The chemical additives (mainly organic constituents)
used in the preparation of drilling fluid are bio-degradable. Therefore, impact on biological environment
will be minimal.

Pre-drill EIA for the NELP block MB-OSN-2005/3 (5-Appraisal Wells) 2017
93
Drill cuttings generated in the drilling process are naturally occurring earth materials comprising of chips
of sandstone, shale, sand and lumps of clay. Their discharges do not cause significant impact on
marine water column as they settle down to the sea bottom and will not form heaps due to higher water
depths and strong currents. Traces of WBM / SOBM coated on drill cuttings generally disperse in the
water column causing temporary little increase in turbidity in the area of release.
The domestic waste discharges such as galley wastewater and sewage generated in the drilling rig
increase in turbidity in the water column temporarily. Chlorination is done before discharge. However,
drilling rigs has domestic sewage treatment facilities for waste generated from accommodation areas
and the effluent released to the sea will meet standards prescribed by MARPOL.
Some quantity of waste oil generated from the machinery of the drilling rig is of concern for its disposal.
Any disposal of waste oil into the sea is prohibited as per Merchant Shipping Act as well as
Environment Protection Act and all oily discharges will be treated to the required standard. The spent
oil will be brought to shore and disposed to authorized recyclers.
Various types of solid wastes are generated on drilling rigs from accommodation area and process
operations. Apart from being aesthetically undesirable, some wastes such as plastic are not
biodegradable and accumulate on the sea floor when released to the sea, causing nuisance to benthic
organisms. These wastes are not allowed to be disposed at sea. The food wastes from the kitchen,
degradable materials like paper etc. however, form food for marine biota, hence allowed to be
discharged in the sea. The impact of drilling operations on fisheries or fishing activities is considered
insignificant as these block is 28-250 km away from the coast.
5.5.1 AIR ENVIRONMENT
Offshore receptors such as fishing vessels and commercial shipping are unlikely to be exposed to poor
quality air other than for very short durations, for example if sailing very close and downwind of the site
during flaring.
Mitigation of air emission impacts is done through:
Good operational controls and high level of monitoring shall be built into the design
operational aspects of the project.
Regular maintenance of engines and generators shall be done to keep the environment
impact minimum.
Existing and the proposed DG Sets will comply with the applicable emission norms.

Pre-drill EIA for the NELP block MB-OSN-2005/3 (5-Appraisal Wells) 2017
94
Scrubbers will be provided to minimize the emissions and to maintain the emissions within
the prescribed limits.
Regular monitoring of emissions (from all DG Sets) and ambient air quality will be carried
out as per norms.
Emissions during transportation shall be minimized by ensuring regular maintenance of the
vessels.
Stack height shall be maintained to the optimum levels
5.5.2 WATER ENVIRONMENT
Bulk discharge of drilling fluid in offshore is prohibited except in emergency situations. Water
Based Mud WBM will be recycled to the maximum extent. Unusable portion of WBM will be
discharged offshore into sea intermittently, at an average rate of 50 bbl/hr as per G.S.R. 546
(E), dated 30/08/05, so as to have proper dilution and dispersion without any adverse impact
on marine environment.
Use of only low toxicity chemicals shall be ensured on board.
Sewage will be treated on-board of the rig as per MARPOL regulations. Residual chlorine of
the treated sewage shall not exceed 1mg/L before disposal.
Oily wastewater from deck washing, drainage system, bilges etc will be treated using on board
oil traps and will be disposed to sea as per norms laid by CPCB/APPCB. According to
MARPOL regulations the discharge of oil content (without dilution) into sea shall not exceed 15
ppm.
Adequate well management shall be ensured during well completion activities to minimize
produced water production.
Oil drilling operators shall maintain daily record of discharge of drill cutting & drill fluid to
offshore and also to monitor daily the effluent quality.
In case of oily cuttings, they will be transported on shore for appropriate disposal.
5.5.3 IMPACT ON BIOTA
All precautionary measures shall be adopted to minimize disturbance to the marine animals due to
deployment and operations of offshore wells. The baseline information on existing marine species in the
area shall be obtained from state/district/regional level authorities and other sources in an effort to
reduce the potential adverse impacts of the project and future activities on marine species.

Pre-drill EIA for the NELP block MB-OSN-2005/3 (5-Appraisal Wells) 2017
95
5.5.4 OCCUPATIONAL HEALTH HAZARDS FROM NOISE POLLUTION
Site workers working near high noise equipment will use personal protective equipment to minimize
their exposure to high noise levels. Good working practices will be implemented to reduce noise impact
on the health and environment.
5.5.5 NOISE IMPACTS DUE TO DRILLING ACTIVITIES
Mobile noise sources such as rig and vessels shall be routed in such a way that there is
minimum disturbance to receptors.
Avoid loud, sudden noises, wherever possible. Integral noise shielding shall be used where
practicable and applicable.
Rubber padding/noise isolators shall be provided at equipment/machinery used during the
project activities.
Regular maintenance of all equipment and transportation vessels shall be ensured. Idling of
vessels or equipment shall be avoided when not in use.
5.5.6 WASTE GENERATION AND MANAGEMENT
The site would develop and adopt proper system for the management, storage and disposal of the
hazardous and non-hazardous waste, for example measures such as:
Solid waste including domestic waste (from kitchen, gallery, laundries etc), combustible and
recyclable waste shall be collected, segregated and stored in specified containers and shall be
transferred to authorized contractors for their disposal.
Hazardous waste such as medical waste, waste lube/system oil from machinery, used oil from
generator sets shall be handled as per Hazardous Wastes (Management, Handling and Trans-
boundary Movement) Rules, 2008. The waste will be carefully stored in drums and transported
to MoEF approved recyclers for its final disposal. All precautions will be taken to avoid spillage
from the storage.
Based on foregoing discussion on mitigation measures the impact matrix Fig: 4.4 & 4.5 on comparison
it may be noticed that preventive measures have contributed for the reduction of impacts and risks due
to drilling activities

Pre-drill EIA for the NELP block MB-OSN-2005/3 (5-Appraisal Wells) 2017
96
Environmental
Sensitivities Nature of Likely Impacts Impact Significance
Lo
w In
ten
sity
Mo
der
ate
Inte
nsi
ty
Hig
h In
ten
sity
Lo
cal
Mo
der
ate
Sp
read
Reg
ion
al
Sh
ort
Ter
m
Mo
der
ate
Ter
m
Lo
ng
Ter
m
Ad
vers
e
Ben
efic
ial
Insi
gn
ific
ant
Min
or
Mo
der
ate
Maj
or
Air Quality
Noise
Water Quality
Sediment Quality
Aquatic Flora
Aquatic Fauna
Local fish population
Local Economy
5.5.7 RESPONSE OF MARINE ECOSYSTEMS TO OIL SPILLS.
The response of marine ecosystems to oil spills is given special consideration since oil spills are
identified as potentially most deleterious to the environment. Crude oil is a very hydrophobic mixture
and therefore does not mix well with water. When both mix, small oil droplets tend to disperse into the
aqueous phase. The large droplets quickly return to the surface oil slick while the smaller droplets
remain in the water. Some water is incorporated into the oil layer in the form of water-in-oil emulsion. At
the same time, its hydrophobic nature causes crude oil to be adsorbed to particulate matter in seawater
and to quickly sediment with it to the bottom. Petroleum hydrocarbons associated with sediments are
also known to be more persistent and to cause more harm than hydrocarbons in the water column.
5.6 RESOURCE SENSITIVITY ASSESSMENT.
The variability in season and geography related to physical-chemical attributes of the marine
environment affect all marine life. As a result, marine organisms may exhibit varying degrees of
ecological adaptation to changing conditions of their existence. With respect to oil spills, the major
concerns in biological resource sensitivity assessment were abundance, initial mortality, population

Pre-drill EIA for the NELP block MB-OSN-2005/3 (5-Appraisal Wells) 2017
97
perturbation, fate of survivors and potential for population recovery. The following biological species
within the open sea area are thus considered most sensitive to spilled oil.
Plankton: Some crude components are deleterious to a wide range of planktonic organisms. However,
they have a high recovery potential which reduces any significant impacts to their populations. Impacts
to plankton are usually limited to very transient effects in the vicinity of the spill release point.
Fish: Adult fish exhibit avoidance behavior initiated by the smell of hydrocarbons. This reduces the risk
to them as a result of exposure to oil. The fish eggs and larvae on the other hand are a lot more
sensitive as single individuals.
Seabird: The most important factors in seabird damage evaluation are; abundance and diversity,
molting and migration patterns. While marine birds can suffer major damage from oil spills in the near
shore areas, diving birds are the most affected as they live on the surface of the sea and dive for food.
As they dive into floating oil they become covered in it. Also during oiling plumage air is replaced by
water causing reduced insulation and buoyancy. Migratory birds may be less vulnerable due to absence
at time of spill but non-migratory birds are hard hit with the possibility of a colony facing elimination.
Marine Mammals: Contact of these mammals with oil could be injurious particularly during breeding
period.
Deep Sea Benthos: Long term studies at a number of oil spill sites where hydrocarbons have remained
in the sediments have shown amongst others, effects from residue accumulation on behavior in certain
benthic species. The effect on benthic communities covers a small area and damage is reversible if
contamination stops. Several studies of oil spills in different parts of the world show that different
environments have different recovery rates. Generally, open water oil spills are not known to cause
excessive adverse effects on water column organisms. Hence the open waters are not considered a
sensitive habitat. The effect of oil spilled at sea may be substantial during the spill, but recovery is very
rapid and after effects minimal. This is further confirmed by the results of the oil spill drift and
weathering simulations which predict substantial evaporation of the oil spilled at sea within a relatively
short time.
Sensitivity of Coastal Communities: Deep water drilling locations as proposed in this project are 28-
350 km away from the east coast of India. Impact of oil spill on coastal communities will be minimal if
oil spill contingency plan is activated in time prevent its spread.
Fire and Explosion: Where there is appropriate source of heat and fuel, there is a potential for fire
outbreak. Thus, drilling activities have a high potential for fire outbreak.

Pre-drill EIA for the NELP block MB-OSN-2005/3 (5-Appraisal Wells) 2017
98
Chapter-6 ENVIRONMENTAL MANAGEMENT PLAN
Impacts of physical, chemical and biological changes arising from interaction of drilling operation with
marine environment are to be mitigated by adopting industry specific standards, guidelines and
prevailing regulatory requirements. Environmental monitoring helps in detecting changes in the
environment resulting from discharges from oil & gas drilling operations, Environment Management
Plan provides a delivery mechanism to address the adverse environmental impact of a project during its
execution. It aims at mitigating potential impacts associated with exploratory drilling activity based on
baseline data. To develop EMP, the effects of the following due to offshore exploratory drilling and
contingency plans to mitigate / avoid these impacts are described in this chapter.
1. Physical presence of drilling rig and movement of associated vessels (MSV/OSV)
2. Emissions and discharges from actual drilling operations
3. Blowout and Oil spill combatment
4. Occupational Hazards
5. H2S emission
6.1 PHYSICAL PRESENCE OF DRILLING RIG AND MOVEMENT OF VESSELS
The drilling rig and associated MSV/OSV‘s may cause disruption to marine traffic and fishing during
mobilization and de-mobilization. To prevent this, ONGC issues notice to concerned authorities /
marine users. Consultations are held with the Ports and Harbor authorities and local fishing
communities about ONGC‘s operations. Information on the scheduling of the rig movements, routes,
exclusion zones and durations are furnished. Any change in the program is informed well in advance to
the concerned authorities. Proper records of consultations are maintained.
6.2 EMISSIONS AND DISCHARGES FROM DRILLING OPERATIONS
6.2.1 ATMOSPHERIC EMISSIONS:
Burning of HSD for generating power for the drilling operations, results in the emission of SO2, NOx,
CO, particulates and hydrocarbons in to the atmosphere. Emissions from diesel gensets (SO2, NOx,
CO, Particulates and possibly hydrocarbons) are likely to occur. However, with the prevailing wind
speeds in open sea the dispersion of air pollutants will be very high and will not accumulate in the
vicinity of the working area of the rig. Measures to ensure minimal impacts include:

Pre-drill EIA for the NELP block MB-OSN-2005/3 (5-Appraisal Wells) 2017
99
Adequate stack height of the DG sets and its placement at safe distance from working area
Appropriate management of power generation
Use of low Sulphur diesel oil (120 ppm Sulphur content)
Fugitive emissions of VOC‘s from diesel fuel to be reduced by appropriate storage and
handling
6.2.2 NOISE LEVELS AND NOISE ABATEMENT
Noise levels will generally remain in permissible limits within short distance from the source. However,
the following mitigation measures are followed;
Acoustic enclosures for all generators
Exhausts are provided with silencers
Operators / personnel working near the high noise source at the rig shall be Provide with
earmuffs and earplugs etc.
Deployment of drilling crew in high noise area for short duration.
6.2.3 MARINE DISCHARGES
The offshore drilling rig generates two major and four minor waste streams. These include:
Major discharge
Unused Drilling fluid
Drill cuttings
Minor discharge
Sanitary waste,
Domestic waste and
Well fluid and deck drainage
Drilling Fluids
Drilling fluids are mostly water based and in the event of specific hole problem synthetic oil based mud
(SOBM) are used in exploratory drilling to maintain hydrostatic pressure control in the well and to
lubricate the drill bit. Drilling fluid system is circulatory system and mud coming out from the well is
passed through solid control equipment and treated and re-circulated into the well. Only small portion of
the mud is wasted during drilling along with cuttings and solid control equipment. Non-usable portion
will be discharged intermittently (50 bbl/hr) in sea with proper dilution as per GSR 546 (E). SOBM ( if

Pre-drill EIA for the NELP block MB-OSN-2005/3 (5-Appraisal Wells) 2017
100
used) will not be discharged into sea, completely recycled and reused after completion of the well it will
be transported to the new location. A unit to this effect has been developed at Nhava Supply base.
Drill Cuttings
The drill cuttings removed from the well are rock debris and mineral particles generated by drilling into
the underground formation, are separated at shale shaker and washed thoroughly before discharging to
sea. Cuttings generated while drilling 36‖ & 17-1/2‖ hole size will be discharged to sea bed whereas
cuttings from 12-1/4‖ & 8-1/2‖ hole size will be discharged to sea surface in a phased manner. Impact of
cuttings along with associated water based mud will be reduced significantly due to dilution effect and
wave currents.
Proposed control measures for reducing the wastage of drilling mud and disposal of drill cuttings
include:
Efficient maintenance of solid control equipment to minimize mud waste.
Proper maintenance of valves / flanges of mud tanks and mud circulation
Systems to reduce risks of leaks.
Strict adherence to standard operational procedures of the rig.
Thoroughly washed drill cuttings separated from WBM / SOBM will be discharged into sea intermittently
at an average rate of 50 bbl/hr as per GSR 546 (E) from the rig, so as to have proper dilution and
dispersion without any adverse impacts on marine environment. The water depths in these block varies
from 250 m to 3100 m therefore, the impact of disposal of drill cuttings on sea bed will be minimal.
Domestic waste
Kitchen waste is separated into bio-degradable and non-biodegradable components. Non-
biodegradable waste (plastic, glass and metal etc) is packed, labeled and sent to Base for further
recycling / safe disposal. The biodegradable garbage separated from other domestic wastes, will be
ground in a crushing machine and dumped overboard in biodegradable jute bags. The other solid
wastes will be collected, compacted and stored in containers or placed in special metal baskets or
plastic bags for transport to onshore.

Pre-drill EIA for the NELP block MB-OSN-2005/3 (5-Appraisal Wells) 2017
101
SANITARY WASTE: Sanitary waste is treated in the sewage treatment plants on board of the drilling
rig and disposed to sea after maintaining the required disposal parameters. Waste water generated is
expected to be approximately 20 M3 (0.22 m³/day/person grey water and 0.11 m³/Day / person for Black
water for 50-60 persons)
The following criteria are strictly followed before disposing to sea:
Suspended solid : 30-40 mg/l or less
Coliform count : 200 /100 ml
Residual Chlorine : 1 PPM.
Well fluid and deck drainage
Produced water during well testing operation, deck floor washings and spent oil etc., are the hazardous
waste generated during the offshore drilling. Produced water which is generated during production
testing is treated in the produced water handling system where oil is separated and water is disposed to
sea after meeting the standards (oil content < 40 ppm). Spent oil is collected, labeled and sent back to
base for further safe disposal through authorized recyclers. Deck drainage is collected and treated
separately for oil removal by gravity separation before discharge.
6.3 OIL SPILL CONTINGENCY PLAN
During exploration and production of hydrocarbon oil and oil-based products are accidentally spilled into
sea. This poses risks to human health and environmental quality. Every effort must be made to
prevent oil spills and to clean them up quickly.
The entire offshore facilities are designed, installed and operated in such a way, so as to minimize
possibility of any oil spills. Facilities and resources supplied by outsourced agencies also meet
international pollution prevention design and operation standards. Oil spill risks are identified and
measures to prevent and contain oil spill have been outlined in contingency plan given below;
To establish response procedures for oil spills
To combat, contain, recover, clean up and dispose off the spilled oil
To provide training and drill schedule for keeping the system in place and
To meet statutory requirements.
Activation of plan starts with notification of ―Oil spill‖ and spill assessment. Immediate action is taken to
disconnect the source. Further action is taken based on Short Term and Long Term strategies for spill
combatment.

Pre-drill EIA for the NELP block MB-OSN-2005/3 (5-Appraisal Wells) 2017
102
STRATEGY DURING FIRST SIX HOURS:
Depending upon nature of emergency at sea and weather conditions booms will be laid around source
of spill for containment. Recovered oil will be stored for further disposal as per laid down procedures.
If some quantity of oil has spread prior to deployment of booms or some oil has slipped away during
containment and recovery process, following factors will be taken into consideration prior to taking
decision on application of dispersant:
a) Spilled oil shall not be more than 4 hours old.
b) Oil is moving towards shoreline.
c) Spilled crude characteristics are amenable to use of dispersants.
d) Prevailing weather conditions are conducive to dispersant applications.
Prior approval from Coast Guard for use of dispersant will be obtained.
Spraying of Dispersants:
During rough weather, monsoon, low visibility or in case of delayed deployment of equipment, the
spraying of dispersants is considered one of the options, because this strategy needs very less reaction
time (resource mobilization time) and can be initiated by the boat /vessels crew operating in that area.
Spray of dispersants can be done through Helicopters also. Response equipment such as Containment
Booms will be deployed for protection of Godavari river estuary, mangroves, shrimp farms and other
sensitive areas such as river mouths to deflect spills towards other areas of the shoreline where it shall
cause less harm to the environment.
SHORE CLEANUP
Despite best efforts to contain and recover spilled oil, there is always a likelihood of spilled oil reaching
shorelines. Shoreline cleanup technique will be practiced for the left over oil as per topography of the
coastline.

Pre-drill EIA for the NELP block MB-OSN-2005/3 (5-Appraisal Wells) 2017
103
OIL SPILL RESPONSE MANAGEMENT PLAN
If Minor If Major
With no chance of presently small,
Aggravation but can Aggravate
MONSOON CONDITIONS (SOUTH WEST AND NORTH EAST)
Day Time Operations: In SW monsoon, especially in the month of May & June, the sea conditions are
pretty rough, winds are strong, heavy rainfall reduces the visibility, and operation of smaller vessels
becomes difficult. Observation / tracking of oil slick become much more difficult and hence, deployment
Oil Spill Observed Installation Manager
IC
by (OIC /OOM)
FPU
Inform ED-Asset
Manager (EOA)
Establish Severity of Spill
Handle
emergency and
close out
Through ECR, Inform
CG
ECR to organize further
actions
Respond to Emergency
Mobilize Emergency Teams
Mobilize Other Resources
Monitor & Record details
Incident resolved?
Inform ECR ECT
Leader ECT
Yes No
Collect and collate all Logs
Stand Down ERT
Prepare Log of Events and
Report on emergency
Inform OSC to take
charge
Board
C & MD
Activate OSR
Activities
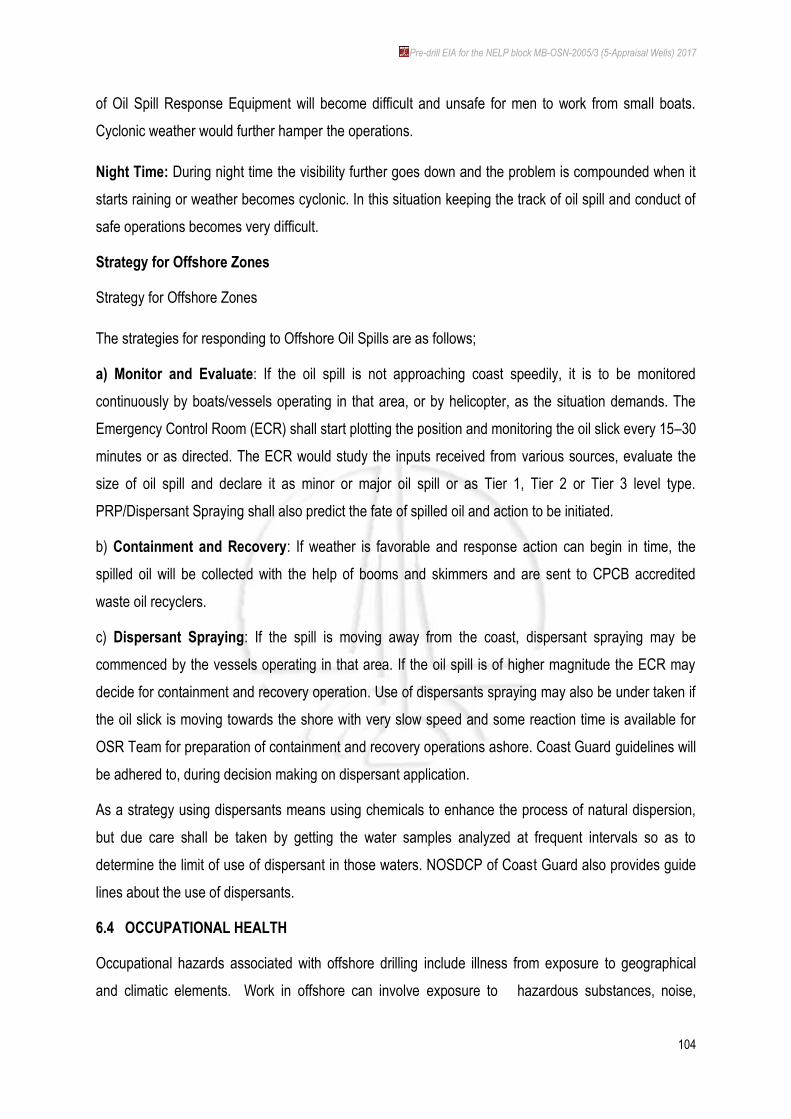
Pre-drill EIA for the NELP block MB-OSN-2005/3 (5-Appraisal Wells) 2017
104
of Oil Spill Response Equipment will become difficult and unsafe for men to work from small boats.
Cyclonic weather would further hamper the operations.
Night Time: During night time the visibility further goes down and the problem is compounded when it
starts raining or weather becomes cyclonic. In this situation keeping the track of oil spill and conduct of
safe operations becomes very difficult.
Strategy for Offshore Zones
Strategy for Offshore Zones
The strategies for responding to Offshore Oil Spills are as follows;
a) Monitor and Evaluate: If the oil spill is not approaching coast speedily, it is to be monitored
continuously by boats/vessels operating in that area, or by helicopter, as the situation demands. The
Emergency Control Room (ECR) shall start plotting the position and monitoring the oil slick every 15–30
minutes or as directed. The ECR would study the inputs received from various sources, evaluate the
size of oil spill and declare it as minor or major oil spill or as Tier 1, Tier 2 or Tier 3 level type.
PRP/Dispersant Spraying shall also predict the fate of spilled oil and action to be initiated.
b) Containment and Recovery: If weather is favorable and response action can begin in time, the
spilled oil will be collected with the help of booms and skimmers and are sent to CPCB accredited
waste oil recyclers.
c) Dispersant Spraying: If the spill is moving away from the coast, dispersant spraying may be
commenced by the vessels operating in that area. If the oil spill is of higher magnitude the ECR may
decide for containment and recovery operation. Use of dispersants spraying may also be under taken if
the oil slick is moving towards the shore with very slow speed and some reaction time is available for
OSR Team for preparation of containment and recovery operations ashore. Coast Guard guidelines will
be adhered to, during decision making on dispersant application.
As a strategy using dispersants means using chemicals to enhance the process of natural dispersion,
but due care shall be taken by getting the water samples analyzed at frequent intervals so as to
determine the limit of use of dispersant in those waters. NOSDCP of Coast Guard also provides guide
lines about the use of dispersants.
6.4 OCCUPATIONAL HEALTH
Occupational hazards associated with offshore drilling include illness from exposure to geographical
and climatic elements. Work in offshore can involve exposure to hazardous substances, noise,

Pre-drill EIA for the NELP block MB-OSN-2005/3 (5-Appraisal Wells) 2017
105
vibrations, hot or cold conditions, heavy manual handling activity on the derrick floor etc. Drilling rigs
especially in deep water drilling are isolated, workforce travels to work by helicopter and perform shift
duties. Extended long distance travelling, psychological stress resulting from physical isolation due to
remoteness of site and shift duty pattern, sea sickness and exposure to extreme weather conditions are
other hazards. Harsh climate, parasitic diseases and infections may result in respiratory tract diseases.
On board qualified doctor is available 24 hrs. on the drilling rig for the immediate treatment and first
aid. For serious injuries and diseases patient is evacuated by the emergency Helicopter exclusively
meant for emergencies to the nearest base.
OCCUPATIONAL HEALTH HAZARDS
Occupational health hazards identified during drilling operation are given below:
Chemical Hazards
Noise Hazards
Radiation Hazards
Illumination Hazards
Vibration Hazards
Temperature Extremes
Biological Hazards
Ergonomic Hazards
Stress related Hazards
HEALTH HAZARD CONTROL IS DONE BY ADOPTING FOLLOWING MEASURES
Prioritize the health hazards based on their risk potential.
Identify specific work groups affected by each hazard.
Determine the controls required to manage these identified hazards. The cost of each identified
control versus benefits of its implementation may be evaluated.
Develop an action plan identifying work to be done
The health and hygiene of the personnel working at the Drilling Rig will be monitored through periodic
health checks of the persons. All employees undergo a periodic medical examination (PME). The
record of the health checkup will be maintained centrally off site in confidential file by the medical
section. The medical officer at base recommends appropriate treatment for the persons found to be
having any health problems requiring attention.
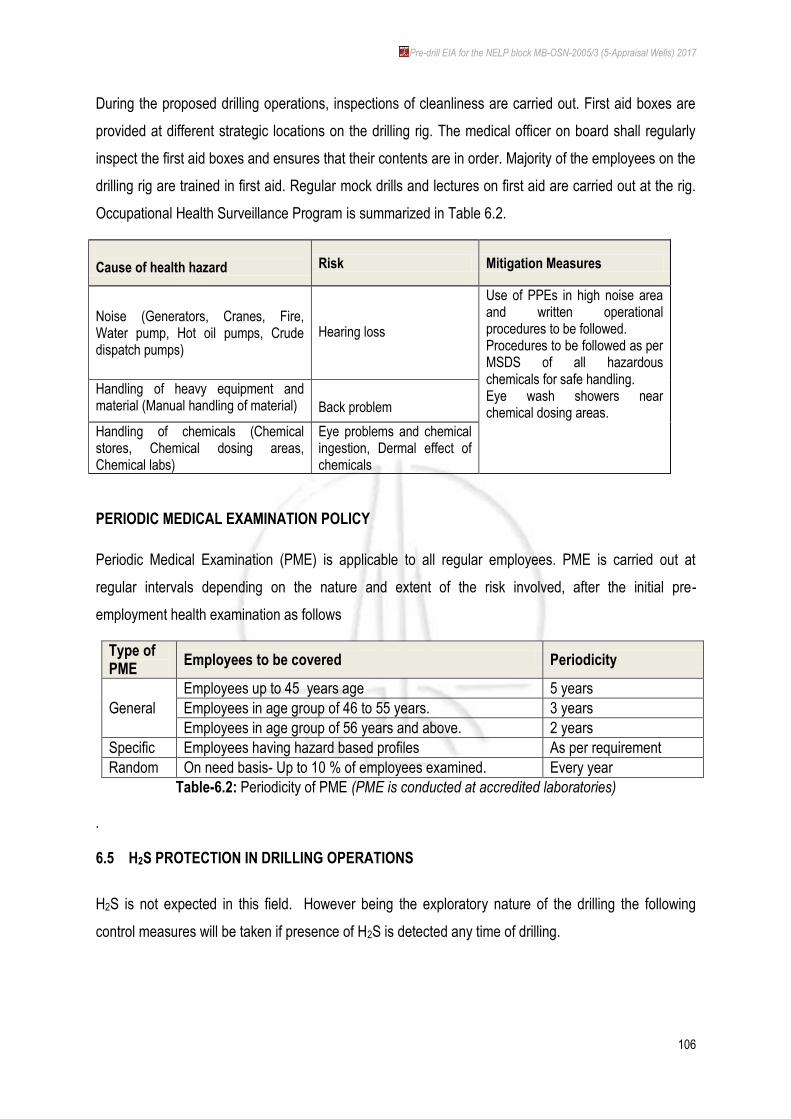
Pre-drill EIA for the NELP block MB-OSN-2005/3 (5-Appraisal Wells) 2017
106
During the proposed drilling operations, inspections of cleanliness are carried out. First aid boxes are
provided at different strategic locations on the drilling rig. The medical officer on board shall regularly
inspect the first aid boxes and ensures that their contents are in order. Majority of the employees on the
drilling rig are trained in first aid. Regular mock drills and lectures on first aid are carried out at the rig.
Occupational Health Surveillance Program is summarized in Table 6.2.
Cause of health hazard Risk Mitigation Measures
Noise (Generators, Cranes, Fire, Water pump, Hot oil pumps, Crude dispatch pumps)
Hearing loss
Use of PPEs in high noise area and written operational procedures to be followed. Procedures to be followed as per MSDS of all hazardous chemicals for safe handling. Eye wash showers near chemical dosing areas.
Handling of heavy equipment and material (Manual handling of material)
Back problem
Handling of chemicals (Chemical stores, Chemical dosing areas, Chemical labs)
Eye problems and chemical ingestion, Dermal effect of chemicals
PERIODIC MEDICAL EXAMINATION POLICY
Periodic Medical Examination (PME) is applicable to all regular employees. PME is carried out at
regular intervals depending on the nature and extent of the risk involved, after the initial pre-
employment health examination as follows
Type of PME
Employees to be covered Periodicity
General
Employees up to 45 years age 5 years
Employees in age group of 46 to 55 years. 3 years
Employees in age group of 56 years and above. 2 years
Specific Employees having hazard based profiles As per requirement
Random On need basis- Up to 10 % of employees examined. Every year
Table-6.2: Periodicity of PME (PME is conducted at accredited laboratories)
.
6.5 H2S PROTECTION IN DRILLING OPERATIONS
H2S is not expected in this field. However being the exploratory nature of the drilling the following
control measures will be taken if presence of H2S is detected any time of drilling.

Pre-drill EIA for the NELP block MB-OSN-2005/3 (5-Appraisal Wells) 2017
107
H2S DETECTION SYSTEM PRESENCE
A four channel H2S gas detection system will be provided. Sensors will be positioned at optimum
points for detection, actual locations being decided onsite but likely to be: Well Nipple, Rig flour, Shaker
Header tank and Substructure cellar pit:
The detection system will be connected to an audio visual (siren and lights) alarm system. The two
levels of alarm are as follows:
10 ppm H2S low level alarm triggers a light signal but does not indicate danger for all. Persons
are required to stand by to check the installation after announcement on public address system
(PA) by the tool pusher, otherwise, to proceed to the upwind side.
20 ppm H2S high level triggers a sound alarm and also red light on the control panel.
Emergency alarm is sounded by two short rings of bell intermittently. This requires breathing
equipment to be used immediately and the hazard area to be vacated unless announcement on
Public Address System (PA) by the tool pusher provides other instructions.
The mud logging will have a completely independent detection system which is connected to an alarm
in the cabin. This system will be adjusted to sound an alarm at a concentration level of 10 ppm as
suggested in the Drilling and Production Safety code for onshore operations issued by the Institute of
Petroleum.
A stock of H2S scavenger will be kept at drilling site for emergency use.
Visual Warning Signs
In case of high level H2S alarm, the following warning signs will be displayed to alert helicopter and
vessels in the vicinity of the drilling rig.
Red flag 90cm X 60 cms on each side of the rig.
Danger boards painted yellow with black lettering 30 cms high indicating "DANGER H2S".
Muster stations and escape routes
Since H2S is heavier than air, it is likely to settle down at lower levels particularly in still air or in
light winds and cut off the natural escape route to the boat landing; this situation gives rise to
the following requirements:
Sufficient stair cases on the upwind side of prevailing winds for escape route up the stairs or
down to the lifeboat.

Pre-drill EIA for the NELP block MB-OSN-2005/3 (5-Appraisal Wells) 2017
108
Muster stations for operating personnel in the event of gas alarm, areas in the open on the
upper deck which can be kept free of H2S by the wind.
Ventilation
Forced air ventilation to disperse any accumulation of H2S will be provided by fans (bug blower) at the
following points:
Shale shaker
Mud tanks
Derrick floor
If higher levels of H2S >10 ppm are found following steps will be taken.
Driller will shut down rotary and pumps pickup so that drill pipe in BOP and chain down the
break.
One pre-assigned rough neck will go to doghouse and put on breathing apparatus. All other rig
personnel will evacuate the rig and move in up-wind direction to designated muster point.
Driller and rough neck will return to the rig floor and commence circulating H2S scavenger
slowly and reciprocating pipe.
The level of H2S will be checked in all work areas. H2S scavenger will be added to the mud
and circulated. If H2S levels drop, drilling will be continued with scavenger-I the mud.
Approximately 30% of hydrogen peroxide (H2O2) solution will neutralize H2S gas in the mud at
20 gallons of H2O2 per 100 barrels of mud.
The workers will be provided with personal H2S detectors along with self-containing breathing
apparatus.
CONTROL MEASURES
H2S will cause a sudden drop of mud pH. The mud man will therefore organize and supervise
continuous pH checks while drilling. Checks should be as frequent as possible and always made
following a formation change.
Following control measures will be taken in case of small levels of H2S detection.
H2S scavenger will be added to mud
H2S levels will be checked at regular intervals for possible increase
All personnel of the rig will be informed about the presence of H2S and current wind direction
Operation will be commenced in pairs

Pre-drill EIA for the NELP block MB-OSN-2005/3 (5-Appraisal Wells) 2017
109
Sub base and cellar out of bounds will be rendered without further checking levels in this area
The workers will be provided with personal H2S detectors along with SCBA.
H2S KICK CONTROL
The control of H2S kick may be achieved either by bulldozing gas back into formation or circulating
it out. The actual method to be adopted will depend upon the condition of the well. When a gas
kick occurs, estimate the quantity of H2S present taking adequate precautionary measures of
wearing self-contained breathing apparatus (SCBA). The following procedure will be adopted:
Close BOP, monitor SIDPP, SICP & pit gain.
If the concentration is high and cannot be circulated out due to H2S hazard in
atmosphere, bulldoze the gas into formation by pumping through kill line.
Raise mud wt. and pH as required.
Load H2S scavenger like zinc carbonate and ironite sponge as may be necessary in
the active mud pit.
Circulate the gas through choke and degasser and burn off the gas.
The following factors will also be kept in view:
All persons on the drilling floor, shale shaker area, mud pump and tank should put on self-
contained breathing apparatus when the kick is to be circulated out.
Persons who are not required for the control operation will be withdrawn to a safe area, where
adequate ventilation is arranged.
Frequent checks with portable H2S gas detector will be made.
Supply vessels (in case of Offshore) should stay upwind on power and maintain continuous
radio and visual watch.
6.6 SUMMARY OF ENVIRONMENTAL MANAGEMENT PLAN
Marine Environment
Low toxicity WBM, having 96 h LC50 > 30000 mg/l will be used
The water based drilling muds will be re-cycled and reused to maximum extent.
Drill cuttings, thoroughly washed and separated from WBM, will be discharged to the sea
intermittently as per GSR546 ( E ).

Pre-drill EIA for the NELP block MB-OSN-2005/3 (5-Appraisal Wells) 2017
110
In order to mitigate the specific hole problem, Synthetic oil based mud (SOBM) with low toxicity of
96 h LC50 > 30,000 mg/l as per mysid toxicity test or toxicity test conducted on locally available
sensitive species will be used.
Waste water generated on drilling rigs is treated as per MARPOL and CPCB guidelines, before
disposal to the sea. Modular treatment plants are available for on board to treat domestic
wastewater.
As discharge of waste oil into the sea is prohibited, oily wastes is collected and sent to base for
disposal.
Emissions from DG sets are controlled through efficient maintenance and stack heights.
Barite in drilling fluids contains < 1 mg/kg Mercury and < 3 mg/kg Cadmium.
The biodegradable garbage separated from other domestic wastes, is grounded in a crushing
machine, filled into Jute bags and discharged in sea. The non-biodegradable solid wastes is
collected, compacted and stored in containers, or placed in special metal baskets or plastic bags
for transport to onshore facilities.
Sewage is treated at the facilities available at the rig and chlorination of treated sewage is done to
achieve 1 mg/l residual chlorine before discharging into sea.
The left over drilling fluids after drilling is completed will be transported next site for reuse. SOBM
mud is always recycled and not discharged in to sea whereas only non-usable WBM is occasionally
discharged into sea with proper dilution as per guidelines.
Based on risk assessment studies it is suggested that during drilling activity, fishing should be
restricted to 500 m zone from the drilling locations.
Oil spill contingency plan exists to combat any accidental spills or blowout
Air Environment
All equipment would be operated within specified design parameters during drilling operations.
The DG set emissions meet standards stipulated by CPCB.
Any dry, dusty materials (chemicals), mud etc. are stored in bags or sealed containers.
Quantity of flared gas during well testing is kept minimum and restricted to the short duration.
H2S detection system will be installed at optimum points for detection like: Well Nipple, Rig flour,
Shaker Header tank and Substructure cellar pit.
Noise Environment
Noise barriers / shields are provided around the high noise units wherever possible.
Use of ear muffs / plugs and other protective devices are provided to the workforce.
Acoustic enclosures around high noise sources are provided depending on the size of the unit.

Pre-drill EIA for the NELP block MB-OSN-2005/3 (5-Appraisal Wells) 2017
111
Chapter 7
ANALYSIS OF ALTERNATIVES (TECHNOLOGY & SITE)
ONGC as an integrated oil and gas Corporate has developed in-house capability in all
aspects of exploration business i.e., Acquisition, Processing & Interpretation (API) of Seismic data,
drilling, work-over and well stimulation operations, engineering, construction, production, processing,
refining, transportation, marketing, applied R&D and training, etc. Wherever possible alternatives with
respect to rig, mud, on-site support base, and drilling locations are considered and best possible option
is selected.
7.1. DRILLING LOCATIONS
The main objective of the exploratory drilling in block MB-OSN-2005/3 is to identify the block
area that contains oil and/or gas. The prospective drilling areas for the block is selected on the basis of
the 3D seismic survey. Based on the interpretation of 3D seismic data (acquisition ensued), specific
drilling locations are finalized. Before finalization of drilling locations information on the stability of
surface sediments and potential subsurface hazards (e.g. shallow gas formations) are gathered to
ensure the rig not to encounter problems when positioning or drilling the surface hole.
MoEF, through its ToR for this block, has asked ONGC for commitment on no drilling within
1 km from coastline. The exploratory drilling locations in the block MB-OSN-2005/3 is over 157 km from
the coast, thus MoEF requirement/ stipulations are met with spontaneously.

Pre-drill EIA for the NELP block MB-OSN-2005/3 (5-Appraisal Wells) 2017
112
Chapter 8
ENVIRONMENTAL MONITORING PROGRAM
Monitoring is one of the most important components of a management system. ONGC‘s
IMS (Information Management System) requires continuous monitoring to be carried out for
environmental, safety and health impacts and the performance of EMP implementation, etc. Monitoring
indicators have been developed for each of the activities considering the mitigation measures
proposed. Real time measurements of these indicators will be carried out during drilling and data will be
submitted to MoEF as per statutory requirements of MoEF.
ONGC is required to record daily discharge of drill cuttings & drilling fluids in sea and also to
monitor the effluent quality. Compliance report will be prepared and it will be submitted to MoEF on 6
monthly basis or as per the conditions specified by MoEF.
Monitoring results would be documented, analyzed and reported internally to Offshore
Drilling Supervisor, Wells Operations Manager and HSE Coordinator. Monitoring requirements have
been described in the following Table 8.1. Frequency of monitoring and responsibility of carrying out the
monitoring have also been presented in the table.
TABLE 8.1: ENVIRONMENTAL MONITORING PROGRAM
Sr.
No. Particular Criteria/Regulation
Parameter to be
monitored
Frequency
of
Monitoring
Responsibility
1
Lo
cati
on
of
dri
llin
g w
ells
ONGC shall be drilling the
exploratory wells much
beyond 5 km from the coast
(nearest being 42 km SSW,
thus meeting the MoEF
requirement.
Drilling locations Once before
start of drilling
activity.
Drilling HSE
Team
2
Qu
alit
y o
f se
a w
ater
Physico-chemical
characteristics of marine
surface water
Physical parameter – pH,
Salinity, temperature,
Chemical parameter – Oil
& Grease, Total
Petroleum, Hydrocarbons
(TPH), Petroleum
Aromatic Hydrocarbons
(PAHs)
Once in 24
hrs.
if no toxicity is
found, then
once in a
week.
Drilling HSE
Team

Pre-drill EIA for the NELP block MB-OSN-2005/3 (5-Appraisal Wells) 2017
113
3
Use
of
mu
d ONGC is committed to using
of only Water Based Mud
(WBM) for the offshore
exploratory drilling
operations.
Quantity & characteristics
of mud to be used
Toxicity as per CPCB
guidelines.
Once every
year
Drilling HSE
Team
4
Wat
er
Usa
ge
Commitment to use an
average of 40 m3/day of
water during the drilling
period
Monitor the quantity of
water being used in vessel
Drilling HSE
team
5
No
ise
Gen
erat
ion
Noise levels to which drilling
crew is exposed
Noise monitoring at rig Weekly, as
per CPCB
guidelines
Drilling HSE
team
6
Dri
llin
g
Mu
d a
nd
Cu
ttin
gs
Drilling Mud
Quantity & Characteristics Once for
each well as
per CPCB
guidelines
Drilling HSE
team
Drill cuttings Quantity
7
Eff
luen
ts
Drilling Effluents
Residual chlorine (Cl2)
after treatment
Weekly, as
per CPCB
guidelines
Deck drainage
Sanitary wastes- volume &
regular quality
as per MARPOL
8.1. DETAILED BUDGET AND PROCUREMENT SCHEDULES OF ENVIRONMENTAL MONITORING
ONGC has regular procurement plans for various operations related to hiring of drilling rig
services and associated facilities. These also include various aspects related to environmental
management measures. Thus procurements related to EMP are inbuilt in the procurement requirement
of ONGC.
Various man power requirements are provided by Drilling HSE, Basin HSE and Corporate
HSE teams of ONGC.

Pre-drill EIA for the NELP block MB-OSN-2005/3 (5-Appraisal Wells) 2017
114
Chapter 9
ADDITIONAL STUDIES
9.1 RISK ASSESSMENT
ONGC plans to drill one exploratory well and the exploratory drilling will be taken up in the
Block MB-OSN-2005/3 having an area of 1685 km2, and bathymetry ranging from 102~107 m, during
this phase of exploration.
Drilling will be performed using a self-contained Mobile Offshore Drilling Unit (MODU), a
Floater rig capable of performing shallow water drilling. Well testing will be conducted in the event of
discovery of hydrocarbon at such formation to establish hydrocarbon potential in terms of flow rates and
reservoir pressure. Following drilling and well testing activities, wells will be permanently abandoned or
sealed off for further development. Once well has been secured and all necessary equipment has been
retrieved, MODU will be mobilized to the next drill location.
The Risk Assessment encompasses identification of risks involved in the drilling process
and the associated activities in the drilling program, and assessment of probability of certain
consequences.
9.1.1. STAGES FOR WHICH RISK ASSESSMENTS ARE UNDERTAKEN
Exploration drilling activity can be broken up into a series of stages during which different risk
assessments are undertaken:
Pre-operational assessments and regulatory approvals
Well design
Selection of rig, equipment and services
Pre-mobilization, mobilization
Drilling
De-mobilization
The Risk Assessment ascribed here has been undertaken prior to commencing of drilling
operation, and as part of the regulatory requirements, involving evaluation and disclosure of major risks
to the members of the Expert Appraisal Committee (EAC) of MoEF and other regulators, and

Pre-drill EIA for the NELP block MB-OSN-2005/3 (5-Appraisal Wells) 2017
115
demonstrates that the exploratory wells, in principle, can be drilled in a manner not resulting in harm to
individuals or damage to the environment.
This assessment relies on environmental and social sensitivities associated in the region,
data on past accidents in the oil and gas industry, information on past E&P activities undertaken by
ONGC in general and specifically in this area / region, and HSE management systems of ONGC. This
study however has certain limitations for the absence of sufficient details of the Drilling Rig or
associated support systems to be deployed for the proposed exploratory drilling program.
This report on Quantitative Risk Assessment (QRA) aims at providing a systematic and
syntactic analysis of the major risks that could arise as a result of offshore exploration activities of
ONGC in the MB-OSN-2005/3 block.
The QRA process outlines rationale behind the identified risks based on their significance
and also provides for appropriate preventive and risk mitigation measures. It is anticipated that the
results of the QRA would provide valuable inputs for the overall project planning, ONGC‘s existing IMS
and the DSS (Decision Support System) for effectively addressing the identified risk to ensure that the
project risks stay at ‗As Low As Reasonably Practicable (ALARP)‘ levels at all times during project
implementation. In addition, the QRA will also help in assessing risks arising from potential emergency
situations like a large oil spill and develop a structured Emergency Response Plan (ERP) to restrict
damage to personnel, infrastructure and the environment.
The risk study for the offshore project has considered all aspects of operation of the MODU
and other associated activities during the exploratory phase. Oil spills, loss of well control / blow-out,
vessel collisions, process leaks and helicopter crashes constitute the major potential hazards that may
be associated with the project. External and environmental risk factors (e.g., collisions with passing
merchant vessels, severe weather and seismic events) were considered in the assessment. However,
the risks or hazards associated with development and production program of exploratory wells has
been precluded for it being beyond the scope of the study.
The following section describes the methodology of the risk assessment study and then
presents the assessment for each of the potential risk separately.
9.1.1.1 OBJECTIVE OF QRA
The overall objective of the QRA is to identify the main contributors of major risks arising
from the offshore project which in turn will help in understanding the nature of hazards, evaluate and
Pre-drill EIA for the NELP block MB-OSN-2005/3 (5-Appraisal Wells) 2017
116
prioritize them keeping in mind the ALARP principle and then suggest practicable targets for risk
reduction, if any. The specific objectives of this risk assessment are to:
Identify potential risk scenarios that may arise from operation of supply ships, helicopter
transport, etc.
Analyze the possible likelihood and frequency of such risk scenarios by reviewing
historical accident data.
Predict the consequences of such potential risk scenarios and if consequences are high,
establish the same by through application of quantitative simulations.
Recommend feasible preventive and mitigation measures as well as provide inputs for
drawing up an Emergency Response Plan (ERP) for the project.
The objectives of the QRA meet the criteria set for risk assessment for offshore operations in the
Petroleum and Natural Gas (Safety in Offshore Operations) Rules, 2008.
9.1.1.2 RISK ASSESSMENT METHODOLOGY
Risk associated with offshore oil and gas activities has two main elements - the risk of an
event happening - an oil spill, and the probability that that it will impact a receptor, such as an
ecologically sensitive area. For the purposes of this assessment, a risk ranking methodology based on
likelihood and consequence has been developed in line with specific criteria defined by ONGC for this
project, and represented in the form of a risk matrix.
The risk matrix is a widely accepted and standardized method of semi-quantitative risk
assessment and is preferred over purely quantitative methods, given its inherent limitations to define a
risk event with certainty. The application of this tool has resulted in the prioritization of the potential risk
events for the proposed drilling operations thus providing the basis for drawing up risk mitigation
measures leading to formulation of plans for risk and emergency management. The overall approach is
summarized in the Figure 9.1.
9.1.1.3 HAZARD IDENTIFICATION
Hazard identification for the purposes of the QRA comprised of a review of the project and
associated activity related information provided by ONGC. In addition, guidance provided by knowledge
platforms/portals of the upstream oil & gas industry including OGP, ITOPF and DNV as well as

Pre-drill EIA for the NELP block MB-OSN-2005/3 (5-Appraisal Wells) 2017
117
historical information available with ONGC were used to identify the potential hazards that may arise
out the proposed project activities.
FIGURE 9.1: RISK ASSESSMENT METHODOLOGY
Primarily, six major categories of hazards that can be associated with the project have been dealt
with in detail. They are as follows:
Oil Spills
Blowouts
Collisions
Helicopter crash
Process leaks
Process and non-process fires / explosions
Other possible hazard scenarios like chemical spills, falls, etc. has not been considered for
detailed assessment as preliminary evaluation has indicated that the overall risk that may arise out of
them is or negligible. In addition, it is understood that the causative factors and mitigation measures for
such events can be adequately taken care of through existing safety management procedures and
practices of ONGC.
It must also be kept in mind while evaluating the QRA that many of the hazards identified
are sometimes interrelated with one hazard, often has the ability to trigger off another hazard through a
domino effect. For example, a large oil spill in most instances is caused by another hazardous incident
like a blowout, a process leak or a collision. This aspect has been considered while drawing up hazard

Pre-drill EIA for the NELP block MB-OSN-2005/3 (5-Appraisal Wells) 2017
118
mitigation measures and such linkages (among hazards) has also been given due Importance for
managing hazards and associated risks in a composite manner through ONGC safety management
system and the Emergency Response Plan.
9.1.1.4 FREQUENCY ANALYSIS
The analysis of frequencies of occurrences for the key hazards is important to assess the
likelihood of hazards during the lifecycle of the project. With relevance to the risk assessment study of
the proposed offshore exploratory project, major information sources viz. statistical data, historical
records and global offshore industry experience were considered for the frequency analysis of the
major identified risks.
The following accident databases and published oil industry databases have been consulted for
arriving at probable frequencies of identified hazards for the purpose of this QRA:
The Worldwide Offshore Accident Databank (WOAD) – world‘s most extensive database
of offshore accidents and incidents maintained by DNV;
SINTEF Offshore Blowout Database - a compilation sponsored by 6 operators and 2
consultants;
CAA Helicopter Data – statistics published by the UK Civil Aviation
Accident Data published by DNV Technica
Environmental & Safety Performance of E & P Industry published by oil & gas producers
OGP;
Oil Spill Statistics published by International Tankers Owners Pollution Federation (ITOPF)
Likelihood Ranking Criteria Definition
E Higher than 1 occurrences/year
D Between 10-1 to 1 occurrences/year
C Between 10-4 to 10-3 occurrences/year
B 10-3 to 10-1 occurrences/year
A Between 10-6 to 10-4 occurrences/year
0 0 Lower than 10-6 occurrences/year

Pre-drill EIA for the NELP block MB-OSN-2005/3 (5-Appraisal Wells) 2017
119
9.1.1.5 CONSEQUENCE ANALYSIS
In line with the frequency analysis, hazard prediction / consequence analysis exercise has
been done to assess the resulting effects in the event of an accident and their likely impact on project
personnel, infrastructure and environment. The consequences of accidental events on the marine and
social environment have been studied to evaluate any major impact to the aforesaid environment.
Overall, the consequence analysis takes into account the following aspects:
Magnitude of impacts in terms of area involved
Stakeholder concern
Impact on ecology/biodiversity
Time period for natural recovery and cleanup in case a risk scenario unfolding
The following criteria for consequence rankings have been drawn up in context of the possible
environmental consequences in the event of the risk events unfolding during the drilling operations:

Pre-drill EIA for the NELP block MB-OSN-2005/3 (5-Appraisal Wells) 2017
120
TABLE 9.1: SEVERITY CATEGORIES AND CRITERIA
Environment Severity Ranking
Criteria Definition
Major International Impact
5
International stakeholder concern
Impact on licenses / acquisitions
More than 5 years for natural recovery
More than 5 months for clean-up Reduction of biodiversity
Impact on special conservation areas.
Involved area > 100 km2 – Spill= 5000 MT
Major National Impact 4
National stakeholder concern
Impact on licenses
2-5 years for natural recovery
Up to 5 months for clean-up
Threatening to biodiversity
Impact on interesting areas for science.
Involved area < 100 km2 – Spill= 700 MT
Local Impact 3
Regional stakeholder concern
1-2 years for natural recovery
1 week for clean-up
Threatening to some species
Impact on protected natural areas.
Involved area < 10 km2 - Spill = 100 MT
Minor Impact 2
Some local stakeholder concern
1 year for natural recovery
Impact on small no of not compromised species.
impact on localized ground
Involved area < 1 km2
Spill = 10 MT
Slight Impact 1
No stakeholder impact
Temporary impact on the area.
Involved area < 0.1 km2
Spill < 1 MT – no sensitive impact on ground
9.1.1.6 RISK EVALUATION
Based on ranking of likelihood and frequencies, each identified hazard has been evaluated
based on the likelihood of occurrence and the magnitude of consequences. The significance of the risk
is expressed as the product of likelihood and the consequence of the risk event, expressed as
―Significance = Likelihood X Consequence‖.

Pre-drill EIA for the NELP block MB-OSN-2005/3 (5-Appraisal Wells) 2017
121
The figure below Illustrates all possible product results for the four likelihood and
consequence categories and the Fig. 9.2 and Fig. 9.3 assign risk significance criteria in three regions
that identify the limit of risk acceptability according to the policy and the strategic objectives. Depending
on the position of the intersection of a column with a row in the risk matrix, hazard prone activities have
been classified as low, medium and high thereby qualifying for a set of risk reduction / mitigation
strategies.
FIGURE 9.2: RISK MATRIX & ACCEPTABILITY CRITERIA
Likelihood of Occurrence
Sev
erit
y o
f C
on
seq
uen
ce
O A B C D E
1 Continuous Improvement
2 Risk Reduction
Measures
3
4 Intolerable Risk
5
FIGURE 9-3: RISK CATEGORIES AND SIGNIFICANCE CRITERIA
Risk Criteria Definition
Low (Continuous improvement The level of risk is broadly acceptable and no Specific control measures are required.
Medium (Risk reduction measures)
The level of risk can be tolerable only once a structured review of risk reduction measures has been carried out.
High (Intolerable risk) The level of risk is not acceptable and risk control measures are required to move the risk figure to the previous regions.
9.1.2. KEY RISKS INVOLVED
The key accidental scenarios corroborating safety and environmental risks due to offshore exploratory
drilling program in the current region are:
Fire and Explosion due to Blowouts and other reasons
Accidents during sea transport of materials and supplies
Accidents during air transport of personnel
Oil Spills
Risk and consequence of oil spills are included in separate section, while blowouts and other risks
relating to air and sea side transport accidents are included in the following sub sections.

Pre-drill EIA for the NELP block MB-OSN-2005/3 (5-Appraisal Wells) 2017
122
9.1.2.1 BLOWOUTS
A blowout in a hydrocarbon exploration activity can be defined as any uncontrolled flow of
formation fluids from the reservoir to the surface, due to formation pressure exceeding the hydrostatic
pressure of the mud or fluid column and failure of blowout prevention measures. For an offshore drilling
activity, blowout events may occur at the drill ship level or subsea and may result in pool /jet fires,
vapour cloud explosions or sometimes may lead to release of toxic gases like Hydrogen Sulphide.
Blowouts during offshore operations may be initiated during both drilling and development
phase and also as a result of external causes viz. earthquakes, ship collision, and structural collapse. In
the context of the proposed project, offshore operations will be limited to exploratory drilling and testing.
Therefore, any incidence of blowout during the aforesaid phases may occur as a result of loss of well
control due to formation fluid entry into well bore, well head damage or loss of containment. The
underlying causes of most of the blowout incidents (excluding external causes) occurring worldwide can
be interpreted as organizational and managerial. An analysis of blowout causes into such factors
attempted for the Marintek database (NSFI 1985) revealed that the main causal factors were improper
maintenance, operational failures and inadequate supervision.
BLOW OUT FREQUENCY ANALYSIS
Blowout frequency estimates are obtained from a combination of incident experience and
associated exposure in a given area over a given time period. Due to limited offshore oil & gas related
activities in the offshore region, blowouts that have occurred at other offshore locations worldwide have
been considered for the blowout frequency analysis. Input data for the frequency analysis of blowout
events were taken from DNV‘s database, viz., WOAD (World Offshore Accident Database). Review of
blowout frequencies from the database reveals a frequency 1.1 X 10⁻² per operation per year for drill
ships (comparable to the MODU to be deployed for the drilling activity) compared to Jack Up Rigs (9.8
X 10-3), and Fixed Platforms (9.3 X 10⁻⁴).
Since the proposed project involves only exploratory drilling, measurement of exposure for
blowout incidents has been determined by considering blowout frequencies during drilling and by the
platform type. The blowout frequency for the proposed 6 wells have been obtained by multiplying the
blowout frequencies per well year by the no of wells drilled, and the time taken for drilling each well.

Pre-drill EIA for the NELP block MB-OSN-2005/3 (5-Appraisal Wells) 2017
123
Estimated frequency for blowout for the proposed drilling operation in exploratory block MB-
OSN-2005/3 is: Probability for blowout from ONGC drilling operations = 1.1 X 10⁻² (prob/ year / drilling
operation) X 1(no of drills) X 0.2 (time taken for each drill in yrs) = 0.2 X10⁻²
BLOW OUT CONSEQUENCES AND EFFECTS
A blowout incident can take a variety of different forms, ranging from a minor leak which can
be stopped within minutes, to a major release which continues out of control for days or even months.
The consequences of a blowout event will to a large extent depend on how the blowout scenario
evolves and the following possible scenarios are likely:
release of oil resulting in a slick or spill on the sea
release of drilling fluids and resulting spill leading to contamination of marine environment
release of toxic / flammable gas which may have deleterious/detrimental effect on the drill
ship personnel
ignition of the flammable gas / oil released resulting in a jet of fire, pool of fire or an
explosion
Ignition of released oil and gas can possibly result in considerable harm. With historical
data, 40% of blowout incidences to have led to significant damage to the drill ship / platform (WOAD
database) and resulted in associated fatalities amongst drilling crew and support personnel present on
the ship / platform. Also, ignition has been recorded world over, on an average, in about 30% of the
blowout cases (SINTEF offshore blowout database). However, on the positive side, with improvement
of offshore drilling technology, number of offshore blowouts occurrences has significantly gone down in
the last decade.
A public domain database maintained by DNV for all offshore hazards including 312 blowouts
worldwide from 1970-96.
RISK RANKING FOR BLOWOUTS
Likelihood Ranking - C
Consequence Ranking - 4
Risk Ranking - 4C (High)

Pre-drill EIA for the NELP block MB-OSN-2005/3 (5-Appraisal Wells) 2017
124
PREVENTIVE AND MITIGATION MEASURES
Blowouts being events which may be catastrophic to any well operation, it is essential to
take up as much a preventive measures as feasible. Following measures would be implemented:
Necessary active barriers (e.g. Blowout Preventer) will be installed to control or contain a
potential blowout.
Close monitoring of drilling activity would be done to check for signs of increasing
pressure, viz., shallow gas formations.
Adequate precautionary measures to be taken in case of a natural event like earthquake
or a cyclone.
9.1.2.2 COLLISIONS INVOLVING MODU:
A collision event is considered for the risk assessment for the impacts on MODU by other
drill ships or other marine vessels working nearby or passing by it. The following possibilities have been
taken into consideration:
support vessels which approach the MODU under their own power including supply
vessels, standby vessels, etc.
Collisions may vary from minor bumps to rare but highly damaging full-speed collisions.
The frequency for such incidences is strongly dependent on the severity of the collisions
included. The types of collisions possible in this are as follows:
On arrival – where the visiting vessel fails to stop when it reached the platform;
Manoeuvering – where the vessel misjudges a turning or approach manoeuver, and the
hits the MODU at a relatively low speed
Drifting – where the vessel loose power or suffers a failure of dynamic positioning and
drifts into the platform because of winds or waves.
The collision frequency would be expected to vary roughly in proportion to the number of
visits, particularly for supply vessels, which are again of a similar pattern. The frequency of collisions
will also depend on the weather conditions prevailing in the offshore region near the coast during the
drilling period, especially for minor collisions. As exact vessel movement data for the ONGC India
operations are not available at this time, an average vessel movement (Technica, 1987) of about 3.6
vessels / week has been assumed.
Assuming the number of visits to the MODU as 5.0 vessels per week, the typical overall
frequency of moderate to severe collision by a support vessel with the MODU can be taken as 1.0X10⁻⁴

Pre-drill EIA for the NELP block MB-OSN-2005/3 (5-Appraisal Wells) 2017
125
per visit. Estimated frequency for support vessel collision for the proposed drilling operation in
exploratory block MB-OSN-2005/3 is:
Total number of visits = 5 / 7 X 210 = 150
Frequency for collision = 1.0 X 10-4 X 150 = 1.5 X 10⁻²
COLLISIONS INVOLVING MODU AND PASSING VESSELS
Collisions with offshore oil structures involving passing vessels are generally very rare
(about 5 % of all reported collisions) but can be potentially very damaging. Probabilities for passing
vessel collisions can be estimated from historical experience. However, the frequencies are uncertain
and statistically insufficient as only few passing vessel collisions have has been reported. Historical
data have limited value because they are often unable to reflect local traffic levels with reasonable
degree of accuracy and also because the sea has few formally defined shipping lanes and ships tend to
follow informal lanes voluntarily between ports.
COLLISIONS INVOLVING SUPPLY AND OTHER VESSELS
There is a negligible probability of supply vessels colliding with other commercial vessels on
route to the MODU while maneuvering near to the Nhava base. These collisions may happen because
of navigational difficulties or because of prevailing traffic density near JNPT. However, the traffic on
local routes is highly regulated and controlled. So the possibility of such collisions happening is
considered to be minimal.
CONSEQUENCES AND EFFECTS
The analysis of collision consequences is generally based on the principle of conservation
of energy. The incident kinetic energy of a vessel on a collision course can be transferred to the MODU
during the impact. The magnitude of energy transfer will depend on the mass of the vessel and on the
square of its speed at the time of impact. However, in the case the collision is as a result of a glancing
blow from a support vessel, where the vessel brushes against the platform, the kinetic energy transfer
is minimal and is expected to cause minimal damage to the MODU. The impact of a full-on collision
may however be more severe and may lead to structural damage to the MODU. The risk to personnel
manning a platform / drill ship from a collision in terms of fatalities or injuries has been historically found
to be very low, if not resulting in a catastrophic incidence like a blowout. It should be noted that the
Pre-drill EIA for the NELP block MB-OSN-2005/3 (5-Appraisal Wells) 2017
126
MODU would be connected to the drilling apparatus at the sea bottom; a collision involving high energy
transfer may lead to a rupture or leak in the riser resulting in a process leak or a blowout.
RISK RANKING FOR VESSEL COLLISION
Likelihood Ranking - C
Consequence Ranking - 3
Risk Ranking - 3C (Medium)
PREVENTIVE AND MITIGATION MEASURES
A Vessel Management Plan will be formulated and implemented to reduce collision risk, both vessel–
vessel and MODU–vessel and will address the following:
Mandatory 500 m safety zone around platform;
Operational restrictions on visiting vessels in bad weather;
Defined vessel no-go areas within safety zone; and
Agreed approach procedures to platform by supply and safety vessels.
9.1.2.3 HELICOPTER CRASHES
The journey to and from offshore installations has historically been one of the main reasons
for accidental death or injury to many offshore workers. For the ONGC India drilling activities, crew
transport to and from the MODU will be taken care of by helicopter for its speed, convenience and good
operability under rough weather conditions.
FREQUENCY PROBABILITY
Several approaches exist to analyze probability of helicopter crash risks. The most common
approach involves the use an overall Fatal Accident Rate (FAR) value (e.g. SINTEF 1990). However,
there are certain inherent deficiencies in adopting this approach in spite of the fact that it provides
convenient risk numbers. A more reasonable approach involves the use of individual risk approach as a
product of 3 components:
Frequency of helicopter accidents per flight;
Proportion of accidents which involve fatalities;
Proportion of personnel on board in fatal accidents who become fatalities.

Pre-drill EIA for the NELP block MB-OSN-2005/3 (5-Appraisal Wells) 2017
127
Taking this approach and considering historical data from the UK sector which is available, while
accounting for both the flying time and number of flying stages involved, the Individual Risk per journey
can be calculated as Individual Risk (IR) per journey = 1.7 X 10⁻⁶ X flying time (hours) + 2.7 X 10⁻⁷ X
No. of stages per journey.
CONSEQUENCES AND EFFECTS
Helicopter crashes with offshore oil & gas exploration and production have happened
routinely in the past, especially in the North Sea offshore operations in Europe, with some resulting in
fatalities or injuries to crew members. In addition to the risk posed to the helicopter occupants,
accidents involving helicopters can also cause damage to the drill ship itself by way of crashing into the
ship during take-off or landing or by an accident when the helicopter is on the helideck. However, the
consequence of such risk may be considered to be small compared to the other risks sources on the
MODU.
RISK RANKING FOR HELICOPTER CRASH
Likelihood Ranking - BC
Consequence Ranking - 3
Risk Ranking - 3B (Medium)
PREVENTIVE AND MITIGATION MEASURES
Following preventive and mitigation measures will be adopted with respect of helicopter operations:
Air worthiness of helicopter to be checked by competent authority before helicopter is
hired by ONGC India.
ONGC India should ensure that the pilot/pilots who will be operating have got appropriate
training on similar craft.
Effective arrangements for coordination would be developed with air traffic control room at
Nhava base, as also in the MODU;
Helicopter operations to be restricted during night time and during bad weather conditions.
All employees who are supposed to travel on helicopters would be receiving basic training
on rescue and survival techniques in the case of a helicopter crash at sea.

Pre-drill EIA for the NELP block MB-OSN-2005/3 (5-Appraisal Wells) 2017
128
9.1.3. RISK MITIGATION MEASURES
9.1.3.1 WELL PLANNING & DESIGN
Exploration wells are designed to manage the uncertainty in the true nature of the well to be
drilled. The possibility of shallow gas, uncertainty in pore-pressure and temperature, porous and
permeable intervals, weak formations, etc. all need to be assessed, and the well design and drilling
program developed to cater for ‗worse-case‘ scenarios. Offset well data, computation modeling and site
specific survey data allow the geoscientists to provide the drilling engineers with information on the
likely range (probabilistic) and maximum values of key design parameters. The drilling engineer designs
the well (and the associated drilling programme) on the basis of maximum anticipated values.
Explicit risk assessment, in terms of assigning quantitative probabilities of failure to all parts
of the well design, does not feature in the design of a typical exploration well. However, risk
assessment is implicit within the design process, specifically through the adoption of operational
manuals and procedures and industry recognized design approaches by ONGC.
ONGC and other private E&P operators such as RIL have in the past undertaken drilling
activities in the offshore region around the coast of Maharashtra. This has led to a fair amount of
geological information and offset well data from the region, based on which ONGC will be able to plan
and design exploratory wells in the block, with minimal uncertainties and therefore higher probability of
avoiding accidental scenarios such as blowouts.
As per ONGC‘s Management Systems of Offshore Drilling and HSE, and in compliance with
Petroleum and Natural Gas (Safety in Offshore Operations) Rules 2008, ONGC will ensure that:
A Well programme describing the individual activities and the equipment to be used will be
prepared prior to starting well activities
The management system with associated processes, resources and operational
organization will be established;
Steering documents, including technical documents for drilling and well testing operations,
will be made available, in an updated version and the operational personnel shall be
acquainted with it.
Commissioning process prior to startup of facilities for first time or after technical
modifications will be completed

Pre-drill EIA for the NELP block MB-OSN-2005/3 (5-Appraisal Wells) 2017
129
Well barriers:
During drilling and other related well activities, there will at all times be at least two
independent and tested well barriers after surface casing a in place. Well barriers
will be designed in such a manner that unintentional influx, cross flow to
deformation layers and outflow to the external environment is prevented.
Well barriers will be designed in such a manner that their performance can be
verified.
If a barrier fails, during drilling and other related well activities, no other activities will
be undertaken in the well than those to restore the barrier.
When a well is abandoned, the barriers would be designed to provide integrity for
the longest period of time in such a manner, inter alia, that outflow from the well or
leakages to the external environment do not occur.
ONGC will choose well location and well path on the basis of well parameters of
importance, including occurrence of shallow gas, other hydrocarbon bearing
formation layers and distances to adjacent wells and to ensure that it is possible to
drill a relief well from two alternative locations. The well path will be known at all
times.
ONGC will ensure that the necessary actions are planned including setting of casing
above all known shallow gas hazard zones to handle occurrence of situations of shallow
gas or other formation fluids.
During drilling and well activities, drilling and well data will be collected and monitored to
verify the well prognoses, in order that necessary actions may be taken and the well
programme may be adjusted, if necessary.
Well control:
Well control equipment will be designed, installed, maintained, tested and used so
as to provide for well control.
In the case of drilling of top hole sections with riser or conductor, equipment with
capacity to conduct shallow gas and formation fluid away from the facility, until the
personnel has been evacuated, will be installed.
Floating facilities shall have an alternative activation system for handling critical
functions on the blow out preventer.

Pre-drill EIA for the NELP block MB-OSN-2005/3 (5-Appraisal Wells) 2017
130
Accumulator for surface and subsurface well control equipment will have minimum
useable fluid capacity as per industry standards in order to perform closing and
opening sequences as applicable to secure the well.
The pressure control equipment used in well interventions will have remote control
valves with locking devices.
The well intervention equipment will have a remote control blind or shear ram as
close to the Christmas tree as possible
If well control is lost, ONGC will ensure that it shall be possible to regain the well
control by direct intervention or by drilling a relief well.
ONGC will prepare an action plan describing how the lost well control can be
regained
ONGC will set operational limitations in relation to controlled well flow
Securing of wells before abandoning
All wells will be secured before they are abandoned in such a manner that well
integrity remains intact for the period abandoned.
With regard to subsea completed wells, the well integrity will be ensured if the wells
are planned to be temporarily abandoned
Radioactive sources will not be left behind in the well.
In case it is not possible to retrieve the radioactive sources and these have to be left
in the well, ONGC will follow proper abandonment procedure as per guidelines of
the Department of Atomic Energy, Government of India.
Compensator and disconnection systems:
Design of compensator systems will be based on robust technical solutions so that
failures do not lead to unsafe conditions.
Floating facilities shall be equipped with a disconnection system that secures the
well and releases the riser before a critical angle occurs
Drilling fluid system:
The drilling fluid system will be designed in such a manner that it will mix, store,
circulate and clean a sufficient volume of drilling fluid with the necessary properties
to ensure the drilling fluid‘s drilling and barrier functions.
The high pressure part of the drilling fluid system with associated systems will in
addition have capacity and working pressure to be able to control the well pressure
at all times.

Pre-drill EIA for the NELP block MB-OSN-2005/3 (5-Appraisal Wells) 2017
131
Availability of sufficient quantity of drilling fluid weighting material to subdue the well
at any time during the drilling operation will be ensured
Cementing unit:
The cementing unit will be designed in such a manner that it will mix, store and
deliver as exact volume as possible of cement with the necessary properties to
ensure full satisfactory anchoring and barrier integrity
The unit will be designed in such a manner that remains of unmixed chemicals as
well as ready-mixed cement is handled in accordance with the applicable
environment regulations.
If the cementing unit with associated systems is intended to function as backup for
the drilling fluid system, it shall have capacity and working pressure to be able to
control the well pressure at all times.
Casings and anchoring will be such that the well integrity is ensured and the barrier
functions are provided for the life time of the well.
Equipment for completion and controlled well flow
Equipment for completion will provide for controlled influx, well intervention, backup
well barrier elements and plug back activities.
Completion strings will be equipped with necessary down hole equipment including
safety valves
During controlled well flow, the surface and down hole equipment will be adapted to
the well parameters.
Equipment for burning of the well stream will be designed and dimensioned in such
a manner that combustion residues shall not cause pollution of the marine
environment
ONGC will ensure that controlling well pressure through the work string and the well
flow through the choke manifold at any time
9.1.3.2 SELECTION OF EQUIPMENT, SYSTEMS AND PEOPLE
ASSESSING THE ABILITY OF THE DRILLING RIG TO PERFORM THE REQUIRED OPERATION
The water depth, environmental conditions, reservoir and geophysical properties will dictate
the type of rig and equipment required to perform the drilling operation. Highly technical risk

Pre-drill EIA for the NELP block MB-OSN-2005/3 (5-Appraisal Wells) 2017
132
assessments will be undertaken both to demonstrate that the rig is capable of providing an acceptable
working environment, and to determine the limits to which certain operations will be undertaken.
During this phase, the ability of the equipment and systems on the rig to provide a suitable
barrier(s) to well control incidents will be reviewed (e.g., pressure rating and functionality of the BOP).
The ability of a drilling rig to operate at the specific location will be assessed, usually through the
application of an industry recognized site assessment practice. (e.g., Site Specific Assessment of
Mobile Jack-Up Units). The objective being to ensure that the risk of (for example) a structural or
mooring failure does not exceed ONGC‘s and the regulator‘s risk acceptance requirements.
The risk assessment process is, to an extent, embodied within the relevant design and
assessment standards applicable to the particular type of drilling rig. However, detailed, site-specific
risk assessments support the application of these standards, for example the analysis of borehole data
to establish the risk of a punch-through. Where a drilling rig is deemed to be operating close to the
limits of its operating envelope, more detailed risk assessments may be warranted.
The requirements of the following applicable standards for the listed equipment shall be met
to demonstrate that drilling systems are in compliance with requirements of the Petroleum and Natural
Gas (Safety in Offshore Operations) Rules, 2008 and Drilling Rig (MODU) is thus fit for purpose:
Fire and explosion risk assessment on MODU includes hazards from the wells and well
testing operations. Following fire and explosion hazards related to wells are generally considered:
Subsea shallow gas blow out
Shallow gas blow out in cellar deck
Blow out at drill floor
Subsea blowout
HC gas release / ignition in mud processing area
Fire and explosion in well testing areas
Well programs needs to be designed taking into consideration the anticipated hazards as
listed above. MODUs should conform to conventions and codes of International Maritime Organization
(IMO). Fire and explosion risk management at MODU can be ensured by meeting the requirements of
these codes. Following issues have been taken into consideration by MODU code:

Pre-drill EIA for the NELP block MB-OSN-2005/3 (5-Appraisal Wells) 2017
133
Structural fire protection layout plan for decks and bulkheads
Protection of accommodation spaces, service spaces and control locations
Means of escape
Fire pumps, fire mains, hydrants and hoses
Fire extinguishing systems in machinery spaces and in spaces containing fired processes
Portable fire extinguishers in accommodation, service and working spaces
Arrangements in machinery and working spaces
Fire detection and alarm system
Gas detection and alarm system
Fireman‘s outfit
Provisions for helicopter facilities
Fire control plan
Ensuring fit for purpose status of fire extinguishing appliances (operational readiness and
maintenance is detailed in MODU Code 2009)
Number and type of portable extinguishers provided on the MODU would be based on the fire hazards
for the spaces protected.
9.1.3.3 TESTING & MAINTENANCE OF CRITICAL EQUIPMENT
Blowout preventer and other pressure control equipment is the most critical equipment to
avoid major accidents during drilling. Therefore the blow out preventer will be pressure tested regularly
in order to maintain its capability of carrying out its intended functions. The blow out preventer with
associated valves and other pressure control equipment on the facility shall be subjected to a complete
overhaul and shall be recertified at regular intervals based on original equipment manufacturer‘s
recommendations and international standards and recommended practices.
CONTRACTOR MANAGEMENT (DRILLING CONTRACTOR)
Management of major incident risks are by the drilling contractor on the MODU is of interest
to ONGC, and will, therefore, ensure that all major incident risks have been assessed and suitable
controls put in place to reduce the risks to as low as reasonably practicable (ALARP). Pre-mobilization
and pre-drilling assessments will be undertaken by ONGC to ensure that the risk to an individual worker
Pre-drill EIA for the NELP block MB-OSN-2005/3 (5-Appraisal Wells) 2017
134
is as low as reasonably practicable. Typically this is demonstrated through the analysis and summation
of all the individual risks and how they impact different classes of offshore personnel.
The major incident risks for which some level of risk assessment is undertaken normally include:
Hydrocarbon releases resulting in fires, explosions or asphyxiation
Structural failure (environmental overload, foundation failure, seismic etc.)
Mooring failure (loss of location keeping and secondary impacts)
Ship Collision
Helicopter operations
Lifting operations and dropped objects (with major incident potential)
The nature of the risk assessment exercise undertaken for each of the risk types varies from
analysis of past incident data, to the detailed assessment of blast overpressure resulting from
hydrocarbon releases of varying sizes and from different locations.
9.1.3.4 SELECTION OF SUPPORT SERVICES
The proposed drilling operations will require some level of 3rd party support services which
typically include helicopter operations, standby and supply vessels, services and equipment on the rig,
onshore supply base and so on. Associated with each of these activities some level of risk assessment
will be undertaken by ONGC. These risk assessments will, for example, drive the need to develop
‗bridging arrangements‘ between the contractors that contribute to the management of a particular
activity and the risks that arise from it. However, since ONGC is an experienced E&P operator owning
and/or contracting such support services – Risk Management is built in selection, supervision, and
monitoring these support services.
9.1.3.5 ENSURING MARINE INTEGRITY
1. Stability:
ONGC will ensure that floating facilities are in accordance with the requirements contained
in the applicable standards concerning stability, water tightness and watertight and
weather tight closing means on mobile offshore units.

Pre-drill EIA for the NELP block MB-OSN-2005/3 (5-Appraisal Wells) 2017
135
There will be weight control systems on floating facilities, which will ensure that weight,
weight distribution and centre of gravity are within the design assumptions and equipment
and structural parts will be secured against displacements to affect stability.
2. Anchoring, mooring and positioning:
Floating facilities will have systems to enable them to maintain their position at all times
and, if necessary, be able to move away from the position in the event of a situation of
hazard and accident.
Dynamic positioning systems will be designed in such a manner that the position can be
maintained in the event of defined failures and damage to the system, in case of
accidents.
During marine operations, necessary actions will be taken in such a manner that the
probability of situations of hazard and accident is avoided and those who take part in the
operations are not injured.
Requirements will be set to maintaining position in respect of vessels and facilities during
implementation of such operations, and criteria will be set up for commencing and
suspension of activities.
3. Collision risk management
The Offshore Installation Manager will be the overall authority for safe operations within
the safety zone of installation.
ONGC will ensure that a collision risk management system is implemented and
maintained wherein following shall be inter alia included –
suitability of attendant vessels and off take tankers and competence of their crew;
assessment of probability of collision peculiar to the installation and its location;
provision of necessary risk reduction and control measures;
appropriate procedures and communications for managing operations of attendant
vessels developed jointly with marine service providers;
provision of appropriate equipment and procedures for detecting and assessing the
actions of vessels intruding into the safety zone;
provision of competent personnel with an appropriate level of marine knowledge;
provision of appropriate evacuation and rescue procedures and facilities; and
regular audit and updating of the above systems.

Pre-drill EIA for the NELP block MB-OSN-2005/3 (5-Appraisal Wells) 2017
136
4. Control in the safety zone
The master of the attendant vessel or off take tanker will comply with instructions of the
Offshore Installation Manager when in a safety zone.
The master of the attendant vessel or off take tanker will be responsible for safety of his
crew, the safe operation of attendant vessel or off take tanker and for avoiding collision
with the installation or associated facilities.
5. Operations in rough weather conditions
The operator will ensure safe working in adverse weather and tidal conditions and identify
the rough weather conditions when the operations are to be discontinued and evacuations
carried out, as required.
The operator will ensure that transfer of personnel and cargo between the vessel and
installation is carried out under safe weather conditions and such transfers should be
stopped during adverse or unsuitable weather conditions
6. Cargo management
The operator will ensure optimization of cargo trips, from and to the shore, and cargo handling time at
installation by efficient planning of cargo supplies through containerization, pre-slinging of cargo etc.
9.1.4. H2S EMISSION CONTROL PLANS
H2S production is not envisaged in these wells, but due to exploratory nature of the wells,
contingency plan for emergencies are provided herewith:
9.1.4.1 DETECTION AND ALARM SYSTEMS
The system comprises of H2S sensors located at pre-determined points. In air conditioned
or ventilated areas, detectors will be installed at the fresh air inlets (ducts, entrance ways etc.). Outside,
detectors are required to be installed on gas carrying equipment (well nipple, shale shaker, mud, pits,
drillers‘ stands etc.).
The alarm systems are located near potential leaks, such as the shaft gland connection,
flanges etc. It is pure alarm system with two warning stages and cannot trigger emergency shutdown
alone. The two levels of alarm are as follows:
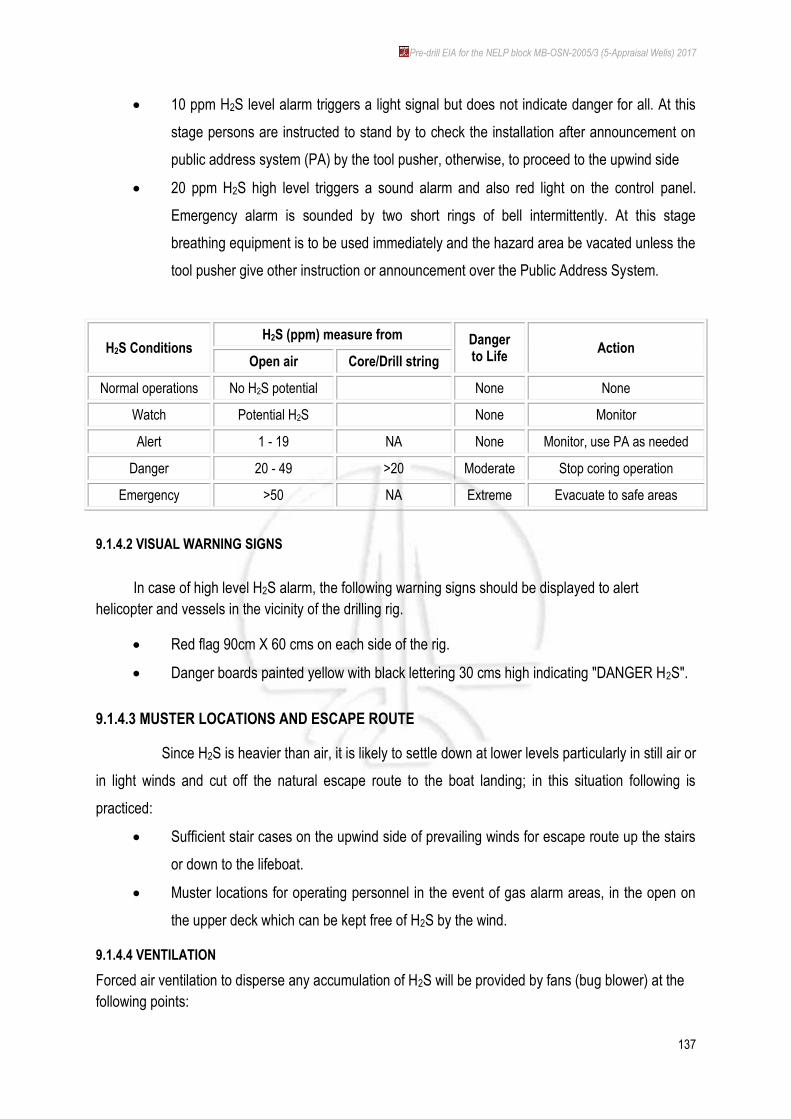
Pre-drill EIA for the NELP block MB-OSN-2005/3 (5-Appraisal Wells) 2017
137
10 ppm H2S level alarm triggers a light signal but does not indicate danger for all. At this
stage persons are instructed to stand by to check the installation after announcement on
public address system (PA) by the tool pusher, otherwise, to proceed to the upwind side
20 ppm H2S high level triggers a sound alarm and also red light on the control panel.
Emergency alarm is sounded by two short rings of bell intermittently. At this stage
breathing equipment is to be used immediately and the hazard area be vacated unless the
tool pusher give other instruction or announcement over the Public Address System.
H2S Conditions H2S (ppm) measure from Danger
to Life Action
Open air Core/Drill string
Normal operations No H2S potential None None
Watch Potential H2S None Monitor
Alert 1 - 19 NA None Monitor, use PA as needed
Danger 20 - 49 >20 Moderate Stop coring operation
Emergency >50 NA Extreme Evacuate to safe areas
9.1.4.2 VISUAL WARNING SIGNS
In case of high level H2S alarm, the following warning signs should be displayed to alert
helicopter and vessels in the vicinity of the drilling rig.
Red flag 90cm X 60 cms on each side of the rig.
Danger boards painted yellow with black lettering 30 cms high indicating "DANGER H2S".
9.1.4.3 MUSTER LOCATIONS AND ESCAPE ROUTE
Since H2S is heavier than air, it is likely to settle down at lower levels particularly in still air or
in light winds and cut off the natural escape route to the boat landing; in this situation following is
practiced:
Sufficient stair cases on the upwind side of prevailing winds for escape route up the stairs
or down to the lifeboat.
Muster locations for operating personnel in the event of gas alarm areas, in the open on
the upper deck which can be kept free of H2S by the wind.
9.1.4.4 VENTILATION
Forced air ventilation to disperse any accumulation of H2S will be provided by fans (bug blower) at the
following points:

Pre-drill EIA for the NELP block MB-OSN-2005/3 (5-Appraisal Wells) 2017
138
Shale shaker
Working platforms
Control rooms
9.1.4.5 H2S KICK CONTROL
The control of H2S kick may be achieved either by bulldozing gas back into formation or
circulating it out. The actual method to be adopted will depend upon the condition of the well. When a
gas kick occurs, estimate the quantity of H2S present taking adequate precautionary measures of
wearing self-contained breathing apparatus (SCBA). The following procedure is to be adopted:
Close BOP, monitor SIDPP, SICP & pit gain.
If the concentration is high and cannot be circulated out due to H2S hazard in atmosphere,
bulldoze the gas into formation by pumping through kill line.
Raise mud wt. and pH as required.
Load H2S scavenger like zinc carbonate and ironite sponge as may be necessary in the
active mud pit.
Circulate the gas through choke and degasser and burn off the gas.
The following factors are needed to be kept in view:-
All persons on the drilling floor, shale shaker area, mud pump and tank should put
on self-contained breathing apparatus when the kick is to be circulated out.
Persons who are not required for the control operation are withdrawn to a safe area,
where adequate ventilation is arranged.
Frequent checks with portable H2S gas detector are to be made.
Supply vessels will be directed to stay upwind on power and maintain continuous
radio and visual watch.
9.2. DISASTER MANAGEMENT PLAN
Oil & Natural Gas Corporation Limited is the premiere national oil company engaged in the
exploration and production (E&P) of crude oil and natural gas from offshore as well onshore assets in
Indian and abroad. The inherent risk in the oil well drilling and production are well known and the
management of the risks calls for systematic planning, adopting engineering practices and positive
attitude towards safety & environment protection. It was therefore, necessary to develop a Disaster
Management Plan (DMP) to facilitate necessary actions to meet emergency scenarios.

Pre-drill EIA for the NELP block MB-OSN-2005/3 (5-Appraisal Wells) 2017
139
9.2.1. PURPOSE & SCOPE OF THE PLAN
The disaster management plan would serve the following purpose
To set out the appropriate course of action to mitigate the impact of an emergency event.
The plan provides for a procedure allowing all those involved to mobilize their resources in
an orderly way and to react in time effectively.
To respond immediately to an emergency event to prevent its escalation to a disaster and
also the response in the event of such an escalation. The scope of the plan is to cover all
the emergency situations which can influence the risk under the following situations
Disasters due to natural causes Disasters due to manmade causes (external)
Floods Civil disturbances
Tsunami Terrorist Attack
Hurricane Hostage Crisis
Earthquake Bomb threats
Tornado Potential Offshore Vessel Collision
Lightning Helicopter crash on Helideck in Offshore
Disasters due to manmade causes (operational) Helicopter crash-Ditch in sea
Fires Helicopter Emergency landing
Oil/gas well blowouts Office/Offshore accommodation fire
Toxic gas releases, Dropped object incidents
Oil / Chemical spills, Emergencies to offshore installations
Hydrocarbon Release Diving Incidents
Explosions (unconfined, confined) Man Overboard incidents
The emergency situations mentioned above can escalate to such an extent that the required
level of response would be beyond ONGC‘s own resources available within an Asset and intervention
of corporate level will be necessary to mobilize additional resources not only from various other work
centres of ONGC, but even from outsourcing services internationally. In such cases, DMP shall be
activated by the CMD, ONGC as and when, in his opinion, a national and/or international level
intervention is required for handling the crisis.
9.2.1.1 UPDATING AND EXERCISES
The disaster management plan shall be updated as and when required but at least once in a
year. Also, the plan will be exercised under the chairmanship of the CMD once every year to test the
communication system, action plan and the response of all key agencies within ONGC, govt. of India
and outside resources. Accordingly, a Disaster, scenario will be simulated and the ‗Emergency

Pre-drill EIA for the NELP block MB-OSN-2005/3 (5-Appraisal Wells) 2017
140
Coordinators‘ as defined by the plant will be required to act in a predetermined way to deal in real time
with the situation. The outcome of the exercise will be taken as input to updating the plan and improve
on the lacunae, if any, on the front of preparedness as well as to plug the loopholes to meet with
emergencies of any extent feasible. The exercise shall include the National Crisis Management
Committee. If in any case the exercise cannot be carried out due to operational reasons the same shall
be done as a table top exercise.
9.2.1.2 DISASTER MANAGEMENT PREPAREDNESS
In case of emergency, Emergency Response Plan (ERP) is activated by the installation
manger. He shall immediately bring it into the notice of the Asset/ Basin Manager/ Chief of Services for
mobilization of resources, should the emergency warrants so, beyond the capability of the installation/
rig/ vessel, as well as to activate the Disaster Management Plan constituting a part of the Regional
Contingency Plan (RCP). In order of affixing the responsibility, the Senior most Asset Manager shall be
the Chief Emergency Coordinator (CEC). In case of his absence the next Senior Asset Manager shall
be the CEC. The CEC shall, on the gravity of the emergency, inform the CMD, Director (HR)-CCEC,
Director-concerned and Director-I/C HSE for intervention of Corporate Disaster Management Group
(CDMG).
Corporate Disaster Management Group (CDMG) will come into action in the following
situation when in case of an Offsite emergency, likely to have effect beyond the installation premises or
an emergency originated from outside the premises of the installation which is likely to effect the
operations of the installation and requires corporate intervention.
9.2.1.3 ON SCENE COORDINATOR
Initial Phase
One who is close enough to the scene of emergency may exercise emergency co-ordination in the
initial phase. Accordingly, the Installation Manager will assume the role of On-Site Coordinator (OSC).
Intermediate Phase
The Chief Emergency Coordinator (CEC) at Asset level may appoint a person, normally locationed at
base to take over the task of OSC at Site Control Room (SCR).
Pre-drill EIA for the NELP block MB-OSN-2005/3 (5-Appraisal Wells) 2017
141
Function
The OSC will make an assessment of the situation; the type and quantity of assistance
required and communicate the same to the Asset ECR. The OSC will mobilize the resources available
at the site, deal with the situation and take such actions as directed by the Chief Emergency
Coordinator at the Asset/ Basin/ Plant. He will transmit situation reports (SITREPS) at regular interval
prefixing a numerical sequence to each message.
9.2.1.4 Site Control Room
Location
The Site Control Room will function at the installation depending upon situation. Alternate site control
room will be set up at the closest installation.
Mobilization
The On-Scene Co-coordinator (OSC) will set up SCR as soon as he becomes aware of the emergency
situation.
Function
To make situation reports (SITREPS) from time to time and take steps to fight the emergency.
Determine the type of assistance required & mobilize the same through ECR.
9.2.1.5 COMMUNICATION
As effective communication is crucial for the overall success of the operation, a
communication flow-chart for such scenario is outlined herewith. In the event of a terrorist act, timely,
accurate communications will be critical for the success and survival. Timely response during
emergency is extremely important.
CEC at the work center must communicate immediately as per the flow chart for first
information in case any emergency is likely to come to the notice of media. This is to ensure that the
management has an authentic update of the emergency to reply to the media.

Pre-drill EIA for the NELP block MB-OSN-2005/3 (5-Appraisal Wells) 2017
142
9.3. OIL SPILL RISK ASSESSMENT
9.3.1. OIL SPILL SCENARIOS
Exploration drilling in offshore areas implies a risk for acute spills to sea. Major incidents are
blowouts during drilling into the reservoir zone. Minor incidents include small spills of crude oil (well
releases), diesel (from the rig or from supply vessels) or hydraulic oil (from the rig). With respect to
environmental risk and oil spill emergency preparedness, the dimensioning incident is a blowout.
The oil spill scenarios have been assessed to classify into:
Most probable spill scenario
Maximum likely spill
Worst case spill
TABLE 9.3.1: OIL SPILL SCENARIOS
Spill Scenario Classification Qty. of oil spilled
Spill due to Rupture of flow lines/ hose during transfer of
diesel from supply vessel to the Drilling Rig (as such these
transfer hoses are likely to have auto shut off valve, but
presuming a scenario where this auto shut off valve is non-
functional and is manually shut off after a reaction time of
15 min)
Most probable
spill scenario
100 MT
(Instantaneous)
Spill of diesel due to collision between supply vessel and
the drilling rig and damage to diesel storage in the supply
vessel
Maximum likely
spill
700 MT
(Instantaneous)
Spill of crude oil / condensate due to well blowout which
takes 2 days to cap
Worst case spill 5000 MT (over a
period of 2 days)
9.3.1.1 Marine and Coastal Features Sensitive to Oil Spills
The block MB-OSN-2005/3 is approximately at a distance of over 160 km off the coast of
Mumbai where no ecologically sensitive areas in the exploration area lie. However, the Marine National
Park and the Marine Sanctuary that lie in the gulf will not come in the specific activities for exploratory
drilling in the block MB-OSN-2005/3. Besides this, the Maharashtra coastline comprises of significant
mangrove patches which could also be sensitive to oil spills in case of large oil spill. The well proposed
to be drilled in this block which is closest to this coast is at a distance of over 160 km.

Pre-drill EIA for the NELP block MB-OSN-2005/3 (5-Appraisal Wells) 2017
143
9.3.1.2 ASSESSMENT OF RISKS DUE TO OIL SPILLS
In absence of sufficient met-ocean data and an oil spill trajectory model validated to Indian
metocean conditions, the assessment of risks due to oil spills is made on the basis of logical analysis.
Quantitative spill trajectory models have not been used as part of this assessment. This assessment is
with respect to seasonal trend of coastal currents. A recent study on ―Intra-seasonal variability of
coastal currents in India‖ (by SSC Shenoi, INCOIS – Dec‘10) indicates that except during the period
June to October of the year, sea currents around the coast (excluding the gulf) are pre-dominantly
towards the northwest. During the monsoon period (i.e., Jun to Oct), the currents are predominantly
towards southeast.
Considering this, accidental spills from the proposed oil and gas drilling activity in this block
are not likely to hit the coast during the weather window generally chosen for deploying offshore rigs
and undertaking drilling activities. Moreover the nearest well (from the coast) proposed to be drilled is at
a distance of over 160 km from the coast. Therefore the risk of oil spills due to the proposed exploratory
drilling activities in this block is negligible / nil. However, considering the coastal sensitivities, ONGC
understands that preparedness to respond to oil spills during exploratory drilling program is key for
exploratory drilling.
9.3.1.3 OIL SPILL CONTINGENCY PLAN
Since accidental spills of crude oil and oil based products pose risks to human health and
environment, ONGC will make every effort to prevent accidental oil spills and to clean them up quickly
in case such accidental spill occurs.
The entire offshore facilities are designed, installed and operated in such a way, so as to
minimize possibility of any accidental oil spills. Facilities and resources supplied by outsourced
agencies also meet international pollution prevention design and operation standards. Oil spill risks are
identified and measures to prevent and contain oil spills have been outlined in contingency plan given
below:
To establish response procedures for oil spills
To combat, contain, recover, cleanup and dispose of the spilled oil
To provide training and drill schedule for keeping the system in place, and

Pre-drill EIA for the NELP block MB-OSN-2005/3 (5-Appraisal Wells) 2017
144
To meet statutory requirements
Activation of plan starts with notification of ―Oil Spill‖ and spill assessment. Immediate action
is taken to disconnect the source. Further action is taken based on Short Term and Long Term
strategies for spill containment.
OIL SPILL RESPONSE
In any marine oil spill response, mobilization of resources depends on a number of factors.
One of the most critical ones is the time taken to activate this plan and mobilize equipment & resources
to the scene of the spill. To ensure efficiency in response initiation, a tiered response approach is
adopted by ONGC in line with NOSDCP and Oil Industry Safety Directorate (OISD) guidelines. This
plan takes into account the response time needed to mobilize, transport and deploy increasing amounts
of resources to the scene of a spill, depending upon the severity of oil spill.
The size, location and timing of an oil spill are unpredictable and different situations require
different responses. The severity of an oil spill incident is largely based on the quantity of oil spilled and
its distance from the shore. With increasing size of spill and decreasing distance from shore the number
of outside agencies involved and urgency of their notification increases and so does the resources
required and degree of organization needed. Based on past experience of oil spills, the strategy and
guidelines for dealing with different sizes of oil spills, Tier wise classification of resources have
emerged. But these tier levels were varying from place to place and company to company based on
different interpretations. In India, considering these differences, guidelines has been provided by Oil
Industry Safety Directorate (OISD), Ministry of Petroleum & Natural Gas to enable oil companies to plan
their respective tiered response strategy.
ONGC follows a 3-tier approach for oil spill response: Tier 1, 2 and 3. These are explained
in following sections.
Tier I:
In line with the standard industry practice, ONGC is prepared to mitigate spills of importance
from routine operations (Tier-1), while oil spill situations of higher magnitude are dealt with industry co-
operation and external intervention. Oil spill is considered as Tier 1 when it is less than 100T and is up
to 500 m around its installations. ONGC will immediately respond to combating such oil spill incidents
and will continue to provide equipment, material, trained manpower, sampling efforts, and vessels.

Pre-drill EIA for the NELP block MB-OSN-2005/3 (5-Appraisal Wells) 2017
145
ONGC‘s IMR (Inspection, Maintenance & Repair) Division is operating four numbers of Multi
Support Vessels (MSV) in the Western Coast. One of the functions of MSVs is to handle oil spills. The
following facilities exist with ONGC.
TABLE 9.3.2: OIL SPILL RESPONSE EQUIPMENT WITH IMR, ONGC (TIER –I FACILITY)
Sl.
No.
Item Availability in
the field
At Nhava Remarks
1 Oil Spill
Dispersants
20 M3 Type-II OSD available on MSVs and at Nhava
Store.
2 Heavy Duty
Containment
Booms
500Mtrs each
(M-36, HAL
Anant &
Seamac-II)
500 mtrs
(S/Sevak)
MSV S/Sevak-500 mtrs of heavy duty oil
containment boom (Make -Lamor), kept at
Nhava Supply Base
MSV Mal-36-500 mtrs available on board
(Make-Seacurtain)
MSV HAL Anant -500 mtrs available on board
(Make-Canadyne).
Seamac-II-500 mtrs available on board (Make
–Kepner)
3 Skimmer Sets 3 (M-36, HAL
Anant &
Searnac-II)
1 (S. Sevak) MSV S/Sevak (Make- Lamor),
MSV HAL Anant (Make-Canadyne),
Malviya-36 (Make-Seavac HD Delta),
Seamac-II (Make-Kepner)
4 Ship Borne
Dispersant
Spray System
7 sets One each on S/Sevak, and Prabha and five on
chartered vessels-Hal
Anant, Mal-36., Mal-25 Mal-27 and Seamac-II
Tier II:
Oil spill is considered as Tier II when it is more than 100T but less than 700T. ONGC will
immediately inform Coast Guard about such oil spill incidents as they are the national agency for
ensuring marine environment security in India.
Coast Guard is involved in protection and preservation of the environment and prevention
and control of pollution. Being the national coordinator in oil spill response, it has a variety of
responsibilities under the National Oil Spill Disaster Contingency Plan (NOS-DCP). It is the coordinator

Pre-drill EIA for the NELP block MB-OSN-2005/3 (5-Appraisal Wells) 2017
146
for oil spill response in the entire maritime zones of India with specific allocation for direct response
functions in the maritime zones outside the port limits and notified areas around offshore oil facilities.
TABLE 9.3.3: POLLUTION RESPONSE EQUIPMENT HELD AT COAST GUARD POLLUTION
RESPONSE TEAM (WEST), MUMBAI
Sl. No. Pollution Response Equipment at PRT ( West), Mumbai Qty. (No.) Remarks
1 RO Boom OSA 2000 with deck Reel 4 200 m each
2 RO Boom Powerpack (old) 2
3 RO Boom Powerpack (New) 2
4 Vikoma Hi-Sprint Boom with deck Reel 4
5 Vikoma PN Diesel Hydraulic Powerpack 3
6 Vikoma Hi-Sprint Boom air blower (Echo) 2
7 Vikoma air Blower (Honda) 2
8 Vimkoma Sentinal Boom 1
9 Vikoma Sential boom 1
10 Ro Boom 610 (16 x 25) 16
11 Air Blower for sl. No. 10 5
12 Boom Washing Chamber 1
13 Fresh water Chemical Pump for Sl No. 12 2
14 Power pack for Sl. No. 12 1
15 Ro ser (Settling Tank) 1
16 RoC kean Unit 1
17 Beach Cleaning equipment 1
18 Hot water cleaner (KEW) 4
19 Hot water cleaner (L&T) 1
20 CCN-100 off loading pump 1
21 Power pack for Sl. No. 20 1
22 TC-3 Aerial spray unit with bucket 3
23 TC-3 Areal Spray Arm set 5
24 Spill Spray Pump 4
25 Spill Spray Arm (set) for Sl. No. 24 5
26 Wide Spray System 2

Pre-drill EIA for the NELP block MB-OSN-2005/3 (5-Appraisal Wells) 2017
147
27 OMI Oil Mop MK-II-9D 2
28 SS-50 Disk skimmer (Vimoma) 4
29 Power Pack for OMI Sl. No. 28 4
30 Welosep Vertex Skimmer 2
31 Power Pack for Sl. No. 30 2
32 Desmi DEstroil Skimmer Ds-250 4
33 Powerpack for Sl. 32 4
34 Desmi Destroil Skimmer DS 210 2
35 Powerpack for Sl. 34 - 02 2
36 Dunlop Salvage Barge 100 M3 2
37 Dunlop Salvage Barge 30 M3 3
38 Linductor Oil recovery 2
39 Vikoma Sea Devil Skimmer 3
40 Powerpack for Sl. 3 3
41 Hydraulic Control for Sl. 39 - 03 3
42 Hydraulic hand pallet 3
43 Hydraulic power pack lifter drum lifter 1
44 Hand trolley 1
45 Hand trolley 1
46 Fork lift 1
47 SeaVac Heli Skimmer 1
48 Pallet Stacking System (Ex Jay=24 & Ex Godrej=32) 56
49 Container top for OSA 200 Boom reel 3
50 Oil Spill response kit 1
51 Seavac 330 Heli skimmer system 1
52 RO Boom 1
53 DS 250 Skimmer 1
54 Spill Spray equipment 1
55 Spray Pod 2
56 Spray Pod 8 750 SQN at Daman.
57 IR/UV System 2 -do
58 TC-3 Bucket with boom S/N 7584 1 841 SQN at Daman

Pre-drill EIA for the NELP block MB-OSN-2005/3 (5-Appraisal Wells) 2017
148
59 Oil Water separator 1 At Vadinar
60 Petrol Engine General Purpose 1
61 Rop Mop skimmer(Diesel engine & power pack) 2
62 Oil Spill Kit with accessories 2
63 Dunlop Dragon Barge 30 Ton .3
64 Sea Curtain Boom 24000 m
65 Sea vac Heli skimmer 1
66 High Pressure Steam Jet Cleaner 2
67 TC-3 Bucket 1 CGAE Goa
68 TC-3 Bucket 1 800 SQN at Goa
69 TC-3 Bucket 1 Vera flight at Kochi
Source: National Oil Spill Disaster Contingency plan (short title: NOS-DCP), 2006 (Updated),
Ministry of Defense, Government of India, CGBR 771, (Edition 2006)
Tier III:
Oil spill is considered as Tier III when it is more than 700T. Globally there are a select few
industry cooperative, international Tier 3 Response Centers. Their location was originally influenced by
the occurrence of major oil spills from shipping, these being perceived as the greatest risk. Since then
their service remit has evolved and the membership and capability have changed. While stockpiles of
equipment remain a key feature, emphasis has grown on the provision of expert staff for a range of
preparedness and response services.
For combating oil spills of this magnitude, ONGC has obtained membership of International
agency i.e. M/s OSRL (Oil Spill Response Limited), UK. The membership is continually renewed
annually to cover all ONGC‘s offshore operations from the threat of major oil spills. OSRL is having
expertise in handling the disaster of any higher magnitude. They are capable of deploying their services
in minimum response time anywhere in emergency.
STRATEGY DURING FIRST SIX HOURS
Depending upon nature of emergency at sea and weather conditions booms will be laid
around source of spill for containment. Recovered oil will be stored for further disposal as per laid down
procedures. If some quantity of oil has spread prior to deployment of booms or some oil has slipped
away during containment and recovery process, following factors will be taken into consideration prior
to taking decision on application of dispersant:

Pre-drill EIA for the NELP block MB-OSN-2005/3 (5-Appraisal Wells) 2017
149
Spilled oil shall not be more than 4 hours old
Oil is moving towards shoreline
Spilled crude characteristics are amenable to use of dispersants
Prevailing weather conditions are conducive to dispersant applications.
Prior approval from Coast Guard for use of dispersant will be obtained.
Spraying of Dispersants
During rough weather, monsoon, low visibility or in case of delayed deployment of
equipment, the spraying of dispersants is considered one of the options, because this strategy needs
very less reaction time (resource mobilization time) and can be initiated by the boat/vessels crew
operating in the area. Spray of dispersants can be done through Helicopters also.
Response equipment such as Containment Booms will be deployed for protection of
Maharashtra coastal belt, the creeks and mangroves along the Maharashtra coast, and sensitive pilgrim
/ tourist area of Dwarka and Bet Dwarka, to deflect spills towards other areas of the shoreline where it
shall cause less harm to the environment.
Shore Cleanup
Despite best efforts to contain and recover spilled oil, there is always a likelihood of spilled
oil reaching shorelines. Shoreline cleanup technique will be practiced for the left over oil as per
topography of the coastline.
9.3.1.4 PROJECT NEED & BENEFITS
The hydrocarbons sector plays vital role in the economic growth of the country. Oil and gas
continue to play a pre-eminent role in meeting a part of the energy demands of the country. Growth of
the economy would lead to spontaneous growth in energy consumption. Economists opine that there
the GDP and per capita energy consumption is a directly proportional. The hydrocarbon sector,
therefor, plays a crucial role in the energy security for the country.
As per the Hydrocarbons Vision – 2025 of the Ministry of Petroleum & Natural Gas, Govt. of
India, inter alia, is – ‗to assure energy security by achieving self-reliance through increased indigenous
production and investment in equity oil abroad.‘ The medium term objective for E & P Sector of the
country includes:
Continue exploration in producing basins.

Pre-drill EIA for the NELP block MB-OSN-2005/3 (5-Appraisal Wells) 2017
150
Aggressively pursue extensive exploration in non-producing and frontier basins for
knowledge building' and new discoveries.
Venturing into deep-sea offshore areas of the Indian basin for newer finds.
The rapid economic growth of the country and rising population result in the considerable
increase in demand of petroleum products. The gap between supply and availability of crude oil,
petroleum products as well as gas from indigenous sources is likely to increase over the years.
The growing demand and supply gap would require increasing emphasis on E&P sector to
pace keep with demand-supply relationships.
At present, India meets about 30% of petroleum requirements from all of its resources. It is,
therefore, impertinent to expedite exploration activities to minimize our dependence on the imports and
to ensure the energy security of our country.
In view of the unfavorable demand-supply balance of hydrocarbons in the country, ONGC
has been intensifying its E&P activities in Indian basins to improve on the domestic productivity of oil
and gas as well as make equity oil available by acquiring gas assets overseas with a focus on oil
security.
The Western Offshore area has been the main contributor of domestic hydrocarbon
production the Indian exchequer. The recent finds and discoveries have given new vistas and the
likelihood of finding potential hydrocarbon pools is quite high here in the basin.
Block MB-OSN-2005/3 is located in the Western Offshore basin and is proposed by ONGC
for exploratory drilling to explore for the liquid gold. In view of prognosticating the feasibility of presence
as well as tapping hydrocarbon, this offshore exploratory project is of immense domestic and national
importance.

Pre-drill EIA for the NELP block MB-OSN-2005/3 (5-Appraisal Wells) 2017
151
Chapter 10
ENVIRONMENT MANAGEMENT PLAN
The Environmental Management Plan is a site specific document for ONGC‘s Offshore
Drilling Project in Arabian Sea developed to ensure that the project can be implemented in an
environmental sustainable manner and where all contractors and related stakeholders understand the
potential environmental impacts and risks arising from the proposed project and take appropriate
actions to properly manage them.
The EMP will be taken as a guide to optimize its management of all aspects of ONGC‘s
activities in the MB-OSN-2005/3 Block in the Arabian Sea and activities related to the operations of its
onshore project base at Nhava. The EMP describes inter alia the actions in terms of:
Regulations and Standards
Best Practices and guides
Local Environmental and Social Sensitivities
International Conventions and National Policies
10.1. SELECTION OF DRILLING LOCATION AND NAVIGATIONAL PATH WAYS
Proper site selection and routing of navigational pathways for drilling rig and supply vessels
can result in preventive mitigation measures that may considerably reduce impacts arising out of the
proposed project. The Project planning team will work in close cooperation with the HSE Department to
look at preventive options early in the project life cycle based on findings of the EIA study. This will
ensure optimizing the need for ―end-of-the-pipe‖ solutions to the extent feasible. Some of the proposed
mitigation measures that need to be adopted are discussed below.
SETTING OF EXPLORATORY BLOCK AND DRILL LOCATIONS
As has been elaborated earlier, there exists no designated marine protected areas or
marine archaeological sites in and around the project block. The project location, therefore, is not
bound by any national and international siting regulations. Occurrence of sensitive species in close

Pre-drill EIA for the NELP block MB-OSN-2005/3 (5-Appraisal Wells) 2017
152
proximity or within the block will also govern the selection of drilling locations. If sensitive species viz.
sea turtles are anticipated in the block area, their presence will be monitored in accordance with the
international sighting guidelines for marine mammals.
SELECTION OF NAVIGATIONAL PATHWAY FOR DRILLING RIG & SUPPLY VESSELS
ONGC will be giving due weightage to the impacts that may arise due to movement of
supply vessels (SOVs) and drilling rig, which will be documented prior to the exploratory operations and
planned taking into account MARPOL designated sensitive areas and also marine habitats protected by
national legislation. Appropriate measures will be adopted by the project proponent to avoid migratory
routes of turtles and ecologically and culturally sensitive coastal areas during vessel movement. In
addition, consultations with different stakeholders (Directorate of Fisheries, Coast Guard, Port
Management Board, etc.) will be carried out to aid in the routing of supply vessels from the logistic
base.
10.2. ATMOSPHERIC EMISSIONS
There are a number of sources of atmospheric emissions (both point sources and fugitive
emissions) from the proposed offshore project. The primary air pollutant emission source for the
proposed project is DG sets. Five DG sets for meeting power requirement (~600 KW/day) will be in
operation during the exploratory period with estimated fuel consumption of 15 Kl/day/rig. The following
specific mitigation measures are recommended:
All equipment would be operated within specified design parameters during drilling
operations and fully trained personnel will be utilized to maintain and test the systems;
The project will monitor and record fuel use for compressors and generator sets.
The emissions from DG sets will be in accordance with the guidelines in MARPOL.
Valves, flanges, fittings, seals and packing considering safety and suitability requirements
will be selected to reduce gas leaks and fugitive emissions. Additionally, leak detection
and repair programs will be implemented;
Flaring of gas during well testing will be minimized and restricted to a short duration;
Flare combustion efficiency will be maximized by controlling and optimizing flare
fuel/air/steam flow rates to ensure the correct ratio of assist stream to flare stream; and
Dry, dusty materials (chemicals), mud etc. would be stored in bags or sealed containers;

Pre-drill EIA for the NELP block MB-OSN-2005/3 (5-Appraisal Wells) 2017
153
10.3. STORAGE AND HANDLING OF CHEMICALS AND SUPPLIES
ONGC will ensure proper storage and handling of chemicals and other supplies at the
onshore facility at Nhava base, prior to their shipment to the rig. A good working inventory will help
minimize impacts that may arise due to such handling and storage. All loading and unloading activities
will be carried out as close as feasible to the storage facilities.
It will be ensured that lids of all containers containing volatile substances/chemicals are
properly fitted.
All chemical storage areas to have proper bunds so that contaminated run-off cannot
escape as runoff into the nearby coastal areas. Regular inspections to be undertaken for the storage
areas to detect any indication of leakage, decomposition or other unsafe storage conditions and
corrective actions initiated accordingly.
Adequate Personal Protective Equipment (PPEs) shall be provided to all workers involved in
handling of hazardous materials.
10.4. MANAGEMENT OF DRILL CUTTINGS & DRILLING MUD
The offshore exploratory drilling project is likely to generate a considerable amount (Total
volume during drilling of the well ~ 700 m3) of drill cuttings. The disposal option for such drill cuttings
generated from offshore drilling will primarily be governed by the type of drilling mud (water or oil
based) utilized for the exploratory drilling. The disposal of the drill cuttings to be conforming to the
guidelines pertaining to the ―Disposal of Drill Cuttings and Drilling Fluids for Offshore Installations‖
provided by the Ministry of Environment & Forests (MoEF) G.S.R. 546(E) August 2005. Drill cuttings
disposal will be monitored to check compliance of these guidelines.
Oil based mud will not be used unless and until warranted otherwise, and only water
based mud will be used.
To mitigate specific hole problems if SOBM is used, ONGC will ensure that it has less than
1% of aromatic content and will use with intimation to MoEF
Chemical additives used in the mud will be biodegradable (mainly organic constituents)
with a toxicity of 96 hr. LC 50 Value > 30,000 mg /l as per missed toxicity or toxicity test
conducted on locally available sensitive sea species

Pre-drill EIA for the NELP block MB-OSN-2005/3 (5-Appraisal Wells) 2017
154
Hexavalent chromium compound will not be used in drilling mud. Alternative chemical in
place of chrome lignosulfonate will be used.
Except in emergency situations, bulk discharge of drilling mud in offshore will not be
undertaken. Drilling mud will be recycled to a maximum extent.
Discharge of thoroughly washed drill cuttings separated from mud & unusable portion of
mud will be discharged into sea intermittently, at an average rate of 50 bbl/hr/well to have
proper dilution & dispersion without any adverse impact on marine ecology and
environment.
Drill cuttings will not be discharged in sensitive areas notified by the Ministry of
Environment and Forests.
Disposal of drill cuttings associated with high oil content from hydrocarbon bearing
formation will have oil content < 10 gm/kg.
The drill cuttings wash water will be treated to conform to limits notified under EPA, before
disposal into Sea. The treated effluent will be monitored regularly.
Use of environmental friendly technology emerging due to substitution of DF or disposal
technology will be brought to the notice of MoEF and regulatory agencies and a prior
approval from Ministry of Environment and Forests will be taken
Barite used in preparation of drilling mud will not contain Hg> 1 mg/kg and Cd> 3 mg/kg.
Daily discharge of drill cuttings and drilling mud to offshore will be recorded, daily effluent
quality will be monitored and compliance reports to be submitted half-yearly to the Ministry
of Environment and Forests.
10.5 OILY WATER DISCHARGES AND OTHER WASTES
In addition to drill cuttings and unused drilling mud, the proposed exploratory drilling
operations would also result in the generation of other routine and non-routine waste streams. These
waste steams will primarily comprise of bilge fluids, ballast water, cooling water, deck drainage and
food and sanitary waste and needs to be disposed and managed in compliance with best industry
practices and international requirements to avoid any impacts arising from the same.
The waste streams which are routinely generated at offshore facilities are listed below along
with their recommended disposal measures and management alternatives:

Pre-drill EIA for the NELP block MB-OSN-2005/3 (5-Appraisal Wells) 2017
155
Ballast Water
The drilling rig will be having a Ballast Water Record Book and ONGC has formulated
ballast water management procedures to a given standard. These procedures will serve as an effective
management tool in reducing the risk arising from ballast-mediated invasion. The process involved will
reduce the density of coastal organisms in ballast tanks which may be able to invade a recipient port,
replacing them with oceanic organisms with a lower probability of survival in near shore waters.
Cooling Water
In regard to the disposal of cooling water, available alternatives will be evaluated and, where
practical, the seawater intake depth will be optimized to reduce the need for use of chemicals.
Appropriate screens will be fitted to the seawater intake if safe and practical. Deck Drainage water
generated from precipitation, sea spray, or routine operations, such as deck and equipment cleaning,
will be routed to separate drainage systems on offshore facilities of the drilling rig. This includes
drainage water from process areas that could be contaminated with oil (closed drains) and drainage
water from non-process areas (open drains).
The following management measures will be followed:
Chemicals, oils and wastes will be stored in the designated storage areas on the drilling rig
where appropriate spill cleanup materials (e.g. absorbents, containers) are maintained in
accessible locations;
In the event of a chemical or oil spill, absorbents will be used to remove spill material prior
to any washing activities;
Absorbent material, used for cleanup, will be containerized and sent to shore as
hazardous waste;
Bunding will be provided for those areas/activities where there is an increased risk of
oil/chemical spill (e.g. fuel transfer);
Material Safety Data Sheets will be made available for all chemicals used on the drilling rig
(which also includes spill response requirements);
Chemicals used will be assessed for environmental impacts prior to their purchase (e.g.
fully biodegradable detergent); and

Pre-drill EIA for the NELP block MB-OSN-2005/3 (5-Appraisal Wells) 2017
156
Slops water will be discharged via an IMO approved Oil-in-water (OIW) meter as per
MARPOL requirement.
Food Waste
Food waste generated from the kitchen will be, at a minimum macerated to levels less than
25 mm as per the legal requirements prior to their discharge in the marine environment. It will also be
ensured that cleaning agents (detergents) used in the accommodation block are fully biodegradable
and inspection undertaken on a regular basis to conform to operability and performance.
As far as practicable, typical combustible and non-combustible wastes routinely generated
at offshore facilities will be segregated at source and shipped to shore for re-use, recycling, or disposal.
Efforts will be made to eliminate, reduce, or recycle wastes at all times.
The project waste management strategy being adopted to be effective solid waste treatment
hierarchy.
ONGC would ensure that the project contractor(s) have adequate training and follow
stipulated waste management procedures for minimizing, handling and storing waste; waste disposal
contractor(s) use facilities for treatment and the disposal of waste is acceptable to mitigate damage to
the environment to the permissible limit and standards.
Audits are carried out to ensure these are achieved.
Detailed waste management procedures will be put in place and all personnel employed at
the drilling rig will receive formal waste management awareness training, particularly regarding the
proper waste segregation, storage and labeling, procedures for recycling of waste.
Quality, Occupational Health, Safety and Environmental Policy
Comply with all applicable occupational, safety, environmental legal and other
requirements of the organization.
Commitment for continual improvement in Quality, Occupational Health, and Safety and
Environmental management and performance.
Prevention of pollution due to release of hydrocarbon and other waste.
Ensure safe operations and prevent loss of property.

Pre-drill EIA for the NELP block MB-OSN-2005/3 (5-Appraisal Wells) 2017
157
Protection of employees, contractual persons and persons living in adjacent areas of the
rig from the foreseeable work hazards.
Optimize the use of natural and other resources.
Maintain safe and healthy work environment.
Provide quality product and service to the customer‘s satisfaction in the drilling / servicing
of well in offshore for production of hydrocarbons consistent with national and international
standards.
Be always alert and equipped to respond to emergencies and disasters by having an
updated ―Emergency Response Plan‖ and ―Disaster Management Plan‖.
Equip employees and contractors with the awareness, information, instructions, and
Supervision Skills needed for safe working, quality of operation and environmental
management.
Identify and maintain the processes needed for effective implementation of the ―Quality
Management System‖.
10.6 MANAGEMENT MANUAL
Management of the rig describes the relevant management systems for quality occupational
health, safety, and environment in the QHSE management system manual. The management system
manual of rig establishes and maintains a quality manual that includes:
The scope of the quality management system includes all the elements of the ISO
The documented procedures for the management of quality management system have
been established for;
1. Commitment to the relevant clauses of ISO Standard
Needed by the various sections of Rig listed as documents of internal origin (DIO), these
are:-
MM manual,
Book of delegated powers,
R & P Regulations,
ONGC Chemistry lab procedures,
ONGC Emergency Plan (EMP).

Pre-drill EIA for the NELP block MB-OSN-2005/3 (5-Appraisal Wells) 2017
158
Cementing manual,
Drilling Operational manual
Code of Safe practices Vol. I & II
Procedures needed for implementation of various clauses also referred to as Quality
System Procedure (QSP)
Check lists for the various key operations and these may be maintained by the concerned
personnel or demonstrated by them.
The details of the procedures and method of operations are developed based on the
competency of the complexity of the operations. The method of presentation of procedures aims at
enhancing the understanding of operation being done and realization of the services of drilling and
testing or the working over of wells at all stages of operation/manufacturing.
Review
The management system manual is generally reviewed at least once in a year. The review
can even be carried out in part or whole in a shorter period when the need for the same is felt due to
audit observations, change of system, change of equipment, change of management etc. The review is
carried out based on the inputs provided by a nominated manual development team. Records of such
reviews are maintained by MR/Dy MR.-QHSE.
10.7 MANAGEMENT SYSTEM PROCEDURES AND DOCUMENTATION
The rig management team documents, implements and maintains procedures for ensuring
requirements for quality, occupational health, safety, and environment in accordance with the
installation and ONGC‘s stated policies. The following procedure manuals have been documented:
QHSE/DS/SSK/CPM-Common procedure manual
QHSE/DS/SSK/SPM-Safety procedure manual
QHSE/DS/SSK/QPM-Quality procedure manual
QHSE/DS/SSK/EMS/OM/01 to 04-Environment Management System and Aspect
Manual
QHSE/DS/SSK/RR- Risk Register

Pre-drill EIA for the NELP block MB-OSN-2005/3 (5-Appraisal Wells) 2017
159
Management system documentation is in the form of a written QHSE management manual
(QHSE/DS/SSK/MM).
Implementation, Operation, Infrastructure and Work Environment
The Drilling Services has determined, provided and maintained the infrastructure needed to
achieve conformity to services requirements. Infrastructure includes machineries, man power, plants,
equipment (both hardware and software) for exploratory or work over drilling operations. ONGC also
maintains marine and air logistics services, catering services, communication and information systems
for satisfactory performance in its drilling operation.
Work Environment in offshore comprises 12 hours shift duty, 14 days on-off work period
(24x7), accommodation for offices, staff and contract personnel etc. Environmental factors such as
temperature, humidity, illumination, wind speed, ventilation and weather conditions are taken care.
Resource, Roles, Responsibility & Authority
The roles, authorities and responsibilities are defined, documented and communicated to all
concerned staffs to facilitate effective QHSE Management. The Management provides essential
resources for manpower, technology and finance required for establishment, implementation
maintenance, improvement and control of QHSE Management System.
Documentation / Control of Documents
The OHSAS and EMS management system documentation includes
The OHSAS and EMS Policy and objectives and targets.
Description of scope of OHSAS and EMS.
Description of main elements of OHSAS and EMS and their interaction and reference to
related documents.
Documented procedure and records required by QMS, OHSAS and EMS standards.
Documents, including records, determined by Drilling services to be necessary to ensure
the effective planning, operation and control of processes that relate to management of its
OHSAS risk and environmental issues.
The details of the Occupational health, Safety, Environment and Quality management system
documentation are as below:

Pre-drill EIA for the NELP block MB-OSN-2005/3 (5-Appraisal Wells) 2017
160
QHSE Management manual (QHSE/DS/SSK/MM) - This manual provides the outline for
the quality, occupational health, safety and environment management systems and
describes the commitment to adoption of elements as per the requirement of ISO9001,
OHSAS18001 and ISO14001.The manual also provides the cross references to the
relevant procedures.
Common Procedure Manual (QHSE/DS/SSK/CPM) - This manual, inter alia, defines the
detailed procedure of applying each element defined in the QHSE Management manual.
Quality Procedure Manual (QHSE/DS/SSK/QPM) - This manual contains all the quality
procedures (operating work instructions) to address the significant quality issues.
Environment Aspect Manual (QHSE/DS/SSK/EMS/AM): This manual provides
The list of environmental aspects (QHSE/DS/SSK/EMS/AM/01)
Evaluation and significant environmental aspects (QHSE/DS/SSK/EMS/AM/02)
Objective and Targets (QHSE/DS/SSK/EMS/AM/03)
Environment management program (QHSE/DS/SSK/EMS/AM/04)
Risk Register (QHSE/DS/SSK/RR): This manual provides the master list of
Risk Assessment criteria (QHSE/DS/SSK/RR/RAC/01)
Objectives (QHSE/DS/SU/RR/OBJ/04)
Occupational and safety hazards & Evaluation (QHSE/DS/SSK/RR/HIE/02)
List of significant risk (QHSE/DS/SSK/RR/SSK/03)
Legal Register (QHSE/DS/SSK/LR/)
This register will contain the list of applicable legislation, acts, Regulations
Company‘s code etc. with reference to QHSE.

Pre-drill EIA for the NELP block MB-OSN-2005/3 (5-Appraisal Wells) 2017
161
Chapter 11
ORGANIZATIONAL STRUCTURE
AND IMPLEMENTATION FRAMEWORK
In addition to regular operational roles & responsibilities defined for the drilling services, all
personnel directly or indirectly have a role to play towards an effective environment management in the
project. Personnel responsible for environment management at the drilling project will be responsible
for implementing the HSE policy and the environment management plan. The drilling services shall co-
operate with government agencies, regulatory authorities and other stakeholders who may have
environmental concerns associated with the project.
Various key personnel involved in the oil spill in the organization and communication have
been shown in a hierarchical manner in the following Figure 11-1.
FIG. 11.1: OIL SPILL ORGANIZATION AND COMMUNICATION

Pre-drill EIA for the NELP block MB-OSN-2005/3 (5-Appraisal Wells) 2017
162
ONGC would also set up a Safety Committee in the MODU headed by the Well Operations
Manager as stipulated by the OISD Rules. The Safety Committee would meet once a week and will
function with the following mandate:
Discuss work related health, safety and environmental issues and make suggestions for
improvement;
Undertake safety and housekeeping inspections of the MODU with a view to identify
deficiencies and recommend corrective measures;
Promote development of safety attitude amongst employees.
11.1 CAPITAL AND RECURRING COST FOR ENVIRONMENTAL POLLUTION CONTROL MEASURES
ONGC has regular procurement plans for various operations related to hiring of drilling rig
services and associated facilities. These also include cost related to various aspects related to
environmental management measures. Thus procurements related to EMP are inbuilt in the
procurement requirement of ONGC.
11.2 DISCLOSURES OF CONSULTANTS ENGAGED
For carrying out the environmental impact assessment study of the proposed oil exploration
block MB-OSN-2005/3 in Mumbai offshore, various institutions/agencies have been working in
coordination with each other.
11.3 EIA CONSULTANT ENGAGED
No consultant has been engaged for the present study. Corporate HSE (Health Safety &
Environment) Department, ONGC, 8th floor, Scope Minar, South Tower, Laxminagar, Delhi – 110 092
is accredited to carry out EIA studies and the present study has been carried out under their active
supervision & guidance. The primary data has been provided by Institute of Petroleum Safety, Health
and Environment Management (IPSHEM), ONGC, Betul, Goa-403 723.
11.4 AGENCY ENGAGED FOR CRZ MAPPING
Since the block MB-OSN-2005/3 block of Western offshore lies much beyond 12 nautical
miles, the nearest point of the boundary lies at a distance of over 255 km (~ 138 nautical miles) no CRZ
regulation was applicable in the block and therefore, CRZ mapping was not mandatory.
Pre-drill EIA for the NELP block MB-OSN-2005/3 (5-Appraisal Wells) 2017
163
12. Bibliography 1. Paris Commission (1989) Guidelines for monitoring methods to be used in the vicinity of
platforms in the North Sea, Paris Commission.
2. EPA (1985) Assessment of Environmental fate and effects of discharges from offshore oil and
gas operations. EPA-440/4-85/002
3. Anon (1994) Status of marine pollution in coastal and offshore water of India, Department of
Ocean Development, New Delhi.
4. Grasshoff K et al (1987) Methods of sea water analysis, Verlag Chemie
5. Strickland J D H & T R Parsons (1968) A manual of seawater analysis. Fish. Res.Bd.Canada,
Bull.169.
6. UNESCO Manuals & Guides No.12 (1982) and 13 (1983)
7. Todland M et al (1992) Chem. Geol.95: 35-62
8. Nair RR & NF Hashmi (1980) Proc.Ind.Acad.Sci. (Earth Sciences), 89:299-315
9. Sen Gupta R & S Z Qasim (1982) Petr.Asia.5, 33-37
10. Sen Gupta R et al (1993) Mar.Poll.Bull. 27: 85-91
11. Mehta P et al (1994) Ind.J.Mar.Sci. 23: 123-125
12. Clarke RC & W D Macleod (1977): Effects of petroleum on Arctic & subarctic marine
environments and organisms. Ed.D C Malins, Acad. Press, New York
13. Sen Gupta R (1987) State of the marine environment of India (MSS)
14. Monaghan et al (1980) in `Marine environment pollution‘ – Elsivier Sc.Publ.Co. Vol.1: 413-431
15. Zingde M D et al (1976) Ind.J.Mar.Sci. 5: 212-217
16. Krishnakumar P K et al (1990) Ind.J.Fish. 37: 129-137
17. Parulekar A H et al (1982) Ind.Mar.Sci. 11: 107-114
18. Environment monitoring around ONGC installations in the Western Offshore region – Report by
IPSHEM, ONGC, Goa – September ‗95,December ‗97, May‘99, December 2000 and October
2001.
19. Hydrography of the Arabian Sea shelf of India and Pakistan and effects on demersal fishes –
Karl Banse, Deep sea research, 1968, Vol.15, pp 45 to 79. Pergamom Press.
20. Trace metal concentration in Marine organisms – Ronald Eisler, Pergamom Press, 1981, pp:
493-623
21. Heavy metals in Marine Environment of Indian Ocean – J. Sci.Dev.Env., pp 247-260, (1987),
Sen Gupta R and Qasim S Z
22. Environmental Characteristics of the Ocean – S.Z.Qasim, R.Sen Gupta
23. State of Oil pollution in the Northern Arabian Sea after the 1991 Gulf Oil Spill – R. Sen Gupta,
S.P.Fondekar and R. Alagarsamy, Marine Pollution Bulletin,Volume 27, pp. 85 – 91, 1993.
24. Distribution of Petroleum Hydrocarbons in Goa Coastal Waters – S.P.Fondekar, R.S.Topgi and
R.J.Noronha, Indian Journal of Marine Sciences, Vol.9, pp. 286 – 288, 1980.
25. Petroleum and the continental shelf of Northwest Europe, Vol.2, Chapter.12 (Effects of long
term, low level exposure to oil), pp. 106 – 107, By A. Nelson Smith.
26. UNEP–Environmental data report, 1989/90, pp. 161–162, Table No. 1.42.
27. Petroleum Residues in Surface sediments of Kuwait, Marine Pollution Bulletin, Vol.16, No.5,
pp.209 – 211, 1985, M.A.Zarba et al.
28. Trace Metals in the Northern North Sea - Marine Pollution Bulletin, Vol.16, No.5, pp. 203 – 207,
1985, By P.W. Balls

Pre-drill EIA for the NELP block MB-OSN-2005/3 (5-Appraisal Wells) 2017
164
29. The distribution of Cadmium, Copper, Nickel, Manganese and Aluminium in surface waters of
the open Atlantic and European shelf area - Deep Sea Research, Vol. 32, No. 5, pp. 531 – 555,
1985, By Klans Kremling
30. Copper, Zinc, Cadmium, Nickel, Iron and Manganese in the Southern Bight of the North Sea -
Marine Pollution Bulletin, Vol. 17, No.3, pp. 113 – 117, 1986, By Rob F. Nolting
31. Toxicants in the aqueous ecosystem, T.R.Crompton, John Wiley and sons, 1997.
32. Trace elements in Sediments of the Western Gulf, Marine Pollution Bulletin, Vol. 27, pp. 103 –
107, 1993, By Ali S. Basaham, and Sultan S. Al – Lihaibi.
33. Environment Protection, Standards, Compliance and Costs, Editor. T.J. Lack, Chapter 9 – The
role and activities of Oslo and Paris Commissions, By F.Bjerre and P.A. Hayward, pp. 142 –
157.
34. An evaluation of level of Iron, Manganese, Lead and Copper in some marine organisms – M.Sc
(Marine Sciences) thesis, University of Goa (March 1997) by S. Fernandes.
35. Ingole, B. S. & A. H. Parulekar. (1998). Role of Salinity in structuring the intertidal meiofauna of
a tropical estuarine beach: Field Evidence. Indian J. Marine Science, 27:356-361.
36. Ansari, Z. A., Ingole, B.S., 2002. Effect of an oil spill from M.V. Sea Transporter on intertidal
meiofauna at Goa, India. Marine Pollution Bulletin, 44: 396-402.
37. Baker, J. M. 1983 Impact of oil pollution on living resourses. Commission on Ecology Papers 4,
218 – 230
38. Bragg, J.R. and Yang, S.H. 1995: Clay – oil flocculation and its role in natural cleansing in
Prince William Sound following the Exxon Valdez Oil Spill. In Exxon Valdez Oil Spill Fate and
Effects in Alaskan Waters, eds P.G. Wells, J.N. Butler and J.S. Hughes, pp. 178 – 214.
American Society for Testing and Materials (1219) Philadelphia, PA.
39. Dauvin J.C., 1998. The fine sand Abra alba community of the Bay of Morlaixtwenty years after
the Amoco Cadiz oil spill. Marine Pollution Bulletin 36, 669-676 Gin, K. Y. H., Huda, MD, K.,
Lim, W. K. and Tkalich, P. 2001 An oil spill – Food chain interaction model for coastal waters.
Marine Pollution Bulletin. 40(7):590-597.
40. Gomez Gesteria, J.L., Dauvin, J.C., Fraga M.S, 2003 Taxonomic level for assessing oil spill
effects on the soft-bottom sublittoral benthic communities. Marine Pollution Bulletin 46(5), 562-
572.
41. Guidetti, P., Modena, M., Mesa, G.L., and Vachhi, M., 2000: Composition, Abundance and
stratification of Macrobenthos in the Marine Area impacted by tar aggregates derived from
Haven oil spill (Ligurian Sea, Italy). Marine Pollution Bulletin, 40(12): 1161-1166.
42. Ingole B., Sivadas, S., Goltekar, R., Clemente, S., Nanajkar, M., Sawant, R., D‘Silva, C.,Sarkar,
A. & Z. Ansari (2006): Ecotoxicological effect of grounded MV River Princess on the intertidal
benthic organisms off goa. Environment International, 32 (2):284-291.
43. Jewett, S.C., Dean, T.A., Smith, R.O. and Blanchard, A., 1999: ‗Exxon Valdez‘ oil spill: impacts
and recovery in the soft-bottom benthic community in an adjacent to eelgrass beds. Marine
Ecology Progress Series 185: 59-83.
44. Lee, R. F. and Page, D. S., 1997. Petroleum hydrocarbons and their effects in sub-tidal region
after Major Oil Spills. Marine Pollution Bulletin 34 (11): 20928-211.
45. Schmidt Ektin, D.,1999: Marine spills worldwide: all sources. The oil Spill Intelligence Report
Series: 30 years of Oil spills. Cutter Information Cooperation, Arlington, MA, 56pp.
46. Albert West Phal (1976) Protozoa Blackwell , London

Pre-drill EIA for the NELP block MB-OSN-2005/3 (5-Appraisal Wells) 2017
165
47. Banerjee, R.K. (1989) Heavy metals and benthic foraminiferal distribution along Bombay coast
India. Studies in benthic foraminifera. Tokyo University Press Tokyo pp 151-157
48. Dey, F. (1889) The fauna of British India Ceylon and Burma- Fishes Vol-1- Vol-2 Taylor and
Francis London
49. Desikachary, T.V. (1989) Atlas of diatoms, Madras Science Foundation
50. Desikachary, T.V.(1959) Cyanophyta ICAP Monographs on Algae Indian Council of Agricultural
research New Delhi
51. Faiza Yousif AL-Yamani,& Maria A. Saburova (2010) Illustrative guide on the flagellates of
Intertidal soft sediment Kuwait Institute for scientific Research Kuwait
52. Faiza yousif Al-Yamani, Valeriy Skryabin, Aleksandra Gubanova, Sergey Khvorov and Irina
Prusova (2011), Marine zooplankton Practical guide from North western Arabian gulf Vol-1 and
vol-2 Kuwait Institute for scientific Research Kuwait
53. Fauvel P. (1953), The fauna of India Annelida - Polychaeta Indian Press Allahabad
54. Hayward P. J. & Ryland J.S. (1995) Handbook of Marine fauna of north –West Europe Oxford
University Press London
55. Higgins R.P. & Hajamar Thiel Eds. (1998) Introduction to the study of Meio Fauna
56. Horace G. Barber & Elizabeth Y., Haworth (1981) A guide to the Morphology of Diatoms
Frustules.
57. Ingram Hendey (1964) An introductory account of smaller Algae of British coastal waters part-
V. Bacillariophyceae
58. John H. Wickstead (1965) An Introduction to the study of Tropical Plankton .Hutchinson
Tropical Monographs
59. Joyothibabu,R. Madhu, N.V. Maheshwaran, P.A,, Nair K.K.C., Venugopl, P. &
Balasubramanian, T.(2005) Dominance of Dinoflagellates in micro zooplankton communities in
the oceanic region Bay of Bengal and Andaman sea Current science vol.84. 10th May 2003
60. Kasturirangan, L.R. (1963) A key for the identification of the Common Planktonic Copepoda of
Indian Coastal water
61. Manal Al-Kandari, FaizA Y. Al-Yamani & Kholood Al-Rifaie (2009) Marine phytoplankton Atlas
of Kuwait‘s water Kuwait Institute for scientific Research
62. MPEDA (1998) Commercial Fishes and shell fishes of India
63. Newel G.E. & Newell R.C. (1963) Marine plankton a Practical Guide Hutchinson Educational
64. NIGAM R.C. & CHATURVEDI S.K. (2000) Foraminiferal Study from Kharo Creek, Kachchh
(Gujarat) North west coast of India. Indian Journal of marine science Vol.29 133-189
65. Olav Giere (1993) Meiobenthology , Microscopic Fauna in Aquatic Sediments m Springer
London
66. Perragallo (1965) Diatomees Marines de France A. Asher & Co. Amsterdam
67. Robert P. Higgins (Eds.), (1985) An introduction to the study of Meuio fauna Smith sons
Institution press Washington DC
68. Sterrer W. & Sterrer C.S Eds. Marine Fauna and Flora of Bermuda A systematic Guide to the
Identification of Marine Organisms. John Wiely and Sons New York
69. Suresh Gandhi M. (2009) Distribution of certain ecological parameters and Foraminiferal
distribution in the depositional environment of Pak strait east coast of India .Indian J. of Marine
Science Vol.33 pp 287-295

Pre-drill EIA for the NELP block MB-OSN-2005/3 (5-Appraisal Wells) 2017
166
ToR issued by MoEF&CC for the NELP VII block MB-OSN-2005/3 (Scanned copy) Annexure – I

Pre-drill EIA for the NELP block MB-OSN-2005/3 (5-Appraisal Wells) 2017
167

Pre-drill EIA for the NELP block MB-OSN-2005/3 (5-Appraisal Wells) 2017
168

Pre-drill EIA for the NELP block MB-OSN-2005/3 (5-Appraisal Wells) 2017
169
Annexure – II

Pre-drill EIA for the NELP block MB-OSN-2005/3 (5-Appraisal Wells) 2017
170
Annexure - III
EQUIPMENT AND APPLICABLE STANDARDS
Sl. No.
Equipment Verification retirements Reference Standard
1 Drilling structure, Derick floor, sub structure, lifting equipment.
A. Derrick / structures i. Structures have been designed and fabricated by manufacturers as per API Spec 4F or equivalent. This verification should include structural safety level (refer sections 6 and B.6 of API Spec 4F). ii. Different categories‘ inspection(s) of derrick, structures and drill floor have been carried out as per section 6 of API RP 4G or equivalent and OEM‘s recommendations, besides Non Destructive Examination (NDE) as considered necessary. Chairmen cum managing director iii. Repair and modification of structures (if carried out, based on inspection) have been carried out as per section 7 and 8 respectively of API RP 4G or equivalent and OEM‘s recommendations. Quality control of repair and modification has been ensured in line with requirements of section 11 of API SPEC 4F or equivalent. B. Drilling equipment i. Installation, inspection and maintenance of IC engines have been carried out as per API Spec 7C-11F or equivalent and OEM‘s recommendations. For minimizing potential fires and/or explosions in the operations of IC engines requirements given in Appendix A of API Spec 7C-11F or equivalent, are being followed. Functional testing of safety devices and emergency stop function has been carried out. ii. Design, inspection and operating limits of drill stem components is as per API RP 7G or equivalent. iii. Design of drilling equipment (rotary equipment, slush pumps, power tongs and draw works) is as per API Spec 7K or equivalent. iv. Inspection, maintenance and repair of rotary equipment, slush pumps, power tongs and draw works has been carried out as per API RP 7L or equivalent and OEM‘s recommendations. Inspection has included NDE and/or opening of equipment as considered necessary. Functional testing of safety devices and emergency stop function has been carried out. v. Design of drilling hoisting equipment is as per API Spec 8A and API Spec 8C or equivalent. vi. Inspection, maintenance and repair of hoisting equipment are as per API RP 8B or equivalent and OEM‘s recommendations. Inspection of hoisting equipment has focused on structural integrity and personnel protection. Category III and IV inspection has included NDE / MPI and/or opening of equipment as considered necessary. Functional testing of safety devices and emergency stop function has been carried out.
API Spec 4F (3rd Edition 2008) API RP 4G (3rd Edition, 2004) API RP 4G(3rd Edition, 2004) API Spec 4F (3rd Edition 2008) API Spec 7C-11F (5th Edition 1994) API RP 7G API Spec 7K API RP 7L API Spec 8A and API Spec 8C API RP 8B

Pre-drill EIA for the NELP block MB-OSN-2005/3 (5-Appraisal Wells) 2017
171
vii. Minimum requirements and terms of acceptance of steel wire ropes as per API Spec 9A / ISO 10425 or equivalent are being followed. viii. Field care (inspection) and use of wire rope and evaluation of rotary drilling line has been carried out as per API RP 9B or equivalent. ix. Inspection of piping and piping systems has been carried out as per API RP 570 and API RP 574. x. Pressure vessels have been inspected externally and internally; thickness measurement / crack detection tests have been carried out as deemed necessary. Pressure testing at a pressure equal to maximum allowable working pressure has been carried out. Safety valves / instrumentation have been tested.
API Spec 9A / ISO 10425 API RP 9B API RP 570 and API RP 574
2 Well Control Systems: blow out preventers, diverters, marine risers, choke and kill system, control systems for well control equipment.
A. Design of drill through equipment / blowout prevention equipment – ram and annular blowout preventers, hydraulic connectors, drilling spools, adaptors etc. is as per API Spec 16A / ISO 13533 or equivalent. Records of maintenance (including major inspection as per section 17.10.3 of API RP 53 and OEM‘s recommendations) have been reviewed. Installation and testing (complete performance testing including functional and pressure tests) of blow out control equipment is being carried out in line with API RP 53 or OISD-RP-174 or equivalent. B. Design and maintenance of diverter systems is as per API RP 64 or equivalent. Inspection and testing of diverter systems has been carried out as per API RP 64 or OISD-RP-174 or equivalent. C. Design of choke and kill systems are as per API Spec 16C or equivalent. Pressure testing of choke and kill systems is being carried out in line with API RP 53 or OISD-RP-174 or equivalent. Flexible choke and kill lines and choke manifold are inspected as per section 17.10.3 of API RP-53(3rd Edition 1997) and OEM‘s recommendations. D. Design of control systems for well control equipment and diverter equipment is as per API Spec 16D and API RP 53 or equivalent and performance requirements/ testing, inspection and maintenance is as per API RP 53 or OISD-RP-174 or equivalent and OEM‘s recommendations. E. Marine drilling riser systems for floating drilling operations have been selected, operated and maintained in line with API RP 16Q or equivalent. Design, manufacture and fabrication of marine drilling riser system and associated equipment used in conjunction with a subsea blowout preventer (BOP) stack are as per API Spec 16F or equivalent. Design and standards of performance for marine drilling riser coupling is as per API Spec 16R or equivalent. Risers and riser couplings / joints are being inspected for wear, cracks and corrosion; thickness measurement has been carried out as required.
API Spec 16A (3rd Edition 2004) / ISO 13533 (2001) API RP 53 (3rd Edition 1997) or OISD-RP-174 API RP 64 or OISD-RP-174 API Spec 16C API RP 53(3rd Edition 1997) or OISD-RP-174 API Spec 16D and API RP 53 API RP 53 or OISDRP-174 API RP 16Q API Spec 16F / API Spec 16R
3 Man riding equipment Selection of man riding equipment is done ensuring that equipment is suitable for man riding operations, and the equipment are inspected and maintained regularly
4 Location keeping systems: anchoring, mooring, dynamic
Verify that MODU‘s location keeping and stability characteristics are suitable for the environmental (including sea bed and soil
API RP 2SK (for location keeping)

Pre-drill EIA for the NELP block MB-OSN-2005/3 (5-Appraisal Wells) 2017
172
positioning, compensator and disconnection systems.
conditions) and operating conditions envelope. Inspection and maintenance of mooring hardware is as per API RP 2I or equivalent and OEM‘s recommendations; and design, manufacturing and maintenance of synthetic fiber ropes for offshore mooring is as per API RP 2 SM or equivalent.
MODU code (for stability) API RP 2I API RP 2 SM
5 Drilling fluid handling and cementing system
Physical condition of the equipment is satisfactory and instrumentation, safety alarms and pressure safety valves are being tested regularly.
6 Electrical Systems A. Design and maintenance of electrical systems is as per IMO MODU code meeting requirements of industry standards API RP 500 or API RP 505. B. Inspection and functional testing of emergency power system is being carried out.
MODU code API RP 500 API RP 505
7 Safety systems (exclude items which are covered by MODU safety certificate, provided the rig has valid MODU safety certificate
A. Inspection and testing of the following safety systems is being carried out periodically: − Fire detection system − Gas detection system – HC and H2S − Drilling operations related alarm system − Lifesaving appliances − SCBA − Gas measuring devices − Firefighting system − Communication systems B. Safety systems are as per MODU code requirements, as applicable.
8 Cranes (If classed certificate notation does not cover cranes)
A. Design and testing of pedestal mounted offshore cranes are as per API Spec 2C or equivalent. B. Operations and maintenance of offshore cranes are as per API RP 2D or equivalent. Inspection has focused on structural integrity and includes: − Blocks and sheaves − Wire ropes and end attachments − Hooks − Bearings − Shackles − Securing arrangements − Support structure − Axle pin and housing C. Inspection and function testing has included: − Correct adjustment of brakes − Resistance measurement of electrical systems − Leakages in hydraulic systems D. Load charts have been verified by carrying out load tests as per applicable requirements. Functional testing of safety devices and emergency stop function are being carried out
API Spec 2C API RP 2D
9 Helideck (If classed certificate notation does not cover helideck)
Inspection has included: − Structural integrity of deck and supporting structure − Surface of deck − Obstacles and marking − Safety net − Fire safety arrangements

Pre-drill EIA for the NELP block MB-OSN-2005/3 (5-Appraisal Wells) 2017
173
Annexure - IV
COMPARATIVE ECOTOXICITIES
Comparative ecotoxicitities (96 hrs LC50 values) of SPP of 15 different system drilling fluids
for one species of sensitive pawn (Penaeus monodon) and one species of fish (Mugil cephalus) are
summarized in the following table.
Comparative 96 hrs LC50 values (ppm) of different WBM samples in response to species of prawn (Penaeus monodon) and fish (Mugil cephalus).
Sample
No. Drilling Fluid System
Test Species Permissible
Limit* P. monodon M. cepjalus
Clay Free Non Damaging System ppm (%) ppm (%) (%) or (ppm)
1 KCL-PHPA System 103,100 10.31 113700 11.37 >3.0% or >30,000
2 CL-CLS System 77,700 7.77 77800 7.78 >3.0% or >30,001
3 HTHP System 84,100 8.41 87800 8.78 >3.0% or >30,002
4 Biopolymers System (TSP) 97,200 9.72 83600 8.36 >3.0% or >30,003
5 KCL-KOH-K-Lignite System 81,900 8.19 93000 9.30 >3.0% or >30,004
6 Potassium Formate System 62,100 6.21 53000 5.30 >3.0% or >30,005
7 KCL-Polyol System 58,600 5.86 47600 4.76 >3.0% or >30,006
8 Sodium Formate System 37,100 3.71 46000 4.60 >3.0% or >30,007
9 Low Lime System 102,400 10.24 121900 12.19 >3.0% or >30,008
10 Choline Chloride based System 120,200 12.02 112500 11.25 >3.0% or >30,009
11 Mixed metal oxide System 55,100 5.51 56600 5.56 >3.0% or >30,010
12 HGS System 50,900 5.09 48700 4.87 >3.0% or >30,011
13 Silicate Mud System 44,100 4.41 46100 4.61 >3.0% or >30,012
14 Low Toxic mineral Oil based Mud
system
255,200 25.52 261100 26.11 >3.0% or >30,013
*Permissible limit (96 hrs LC50) as specified by the Ministry of Environment and Forests, Govt. of India vide G.S.R. 546 (E)- dated 30th August, 2005 is >30,000 mg/l or >3.0%
The 96 hrs LC50 values of 15 water based drilling fluid systems to post larvae of black tiger
prawn (Penaeus monodon) were found to be range from 37,100 ppm (3.71%) for KCL-Polyol System to
255,200 ppm (25.52%) for Silicate Mud System drilling respectively. On the other hand, 96 hrs LC50
values of different drilling fluid systems tested using larvae of grey mullet (Mugil cephalus) were found
to be range from 46,000 ppm (4.60% for KCL-Polyol System to 261,100 ppm (26.11%) for Silicate Mud
System, respectively.
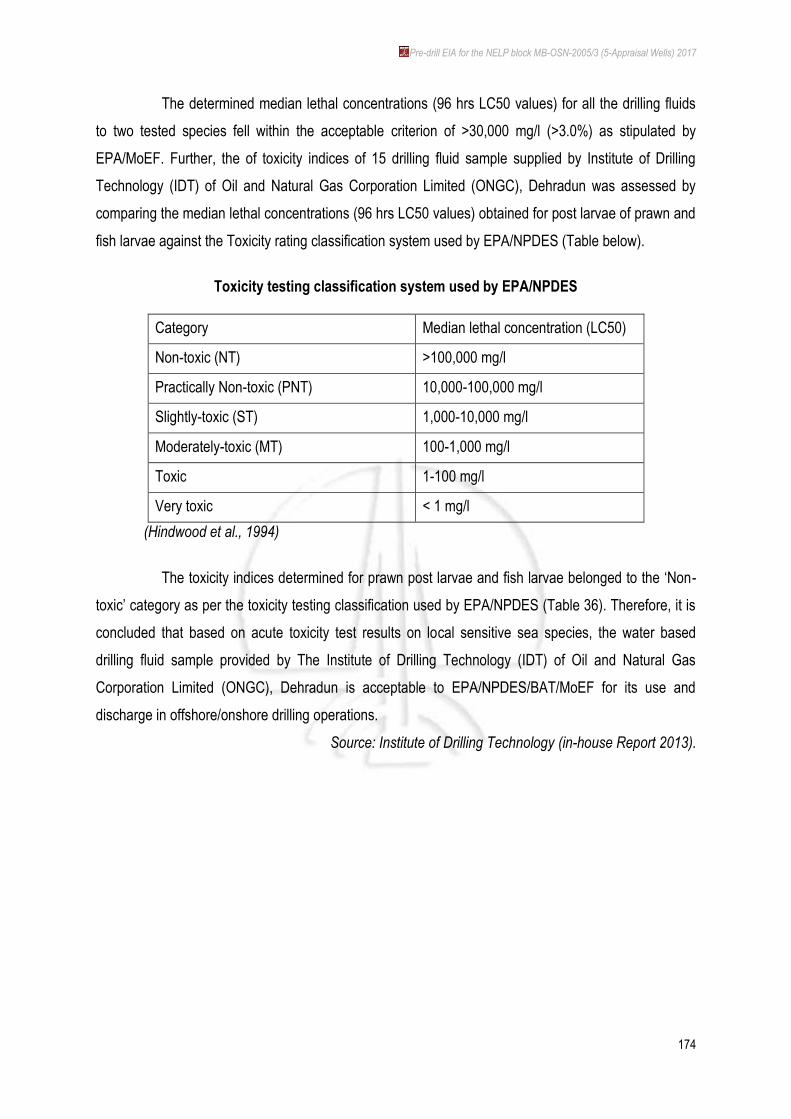
Pre-drill EIA for the NELP block MB-OSN-2005/3 (5-Appraisal Wells) 2017
174
The determined median lethal concentrations (96 hrs LC50 values) for all the drilling fluids
to two tested species fell within the acceptable criterion of >30,000 mg/l (>3.0%) as stipulated by
EPA/MoEF. Further, the of toxicity indices of 15 drilling fluid sample supplied by Institute of Drilling
Technology (IDT) of Oil and Natural Gas Corporation Limited (ONGC), Dehradun was assessed by
comparing the median lethal concentrations (96 hrs LC50 values) obtained for post larvae of prawn and
fish larvae against the Toxicity rating classification system used by EPA/NPDES (Table below).
Toxicity testing classification system used by EPA/NPDES
Category Median lethal concentration (LC50)
Non-toxic (NT) >100,000 mg/l
Practically Non-toxic (PNT) 10,000-100,000 mg/l
Slightly-toxic (ST) 1,000-10,000 mg/l
Moderately-toxic (MT) 100-1,000 mg/l
Toxic 1-100 mg/l
Very toxic < 1 mg/l
(Hindwood et al., 1994)
The toxicity indices determined for prawn post larvae and fish larvae belonged to the ‗Non-
toxic‘ category as per the toxicity testing classification used by EPA/NPDES (Table 36). Therefore, it is
concluded that based on acute toxicity test results on local sensitive sea species, the water based
drilling fluid sample provided by The Institute of Drilling Technology (IDT) of Oil and Natural Gas
Corporation Limited (ONGC), Dehradun is acceptable to EPA/NPDES/BAT/MoEF for its use and
discharge in offshore/onshore drilling operations.
Source: Institute of Drilling Technology (in-house Report 2013).

![ONGC Board approves Field Development Plan (FDP) for development of Cluster 2 fields of Deep-water NELP Block KG-DWN-98/2 [Company Update]](https://static.fdocuments.us/doc/165x107/577c838f1a28abe054b56903/ongc-board-approves-field-development-plan-fdp-for-development-of-cluster.jpg)