Environmental Assessment of a Golf...
102
Environmental Assessment of a Golf Course First Step Towards Environmental Product Declarations (EPD) Master of Science Thesis in the Master’s Programme, Industrial Ecology HANSSON SANDRA PERSSON IDAMARIA Department of Energy and Environment Division of Physical Resource Theory CHALMERS UNIVERSITY OF TECHNOLOGY Gothenburg, Sweden, 2012 Report No. 2012:5
Transcript of Environmental Assessment of a Golf...

Environmental Assessment of a Golf Course First Step Towards Environmental Product Declarations (EPD)
Master of Science Thesis in the Master’s Programme, Industrial Ecology
HANSSON SANDRA
PERSSON IDAMARIA
Department of Energy and Environment
Division of Physical Resource Theory
CHALMERS UNIVERSITY OF TECHNOLOGY
Gothenburg, Sweden, 2012
Report No. 2012:5

ii
Environmental Assessment of a Golf Course – A First Step Towards Environmental
Product Declarations (EPD)
SANDRA HANSSON & IDAMARIA PERSSON
© Sandra Hansson & IdaMaria Persson, 2012
Report No. 2012:5
Physical Resource Theory
Department of Energy and Environment
Chalmers University of Technology
SE-412 96 Göteborg
Sweden
Telephone +46(0)31-772 1000
Printed by Chalmers Reproservice
Göteborg, Sweden 2012

iii
Abstract
The purpose of this master’s report is to address the challenges of decreasing golf
courses’ environmental impact and increasing their ability to communicate their
environmental performance. Sustainability and the environment are hot topics in the
society nowadays and that is also the case for golf in Sweden which is why this work
was initiated by the Swedish Golf Federation (SGF) and two golf clubs; Forsgården
Golfklubb and Kungsbacka Golfklubb.
A lifecycle assessment (LCA) is performed on three golf courses, Forsgården GK and
two fictive golf courses, Best Case GK and Worst Case GK. The two fictive golf
courses are created in order to cover most of the golf courses in Sweden. From the three
LCA studies hotspots for the golf course management are identified. Hotspots are the
resources contributing to the most significant environmental impacts. The hotspots
identified are: Alkylate, Diesel, Electricity, Environmental Diesel, Fertilizer N,
Fertilizer P, Green Electricity, Herbicides, Office Paper, Petrol and Sand.
A tool is created based on the hotspots identified. The tool is a web application
supposed to improve the communicability of golf clubs’ environmental performance but
also facilitate internal environmental work on golf clubs. From the web application two
documents can be derived, a short version for communication to stakeholders and a long
version for the golf club’s internal work.
Transport to and from the golf course is not included in the LCA studies but is briefly
studied in a screening of the golfer’s environmental impact. The results of the golfer’s
environmental impact indicate that the transportation back and forth to the golf club
often caused larger environmental impacts than the actual round of golf. Restaurants
and golf shops are not studied.
The results from the LCA studies pointed out that some of the resources had a large
environmental impact but that they can be reduced. Golf clubs use a lot of sand and the
sand is often transported long distances, by buying sand from a local supplier the
transportation and the related emissions can be reduced. Also by choosing green
electricity instead of regular electricity the environmental impact can be reduced.

iv

v
Acknowledgements
This thesis has been carried out at the Master’s programme “Industrial Ecology - for a
Sustainable Society” at Chalmers University of Technology. The thesis was initiated by
the Swedish Golf Federation (SGF) and two golf clubs; Forsgårdens Golfklubb and
Kungsbacka Golfklubb, and we would like to thank you all for your cooperation and
support. We would also like to thank CPM - The Swedish Life Cycle Center, IVL
Swedish Environmental Research Institute and Akzo Nobel for your guidance and
inspiration.
We would like to thank our supervisor and examiner, Ulrika Lundqvist, for her constant
support and good advice. At last we also want to thank our families and friends for
supporting us throughout this project with all the ups and downs.
Göteborg May 2012
Sandra Hansson and IdaMaria Persson

vi

vii
Abbrevations and Nomenclature
Agronomists - The agronomists are part of the Swedish Golf Federation (SGF) and
each of them has responsibility over a geographical region. They are also providing
guidance for golf clubs.
AP - Acidification Potential
Characterization - The relative contributions of the emissions and
resource consumption to each type of environmental impact. For example, all emissions
of greenhouse gases may be aggregated into one indicator for global warming and all
acidifying emissions into one indicator for acidification.
EP - Eutrophication Potential
EPD - Environmental Product Declaration
Fairway - The play area between tee and green with grass high (10-15 mm) and has less
intensive maintenance than a green and tee.
GEO - Golf Environment Organization
GIT - The Swedish golf IT system
Green - The area of a golf course which has the shortest grass (3-5 mm) and the most
intensive maintenance. The green is the grass area that is specially prepared for putting.
Green fee - The fee for playing golf, paid by the golfers.
GWP - Global Warming Potential
Hotspots - The resources contributing to the most significant environmental impacts.
Impact Category - The category the environmental impact is described in, e.g. global
warming potential or acidification potential.
Intangibles - Values hard to quantify, e.g. ecosystem quality.
ISO - International Organization for Standardization
ISO 14000 - Environmental Management Standards
LCA - Lifecycle Assessment
PCR - Product Category Rules, common and harmonized calculation rules that have to
be established to ensure that similar procedures are used when creating EPDs.
POP - Photochemical Oxidation Potential
Screening - A simplified LCA study. If speed or budget is more important than
precision, a screening can be made using already available or estimated data in
databases. For missing data provisional alternatives are used.
SGF - Svenska Golf Förbundet (Swedish Golf Federation)
SimaPro 7 - A computer application for Lifecycle Assessment (LCA).
Stakeholders - Someone that is directly or indirectly affecting or affected by the
organization/ company
Tangibles - Measurable values, e.g. CO2 emissions.
Tee - The starting place for the hole to be played with grass high (about 10 mm) and has
just less intensive maintenance than a green.
Turf - The grass covering golf courses.

viii

ix
Table of Contents
1. Introduction .................................................................................................................. 1
1.1 Background ............................................................................................................. 1
1.2 Purpose ................................................................................................................... 3
1.3 Objectives ............................................................................................................... 3
1.4 Delimitations .......................................................................................................... 3
2. Methodology ................................................................................................................. 5
2.1 LCA of Forsgården GK .......................................................................................... 6
2.2 LCA of Best Case GK and Worst Case GK ........................................................... 7
2.3 Determining the Hotspots ....................................................................................... 8
2.4 Screening of the Golfer’s Environmental Impact ................................................... 8
2.5 Development of the Tool ........................................................................................ 9
3. Results of Forsgården LCA ........................................................................................ 11
3.1 Results of the Inventory Analysis of Forsgården GK........................................... 11
3.1.1 Flow Charts ................................................................................................... 12
3.1.2 Resources and Related Amounts for Forsgården GK .................................... 17
3.2 Results of the Impact Assessment of Forsgården GK .......................................... 18
3.2.1 Characterisation ............................................................................................. 18
4. LCA of Two Fictive Golf Clubs ................................................................................. 25
4.1 Differences Between Golf Courses in Sweden..................................................... 25
4.2 Results of the Inventory Analysis of Best Case GK and Worst Case GK ............ 26
4.2.1 Resources and Related Amounts for Best Case GK and Worst .................... 27
Case GK .................................................................................................................. 27
4.3 Results of the Impact Assessment of Best Case GK and Worst Case GK ........... 28
4.3.1 Characterisation ............................................................................................. 28
5. Identified Hotspots ..................................................................................................... 39
5.1 Resources Above the Limit .................................................................................. 39
5.2 Possible Hotspots .................................................................................................. 45
5.3 Final Hotspots ....................................................................................................... 46
6. Screening of the Golfer’s Environmental Impact ....................................................... 47
6.1 Transportation ....................................................................................................... 47
6.2 Equipment ............................................................................................................. 48
7. The Tool ..................................................................................................................... 51

x
8. Discussion and Conclusion ......................................................................................... 59
8.1 Discussion and Conclusion on the Methodology Used ........................................ 59
8.2 Discussion and Conclusion on the Results ........................................................... 61
8.3 Discussion and Conclusion on Future Research................................................... 62
9. References .................................................................................................................. 65
Appendix I ...................................................................................................................... 69
Appendix II ..................................................................................................................... 73
Appendix III ................................................................................................................... 75
Appendix IV ................................................................................................................... 77
Appendix V .................................................................................................................... 79
Appendix VI ................................................................................................................... 87
AppendixVII ................................................................................................................... 91

1
1. Introduction
1.1 Background Golf is one of the largest sports in Sweden (Riksidrottsförbundet, 2011) with almost
half a million members and more than 480 golf clubs (SGF, 2011 A). The sport is not
just one of the largest regarding the number of members, it is also the sport requiring the
largest areas of land (Gange, Lindsay and Schofield, 2003). Occupying and managing
large areas of land have an impact on the environment which is naturally the case for
golf courses.
Besides occupying large areas of land, golf courses use pesticides, fertilizers, water for
irrigation, electricity etcetera. (Salgot and Tapias, 2006). At the end of the 21st century,
golf courses started to be associated with a negative environmental impact (Wheeler and
Nauright, 2006). The use of chemicals on the courses made the public question possible
effects on humans and the environment. “The peak of the global golf movement has
coincided with the peak of the environmental awareness movement, and more people
have become less tolerant of the impact that courses have.” (Wheeler and Nauright,
2006). Media has played a big part in the public perception of golf’s environmental
impact. On one hand media has made the public aware about the negative impacts golf
courses have, for instance the pesticide use, but on the other hand big championships
and tournaments broadcasted all over the world has made a perfect, flawless, green turf
the point of reference, causing high expectations among golfers. These expectations put
pressure on golf courses to achieve perfect turf, just like the turf seen in media, but
sustaining such turf often needs chemicals, which have a negative environmental
impact. The famous golf courses have other prerequisites than the average golf courses.
One of these famous golf courses is the Augusta National in the United States. The
course is held in abeyance for up to four months after a championship or tournament,
repairing and treating the damage which is often the case for this kind of courses
(Wheeler and Nauright, 2006). There is a wide range of different types of golf courses,
all the way from the average golf course to golf courses such as the Augusta National.
Common for all these golf courses are the expectations, which generally are very high
and often unrealistically high.
There is an increasing awareness of problems connected to pesticide use in Sweden.
There are regulations regarding the pesticide use, for example golf courses located in
primary water protection zones are not allowed to use pesticides at all in compliance
with the Swedish Environmental Protection Agency (14 § SNFS 1997:2). According to
the 11§ (SNFS 1997:2), all sports facilities in Sweden are obliged to report anticipated
pesticide use to the municipality. Sweden is not the only country taking actions against
pesticide use, the Danish government has decided on phasing out pesticide use on golf
courses completely (Dansk Golfunion, 2012). Sweden’s Environmental Protection
Agency, Naturvårdsverket, wanted to investigate golf courses’ pesticide use and
dissipation and ordered a juxtaposition which resulted in the report “Use and dissipation

2
of plant protectants at golf courses” carried out by WSP Environmental (WSP
Environmental, 2009). The result of this study showed that the Swedish golf clubs tends
to use pesticides in accordance with the restricted amount.
Golf courses’ environmental impact is not only a governmental concern but also a
concern for other stakeholders such as the Swedish Golf Federation (SFG) and golf
clubs. The Swedish Golf Federation, SGF, encourages the golf courses in Sweden to
decrease their environmental impact, and to change the negative public perception of
golf’s environmental impact.
Environmental work has been a part of SGF’s agenda for quite some time. In 1999 SGF
established an environmental diploma, “SGF:s Miljödiplom”. The diploma is handed
out to golf clubs that have initiated their environmental work and an example of a
criteria for receiving the diploma is to have established an environmental plan and
policy for the golf club (SGF, 2011 B). Golf clubs can only receive the diploma once
and their environmental plan should then be audited every year in consultation with an
SGF agronomist.
In addition to the SGF environmental diploma there is an international organization, the
Golf Environment Organization (GEO) that has a certification program which is the
natural continuance for ambitious golf clubs. After getting certified according to the
GEO a re-certification is required every third year in order to keep staying certified
(GEO, n.d.).
The GEO certification and the SGF diploma both consider tangibles and intangibles.
Tangibles, such as resource use and emissions are possible to quantify while the
intangibles, such as ecosystem quality etcetera are harder measure. The intangibles can
however be measured, for example, by counting the amount of species on the golf
course. Both GEO and SGF are requiring some quantification of the tangibles and
intangibles, but neither require an assessment of the tangibles environmental impacts.
Additionally, both the GEO certificate and SGF diploma have some difficulties to
communicate the environmental performance to stakeholders in a perspicuous and
compact way.
Hence there is a need of a study that assesses the environmental impacts for the
tangibles and improves the communicability and comparability of golf clubs
environmental performance. An environmental product declaration (EPD) is a way of
presenting life cycle assessment (LCA) results in a standardized way in order to enable
approachable and comparable results that are easier to communicate to stakeholders
(The International EPDsystem, 2012). An EPD can be a suitable option for presenting
golf courses environmental performance for future reference and this report is the first
step towards this. The Swedish Golf Federation (SGF) and two golf clubs; Forsgårdens
Golfklubb and Kungsbacka Golfklubb have initiated this master’s report.

3
1.2 Purpose The purpose of this master’s report is to address the challenges of decreasing golf
courses’ environmental impact and increasing their ability to communicate their
environmental performance.
1.3 Objectives To describe what kind of activities that are connected to golf courses and to
determine what different environmental impacts they have.
Perform three Life Cycle Assessments of three different golf courses;
Forsgården GK, Best Case GK and Worst Case GK.
To identify and distinguish the resources contributing to the most significant
environmental impacts on a golf course, i.e. the hotspots.
Create a tool to assess and improve the communicability of golf courses’
environmental performance based on the identified hotspots.
Perform a screening of the golfer’s environmental impacts.
1.4 Delimitations The geographical boundaries are set to only include Sweden.
Restaurants and golf shops are excluded.
Transportation to and from the golf course is excluded.
Waste treatment is excluded.
The construction of golf courses and related buildings is excluded.
The production of maintenance equipment is excluded.
The study is not considering intangible values.
The positive or negative effects of the terrestrial CO2 uptake are not considered.

4

5
2. Methodology
The activities on golf courses and their impacts have been mapped and determined
through three LCA studies of three different golf courses, Forsgården GK and the two
fictive golf courses Best Case GK and Worst Case GK. Hotspots have been identified
from the LCA studies by characterization. The impact categories have been chosen
based on the impact categories in Environmental Product Declaration Standard, ISO
14025. The LCA studies have also been complemented with a screening, adding the
contribution of the golfer’s environmental impacts. Finally, a web application has been
developed in order to simplify environmental assessment of golf courses and also
facilitate communication of the results to stakeholders.
Figure 1: An overview of the work flow in this report. All parts are described
subsequently.

6
2.1 LCA of Forsgården GK The focus of the LCA study of Forsgården GK has been golf course management since
that is the part that the golf club itself can affect. The aim of the LCA study has been to
declare Forsgården’s environmental impact in order to find the hotspots in golf course
management. The LCA of Forsgården GK is a gate-to-gate study.
The LCA study has been carried out in the LCA software SimaPro. SimaPro has
databases with data of production of resources and emissions connected to this (PRé
Consultants, 2010). Characterization, normalization and weighting etcetera are
automatically calculated for the resources and only the amount and the linkage between
the resources are added. Some information such as emissions from combustion of fuels
and leakage from fertilizers are not included and has therefore been determined and
added to SimaPro. The resources used and the assumed emissions are presented in
appendix V and VI.
An 18-hole round of golf has been chosen as the functional unit and the golf round has
been seen as a service. The unit focuses on golf course operation and is easy for
stakeholders to relate to. Also golf clubs with high utilization are encouraged since high
utilization affects the results positively and high utilization is seen as having a high
public welfare. Forsgården GK both has one 18-hole and one 9-hole golf course. A 9-
hole round of golf is assumed to equal half an 18-hole round of golf, thus half the
amount of 9-hole rounds are added to the total amount of 18-hole rounds. Most of the
18-hole rounds but no 9-hole rounds are registered in GIT (Golf’s IT system), therefore
the estimated number of both 18-hole and 9-hole golf rounds have been used to
calculate the results per functional unit.
The system boundaries have been based on considering a golf round as a service and
what should be included in the study is the same that is included in the green fee.
Therefore the restaurant and the golf shop have been excluded from the LCA study
since their services are not included in the green fee. The construction of the golf course
and the related buildings has also been excluded from the study, since the construction
is not possible to affect subsequently for the existing golf courses. The focus is instead
on golf course operation which can be affected. The production of maintenance
equipment has been excluded from the study since it is considered as capital goods
where the emissions from the production are negligible compared to the emissions
connected to the usage phase (Baumann and Tillman, 2004).
All flows connected to this LCA study are presented in several flow charts. The main
flow chart of Forsgården GK has been divided into three modules; upstream activities,
core module and downstream activities, where all activities inside the core module are
within the system boundaries. The activities inside the core module are described
further with additional flow charts.

7
The data collection for the resource use for all activities in the golf course operation has
been made through interviews with employees, suppliers and by annual reports and data
at Forsgården golf course. All data for Forsgården GK is taken from 2011’s resource
consumption. The database in SimaPro has been used, but with some additions,
presented in appendix V-VI. No allocation has been made since the resource use for the
whole system has been envisaged and has not been divided per activity.
The impact assessment describes the environmental loads in the inventory analysis and
narrows down the number of parameters by aggregating the relative contributions into
the chosen impact categories (Baumann and Tillman, 2004). An LCA can consist of
three parts, classification, characterization and weighting. For this study only
classification and characterization have been considered. Both the classification and
characterization are automatically done in SimaPro, thus only the characterization is
presented.
The impact categories have been chosen based on the impact categories used in EPD.
Since the master’s report is a first step towards EPD, the structure has been influenced
by the structure of EPDs. Global Warming Potential (GWP), Photochemical Oxidation
Potential (POP), Ozone Depletion Potential (ODP), Acidification Potential (AP) and
Eutrophication Potential (EP) are the impact categories chosen.
2.2 LCA of Best Case GK and Worst Case GK Additionally, two LCA studies have been performed of two fictive golf clubs; Best Case
GK and Worst Case GK, in order to create a range covering most of the golf clubs in
Sweden. The aim of the LCA studies is that most Swedish golf clubs end up within the
range of Best Case GK and Worst Case GK so that the hotspots derived are
representative for Sweden and that possible hotspots that have not been covered by the
LCA of Forsgården are identified.
In order to determine differences and deviations between golf clubs in Sweden
interviews with SGF agronomists have been made. The SGF agronomists are each
responsible for different geographical regions of Sweden. Furthermore, several
municipalities in Sweden have also been contacted to collect data for the use of
pesticides on different golf courses. The golf courses were randomly selected and were
all located in different geographical regions. Forsgården GK has been the starting-point
for Best Case GK and Worst Case GK, however the assumptions have, besides the
interviews with the SGF agronomists, also been based on interviews with other people
well conversant in the respective area. Assumptions made on patterns of usage and
periodicity of replacing parts and materials are derived from these interviews.
Additionally, a literature review has been performed in order to broaden the view of
golf course management. Results from other LCA studies have also been used.
In order to make all three LCA studies performed in this report comparable, the same
base assumptions have been made and are performed similarly. It has been assumed that

8
all have the same amount of 18-hole rounds and the same system boundaries apply. The
results are presented in the same way as for Forsgården GK with the exception that no
redundant information is presented, only the differences.
2.3 Determining the Hotspots The hotspots of golf course management have been determined based on the results of
the characterization of the three LCA studies, Forsgården GK, Best Case GK and Worst
Case GK. All resources are categorized as definitive, possible or no hotspots. The final
hotspots consist of all the definitive hotspots plus the possible hotspots that have been
analyzed and determined to be final hotspots.
To determine if a resource is a definitive, possible or no hotspot, the relative
contributions of the resources for each impact category have been assessed. One impact
category at a time has been studied and resources contributing with more than 1% have
been marked with an “X” in the table (Table 1). The limit has been set to 1% in order to
get high coverage and include the resources with the most significant impacts.
Resources with two or three “X:es” are definitive hotspots even if they have just been
considered as definitive hotspots in one of the impact categories. Resources with no
“X:es” at all in all of the impact categories are considered to be no hotspots, while
resources with one “X” in one or more of the impact categories are considered to be
possible hotspots.
Impact
category
Resources Forsgården
GK
Best case
GK
Worst case
GK
Hotspots
Diesel x x x Definitive hotspot
Petrol x x Definitive hotspot
Fertilizer x Possible hotspot
Water No hotspot
Table 1: Example table of how the hotspots are determined. The resources are just
examples and not a result.
If a possible hotspot has only been over the 1% limit for Best Case GK the possible
hotspot is not considered a hotspot. Since no fossil fuels consumption occur at Best
Case GK many resources with small environmental impacts exceed the 1% limit, which
is not likely in a near future, therefore these resources are considered a no hotspots.
2.4 Screening of the Golfer’s Environmental Impact Even though the focus of this report has been on golf course management, the impact of
the golfer has also been assessed briefly in the form of a screening. A screening is a type
of LCA study where rough values can be used to get an overview of the impact of a
product or service (PRé Consultants, 2010). The aim of the screening is to obtaining a
holistic perspective as well as for further studies in the subject.

9
The system boundaries for the screening of the golfers environmental impact is, in
contrast to the LCA studies, everything that the golfer needs in order to play a round of
golf. That includes transportation to and from the golf club and use of equipment such
as golf clubs, gloves etcetera. The equipment has been mapped and periodicity of
replacing equipment has been analyzed in order to find the hotspots in the golfer’s
environmental impact. Food is however not included, since it is not a necessity for a
round of golf.
2.5 Development of the Tool A tool for assessing the environmental performance of golf clubs in Sweden has been
developed in order to give golf clubs a way to communicate their performance to
stakeholders. The web application includes and assesses the impact of the resources that
has been identified as hotspots.
The most important part of the development of the tool is to decide how to
communicate the results to golf clubs and other stakeholders. Therefore the content and
layout have been decided on in an early stage and evaluated with all involved parties.
The web application has been developed in Visual Studio 2010 (Microsoft Visual
Studio, 2012) using ASP.NET and C# (w3schools.com, 2012). To present the bar charts
jqPlot have been used (jqPlot, 2012). The database used is Microsoft Office Access
(Microsoft Office, 2012) and has been used to store information about the clubs,
environmental impact data and results (Microsoft Office, 2012).
The requirements for the web application are presented below. A document with the
environmental impacts is called environmental impact profile in the list. The web
application has the following requirements represented in the form of user stories:
As a user I want to be able to log in to the application
As a user I want to see a list of my saved environmental impact profiles
As a user I want to see and be able to change my user information and
information about the golf club
As a user I want to be able to enter the resources for a new environmental impact
profile
As a user I want to be able to change the resource use of an existing
environmental impact profile
As a user I want to be able to view the environmental impact profiles in a short
version for communication to stakeholders and long version for golf clubs
internal environmental work
As a user I want to be able to delete an existing environmental impact profile
As a user I want to enter the resources with a unit that I prefer
As a user I want to have feedback when entering resource use on what to enter
As a user I want to print the long and short EPD and get feedback on how to
disable the printer headers and footer.

10
As an unauthenticated user I want to get information about the application on the
login page
The result of the application has been compared with the result from the three LCA
studies in order to ensure a high enough accuracy in the magnitude of the environmental
impacts. Some user tests have also been performed to evaluate the user experience and
improve the usability.

11
3. Results of Forsgården LCA
3.1 Results of the Inventory Analysis of Forsgården GK
Forsgården GK is a golf club located in Kungsbacka, Sweden, and had in 2011
approximately 1 500 members. There is one 18-hole and one 9-hole golf course.
Forsgården GK is occupying a total of 95 ha where the golf courses, infrastructure, club
houses, the surrounding vegetation, etcetera are included. The total amount of greens is
estimated to 2.2 ha and 19 ha is fairway.
The total amount of registered 18-hole golf rounds for the year 2011 in GIT (the Golf’s
IT-system) is 24 596, but not all rounds are registered. Forsgården GK has estimated
that the total number of 18-hole golf rounds is 35 000 rounds for 2011. The 9-hole
rounds are not registered at all but are estimated to 10 000 rounds. Hence the amount of
golf rounds used to calculate the functional unit is 40 000 for the year 2011, the
estimated amount of 18-hole rounds plus half the estimated amount of 9-hole rounds.
The system is divided into three modules; upstream activities, core module and
downstream activities where only the core module is included in the system boundaries,
see Figure 2. The core module is presented in 3.1.1 and the groups of activities within
the main activities in the core module are presented in 3.1.1.1–3.1.1.4.
Figure 2: The core module is inside the system boundaries and the main
activities in the core module each consists of many sub-activities.
Upstream activities
Core module
Downstream activities
Main
activity
Main
activity
Main
activity
Main activity
Activity Activity
Activity Activity
Activity Activity

12
3.1.1 Flow Charts
The flow chart of Forsgården GK is presented in this section, picturing the main
activities in the system, see Figure 3. The activities in the core module are the activities
included in the study and are inside the system boundaries. These main activities in the
core module are described more thorough in section 3.1.1.1-3.1.1.4.
Figure 3: Upstream activities, Core Module and Downstream activities. The activities
within the Core Module inside the system boundaries and are presented more thorough
in the subsequent section.

13
3.1.1.1 Operation of Golf Course
This section describes the activities connected to “Operation of Golf Course”, with
related resources, at Forsgården GK are presented in Figure 4.
Figure 4: Flow chart of the main activity “Operation of Golf Course” and appertained
activities with related resources.
The core of operation of a golf course is managing the turf; the turf needs to be mowed,
fertilized, vertically cut, irrigated, protected from tares and fungus, aerificated, dressed
and reseeded. The turf is differently managed, greens are managed the most intensively
and ruffs are hardly managed at all. For example different mowers are used for mowing
the golf course; there are mowers for the green, fairway, tee etcetera. A golf course
needs a quite big machinery fleet consisting of mowers, tractors and other vehicles and
machines. Forsgården GK has 32 vehicles, their entire machinery fleet is attached in
Appendix III. The machinery fleet is mostly consuming environmental diesel (MK1)
and alkylate.
The turf on the golf course needs to be irrigated. For Forsgården GK’s case the water
for irrigating the course is taken from the small river Söderå that is passing by the golf
club. Electric pumps are used for the irrigation. The golf course is also drained.
Fertilizing is another activity on golf clubs. The fertilizing on Forsgården GK is based
on continuous soil samples determining the ratio between the three different fertilizers;

14
nitrogen, phosphorus and potassium. Fertilizing is can be done in connection with the
irrigation.
Fungicides and herbicides are used for turf protection. The turf is protected from tares
by using herbicides when necessary. In case of a fungus attack, fungicides are used.
Forsgården GK uses one kind of herbicide, Spitfire, and two kinds of fungicides,
Amistar and Baycore.
The turf is also mechanically treated; it is subjected to vertical cutting, aerification and
dressing. These activities are done in order to increase the access of air in the root
system and decrease the thatch. A lot of sand is used for dressing. The sand used for
dressing of greens is washed in contrast to the sand used for the fairways which is not.
Fossil fuels are also used since all the activities are done mechanically with dressers,
vertical cutters etcetera. The aerification creates a lot of organic waste, which is
composted and reused for repairing the golf course.
Sand is not only used for dressing, it is also used for maintaining the bunkers. The sand
is bought at Lysegården outside of Kungälv and transported to Forsgården GK, the
distance is 60 km.
Due to ice injuries or other incidents the turf might die on spots and therefore grass
seeds must be sown. The need of reseeding varies a lot depending on climate, drainage
etcetera.
Golf courses must be marked and on Forsgården painted sticks made of wood have been
used.

15
3.1.1.2 Maintenance of Equipment
This section describes how the equipment used on Forsgården GK is maintained. The
activities connected to the “Maintenance of Equipment”, with related resources, at
Forsgården GK are presented in Figure 5.
Figure 5: Flow chart of the main activity “Maintenance of Equipment” and
appertained activities with related resources.
The equipment used on a golf course is used intensively and the performance of the
equipment is of high importance, therefore the maintenance of the equipment is done
extensively to ensure as high quality as possible. The mowers are rinsed after every use,
they are rinsed with a mix of water and detergent. The detergent used on Forsgården GK
is called MAC AB54. The waste water passes an oil separator before returned to the
hydrologic cycle.
A lot of different vehicles and machines are used in golf course operation. In order to
keep the engines in good shape they are lubricated regularly. Also oil and oil filters
needs to be changed regularly in order to maintain a high performance. At Forsgården,
oil and oil filters are changed once a year for all the vehicles, which is also the case for
air filters. Many of the vehicles are frequently washed and exposed to a corrosive
environment, therefore corrosion protection and painting is done in order to keep the
vehicles in good shape.
The bedknives and knife cylinders get blunt quickly and have to be sharpened.
Forsgården GK has electric equipment for sharpening of both the bedknives and the
knife cylinders. The bedknives on the green mowers are sharpened after every usage
and the knife cylinders only when needed. Eventually they are hackneyed and not
possible to sharpen any more, then they are replaced with new parts. Other parts that are
changed regularly are coring tines, solid conventional tines and roller bearings. The
metal scrap that is glomerated at Forsgården, as well as the waste oil are sent to
recycling, which is not considered in this study.

16
3.1.1.3 Operation of Buildings and Infrastructure
This section describes how the buildings and infrastructure at Forsgården GK are
maintained. The activities connected to the “Operation of Buildings and Infrastructure”,
with related resources, at Forsgården GK are presented in Figure 6.
Figure 6: Flow chart of the main activity “Operation of Buildings and Infrastructure”
and appertained activities with related resources.
Forsgården GK has a club house and a main building with front desk, secretariat,
changing rooms etcetera. The main building is open throughout the year and therefore
needs to be heated or cooled, but also needs water and electricity. The water used is
from the municipal water system. The secretariat is also manned throughout the year
and besides water, electricity and heating, office related material such as office paper is
used.
The infrastructure on Forsgården GK is overhauled and touched up once a year.
Depending on the state of the infrastructure, different kinds of measures are required.
Usually sand and gravel is used to fix the roads. Sometimes bigger excavators are
needed but it all depends on the state.
The golf course does not just consist of grass, there are small forests etcetera that needs
to be maintained. The forest is disforested regularly. For the disforestation, chainsaws
are used which runs on fossil fuels.
17
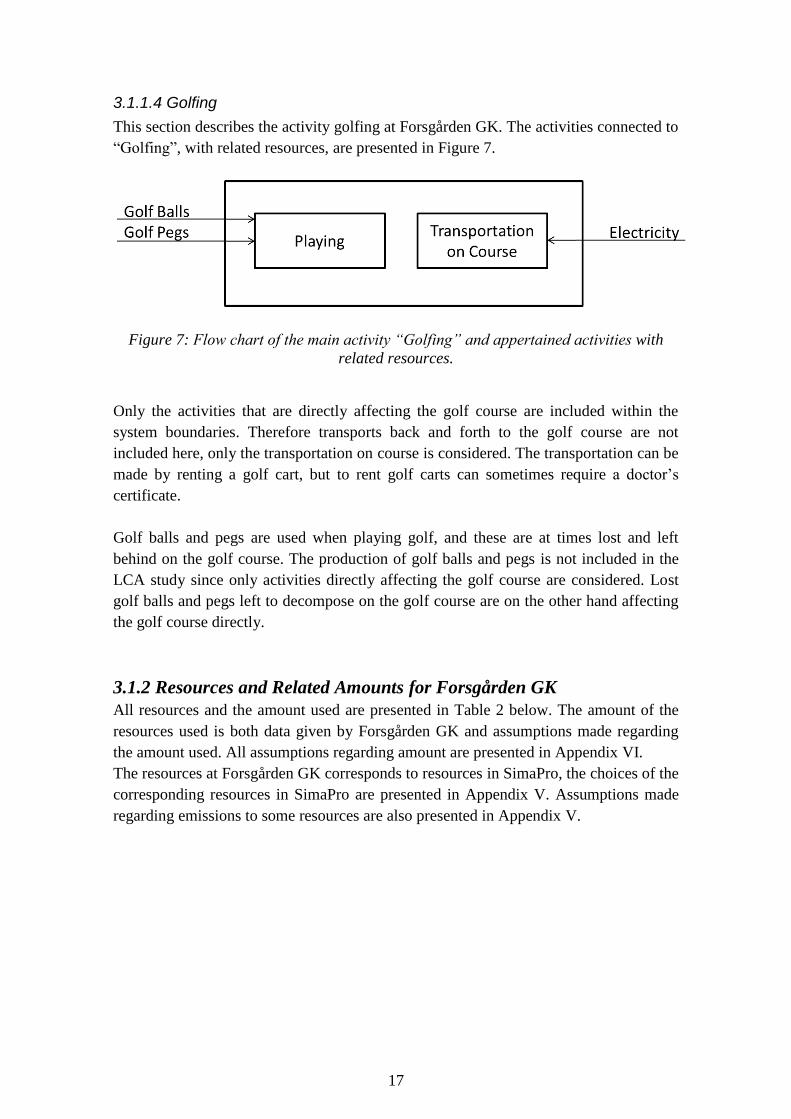
3.1.1.4 Golfing
This section describes the activity golfing at Forsgården GK. The activities connected to
“Golfing”, with related resources, are presented in Figure 7.
Figure 7: Flow chart of the main activity “Golfing” and appertained activities with
related resources.
Only the activities that are directly affecting the golf course are included within the
system boundaries. Therefore transports back and forth to the golf course are not
included here, only the transportation on course is considered. The transportation can be
made by renting a golf cart, but to rent golf carts can sometimes require a doctor’s
certificate.
Golf balls and pegs are used when playing golf, and these are at times lost and left
behind on the golf course. The production of golf balls and pegs is not included in the
LCA study since only activities directly affecting the golf course are considered. Lost
golf balls and pegs left to decompose on the golf course are on the other hand affecting
the golf course directly.
3.1.2 Resources and Related Amounts for Forsgården GK
All resources and the amount used are presented in Table 2 below. The amount of the
resources used is both data given by Forsgården GK and assumptions made regarding
the amount used. All assumptions regarding amount are presented in Appendix VI.
The resources at Forsgården GK corresponds to resources in SimaPro, the choices of the
corresponding resources in SimaPro are presented in Appendix V. Assumptions made
regarding emissions to some resources are also presented in Appendix V.

18
Resource Amount Unit
Alkylate 1 875 kg
Anti-rust Agent 32 kg
Cast Iron 333 kg
Corrugated Board 616 kg
Course Marks 1 m3
Detergent Mix 420 kg
Enamel Paint 32 kg
Environmental Diesel 14 400 kg
Fertilizer K 770 kg
Fertilizer N 2 132 kg
Fertilizer P 230 kg
Fungicides 1.2 kg
Golf Balls 40 000 pieces
Golf Pegs 80 000 pieces
Grass Seeds 100 kg
Green Electricity 210 440 kWh
Herbicides 40 kg
Hydraulic Hoses 16 kg
Iron Sulphate 300 kg
Lubricant Oil 8 l
Motor Oil 142 kg
Office Paper 1 078 kg
Oil and Air Filters 5 kg
Sand 1 300 ton
Tires 32 pieces
Water, Dam 35 000 m3
Water, Municipality 764.5 m3
Wood Paint 2 kg
Table 2: The amount of the different resources used on Forsgården GK.
3.2 Results of the Impact Assessment of Forsgården GK The characterization for Forsgården GK is presented in this section.
3.2.1 Characterisation
All the resources’ environmental impacts have been characterized and are presented
below for all assessed impact categories. The figures are presented in percentage. A
limit is set at 1%, resources contributing to 1% or more of the environmental impacts
can be hotspots and are therefore of interest. The total amount of impact equivalents
(eq) can be found in Appendix I.

19
3.2.1.1 Global Warming Potential
Figure 8: The global warming potential for Forsgården GK presented in percentage.
All data for each resource can be found in appendix I
One 18-hole round at Forsgården GK contributes to the global warming potential with
2.24 kg CO2 equivalents. The resource that has the most significant impact is
environmental diesel (MK1) with 1.2 kg CO2 or 53% of the total global warming
potential for Forsgården GK. Fertilizer N has the second largest impact with 0.49 kg
CO2 or 21%. Resources which have more than 1% of the total global warming potential
are alkylate, electricity, office paper and sand.
0%
10%
20%
30%
40%
50%
60%
70%
80%
90%
100%
0
0,5
1
1,5
2
Alk
yd P
ain
t
Alk
ylat
e
Cas
t Ir
on
Oil
and
Air
Filt
ers
Co
rru
gate
d B
oar
d
Det
erge
nts
Mix
Envi
ron
men
tal D
iese
l
Fert
ilize
r K
Fert
ilize
r N
Fert
ilize
r P
Fun
gici
des
Go
lf B
alls
Go
lf P
egs
Gra
ss S
eed
s
Gre
en E
lect
rici
ty
Her
bic
ides
Hyd
ralic
Ho
ses
Iro
n S
ulp
hat
e
Mo
tor
Oil
Lub
rica
nt
Oil
Off
ice
Pap
er
Wat
er D
am
San
d
Tire
s
Wat
er M
un
icip
alit
y
Wo
od
Global warming (GWP100) kg CO2 eq
20
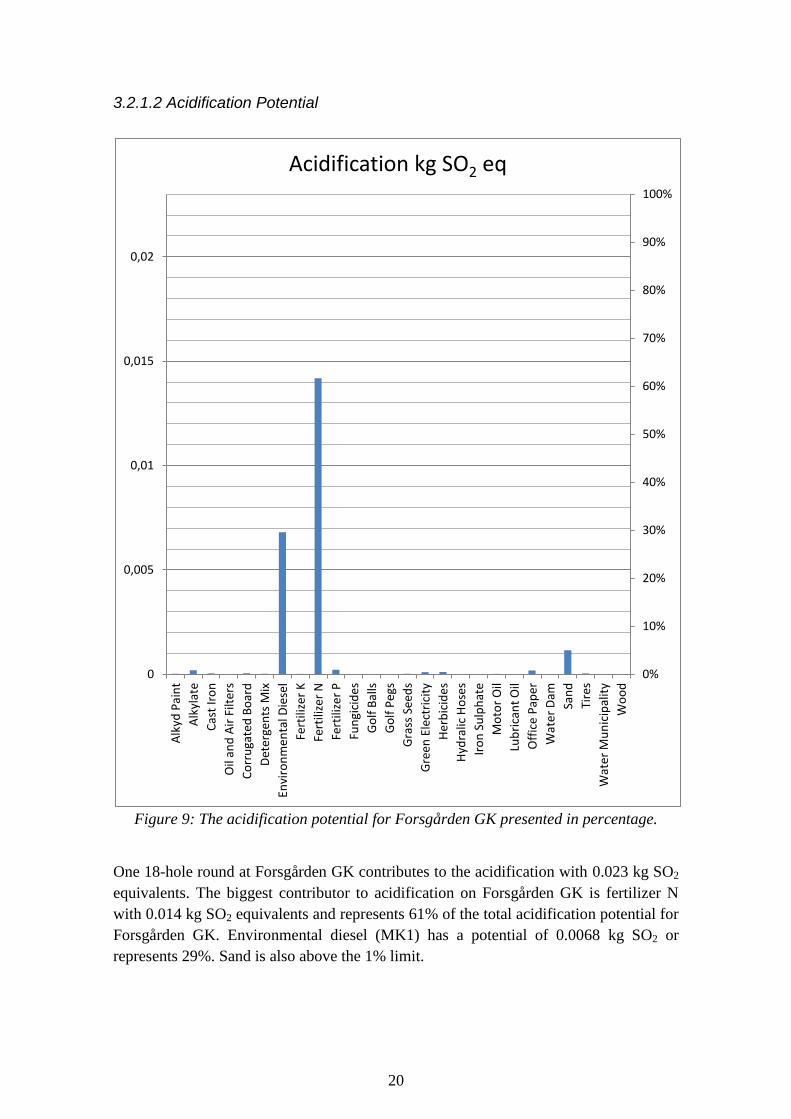
3.2.1.2 Acidification Potential
Figure 9: The acidification potential for Forsgården GK presented in percentage.
One 18-hole round at Forsgården GK contributes to the acidification with 0.023 kg SO2
equivalents. The biggest contributor to acidification on Forsgården GK is fertilizer N
with 0.014 kg SO2 equivalents and represents 61% of the total acidification potential for
Forsgården GK. Environmental diesel (MK1) has a potential of 0.0068 kg SO2 or
represents 29%. Sand is also above the 1% limit.
0%
10%
20%
30%
40%
50%
60%
70%
80%
90%
100%
0
0,005
0,01
0,015
0,02
Alk
yd P
ain
t
Alk
ylat
e
Cas
t Ir
on
Oil
and
Air
Filt
ers
Co
rru
gate
d B
oar
d
Det
erge
nts
Mix
Envi
ron
men
tal D
iese
l
Fert
ilize
r K
Fert
ilize
r N
Fert
ilize
r P
Fun
gici
des
Go
lf B
alls
Go
lf P
egs
Gra
ss S
eed
s
Gre
en E
lect
rici
ty
Her
bic
ides
Hyd
ralic
Ho
ses
Iro
n S
ulp
hat
e
Mo
tor
Oil
Lub
rica
nt
Oil
Off
ice
Pap
er
Wat
er D
am
San
d
Tire
s
Wat
er M
un
icip
alit
y
Wo
od
Acidification kg SO2 eq

21
3.2.1.3 Eutrophication Potential
Figure 10: The eutrophication potential for Forsgården GK presented in percentage.
One 18-hole round at Forsgården GK contributes to the eutrophication with 0.0091
PO43-
equivalents. For eutrophication the biggest contributor is fertilizer N with 0.0058
kg PO43-
representing 63%. But also fertilizer P contributes with another 0.0012 kg
PO43-
representing 13%. These two resources are the most significant contributors.
Environmental diesel and sand are also above the 1% limit.
0%
10%
20%
30%
40%
50%
60%
70%
80%
90%
100%
0
0,001
0,002
0,003
0,004
0,005
0,006
0,007
0,008
0,009
Alk
yd P
ain
t
Alk
ylat
e
Cas
t Ir
on
Oil
and
Air
Filt
ers
Co
rru
gate
d B
oar
d
Det
erge
nts
Mix
Envi
ron
men
tal D
iese
l
Fert
ilize
r K
Fert
ilize
r N
Fert
ilize
r P
Fun
gici
des
Go
lf B
alls
Go
lf P
egs
Gra
ss S
eed
s
Gre
en E
lect
rici
ty
Her
bic
ides
Hyd
ralic
Ho
ses
Iro
n S
ulp
hat
e
Mo
tor
Oil
Lub
rica
nt
Oil
Off
ice
Pap
er
Wat
er D
am
San
d
Tire
s
Wat
er M
un
icip
alit
y
Wo
od
Eutrophication kg PO43- eq

22
3.2.1.4 Photochemical Oxidation Potential
Figure 11: The photochemical oxidation potential for Forsgården.
One 18-hole round at Forsgården GK contributes to the photochemical oxidation with
0.0027 kg C2H4 equivalents. Alkylate and environmental diesel are more than four times
larger contributor to photochemical oxidation than the next largest contributor. Alkylate
have 0.0012kg C2H4 equivalents with 43% and environmental diesel 0.0011kg C2H4 eq
and 42%. Sand, fertilizer N, office paper and electricity are also over the 1% limit.
0%
10%
20%
30%
40%
50%
60%
70%
80%
90%
100%
0
0,0005
0,001
0,0015
0,002
0,0025
Alk
yd P
ain
t
Alk
ylat
e
Cas
t Ir
on
Oil
and
Air
Filt
ers
Co
rru
gate
d B
oar
d
Det
erge
nts
Mix
Envi
ron
men
tal D
iese
l
Fert
ilize
r K
Fert
ilize
r N
Fert
ilize
r P
Fun
gici
des
Go
lf B
alls
Go
lf P
egs
Gra
ss S
eed
s
Gre
en E
lect
rici
ty
Her
bic
ides
Hyd
ralic
Ho
ses
Iro
n S
ulp
hat
e
Mo
tor
Oil
Lub
rica
nt
Oil
Off
ice
Pap
er
Wat
er D
am
San
d
Tire
s
Wat
er M
un
icip
alit
y
Wo
od
Photochemical oxidation kg C2H4 eq

23
3.2.1.5 Ozone Depletion Potential
Figure 12: The ozone depletion potential for Forsgården GK.
One 18-hole round at Forsgården GK contributes to the ozone depletion with 2.9E-7
CFC-11 equivalents. Environmental diesel is the resource with the most significant
impact with 1.9E-7 CFC-11 eq and 66% of the total ozone depletion potential. Sand,
office paper, herbicides and alkylate are above the 1% limit.
0%
10%
20%
30%
40%
50%
60%
70%
80%
90%
100%
0,0E+0
5,0E-8
1,0E-7
1,5E-7
2,0E-7
2,5E-7
Alk
yd P
ain
t
Alk
ylat
e
Cas
t Ir
on
Oil
and
Air
Filt
ers
Co
rru
gate
d B
oar
d
Det
erge
nts
Mix
Envi
ron
men
tal D
iese
l
Fert
ilize
r K
Fert
ilize
r N
Fert
ilize
r P
Fun
gici
des
Go
lf B
alls
Go
lf P
egs
Gra
ss S
eed
s
Gre
en E
lect
rici
ty
Her
bic
ides
Hyd
ralic
Ho
ses
Iro
n S
ulp
hat
e
Mo
tor
Oil
Lub
rica
nt
Oil
Off
ice
Pap
er
Wat
er D
am
San
d
Tire
s
Wat
er M
un
icip
alit
y
Wo
od
Ozone layer depletion (ODP) kg CFC-11 eq

24

25
4. LCA of Two Fictive Golf Clubs The identified differences in golf course management are described and subsequently
the two LCA studies, Best Case GK and Worst Case GK, are presented. The resource
uses in Best Case GK and Worst Case GK have been based on the identified differences
in golf course management described below.
4.1 Differences Between Golf Courses in Sweden The most obvious difference between golf courses in Sweden is the different climate
zones. There is a big difference in latitude between northern Sweden and southern
Sweden which results in big differences in the climate. But there are also differences in
littoral and inland climate. The length of the gaming season differs a lot between the
different climate zones, some golf clubs located in southern Sweden in a littoral climate
are open throughout the year while other golf clubs located in northern Sweden in
inland climate only have a gaming season of 20 weeks. The gaming season usually
ranges from 20 to 40 weeks in Sweden.
The difference in gaming season influences the resource use on the golf club but also
the number of golf rounds played per year. Shorter season implies lower resource use
and fewer golf rounds. Since the environmental impact is calculated per functional unit
the difference in length of the gaming season will not create big differences in the result
and does therefore not affect the screening mentionable. Although, differences in rounds
per year affects the result, golf courses with the same resource use but different number
of played rounds will get different results. More rounds will result in lower impact per
golf round. The number of golf rounds is the same for all the three LCA studies in
order to be comparable.
The gaming season is not the only thing affected by the differences in climate, the
management of the turf differs. In northern Sweden the winters are harder which have
made some golf clubs use winter covers on their golf courses. The winter cover is made
of polyethylene (Covermaster, n.d.).
Different types of grass require different types of management, there are grass that
grows slower, require less water, fertilizers and pesticides. Other types of grass are more
resource intense. Depending on the grass chosen the need of water, fertilizers, pesticides
and the periodicity of grass mowing, indirectly the fossil fuel use, varies between golf
clubs. Some golf clubs do not have much water in their own dams and are from times to
times forced to irrigate their golf course with municipal water.
Also the machinery fleet differs depending on many variables such as size of the golf
course and economy. For example an older fleet tends to have higher fuel consumption.
Also the distribution between the different fossil fuels can differ, for instance some golf
clubs might use a higher share of alkylate than diesel compared to other golf clubs.
Electricity consumption also differs depending on heating system, climate etcetera.

26
Which electricity is chosen also result in different impacts, green electricity mix will
give a lower environmental impact.
The attitude among stakeholders differs a lot between different parts in Sweden. In
some parts there are high expectations on the golf course turf, the turf should be perfect
and flawless while in other parts, the expectations are considerably lower. Higher
expectations on the turf often cause more intense turf maintenance. Attitudes towards
pesticides also differ between the different parts, with some golf courses more liberal
than others. High expectations often coincide with a more liberal attitude towards
pesticide use.
4.2 Results of the Inventory Analysis of Best Case GK and
Worst Case GK Best Case GK and Worst Case GK are two fictive golf clubs and an LCA study has
been performed on both of them. The system for Best Case GK and Worst Case GK is
assumed to be the same as for Forsgården GK, and so are also the main activities. The
size of the golf courses are the same as for Forsgården GK, 95 ha, and also the number
of rounds is the same, 40 000 rounds.
The main activity Operation of Golf Course includes the same activities for both Best
Case GK and Worst Case GK, except for one addition to Worst Case GK, winter covers.
For Worst Case GK the greens are assumed to be covered in the winter in order to
protect the turf. The area of the greens is the same as for Forsgården GK, 2.2 ha.
Best Case GK is a possible future golf course. The mowers for Best Case GK differ
from Forsgården GK and Worst Case GK; all the mowers are electric and therefore no
diesel or alkylate consumption occurs at Best Case GK. The electricity mix used at Best
Case GK is the same as for Forsgården GK, a mix of 90% hydropower and 10% wind
power. All along the line Best Case GK use a minimal of all the other resources. The
turf on Best Case GK is assumed to be very tough with little need of irrigation,
fertilizing, aerification etc. The sand consumption is also lower due to little need of
dressing and the sand is bought from a local supplier only 10 km away. Pesticides are
not used at all.
Worst Case GK on the other hand has higher resource consumption than Forsgården
GK. The turf at Worst Case GK requires extensive care with high intensity of mowing,
irrigating, aerification, dressing etcetera. A lot of fertilizers and pesticides are used and
reseeding is often needed since the turf dies in patches. The electricity used at Worst
Case GK is Swedish Electricity Mix, referred to Electricity, which besides hydropower
and wind power also include and other renewables and nuclear power, fossil fuels.
The main activity Maintenance of Equipment does not differ much from Forsgården
GK, except from the rinsing of mowers. Since mowing is not done as frequently at Best

27
Case GK the mowers is rinsed much more seldom. For Worst Case GK it is the
opposite, since the turf is mowed very frequently that is also the case for rinsing.
The main activity Operation of Buildings and Infrastructure differs between the golf
clubs. Electricity consumption differs, because of differences in heating and insulation
but also other energy saving methods. Also Best Case GK and Worst Case GK use
different electricity mixes. Best Case GK uses electricity very sparingly while Worst
Case GK uses the electricity much more prodigally. The office work also differ, Worst
Case GK uses a lot of office paper while Best Case GK has minimized their use.
The main activity Golfing does not differ that much between the golf clubs. The number
of pegs lost at the courses is the same for all three; Forsgården GK, Best Case GK and
Worst Case GK. The numbers of golf balls lost are twice as many at Worst Case GK
than it is at Forsgården GK or at Best Case GK.
The resources used are the same at all three golf clubs except for Worst Case GK where
also winter covers are used. All the resources and the amount of resources used are
presented in the following section.
4.2.1 Resources and Related Amounts for Best Case GK and Worst
Case GK
All resources and the amount used in golf course management for Best Case GK and
Worst Case GK are presented in the table 14 below. All the assumptions made
regarding the amount used are presented in Appendix VI. The resources correspond to
resources in SimaPro which are presented in Appendix V.

28
Resource Best Case GK Worst Case GK Unit
Alkylate 0 3 750 kg
Anti-rust Agent 32 32 kg
Cast Iron 97 666 kg
Corrugated Board 308 862.4 kg
Course Marks 1 1 m3
Detergent Mix 210 420 kg
Electricity 0 420 880 kWh
Enamel Paint 32 32 kg
Environmental Diesel 0 20 000 kg
Fertilizer K 257 1 540 kg
Fertilizer N 710 4 264 kg
Fertilizer P 737 4 422 kg
Fungicides 0 4.8 kg
Golf Balls 40 000 120 000 pieces
Golf Pegs 80 000 80 000 pieces
Grass Seeds 50 200 kg
Green Electricity 154 220 0 kWh
Herbicides 0 160 kg
Hydraulic Hoses 16 16 kg
Iron Sulphate 150 900 kg
Lubricant Oil 8 8 l
Motor Oil 85 142 kg
Office Paper 539 1 509.2 kg
Oil and Air Filters 5 5 kg
Sand 400 1 500 ton
Tires 32 128 pieces
Water, Dam 35 000 20 000 m3
Water, Municipality 500 20 000 m3
Winter Cover 0 220 kg
Wood Paint 2 2 kg
Table 3: The amount of the different resources used at Best Case and Worst Case.
4.3 Results of the Impact Assessment of Best Case GK
and Worst Case GK The characterization for Best Case GK and Worst Case GK are presented in this section.
4.3.1 Characterisation
The characterized results of Best Case GK and Worst Case GK are presented for each of
the impact categories. A limit is set at 1% for all the charts, the same as for Forsgården
GK. The total amount of impact equivalents (eq) can be found in Appendix I.

29
4.3.1.1 Global Warming Potential
Best Case GK
Figure 13: The global warming potential for Best Case GK.
One 18-hole round at Best Case GK contributes to the global warming potential with
0.30 kg CO2 equivalents. The resource that has the most significant impact is fertilizer
N with 0.16 kg CO2 representing 54%. More resources are above the 1% limit; i.e. cast
iron, alkyd paint, sand, corrugated board, office paper, fertilizer P, fertilizer K,
electricity, tires and water municipality.
0%
10%
20%
30%
40%
50%
60%
70%
80%
90%
100%
0
0,05
0,1
0,15
0,2
0,25
Alk
yd P
ain
t
Cas
t Ir
on
Co
rru
gate
d B
oar
d
Det
erge
nts
Mix
Fert
ilize
r K
Fert
ilize
r N
Fert
ilize
r P
Go
lf B
alls
Go
lf P
egs
Gra
ss S
eed
s
Gre
en E
lect
rici
ty
Hyd
ralic
Ho
ses
Iro
n S
ulp
hat
e
Lub
rica
nt
Oil
Mo
tor
Oil
Off
ice
Pap
er
Oil
and
Air
Filt
ers
San
d
Tire
s
Wat
er D
am
Wat
er M
un
icip
alit
y
Wo
od
Global warming (GWP100) kg CO2 eq

30
Worst Case GK
Figure 14: The global warming potential for Worst Case GK.
One 18-hole round at Worst Case GK contributes to the global warming potential with
5.64 kg CO2 equivalents. Sand has a large impact due to long transportation distance
and represents 32% with 1.81 kg CO2 eq. Environmental Diesel has 1.66 kg CO2 eq and
29% of the total contribution. Fertilizer N, electricity, environmental diesel, alkylate and
water municipality are also above the 1% limit.
0%
10%
20%
30%
40%
50%
60%
70%
80%
90%
100%
0
1
2
3
4
5
Alk
yd P
ain
t
Alk
ylat
e
Cas
t Ir
on
Co
rru
gate
d B
oar
d
Det
erge
nts
Mix
Elec
tric
ity
Envi
ron
men
tal D
iese
l
Fert
ilize
r K
Fert
ilize
r N
Fert
ilize
r P
Fun
gici
des
Go
lf B
alls
Go
lf P
egs
Gra
ss S
eed
s
Her
bic
ides
Hyd
ralic
Ho
ses
Iro
n S
ulp
hat
e
Lub
rica
nt
Oil
Mo
tor
Oil
Off
ice
Pap
er
Oil
and
Air
Filt
ers
San
d
Tire
s
Wat
er D
am
Wat
er M
un
icip
alit
y
Win
ter
Co
ver
Wo
od
Global warming (GWP100) kg CO2 eq

31
4.3.1.2 Acidification Potential
Best Case GK
Figure 15: The acidification potential for Best Case GK.
One 18-hole round at Best Case GK contributes to the acidification with 0.0054kg SO2
equivalents. Fertilizer N with 87% of the acidification potential is by far the most
significant contributor. Sand, corrugated board, office paper, fertilizer P and electricity
are also above the 1% limit.
0%
10%
20%
30%
40%
50%
60%
70%
80%
90%
100%
0
0,001
0,002
0,003
0,004
0,005
Alk
yd P
ain
t
Cas
t Ir
on
Co
rru
gate
d B
oar
d
Det
erge
nts
Mix
Fert
ilize
r K
Fert
ilize
r N
Fert
ilize
r P
Go
lf B
alls
Go
lf P
egs
Gra
ss S
eed
s
Gre
en E
lect
rici
ty
Hyd
ralic
Ho
ses
Iro
n S
ulp
hat
e
Lub
rica
nt
Oil
Mo
tor
Oil
Off
ice
Pap
er
Oil
and
Air
Filt
ers
San
d
Tire
s
Wat
er D
am
Wat
er M
un
icip
alit
y
Wo
od
Acidification kg SO2 eq

32
Worst Case GK
Figure 16: The acidification potential for the Worst Case GK.
One 18-hole round at Worst Case GK contributes to the acidification with 0.051 kg SO2
equivalents. The biggest contributor to acidification for Worst Case GK is fertilizer N
with 0.0028 kg SO2 eq which represents 56%. Sand, fertilizer P, electricity and
environmental diesel are above the 1% limit.
0%
10%
20%
30%
40%
50%
60%
70%
80%
90%
100%
0
0,005
0,01
0,015
0,02
0,025
0,03
0,035
0,04
0,045
0,05
Alk
yd P
ain
t
Alk
ylat
e
Cas
t Ir
on
Co
rru
gate
d B
oar
d
Det
erge
nts
Mix
Elec
tric
ity
Envi
ron
men
tal D
iese
l
Fert
ilize
r K
Fert
ilize
r N
Fert
ilize
r P
Fun
gici
des
Go
lf B
alls
Go
lf P
egs
Gra
ss S
eed
s
Her
bic
ides
Hyd
ralic
Ho
ses
Iro
n S
ulp
hat
e
Lub
rica
nt
Oil
Mo
tor
Oil
Off
ice
Pap
er
Oil
and
Air
Filt
ers
San
d
Tire
s
Wat
er D
am
Wat
er M
un
icip
alit
y
Win
ter
Co
ver
Wo
od
Acidification kg SO2 eq

33
4.3.1.3 Eutrophication Potential
Best Case GK
Figure 17: The eutrophication potential for Best Case GK.
One 18-hole round at Best Case GK contributes to the eutrophication with of 0.0027
PO43-
equivalents. The resources above the 1% are fertilizer N, fertilizer P, corrugated
board, electricity, office paper and sand.
0%
10%
20%
30%
40%
50%
60%
70%
80%
90%
100%
0
0,0005
0,001
0,0015
0,002
0,0025
Alk
yd P
ain
t
Cas
t Ir
on
Co
rru
gate
d B
oar
d
Det
erge
nts
Mix
Fert
ilize
r K
Fert
ilize
r N
Fert
ilize
r P
Go
lf B
alls
Go
lf P
egs
Gra
ss S
eed
s
Gre
en E
lect
rici
ty
Hyd
ralic
Ho
ses
Iro
n S
ulp
hat
e
Lub
rica
nt
Oil
Mo
tor
Oil
Off
ice
Pap
er
Oil
and
Air
Filt
ers
San
d
Tire
s
Wat
er D
am
Wat
er M
un
icip
alit
y
Wo
od
Eutrophication kg PO43- eq

34
Worst Case GK
Figure 18: The eutrophication potential for Worst Case GK.
One 18-hole round at Worst Case GK contributes to the eutrophication with of 0.02
PO43-
equivalents. Fertilizer P and fertilizer N have the largest impact with an
aggregated contribution of 74%. Fertilizer P has 0.0034kg PO43-
eq and Fertilizer N
0.012 kg PO43-
eq. Sand, electricity and environmental diesel are above the 1% limit.
0%
10%
20%
30%
40%
50%
60%
70%
80%
90%
100%
0
0,005
0,01
0,015
0,02
Alk
yd P
ain
t
Alk
ylat
e
Cas
t Ir
on
Co
rru
gate
d B
oar
d
Det
erge
nts
Mix
Elec
tric
ity
Envi
ron
men
tal D
iese
l
Fert
ilize
r K
Fert
ilize
r N
Fert
ilize
r P
Fun
gici
des
Go
lf B
alls
Go
lf P
egs
Gra
ss S
eed
s
Her
bic
ides
Hyd
ralic
Ho
ses
Iro
n S
ulp
hat
e
Lub
rica
nt
Oil
Mo
tor
Oil
Off
ice
Pap
er
Oil
and
Air
Filt
ers
San
d
Tire
s
Wat
er D
am
Wat
er M
un
icip
alit
y
Win
ter
Co
ver
Wo
od
Eutrophication kg PO43- eq

35
4.3.1.4 Photochemical Oxidation Potential
Best Case GK
Figure 19: The photochemical oxidation potential for Best Case GK.
One 18-hole round at Best Case GK contributes to the photochemical oxidation
potential with 0.00015 kg C2H4 equivalents. The contribution of impact is relatively
evenly distributed between the resources and many resources are above the 1% limit.
Cast iron, motor oil, alkyd paint, sand, grass seeds, corrugated board, office paper,
fertilizer N fertilizer P, electricity, tires, and wood (course marks) are above the 1%
limit.
0%
10%
20%
30%
40%
50%
60%
70%
80%
90%
100%
0,0E+0
2,0E-5
4,0E-5
6,0E-5
8,0E-5
1,0E-4
1,2E-4
1,4E-4
Alk
yd P
ain
t
Cas
t Ir
on
Co
rru
gate
d B
oar
d
Det
erge
nts
Mix
Fert
ilize
r K
Fert
ilize
r N
Fert
ilize
r P
Go
lf B
alls
Go
lf P
egs
Gra
ss S
eed
s
Gre
en E
lect
rici
ty
Hyd
ralic
Ho
ses
Iro
n S
ulp
hat
e
Lub
rica
nt
Oil
Mo
tor
Oil
Off
ice
Pap
er
Oil
and
Air
Filt
ers
San
d
Tire
s
Wat
er D
am
Wat
er M
un
icip
alit
y
Wo
od
Photochemical oxidation kg C2H4 eq

36
Worst Case GK
Figure 20: The photochemical oxidation potential for Worst Case GK.
One 18-hole round at Worst Case GK contributes to the photochemical oxidation
potential with 0.0057 kg C2H4 equivalents. The largest contributor is alkylate with
0.0024 kg C2H4 eq and 42%. Sand, fertilizer N, electricity and environmental diesel
(MK1) are above the 1% limit.
0%
10%
20%
30%
40%
50%
60%
70%
80%
90%
100%
0
0,001
0,002
0,003
0,004
0,005
Alk
yd P
ain
t
Alk
ylat
e
Cas
t Ir
on
Co
rru
gate
d B
oar
d
Det
erge
nts
Mix
Elec
tric
ity
Envi
ron
men
tal D
iese
l
Fert
ilize
r K
Fert
ilize
r N
Fert
ilize
r P
Fun
gici
des
Go
lf B
alls
Go
lf P
egs
Gra
ss S
eed
s
Her
bic
ides
Hyd
ralic
Ho
ses
Iro
n S
ulp
hat
e
Lub
rica
nt
Oil
Mo
tor
Oil
Off
ice
Pap
er
Oil
and
Air
Filt
ers
San
d
Tire
s
Wat
er D
am
Wat
er M
un
icip
alit
y
Win
ter
Co
ver
Wo
od
Photochemical oxidation kg C2H4 eq

37
4.3.1.5 Ozone Depletion Potential
Best Case GK
Figure 21: The ozone depletion potential for Best Case GK.
One 18-hole round at Best Case GK contributes to the ozone depletion potential with
1.15E-8 CFC-11 equivalents. As for photochemical oxidation potential the distribution
between the resources impact is relatively even. Above the 1% limit are; motor oil,
alkyd paint, cast iron, grass seeds, sand, corrugated board, office paper, lubricant oil,
fertilizer P, detergent mix, electricity, tires and wood (course marks).
0%
10%
20%
30%
40%
50%
60%
70%
80%
90%
100%
0,0E+0
2,0E-9
4,0E-9
6,0E-9
8,0E-9
1,0E-8
Alk
yd P
ain
t
Cas
t Ir
on
Co
rru
gate
d B
oar
d
Det
erge
nts
Mix
Fert
ilize
r K
Fert
ilize
r N
Fert
ilize
r P
Go
lf B
alls
Go
lf P
egs
Gra
ss S
eed
s
Gre
en E
lect
rici
ty
Hyd
ralic
Ho
ses
Iro
n S
ulp
hat
e
Lub
rica
nt
Oil
Mo
tor
Oil
Off
ice
Pap
er
Oil
and
Air
Filt
ers
San
d
Tire
s
Wat
er D
am
Wat
er M
un
icip
alit
y
Wo
od
Ozone layer depletion (ODP) kg CFC-11 eq

38
Worst Case GK
Figure 22: The ozone depletion potential for Worst Case GK.
One 18-hole round at Worst Case GK contributes to the ozone depletion potential with
5.8E-7 CFC-11 equivalents. Environmental diesel and herbicides are the largest
contributors with 2.6E-7 CFC-11 eq and 2.0E-7 CFC-11 eq contributing with 45% and
34% of the total impact. Above the 1% limit are sand, electricity and alkylate.
0%
10%
20%
30%
40%
50%
60%
70%
80%
90%
100%
0,0E+0
1,0E-7
2,0E-7
3,0E-7
4,0E-7
5,0E-7
Alk
yd P
ain
t
Alk
ylat
e
Cas
t Ir
on
Co
rru
gate
d B
oar
d
Det
erge
nts
Mix
Elec
tric
ity
Envi
ron
men
tal D
iese
l
Fert
ilize
r K
Fert
ilize
r N
Fert
ilize
r P
Fun
gici
des
Go
lf B
alls
Go
lf P
egs
Gra
ss S
eed
s
Her
bic
ides
Hyd
ralic
Ho
ses
Iro
n S
ulp
hat
e
Lub
rica
nt
Oil
Mo
tor
Oil
Off
ice
Pap
er
Oil
and
Air
Filt
ers
San
d
Tire
s
Wat
er D
am
Wat
er M
un
icip
alit
y
Win
ter
Co
ver
Wo
od
Ozone layer depletion (ODP) kg CFC-11 eq

39
5. Identified Hotspots Resources above the limit, possible hotspots and the final hotspots are presented in this
section.
5.1 Resources Above the Limit The characterization results of the tree LCA studies; Forsgården GK, Best Case GK and
Worst Case GK, are the foundation for the identification of the hotspots. The hotspots
are the resources used in golf course operation resulting in the largest environmental
impacts. The relative contributions of emissions for each of the LCA studies have been
analyzed for all the impact categories and resources resulting in relative emissions
higher than 1 % are marked with an “X” in the tables.

40
Global Warming Potential
Forsgården GK Best Case GK Worst Case GK
Alkyd Paint x
Alkylate x x
Cast Iron x
Corrugated Board x
Course Marks
Detergent Mix
Electricity x
Enamel Paint
Environmental Diesel x x
Fertilizer K x
Fertilizer N x x x
Fertilizer P x
Fungicides
Golf Balls
Golf Pegs
Grass Seeds
Green Electricity x x
Herbicides
Hydraulic Hoses
Iron Sulphate
Lubricant Oil
Motor Oil
Office Paper x x
Sand x x x
Tires x
Water, Dam
Water, Municipality x x
Winter Cover
Table 4: Table for determining hotspots for the global warming potential.

41
Ozone Depletion Potential Forsgården Best case Worst case
Alkyd Paint x
Alkylate x x
Cast Iron x
Corrugated Board x
Course Marks x
Detergent Mix x
Electricity x
Environmental Diesel x x
Fertilizer K
Fertilizer N
Fertilizer P x
Fungicides
Golf Balls
Golf Pegs
Grass Seeds x
Green Electricity x
Herbicides x x
Hydraulic Hoses
Iron Sulphate
Lubricant Oil x
Motor Oil x
Office Paper x x
Oil and Air Filters
Sand x x x
Tires x
Water, Dam
Water, Municipality
Winter Cover
Table 5: Table for determining hotspots for the ozone depletion potential.

42
Photochemical Oxidation Potential
Forsgården GK Best case GK Worst case GK
Alkyd Paint x
Alkylate x x
Cast Iron x
Corrugated Board x
Course Marks x
Detergent Mix
Electricity x
Environmental Diesel x x
Fertilizer K
Fertilizer N x x x
Fertilizer P x
Fungicides
Golf Balls
Golf Pegs
Grass Seeds x
Green Electricity x
Herbicides
Hydraulic Hoses x
Iron Sulphate
Lubricant Oil
Motor Oil x
Office Paper x x
Oil and Air Filters
Sand x x x
Tires x
Water, Dam
Water, Municipality
Winter Cover
Table 6: Table for determining hotspots for the photochemical oxidation potential
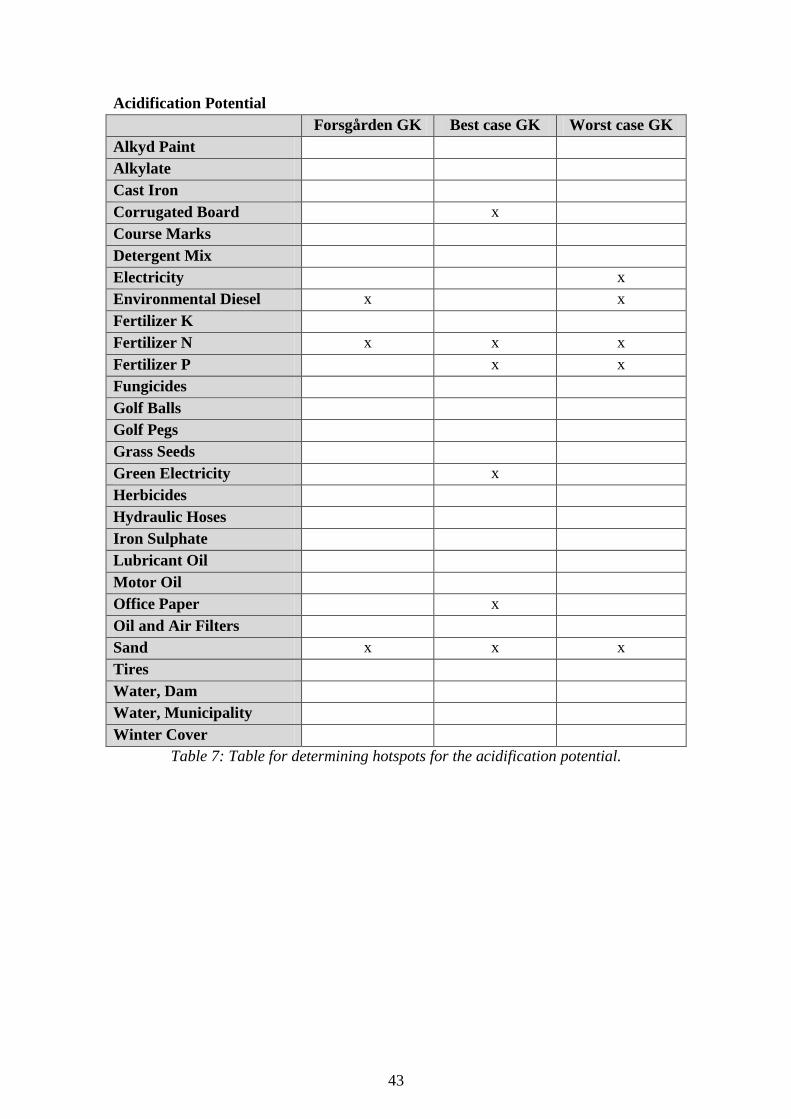
43
Acidification Potential
Forsgården GK Best case GK Worst case GK
Alkyd Paint
Alkylate
Cast Iron
Corrugated Board x
Course Marks
Detergent Mix
Electricity x
Environmental Diesel x x
Fertilizer K
Fertilizer N x x x
Fertilizer P x x
Fungicides
Golf Balls
Golf Pegs
Grass Seeds
Green Electricity x
Herbicides
Hydraulic Hoses
Iron Sulphate
Lubricant Oil
Motor Oil
Office Paper x
Oil and Air Filters
Sand x x x
Tires
Water, Dam
Water, Municipality
Winter Cover
Table 7: Table for determining hotspots for the acidification potential.

44
Eutrophication Potential
Forsgården GK Best case GK Worst case GK
Alkyd Paint
Alkylate
Cast Iron
Corrugated Board x
Course Marks
Detergent Mix
Electricity x
Environmental Diesel x x
Fertilizer K
Fertilizer N x x x
Fertilizer P x x x
Fungicides
Golf Balls
Golf Pegs
Grass Seeds
Green Electricity x
Herbicides
Hydraulic Hoses
Iron Sulphate
Lubricant Oil
Motor Oil
Office Paper x
Oil and Air Filters
Sand x x x
Tires
Water, Dam
Water, Municipality
Winter Cover
Table 8: Table for determining hotspots for the eutrophication potential.
Resources marked with two or more “X:es” in one or more of the tables presented
earlier are definitive hotspots while resources not marked in any of the tables are
considered as no hotspots. The definitive hotspots are; sand, office paper, fertilizer N,
fertilizer P, alkylate, green electricity, environmental diesel, herbicides and water
municipality. Resources that are considered as no hotspots are; fungicides, golf balls,
golf pegs, iron sulphate, oil and air filters, water dam, water municipality and winter
cover. Petrol and regular diesel are not included in the LCA studies, but some golf
courses might use petrol instead of alkylate and diesel instead of environmental diesel
and therefore petrol and diesel are considered as hotspots.

45
5.2 Possible Hotspots Resources marked with only one “X” in one or more of the tables 4-8 are considered as
possible hotspots. These possible hotspots are determined whether they are hotspots or
not in this section.
Alkyd Paint: The alkyd paint is assumed to be used for anti-corrosive treatment of the
mowers and also for painting the sticks used for marking the golf course. Alkyd paint is
over the 1% limit only for the LCA of Best Case GK and is therefore not considered a
hotspot.
Cast Iron: Cast iron is metal scrap. Cast iron is over the 1% limit only for the LCA of
Best Case GK and is therefore not considered a hotspot.
Corrugated Board: Corrugated board is only over the 1% limit for the LCA of Best
Case GK, therefore the corrugated board is not considered a hotspot.
Course Marks: The course marks are over the 1% limit only for the LCA of Best Case
GK and are therefore not considered a hotspot.
Detergent: The detergent is over the 1% limit only Best Case GK and is therefore not
considered a hotspot.
Electricity: Since green electricity is one of the definitive hotspots electricity is also
considered a hotspot.
Fertilizer K: The potassium fertilizer is over the 1% limit only in the LCA of Best Case
and is therefore not considered a hotspot.
Grass Seeds: The grass seeds are over the 1% limit only in Best Case GK and are
therefore not considered a hotspot.
Hydraulic Hoses: The hydraulic hoses are over the 1% limit only in Best Case GK and
are therefore not considered a hotspot.
Lubricant Oil: The lubricant oil is over the 1% limit only in the LCA of Best Case and
is therefore not considered a hotspot.
Motor Oil: The motor oil is over the 1% limit only for the LCA of Best Case GK and is
therefore not considered a hotspot.
Tires: Tires on golf course operation vehicles are replaced frequently. Tires are over the
1% limit only in the LCA of Best Case GK and are therefore not considered a hotspot.

46
5.3 Final Hotspots The final hotspots include all definitive hotspots and the possible hotspots which are
considered as hotspots. The final hotspots are:
Alkylate
Diesel
Electricity
Environmental Diesel
Fertilizer N
Fertilizer P
Green Electricity
Herbicides
Office Paper
Petrol
Sand
Water Municipality

47
6. Screening of the Golfer’s Environmental
Impact
A golfer can be associated with other activities connected to golfing. The two identified
activities which can be associated with the golfer and golfing is transportation back and
forth to the golf course and use of equipment. These two activities are part of the
screening and the results are presented below.
6.1 Transportation A common means of transportation back and forth to the golf course is by car. A normal
sized Swedish car emits 156 g CO2/km (SITA, 2012). The amount of SO2 that is emitted
is 0.00746 g SO2/km (NyTeknik, 2008). Euro III personal cars have a limit of 0.15
NOx/km (IVL Swedish Environmental Research Institute Ltd, 2004). 1 g NOx equals
0.13 g PO43-
which means that a personal car emits 0.0195 g PO43-
eq/km (The
international EPD system, 2008). The impact of transportation back and forth to the golf
course is added to the total impact. Table 9 presents the share between the impact of the
golf course and the transportation with the distances 5 km, 10 km and 20 km for one
person.
Distance to
Forsgården
GK
Global Warming Acidification Eutrophication
Golf
Course
Transport Golf
Course
Transport Golf
Course
Transpor
t
5 km 58.98% 41.02% 99.68% 0.32% 97.92% 2.08%
10 km 41.82% 58.18% 99.36% 0.64% 95.93% 4.07%
20 km 26.44% 73.56% 98.73% 1.27% 92.18% 7.82%
Table 9: The amount of impact equivalents for the transportation with a personal car
have been added to the total impact for each impact category. The share between the
impact from the golf course and the transportation back and forth are presented.
It can be seen from the results that the acidification and eutrophication from the golf
course is significantly greater compared to transportation back and forth for the golfer.
The share between the impact of the golf course and the transportation can however
differ for global warming potential depending on the distance to the golf course and the
amount of people riding in the car.
To emit the same amount of CO2 eq as for Forsgården GK a person have to ride 14.4
km by car. For acidification a person have to go 3110 km by car to emit the same
amount. Additionally, a distance of 471 km would have to be driven to emit the same
amount of PO43-
eq as for Forsgården GK.

48
6.2 Equipment The equipment used by the golfer such as golf clubs, golf bags, additional golf club
covers, clothes, scorecards, umbrellas etcetera are found to have a negligible impact
compared to the impact of one 18-hole golf round, since all equipment is either small or
used over a long period of time.
However, golf balls and golf pegs are consumed in another magnitude. For the LCA of
Best Case GK it is assumed that 1golf ball and 2 pegs are lost each 18-hole round and
for Worst Case GK 3 golf balls and the same amount of golf pegs are lost. The LCA
studies of the three golf clubs only included the emissions from the decomposition of
the golf balls and the golf pegs, production was not included. In the screening of the
golfer’s environmental impacts the production of the golf balls and golf pegs is included
in order to get an understanding whether this is a possible hotspot or not for the golfer.
Assumptions regarding the production of the golf balls and the golf pegs are presented
in appendix V.
Pegs: 75% of the pegs are made of wood and 25% are made of polypropylene. The
emissions related to the pegs are presented in Appendix V. The environmental impact
per 18-hole round, per 1 average peg, is:
Global warming 0.00631 kg CO2 eq
Acidification 1.97E-5 kg SO2 eq
Eutrophication 2.73E-6 kg PO43-
eq
Photochemical oxidation 5.27E-6 kg C2H4 eq
Ozone layer depletion 5.25E-15 kg CFC-11 eq
Table 10: The estimated environmental impact of pegs.
The impact compared with the result in the three LCA studies performed in this report,
did not exceed 1% for any of the categories and is therefore not considered as a hotspot
for the golfer.
Golf balls: There is a lack of information about golf ball production, however the
production of three layer golf balls may require up to a month, which suggests that the
production is a rather intensive process (Advameg Inc, n.d.) (Livestrong.com, 2012).
The assumed resource use for production of golf balls is presented in Appendix V. The
emissions from the golf balls are assumed to be the same as for the LCA studies of the
golf courses.
The results are presented in Table 11 where a range is given, the impact of 1 to 3 balls
loss per 18-hole round.

49
Global warming 0.89- 2.67 kg CO2 eq
Acidification 0.0022 – 0.0066 kg SO2 eq
Eutrophication 0.00022 – 0.00065 kg PO43-
Photochemical oxidation 0.00066- 0.0020 kg C2H4 eq
Ozone layer depletion 1.12E-12 – 3.37 E-10 kg CFC-11 eq
Table 11: The estimated environmental impact of golf balls.
These rough estimates suggest that golf balls with production included are hotspots for
the golfer’s environmental impact. For the impact category global warming potential the
golf balls exceed the limit of 1% for all the golf clubs, Forsgården GK, Best Case GK
and Worst Case GK. Based on the assumptions made, the impact of golf balls can be
75% of the total global warming impact for Best Case GK, 28% for Forsgården GK and
32% for Worst Case GK, a definitive hotspot for the golfer.

50

51
7. The Tool
The tool is to be used by golf clubs in Sweden to simplify their environmental work and
to give them a way of communicating their performance to stakeholders such as
members, municipalities and the public. It is a web application located at
www.golfbanansmiljopaverkan.se. Golf clubs can use this tool to evaluate how a
change in their resource use can alter their environmental pressure. The user enters the
resource use and the application then generates two documents with the golf club's
environmental impact. One of the documents is for golf clubs internal environmental
work and the other for communication to stakeholders. These two documents, called
environmental impact profile (Miljöpåverkansprofil) in the web application, differs
since the information needed for golf clubs internal environmental work is not the same
as the information relevant to stakeholders, which is more simplified.
The default view of the webpage is the login page, which includes a login form and
short information about the web site. Unauthorized users are not able to view other
pages on the website. Therefore the short information displayed includes information
about the tool, how it has been developed and what is included, as well as a link to this
report. To login to the web site the user has to acquire user information by contacting
the one responsible for the web site at SGF.
An authorized user is able to create a new environmental impact profile, by entering
general information about the golf club as well as the resource use. The general
information is; number of courses, number of members, occupied area, types of grass,
estimated amount of 18-hole rounds, registered amount of 18-hole rounds in GIT,
estimated amount of 9-hole rounds as well as short environmental facts about the golf
club. The resource use, which the user has to enter, is only those resources that were
found to be hotspots. It is the resource use for a specific or fictive year. When the user
has entered all the information he or she can choose to save, view the short document
for communication or view the long document for the golf club internal environmental
work.
The short document for communication, generated from the information entered by the
user, is simplified and only contains the most important information about the golf clubs
environmental performance. It is of high importance to make it as simple and clean as
possible since it is assumed that the reader will have little knowledge of environmental
assessment and would not be interested in reading the document if there was too much
information. Therefore only the impact categories global warming, eutrophication and
acidification as well as water and sand consumption are included. Water and sand are
presented since golf courses use a lot of these resources. The total amount of impact
equivalents are presented as well as what it corresponds to, compared to driving with a
normal sized Swedish car. Only presenting the total amount of impact would not give
the same information as when put into context. Additionally a section about pesticides is
included, since the environmental impact categories are not considering eco toxicity and

52
thus it is important to communicate that there are restrictions about pesticide use. The
document as can be created from the web site is displayed in Figure 23.

53
Figure 23: The short document for communication. It is created from the web
application.

54
The document for the golf clubs internal environmental work includes all the
information as the short document, but also has additional information. Instead of only
including the three impact categories global warming, eutrophication, acidification and
the additional categories water and sand, the two final impact categories photochemical
oxidation and ozone layer depletion are also included. The amount of resource use is
displayed, both per functional unit and the total amount. The amount per functional unit
is displayed since the result is calculated per functional unit and is the foundation for
comparison between other golf courses. The total amount is also displayed since the
user should not be forced to log in on the web application to see the total resource use
and should easily compare the differences between two distinguished resource uses. The
resource type is also displayed since it is included in the EPD format.
The long document also includes bar charts for all impact categories where the
resources contribution to each impact is displayed. By having this presentation the
reader will easily see which resources are contributing the most to the environmental
impact and thus where a change would make the most difference. The amount of impact
per resource is not displayed only the total aggregated value.
The document, as can be created from the website is displayed in Figure 24 to Figure
26.

55
Figure 24:The long document for golf clubs internal work, created from the web
application. Sheet 1 of 3.

56
Figure 25: The long document for golf clubs internal work, created from the web
application. Sheet 2 of 3.

57
Figure 26: The long document for golf clubs internal work, created from the web
application. Sheet 3 of 3.

58
Since only the resources that were found to be hotspots are included in the application,
the results in the web application compared to the results in the LCA studies performed
in this report were not exactly alike. The differences in the total impacts are displayed in
Table 12 and the differences in percentage are presented in Table 13.
Impact
category
LCA studies Web application
Forsgården
GK
Best
Case
Worst
Case
Forsgården
GK
Best
Case
Worst
Case
Global
Warming
2.24 0.3 5.64 2.17 0.25 5.5
Acidification 0.023 0.0054 0.05 0.023 0.0052 0.05
Eutrophication 0.0092 0.0027 0.02 0.0091 0.0026 0.02
Photochemical
oxidation
0.0027 0.00015 0.0057 0.0026 0.00008 0.0055
Ozone
depletion
2.9E-07 1.2E-8 5.8E-7 2.8E-7 5.7E-9 5.7E-7
Table 12: The total amount of kg equivalents for all the impact categories from the
three LCA studies and the web application.
Impact category Forsgården GK Best Case Worst Case
Global Warming 3% 17% 2%
Acidification 0% 4% 0%
Eutrophication 1% 4% 0%
Photochemical oxidation 4% 47% 4%
Ozone depletion 3% 53% 2%
Table 13: The results of the web application compared with the results from the LCA
studies. The differences are presented in percentage. Forsgården GK and Worst Case
GK are not differing more than 4%. Best Case GK differs up to 53%.
As can be seen from Table 13 Forsgården GK and Worst Case GK are not differing
more than 4% and are thus considered to have high enough accuracy. Best Case GK
does however differ up to 53% due to that the distribution of impact between the
resources in the LCA study for the impact categories photochemical oxidation and
ozone depletion were more evenly distributed, and a lot of other resources, which did
not become hotspots, did also have an impact, often over to the 1% limit.

59
8. Discussion and Conclusion This section includes discussion and conclusions on the methodology, results and
recommendations for future research.
8.1 Discussion and Conclusion on the Methodology Used
The choice of functional unit has affected the outcome of this report in many ways.
Other functional units considered were a golf round, a year of maintenance etcetera.
If a round of golf would had been chosen instead of an 18-hole round of golf, it would
mean that a golf club with a 9-hole golf course would have less impact per functional
unit since the resource use is less. However since the function of going an 18- and a 9-
hole round of golf is not equally valued an 18-hole round of golf was chosen as
functional unit. Furthermore, to have a year of maintenance instead of an 18-hole golf
round would result in that the function would be to maintain a golf course instead of to
play golf and the amount of played rounds would not make any difference. It was
decided that the function was to play golf and that the amount of played rounds should
affect the outcome since a golf course that have few players does not have the same
function and value to the public welfare.
To only have registered 18-hole rounds in GIT was also considered as a functional unit,
since all other golf rounds are estimated. By only considering the total amount of
registered rounds in GIT was found to be unfair for golf clubs which have both an 18
and 9-hole, which is a common case, since the 9-hole course would then have no
function, but still contribute to the impact. But a consequence with estimated number of
rounds is that the golf clubs have a possibility to tamper with the results in the
application since more rounds leads to a lower impact per functional unit. The
conclusion was that the user would enter the amount of registered golf rounds as well as
the estimated number of rounds, which would give a more just result but also at the
same time give the reader the opportunity to view the number of rounds critically.
The chosen delimitations affect the results. For example by not considering intangibles,
potential environmental aspects may fall outside the study and create a wry picture of
the golf courses environmental impact. Aspects such as creating an appealing milieu for
frogs or birds are not considered. The focus is instead on the tangibles such as CO2
emissions etcetera. Not considering the intangible values can give the wrong
impression, that the intangibles are not as important as the tangibles, but they are both
important.
Restaurants and golf shops are excluded from the study, but golf clubs are often seen as
some kind of sports facility, and by not including restaurant and golf shop the whole
facility is not considered. By excluding parts of the facility leads to allocation which
results in uncertainties that could have been avoided. Also, a general round of golf often

60
include lunch, so setting the system boundaries to what the green fee covers exclude
some parts of the round of golf that many consider very important.
The construction of golf courses is not included. In LCA studies this is a common
delimitation. But the construction of golf courses may be very harmful to the ecosystem
depending on where it is built. If a golf boom would occur this is definitely an area that
should be considered. But just looking at the management of the existing golf clubs the
decision to exclude the construction is relevant.
Terrestrial CO2 uptake has not been considered. Some parts of the golf course, such as
the rough, can give a positive contribution, but that depends on what used to grow there
before the construction of the golf course as well as how long it has existed. Replacing a
primeval forest with rough results in a negative contribution while replacing a non-
covered arable area results in a positive contribution by binding CO2. The impact of
decomposition of cut grass, which emits methane gas, and cutting down and growth of
trees is therefore also not included, but has however an impact on the environment.
The final hotspots were based on the method chosen. However the choice that had the
most influence on the result was the 1% limit. Whether or not 1% of the total impact
was sufficient could be discussed, though if a resource had less than 1% it would mean
that the other resources had a much larger impact and thus the resources which have less
than 1% are not as critical. The 1% limit was determined to be legitimate and sufficient.
If other impact categories would have been chosen the result of this master’s report
could have been different. For example adding eco-toxicity as an impact category could
have led to other inputs as final hotspots. It is also plausible that if other impact
categories, such as scarcity, would have been included it would result in other resources
as hotspots.
All data needed for the LCA of Forsgården GK has not been available. Instead of
excluding the parts with missing data, assumptions were made. Excluding them could
lead to a false impression of them being zero, however since that is not the case it is
better making assumptions. There are still many uncertainties regarding these
assumptions that have affected the results. The hotspots are certain because the size of
them was very big compared to the other resources and they overshadowed the other
resources. But assuming a golf course such as Best Case GK where the hotspots are
barely hotspots other resources come forward and these resources are often very
uncertain. For such a case the assumptions need to be considered once again and more
carefully.
Best Case GK and Worst Case GK are based on the data for Forsgården GK, interviews
with SGF representatives, interviews with municipalities and a literature study. By
basing the actives and the magnitude of the inputs of Best Case GK and Worst Case GK
on Forsgården GK it is assumed that Forsgården GK poses as a general, point-of-
reference golf course. But the question is if Forsgården GK really is representative for

61
other golf courses. There might be activities on other golf courses that have not emerged
in the study and that therefore are not considered since these activities do not occur at
Forsgården GK. The interviews with the SGF representatives and municipalities tried to
cover the differences and deviations in golf course operation, but perhaps all the
deviations weren’t identified. The representatives from SGF are responsible for
different geographical regions and might be partial towards their own region, also they
might be partial towards golf and perceive golf’s environmental performance to be
higher than it is. The municipalities only register pesticide use, so even if the
municipalities are more of a neutral source for information they do only have a fragment
of the information needed. But by exaggerating the differences that were identified it is
assumed that most of the golf clubs in Sweden are covered.
The tool is only based on the determined hotspots and thus the impact acquired from the
web application is not the same as if a proper LCA study would have been performed.
The purpose of the web application is however not to give the exact numbers of the
impacts but more highlight the significant impacts and give an approximate picture of
how the impacts are allocated between the resources. The documents generated from the
application, used for communication and internal environmental work, include a section
where the calculated amount of equivalents for the impact categories global warming,
eutrophication and acidification are compared with the corresponding distance with a
normal sized Swedish car. This comparison enables understanding of the environmental
impact, which otherwise can be hard to understand. However, since the automotive
industry has had hard legislation of emissions from combustion, the eutrophication and
acidification impact of the car is relativity smaller which leads to a long distance when
compared to a 18-hole round of golf. The other impact categories ozone layer depletion
and photochemical oxidation were not included due to lack of information.
8.2 Discussion and Conclusion on the Results
Many resources that became hotspots were not directly connected to the management of
the turf, for example the use of office paper. The electricity consumption resulted in one
of the largest environmental impacts but was mainly used for operation of the facility,
also not directly linked to the management of the turf. A lot of golf clubs seem to have
the golf course operation very carefully monitored and controlled while electricity
consumption and heating in buildings might have a lower prioritization. There seem to
be potential for saving electricity at golf clubs, e.g. by changing heating system in
buildings and introducing other electricity saving methods that in turn can decrease the
environmental impacts.
Additionally, the LCA of Forsgården GK proved that a golf club is a complex facility,
with activities not directly connected to golfing, such as restaurants and golf shop.
Forsgården GK is situated quite central in Kungsbacka and is a popular lunch restaurant
for non-golfers which adds to the complexity of the golf club and what should be
included in the service golfing.

62
There were some unexpected hotspots, for example sand and the transportation of sand
causes a big environmental impact. By choosing a local supplier the impact can be
reduced. The quality of the sand is important for the golf clubs, therefore methods and
ways to treat the sand in order to increase the quality is definitely of interest for the golf
clubs. Sweden’s vision is to decrease the use of natural sand, so finding ways to treat
crushed products may become more and more important in the future.
The fossil fuels consumption is the resource contribution to the absolute highest
environmental impacts, decreasing the fossil fuels consumption is of great importance
for golf clubs. The choice of grass is a measure given more and more attention, there are
different types of grass that grows slower and requires less management. Changing the
type of grass can be the long term measure in reducing the fossil fuels consumption.
Today, there exists hybrid mowers, in the future the fossil fuels consumption might not
even be a problem if the machinery fleet is replaced by an electric fleet. But an electric
fleet would then lead to new challenges.
The tool, if properly introduced, can ease the internal environmental work at golf clubs
but also facilitate the communication of golf clubs’ environmental performance to
stakeholders. The expectation is that golf clubs with the help of the tool will be able to
emphasize and highlight the resources contributing to the most significant
environmental impacts and what they should focus their work on. The tool is also used
for communicating golf clubs environmental performance to stakeholders, by
comparing the golf clubs environmental impacts with driving a car a certain distance
creates an understanding of what the impacts mean.
8.3 Discussion and Conclusion on Future Research
The focus of the study has been on management of the golf course however the
environmental impact of the golfer was briefly touched. The screening indicated that the
golfer’s environmental impact posed a substantial part compared to the environmental
impact of the golf course. A more elaborated study and information about the
production of golf balls is needed to determine the full impact of the golfer in order to
find ways of minimizing the golfer’s impact and to give proper advice to golfers. To
compare the environmental impacts of different types of golf balls is also of interest for
further research. Such a study could result in a recommendation of which golf balls to
choose in order to minimize the environmental impact.
It is also of interest to update the web application with an addition of the golfer’s
environmental impact. Having such a function can increase the environmental
awareness among people and make them understand their contribution to the
environmental impacts.

63
The determined hotspots are based on the current situation at Swedish golf clubs as well
as the method chosen. When substantial improvements have been made at golf clubs
Best Case GK is a possible future scenario. If such improvements are made the hotspots
will change, small resources, previously overshadowed by the big ones, will appear and
suddenly become hotspots. Therefore there is a need to update this study if substantial
changes have been made in golf course management. Additionally, the possible hotspots
which did not make the cut to become final hotspots are still considered to be possible
hotspots and the recommendation for future research is to assess these resources more
thoroughly.
This thesis is a first step towards EPD and of course a recommendation is to complete
this quest. Certifying golf clubs according to the ISO 14025 can give an increased
credibility regarding the golf clubs’ environmental work, but also enable comparability
between golf clubs. The expectation is that this thesis can pose as the foundation for a
future PCR document.

64

65
9. References Advameg, Inc (n.d.) How golf ball is made. http://www.madehow.com/Volume-3/Golf-
Ball.html (16 May 2012)
Biogasportalen ( n.d.) Energiinnehåll.
http://www.biogasportalen.se/FranRavaraTillAnvandning/VadArBiogas/Energiinnehall
(4 April 2012)
Christensen, A., Westerholm, R. and Almén J., 2001. Measurement of Regulated and
Unregulated Exhaust Emissions from a Lawn Mower with and without an Oxidizing
Catalyst: A Comparison of Two Different Fuels. Environmental Science & Technology,
No. 35, pp. 2166-2170
Covermaster (n.d.) Turf Blankets. http://www.covermaster.com/Golf-
Courses/Evergreen-Turf-Covers/ (4 April 2012)
Dansk Golfunion (2011) Aftale om udfasning af pesticidforbruget på danske golfbane.
http://www.danskgolfunion.dk/media/194224/02%20golf-aftale.pdf. (1 March 2012)
Eriksson, T. 2010. Säkerhetsdatablad MAC 54AB. Macserien.
http://www.macserien.se/upload/sdb/Mac%2054AB.pdf (6 April 2012)
Gange, A. C., Lindsay, D. E. and Schofield, J. M., 2003. The ecology of golf courses.
Biologist, http://www.ecossistemasol.com/The_egology_of_golf_courses.pdf ( 8 Feb
2012)
Golf Environment Organisation, GEO (n.d.) Legacy.
http://www.golfenvironment.org/legacy/faqs#ongoing. (1 March 2012)
Golf.se (2012) Golfens IT-system (GIT) http://www.golf.se/SGF/GIT/ (14 May 2012)
Hansson, G., Klemendtsson, L., Nilsson, L.G. and Torstensson, L., 1986. Kan
nitrifikationsinhibitorer hålla kvar kväve i åkermark från höst till vår?. Fakta -
Mark/växter, No. 13.
Helgesson, A., (n.d) Tvättskolan. Motormännen.
http://www.motormannen.se/bilen/kora-aga/tvattskolan/ (4 April 2012)
Ivarsson, K. and Brink, N., (1986) Utlakning av växtnäring från grovmojord i Halland.
Fakta - Mark/växter, No. 6.
IVLSwedish Environmental Research Institute Ltd (2004) Vägtrafikens utsläpp av
kväveoxider – reglering, utsläpp och effekter. http://www.ivl.se/webdav/files/B-
rapporter/B1597.pdf (4 April 2012)

66
jqPlot (2012) jqPlot Charts and Graphs for jQuery http://www.jqplot.com/ (2 May
2012)
jQuery (2012) jQuery: The Write Less, Do More, Javascript Library http://jquery.com/
(5 Mars 2012)
Kastrup Petersen, T. and Riger Kusk, O., (2009) Husk at samle golfboldene op. Grønt
Miljø. No. 7.
Livestrong.com (2012) Golf ball manufacturing process.
http://www.livestrong.com/article/81717-golf-ball-manufacturing-process/ (16 May
2012)
Microsoft Office (2012) What is Microsoft Access Database software and applications
http://office.microsoft.com/en-us/access/what-is-microsoft-access-database-software-
and-applications-FX102473444.aspx (2 May 2012)
Microsoft Visual Studio (2012) Overview of Microsoft Visual Studio 2010 Professional
http://www.microsoft.com/visualstudio/en-us/products/2010-
editions/professional/overview (5 Mars 2012)
NyTeknik (2008) Danmarks värsta miljöbov.
http://www.nyteknik.se/nyheter/energi_miljo/miljo/article65502.ece (11 May 2012)
PRé Consultants (2010) Introduction to LCA with SimaPro 7, San Francisco: SimaPro
7.
RiksIdrottsförbundet (2011) Idrotten i siffror.
http://www.rf.se/Forskningochfakta/ForskningFakta/Statistik/. (8 Feb. 2012)
Salgot, M. and Tapias, J. C., 2006. Golf courses: Environmental impacts. Tourism and
Hospitality Research. http://thr.sagepub.com/content/6/3/218 (8 Feb. 2012)
SITA (2012) SITA först med miljösatsningar i trafiken.
http://www.sita.se/Ovrigt/press/Pressmeddelande/SITA-forst-med-miljosatsningar-i-
trafiken-/ (11 May 2012)
Svenska Golfförbundet, SGF, A (2011) Statistik http://www.golf.se/SGF/Om-
SGF/Statistik1/ (9 Feb. 2012)
Svenska Golfförbundet, SGF, B (2011) Miljö http://www.golf.se/SGF/Miljo/.(9 Feb.
2012)
The International EPDsystem (2008) Supporting Annexes. Version 1.0

67
The International EPDsystem (2012) Using EPDs. http://www.environdec.com/ (16
Feb. 2012)
w3schools.com (2012) ASP.NET Tutorial http://www.w3schools.com/aspnet/default.asp
(5 Mars 2012)
Westerholm, R., Christensen, A., Törnqvist, M., Ehrenberg, L., Rannung, U., Sjögren,
M., Rafter, J., Soontjens, C., Almén, J. and Grägg, K., (2001) Comparison of Exhaust
Emissions from Swedish Environmental Classified Diesel Fuel (MK1) and European
Program on Emissions, Fuels and Engine Technologies (EPEFE) Reference Fuel: A
Chemical and Biological Characterization, with Viewpoints on Cancer. Environmental
Science & Technology, No. 35, pp. 1748-1754.
Wheeler, K. and Nauright, J., (2006) A Global Perspective on the Environmental Impact
of Golf. Sport in Society, Vol. 9, No. 3, July, pp. 427-443.
Österås, A.H., Josefsson K. and Sternbeck J., (2009) Use and dissipation of plant
protectants at golf courses (Användning och spridning av växtskyddsmedel vid
golfbanor). Naturvårdsverket.

68

69
Appendix I Forsgården GK Global warming (GWP100) Ozone layer depletion (ODP) Photochemical oxidation Acidification Eutrophication
kg CO2 eq % kg CFC-11 eq % kg C2H4 eq % kg SO2 eq % kg PO43- eq %
Total 2.243066744 2.88921E-07 0.002651679 0.023207497 0.009191901
Alkyd Paint 0.004702464 0.21% 1.06823E-09 0.37% 1.17355E-05 0.44% 2.8448E-05 0.12% 1.22077E-05 0.13%
Alkylate 0.180743303 8.06% 2.98678E-08 10.34% 0.001188416 44.82% 0.000194564 0.84% 4.2219E-05 0.46%
Cast Iron 0.012544434 0.56% 4.99783E-10 0.17% 9.96644E-06 0.38% 4.24724E-05 0.18% 2.61787E-05 0.28%
Oil and Air Filters 6.12838E-05 0.00% 5.70302E-12 0.00% 6.41578E-08 0.00% 2.79598E-07 0.00% 1.53259E-07 0.00%
Corrugated Board 0.010115492 0.45% 1.07506E-09 0.37% 9.71794E-06 0.37% 5.1221E-05 0.22% 2.80425E-05 0.31%
Detergents Mix 0.003346027 0.15% 3.47183E-10 0.12% 2.8253E-06 0.11% 2.35517E-05 0.10% 1.41621E-05 0.15%
Environmental Diesel 1.19616245 53.33% 1.90032E-07 65.77% 0.00111117 41.90% 0.006799595 29.30% 0.001656362 18.02%
Fertilizer K 0.01539776 0.69% 0 0.00% 3.8793E-06 0.15% 1.96684E-05 0.08% 3.63048E-06 0.04%
Fertilizer N 0.486073948 21.67% 0 0.00% 5.45936E-05 2.06% 0.014183957 61.12% 0.005811064 63.22%
Fertilizer P 0.015030532 0.67% 1.34886E-09 0.47% 1.79406E-05 0.68% 0.000219524 0.95% 0.001191837 12.97%
Fungicides 0.00031578 0.01% 9.19402E-11 0.03% 2.28293E-07 0.01% 1.36985E-06 0.01% 1.08604E-06 0.01%
Golf Balls 0 0.00% 0 0.00% 0 0.00% 0 0.00% 0 0.00%
Golf Pegs 0 0.00% 0 0.00% 0 0.00% 0 0.00% 0 0.00%
Grass Seeds 0.005075799 0.23% 4.21264E-10 0.15% 3.139E-06 0.12% 2.54694E-05 0.11% 1.42273E-05 0.15%
Green Electricity 0.033681173 1.50% 1.57473E-09 0.55% 2.37037E-05 0.89% 9.90681E-05 0.43% 4.85662E-05 0.53%
Herbicides 0.010208926 0.46% 4.916E-08 17.02% 1.0648E-05 0.40% 0.000107342 0.46% 2.74412E-05 0.30%
Hydralic Hoses 0.001543897 0.07% 0 0.00% 1.58177E-06 0.06% 6.90135E-06 0.03% 4.05937E-07 0.00%
Iron Sulphate 0.001251111 0.06% 7.43521E-11 0.03% 5.6412E-07 0.02% 5.70811E-06 0.02% 4.92322E-06 0.05%
Motor Oil 0.00207522 0.09% 1.71748E-09 0.59% 7.53441E-06 0.28% 1.56331E-05 0.07% 2.92593E-06 0.03%
Lubricant Oil 0.00012813 0.01% 1.32386E-10 0.05% 3.28074E-07 0.01% 1.68695E-06 0.01% 4.0143E-08 0.00%
Office Paper 0.039641867 1.77% 3.84578E-09 1.33% 2.77962E-05 1.05% 0.000178457 0.77% 8.85447E-05 0.96%
Water Dam 0 0.00% 0 0.00% 0 0.00% 0 0.00% 0 0.00%
Sand 0.207798138 9.26% 5.99951E-09 2.08% 0.000142136 5.36% 0.001148935 4.95% 0.000204988 2.23%
Tires 0.010329296 0.46% 1.29648E-09 0.45% 9.90198E-06 0.37% 3.80858E-05 0.16% 6.80735E-06 0.07%
Water Municipality 0.004666386 0.21% 1.72887E-10 0.06% 9.87618E-07 0.04% 4.31177E-06 0.02% 8.35714E-07 0.01%
Wood 0.002173328 0.10% 1.89134E-10 0.07% 1.28205E-05 0.48% 1.12484E-05 0.05% 5.25312E-06 0.06%
Table 14: The environmental impact of Forsgården GK per functional unit.

70
Best Case GK Global warming (GWP100) Ozone layer depletion (ODP) Photochemical oxidation Acidification Eutrophication
kg CO2 eq % kg CFC-11 eq % kg C2H4 eq % kg SO2 eq % kg PO43- eq %
Total 0.298271204 1.15468E-08 0.000146884 0.0054176 0.002709857
Alkyd Paint 0.004702464 1.58% 1.06823E-09 9.25% 1.17355E-05 7.99% 2.8448E-05 0.53% 1.22077E-05 0.45%
Cast Iron 0.006291053 2.11% 2.50642E-10 2.17% 4.99818E-06 3.40% 2.13E-05 0.39% 1.31287E-05 0.48%
Corrugated Board 0.014161689 4.75% 1.50508E-09 13.03% 1.36051E-05 9.26% 7.17094E-05 1.32% 3.92595E-05 1.45%
Detergents Mix 0.001673013 0.56% 1.73591E-10 1.50% 1.41265E-06 0.96% 1.17759E-05 0.22% 7.08104E-06 0.26%
Fertilizer K 0.005139252 1.72% 0 0.00% 1.29478E-06 0.88% 6.56465E-06 0.12% 1.21173E-06 0.04%
Fertilizer N 0.161872656 54.27% 0 0.00% 1.81808E-05 12.38% 0.00472355 87.19% 0.001935204 71.41%
Fertilizer P 0.007188515 2.41% 6.45106E-10 5.59% 8.58029E-06 5.84% 0.00010499 1.94% 0.000570009 21.03%
Golf Balls 0 0.00% 0 0.00% 0 0.00% 0 0.00% 0 0.00%
Golf Pegs 0 0.00% 0 0.00% 0 0.00% 0 0.00% 0 0.00%
Grass Seeds 0.002537899 0.85% 2.10632E-10 1.82% 1.5695E-06 1.07% 1.27347E-05 0.24% 7.11363E-06 0.26%
Green Electricity 0.024683095 8.28% 1.15404E-09 9.99% 1.73711E-05 11.83% 7.26016E-05 1.34% 3.55915E-05 1.31%
Hydralic Hoses 0.001543897 0.52% 0 0.00% 1.58177E-06 1.08% 6.90135E-06 0.13% 4.05937E-07 0.01%
Iron Sulphate 0.000625556 0.21% 3.71761E-11 0.32% 2.8206E-07 0.19% 2.85405E-06 0.05% 2.46161E-06 0.09%
Lubricant Oil 0.00012813 0.04% 1.32386E-10 1.15% 3.28074E-07 0.22% 1.68695E-06 0.03% 4.0143E-08 0.00%
Motor Oil 0.001242209 0.42% 1.02807E-09 8.90% 4.51004E-06 3.07% 9.35784E-06 0.17% 1.75144E-06 0.06%
Office Paper 0.019820934 6.65% 1.92289E-09 16.65% 1.38981E-05 9.46% 8.92284E-05 1.65% 4.42723E-05 1.63%
Oil and Air Filters 6.12838E-05 0.02% 5.70302E-12 0.05% 6.41578E-08 0.04% 2.79598E-07 0.01% 1.53259E-07 0.01%
Sand 0.031045014 10.41% 1.81461E-09 15.72% 2.41031E-05 16.41% 0.000201463 3.72% 2.73586E-05 1.01%
Tires 0.010329296 3.46% 1.29648E-09 11.23% 9.90198E-06 6.74% 3.80858E-05 0.70% 6.80735E-06 0.25%
Water Dam 0 0.00% 0 0.00% 0 0.00% 0 0.00% 0 0.00%
Water Municipality 0.00305192 1.02% 1.13072E-10 0.98% 6.45924E-07 0.44% 2.81999E-06 0.05% 5.46575E-07 0.02%
Wood 0.002173328 0.73% 1.89134E-10 1.64% 1.28205E-05 8.73% 1.12484E-05 0.21% 5.25312E-06 0.19%
Table 15: The environmental impact of Best Case GK per functional unit.

71
Worst Case GK Global warming (GWP100) Ozone layer depletion (ODP) Photochemical oxidation Acidification Eutrophication
kg CO2 eq % kg CFC-11 eq % kg C2H4 eq % kg SO2 eq % kg PO43- eq %
Total 5.643335658 5.82166E-07 0.005677616 0.050414647 0.020374441
Alkyd Paint 0.004702464 0.08% 1.06823E-09 0.18% 1.17355E-05 0.21% 2.8448E-05 0.06% 1.22077E-05 0.06%
Alkylate 0.361486605 6.41% 5.97357E-08 10.26% 0.002376833 41.86% 0.000389127 0.77% 8.44381E-05 0.41%
Cast Iron 0.025088869 0.44% 9.99566E-10 0.17% 1.99329E-05 0.35% 8.49447E-05 0.17% 5.23574E-05 0.26%
Corrugated Board 0.014161689 0.25% 1.50508E-09 0.26% 1.36051E-05 0.24% 7.17094E-05 0.14% 3.92595E-05 0.19%
Detergents Mix 0.007645672 0.14% 7.93312E-10 0.14% 6.45582E-06 0.11% 5.38157E-05 0.11% 3.23604E-05 0.16%
Electricity 0.425111862 7.53% 2.66273E-08 4.57% 0.00023315 4.11% 0.001653155 3.28% 0.000524287 2.57%
Environmental Diesel 1.661336737 29.44% 2.63934E-07 45.34% 0.001543292 27.18% 0.009443882 18.73% 0.002300502 11.29%
Fertilizer K 0.030795519 0.55% 0 0.00% 7.75861E-06 0.14% 3.93368E-05 0.08% 7.26096E-06 0.04%
Fertilizer N 0.972147896 17.23% 0 0.00% 0.000109187 1.92% 0.028367914 56.27% 0.011622128 57.04%
Fertilizer P 0.043131092 0.76% 3.87063E-09 0.66% 5.14818E-05 0.91% 0.000629938 1.25% 0.003420054 16.79%
Fungicides 0.00126312 0.02% 3.67761E-10 0.06% 9.13171E-07 0.02% 5.47941E-06 0.01% 4.34416E-06 0.02%
Golf Balls 0 0.00% 0 0.00% 0 0.00% 0 0.00% 0 0.00%
Golf Pegs 0 0.00% 0 0.00% 0 0.00% 0 0.00% 0 0.00%
Grass Seeds 0.010151597 0.18% 8.42528E-10 0.14% 6.27799E-06 0.11% 5.09387E-05 0.10% 2.84545E-05 0.14%
Herbicides 0.040835702 0.72% 1.9664E-07 33.78% 4.25919E-05 0.75% 0.000429367 0.85% 0.000109765 0.54%
Hydralic Hoses 0.001543897 0.03% 0 0.00% 1.58177E-06 0.03% 6.90135E-06 0.01% 4.05937E-07 0.00%
Iron Sulphate 0.003753334 0.07% 2.23056E-10 0.04% 1.69236E-06 0.03% 1.71243E-05 0.03% 1.47697E-05 0.07%
Lubricant Oil 0.00012813 0.00% 1.32386E-10 0.02% 3.28074E-07 0.01% 1.68695E-06 0.00% 4.0143E-08 0.00%
Motor Oil 0.00207522 0.04% 1.71748E-09 0.30% 7.53441E-06 0.13% 1.56331E-05 0.03% 2.92593E-06 0.01%
Office Paper 0.055498614 0.98% 5.38409E-09 0.92% 3.89147E-05 0.69% 0.00024984 0.50% 0.000123963 0.61%
Oil and Air Filters 6.12838E-05 0.00% 5.70302E-12 0.00% 6.41578E-08 0.00% 2.79598E-07 0.00% 1.53259E-07 0.00%
Sand 1.806290243 32.01% 8.41782E-09 1.45% 0.001098941 19.36% 0.008567327 16.99% 0.001937432 9.51%
Tires 0.041317183 0.73% 5.18592E-09 0.89% 3.96079E-05 0.70% 0.000152343 0.30% 2.72294E-05 0.13%
Water Dam 0 0.00% 0 0.00% 0 0.00% 0 0.00% 0 0.00%
Water Municipality 0.1220768 2.16% 4.52288E-09 0.78% 2.5837E-05 0.46% 0.0001128 0.22% 2.1863E-05 0.11%
Winter Cover 0.0105588 0.19% 3.62022E-12 0.00% 2.70798E-05 0.48% 3.14082E-05 0.06% 2.98683E-06 0.01%
Wood 0.002173328 0.04% 1.89134E-10 0.03% 1.28205E-05 0.23% 1.12484E-05 0.02% 5.25312E-06 0.03%
Table 16: The environmental impact of Worst Case GK per functional unit.

72

73
Appendix II
Calculations of amount of electricity needed for replacing fossil fuels.
Assumed efficiencies:
mowers = 22 %
electric engines = 90 %
Volume:
Venv. diesel = 18 000 litres
Valkylate = 2 500 litres
Energy density (Biogasportalen, n.d.):
Eenv. diesel = 9,8 kWh
Ealkylate = 9,06 kWh

74

75
Appendix III Forsgården GK’s machinery fleet
Brand Model Amount
Jacobsen (green) GK6 2
Jacobsen (tee/foregreen) GK6 2
Jacobsen (fairway) LF 3400 1
Jacobsen (fairway) LF 3800 1
John Deere (fairway) 7500 1
Jacobsen (green areas) TR3 1
John Deere (green) 7200 1
Jacobsen (semi-rough) AR522 1
Jacobsen (rough) HR5111 2
John Deere (bunker rake) 1200 A 2
Tru-Turf (roller) RS48-11C 2
John Deere 5720 1
John Deere (mini tractor) 4200 1
Iseki (mini tractor) TX2140 1
Cushman truck Truckster 2
Ez-Go (transport vehicle) WH 350 5
John Deere (transport vehicle) Gator 1
Flexotronic Electric car 2
Mitsubishi (pickup) L200 1
Turfco (green dresser) SP 1530 1
Turfco (green dresser) Falldressare 1
Bredal (fw dresser) Turfdress 1
John Deere (areator) Aercore 150 1
Parkland (fw scarifier) VF250 1
Tractor trolley Möre 41K 1
Stilh (brush saw) S 480 8
Stilh (leaf blower) BR 600 2
Stilh (chainsaw) R 350 2

76

77
Appendix IV
Interviews with the SGF’s agronomists.
Name Geographical Region
Göran Hansson Skåne and some parts of Halland
Mikael Frisk Småland, Blekinge, Öland, Örebro, Värmland
Kim Sintorn Halland and some parts of Göteborg
Peter Edman Västra Götaland, Bohuslän and some parts of Göteborg
Carl-Johan
Lönnberg
Södermanland, Östergötland, Stockholm, Gotland
Thomas
Andersson
Uppland, Västmanland, Dalarna Gävleborg
Boel Sandström Hälsingland, Jämtland-Härjedalen, Medelpad, Ångermanland,
Västerbotten, Norrbotten

78

79
Appendix V
Resources and Corresponding Names in SimaPro
All resources in the three LCA studies are assumed to correspond to the same resources
in SimaPro. The resources assumed are presented in the table.
Resource Corresponding to resource in SimaPro
Alkylate Petrol, low-sulphur, at refinery
Anti-rust Agent Alkyd paint, white, 60% in solvent, at
plant
Cast Iron Cast iron, at plant/RER S
Corrugated Board Corrugated board base paper, kraftliner, at
plant
Course Marks Sawn timber, softwood, planed, air dried,
at plant
Detergent Mix Detergent mix (5% MAC 54AB and 95%
water)
1 kg of MAC 54AB:
1% Ethoxylated alcohols, unspecified, at
plant/RER S
1% Esterquat, tallow, at plant/RER S
1% Alkylbenzene sulfonate, linear,
petrochemical, at plant/RER S
10% Layered sodium silicate, SKS-6,
powder, at plant/RER S
5% Phosphoric acid, industrial grade, 85%
in H2O, at plant/RER S
82% Tap water, at user/CH S
Enamel paint Alkyd paint, white, 60% in solvent, at
plant
Electricity Electricity, high voltage, production SE, at
grid/SE S
Environmental Diesel Diesel, low-sulphur, at regional storage
Fertilizer K Fertiliser (K)
Fertilizer N Fertiliser (N)
Fertilizer P Single superphosphate, as P2O5, at
regional storehouse
Fungicides Fungicides, at regional storehouse
Golf Balls 1 kg of Golf Balls:
5 litres Diesel, combusted in industrial
boiler
1 kg High impact polystyrene (HIPS) E

80
Golf Pegs 1 kg of Golf Pegs:
75% Sawn lumber, softwood, rough,
green, at sawmill, INW/kg/RNA
25% Polypropylene resin E
Grass Seeds Grass seed IP, at regional storehouse
Green Electricity Mix 1 kWh of Green Electricity Mix:
90% Electricity, hydropower, at power
plant 10% Electricity, at wind power plant
Herbicides Herbicides, at regional storehouse
Hydraulic Hoses Polybutadiene E
Iron Sulphate Iron sulphate, at plant
Lubricants Lubricant oil (1)
Motor Oil Light fuel oil, at regional storage
Office Paper Paper, wood-containing, LWC, at regional
storage
Oil and Air Filters Core board, at plant
Sand Transport and Sand used:
Lorry transport, Euro 0, 1, 2, 3, 4 mix, 22 t
total weight, 17,3t max payload
Sand 0/2, wet and dry quarry, production
mix, at plant, undried
Tires 1 piece of Tire:
1.05 kg Synthetic rubber, at plant/RER S
1.05 kg Polybutadiene E
0.6 kg Stainless steel hot rolled coil,
annealed & pickled, elec. arc furnace
route, prod. mix, grade 304 RER S
0.6 kg Silica sand, at plant/DE S
0.6 kg Carbon black, at plant/GLO S
0.25 kg Polyester resin, unsaturated, at
plant/RER S
0.4 kg Benzene E
Water, Dam Rain Water
Water, Municipality Water (Tap)
Winter Cover Polyethylene, HDPE, granulate, at
plant/RER S
Wood paint Alkyd paint, white, 60% in solvent, at
plant

81
Resources and Corresponding Emissions
Environmental Diesel: Forsgården GK uses Swedish Environmental Diesel (MK1).
The production of environmental diesel is assumed to be more energy intensive than
regular diesel. In SimaPro the resource called “Diesel, low-sulphur, at regional storage”
includes the production of diesel. For production of 1 kg of environmental diesel 1.05
kg of regular diesel (Diesel, low-sulphur, at regional storage) is assumed to be needed.
The Swedish Environmental Diesel is combusted without catalyst. The emissions from
combustion of environmental diesel without catalyst are not included in SimaPro. These
emissions are assumed to be airborne, the sort and the amount of the emissions assumed
are listed below (Westerholm et. al., 2001).
Environmental Diesel (MK1), no catalyst
Inputs from technosphere Diesel, low-sulphur, at regional
storage/CH S
1.05 kg
Emissions to air Nitrogen oxides 0.028897243 kg
Carbon dioxide 2.664160401 kg
Carbon monoxide 0.015087719 kg
Hydrocarbons, unspecified 0.000927318 kg
Soot 0.000749373 kg

82
Alkylate: The production of alkylate is assumed to be the same as for petrol. In
SimaPro the production of “Petrol, low-sulphur, at refinery” is assumed to correspond to
the production of alkylate. The alkylate is combusted without catalyst, the assumed
emissions are listed below (Christensen, Westerholm and Almén, 2001).
Alkylate
Inputs from technosphere Petrol, low-sulphur, at refinery/CH S 1 kg
Emissions to air
Nitrogen oxides 0.002721088 kg
Carbon dioxide 1.771714405 kg
Carbon monoxide 0.76462585 kg
Soot 0.001088435 kg
Methane 0.005238095 kg
Ethane 0.003687075 kg
Ethanol 0.002217687 kg
Nitrogen monoxide 0.000612245 kg
Pyrene 0.000146939 kg
Cyclopentane 0.000164626 kg
Hydrocarbons, aromatic 0.03537415 kg
Benzo(ghi)perylene 8.61224E-05 kg
Benzo(e)pyrene 6.13605E-05 kg
Indeno(1,2,3-cd)pyrene 3.90476E-05 kg
Fluorenone 8.68027E-05 kg
Benz[a]anthracene,12-methyl- 2.93878E-05 kg
Benzo(g,h,i)fluoranthene 2.84354E-05 kg
Detergent mix: The detergent used is MAC 54AB. The detergent mix consists of 5%
MAC 54AB and 95% water according to a mechanic at Forsgården GK. The inputs in
SimaPro are based on the Safety Datasheet on the MAC series (Eriksson, 2010). No
emissions are assumed since the detergent mix passes an oil separator before returned to
the hydrologic cycle.
Detergent
Inputs from technosphere Ethoxylated alcohols, unspecified, at
plant/RER S
0.01 kg
Esterquat, tallow, at plant/RER S 0.01 kg
Alkylbenzene sulfonate, linear,
petrochemical, at plant/RER S
0.01 kg
Layered sodium silicate, SKS-6, powder, at
plant/RER S
0.1 kg
Phosphoric acid, industrial grade, 85% in
H2O, at plant/RER S
0.05 kg
Tap water, at user/CH S 0.82 kg

83
Fertilizer N: The production of nitrogen fertilizer is assumed to be the same as for
“Fertiliser (N)” in SimaPro. The emissions from the nitrogen fertilizer is assumed to be
both air- and water-borne, the assumed allocation is listed below (Hansson et.al, 1986).
Fertilizer N
Inputs from technosphere Fertiliser (N) 1 kg
Emissions to air Ammonia 0.15 kg
Emissions to water Nitrogen, organic bound 0.15 kg
Ammonium, ion 0.15 kg
Fertilizer P: The production of phosphorus fertilizer is assumed to be the same as for
“Single superphosphate, as P2O5, at regional storehouse” in SimaPro. The emissions
from the phosphorus fertilizer is assumed to be both water- and soil-borne, the assumed
allocation is listed below (Ivarsson and Brink, 1986).
Fertilizer P
Inputs from technosphere Single superphosphate, as P2O5, at regional
storehouse/RER S
1 kg
Emissions to water Phosphoric acid 0.15 kg
Emissions to soil Phosphate 0.05 kg
Fertilizer K: The production of potassium fertilizer is assumed to be the same as for
“Fertiliser (K)” in SimaPro. The emissions from the potassium fertilizer are assumed to
be air-, water- and soil-borne, the assumed allocation is listed below (Ivarsson and
Brink, 1986).
Fertilizer K
Inputs from technosphere Fertiliser (K) 1 kg
Emissions to air Potassium 0.05 kg
Emissions to water Potassium 0.05 kg
Emissions to soil Potassium 0.05 kg

84
Fungicides: Forsgården GK uses two kind of fungicides, Baycore and Amistar, the
production of them is assumed to be the same as for “Fungicides, at regional
storehouse” in SimaPro. The emissions from the fungicides are assumed to be water-
borne and the assumed emissions are based on the inputs in SimaPro for “Fungicides, at
regional storehouse” where all inputs are assumed to become emissions. The assumed
emissions are listed below.
Fungicides
Inputs from technosphere Fungicides, at regional
storehouse/RER S
1 kg
Emissions to water Trichlorophenol 0.04 kg
Bromine 0.36923 kg
Iodine-129 0.030086 kBq
Dichlorophenol 0.05832 kg
Chlorendic acid 0.1204 kg
Sodium hydroxide 0.41749 kg
Toluene 0.11685 kg
Ethylene glycol 0.03 kg
Cadmium 5.859E-07 kg
Aluminium 0.0085992 kg
Chromium 0.003672 kg
Cobalt 1.8176E-06 kg
Lead 0.000053453 kg
Sulfur 0.0076125 kg
Uranium-238 0.00055955 kBq
Zinc 0.010891 kg
Thorium 0.0054133 kg
Chloride 0.49592 kg

85
Herbicides: Forsgården GK uses a herbicide called Spitfire, the production of the
herbicide is assumed to be the same as for “Herbicides, at regional storehouse” in
SimaPro. The emissions from the herbicides are assumed to be water-borne and the
assumed emissions are based on the inputs in SimaPro for “Herbicides, at regional
storehouse” where all inputs are assumed to become emissions. The assumed emissions
are listed below.
Herbicides
Inputs from technosphere Herbicides, at regional
storehouse/RER S
1 kg
Emissions to water Bromine 0.068461 kg
Iodine-129 0.035586 kBq
Bromide 0.051519 kg
Chloride 0.86358 kg
Ethylene oxide 0.00015834 kg
Fluoride 0.0024529 kg
Formaldehyde 0.00013509 kg
Phenol 0.003447 kg
Potassium, ion 0.0071221 kg
Sodium 4-(2H-naphtho(1,2-d)triazol-
2-yl)stilbene-2-sulfonate
0.53443 kg
Sulfate 0.069385 kg
Acetic anhydride 0.094827 kg
Iron Sulphate: The iron sulphate is assumed to med water-borne and 90% is assumed
to leak in the form of iron ions.
Iron Sulphate
Inputs from technosphere Iron sulphate, at plant/RER S 1 kg
Emissions to water Iron, ion 0.9 kg

86
Golf Balls: Some golf balls are never found and therefore left behind on the golf course
to decompose. On Forsgården GK 1 golf ball/round is assumed to be lost. An
assumption is that Forsgården GK has 40 000 rounds/year which gives a total of 40 000
lost golf balls/year. Emissions are assumed to be water-borne and are listed below
(Kastrup Petersen and Riger Kusk, 2009). The production of golf balls is not included,
since it is the golfer buys and consumes golf balls and is thus responsible for the
environmental impact of the production.
Golf Balls
Emissions to water Lead 23 mg
Cadmium 3.5 mg
Copper 64 mg
Zinc 91 000 mg
Chromium 1.2 mg
Nickel 3.3 mg
Hydrocarbons, aliphatic, alkanes,
unspecified
4 900 mg
Golf Pegs: 75% of the number of pegs are assumed to be made of wood and 25% of
poly propylene, only the pegs that are made of poly propylene are assumed to have
emissions.
Golf Pegs
Emissions to soil 1 kg golf pegs:
Zinc
61 mg

87
Appendix VI Assumptions regarding Amount of Resources
Resource Assumptions for
Forsgården GK
Assumptions for Best
Case GK
Assumptions for Worst
Case GK
Alkylate Amount given by
Forsgården GK.
No alkylate consumption.
All vehicles are assumed to
be electric.
Twice as much as Forsgården
GK is assumed, which gives a
total of 5 m3. The assumed
density for alkylate is 0.75
kg/l
Anti-rust
Agent
Anti-rust agent is assumed to
be used for maintenance of
the vehicles and equipment.
1 kg/vehicle and year is
assumed to be used which
gives a total of 32 kg.
The same as for Forsgården
GK is assumed.
The same as for Forsgården
GK is assumed.
Cast Iron Forsgården GK reported that
they had 1000 kg of scrap
metal for a period of three
years. A mean value of these
three years was calculated,
333 kg/year. An assumption
is made that an equal
amount enters Forsgården
GK every year.
1 machine has 1 knife
cylinder, á 5 kg, that is
replaced once a year.
11 machines have 4
bedknifes, á 1 kg, that are
replaced once a year.
11 machines have 1 roll, á 2
kg, that are changed 2
times/year.
1 machine has 1 coring tine
module, á 2 kg, that is
replaces 2 times/year.
Totally 97 kg of cast iron is
assumed to be replaced
every year.
The consumption is assumed
to be twice as big as for
Forsgården GK.
Corrugated
Board
Forsgården GK reported that
they have 616 kg of
corrugated board waste.
Therefore an assumption is
made that an equal amount
enters Forsgården GK.
Half of Forsgården GK’s
corrugated board
consumption is assumed to
be used.
The corrugated board
consumption is assumed to be
40% higher than for
Forsgården GK.
Course Marks 1 m3 wood is assumed to be
needed for the sticks for
marking the golf course at
Forsgården GK.
The same number of sticks
as for Forsgården GK is
assumed to be used.
The same number of sticks as
for Forsgården GK is
assumed to be used.
Detergent Mix One wash is assumed to
consume 20 kg detergent
mix (Helgesson, n.d.).
Forsgården GK’s active
playing season is assumed to
be 30 weeks. Forsgården GK
have 2 green clippers
assumed to be washed 4
times/week and 6 other
clippers assumed to be
The gaming season is
assumed to be 30 weeks, 2
green clippers are assumed
to be washed 2 times/week
and 6 other clippers 0.5
times/week.
The gaming season is also
assumed to be 30 weeks, 2
green clippers are assumed to
be washed 4 times/week and 6
other clippers 1 time/week.

88
washed 1 time/week. This
altogether is 914 kg of
detergent mix per year.
Electricity Green electricity is used. Green electricity is used. Swedish Electricity mix is
assumed to be used and the
electricity consumption is
assumed to be double
consumption at Forsgården
GK.
Enamel Paint Enamel paint is assumed to
be used for maintenance of
the vehicles and equipment.
1 kg/vehicle and year is
assumed to be used which
gives a total of 32 kg.
The same as for Forsgården
GK is assumed.
The same as for Forsgården
GK is assumed.
Environmental
Diesel
Amount given by
Forsgården GK.
No environmental diesel
consumption. All vehicles
are assumed to be electric.
Another 7 m3 besides
Forsgården GK’s
consumption, which gives a
total of 25 m3. The assumed
density for environmental
diesel is 0.8 kg/l
Fertilizer K Amount given by
Forsgården GK.
One third of Forsgården
GK’s consumption is
assumed.
Twice as much as Forsgården
GK is assumed to be used.
Fertilizer N Amount given by
Forsgården GK.
One third of Forsgården
GK’s consumption is
assumed.
Twice as much as Forsgården
GK is assumed to be used.
Fertilizer P Amount given by
Forsgården GK.
One third of Forsgården
GK’s consumption is
assumed.
Twice as much as Forsgården
GK is assumed to be used.
Fungicides Forsgården GK uses two
kind of fungicides, Baycore
and Amistar.
No fungicides are assumed
to be used.
Four times as much as
Forsgården GK is assumed to
be used.
Golf Balls 1 golf ball/round is assumed
to be lost. An assumption is
that Forsgården GK has 40
000 rounds/year which gives
a total of 40 000 lost golf
balls/year.
1 golf ball/round is assumed
to be left behind on the golf
course.
3 golf balls/round are
assumed to be left behind on
the golf course.
Golf Pegs 2 pegs/round are assumed to
be left behind on the golf
course. An assumption is
that Forsgården GK has 40
000 rounds/year which gives
a total of 80 000 lost
pegs/year.
The same as for Forsgården
GK is assumed.
The same as for Forsgården
GK is assumed.
Grass Seeds Grass seeds are for reseeding
and Forsgården GK is
assumed to reseed 1 ha/year.
According to an interview
with an SGF agronomist 100
kg grass seeds/ha is needed
for reseeding which for
Half of Forsgården GK’s
grass seed consumption is
assumed to be used.
The grass seed consumption
is assumed to be twice as high
as for Forsgården GK.

89
Forsgården’s case gives a
total of 100 kg.
Green
Electricity
The electricity mix used on
Forsgården GK comes from
Telge Energi and is a mix of
90% hydropower and 10%
wind power.
Same electricity mix as for
Forsgården GK. All vehicles
are assumed to be electric,
the energy from
environmental diesel and
alkylate has been calculated
into electric energy. The
energy needed for the
electric vehicles is 49 000
kWh (see appendix II for
calculations). The ordinary
electricity consumption has
been reduced compared to
Forsgården GK’s
consumption of 330 840
kWh to instead 160 000
kWh. The total electricity
consumption for Best Case
GK is 209 000 kWh.
No green electricity is used.
Herbicides Forsgården GK uses a
herbicide called Spitfire.
No herbicides are assumed
to be used.
Four times as much as
Forsgården GK is assumed to
be used.
Hydraulic
Hoses
Hydraulic hoses are replaced
on all the 32 vehicles at
Forsgården GK once a year.
One hose is assumed to
weigh 0.5 kg and be made of
polybutadiene.
The same number of
hydraulic hoses as for
Forsgården GK is replaced.
They are assumed to weigh
0.5 kg/piece, in total 16 kg.
The same number of
hydraulic hoses as for
Forsgården GK is replaced.
They are assumed to weigh
0.5 kg/piece, in total 16 kg.
Iron Sulphate Amount given by
Forsgården GK.
Half of Forsgården GK’s
iron sulphate consumption is
assumed to be used.
The iron sulphate
consumption is assumed to be
three times higher than for
Forsgården GK.
Lubricants Forsgården uses lubricants
for maintenance of the
vehicles and equipment.
According to an interview a
mechanic at Forsgården GK
8 litres/year is used.
The same as for Forsgården
GK is assumed.
The same as for Forsgården
GK is assumed.
Motor Oil Forsgården GK reported that
they have 142 kg of oil
waste. Therefore an
assumption is made that an
equal amount enters
Forsgården GK.
The consumption of motor
oil is assumed to be the same
as for Forsgården GK with a
total amount of 142 kg.
The consumption of motor oil
is assumed to be the same as
for Forsgården GK with a
total amount of 142 kg.
Office Paper Forsgården GK reported that
they have 1078 kg of office
paper waste. Therefore an
assumption is made that an
equal amount enters
Forsgården GK.
Half of Forsgården GK’s
office paper consumption is
assumed to be used.
40% more than for
Forsgården GK is assumed to
be used.

90
Oil and Air
Filters
All vehicles at Forsgården
GK are assumed to change
their oil and air filters once a
year. Both the oil and air
filters are assumed to be
made of core board. Totally
64 filters are changed a year
and one filter is assumed to
weigh 0,078 kg/piece.
The number of oil and air
filters used is assumed to be
the same as for Forsgården
GK.
The number of oil and air
filters used is assumed to be
the same as for Forsgården
GK.
Sand The amount of sand and the
supplier was given by
Forsgården GK. A total of
1 300 tons sand was used
and the distance is 60 km
one way from Lysegården
Sand & Trä AB.
400 tons of sand is assumed
to be used. The sand is
assumed to be transported
from a local producer with a
distance of 10 km one way.
1 500 tons of sand is assumed
to be used. The sand is
assumed to be transported 700
km one way, for example
from Jönköping to Sundsvall.
Tires Forsgården GK have 32
vehicles and 1 tire/vehicle is
assumed to be changed once
a year, in total, 32 tires per
year.
1 tire/vehicle is assumed to
be changed once a year, and
the total number of vehicles
is assumed to be the same as
for Forsgården GK which
gives a total of 32 tires per
year.
All 4 tires are assumed to be
changed on all the vehicles
and the total number of
vehicles is also 32 which give
a total of 128 tires per year.
Water, Dam Amount given by
Forsgården GK.
The same water
consumption as Forsgården
GK.
Worst Case GK has lower
water consumption from their
dam than Forsgården since
they also use municipal water
for irrigation. 20 000 m3 is
assumed to be used.
Water,
Municipality
Amount given by
Forsgården GK.
Decreased with about 300
m3 compared to Forsgården
GK.
Some of the municipal water
is assumed to be used for
irrigation of the golf course.
20 000 m3 is assumed to be
used.
Winter Cover No winter cover is used. No winter cover is used. 1 ha covered is assumed to be
covered, 22 g polyethylene/m2
is assumed to be used.
Wood paint Wood paint is used for
painting the sticks for
marking. The total painted
area is assumed to be 20 m2
and 10 m2 is assumed to
need 1 litre of paint with an
assumed density of 1 kg/litre
which in total is 2 kg for
painting the sticks for
marking at Forsgården GK.
The same as for Forsgården
GK is assumed.
The same as for Forsgården
GK is assumed.

91
AppendixVII Division of work.
This thesis has been carried out by Sandra Hansson and IdaMaria Persson. The division
of the work has been equally distributed and has been done in close collaboration.
The code to the web application has been written by Sandra Hansson, but the design and
layout has been developed by both Sandra Hansson and IdaMaria Persson.

92