Environmental and Social Life Cycle Assessment - Climate Change
25
Environmental and Social Life Cycle Assessment Leonor Patricia Güereca, Adba Musharrafie, Edgar Martínez, Flor Hernández, Alejandro Padilla, Liliana Romero, Margarita Cisneros-Ortiz, J. M. Morgan-Sagastume, Adalberto Noyola. XIV IWRA World Water Congress. Porto de Galinhas Pernambuco Brazil. September 25- 29, 2011.
Transcript of Environmental and Social Life Cycle Assessment - Climate Change

Environmental and Social Life Cycle Assessment
Leonor Patricia Güereca, Adba Musharrafie, Edgar Martínez, Flor Hernández, Alejandro Padilla, Liliana Romero, Margarita Cisneros-Ortiz, J. M. Morgan-Sagastume, Adalberto Noyola.
XIV IWRA World Water Congress. Porto de Galinhas Pernambuco Brazil. September 25-
29, 2011.

Content
• Introduction
• Life Cycle Assessment (LCA) Inventory for five WWTP
• Life Cycle Assessment of two inflow scales of wastewater treatment
• Social Life Cycle Assessment
• Conclussions
XIV IWRA World Water Congress. Porto de Galinhas Pernambuco Brazil. September 25-
29, 2011.

Introduction
In Latin America and the Caribbean:
• There is a common belief that : any kind of technology used will avoid environmental pollution
• New wastewater treatment plants must been installed
• Life Cycle Assessment (LCA) analysis the environmental impacts from an holistic approach
• In this project, the Life Cycle Assessment approach is applied to evaluate the environmental and social impacts of wastewater treatment systems
XIV IWRA World Water Congress. Porto de Galinhas Pernambuco Brazil. September 25-
29, 2011.
Background

LCA studies the environmental impacts through the complete life
cycle of a product, process or service; from the raw materials extraction to the final disposal;
considering all the affected vectors (air, water, soil) and a broad time
framework.
Introduction
XIV IWRA World Water Congress. Porto de Galinhas Pernambuco Brazil. September 25-
29, 2011.
Life Cycle Assessment Structure
Interpretation
Goal definition and scope
Inventory analysis
Impact assessment

Pre-treatment Primary
treatment
Secundary
treatment
Sludges
Wastewater
Wastewater
treatedInput
Solid waste management
Production of chemicals raw
material
Transport of chemicals raw
material
Deodori
zation
Electricity
generation
Fuels generation
Water useEmissions
Discharges
Wastes
Raw material extraction, manufacturingand transport of equipment
Emissions Discharges Wastes
Electricity
generation
Electricity
generation
INVENTORY
Introduction

• Acidification
• Eutrophication
• Photo-oxidants
formation
• Climate Change
• Aquatic toxicity
Introduction
Impact Categories
0
0.2
0.4
0.6
0.8
1
Lodos Activados Laguna de estabilización
Photo-oxidants formationt eq etileno
0
500
1000
1500
2000
2500
3000
3500
Lodos Activados Laguna de estabilización
Greenhouse Gases Emissionst eq CO2 (100 años)
0
2
4
6
8
10
12
14
16
Lodos Activados Laguna de estabilización
Acidification t H+
0
50
100
150
200
250
Lodos Activados Laguna de estabilización
Aquatic toxicity eq 1,4-DCB

Life Cycle Inventory for five WWTP

Life Cycle Inventory for five WWTP
Methodology
System Abbreviation Caudal
(l/s)
Activated sludge (small) AS-S 18
Stabilization ponds (small)
SP-S 12
Activated sludge (big) AS-B 1437
Primary treatment (big) PT-B 1344
Representative scenario activated sludge (small)
RSAS-S 13
The Life Cycle Inventory presented corresponds to the analysis of specific data obtained from four real wastewater treatment plants and one representative scenario of
wastewater treatment for Latin-America and Caribbean.
Equipment
manufacturin
g
Equipment
transportation
Influent
Civil works
Operation
Effluent
Wastewater Treatment Plants description Processes considered in the LCI

Life Cycle Inventory for five WWTP
Results and discussions
Description
Units per m3 of
wastewater
treated during 20
years AS-S SP-S AS-B PT-B RSAS-S Construction
Concrete g 36 140 23 0.69 *
Equipment fabrication Steel g 1.26 0.68 0.33 0.04 *
Operation Electricity kJ 4915 0.33 3550 200 2316
Chloro
(hypochlorite) g 18 NO 3.62 NO
36
86
Lime (CaO) g NO 2.11 NO NO NO
Ferric chloride g NO NO NO NA NO
* In process, NO=not applicable
Energy and raw materials used in each WWTP, related to m3 of wastewater treated during 20 years.
XIV IWRA World Water Congress. Porto de Galinhas Pernambuco Brazil. September 25-
29, 2011.

Life Cycle Inventory Results and discussion
The stabilization pond (SP-S) and the activated sludge (AS-S) are the systems with highest BOD5 removed
System Flux BOD5 (g/m3) BOD5 removed
(g/m3) Removal
Efficiency (%)
AS-S Influent 262.2
259 99 Effluent 3.17
SP-S Influent 380
266 70 Effluent 114
AS-B Influent 103
98 96 Effluent 4.6
PT-B Influent 267.4
150 56 Effluent 117.7
RSAS-S Influent 244
214 88 Effluent 30
XIV IWRA World Water Congress. Porto de Galinhas Pernambuco Brazil. September 25-
29, 2011.

Life Cycle Inventory
• Preliminary results of the Life Cycle Inventory
– The stabilization pond studied, used more raw materials than the other systems analyzed in the construction stage
– Operation is the stage with most electricity requirements
– The stabilization pond analyzed is the system with the highest quantity of BOD5 removed, the lowest electricity consumption and the only system with methane emissions
– Activated sludge systems present the highest removal efficiencies and the highest electricity consume
XIV IWRA World Water Congress. Porto de Galinhas Pernambuco Brazil. September 25-
29, 2011.

Life Cycle Assessment of two inflow scales of
wastewater treatment

LCA of two inflow scales of wastewater treatment
Methodology
Two scenarios of wastewater treatment are analyzed according to their scales of operation:
Equipment
manufacturin
g
Equipment
transportation
Influent
Civil works
Operation
Effluent
Scope of the LCA Processes considered in the LCA
Small WWTP Big WWTP
Single Inflow 12 l/s 1437 l/s
Quantity 120 plants 1 plant
Lifetime 20 years 20 years
Total inflow during lifetime
7,568,640 m3 X
120
906,344,640 m3
FUNCTIONAL UNIT = 906,344,640 m3 .

Methodology
• Construction
• Equipment fabrication and transport
• Operation
• Direct and indirect air emissions
• Landfill leachates
• Chemicals
• Fuel extraction
• Physicochemical parameters of wastewater and treated water
In order to facilitate the comparability, the water quality of the influent and effluent were taken from the Big WWTP for both
scenarios
XIV IWRA World Water Congress. Porto de Galinhas Pernambuco Brazil. September 25-
29, 2011.
Abreviation Impact category
AC Acidification
AT Aquatic toxicity
AD Abiotic depletion
EU Eutrophication
GW Global warming
HT Human toxicity
PF Photo-oxidants formation
TT Terrestrial toxicity
LCA for two inflow scales of WW treatment

Results and discussions
•The Life Cycle Impact Assessment (LCIA) was developed using the CML2000 methodologies and the software TEAM 4.0.
•The relative performance of Big WWTP is better than Small WWTP for all the impact categories analyzed. The difference is more than 100% in almost all categories.
•Aquatic toxicity (AT) and eutrophication (EU) present similar impacts because in the operation stage, the same water quality is considered for both scenarios.
0
50
100
150
200
250
300
AC AT AD EU GW HT PF TT
Rela
tive
per
form
ance
(%
)
Impact Categories
Big WWTP
Small WWTP
XIV IWRA World Water Congress. Porto de Galinhas Pernambuco Brazil. September 25-
29, 2011.
LCA for two inflow scales of WW treatment
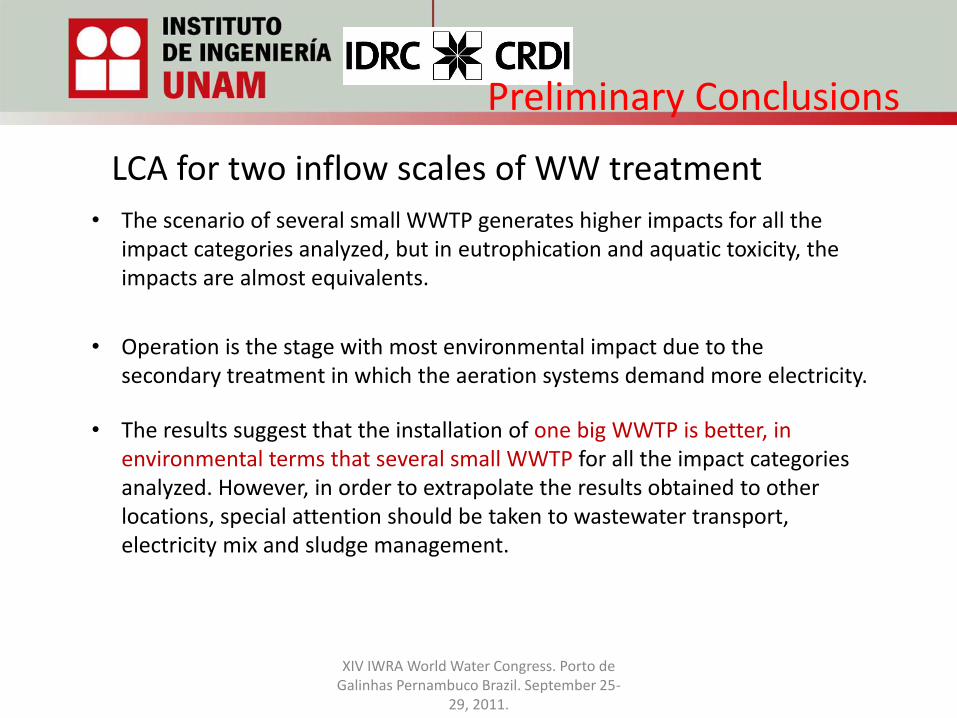
• The scenario of several small WWTP generates higher impacts for all the impact categories analyzed, but in eutrophication and aquatic toxicity, the impacts are almost equivalents.
• Operation is the stage with most environmental impact due to the secondary treatment in which the aeration systems demand more electricity.
• The results suggest that the installation of one big WWTP is better, in environmental terms that several small WWTP for all the impact categories analyzed. However, in order to extrapolate the results obtained to other locations, special attention should be taken to wastewater transport, electricity mix and sludge management.
XIV IWRA World Water Congress. Porto de Galinhas Pernambuco Brazil. September 25-
29, 2011.
Preliminary Conclusions
LCA for two inflow scales of WW treatment

Social Life Cycle Assessment
Backgroung Sustainability = Economic + Environmental+ Social
Social Life Cycle Assessment
XIV IWRA World Water Congress. Porto de Galinhas Pernambuco Brazil. September 25-
29, 2011.

Social Life Cycle Assessment
Methodology:
• Guidelines for S-LCA for products and services (UNEP, 2009) Social Impact Categories:
• Workers
• Local comunity
• Society (National / global)
• Customers
• Value chain
XIV IWRA World Water Congress. Porto de Galinhas Pernambuco Brazil. September 25-
29, 2011.

Instalation
Wastewater treatment
Final disposition
Equipment fabrication
Transport
Construction
Workers Comunity Society Customers Value chain
CATEGORIAS DE IMPACTO =
• Work hours • Income • Forced work • Equity • Health and security • Capacitation
• Local employment • Contribution to education
• Development of society • Contribution to technological development
• Responsability with customers
• Capacitation and reinforcement of the value chain
Social Life Cycle Assessment

Social Life Cycle Assessment
Preliminary results
Aerobio52%
Anaerobio4%
Mixto44%
Tipo de tratamiento
Mecanizadas68%
No mecanizadas
32%
Tipo de PTAR
Si92%
No8%
Seguridad social
Basico21%
Educacion Media
26%
Basico y media11%
Educacion media y profesionistas
42%
Nivel de estudios
25 WWTP visited in Mexico, Chile, Domican Republic, Colombia and Guatemala.
Social Life Cycle Assessment
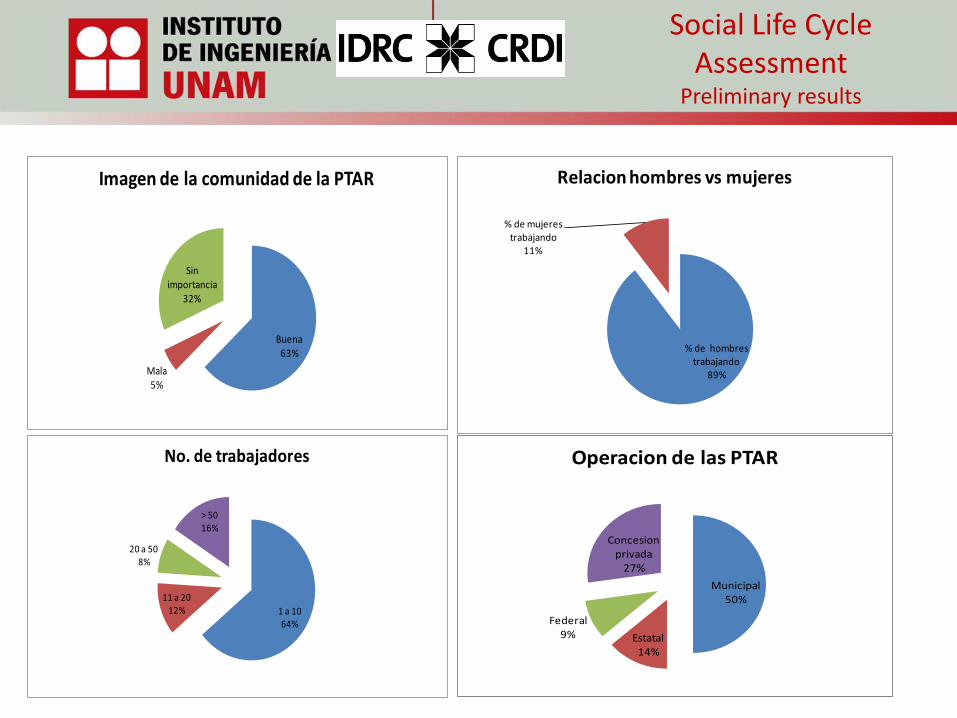
Preliminary results
Buena63%
Mala5%
Sin importancia
32%
Imagen de la comunidad de la PTAR
% de hombres trabajando
89%
% de mujeres trabajando
11%
Relacion hombres vs mujeres
1 a 1064%
11 a 2012%
20 a 508%
> 5016%
No. de trabajadores
Municipal50%
Estatal14%
Federal9%
Concesion privada
27%
Operacion de las PTAR

Life Cycle Inventory Conclussions
• According to preliminary Social Life Cycle Assessment in 25 WWPT of Latinamerica and the Caribbean region::
– The workers in the WWTP are principally men, with elementary and high
school education and they has social security
– Only a minority of the WWTP has a bad image with the community, which is due principally to the odor emissions
– The WWTP has between 1 to 10 workers, which is in concordance with the treated flux
XIV IWRA World Water Congress. Porto de Galinhas Pernambuco Brazil. September 25-
29, 2011.

Recommendations
• It is necessary to obtain precise information about:
– chemical raw material used during operation stage – physic-chemical and biological parameters of the influent
and effluent for all the analyzed systems – to estimates the nitrous oxide emissions for all the analyzed
systems
• It is imperative to broad the sample of WWTP and their communities and strength the analysis in order improve the quality of the social life cycle assessment
XIV IWRA World Water Congress. Porto de Galinhas Pernambuco Brazil. September 25-
29, 2011.

Acknowledgements
International Development Research Center (IDRC) for supporting this research.
Thank you!
Patricia Güereca
XIV IWRA World Water Congress. Porto de Galinhas Pernambuco Brazil. September 25-
29, 2011.