
Environment Social Governance Finance - J-POWER · Sakuma Frequency Sakuma Thermal power plant
100
J-POWER Group Annual Report 2017 Environment Social Governance Finance
Transcript of Environment Social Governance Finance - J-POWER · Sakuma Frequency Sakuma Thermal power plant
J-POWER GroupAnnual Report2017
J-POW
ER G
rou
p A
nn
ual R
epo
rt 2017
Printed in Japan2017.9
Electric Power Development Co., Ltd.Corporate Planning & Administration DepartmentCorporate Planning Office15-1, Ginza 6-chome, Chuo-ku, Tokyo 104-8165, JAPAN TEL: +81-3-3546-2211 E-Mail: [email protected]://www.jpower.co.jp/english/
Environment
Social
Governance
Finance
Profile
Since its establishment by the government in 1952 to overcome the power shortages in postwar Japan, J-POWER (Electric Power Development Co., Ltd.) has developed its business in the wholesale supply of hydro-electric and thermal power, conducted a power transmission business through its trunk transmission lines that connect each domestic region, and contributed to the stable supply of electric power in Japan. Listed on the Tokyo Stock Exchange’s First Section and thus becoming fully privatized in 2004, J-POWER has been developing new businesses, including electric power generation businesses in foreign countries where growth is expected, and renewable energy, such as wind and geothermal power. Currently, Japanese power companies are facing a variety of business circumstances, including electricity sys-tem reform, but, by making the most of its expertise regarding leading-edge technologies developed through-out the world and its proven record of trustworthy performance, J-POWER is making steady and farsighted progress on the basis of its “coexistence of energy and the environment” concept.
Contents2 J-POWER Group Profile
4 J-POWER Group Business Development throughout Japan
6 Message from President Toshifumi Watanabe
7 An Interview with the President
12 Japan’s Electric Power Supply System
14 J-POWER Group Medium-Term Management Plan —Facing the Challenge of Further Growth—
16 Measures to Reinforce Safety for Ohma Nuclear Power Plant (Overview)
18 Business Overview
18 Electric Power Business
18 Domestic Electric Power Business (Hydroelectric Power)
19 Domestic Electric Power Business (Wind Power)
20 Domestic Electric Power Business (Thermal Power)
22 Domestic Electric Power Business (Transmission/Transformation)
23 Electric Power-Related Business
24 Overseas Business
28 Other Business
29 E (Environment) S (Social) G (Governance)
30 E (Environment)
30 Environmental Initiatives
36 Initiatives toward Carbon Reduction
40 Initiatives toward Environmental Preservation
41 Preservation of Natural Environment
42 Environmental Data
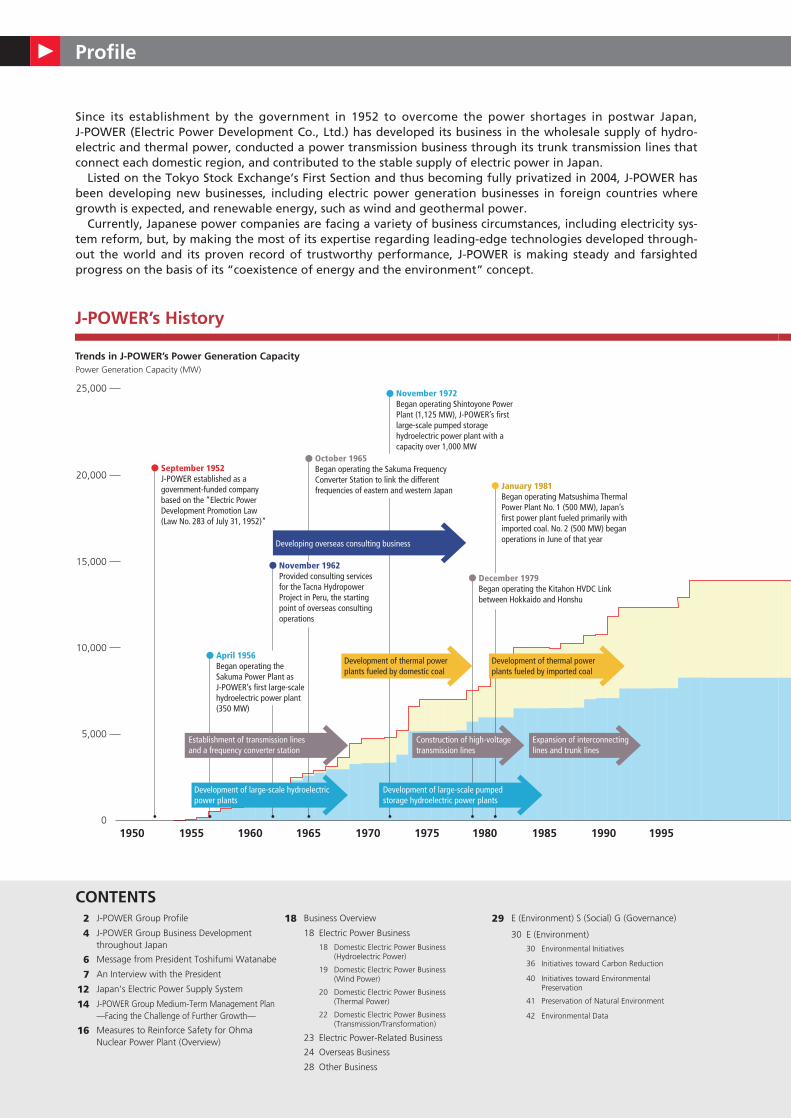
J-POWER’s History
Trends in J-POWER’s Power Generation CapacityPower Generation Capacity (MW)
0
25,000
20,000
15,000
10,000
5,000
September 1952J-POWER established as a government-funded company based on the “Electric Power Development Promotion Law (Law No. 283 of July 31, 1952)”
October 1965Began operating the Sakuma Frequency Converter Station to link the different frequencies of eastern and western Japan
April 1956Began operating the Sakuma Power Plant as J-POWER’s first large-scale hydroelectric power plant (350 MW)
November 1962Provided consulting services for the Tacna Hydropower Project in Peru, the starting point of overseas consulting operations
November 1972Began operating Shintoyone Power Plant (1,125 MW), J-POWER’s first large-scale pumped storage hydroelectric power plant with a capacity over 1,000 MW
January 1981Began operating Matsushima Thermal Power Plant No. 1 (500 MW), Japan’s first power plant fueled primarily with imported coal. No. 2 (500 MW) began operations in June of that year
December 1979Began operating the Kitahon HVDC Link between Hokkaido and Honshu
(As of March 31)
� Domestic Electric Power Business (Hydroelectric) � Domestic Electric Power Business (Thermal)
� Overseas Power Generation Business � Domestic Electric Power Business (Wind)
Note: Includes capacity of consolidated subsidiaries and equity-method affiliates. Capacity is multiplied by J-POWER’s investment ratio (equity ratio).
Development of large-scale hydroelectric power plants
Construction of high-voltage transmission lines
Development of large-scale pumped storage hydroelectric power plants
Expansion of interconnecting lines and trunk lines
Establishment of transmission lines and a frequency converter station
Construction of a nuclear power plant
201420132012201120102009200820072006200520042003200220012000 2016 201720151995199019851980197519701965196019551950
Development of thermal power plants fueled by imported coal
Development of thermal power plants fueled by domestic coal
Developing overseas consulting business
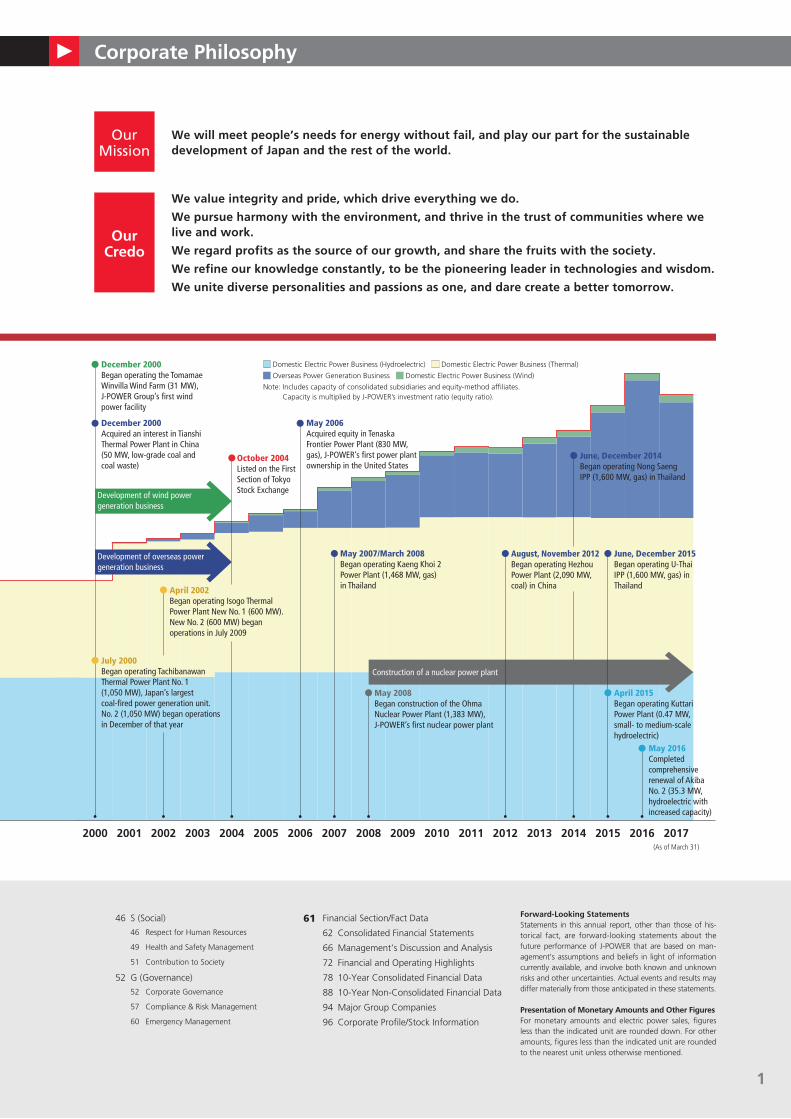
July 2000Began operating Tachibanawan Thermal Power Plant No. 1 (1,050 MW), Japan’s largest coal-fired power generation unit.No. 2 (1,050 MW) began operations in December of that year
April 2002Began operating Isogo Thermal Power Plant New No. 1 (600 MW).New No. 2 (600 MW) began operations in July 2009
December 2000Acquired an interest in Tianshi Thermal Power Plant in China (50 MW, low-grade coal and coal waste)
December 2000Began operating the Tomamae Winvilla Wind Farm (31 MW), J-POWER Group’s first wind power facility
October 2004Listed on the First Section of Tokyo Stock Exchange
Development of wind power generation business
Development of overseas power generation business
May 2006Acquired equity in Tenaska Frontier Power Plant (830 MW, gas), J-POWER’s first power plant ownership in the United States
May 2007/March 2008Began operating Kaeng Khoi 2 Power Plant (1,468 MW, gas) in Thailand
June, December 2014Began operating Nong Saeng IPP (1,600 MW, gas) in Thailand
May 2008Began construction of the Ohma Nuclear Power Plant (1,383 MW), J-POWER’s first nuclear power plant
April 2015Began operating Kuttari Power Plant (0.47 MW, small- to medium-scale hydroelectric)
May 2016Completed comprehensive renewal of Akiba No. 2 (35.3 MW, hydroelectric with increased capacity)
August, November 2012Began operating Hezhou Power Plant (2,090 MW, coal) in China
June, December 2015Began operating U-Thai IPP (1,600 MW, gas) in Thailand
Profile Corporate Philosophy
We will meet people’s needs for energy without fail, and play our part for the sustainable development of Japan and the rest of the world.
Our Mission
We value integrity and pride, which drive everything we do.
We pursue harmony with the environment, and thrive in the trust of communities where we live and work.
We regard profits as the source of our growth, and share the fruits with the society.
We refine our knowledge constantly, to be the pioneering leader in technologies and wisdom.
We unite diverse personalities and passions as one, and dare create a better tomorrow.
our Credo
46 S (Social)
46 Respect for Human Resources
49 Health and Safety Management
51 Contribution to Society
52 G (Governance)
52 Corporate Governance
57 Compliance & Risk Management
60 Emergency Management
61 Financial Section/Fact Data
62 Consolidated Financial Statements
66 Management’s Discussion and Analysis
72 Financial and Operating Highlights
78 10-Year Consolidated Financial Data
88 10-Year Non-Consolidated Financial Data
94 Major Group Companies
96 Corporate Profile/Stock Information
Forward-Looking statementsStatements in this annual report, other than those of his-torical fact, are forward-looking statements about the future performance of J-POWER that are based on man-agement’s assumptions and beliefs in light of information currently available, and involve both known and unknown risks and other uncertainties. Actual events and results may differ materially from those anticipated in these statements.
Presentation of Monetary Amounts and other FiguresFor monetary amounts and electric power sales, figures less than the indicated unit are rounded down. For other amounts, figures less than the indicated unit are rounded to the nearest unit unless otherwise mentioned.
J-POWER’s History
Trends in J-POWER’s Power Generation CapacityPower Generation Capacity (MW)
0
25,000
20,000
15,000
10,000
5,000
September 1952J-POWER established as a government-funded company based on the “Electric Power Development Promotion Law (Law No. 283 of July 31, 1952)”
October 1965Began operating the Sakuma Frequency Converter Station to link the different frequencies of eastern and western Japan
April 1956Began operating the Sakuma Power Plant as J-POWER’s first large-scale hydroelectric power plant (350 MW)
November 1962Provided consulting services for the Tacna Hydropower Project in Peru, the starting point of overseas consulting operations
November 1972Began operating Shintoyone Power Plant (1,125 MW), J-POWER’s first large-scale pumped storage hydroelectric power plant with a capacity over 1,000 MW
January 1981Began operating Matsushima Thermal Power Plant No. 1 (500 MW), Japan’s first power plant fueled primarily with imported coal. No. 2 (500 MW) began operations in June of that year
December 1979Began operating the Kitahon HVDC Link between Hokkaido and Honshu
(As of March 31)
� Domestic Electric Power Business (Hydroelectric) � Domestic Electric Power Business (Thermal)
� Overseas Power Generation Business � Domestic Electric Power Business (Wind)
Note: Includes capacity of consolidated subsidiaries and equity-method affiliates. Capacity is multiplied by J-POWER’s investment ratio (equity ratio).
Development of large-scale hydroelectric power plants
Construction of high-voltage transmission lines
Development of large-scale pumped storage hydroelectric power plants
Expansion of interconnecting lines and trunk lines
Establishment of transmission lines and a frequency converter station
Construction of a nuclear power plant
201420132012201120102009200820072006200520042003200220012000 2016 201720151995199019851980197519701965196019551950
Development of thermal power plants fueled by imported coal
Development of thermal power plants fueled by domestic coal
Developing overseas consulting business
July 2000Began operating Tachibanawan Thermal Power Plant No. 1 (1,050 MW), Japan’s largest coal-fired power generation unit.No. 2 (1,050 MW) began operations in December of that year
April 2002Began operating Isogo Thermal Power Plant New No. 1 (600 MW).New No. 2 (600 MW) began operations in July 2009
December 2000Acquired an interest in Tianshi Thermal Power Plant in China (50 MW, low-grade coal and coal waste)
December 2000Began operating the Tomamae Winvilla Wind Farm (31 MW), J-POWER Group’s first wind power facility
October 2004Listed on the First Section of Tokyo Stock Exchange
Development of wind power generation business
Development of overseas power generation business
May 2006Acquired equity in Tenaska Frontier Power Plant (830 MW, gas), J-POWER’s first power plant ownership in the United States
May 2007/March 2008Began operating Kaeng Khoi 2 Power Plant (1,468 MW, gas) in Thailand
June, December 2014Began operating Nong Saeng IPP (1,600 MW, gas) in Thailand
May 2008Began construction of the Ohma Nuclear Power Plant (1,383 MW), J-POWER’s first nuclear power plant
April 2015Began operating Kuttari Power Plant (0.47 MW, small- to medium-scale hydroelectric)
May 2016Completed comprehensive renewal of Akiba No. 2 (35.3 MW, hydroelectric with increased capacity)
August, November 2012Began operating Hezhou Power Plant (2,090 MW, coal) in China
June, December 2015Began operating U-Thai IPP (1,600 MW, gas) in Thailand
1
J-PoWeR Group Profile
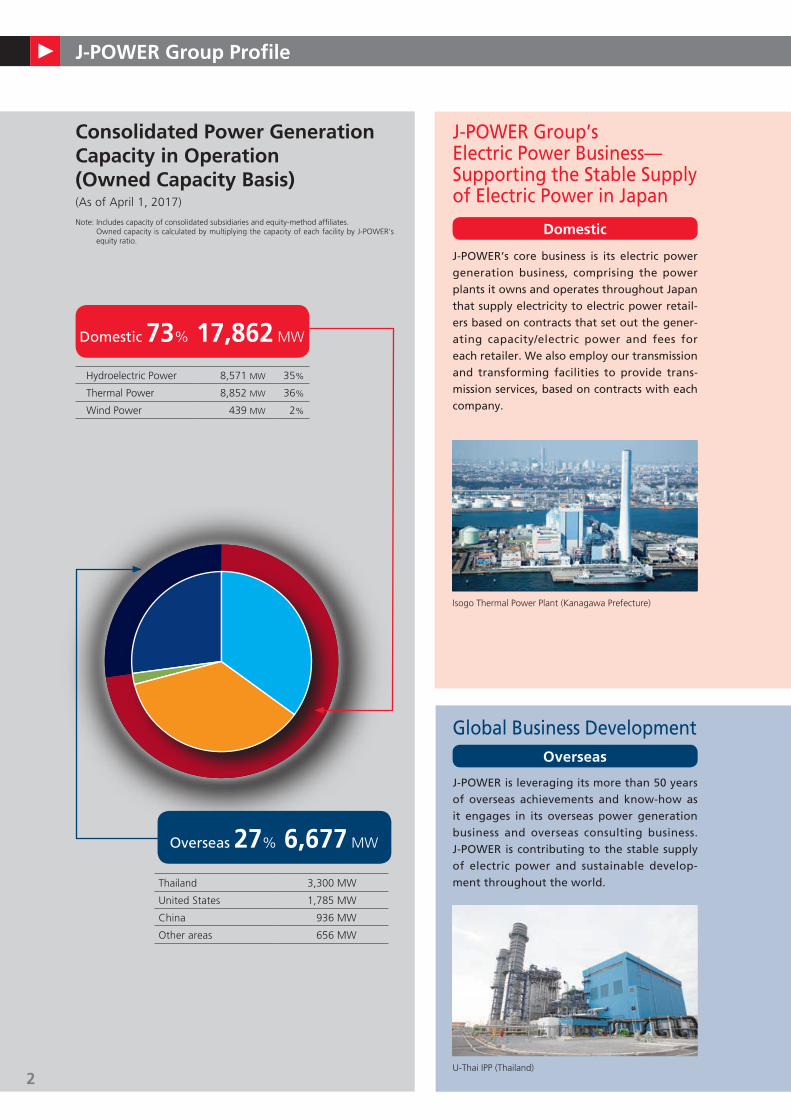
Consolidated Power Generation Capacity in operation (owned Capacity Basis)(As of April 1, 2017)
Note: Includes capacity of consolidated subsidiaries and equity-method affiliates. Owned capacity is calculated by multiplying the capacity of each facility by J-POWER’s equity ratio.
Domestic 73% 17,862 MW
Hydroelectric Power 8,571 MW 35%
Thermal Power 8,852 MW 36%
Wind Power 439 MW 2%
J-POWER’s core business is its electric power
generation business, comprising the power
plants it owns and operates throughout Japan
that supply electricity to electric power retail-
ers based on contracts that set out the gener-
ating capacity/electric power and fees for
each retailer. We also employ our transmission
and transforming facilities to provide trans-
mission services, based on contracts with each
company.
J-POWER Group’s Electric Power Business—Supporting the Stable Supply of Electric Power in Japan
Domestic
Global Business Developmentoverseas
J-POWER is leveraging its more than 50 years
of overseas achievements and know-how as
it engages in its overseas power generation
business and overseas consulting business.
J-POWER is contributing to the stable supply
of electric power and sustainable develop-
ment throughout the world.
Overseas 27% 6,677 MW
Thailand 3,300 MW
United States 1,785 MW
China 936 MW
Other areas 656 MW
Isogo Thermal Power Plant (Kanagawa Prefecture)
U-Thai IPP (Thailand)
2

J-PoWeR Group Profile
electric Power BusinessW Hydroelectric PowerPurely Domestic, CO2-Free Energy
J-POWER owns 61 hydroelectric power plants with a total capacity of 8,571 MW, making it Japan’s sec-ond-ranked company in terms of hydropower generation capacity. Hydroelectric power represents a valuable purely domestic energy resource and, as a CO2-free power source, plays a central role in renew-able energy.
W thermal PowerHighly Economical Base Energy Source
J-POWER owns thermal power gener-ation facilities with a total capacity of 8,852 MW, including the top share of coal-fired thermal power genera-tion capacity in Japan (an owned capacity of 8,544 MW). The special feature of coal-fired thermal power generation is the lower cost per calo-rie compared with power generation by crude oil, LNG, and other fossil fuels. Reflecting the use of coal-fired facilities to meet base demand, they have high capacity load factors and can be said to be outstanding sourc-es of power in terms of economy.
W Wind PowerPower Generation Business for a Low-Carbon Society
J-POWER owns 22 wind power facili-ties with a total capacity of 439 MW, making it Japan’s second-ranked company in terms of wind power generation capacity. Because wind power is a clean, CO2-free power source and a form of renewable energy, J-POWER will continue pro-moting new wind power develop-ment going forward.
W transmission/transformationCore Infrastructure Supporting Japan’s Electric Power Network
J-POWER has major transmission lines with a total length of approxi-mately 2,400 km, including trunk lines that connect Honshu with Hokkaido, Shikoku, and Kyushu. We also own a frequency converter station that links the different frequencies of eastern and western Japan. These facilities are key infrastructure elements that play extremely important roles in the comprehensive management of Japan’s nationwide power grid.
share of Hydroelectric Power Generation Capacity in Japan
(As of March 31, 2017)
Sources: Compiled from Electric Power Survey Statistics (Agency for Natural Resources and Energy) and other sources
J-PoWeR
17%
Sources: Compiled from Electric Power Survey Statistics (Agency for Natural Resources and Energy) and other sources
J-PoWeR
19%
share of Coal-Fired Power Generation Capacity in Japan
(As of March 31, 2017)
overseas Power Generation BusinessFrom the late 1990s, J-POWER has been working on its overseas power generation business, which invests the Company’s funds and technology and participates in electric power generation projects. As of April 1, 2017, the J-POWER Group owns power generation facilities that are in operation in six countries and regions, including Thailand, the United States, and China. These facilities have a total capacity of 6,677 MW (owned capacity basis). Furthermore, the Company is advancing newly developed projects in Indonesia (total output of 2,000 MW, planned for completion in 2020) and in the United States (total output of 926 MW, planned for completion in 2018).
overseas Consulting BusinessJ-POWER has conducted its overseas consulting business, which involves technical cooperation related to electric power development and environmental preservation, since the 1960s. As of April 1, 2017, the Company has executed a cumulative total of 357 projects in 64 countries and regions.
share of Wind Power Generation Capacity in Japan
(As of March 31, 2017)
Sources: Compiled from Electric Power Survey Statistics (Agency for Natural Resources and Energy) and other sources
J-PoWeR
15%
EuropeOverseas power generation business In operation 1 country · 24 MWConsulting service projects 14 countries · 20 projects
Middle East/AfricaConsulting service projects 15 countries · 42 projects
AsiaOverseas power generation business In operation 4 countries/regions · 4,868 MW Under construction/planned 1 country · 1 project 680 MWConsulting service projects 21 countries/regions · 245 projects
North AmericaOverseas power generation business In operation 1 country · 1,785 MW Under construction 1 country · 1 project 232 MWConsulting service projects 1 country · 1 project
Central and South AmericaConsulting service projects 13 countries · 49 projects
overseas power generation business(As of April 1, 2017)
P In operation 6 countries/ 36 projects regions
Owned capacity 6,677 MW
p Under construction/planned
2 countries 2 projects Owned capacity 912 MW
overseas consulting service projects(As of April 1, 2017)
64 countries/ 357 projects regions
3
J-PoWeR Group Business Development throughout Japan
50Hz
60Hz
Green Power Kuzumaki
Kurotani
Tokachi Trunk Line
Ohma Trunk Line
Hakodate (AC/DC Converter Station)
Kitahon HVDC Link
Kamikita (AC/DC Converter Station)
Ohma
ShimogoItoigawa
Tokyo Bayside
Mihama Bayside PowerShintoyone
Awara-KitagataTadami Trunk Line
Sakuma WestTrunk Line
MiboroTrunk Line Sakuma East
Trunk LineNagoya
NishiTokyo
MinamiKawagoe
Takasago
Takehara UnitNew No. 1
Anan-Kihoku HVDC Link
Kumano Trunk Line
Anan (AC/DC Converter Station)
YanaseKihoku (AC/DC Converter Station)
Honshi Interconnecting Line
SameuraTosa
West AreaInterconnectingLine
Sendaigawa No. 1
Shinkatsurazawa Kumaoi
TagokuraOtori
OkukiyotsuOkukiyotsu No. 2Miboro
Funagira
Akiba No. 2Akiba No.1
Nagano
Kuttari
Kaminokuni
Isawa No.1
Minami Ehime
Osaki CoolGen
Advancing DemonstrationStudies of Offshore
Wind Power Generation
Tedorigawa No. 1
Wasabizawa
Genex MizueKashima Power
Yamaguchi Ube Power
Konokidani
Takasago UnitNew No. 1 and No. 2
Bayside Energy
Ohma
Yurihonjo Bayside
Tachibanawan
Matsuura
Nukabira
Tomamae Winvilla
Takehara
Matsushima
Okutadami
Ishikawa Coal
Onikobe
Numappara
Sakuma Frequency Converter Station
Sakuma
Isogo
IkeharaKanmonInterconnecting Line
Setana-Ohsato
New Sakuma Frequency Converter Station(Tentative name)
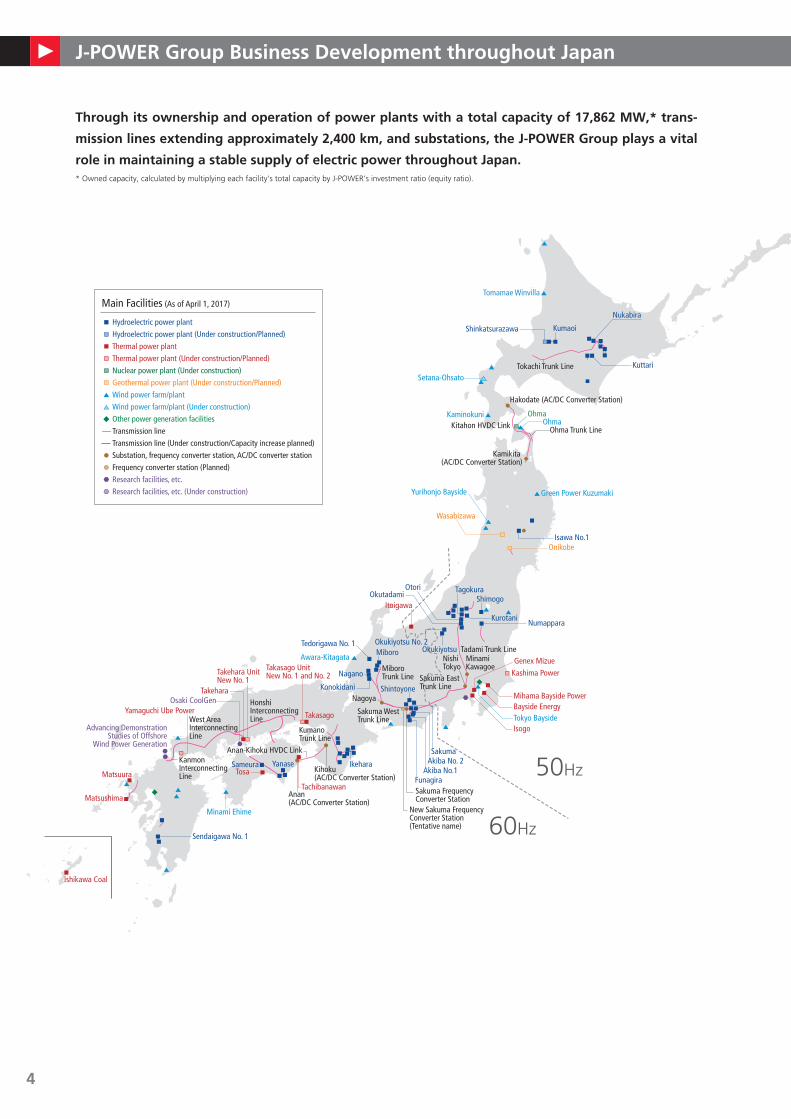
Main Facilities (As of April 1, 2017)
Hydroelectric power plant
Hydroelectric power plant (Under construction/Planned)
Thermal power plant
Thermal power plant (Under construction/Planned)
Nuclear power plant (Under construction)
Geothermal power plant (Under construction/Planned)
Wind power farm/plant
Wind power farm/plant (Under construction)
Other power generation facilities
Transmission line
Transmission line (Under construction/Capacity increase planned)
Substation, frequency converter station, AC/DC converter station
Frequency converter station (Planned)
Research facilities, etc.
Research facilities, etc. (Under construction)
through its ownership and operation of power plants with a total capacity of 17,862 MW,* trans-
mission lines extending approximately 2,400 km, and substations, the J-PoWeR Group plays a vital
role in maintaining a stable supply of electric power throughout Japan.* Owned capacity, calculated by multiplying each facility’s total capacity by J-POWER’s investment ratio (equity ratio).
4

J-PoWeR Group Business Development throughout Japan
(MW)70,000
Hydroelectric Power Thermal Power Nuclear Power Other
Sources: Compiled from Electric Power Survey Statistics (Agency for Natural Resources and Energy) and other sources
Tokyo
Kansai
Chubu
Kyushu
Tohoku
J-POWER
Chugoku
Hokuriku
Hokkaido
Shikoku
Okinawa
0 50,00040,000 60,00010,000 20,000 30,000
Power Generating Capacity of J-PoWeR and 10 electric Power Companies (ePCos)(As of March 31, 2017)
Domestic electric Power Business Facilities (In operation)(As of April 1, 2017)
J-PoWeR Facilities No. of Facilities
Power generation facilities
Hydroelectric power plants 61 8,571 MWThermal power plants* 12 9,140 MWWind power farms/plants* 22 440 MWOther power generation facilities 2 32 MWTotal 97 18,189 MW
Transmission lines 2,410.2 kmAC power transmission lines 2,143.0 kmDC power transmission lines 267.2 km
Substations 4 4,301 MVAFrequency converter station 1 300 MWAC/DC converter stations 4 2,000 MWWireless communication facilities (circuit length) 5,911 km
* Not taking investment ratio (equity ratio) into account
Power Generation by Power source in Japan
While hydroelectric power previously accounted for the bulk of
electric power generating capacity in Japan, there was later a
shift to the use of thermal power fueled by abundant and inex-
pensive oil. Since the oil shocks, the development of coal-fired
and natural gas-fired thermal power generation as well as nucle-
ar power has advanced, and efforts have been made to diversify
power generation methods. The operation of nuclear power
plants in Japan was suspended for a long time after the accident
at the Fukushima Daiichi Nuclear Power Plant in 2011. Although
a start has been made on a gradual recommencement of nuclear
power plant operations, coal and gas-fired thermal power re-
mains the main pillar of electricity supply in Japan.
50Hz
60Hz
Green Power Kuzumaki
Kurotani
Tokachi Trunk Line
Ohma Trunk Line
Hakodate (AC/DC Converter Station)
Kitahon HVDC Link
Kamikita (AC/DC Converter Station)
Ohma
ShimogoItoigawa
Tokyo Bayside
Mihama Bayside PowerShintoyone
Awara-KitagataTadami Trunk Line
Sakuma WestTrunk Line
MiboroTrunk Line Sakuma East
Trunk LineNagoya
NishiTokyo
MinamiKawagoe
Takasago
Takehara UnitNew No. 1
Anan-Kihoku HVDC Link
Kumano Trunk Line
Anan (AC/DC Converter Station)
YanaseKihoku (AC/DC Converter Station)
Honshi Interconnecting Line
SameuraTosa
West AreaInterconnectingLine
Sendaigawa No. 1
Shinkatsurazawa Kumaoi
TagokuraOtori
OkukiyotsuOkukiyotsu No. 2Miboro
Funagira
Akiba No. 2Akiba No.1
Nagano
Kuttari
Kaminokuni
Isawa No.1
Minami Ehime
Osaki CoolGen
Advancing DemonstrationStudies of Offshore
Wind Power Generation
Tedorigawa No. 1
Wasabizawa
Genex MizueKashima Power
Yamaguchi Ube Power
Konokidani
Takasago UnitNew No. 1 and No. 2
Bayside Energy
Ohma
Yurihonjo Bayside
Tachibanawan
Matsuura
Nukabira
Tomamae Winvilla
Takehara
Matsushima
Okutadami
Ishikawa Coal
Onikobe
Numappara
Sakuma Frequency Converter Station
Sakuma
Isogo
IkeharaKanmonInterconnecting Line
Setana-Ohsato
New Sakuma Frequency Converter Station(Tentative name)
Main Facilities (As of April 1, 2017)
Hydroelectric power plant
Hydroelectric power plant (Under construction/Planned)
Thermal power plant
Thermal power plant (Under construction/Planned)
Nuclear power plant (Under construction)
Geothermal power plant (Under construction/Planned)
Wind power farm/plant
Wind power farm/plant (Under construction)
Other power generation facilities
Transmission line
Transmission line (Under construction/Capacity increase planned)
Substation, frequency converter station, AC/DC converter station
Frequency converter station (Planned)
Research facilities, etc.
Research facilities, etc. (Under construction)
(TWh)
0
1,000
800
600
400
200
201320102000199019801970
Nuclear Oil, etc. Coal LNG Hydroelectric Geothermal and new energy
Note: Figures for oil, etc., include figures for LPG, other kinds of gas, and bituminous substances (including power received). Figures for total power generation volume are for the 10 EPCOs (including power received).
Source: Agency for Natural Resources and Energy
5

Message from President toshifumi Watanabe
Looking at Japan’s electric power industry, in July 2015 the Japanese government published its Long-Term
Energy Supply and Demand Outlook and presented its energy-mix targets for 2030. The government is also
steadily advancing its electricity system reform, including the full-scale liberalization of retail business and the
abolishment of wholesale regulations, which were started in April 2016, as well as the unbundling of power
generation and transmission scheduled for 2020. In addition, the Paris Agreement has come into effect, and
the business environment surrounding the J-POWER Group has undergone significant changes, including
demands for efforts to be made in Japan to further reduce greenhouse gas emissions.
Based on these kinds of changes in its business environment and on its own strengths, in July 2015, the
J-POWER Group established a Medium-Term Management Plan to address the challenge of achieving further
growth over the next decade. As for the direction of the plan, there are three concepts:
“Realize growth in Japan by surviving the competition in a liberalized market,” “Enhance overseas business
expansion,” and “Further low-carbon technologies enabling greater business growth globally,” and we are
actively promoting initiatives to give the direction these concepts are taking some tangible form.
Specifically, in addition to the large-scale, coal-fired thermal power generation projects currently under
construction, such as Takehara and Kashima in Japan and in Central Java overseas, we are implementing sev-
eral wind power, geothermal, and hydroelectric projects in the field of renewable energy and making steady
progress in asset formation aimed at future growth. Furthermore, the oxygen-blown IGCC demonstration
project, the next-generation, coal-fired thermal power generation technology, started operations in March. In
the years to come, it is our intention to ensure the ongoing steady growth of the J-POWER Group through
the discovery and promotion of even more superior projects in Japan and abroad.
We will continue to do our utmost under our Corporate Philosophy: “We will meet people’s needs for
energy without fail, and play our part for the sustainable development of Japan and the rest of the world.”
We are grateful as always for your continued support and patronage.
Toshifumi Watanabe
President
September 2017
Actively advancing initiatives
toward the achievement of our
Medium-term Management
Plan, we will ensure the further
growth of the J-PoWeR Group.
6
Message from President toshifumi Watanabe
The Current J-POWER
Q Could you please tell us about the distinc-
tive features of J-PoWeR at this time?
A: Since its foundation in 1952 up to the present day, the
J-POWER Group has been developing large-scale hydroelectric
power plants and thermal power plants in Japan, and in recent
years has also actively engaged in overseas power generation
and the renewable energy business, such as domestic wind
power generation businesses. As contained in its Corporate
Philosophy, the Group has continued to provide the energy that
people want and contributed to the sustainable development of
Japan and the rest of the world. Currently, these power genera-
tion facilities have grown to approximately 25 GW in Japan and
overseas, of which domestic power generation facilities account
for around 18 GW; half of these are large-scale hydroelectric
power generation and wind power generation, and the other
half is coal-fired thermal power generation. Overseas power gen-
eration facilities are at around the 7 GW level and are owned in
Asian countries, including Thailand, and the United States, and
approximately 80% of the overseas thermal power generation
is gas-fired. In the power transmission business, we also own
cross-regional connecting lines that connect Honshu with each
of Hokkaido, Shikoku, and Kyushu, a frequency converter station
to connecting the regions with different frequencies, and other
such power grid facilities.
I think that people have gained the impression that J-POWER’s
core business is coal-fired thermal power generation. However,
as I mentioned, domestic coal-fired thermal power and renew-
able energy, such as hydroelectric and wind power generation,
and overseas gas-fired thermal power generation form the core,
and I think that, in Japan and abroad, the J-POWER Group as a
whole has a well-balanced power generation facility structure.
Response to Electricity System Reform
Q over a year has passed since the full-scale
liberalization of retail business, and the
abolishment of wholesale regulations was
implemented in April 2016. How will you
adapt to the competitive environment
that liberalization is bringing?
A: Although market competition in the power generation busi-
ness field has been hastened by the electricity system reform, as
a power generator, J-POWER has to compete with other power
generators and survive against that competition. In the case
of the J-POWER Group’s domestic power generation facilities,
coal-fired thermal power generation, which is inexpensive and
capable of stably procuring fuel compared to oil and LNG (lique-
fied natural gas), and large-scale hydroelectric power generation,
which is a form of renewable energy, account for the majority.
We thus possess sufficient cost-competitiveness, which is the key
to surviving against market competition that is gaining momen-
tum. Amid intensifying market competition, the J-POWER Group
is targeting further growth armed with a wealth of cost-compet-
itiveness. To that end, it will be necessary to work to stably bring
about the maximum operation of cost-competitive facilities, to
reduce risks and expand returns. We will continuously work to
further improve the operation and maintenance technologies
that the J-POWER Group has accumulated. We will also steadily
develop new coal-fired thermal power plants, such as the Take-
hara replacement facility and Kashima.
Q Please tell us about the importance of
J-PoWeR’s power distribution facilities
while the electricity system reform is pro-
gressing.
A: The robust competitive market aimed for with the electricity
system reform will only be realized when the wide-area power
distribution network is functioning well. We are endeavoring to
maintain the sound function of the Company’s distribution facili-
ties, including our cross-regional connecting lines and frequency
converter station, the part of that network for which we are re-
sponsible. From the viewpoint of maintaining distribution facilities
over a wide area, in 2016, we were also selected as the main
contractor for increasing the capacity of the Sakuma frequency
converter facility (now 300 MW→600 MW) and related transmis-
sion lines. At the present time, we are conducting investigations
toward the start of construction.
An Interview with the President
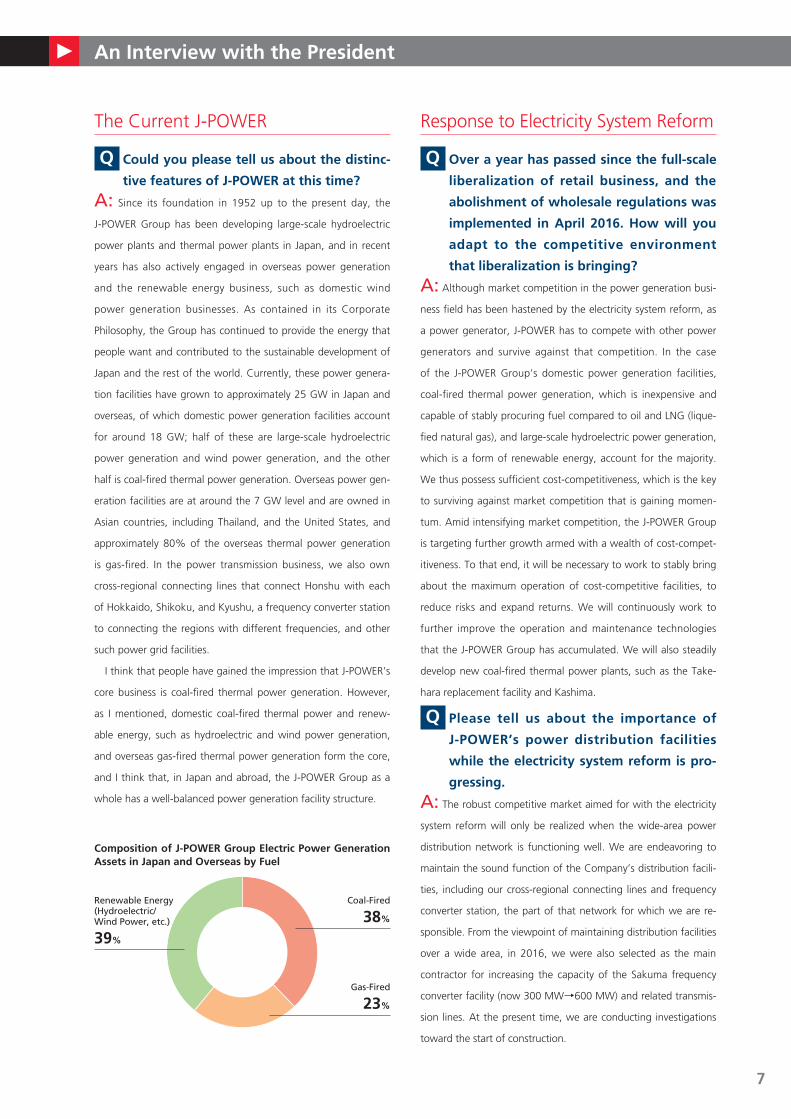
Composition of J-PoWeR Group electric Power Generation Assets in Japan and overseas by Fuel
Coal-Fired
38%
Renewable Energy (Hydroelectric/ Wind Power, etc.)
39%
Gas-Fired
23%
7
An Interview with the President
Expanding Installation of Renewable Energy
Q You mentioned earlier that large-scale hy-
droelectric power generation and wind
power generation, which are sources of re-
newable energy, account for most of the
J-PoWeR Group’s power generation assets.
Will there be continued expansion in the
Group’s renewable energy assets and busi-
ness in the years to come?
A: The development of large-scale, reservoir-type hydroelectric
power stations, which J-POWER has been developing since its
foundation, will be difficult in Japan going forward. In contrast,
we are working on the utilization of hydroelectric resources,
which represent purely domestic CO2-free energy, through the
development of small- and medium-sized hydroelectric power
generation projects that utilize untapped river flows and unused
heads of water and by increasing the capacity of existing power
plants. In December 2016, we commenced operation of the
Konokidani Hydroelectric Power Plant, a small-sized hydroelectric
power generation project that utilizes the large dam reservoir
and the head of water from the water inlet. In addition, at the
Akiba No. 2 Power Plant, we also conducted repowering, which
increases capacity by the installation of the latest technologies, in
accordance with the comprehensive renewal of major facilities.
In the case of wind power generation, the Ohma Wind Farm,
Yurihonjo Bayside Wind Farm, and Minami Ehime Wind Farm (in-
creased capacity) all commenced operations in fiscal 2016.
Currently, our domestic-owned capacity has expanded to
about 440 MW, making J-POWER the second-largest wind
power producer in the country. In addition, construction work is
proceeding at the Setana-Ohsato, Kuzumaki No. 2, and Nikaho
No. 2 sites, and new development of 136 MW is being advanced
at these three officially announced sites alone. In addition, in
Hibikinada, in the city of Kitakyushu, Fukuoka Prefecture, we
established a special-purpose company in cooperation with other
companies with the intention of bringing an offshore wind pow-
er generation project to fruition.
The J-POWER Group now has a more than 40-year record
of operating geothermal power plants. In addition to the con-
struction work on the Wasabizawa Geothermal Power Plant—a
jointly funded project with Mitsubishi Materials Corporation and
Mitsubishi Gas Chemical Company, Inc., which is proceeding
smoothly as a new development—we are planning to replace the
Onikobe Geothermal Power Station, which had been operating
until March 2017, and we are proceeding with environmental
assessment procedures.
We are also working to expand the use of biomass fuels in our
plans to reduce CO2 emissions by producing solid fuel from, for
example, waste, sewage sludge, and woodchips, and co-firing
them at coal-fired thermal power plants.
In such ways as described above, the J-POWER Group will
continue to proactively develop renewable energy through its
abundant operational experience and the installation of the lat-
est technologies.
Business Development Based on Japan’s Energy Mix
Q With coal-fired thermal power generation,
the carbon dioxide (Co2) emissions volumes
are greater than other methods of power
generation, and harsh opinions with regard
to coal-fired thermal power generation are
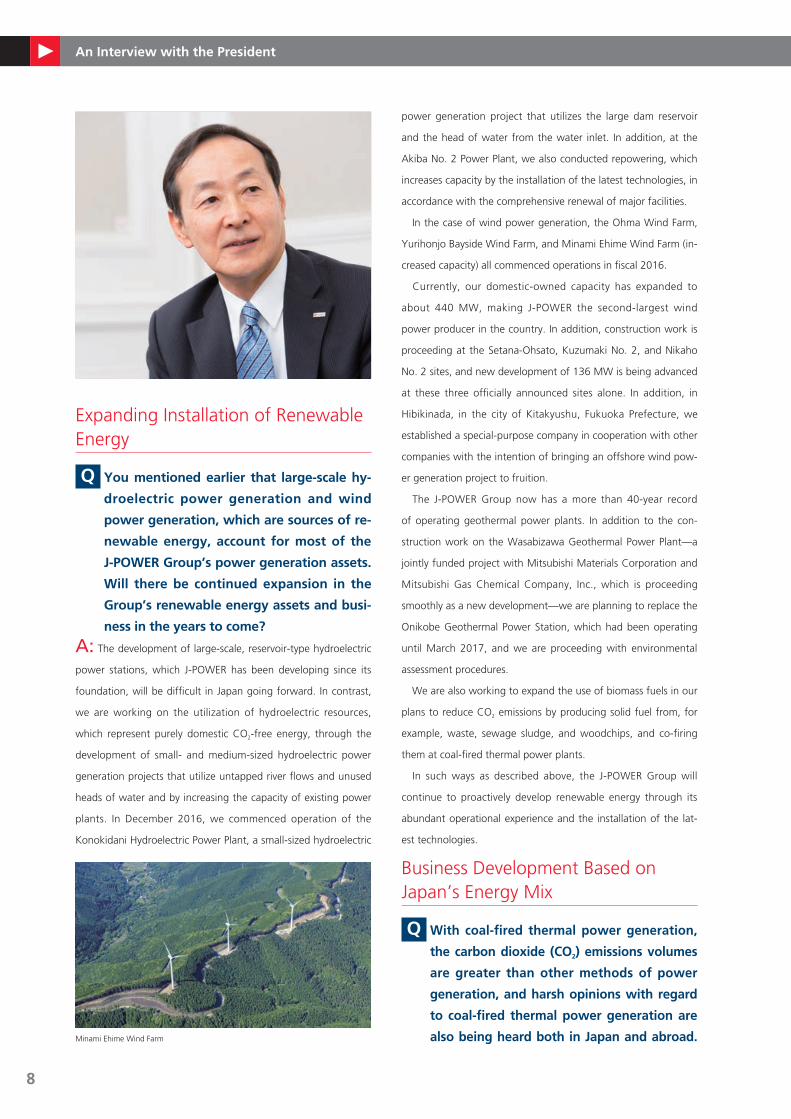
also being heard both in Japan and abroad. Minami Ehime Wind Farm
8
An Interview with the President
Based on the energy mix, what do you think
about the future of coal-fired thermal power
generation?
A: It is essential for domestic resource-poor Japan, which has
an energy self-sufficiency rate of 7.0%* and relies on imports
for most of its fossil fuels, to utilize diverse sources of energy
in a well-balanced manner. Even in the energy mix that Japan
is targeting for fiscal 2030, it is assumed that the use of coal-
fired thermal power generation will account for 26%. That is
because, as a widely produced resource with extensive reserves
throughout the world that presents the lowest geopolitical risk,
coal is a resource that is important for Japan’s energy security.
Furthermore, as coal can be stably procured at the lowest pric-
es upon arrival in Japan, coal-fired thermal power generation
fulfills the role of an excellent baseload power source. It is true,
however, that coal produces a greater volume of CO2, a green-
house gas, than other fossil fuels. The government’s Long-Term
Energy Supply and Demand Outlook says about fossil fuels
that it will “Realize higher efficiency of coal-fired and LNG-
fired thermal power generation, and promote their effective
utilization, while ensuring compatibility with the reduction of
environmental load.”
The electricity industry is building a voluntary framework so
that the industry as a whole will be able to reach the CO2 reduc-
tion target. To support these efforts, the government is creating
and adjusting legal rules for power generators and retailers with
the aim of securing effectiveness and transparency. As part of
the electricity industry, the J-POWER Group is working to fulfill its
responsibilities under this framework.
Accordingly, as the J-POWER Group, I would like us to focus
our efforts on reducing carbon emissions from coal-fired thermal
power generation.
* Fiscal 2015 estimated value
Source: Energy White Paper 2017 (Agency for Natural Resources and Energy)
Q Could you please tell us about your specif-
ic approaches to reducing the carbon
emissions from coal-fired thermal power
generation?
A: Currently, to reduce CO2 emissions from its coal-fired ther-
mal power generation operations, the J-POWER Group is ad-
vancing the replacement of its aging power generation facilities,
such as those at the Takehara and Takasago plants, with new,
high-efficiency, coal-fired thermal power generation facilities. For
new projects, such as the Kashima Power and Yamaguchi Ube
Power projects, we are adopting high-efficiency power genera-
tion technologies currently being commercialized.
In addition, in March 2017, we started a demonstration test
(the Osaki CoolGen Project) of oxygen-blown coal gasification
combined cycle generation, which represents the next-genera-
tion coal technology development toward the even higher effi-
ciency of and reduced carbon emissions from coal-fired thermal
power generation. For the next step, we will also conduct a
demonstration test on CO2 separation and capture technologies.
As a leading company in coal-fired thermal power generation,
the J-POWER Group will take measures in the years to come to
mitigate the effects of global warming through R&D and by the
introduction of the latest technologies. Promoting high efficiency
and the reduction of carbon emissions from coal-fired thermal
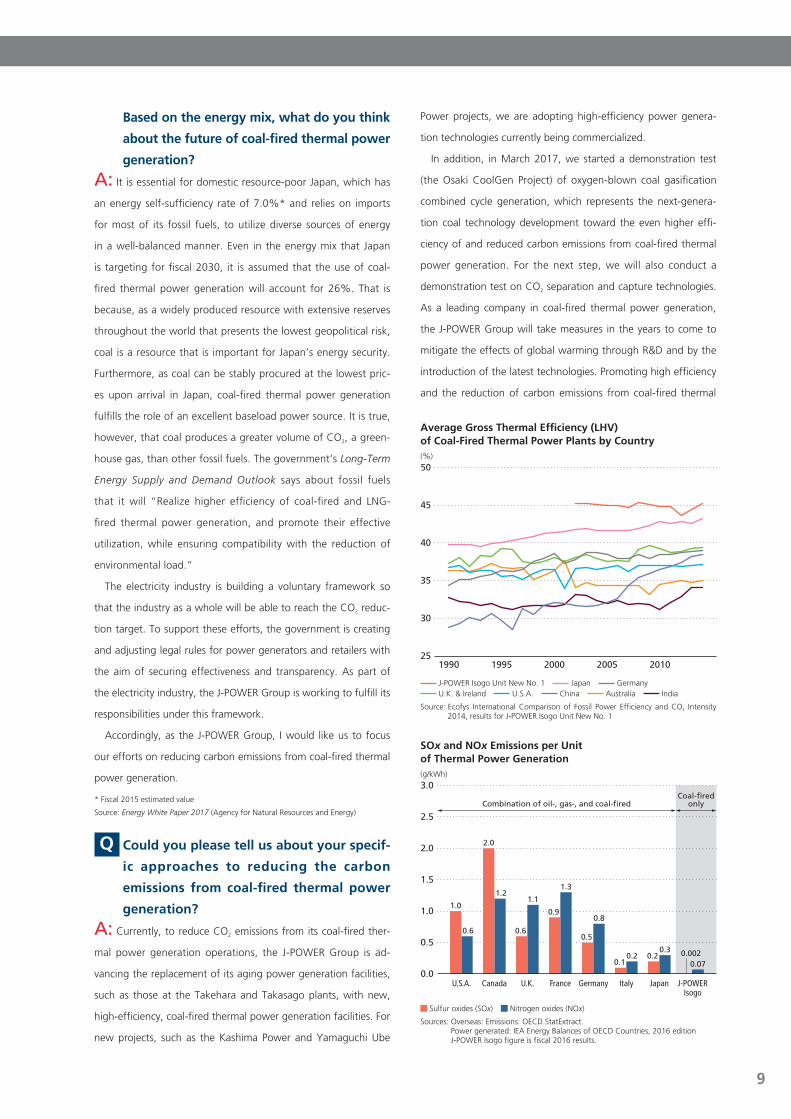
Average Gross thermal efficiency (LHV) of Coal-Fired thermal Power Plants by Country(%)
40
45
35
30
25
50
20102005200019951990
J-POWER Isogo Unit New No. 1 Japan Germany U.K. & Ireland U.S.A. China Australia India
Source: Ecofys International Comparison of Fossil Power Efficiency and CO2 Intensity 2014, results for J-POWER Isogo Unit New No. 1
sox and nox emissions per Unit of thermal Power Generation(g/kWh)
1.0
1.5
2.5
0.5
2.0
0.0
3.0
U.S.A. Canada U.K. France Germany Italy Japan J-POWERIsogo
0.0020.07
0.20.3
0.5
1.1
1.3
0.8
2.0
1.0
0.6 0.6
0.9
1.2
0.20.1
Combination of oil-, gas-, and coal-firedCoal-fired
only
Sulfur oxides (SOx) Nitrogen oxides (NOx)
Sources: Overseas: Emissions: OECD.StatExtract. Power generated: IEA Energy Balances of OECD Countries, 2016 edition J-POWER Isogo figure is fiscal 2016 results.
9
An Interview with the President
power generation, we will respond appropriately to global
warming issues.
The J-POWER Group has constantly been at the forefront
in adopting cutting-edge coal-fired thermal power generation
technologies over the decades. As a result, we possess not only
high-efficiency power generation technologies that emit less
CO2, but also environmental technologies that reduce emissions
of such atmospheric pollutants as sulfur oxides (SOx) and nitro-
gen oxides (NOx) to levels on par with gas-fired thermal power
generation.
In addition, we are working on the technology to manufacture
and utilize carbon-free energy, such as hydrogen, from low-
grade coal, leveraging the knowledge of coal that the J-POWER
Group has built up over many years.
Overseas Business Development
Q Could you please inform us about the state
of progress with the projects currently
under development?
A: In Thailand, Unit 2 of the U-Thai gas-fired thermal power
plant came online in December 2015, and the power generation
projects that we had previously been advancing, through our
consolidated subsidiaries in the country, have run their course.
There are currently two projects in development that have been
announced to follow on from these.
The first is a coal-fired thermal power generation project in
Central Java, Indonesia. In a country where electricity demand
is expected to rise sharply going forward, the construction of a
2,000 MW high-efficiency, coal-fired thermal power plant, which
will be fueled by Indonesia’s abundant coal reserves, is pro-
gressing smoothly toward the commencement of operations in
2020. The J-POWER Group’s coal-fired thermal power generation
technologies, which boast thermal efficiency that is among the
highest in the world and cleanness on par with gas-fired thermal
power generation, have been adopted for this power plant. By
doing so, I would like to help solve Indonesia’s energy problems
in a way that suits the country’s circumstances.
Next, in January 2017, we newly acquired a partial interest in
the natural gas-fired Westmoreland Power Plant, which is under
construction and scheduled to be supplied to the PJM market,
which is the most-developed electricity market in the United
States. This power plant is currently under construction, the in-
tention being to start commercial operations in fiscal 2018.
Q Although it appears that your overseas
power generation business will continue
to expand in the years ahead, do you
think it is possible that you will achieve
the 10 GW target for overseas-owned ca-
pacity by fiscal 2025, as stated in the
Medium-term Management Plan?
A: Currently, we have announced the two projects that are
under construction, but we are also considering multiple proj-
ects besides these. Especially in Asia, where strong demand for
electricity is expected, the J-POWER Group will leverage the
technological capabilities that it has accumulated so far and its
abundance of overseas business experience in its search for more
new development projects. Furthermore, we expect abundant
business opportunities in the United States, where we have an
established business platform and market liberalization is already
advanced. By taking advantage of such wide-ranging overseas
business opportunities and building up superior assets, we aim
to achieve the goal of expanding our overseas-owned capacity to
10 GW by fiscal 2025.
The Ohma Nuclear Power Plant Project
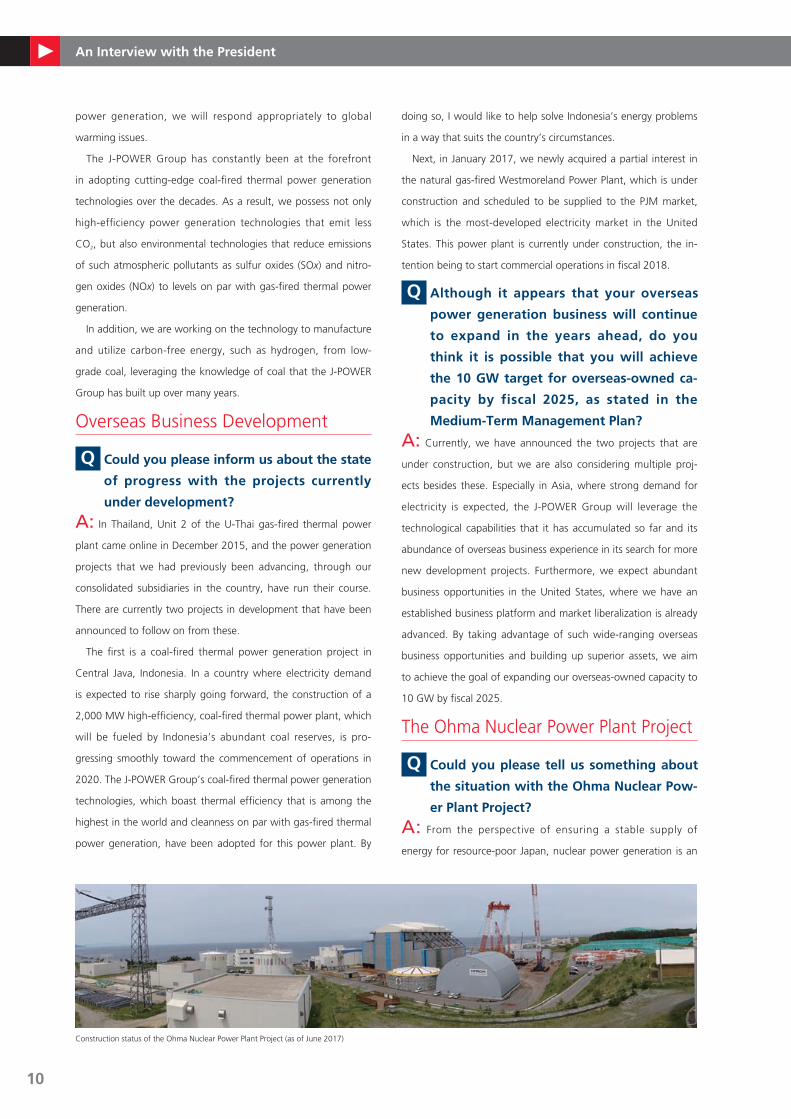
Q Could you please tell us something about
the situation with the ohma nuclear Pow-
er Plant Project?
A: From the perspective of ensuring a stable supply of
energy for resource-poor Japan, nuclear power generation is an
Construction status of the Ohma Nuclear Power Plant Project (as of June 2017)
10
An Interview with the President
indispensable baseload power source. At the same time, nuclear
power plants represent a power source that helps to address the
issue of global warming, as their operation emits no CO2.
Some plutonium remains in the spent fuel from nuclear power
plant operations. In principle, to guard against nuclear non-pro-
liferation, Japan does not hold surplus plutonium. For this reason
and to use resources effectively, Japan promotes a nuclear fuel
cycle in which spent fuel is reprocessed so that the plutonium
and other useful materials are recovered and utilized.
The Ohma Nuclear Power Plant will be able to operate using
only uranium-plutonium mixed oxide (MOX) fuel. Nuclear power
plants are commonly able to use up to about one-third MOX fuel.
As we are aiming to use only MOX fuel at the Ohma Nuclear Power
Plant, it will play an important role in the nuclear fuel cycle.
The Ohma Nuclear Power Plant is currently under construction
and undergoes reviews of its compliance with new regulatory
standards by the Nuclear Regulation Authority. In addition to
appropriately responding to the results of reviews, we are ad-
vancing independent efforts and steadily implementing extensive
safety measures, which are a necessary condition for commenc-
ing operations.
Returns to Shareholders
Q What are your thoughts with regard to fu-
ture returns to shareholders?
A: The business environment of the J-POWER Group is in a
transient period that changes dramatically toward fiscal 2020
and beyond, such as the progress of liberalization accompanying
the electricity system reform.
Under these circumstances, although the J-POWER Group has
reached the stage at which it is able to recover its investments
in its overseas power generation business, for the time being,
we are regarding it as a time to engage in the development of
business projects both in Japan and overseas and to form the
business assets for further growth.
Therefore, for the meantime, we will continue the stable div-
idends while striving to form competitive business assets and
maintaining and improving financial soundness.
In addition, we will flexibly consider appropriate ways to
returns to shareholders that suit the J-POWER Group business
model in a liberalized market.
Corporate Governance
Q the composition of the Board of Directors
includes three outside directors, but is
that function sufficiently performed?
A: Every year, we analyze and assess the effectiveness of the
Board of Directors. In fiscal 2016, we conducted a questionnaire
survey, involving all the members of the Board of Directors, on
the composition, management, roles, and responsibilities of the
Board of Directors, discussed the results at a Board of Directors’
meeting, and judged that the effectiveness of the Board of Direc-
tors was sufficiently secured. In fiscal 2017, based on the status
of initiatives implemented on the basis of the analysis and assess-
ment results of the previous year and the results of interviews
conducted mainly by the outside directors and Audit & Supervi-
sory Board Members and chairpersons of the Board of Directors
and the Audit & Supervisory Board, we will judge whether the
effectiveness of the Board of Directors remains sufficiently se-
cured as a result of discussions at a Board of Directors’ meeting.
In order for the outside directors and Audit & Supervisory
Board Members to fulfill their duties, we provide information
on these matters at any time with the aim of deepening their
understanding with regard to the J-POWER Group’s Corporate
Philosophy, medium-term management plans, business, financial
affairs, and organization. Additionally, we provide opportunities,
such as inspections of J-POWER Group facilities, for them to gain
an even deeper understanding of our businesses.
Going forward, we will continue to make efforts to improve
the effectiveness of the Board of Directors while enriching dis-
cussions based on changes in the business environment.
11
Japan’s electric Power supply system
electricity system Reform
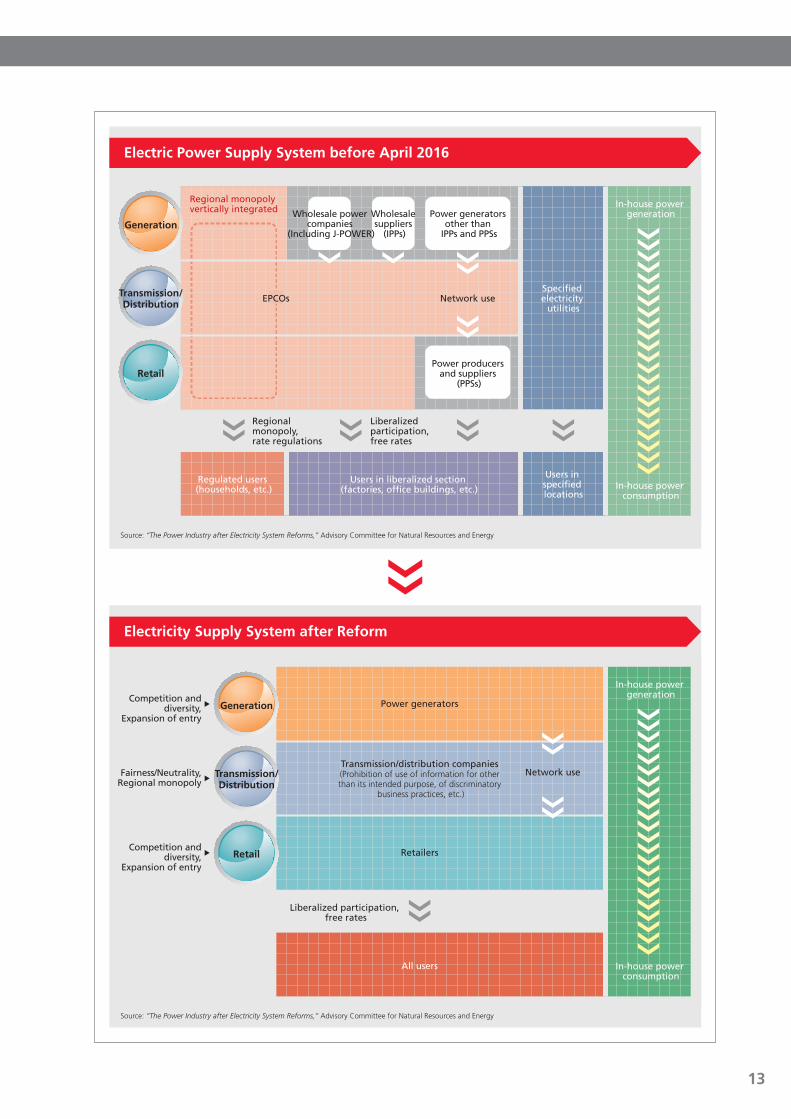
Until now, the electric power supply system has comprised the
traditional, vertically integrated electric power companies
(EPCOs); wholesale power companies, including J-POWER, and
wholesale suppliers (IPPs) that supply electricity to EPCOs; and
power producers and suppliers (PPSs). Amid a trend toward
enhanced electric power industry liberalization, the revision of
the Electricity Business Act created systems that enabled the cre-
ation of IPPs and PPSs and allowed companies other than electric
power companies to engage in the wholesale supply of power to
electric power companies as well as the retail distribution of
power from 1995 onward. Since 2005, electric power transac-
tions have been carried out at the Japan Electric Power Exchange
(JEPX). Due in part to the Great East Japan Earthquake and the
accident at TEPCO’s Fukushima Daiichi Nuclear Power Plant, elec-
tricity generation costs have been rising, and the balance of elec-
tric power supply and demand in Japan is tightening. In
response, the government is advancing electricity system reform
as part of efforts to rebuild its energy policy.
The three goals of the reform are securing the stable supply of
electricity, suppressing electricity rates to the maximum extent
possible, and providing consumers with choices as well as busi-
ness operators with opportunities to expand their businesses. To
achieve these goals, electricity system reform will be implement-
ed in three stages, namely expanding the operations of wide-
area electricity grids, fully liberalizing the retail market and power
generation, and further securing the neutrality of the power
transmission/distribution sector through legal unbundling.
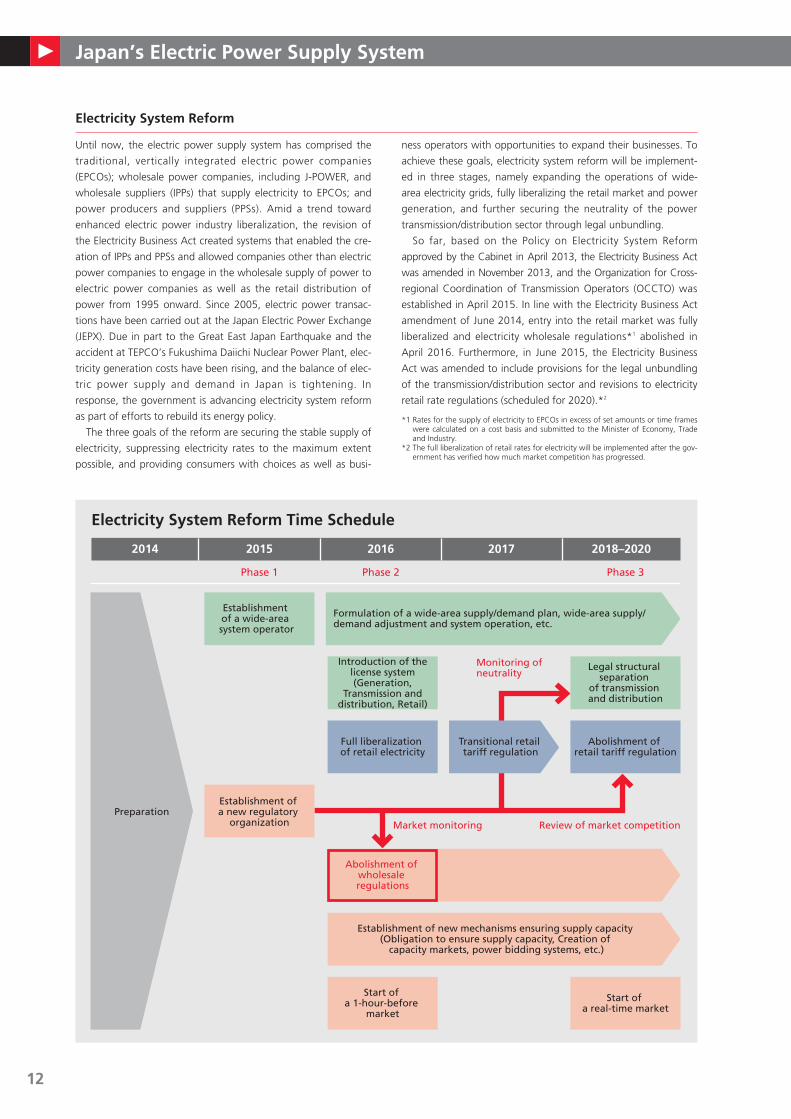
So far, based on the Policy on Electricity System Reform
approved by the Cabinet in April 2013, the Electricity Business Act
was amended in November 2013, and the Organization for Cross-
regional Coordination of Transmission Operators (OCCTO) was
established in April 2015. In line with the Electricity Business Act
amendment of June 2014, entry into the retail market was fully
liberalized and electricity wholesale regulations*1 abolished in
April 2016. Furthermore, in June 2015, the Electricity Business
Act was amended to include provisions for the legal unbundling
of the transmission/distribution sector and revisions to electricity
retail rate regulations (scheduled for 2020).*2
*1 Rates for the supply of electricity to EPCOs in excess of set amounts or time frames were calculated on a cost basis and submitted to the Minister of Economy, Trade and Industry.
*2 The full liberalization of retail rates for electricity will be implemented after the gov-ernment has verified how much market competition has progressed.
Formulation of a wide-area supply/demand plan, wide-area supply/demand adjustment and system operation, etc.
Establishment of new mechanisms ensuring supply capacity (Obligation to ensure supply capacity, Creation of
capacity markets, power bidding systems, etc.)
Review of market competition
Start of a real-time market
Monitoring of neutrality
Transitional retail tariff regulation
Abolishment of retail tariff regulation
Introduction of the license system (Generation,
Transmission and distribution, Retail)
Full liberalization of retail electricity
Market monitoring
Abolishment of wholesale regulations
Start of a 1-hour-before
market
Establishment of a wide-area system operator
Establishment of a new regulatory
organizationPreparation
2014 2015 2016 2017 2018–2020
Phase 1 Phase 3Phase 2
Electricity System Reform Time Schedule
Legal structural separation
of transmission and distribution
12
Japan’s electric Power supply system
Regulated users (households, etc.)
Regional monopoly vertically integrated
Regional monopoly, rate regulations
Liberalized participation, free rates
Users in specified locations
Specified electricity
utilities
Power generators other than
IPPs and PPSs
In-house power generation
In-house power consumption
Power producers and suppliers
(PPSs)
Wholesale suppliers
(IPPs)
Wholesale power companies
(Including J-POWER)
Users in liberalized section (factories, office buildings, etc.)
Network useEPCOs
Generation
Transmission/Distribution
Retail
Source: “The Power Industry after Electricity System Reforms,” Advisory Committee for Natural Resources and Energy
electric Power supply system before April 2016
Network use
In-house power generation
In-house power consumption
Power generators
Retailers
All users
Liberalized participation, free rates
Transmission/distribution companies(Prohibition of use of information for otherthan its intended purpose, of discriminatory
business practices, etc.)
Generation
Transmission/Distribution
Retail
Competition and diversity,
Expansion of entry
Fairness/Neutrality, Regional monopoly
Competition and diversity,
Expansion of entry
Source: “The Power Industry after Electricity System Reforms,” Advisory Committee for Natural Resources and Energy
electricity supply system after Reform
13
J-PoWeR Group Medium-term Management Plan —Facing the Challenge of Further Growth—
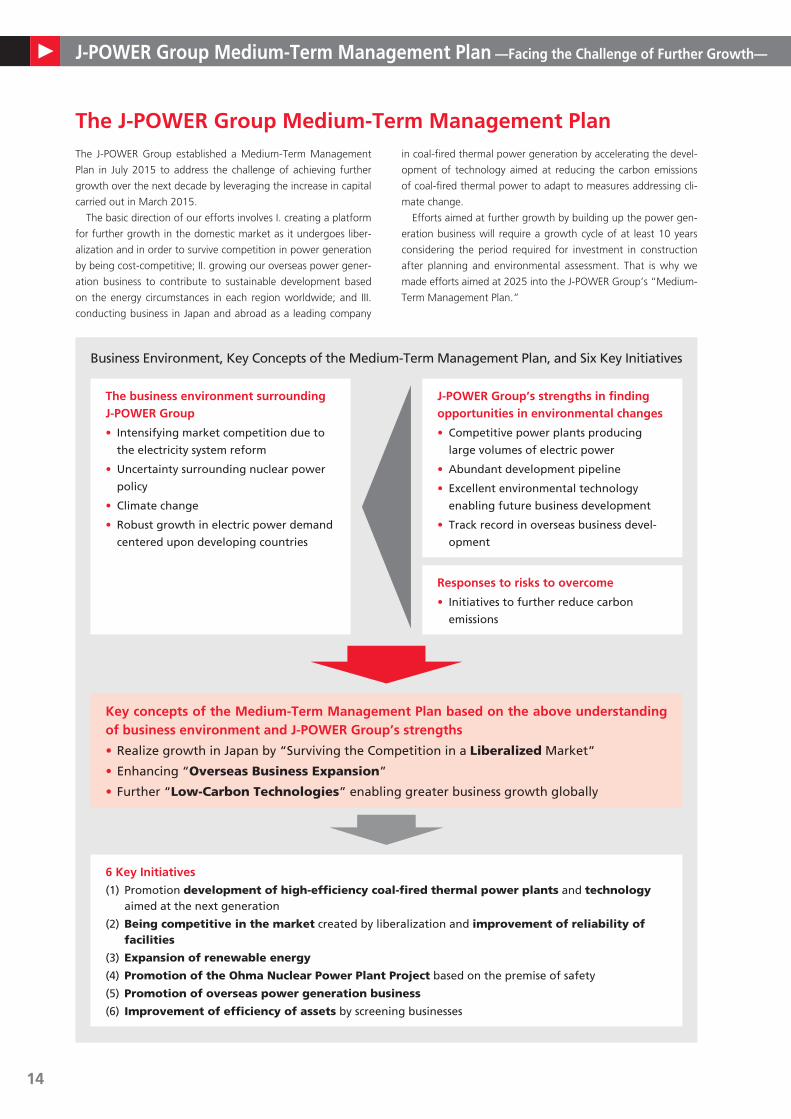
The J-POWER Group established a Medium-Term Management
Plan in July 2015 to address the challenge of achieving further
growth over the next decade by leveraging the increase in capital
carried out in March 2015.
The basic direction of our efforts involves I. creating a platform
for further growth in the domestic market as it undergoes liber-
alization and in order to survive competition in power generation
by being cost-competitive; II. growing our overseas power gener-
ation business to contribute to sustainable development based
on the energy circumstances in each region worldwide; and III.
conducting business in Japan and abroad as a leading company
in coal-fired thermal power generation by accelerating the devel-
opment of technology aimed at reducing the carbon emissions
of coal-fired thermal power to adapt to measures addressing cli-
mate change.
Efforts aimed at further growth by building up the power gen-
eration business will require a growth cycle of at least 10 years
considering the period required for investment in construction
after planning and environmental assessment. That is why we
made efforts aimed at 2025 into the J-POWER Group’s “Medium-
Term Management Plan.”
the J-PoWeR Group Medium-term Management Plan
Business Environment, Key Concepts of the Medium-Term Management Plan, and Six Key Initiatives
the business environment surrounding J-PoWeR Group
• Intensifying market competition due to
the electricity system reform
• Uncertainty surrounding nuclear power
policy
• Climate change
• Robust growth in electric power demand
centered upon developing countries
J-PoWeR Group’s strengths in finding opportunities in environmental changes
• Competitive power plants producing
large volumes of electric power
• Abundant development pipeline
• Excellent environmental technology
enabling future business development
• Track record in overseas business devel-
opment
Responses to risks to overcome
• Initiatives to further reduce carbon
emissions
Key concepts of the Medium-term Management Plan based on the above understanding of business environment and J-PoWeR Group’s strengths
• Realize growth in Japan by “Surviving the Competition in a Liberalized Market”
• Enhancing “Overseas Business Expansion”
• Further “Low-Carbon Technologies” enabling greater business growth globally
6 Key Initiatives
(1) Promotion development of high-efficiency coal-fired thermal power plants and technology aimed at the next generation
(2) Being competitive in the market created by liberalization and improvement of reliability of facilities
(3) Expansion of renewable energy
(4) Promotion of the Ohma Nuclear Power Plant Project based on the premise of safety
(5) Promotion of overseas power generation business
(6) Improvement of efficiency of assets by screening businesses
14
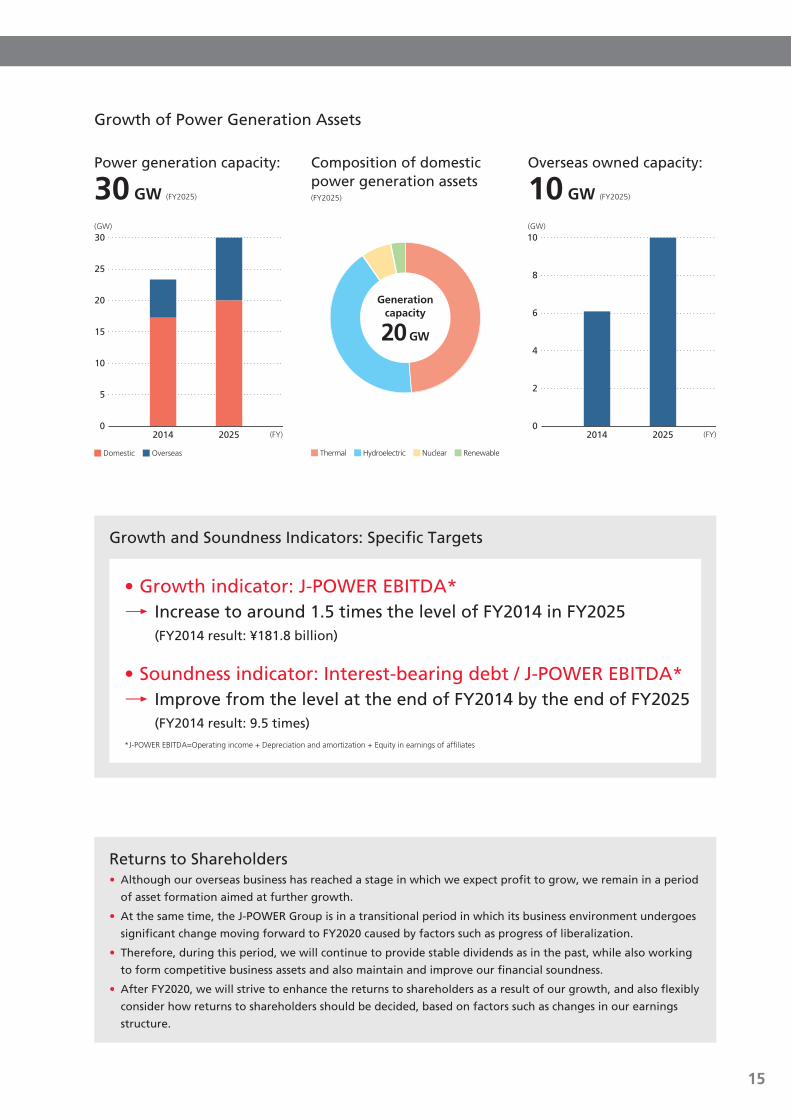
Growth of Power Generation Assets
Power generation capacity:
30 GW (FY2025)
(GW)
10
5
15
20
0
30
25
20252014
Domestic Overseas
(FY)
Composition of domestic power generation assets(FY2025)
Thermal Hydroelectric Nuclear Renewable
Overseas owned capacity:
10 GW (FY2025)
(GW)
2
4
6
0
10
8
20252014
(FY)
J-PoWeR Group Medium-term Management Plan —Facing the Challenge of Further Growth—
Generation capacity
20 GW
Growth and Soundness Indicators: Specific Targets
• Growth indicator: J-POWER EBITDA*→Increase to around 1.5 times the level of FY2014 in FY2025 (FY2014 result: ¥181.8 billion)
• Soundness indicator: Interest-bearing debt / J-POWER EBITDA*→Improve from the level at the end of FY2014 by the end of FY2025 (FY2014 result: 9.5 times)
*J-POWER EBITDA=Operating income + Depreciation and amortization + Equity in earnings of affiliates
Returns to Shareholders • Although our overseas business has reached a stage in which we expect profit to grow, we remain in a period
of asset formation aimed at further growth.
• At the same time, the J-POWER Group is in a transitional period in which its business environment undergoes
significant change moving forward to FY2020 caused by factors such as progress of liberalization.
• Therefore, during this period, we will continue to provide stable dividends as in the past, while also working
to form competitive business assets and also maintain and improve our financial soundness.
• After FY2020, we will strive to enhance the returns to shareholders as a result of our growth, and also flexibly
consider how returns to shareholders should be decided, based on factors such as changes in our earnings
structure.
15
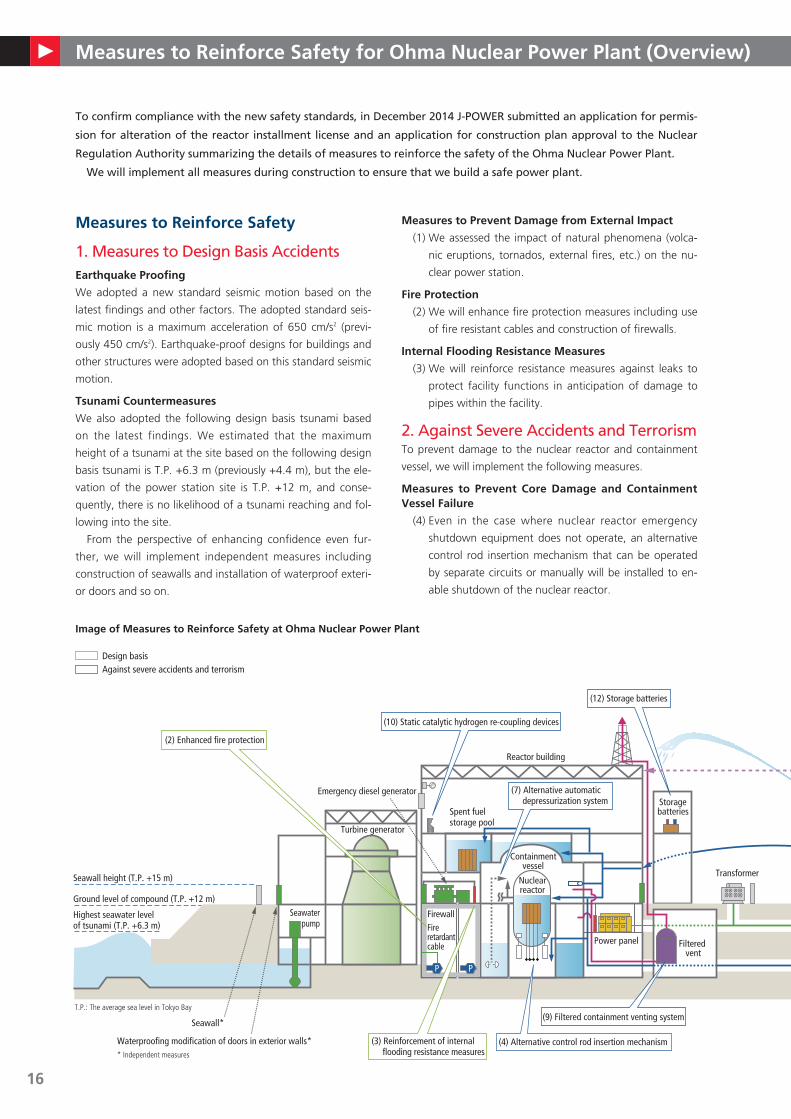
Measures to Reinforce safety for ohma nuclear Power Plant (overview)
Measures to Reinforce safety
1. Measures to Design Basis Accidentsearthquake Proofing
We adopted a new standard seismic motion based on the
latest findings and other factors. The adopted standard seis-
mic motion is a maximum acceleration of 650 cm/s2 (previ-
ously 450 cm/s2). Earthquake-proof designs for buildings and
other structures were adopted based on this standard seismic
motion.
tsunami Countermeasures
We also adopted the following design basis tsunami based
on the latest findings. We estimated that the maximum
height of a tsunami at the site based on the following design
basis tsunami is T.P. +6.3 m (previously +4.4 m), but the ele-
vation of the power station site is T.P. +12 m, and conse-
quently, there is no likelihood of a tsunami reaching and fol-
lowing into the site.
From the perspective of enhancing confidence even fur-
ther, we will implement independent measures including
construction of seawalls and installation of waterproof exteri-
or doors and so on.
Measures to Prevent Damage from external Impact
(1) We assessed the impact of natural phenomena (volca-
nic eruptions, tornados, external fires, etc.) on the nu-
clear power station.
Fire Protection
(2) We will enhance fire protection measures including use
of fire resistant cables and construction of firewalls.
Internal Flooding Resistance Measures
(3) We will reinforce resistance measures against leaks to
protect facility functions in anticipation of damage to
pipes within the facility.
2. Against Severe Accidents and TerrorismTo prevent damage to the nuclear reactor and containment
vessel, we will implement the following measures.
Measures to Prevent Core Damage and Containment Vessel Failure
(4) Even in the case where nuclear reactor emergency
shutdown equipment does not operate, an alternative
control rod insertion mechanism that can be operated
by separate circuits or manually will be installed to en-
able shutdown of the nuclear reactor.
To confirm compliance with the new safety standards, in December 2014 J-POWER submitted an application for permis-
sion for alteration of the reactor installment license and an application for construction plan approval to the Nuclear
Regulation Authority summarizing the details of measures to reinforce the safety of the Ohma Nuclear Power Plant.
We will implement all measures during construction to ensure that we build a safe power plant.
Image of Measures to Reinforce safety at ohma nuclear Power Plant
Ground level of compound (T.P. +12 m)
Highest seawater level of tsunami (T.P. +6.3 m)
Seawall height (T.P. +15 m)
Reactor building
Nuclearreactor
Containment vessel
Power panel Filtered vent
Storagebatteries
Transformer
* Independent measures
Turbine generator
Emergency diesel generator
Seawaterpump
Spent fuel storage pool
P P
Seawall*
Waterproofing modification of doors in exterior walls*
FirewallFire retardant cable
(3) Reinforcement of internal flooding resistance measures
Design basisAgainst severe accidents and terrorism
(4) Alternative control rod insertion mechanism
(12) Storage batteries
(10) Static catalytic hydrogen re-coupling devices
(2) Enhanced fire protection
(7) Alternative automatic depressurization system
(9) Filtered containment venting system
Image of Measures to Reinforce Safety at Ohma Nuclear Power Plant
T.P.: The average sea level in Tokyo Bay
Water source
Elevated ground (T.P. +20 m or higher)
66 kVswitching yard facilities
500 kVswitching yard facilities
Oil
Water source
P
Back-up transformer
(12) Installation of air-cooled emergency generators, Power supply vehicles
(6) Mobile alternative water injection pumps
(14) Emergency response office
(15) Reinforcement of communications facilities
(16) Mobile monitoring posts
(1) Consideration of natural phenomena (volcanic eruptions, tornados, external fires, etc.)
(8) Heat exchanger units(17) Specified severe accident response facilities
Adequate distance or robustness
(11) Water spraying facilities
(5) Alternative water injection facilities
(13) Water storage tanks
16
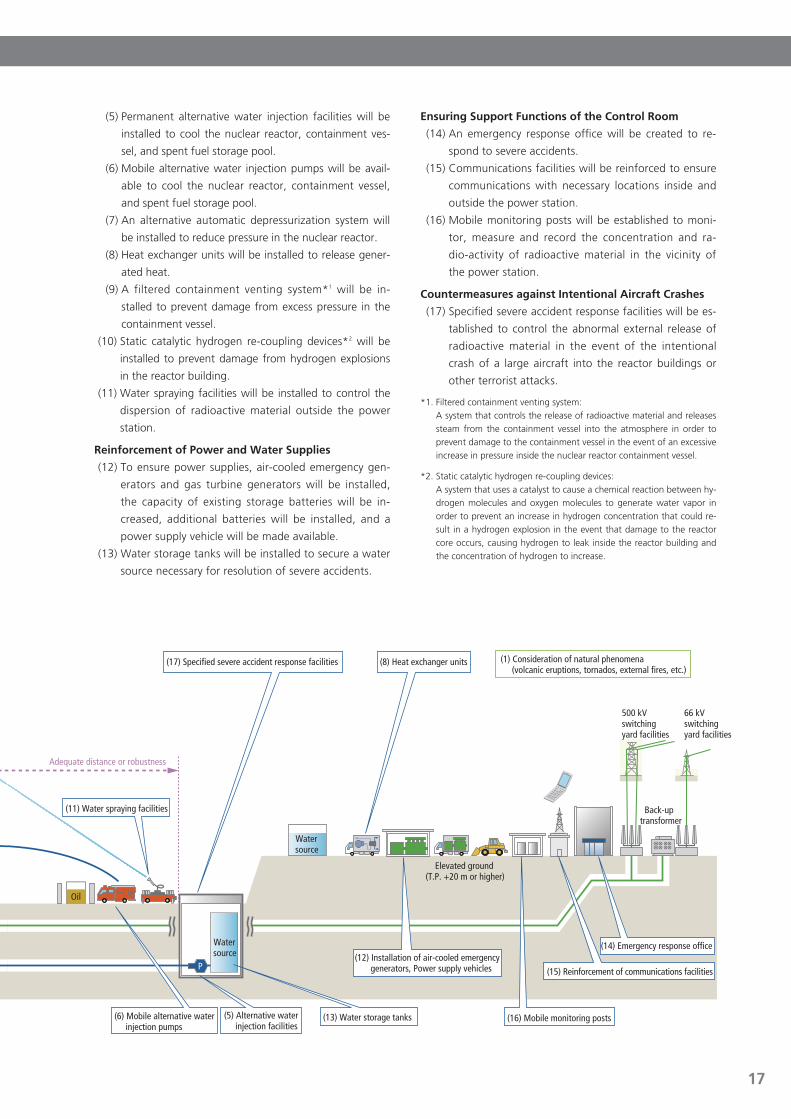
Measures to Reinforce safety for ohma nuclear Power Plant (overview)
(5) Permanent alternative water injection facilities will be
installed to cool the nuclear reactor, containment ves-
sel, and spent fuel storage pool.
(6) Mobile alternative water injection pumps will be avail-
able to cool the nuclear reactor, containment vessel,
and spent fuel storage pool.
(7) An alternative automatic depressurization system will
be installed to reduce pressure in the nuclear reactor.
(8) Heat exchanger units will be installed to release gener-
ated heat.
(9) A filtered containment venting system*1 will be in-
stalled to prevent damage from excess pressure in the
containment vessel.
(10) Static catalytic hydrogen re-coupling devices*2 will be
installed to prevent damage from hydrogen explosions
in the reactor building.
(11) Water spraying facilities will be installed to control the
dispersion of radioactive material outside the power
station.
Reinforcement of Power and Water supplies
(12) To ensure power supplies, air-cooled emergency gen-
erators and gas turbine generators will be installed,
the capacity of existing storage batteries will be in-
creased, additional batteries will be installed, and a
power supply vehicle will be made available.
(13) Water storage tanks will be installed to secure a water
source necessary for resolution of severe accidents.
ensuring support Functions of the Control Room
(14) An emergency response office will be created to re-
spond to severe accidents.
(15) Communications facilities will be reinforced to ensure
communications with necessary locations inside and
outside the power station.
(16) Mobile monitoring posts will be established to moni-
tor, measure and record the concentration and ra-
dio-activity of radioactive material in the vicinity of
the power station.
Countermeasures against Intentional Aircraft Crashes
(17) Specified severe accident response facilities will be es-
tablished to control the abnormal external release of
radioactive material in the event of the intentional
crash of a large aircraft into the reactor buildings or
other terrorist attacks.
*1. Filtered containment venting system:
A system that controls the release of radioactive material and releases
steam from the containment vessel into the atmosphere in order to
prevent damage to the containment vessel in the event of an excessive
increase in pressure inside the nuclear reactor containment vessel.
*2. Static catalytic hydrogen re-coupling devices:
A system that uses a catalyst to cause a chemical reaction between hy-
drogen molecules and oxygen molecules to generate water vapor in
order to prevent an increase in hydrogen concentration that could re-
sult in a hydrogen explosion in the event that damage to the reactor
core occurs, causing hydrogen to leak inside the reactor building and
the concentration of hydrogen to increase.
Ground level of compound (T.P. +12 m)
Highest seawater level of tsunami (T.P. +6.3 m)
Seawall height (T.P. +15 m)
Reactor building
Nuclearreactor
Containment vessel
Power panel Filtered vent
Storagebatteries
Transformer
* Independent measures
Turbine generator
Emergency diesel generator
Seawaterpump
Spent fuel storage pool
P P
Seawall*
Waterproofing modification of doors in exterior walls*
FirewallFire retardant cable
(3) Reinforcement of internal flooding resistance measures
Design basisAgainst severe accidents and terrorism
(4) Alternative control rod insertion mechanism
(12) Storage batteries
(10) Static catalytic hydrogen re-coupling devices
(2) Enhanced fire protection
(7) Alternative automatic depressurization system
(9) Filtered containment venting system
Image of Measures to Reinforce Safety at Ohma Nuclear Power Plant
T.P.: The average sea level in Tokyo Bay
Water source
Elevated ground (T.P. +20 m or higher)
66 kVswitching yard facilities
500 kVswitching yard facilities
Oil
Water source
P
Back-up transformer
(12) Installation of air-cooled emergency generators, Power supply vehicles
(6) Mobile alternative water injection pumps
(14) Emergency response office
(15) Reinforcement of communications facilities
(16) Mobile monitoring posts
(1) Consideration of natural phenomena (volcanic eruptions, tornados, external fires, etc.)
(8) Heat exchanger units(17) Specified severe accident response facilities
Adequate distance or robustness
(11) Water spraying facilities
(5) Alternative water injection facilities
(13) Water storage tanks
17
Electric Power Business
Business overview
Domestic electric Power Business (Hydroelectric Power)
overview of operations and salient Features
J-POWER boasts a track record in the building and operation of
hydroelectric power plants that extends back more than half a
century. Including the Sakuma Power Plant, which began opera-
tions in 1956 in a bid to solve postwar power shortages,
J-POWER has developed many large-scale conventional hydro-
electric power plants. Subsequently, from the 1970s onward, the
Company developed large-scale pumped storage hydroelectric
power plants, such as that at Shintoyone.
The salient features of hydroelectric power plants are that they
are capable of changing output extremely quickly to respond to
demand fluctuations and can cover peak demand in daily and
seasonal supply-demand balancing in Japan’s grid. Furthermore,
for resource-poor Japan, hydroelectric power represents a valu-
able, purely domestic energy resource and, as a CO2-free power
source, plays a central role in renewable energy.
In addition to continuing the efficient maintenance and man-
agement of existing hydroelectric power generation facilities,
J-POWER is carrying out comprehensive renewals of its main
power generating machinery to increase capacity and the power
generated through optimal designs utilizing the latest technolo-
gies. J-POWER is also undertaking the development of small- to
medium-scale hydroelectric power plants that utilize untapped
hydroelectric resources in order to effectively utilize this precious
resource to the maximum extent possible.
Major Hydroelectric Power Plants(As of April 1, 2017)
Power PlantsBeginning ofOperation
Location Capacity (kW) Type
Shimogo 1988 Fukushima Prefecture 1,000,000 Dam conduit type, pumped storage
Okutadami 1960 Fukushima Prefecture 560,000 Dam conduit type
Otori 1963 Fukushima Prefecture 182,000 Dam type
Tagokura 1959 Fukushima Prefecture 400,000 Dam type
Okukiyotsu 1978 Niigata Prefecture 1,000,000 Dam conduit type, pumped storage
Okukiyotsu No. 2 1996 Niigata Prefecture 600,000 Dam conduit type, pumped storage
Numappara 1973 Tochigi Prefecture 675,000 Dam conduit type, pumped storage
Shintoyone 1972 Aichi Prefecture 1,125,000 Dam conduit type, pumped storage
Sakuma 1956 Shizuoka Prefecture 350,000 Dam conduit type
Miboro 1961 Gifu Prefecture 215,000 Dam conduit type
Nagano 1968 Fukui Prefecture 220,000 Dam type, pumped storage
Tedorigawa No. 1 1979 Ishikawa Prefecture 250,000 Dam conduit type
Ikehara 1964 Nara Prefecture 350,000 Dam type, pumped storage
Sendaigawa No. 1 1965 Kagoshima Prefecture 120,000 Dam type
Note: Lists power plants with maximum output of 100,000 kW or more
Major Hydroelectric Power Plant Projects
Project NameYear Beginning Operation (Planned)
Location Capacity (kW)
Shinkatsurazawa/Kumaoi 2022 Hokkaido Prefecture 21,900
Akiba No. 1 (increased capacity by comprehensive renewal) 2018 Shizuoka Prefecture 45,300 R 47,200
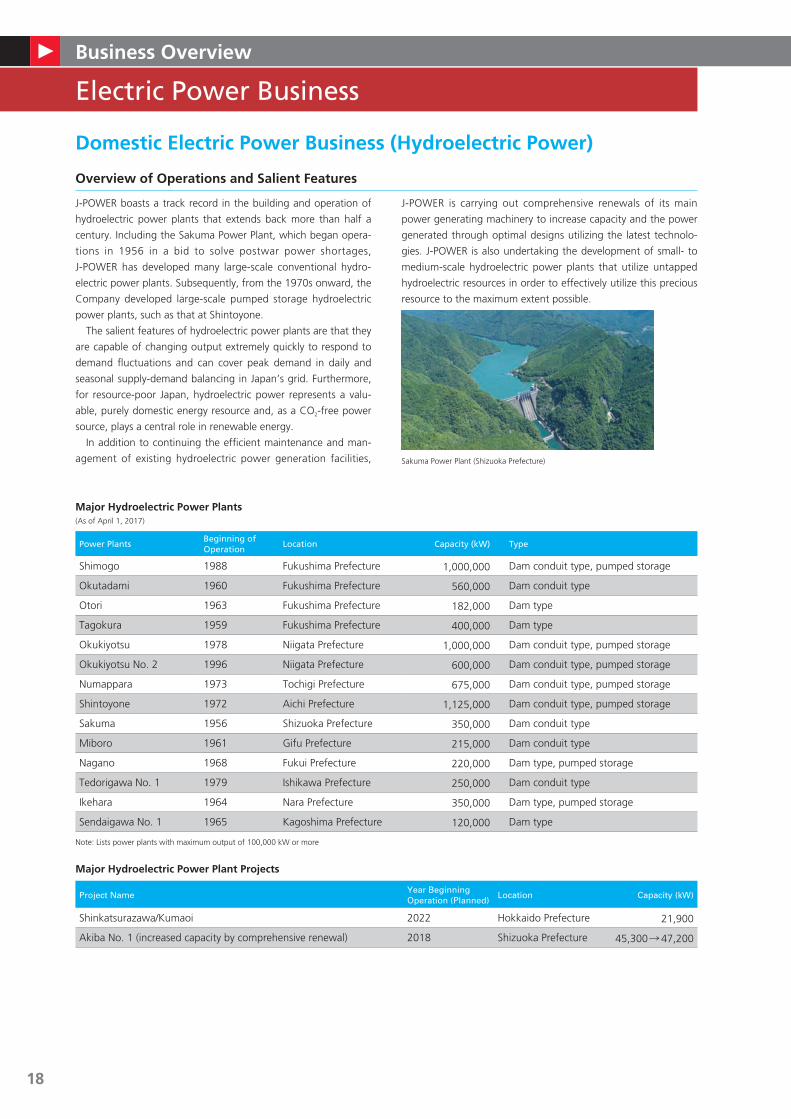
Sakuma Power Plant (Shizuoka Prefecture)
18

Business overview
Domestic electric Power Business (Wind Power)
Overview of Operations and Salient Features
J-POWER is a pioneer in the wind power generation business, hav-
ing commenced operations at its first wind farm in 2000. Since
then, the Company has steadily expanded this business and, as of
April 1, 2017, owns 22 wind farms (247 units) around the country,
with a total output capacity of 444 MW (owned capacity: 439
MW), making it the second-largest wind power producer in the
country. Drawing on its many years of experience, expertise, and
technologies in the building, operation, and maintenance of
power plants and transmission lines, the J-POWER Group has cre-
ated a system that covers the full gamut of the wind power busi-
ness, from surveys of wind conditions to wind farm design,
construction, and operation and maintenance (O&M).
Leveraging its diverse experience, J-POWER is making its O&M
systems more efficient while working to improve utilization rates
and enhance profitability. The feed-in tariff system took effect in
2012, and J-POWER has acquired facility accreditation under the
system for both new and existing wind power facilities.
new site Development
and offshore Wind Power Initiatives
J-POWER is working toward the development of new capacity.
The aim is for the Setana-Ohsato Wind Farm, Kuzumaki No. 2
Wind Farm, and Nikaho No. 2 Wind Farm to commence opera-
tion in fiscal 2019, and these are all currently under construction.
J-POWER will continuously seek locations that possess wind con-
ditions suitable for new facilities and steadily develop new proj-
ects in the years to come.
With regard to offshore wind power, a consortium that includes
the Company has been selected as preferred bidder following a
public tender for the installer and operator of the Hibikinada
Offshore Wind Farm off the coast of Kita-Kyushu in Fukuoka
Prefecture. In the years to come, we will be conducting surveys on
the wind conditions and marine areas toward the commercializa-
tion of offshore wind power generation in Hibikinada.
Yurihonjo Bayside Wind Farm (Akita Prefecture)
Wind Power Projects(As of April 1, 2017)
Wind Farms/Plants Operating Companies Location(Number of Wind
Turbines)
Capacity (kW)
OwnershipBeginning of Operation*1
Sarakitomanai Wind Farm J-Wind Co., Ltd. Hokkaido Prefecture (9) 14,850 100% 2001(2009)
Tomamae Winvilla Wind Farm J-Wind Co., Ltd. Hokkaido Prefecture (19) 30,600 100% 2000Shimamaki Wind Farm J-Wind Co., Ltd. Hokkaido Prefecture (6) 4,500 100% 2000
(2009)
Setana Seaside Wind Farm J-Wind Co., Ltd. Hokkaido Prefecture (6) 12,000 100% 2005Kaminokuni Wind Farm J-Wind Co., Ltd. Hokkaido Prefecture (12) 28,000 100% 2014Ohma Wind Farm J-Wind Co., Ltd. Aomori Prefecture (9) 19,500 100% 2016Green Power Kuzumaki Wind Farm J-Wind Co., Ltd. Iwate Prefecture (12) 21,000 100% 2003Yurihonjo Bayside Wind Farm Yurihonjo
Wind Power Co., Ltd.Akita Prefecture (7) 16,100 100% 2017
Nikaho Kogen Wind Farm J-Wind Co., Ltd. Akita Prefecture (15) 24,750 100% 2001Koriyama-Nunobiki Kogen Wind Farm
J-Wind Co., Ltd. Fukushima Prefecture (33) 65,980 100% 2007
Hiyama Kogen Wind Farm J-Wind Co., Ltd. Fukushima Prefecture (14) 28,000 100% 2011Tokyo Bayside Wind Power J-Wind Co., Ltd. Tokyo metropolitan area (2) 1,700 100% 2003Irouzaki Wind Farm J-Wind Co., Ltd. Shizuoka Prefecture (17) 34,000 100% 2010Tahara Bayside Wind Farm J-Wind Co., Ltd. Aichi Prefecture (11) 22,000 100% 2005Tahara Wind Farm J-Wind Co., Ltd. Aichi Prefecture (1) 1,980 100% 2004Awara-Kitagata Wind Farm J-Wind Co., Ltd. Fukui Prefecture (10) 20,000 100% 2011Yokihi no Sato Wind Park J-Wind Co., Ltd. Yamaguchi Prefecture (3) 4,500 100% 2003
(2009)
Minami Ehime Wind Farm J-Wind Co., Ltd. Ehime Prefecture (12) 28,500 100% 2015Nagasaki-Shikamachi Wind Farm Nagasaki-Shikamachi
Wind Power Co., Ltd.Nagasaki Prefecture (15) 15,000 70% 2005
Aso-Nishihara Wind Farm J-Wind Co., Ltd. Kumamoto Prefecture (10) 17,500 100% 2005Aso-Oguni Wind Farm J-Wind Co., Ltd. Kumamoto Prefecture (5) 8,500 100% 2007
(2009)
Minami Oosumi Wind Farm Minami Kyushu Wind Power Co., Ltd.
Kagoshima Prefecture (19) 24,700 99% 2003 (Nejime)(2009)2004 (Sata)(2009)
Domestic total (247) 443,660Zajaczkowo Wind Farm Zajaczkowo Windfarm
Sp. zo. o.Poland (24) 48,000 50% 2008
total including overseas (271) 491,660
*1 The year when J-POWER purchased its current holdings of shares from other companies. 19

Business overview
Domestic electric Power Business (thermal Power)
Overview of Operations and Salient Features
J-POWER’s thermal power operations center on coal-fired ther-
mal power generation. J-POWER’s first coal-fired thermal power
plant commenced operations in 1963, in line with Japan’s policy
at the time of using domestically produced coal. Following the
oil shocks of the 1970s, the Company responded to government
plans to diversify the mix of power sources, which had been cen-
tered on oil-fired thermal power generation. In 1981, J-POWER
began operations at the Matsushima Thermal Power Plant, the
first in Japan fueled with imported coal. J-POWER went on to
develop a series of large-scale coal-fired thermal power plants—
such as those at Matsuura and Tachibanawan—that run on
imported coal, increasing the scale of its business. The Company
has continued to work to improve power generation efficiency
by enhancing steam conditions and scaling up plants in its
efforts to improve competitiveness and decrease environmental
impact. Providing an economical and stable baseload source of
electricity, J-POWER’s coal-fired thermal power plants maintain
high load factors.
Coal-Fired thermal Power Plants(As of April 1, 2017)
Power Plants Beginning of Operation Location Capacity (kW)
Isogo New No. 1New No. 2
2002 2009
Kanagawa Prefecture 600,000562,000*2
Takasago No. 1No. 2
1968 1969
Hyogo Prefecture 250,000250,000
Takehara No. 1No. 2No. 3
1967 1974*1 1983
Hiroshima Prefecture 250,000350,000700,000
Tachibanawan No. 1No. 2
2000 2000
Tokushima Prefecture 1,050,0001,050,000
Matsushima No. 1No. 2
1981 1981
Nagasaki Prefecture 500,000500,000
Matsuura No. 1No. 2
1990 1997
Nagasaki Prefecture 1,000,0001,000,000
Ishikawa Coal No. 1No. 2
1986 1987
Okinawa Prefecture 156,000156,000
total 8,374,000
*1 Converted from heavy oil-fueled boiler to coal-fueled fluidized boiler in 1995*2 Due to an equipment failure, the operating output of Isogo New No. 2 was reduced from 600 MW to 562 MW, but was restored to 600 MW in June 2017.
other J-PoWeR thermal Power Plants(As of April 1, 2017)
Plant Name Operating Companies Location Capacity (kW) Fuel Type OwnershipBeginning of Operation
Bayside Energy Ichihara Bay Side Energy Co., Ltd.
Chiba Prefecture 107,650 Gas*1 100% 2005
Mihama Seaside Power Shinminato
Mihama Seaside Power Co., Ltd.
Chiba Prefecture 104,770 Gas*1 100% 2005
Itoigawa ITOIGAWA POWER Inc. Niigata Prefecture 149,000 Coal 64%TAIHEIYO CEMENT
CORPORATION*2
2001(2003)*3
Tosa TOSA POWER Inc.*4 Kochi Prefecture 167,000 Coal 45%Shikoku Electric Power
Co., Inc.*2 TAIHEIYO CEMENT
CORPORATION*2
2005
Genex Mizue GENEX Co., Ltd.*4 Kanagawa Prefecture 238,000 Gas Oil Residue
40%TOA Oil Co., Ltd.*2
2003
subtotal 766,420
*1 Generation method: combined cycle *2 Partners *3 Date of investment participation by J-POWER *4 Equity-method affiliates
Tachibanawan Thermal Power Plant
20
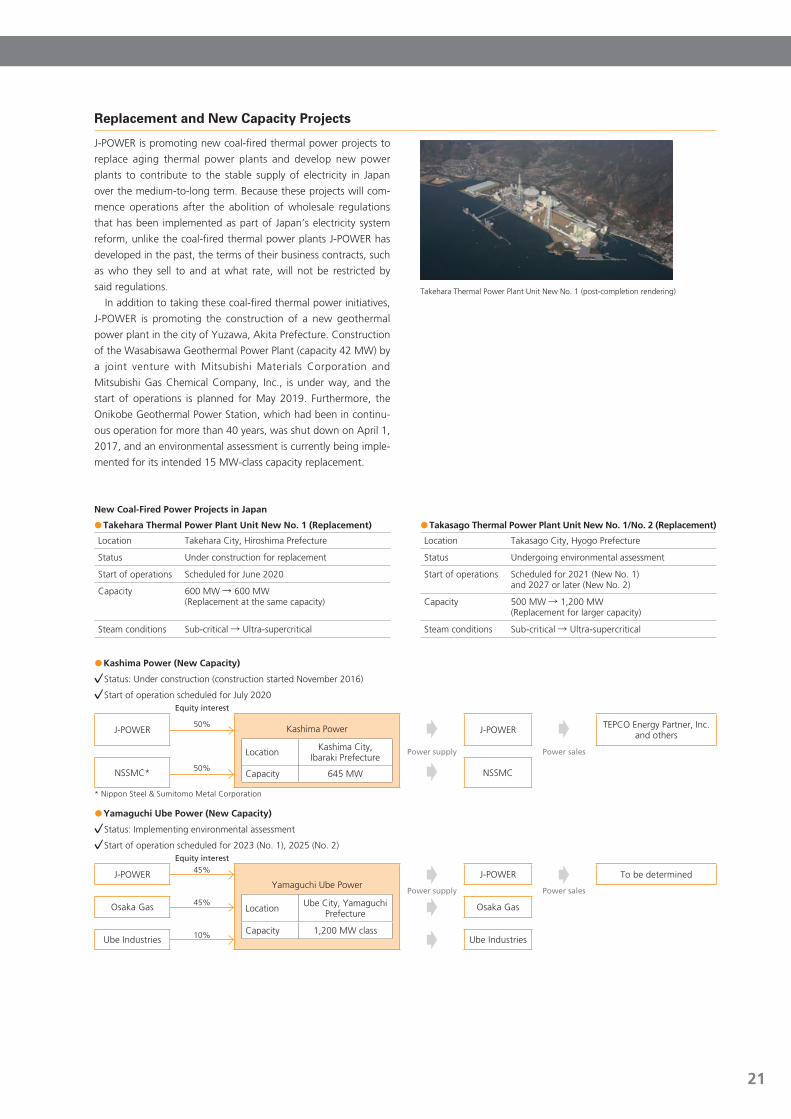
Business overview
Replacement and New Capacity Projects
J-POWER is promoting new coal-fired thermal power projects to
replace aging thermal power plants and develop new power
plants to contribute to the stable supply of electricity in Japan
over the medium-to-long term. Because these projects will com-
mence operations after the abolition of wholesale regulations
that has been implemented as part of Japan’s electricity system
reform, unlike the coal-fired thermal power plants J-POWER has
developed in the past, the terms of their business contracts, such
as who they sell to and at what rate, will not be restricted by
said regulations.
In addition to taking these coal-fired thermal power initiatives,
J-POWER is promoting the construction of a new geothermal
power plant in the city of Yuzawa, Akita Prefecture. Construction
of the Wasabisawa Geothermal Power Plant (capacity 42 MW) by
a joint venture with Mitsubishi Materials Corporation and
Mitsubishi Gas Chemical Company, Inc., is under way, and the
start of operations is planned for May 2019. Furthermore, the
Onikobe Geothermal Power Station, which had been in continu-
ous operation for more than 40 years, was shut down on April 1,
2017, and an environmental assessment is currently being imple-
mented for its intended 15 MW-class capacity replacement.
new Coal-Fired Power Projects in Japan
P takehara thermal Power Plant Unit new no. 1 (Replacement) P takasago thermal Power Plant Unit new no. 1/no. 2 (Replacement)
Location Takehara City, Hiroshima Prefecture Location Takasago City, Hyogo Prefecture
Status Under construction for replacement Status Undergoing environmental assessment
Start of operations Scheduled for June 2020 Start of operations Scheduled for 2021 (New No. 1) and 2027 or later (New No. 2)
Capacity 600 MW R 600 MW (Replacement at the same capacity) Capacity 500 MW R 1,200 MW
(Replacement for larger capacity)
Steam conditions Sub-critical R Ultra-supercritical Steam conditions Sub-critical R Ultra-supercritical
P Kashima Power (new Capacity)
Status: Under construction (construction started November 2016)
Start of operation scheduled for July 2020Equity interest
J-POWER50% Kashima Power
LocationKashima City,
Ibaraki Prefecture
Capacity 645 MW
J-POWERTEPCO Energy Partner, Inc.
and others
Power supply Power sales
NSSMC* 50% NSSMC
* Nippon Steel & Sumitomo Metal Corporation
P Yamaguchi Ube Power (new Capacity)
Status: Implementing environmental assessment
Start of operation scheduled for 2023 (No. 1), 2025 (No. 2)Equity interest
J-POWER 45%
Yamaguchi Ube Power
LocationUbe City, Yamaguchi
Prefecture
Capacity 1,200 MW class
J-POWER To be determined
Power supply Power sales
Osaka Gas 45% Osaka Gas
Ube Industries 10% Ube Industries
Takehara Thermal Power Plant Unit New No. 1 (post-completion rendering)
21

Business overview
Domestic electric Power Business (transmission/transformation)
Overview of Operations and Salient Features
As a wholesale supplier of electric power supplying electricity
nationwide, J-POWER owns and operates approximately 2,400
km of transmission lines and nine substations and converter sta-
tions throughout Japan. In addition to transmitting electric
power generated by its own power plants to demand areas,
J-POWER supports parts of the grids of electric power companies
by connecting the grid of each company, fulfilling a major role in
the nationwide operation of Japan’s overall power grid.
In particular, we operate critical facilities that support wide area
power interchange in Japan, such as interconnecting lines (Kitahon
HVDC Link, Honshi Interconnecting Line, Anan-Kihoku HVDC Link,
and Kanmon Interconnecting Line) connecting Honshu with
Hokkaido, Shikoku, and Kyushu as well as the Sakuma Frequency
Converter Station, which connects the different frequencies of
eastern Japan (50 Hz) and western Japan (60 Hz). J-POWER’s trans-
mission/transformation facilities contributed to alleviating the tight
regional electricity supply-demand balances that followed the Great
East Japan Earthquake. The Company will maintain facilities reliabil-
ity and focus efforts on ensuring stable operations.
J-POWER also maintains a communications network through-
out Japan that is used for facility protection, monitoring, and
control as well as operational management to contribute to the
operation of the power plants and the power grid.
Furthermore, in June 2016, the Organization for Cross-
regional Coordination of Transmission Operators published its
Cross-Regional Network Development Plan, which includes plans
for increasing the capacity of the Sakuma Frequency Converter
Station. J-POWER has been chosen to implement this plan.
Accordingly, in line with government policy requirements and the
purpose of the plan—to ensure the stable supply of electric
power—the Company is advancing detailed examinations in
preparation for construction.
Major transmission Lines(As of April 1, 2017)
Major Transmission Lines Beginning of Operation Location Distance Voltage
Tokachi Trunk Line 1956 Hokkaido Prefecture 214.4 km 187 kV
Kitahon HVDC Link 1979 Hokkaido Prefecture − Aomori Prefecture 167.4 km DC±250 kV
Tadami Trunk Line 1959 Fukushima Prefecture − Tokyo metropolitan area 216.2 km 275kV-500 kV
Sakuma East Trunk Line 1956 Shizuoka Prefecture − Tokyo metropolitan area 197.2 km 275 kV
Sakuma West Trunk Line 1956 Shizuoka Prefecture − Aichi Prefecture 107.7 km 275 kV
Miboro Trunk Line 1960 Gifu Prefecture − Aichi Prefecture 108.6 km 275 kV
Honshi Interconnecting Line 1994 Kagawa Prefecture − Okayama Prefecture 127.0 km 500 kV
Anan-Kihoku HVDC Link 2000 Tokushima Prefecture – Wakayama Prefecture 99.8 km DC±250 kV
Nahari Trunk Line 1960 Kochi Prefecture − Ehime Prefecture 120.0 km 187 kV
Kanmon Interconnecting Line 1980 Fukuoka Prefecture – Yamaguchi Prefecture 64.2 km 500 kV
substations(As of April 1, 2017)
Substations Beginning of Operation Location Output
Isawa 2012 Iwate Prefecture 9,000 kVA
Minami Kawagoe 1959 Saitama Prefecture 1,542,000 kVA
Nishi Tokyo 1956 Tokyo metropolitan area 1,350,000 kVA
Nagoya 1956 Aichi Prefecture 1,400,000 kVA
Frequency Converter station(As of April 1, 2017)
Frequency Converter Station Beginning of Operation Location Output
Sakuma 1965 Shizuoka Prefecture 300,000 kW
AC/DC Converter stations(As of April 1, 2017)
AC/DC Converter Stations Beginning of Operation Location Output
Hakodate 1979 Hokkaido Prefecture 600,000 kW
Kamikita 1979 Aomori Prefecture 600,000 kW
Kihoku 2000 Wakayama Prefecture 1,400,000 kW
Anan 2000 Tokushima Prefecture 1,400,000 kW
Sakuma Frequency Converter Station
22

Electric Power-Related Business
Business overview
Overview of Operations and Salient Features
J-POWER operates electric power-related businesses that support
the smooth and efficient implementation of its electric power
business. Specifically, these businesses are required for the opera-
tion of power generation, transmission, and transformation facili-
ties and include businesses undertaking the design, construction,
inspection, and maintenance of those facilities; importing coal;
and transporting coal using the Company’s vessels. J-POWER con-
ducts the maintenance of the power-generation facilities of its
domestic wholesale electric power business in close partnership
with its subsidiaries.
Coal Procurement
J-POWER procures fuel coal primarily from Australia and
Indonesia. In Australia, the Company owns interests in three
coal-mining projects through subsidiaries.
The global supply and demand of coal can vary greatly due to
demand from developing countries, including China and India,
trends related to energy resources other than coal, such as lique-
fied natural gas (LNG), and other geopolitical factors. In view of
this situation, J-POWER has an upstream presence with respect
to the ownership of coal mines and securing diversified procure-
ment sources to stably procure coal as fuel for thermal power
generation over the long term.
Coal Mining Projects(As of April 1, 2017)
Mine Name Location Loading Port Production Volume 2016*1 Investment Ratio*2
Beginning of Commercial
Production
Clermont Queensland Dalrymple Bay 12.66 million t 15% 2010
Narrabri New South Wales Newcastle 7.79 million t 7.5% 2010
Maules Creek New South Wales Newcastle 8.03 million t (Approx. 10.7 million t/yr)
10% 2014
*1 The production volume in parentheses represents figures for anticipated peak production.*2 Investment through a subsidiary, J-POWER AUSTRALIA PTY. LTD.
Queensland
Dalrymple BayClermont Coal Mine
Narrabri Coal Mine
Maules Creek Coal Mine
NewcastleNew South Wales
23
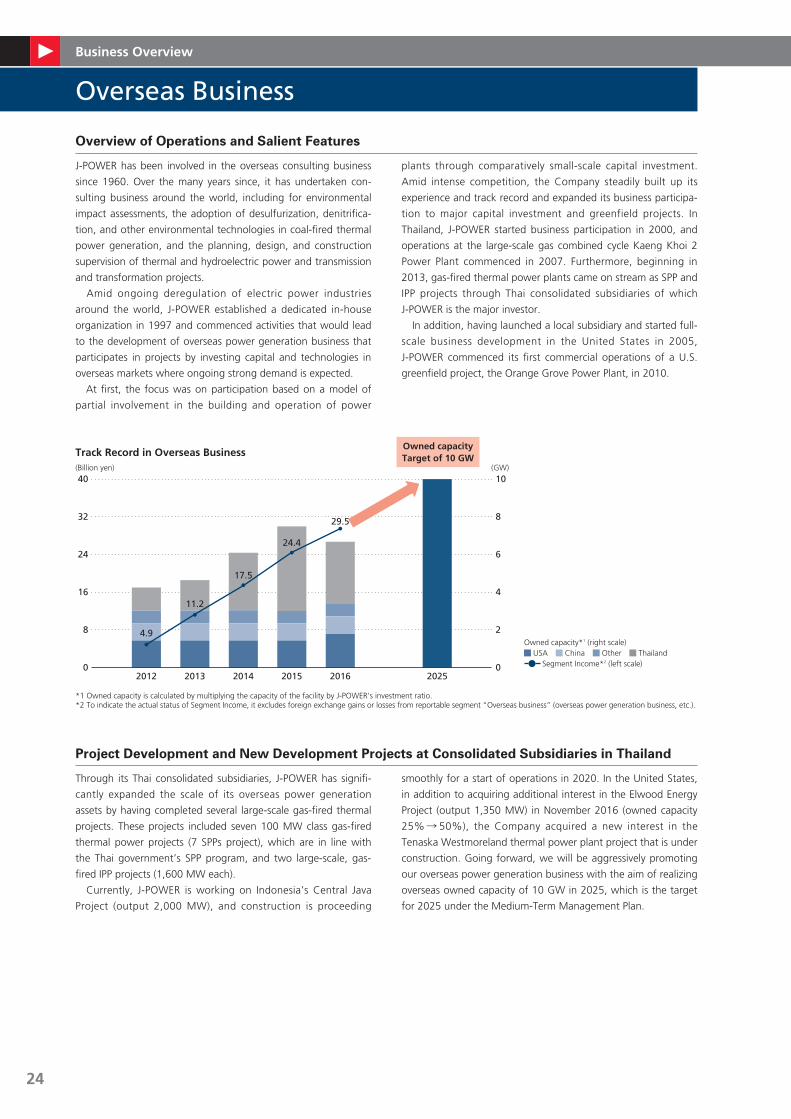
Overseas Business
Business overview
Overview of Operations and Salient Features
J-POWER has been involved in the overseas consulting business
since 1960. Over the many years since, it has undertaken con-
sulting business around the world, including for environmental
impact assessments, the adoption of desulfurization, denitrifica-
tion, and other environmental technologies in coal-fired thermal
power generation, and the planning, design, and construction
supervision of thermal and hydroelectric power and transmission
and transformation projects.
Amid ongoing deregulation of electric power industries
around the world, J-POWER established a dedicated in-house
organization in 1997 and commenced activities that would lead
to the development of overseas power generation business that
participates in projects by investing capital and technologies in
overseas markets where ongoing strong demand is expected.
At first, the focus was on participation based on a model of
partial involvement in the building and operation of power
plants through comparatively small-scale capital investment.
Amid intense competition, the Company steadily built up its
experience and track record and expanded its business participa-
tion to major capital investment and greenfield projects. In
Thailand, J-POWER started business participation in 2000, and
operations at the large-scale gas combined cycle Kaeng Khoi 2
Power Plant commenced in 2007. Furthermore, beginning in
2013, gas-fired thermal power plants came on stream as SPP and
IPP projects through Thai consolidated subsidiaries of which
J-POWER is the major investor.
In addition, having launched a local subsidiary and started full-
scale business development in the United States in 2005,
J-POWER commenced its first commercial operations of a U.S.
greenfield project, the Orange Grove Power Plant, in 2010.
Project Development and New Development Projects at Consolidated Subsidiaries in Thailand
Through its Thai consolidated subsidiaries, J-POWER has signifi-
cantly expanded the scale of its overseas power generation
assets by having completed several large-scale gas-fired thermal
projects. These projects included seven 100 MW class gas-fired
thermal power projects (7 SPPs project), which are in line with
the Thai government’s SPP program, and two large-scale, gas-
fired IPP projects (1,600 MW each).
Currently, J-POWER is working on Indonesia’s Central Java
Project (output 2,000 MW), and construction is proceeding
smoothly for a start of operations in 2020. In the United States,
in addition to acquiring additional interest in the Elwood Energy
Project (output 1,350 MW) in November 2016 (owned capacity
25% R 50%), the Company acquired a new interest in the
Tenaska Westmoreland thermal power plant project that is under
construction. Going forward, we will be aggressively promoting
our overseas power generation business with the aim of realizing
overseas owned capacity of 10 GW in 2025, which is the target
for 2025 under the Medium-Term Management Plan.
track Record in overseas Business(Billion yen) (GW)
16
8
32
24
0
40
6
4
2
8
0
10
202520162015201420132012
29.5
24.4
17.5
11.2
4.9Owned capacity*1 (right scale)
USA China Other Thailand Segment Income*2 (left scale)
*1 Owned capacity is calculated by multiplying the capacity of the facility by J-POWER’s investment ratio.*2 To indicate the actual status of Segment Income, it excludes foreign exchange gains or losses from reportable segment “Overseas business” (overseas power generation business, etc.).
owned capacity target of 10 GW
24

Business overview
overviews of Project Development at Consolidated subsidiaries in thailand
OverviewProject Name
7 SPPs*1
Capacity:
Type:
Start of operation:
Total 790 MW
(110 MW × 5)
(120 MW × 2)
CCGT*3
2013
Capacity:
Type:
Start of operation:
Total 1,600 MW
(800 MW x 2 units)
CCGT*3
2014
Capacity:
Type:
Start of operation:
Total 1,600 MW
(800 MW x 2 units)
CCGT*3
2015
Nong Saeng IPP
U-Thai IPP
60%
Operating Companies
PTT EGAT
100%
PPAsGas Supply Agreement
40%Gulf JP Co., Ltd.
J-POWER Local Partner
Ownership ratio after
a transfer of equity to
the local partner in
August 2016
Scheme Diagram
• Seven 100 MW class cogeneration gas-fired thermal power plants based on the Thai government’s SPP program*1
• The projects will sell electricity to the Electricity Generating Authority of Thailand (EGAT) and nearby customers for 25 years (they will also supply steam and cold water to nearby customers).
• After a transfer of equity of Gulf JP Co., Ltd. to the local partner in August 2016, J-POWER holds a 60% stake in six plants and a 45% stake*2 in one plant.
• Sale of electricity to EGAT for 25 years from the commencement of operations.
Current status of new Projects
Central Java (Indonesia)
Capacity: 2,000 MW (1,000 MW x 2)
Type: Coal (USC)
Ownership: 34%
Status: Under construction
Start of operation No. 1: Jun. 2020 No. 2: Dec. 2020
Westmoreland (USA)
Capacity: 926 MW
Type: CCGT*3
Ownership: 25%
Status: Under construction
Start of operation: 2018
*1 SPP (Small Power Producers) program: The long-term power purchase scheme established by the Thai government. This scheme promotes cogeneration systems, renewable energy, and similar methods, and aims at reducing the import and use of fuel oil. EGAT guarantees the purchase of electricity generated from eligible suppliers up to 90 MW of capacity.
*2 As for the NLL project of the 7 SPPs project, a part of its stake was sold to an operating company of its industrial park on January 2013.*3 CCGT: Combined Cycle Gas Turbine
Minnesota
Wisconsin
Iowa
Illinois Indiana Ohio
New York
Pennsylvania
West Virginia
Michigan
Westmoreland Power Plant
Java, Indonesia
Jakarta Batang, Central Java Province
25
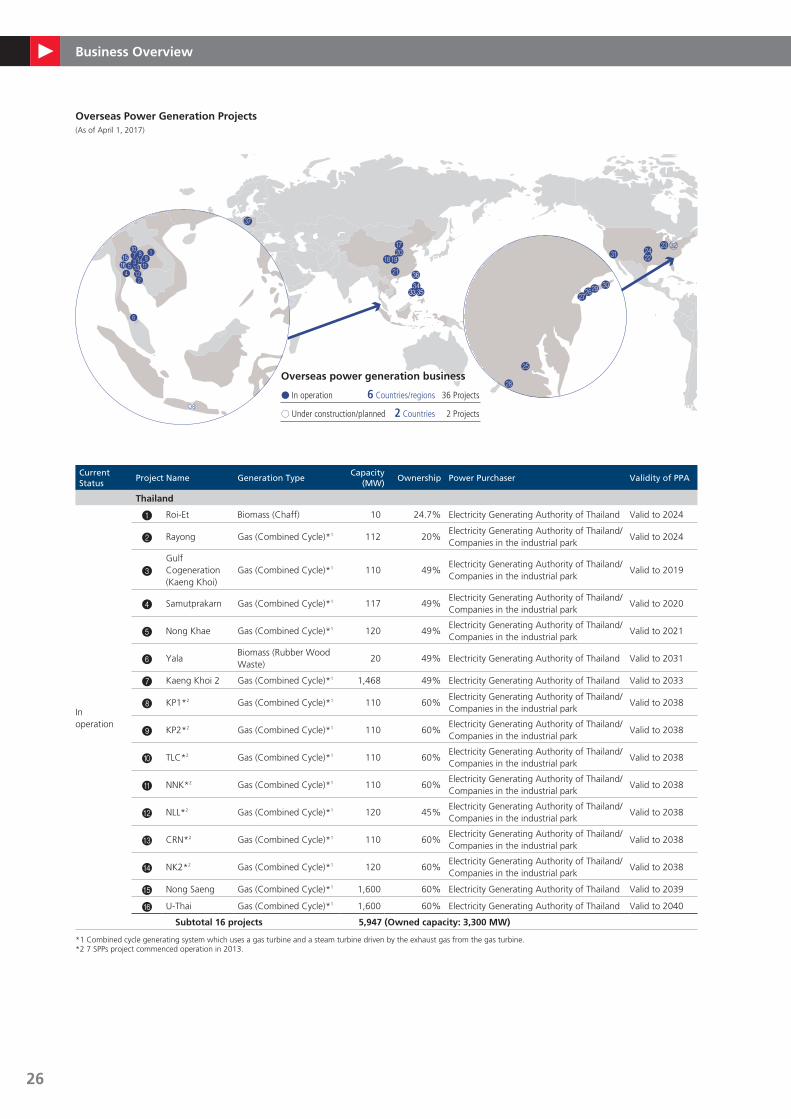
Business overview
Current Status
Project Name Generation TypeCapacity
(MW)Ownership Power Purchaser Validity of PPA
thailand
In operation
1 Roi-Et Biomass (Chaff) 10 24.7% Electricity Generating Authority of Thailand Valid to 2024
2 Rayong Gas (Combined Cycle)*1 112 20%Electricity Generating Authority of Thailand/Companies in the industrial park
Valid to 2024
3Gulf Cogeneration (Kaeng Khoi)
Gas (Combined Cycle)*1 110 49%Electricity Generating Authority of Thailand/Companies in the industrial park
Valid to 2019
4 Samutprakarn Gas (Combined Cycle)*1 117 49%Electricity Generating Authority of Thailand/ Companies in the industrial park
Valid to 2020
5 Nong Khae Gas (Combined Cycle)*1 120 49%Electricity Generating Authority of Thailand/Companies in the industrial park
Valid to 2021
6 YalaBiomass (Rubber Wood Waste)
20 49% Electricity Generating Authority of Thailand Valid to 2031
7 Kaeng Khoi 2 Gas (Combined Cycle)*1 1,468 49% Electricity Generating Authority of Thailand Valid to 2033
8 KP1*2 Gas (Combined Cycle)*1 110 60%Electricity Generating Authority of Thailand/Companies in the industrial park
Valid to 2038
9 KP2*2 Gas (Combined Cycle)*1 110 60%Electricity Generating Authority of Thailand/ Companies in the industrial park
Valid to 2038
0 TLC*2 Gas (Combined Cycle)*1 110 60%Electricity Generating Authority of Thailand/Companies in the industrial park
Valid to 2038
A NNK*2 Gas (Combined Cycle)*1 110 60%Electricity Generating Authority of Thailand/ Companies in the industrial park
Valid to 2038
B NLL*2 Gas (Combined Cycle)*1 120 45%Electricity Generating Authority of Thailand/Companies in the industrial park
Valid to 2038
C CRN*2 Gas (Combined Cycle)*1 110 60%Electricity Generating Authority of Thailand/Companies in the industrial park
Valid to 2038
D NK2*2 Gas (Combined Cycle)*1 120 60%Electricity Generating Authority of Thailand/Companies in the industrial park
Valid to 2038
E Nong Saeng Gas (Combined Cycle)*1 1,600 60% Electricity Generating Authority of Thailand Valid to 2039
F U-Thai Gas (Combined Cycle)*1 1,600 60% Electricity Generating Authority of Thailand Valid to 2040
subtotal 16 projects 5,947 (owned capacity: 3,300 MW)
*1 Combined cycle generating system which uses a gas turbine and a steam turbine driven by the exhaust gas from the gas turbine.*2 7 SPPs project commenced operation in 2013.
GJ
IH
K
1
2
3
45
6
[
789;
AC
EF
\
Z
Q
O
R
T
MNLU
SP
Overseas power generation business
In operation 6 Countries/regions 36 Projects
Under construction/planned 2 Countries 2 Projects
YXW
D
B
V
overseas Power Generation Projects(As of April 1, 2017)
26

Business overview
Green Country (USA)Nong Saeng (Thailand)
Current Status
Project Name Generation TypeCapacity
(MW)Ownership Power Purchaser Validity of PPA
China
In operation
G TianshiLow-Grade Coal Coal Waste
50 24% Shanxi Province Power CorporationRenewed every year*4
H–IHanjiang (Xihe/Shuhe)
Hydroelectric 450 27% Shaanxi Electric Power CompanyRenewed every year*4
J Gemeng*3 Mainly Coal 6,392 7% Shanxi Province Power Corporation —
K Hezhou Coal 2,090 17% Guangxi Power Grid Co.Renewed every year*4
subtotal 5 projects 8,958 (owned capacity: 936 MW)
UsA
In operation
L Tenaska Frontier Gas (Combined Cycle)*1 830 31% Exelon Generation Company, LLC Valid to 2020
M Elwood Energy Gas (Simple Cycle) 1,350 50% Constellation/PJM marketPartially valid to 2017
N Green Country Gas (Combined Cycle)*1 795 50% Exelon Generation Company, LLC Valid to 2022
O Birchwood Coal 242 50% Virginia Electric and Power Company Valid to 2021
P Pinelawn Gas (Combined Cycle)*1 80 50% Long Island Power Authority Valid to 2025
Q Equus Gas (Simple Cycle) 48 50% Long Island Power Authority Valid to 2017
R Fluvanna Gas (Combined Cycle)*1 885 15% Shell Energy North America Valid to 2024
S Edgewood Gas (Simple Cycle) 88 50% Long Island Power Authority Valid to 2018
T Shoreham Jet Fuel (Simple Cycle) 90 50% Long Island Power Authority Valid to 2017
U Orange Grove Gas (Simple Cycle) 96 50% San Diego Gas & Electric Valid to 2035
subtotal 10 projects 4,504 (owned capacity: 1,785 MW)
Under construction
V Westmoreland Gas (Combined Cycle)*1 926 25% PJM market
other Countries/Region
In operation
W–YCBK (Philippines) (3 projects)
Hydroelectric 728 50% National Power Corporation Valid to 2026
ZChiahui (Taiwan)
Gas (Combined Cycle)*1 670 40% Taiwan Power Company Valid to 2028
[Zajaczkowo (Poland)
Wind Power 48 50% ENERGA OBROT S.A. Valid to 2023
subtotal 5 projects 1,446 (owned capacity: 656 MW)
Under construction
\Central Java (Indonesia)
Coal 2,000 34% PT PLN 25 years
*3 Gemeng International Energy Co., Ltd., is an electric power company that owns 14 power generation companies.*4 Although power purchase agreements are renewed every year, J-POWER makes other agreements with power purchasers for continuous power purchase during operations.
27
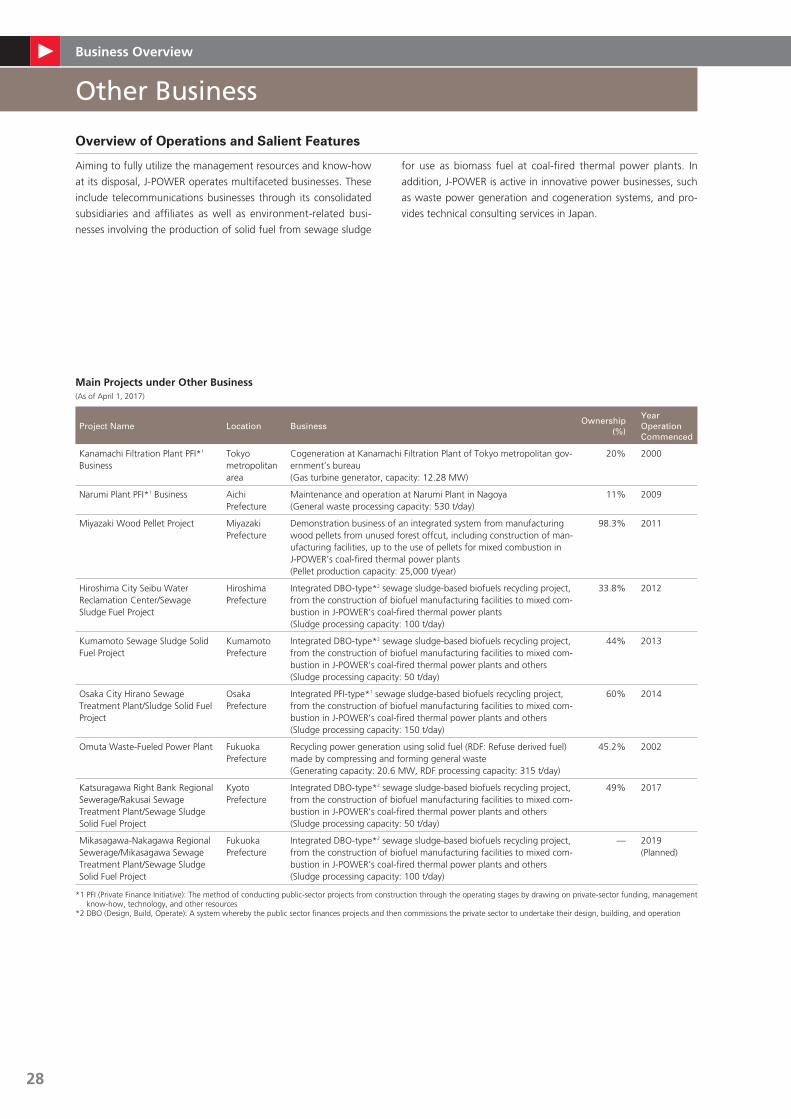
Other Business
Business overview
Overview of Operations and Salient Features
Aiming to fully utilize the management resources and know-how
at its disposal, J-POWER operates multifaceted businesses. These
include telecommunications businesses through its consolidated
subsidiaries and affiliates as well as environment-related busi-
nesses involving the production of solid fuel from sewage sludge
for use as biomass fuel at coal-fired thermal power plants. In
addition, J-POWER is active in innovative power businesses, such
as waste power generation and cogeneration systems, and pro-
vides technical consulting services in Japan.
Main Projects under other Business(As of April 1, 2017)
Project Name Location BusinessOwnership
(%)
Year Operation Commenced
Kanamachi Filtration Plant PFI*1 Business
Tokyo metropolitan area
Cogeneration at Kanamachi Filtration Plant of Tokyo metropolitan gov-ernment’s bureau(Gas turbine generator, capacity: 12.28 MW)
20% 2000
Narumi Plant PFI*1 Business Aichi Prefecture
Maintenance and operation at Narumi Plant in Nagoya(General waste processing capacity: 530 t/day)
11% 2009
Miyazaki Wood Pellet Project Miyazaki Prefecture
Demonstration business of an integrated system from manufacturing wood pellets from unused forest offcut, including construction of man-ufacturing facilities, up to the use of pellets for mixed combustion in J-POWER’s coal-fired thermal power plants(Pellet production capacity: 25,000 t/year)
98.3% 2011
Hiroshima City Seibu Water Reclamation Center/Sewage Sludge Fuel Project
Hiroshima Prefecture
Integrated DBO-type*2 sewage sludge-based biofuels recycling project, from the construction of biofuel manufacturing facilities to mixed com-bustion in J-POWER’s coal-fired thermal power plants(Sludge processing capacity: 100 t/day)
33.8% 2012
Kumamoto Sewage Sludge Solid Fuel Project
Kumamoto Prefecture
Integrated DBO-type*2 sewage sludge-based biofuels recycling project, from the construction of biofuel manufacturing facilities to mixed com-bustion in J-POWER’s coal-fired thermal power plants and others(Sludge processing capacity: 50 t/day)
44% 2013
Osaka City Hirano Sewage Treatment Plant/Sludge Solid Fuel Project
Osaka Prefecture
Integrated PFI-type*1 sewage sludge-based biofuels recycling project, from the construction of biofuel manufacturing facilities to mixed com-bustion in J-POWER’s coal-fired thermal power plants and others(Sludge processing capacity: 150 t/day)
60% 2014
Omuta Waste-Fueled Power Plant Fukuoka Prefecture
Recycling power generation using solid fuel (RDF: Refuse derived fuel) made by compressing and forming general waste (Generating capacity: 20.6 MW, RDF processing capacity: 315 t/day)
45.2% 2002
Katsuragawa Right Bank Regional Sewerage/Rakusai Sewage Treatment Plant/Sewage Sludge Solid Fuel Project
Kyoto Prefecture
Integrated DBO-type*2 sewage sludge-based biofuels recycling project, from the construction of biofuel manufacturing facilities to mixed com-bustion in J-POWER’s coal-fired thermal power plants and others(Sludge processing capacity: 50 t/day)
49% 2017
Mikasagawa-Nakagawa Regional Sewerage/Mikasagawa Sewage Treatment Plant/Sewage Sludge Solid Fuel Project
Fukuoka Prefecture
Integrated DBO-type*2 sewage sludge-based biofuels recycling project, from the construction of biofuel manufacturing facilities to mixed com-bustion in J-POWER’s coal-fired thermal power plants and others (Sludge processing capacity: 100 t/day)
— 2019 (Planned)
*1 PFI (Private Finance Initiative): The method of conducting public-sector projects from construction through the operating stages by drawing on private-sector funding, management know-how, technology, and other resources
*2 DBO (Design, Build, Operate): A system whereby the public sector finances projects and then commissions the private sector to undertake their design, building, and operation
28
Business Overview
E (Environment) S (Social)
G (Governance)
E (Environment)30 Environmental Initiatives
36 Initiatives toward Carbon Reduction
40 Initiatives toward Environmental Preservation
41 Preservation of Natural Environment
42 Environmental Data
S (Social)46 Respect for Human Resources
49 Health and Safety Management
51 Contribution to Society
G (Governance)52 Corporate Governance
57 Compliance & Risk Management
60 Emergency Management
29

environmental Initiatives
Based on our Corporate Philosophy—“We will meet people’s needs for energy without fail, and play our part for the
sustainable development of Japan and the rest of the world”—the J-POWER Group engages in the conduct of busi-
ness that aims for the coexistence of energy and the environment.
Specifically, under our Corporate Conduct Rules and the J-POWER Group Environmental Management Vision, we
regard contribution to the reduction of CO2 emissions on a global scale and the preservation of the local environment
as an important issue to be addressed.
In the J-POWER Group Medium-Term Management Plan, which looks ahead to 2025, we also recognize that initia-
tives to further reduce carbon emissions are necessary in our responses to the risks to be overcome. The development
of technologies to further reduce carbon emissions in coal-fired thermal power generation and the expansion of
renewable energy compose specific activities under the initiatives.
In line with these policies, the J-POWER Group is promoting specific initiatives toward addressing global environ-
mental issues, including those concerning climate change, and initiatives directed at coexistence with the local envi-
ronment.
J-PoWeR Group environmental Management Vision
The J-POWER Group has established a J-POWER Group
Environmental Management Vision. Comprising a J-POWER
Group Environmental Management Vision Basic Policy and
Action Programs, the latter are made up of Corporate Targets
and Segment Targets as well as the J-POWER Group
Environmental Action Guidelines that are formulated each year.
These are deliberated on at the Environmental Management
Promotion Board (and deliberated on by the Executive
Committee* as required), and decided on by the President.
* Executive Committee: Please refer to page 53.
J-PoWeR Group environmental Management Vision
J-PoWeR Group environmental Management Vision Basic Policy
Action Programs
Corporate targets
Targets addressed by the entire Group
which establish medium-term issues
to be addressed, targets, and the means
segment targets
Targets established and addressed
by each relevant department and subsidiaries
J-PoWeR Group
environmental Action Guidelines
Issues to be addressed for fiscal year
30
EEnvironmentEEnvironment

environmental Initiatives
environmental Management Promotion structures
An Executive Vice President serves as the person responsible for
environmental management promotion who is in charge of pro-
moting environmental management. In addition to establishing
the Environmental Management Promotion Board to promote
environmental management, we have established the J-POWER
Group Environmental Management Promotion Conference to
promote group-wide environmental management.
J-PoWeR Group environmental Management Vision Basic Policy (Revised on July 1, 2011)
the J-PoWeR Group adheres to the following Basic Policy.
Basic stance
As an energy supplier, we will contribute to the sustainable
development of Japan and the rest of the world by harmoniz-
ing our operations with the environment and ensuring the
constant supply of energy essential to human life and eco-
nomic activity.
As an energy supplier, the J-POWER Group will strive to bring
together its expertise and its technologies in the utilization of
a wide variety of energy sources, including fossil fuels, nucle-
ar power, and renewable energies, to ensure the efficient and
uninterrupted supply of the electric power essential to human
life and economic activity.
We will contribute to the sustainable development of Japan
and the rest of the world by constantly making efforts to
minimize the environmental impact of our business activities,
reducing environmental risks such as global warming, and
improving eco-efficiency by achieving higher productivity with
lower environmental load, thus promoting greater environ-
mental consideration while enhancing economic value.
efforts Relating to Global environmental Issues
Directing our most-intensive efforts towards a stable energy
supply, we will also steadily advance initiatives towards lower
carbon emissions both domestically and internationally, and
will contribute to the reduction of CO2 emissions on a global
scale.
To that end, we will work from mid- and long-term per-
spectives with technologies as our central focus to realize a
stable energy supply and reduction in CO2 emissions domesti-
cally and internationally through measures including “Carbon
reduction in coal-fired thermal power generation,” “Research
and development of next-generation low-carbon technolo-
gies,” and “Expanding CO2-free power generation facilities.”
Our ultimate aim will be the achievement of zero emissions
by means of measures including CO2 capture and storage.
efforts Relating to Local environmental Issues
We will seek to operate in harmony with the local environ-
ments by adopting measures to reduce the environmental
impact of our operations while working to save, recycle, and
reuse resources in order to limit the amount of waste.
ensuring transparency and Reliability
We will ensure that our business activities comply with all
laws and regulations, disclose a wide range of environmental
information, and enhance communication with stakeholders.
31

environmental Initiatives
Corporate targets and Fiscal 2016 Performance
The Action Programs for the J-POWER Group Environmental Management Vision define Corporate Targets, which are mid-term targets
to be addressed by the Group as a whole. As shown below, all of the items included in the Corporate Targets for fiscal 2016 were
achieved.
We will continue to work toward the achievement of our targets in fiscal 2017.
Item Target Main Performance for Fiscal 2016
effo
rts
Rel
atin
g t
o G
lob
al e
nvi
ron
men
tal I
ssu
es
Reducing CO2 emissions from power generation and promoting technological development
Work to provide a stable supply of energy and reduce CO2 emissions in Japan and over-seas by promoting the following measures looking toward 2020, in addition to con-tinuing to contribute to the Environmental Action Plan by the Japanese Electric Utility Industry as one of the electric utility companies.
• Work to replace aging coal-fired thermal power plants with the world’s highest-level high-efficiency coal-fired thermal power plants.
• We made progress with construction work at the Takehara Thermal Power Plant Replacement Project. We also continued the implementation of various kinds of environmental impact research for the Takasago Thermal Power Plant Replacement Project.
• Promote mixed combustion of biomass fuels in coal-fired thermal power plants (Effective exploitation of untapped resources).
• At the Matsuura Thermal Power Plant, Takehara Thermal Power Plant, and Takasago Thermal Power Plant, we implemented mixed combustion in a suitable manner for each fuel type.
• Contribute to the reduction of global CO2 emissions and the transfer of our technolo-gies by expanding coal-fired thermal power generation business especially in Asia, using J-POWER’s advanced, high-efficiency power generation technologies.
• In Indonesia, we advanced construction work on the Central Java Project.
• Promote the development of high-efficiency oxygen-blown integrated coal gasifica-tion combined cycle (IGCC) technology aiming for practical application through the Osaki CoolGen Project. In addition, promote research and development on CO2 cap-ture and storage (CCS) technology utilizing the results from trial operations under the EAGLE Project and the Callide Oxyfuel Combustion Project in Australia.
• At the Osaki CoolGen Project, we started demonstration tests of oxygen-blown IGCC (Phase 1). We implemented ongoing efforts toward oxygen-blown IGCC with CO2 separation and capture (Phase 2).
• In relation to the Ohma Nuclear Power Project, respond appropriately to the review of compliance with the new safety standards, an application for which was submitted in December 2014. Based on serious consideration of the accident at the Fukushima Daiichi Nuclear Power Station, do our utmost to ensure the construction of a safe and trusted nuclear power plant, taking voluntary safety measures and obtaining the understanding of the local community where the plant site is located.
• For the Ohma Nuclear Power Plant Project, we carried out studies for safety enhancement measures and responded to the review of compliance with the new safety standards. Accordingly, we also implemented initiatives to gain the understanding and trust of local residents.
• Work to expand the use of hydroelectric power through newly installing, expanding, upgrading, and replacing hydroelectric power plants.
• With regard to the expansion of hydroelectric power, the Konokitani Hydroelectric Power Plant commenced operations. We increased the capacity and started the operations of the Akiba No. 2 Hydroelectric Power Plant after the comprehensive renewal of its major facilities.
• Work to significantly expand domestic wind power facilities and advance research and development toward the realization of offshore wind power generation technologies.
• As for onshore wind power, the Minami Ehime Wind Farm (expansion), Ohma Wind Farm, and Yurihonjo Bayside Wind Farm began operations, and construction work on the Setana-Ohsato Wind Farm was started. With offshore wind power, demonstration tests off Kitakyushu (joint research with NEDO) were completed at the end of fiscal 2016. We plan to continue the tests as our own research from fiscal 2017 onwards. The consortium including the Company that had responded to the public tender, con-ducted by Kitakyushu City, seeking applications for the “installer/operator of the Hibikinada Offshore Wind Power Generation Facility,” was selected as a preferred bidder.
• Work to develop new geothermal power projects in Japan. • As development of a new geothermal power project in Japan, we made progress with construction work on the Wasabizawa Geothermal Power Plant.
Item Target Fiscal 2015 Performance Fiscal 2016 Performance Fiscal 2016 Evaluation
• Total thermal efficiency for thermal power (HHV, gross efficiency)
Maintain current level [about 40%]
40.4% (Reference: LHV* = 41.5%)
40.3%ê (Reference: LHV* = 41.4%)
• The J-POWER Group met its target for total thermal efficiency for thermal power thanks to efforts to maintain high- efficiency operations in existing thermal power plants and to adopt high-efficiency technologies at facilities renewal.
• Reduction of SF6 emissions; increase recovery rate during inspection and retirement of equipment
Inspection: at least 97% Retirement: at least 99%
Inspection: 99.3% Retirement: 99.4%
Inspection: 99.5% Retirement: 99.3%
ê• The target was met, with a recovery rate of 99.5% during inspections and 99.3% at retirement, thanks to efforts to
curb emissions during equipment inspection through sound recovery and reuse.
effo
rts
Rel
atin
g t
o
Loca
l en
viro
nm
enta
l Iss
ues
• Reduce SOx emissions per unit of electric power generated by thermal power
Maintain current level [about 0.2 g/kWh]
0.18 g/kWh 0.18 g/kWh ê• Efforts including fuel management and the appropriate operations of flue gas desulfurization systems saw us curb our
SOx emissions and achieve our target for emissions per unit of electric power generated.
• Reduce NOx emissions per unit of electric power generated by thermal power
Maintain current level [about 0.5 g/kWh]
0.50 g/kWh 0.50 g/kWh ê• Efforts including fuel management and the appropriate operations of flue gas denitrification systems saw us curb our
NOx emissions and achieve our target for emissions per unit of electric power generated.
• Increase recycling rate for industrial wasteMaintain current level
[about 97%]98.5% 98.5%ê
• We achieved our targets through efforts to promote the recycling of coal ash and to reduce industrial waste generated by the maintenance and operation of power plants.
• Preservation of aquatic environmentsConsider protection of river and
ocean environments in business activitiesPractices of consideration for protection
of river and ocean environments
Practices of consideration for protection of river
and ocean environments
• In operating power generation facilities that are involved with rivers, we implemented measures for the protection of the river environment. These include the implementation of sedimentation disposal measures and measures to miti-gate long-term persistence of turbidity according to the conditions at each location.
• In operating power generation facilities that adjoin the ocean, we implemented precise control over the effluent in compliance with environmental protection agreements and other such arrangements.
• Preservation of biodiversityConsider the protection of biodiversity
in business activitiesPractices of consideration for biodiversity
Practices of consideration for biodiversity
• We showed consideration for the protection of ecosystems and the diversity of species in conducting our business activities and worked to protect rare animal and plant species and their habitats.
ensu
rin
g
tran
spar
ency
an
d
Rel
iab
ility
• Improvement of environmental management level
Continual improvement of EMS Consistent implementation of PDCA cycleConsistent implementation
of PDCA cycle• We implemented the PDCA cycle consistently and worked to raise the level of environmental management.
* LHV (lower heating value) is estimated from actual HHV (higher heating value) using conversion coefficients supplied in the Agency of Natural Resources and Energy’s Comprehensive Energy Statistics (Fiscal 2004 edition)
The ê marks denote data that are the subjects of third-party assurance. (Please refer to page 45.)
32
EEnvironment

environmental Initiatives
Item Target Main Performance for Fiscal 2016
effo
rts
Rel
atin
g t
o G
lob
al e
nvi
ron
men
tal I
ssu
es
Reducing CO2 emissions from power generation and promoting technological development
Work to provide a stable supply of energy and reduce CO2 emissions in Japan and over-seas by promoting the following measures looking toward 2020, in addition to con-tinuing to contribute to the Environmental Action Plan by the Japanese Electric Utility Industry as one of the electric utility companies.
• Work to replace aging coal-fired thermal power plants with the world’s highest-level high-efficiency coal-fired thermal power plants.
• We made progress with construction work at the Takehara Thermal Power Plant Replacement Project. We also continued the implementation of various kinds of environmental impact research for the Takasago Thermal Power Plant Replacement Project.
• Promote mixed combustion of biomass fuels in coal-fired thermal power plants (Effective exploitation of untapped resources).
• At the Matsuura Thermal Power Plant, Takehara Thermal Power Plant, and Takasago Thermal Power Plant, we implemented mixed combustion in a suitable manner for each fuel type.
• Contribute to the reduction of global CO2 emissions and the transfer of our technolo-gies by expanding coal-fired thermal power generation business especially in Asia, using J-POWER’s advanced, high-efficiency power generation technologies.
• In Indonesia, we advanced construction work on the Central Java Project.
• Promote the development of high-efficiency oxygen-blown integrated coal gasifica-tion combined cycle (IGCC) technology aiming for practical application through the Osaki CoolGen Project. In addition, promote research and development on CO2 cap-ture and storage (CCS) technology utilizing the results from trial operations under the EAGLE Project and the Callide Oxyfuel Combustion Project in Australia.
• At the Osaki CoolGen Project, we started demonstration tests of oxygen-blown IGCC (Phase 1). We implemented ongoing efforts toward oxygen-blown IGCC with CO2 separation and capture (Phase 2).
• In relation to the Ohma Nuclear Power Project, respond appropriately to the review of compliance with the new safety standards, an application for which was submitted in December 2014. Based on serious consideration of the accident at the Fukushima Daiichi Nuclear Power Station, do our utmost to ensure the construction of a safe and trusted nuclear power plant, taking voluntary safety measures and obtaining the understanding of the local community where the plant site is located.
• For the Ohma Nuclear Power Plant Project, we carried out studies for safety enhancement measures and responded to the review of compliance with the new safety standards. Accordingly, we also implemented initiatives to gain the understanding and trust of local residents.
• Work to expand the use of hydroelectric power through newly installing, expanding, upgrading, and replacing hydroelectric power plants.
• With regard to the expansion of hydroelectric power, the Konokitani Hydroelectric Power Plant commenced operations. We increased the capacity and started the operations of the Akiba No. 2 Hydroelectric Power Plant after the comprehensive renewal of its major facilities.
• Work to significantly expand domestic wind power facilities and advance research and development toward the realization of offshore wind power generation technologies.
• As for onshore wind power, the Minami Ehime Wind Farm (expansion), Ohma Wind Farm, and Yurihonjo Bayside Wind Farm began operations, and construction work on the Setana-Ohsato Wind Farm was started. With offshore wind power, demonstration tests off Kitakyushu (joint research with NEDO) were completed at the end of fiscal 2016. We plan to continue the tests as our own research from fiscal 2017 onwards. The consortium including the Company that had responded to the public tender, con-ducted by Kitakyushu City, seeking applications for the “installer/operator of the Hibikinada Offshore Wind Power Generation Facility,” was selected as a preferred bidder.
• Work to develop new geothermal power projects in Japan. • As development of a new geothermal power project in Japan, we made progress with construction work on the Wasabizawa Geothermal Power Plant.
Item Target Fiscal 2015 Performance Fiscal 2016 Performance Fiscal 2016 Evaluation
• Total thermal efficiency for thermal power (HHV, gross efficiency)
Maintain current level [about 40%]
40.4% (Reference: LHV* = 41.5%)
40.3%ê (Reference: LHV* = 41.4%)
• The J-POWER Group met its target for total thermal efficiency for thermal power thanks to efforts to maintain high- efficiency operations in existing thermal power plants and to adopt high-efficiency technologies at facilities renewal.
• Reduction of SF6 emissions; increase recovery rate during inspection and retirement of equipment
Inspection: at least 97% Retirement: at least 99%
Inspection: 99.3% Retirement: 99.4%
Inspection: 99.5% Retirement: 99.3%
ê• The target was met, with a recovery rate of 99.5% during inspections and 99.3% at retirement, thanks to efforts to
curb emissions during equipment inspection through sound recovery and reuse.
effo
rts
Rel
atin
g t
o
Loca
l en
viro
nm
enta
l Iss
ues
• Reduce SOx emissions per unit of electric power generated by thermal power
Maintain current level [about 0.2 g/kWh]
0.18 g/kWh 0.18 g/kWh ê• Efforts including fuel management and the appropriate operations of flue gas desulfurization systems saw us curb our
SOx emissions and achieve our target for emissions per unit of electric power generated.
• Reduce NOx emissions per unit of electric power generated by thermal power
Maintain current level [about 0.5 g/kWh]
0.50 g/kWh 0.50 g/kWh ê• Efforts including fuel management and the appropriate operations of flue gas denitrification systems saw us curb our
NOx emissions and achieve our target for emissions per unit of electric power generated.
• Increase recycling rate for industrial wasteMaintain current level
[about 97%]98.5% 98.5%ê
• We achieved our targets through efforts to promote the recycling of coal ash and to reduce industrial waste generated by the maintenance and operation of power plants.
• Preservation of aquatic environmentsConsider protection of river and
ocean environments in business activitiesPractices of consideration for protection
of river and ocean environments
Practices of consideration for protection of river
and ocean environments
• In operating power generation facilities that are involved with rivers, we implemented measures for the protection of the river environment. These include the implementation of sedimentation disposal measures and measures to miti-gate long-term persistence of turbidity according to the conditions at each location.
• In operating power generation facilities that adjoin the ocean, we implemented precise control over the effluent in compliance with environmental protection agreements and other such arrangements.
• Preservation of biodiversityConsider the protection of biodiversity
in business activitiesPractices of consideration for biodiversity
Practices of consideration for biodiversity
• We showed consideration for the protection of ecosystems and the diversity of species in conducting our business activities and worked to protect rare animal and plant species and their habitats.
ensu
rin
g
tran
spar
ency
an
d
Rel
iab
ility
• Improvement of environmental management level
Continual improvement of EMS Consistent implementation of PDCA cycleConsistent implementation
of PDCA cycle• We implemented the PDCA cycle consistently and worked to raise the level of environmental management.
* LHV (lower heating value) is estimated from actual HHV (higher heating value) using conversion coefficients supplied in the Agency of Natural Resources and Energy’s Comprehensive Energy Statistics (Fiscal 2004 edition)
33
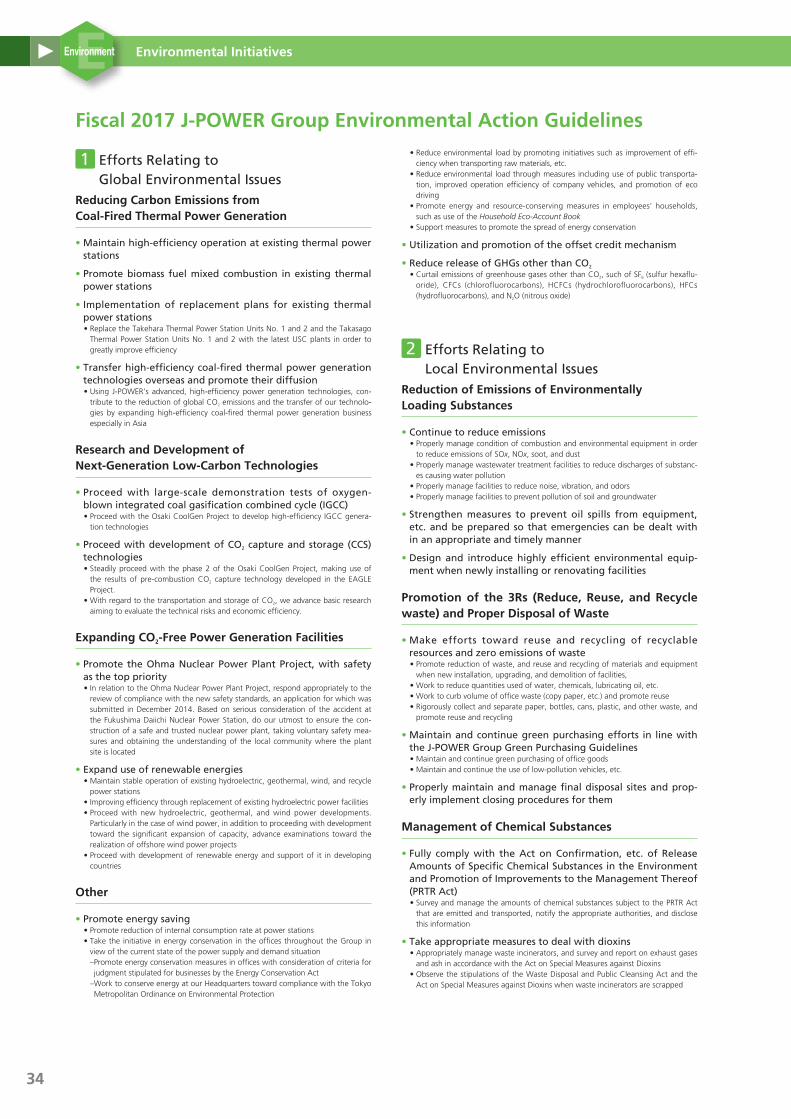
environmental Initiatives
Fiscal 2017 J-PoWeR Group environmental Action Guidelines
1 Efforts Relating to Global Environmental Issues
Reducing Carbon emissions from Coal-Fired thermal Power Generation
• Maintain high-efficiency operation at existing thermal power stations
• Promote biomass fuel mixed combustion in existing thermal power stations
• Implementation of replacement plans for existing thermal power stations• Replace the Takehara Thermal Power Station Units No. 1 and 2 and the Takasago
Thermal Power Station Units No. 1 and 2 with the latest USC plants in order to greatly improve efficiency
• Transfer high-efficiency coal-fired thermal power generation technologies overseas and promote their diffusion• Using J-POWER’s advanced, high-efficiency power generation technologies, con-
tribute to the reduction of global CO2 emissions and the transfer of our technolo-gies by expanding high-efficiency coal-fired thermal power generation business especially in Asia
Research and Development of next-Generation Low-Carbon technologies
• Proceed with large-scale demonstration tests of oxygen- blown integrated coal gasification combined cycle (IGCC)• Proceed with the Osaki CoolGen Project to develop high-efficiency IGCC genera-
tion technologies
• Proceed with development of CO2 capture and storage (CCS) technologies• Steadily proceed with the phase 2 of the Osaki CoolGen Project, making use of
the results of pre-combustion CO2 capture technology developed in the EAGLE Project.
• With regard to the transportation and storage of CO2, we advance basic research aiming to evaluate the technical risks and economic efficiency.
expanding Co2-Free Power Generation Facilities
• Promote the Ohma Nuclear Power Plant Project, with safety as the top priority• In relation to the Ohma Nuclear Power Plant Project, respond appropriately to the
review of compliance with the new safety standards, an application for which was submitted in December 2014. Based on serious consideration of the accident at the Fukushima Daiichi Nuclear Power Station, do our utmost to ensure the con-struction of a safe and trusted nuclear power plant, taking voluntary safety mea-sures and obtaining the understanding of the local community where the plant site is located
• Expand use of renewable energies• Maintain stable operation of existing hydroelectric, geothermal, wind, and recycle
power stations• Improving efficiency through replacement of existing hydroelectric power facilities• Proceed with new hydroelectric, geothermal, and wind power developments.
Particularly in the case of wind power, in addition to proceeding with development toward the significant expansion of capacity, advance examinations toward the realization of offshore wind power projects
• Proceed with development of renewable energy and support of it in developing countries
other
• Promote energy saving• Promote reduction of internal consumption rate at power stations• Take the initiative in energy conservation in the offices throughout the Group in
view of the current state of the power supply and demand situation – Promote energy conservation measures in offices with consideration of criteria for judgment stipulated for businesses by the Energy Conservation Act
– Work to conserve energy at our Headquarters toward compliance with the Tokyo Metropolitan Ordinance on Environmental Protection
• Reduce environmental load by promoting initiatives such as improvement of effi-ciency when transporting raw materials, etc.
• Reduce environmental load through measures including use of public transporta-tion, improved operation efficiency of company vehicles, and promotion of eco driving
• Promote energy and resource-conserving measures in employees’ households, such as use of the Household Eco-Account Book
• Support measures to promote the spread of energy conservation
• Utilization and promotion of the offset credit mechanism
• Reduce release of GHGs other than CO2
• Curtail emissions of greenhouse gases other than CO2, such of SF6 (sulfur hexaflu-oride), CFCs (chlorofluorocarbons), HCFCs (hydrochlorofluorocarbons), HFCs (hydrofluorocarbons), and N2O (nitrous oxide)
2 Efforts Relating to Local Environmental Issues
Reduction of emissions of environmentally Loading substances
• Continue to reduce emissions• Properly manage condition of combustion and environmental equipment in order
to reduce emissions of SOx, NOx, soot, and dust• Properly manage wastewater treatment facilities to reduce discharges of substanc-
es causing water pollution• Properly manage facilities to reduce noise, vibration, and odors• Properly manage facilities to prevent pollution of soil and groundwater
• Strengthen measures to prevent oil spills from equipment, etc. and be prepared so that emergencies can be dealt with in an appropriate and timely manner
• Design and introduce highly efficient environmental equip-ment when newly installing or renovating facilities
Promotion of the 3Rs (Reduce, Reuse, and Recycle waste) and Proper Disposal of Waste
• Make efforts toward reuse and recycling of recyclable resources and zero emissions of waste• Promote reduction of waste, and reuse and recycling of materials and equipment
when new installation, upgrading, and demolition of facilities,• Work to reduce quantities used of water, chemicals, lubricating oil, etc.• Work to curb volume of office waste (copy paper, etc.) and promote reuse• Rigorously collect and separate paper, bottles, cans, plastic, and other waste, and
promote reuse and recycling
• Maintain and continue green purchasing efforts in line with the J-POWER Group Green Purchasing Guidelines• Maintain and continue green purchasing of office goods• Maintain and continue the use of low-pollution vehicles, etc.
• Properly maintain and manage final disposal sites and prop-erly implement closing procedures for them
Management of Chemical substances
• Fully comply with the Act on Confirmation, etc. of Release Amounts of Specific Chemical Substances in the Environment and Promotion of Improvements to the Management Thereof (PRTR Act)• Survey and manage the amounts of chemical substances subject to the PRTR Act
that are emitted and transported, notify the appropriate authorities, and disclose this information
• Take appropriate measures to deal with dioxins• Appropriately manage waste incinerators, and survey and report on exhaust gases
and ash in accordance with the Act on Special Measures against Dioxins• Observe the stipulations of the Waste Disposal and Public Cleansing Act and the
Act on Special Measures against Dioxins when waste incinerators are scrapped
34
EEnvironment

environmental Initiatives
• Management and treatment of PCB waste and products con-taining PCBs• Appropriately store and manage them based on the stipulations of the Waste
Disposal and Public Cleansing Act, the Act on Special Measures concerning Promotion of Proper Treatment of PCB Wastes, the Electricity Business Act, and the Fire Service Act
• Progressively treat PCB waste and products containing PCBs in accordance with the J-POWER Group’s Basic Policy for the Treatment of PCBs
• Strive to reduce volumes of toxic chemicals handled
• Respond appropriately to asbestos-related issues• Adopt appropriate measures to manage asbestos including prevention of disper-
sion and systematically removing asbestos and replacing it with alternative sub-stances based on the J-POWER Group’s Basic Policy concerning Asbestos
Measures to Protect the natural environment
• Take the natural environment into account in the various stages of business• Recognizing that the blessings of the natural environment support a rich and
secure lifestyle, conduct surveys, estimates, and assessments as necessary of the impact of business activities on the natural environment, and work to protect the natural environment at each stage of the business process, including the planning, design, construction, and operation of power stations
• Consideration for aquatic environments• In operating power generation facilities that are involved with rivers, we will
steadily promote measures for the protection of the river environment. These include the implementation of sedimentation control measures and measures to mitigate long-term persistence of turbidity under way according to the conditions at each location.
• In operating power generation facilities that adjoin the ocean, we will implement precise control over the effluent in compliance with environmental protection agreements and other such arrangements.
• Showing consideration for biodiversity• We will show consideration for the protection of ecosystems and the diversity of
species in conducting our business activities, and we will strive to protect rare ani-mal and plant species and their habitats.
• Implement forest protection initiatives• Institute appropriate protections for company-owned forests based on the
J-POWER Group Forest Protection Guidelines• Promote the use of unexploited offcuts in forests
environmental Conservation Initiatives in overseas Projects
• Promote overseas transfer of environmental protection tech-nologies• Promote transfer of environmental protection technologies for thermal and hydro-
electric power generation
• Incorporate environmentally friendly initiatives when formu-lating development plans and considering investment in proj-ects, and ensure that those initiatives are carried out
Implementation of Accurate environmental Impact Assessments
• Conduct surveys, estimates, and assessments of environmental impact of business activities in accordance with the applicable laws and regulations, reflect the results in the details of business activities, and thus consider environmental protection
3 Ensuring Transparency and Reliability
1. Continual Improvement of environmental Management (Greater Reliability)
Improvement of environmental Management Level
• Continue to improve operation of the environmental man-agement system (EMS) at each J-POWER Group company• Assess the actual status of environmental load and set targets and formulate plans
for the protection of the environment• Systematically conduct internal environmental audits and periodically evaluate and
improve details of environmental activities in order to meet targets• Take measures to enhance check functions with the aim of maintaining and
improving internal environmental audits• Make improvements through activities concerning ISO 14001, in the case of certi-
fied business sites
• Raise employee awareness of environmental issues• Systematically conduct education and training programs regarding environmental
laws and regulations applicable to business activities• Promote environmental education using e-learning, etc.
• Request business partners including contractors for coopera-tion in environmentally friendly business operations
• Strengthen risk management• Work to implement measures to prevent environmentally harmful incidents and ensure
essential communication and appropriate responses in an emergency
Full Compliance with Laws, Regulations, Agreements, and other Rules
• Identify applicable laws, regulations, agreements, and other rules, and make them recognized and complied with in busi-ness operations• Accurately identify laws and regulations, agreements, etc. applicable to business
activities, and work to make them appropriately responded, well recognized, and applied, while verifying the compliance
• Fully comply with environment-related laws, regulations, agreements, and other rules• Make precise improvements to equipment and operations in order to prevent pol-
lution of the surrounding environment• Conduct risk diagnoses in relation to waste and education programs for employ-
ees engaged in waste disposal in order to ensure appropriate disposal of waste. In addition, promote application of the J-POWER Group Guidelines for Deciding Industrial Waste Disposal Contractors and the expansion of use of electronic mani-fests
2. Communication with society (Greater transparency)
Disclosure of environmental Information
• Formulate environmental reports• In disclosing environmental information by the environmental report, we refer to
guidelines such as the “Environmental Reporting Guidelines” of the Ministry of the Environment and carry out reporting in consideration of social demands.
• With regard to the content of the environmental report, we work to increase reli-ability and transparency by means such as reviews by third parties.
Increased engagement in environmental Communication
• Carry out environmental communication• Conduct publicity programs via website, internal Group publications, etc.• Conduct publicity programs targeting visitors to offices, PR centers, etc.• Communicate with experts and other third parties• Receive external assessments such as environmental ratings• Conduct environment-related social contribution activities such as providing sup-
port for environmental education
• Carry out regional environmental protection activities• Independently implement regional environmental protection activities• Participate in cleanup events, beautification activities, tree planting events, and similar
activities organized by cities, towns and villages, neighborhoods, etc.
35
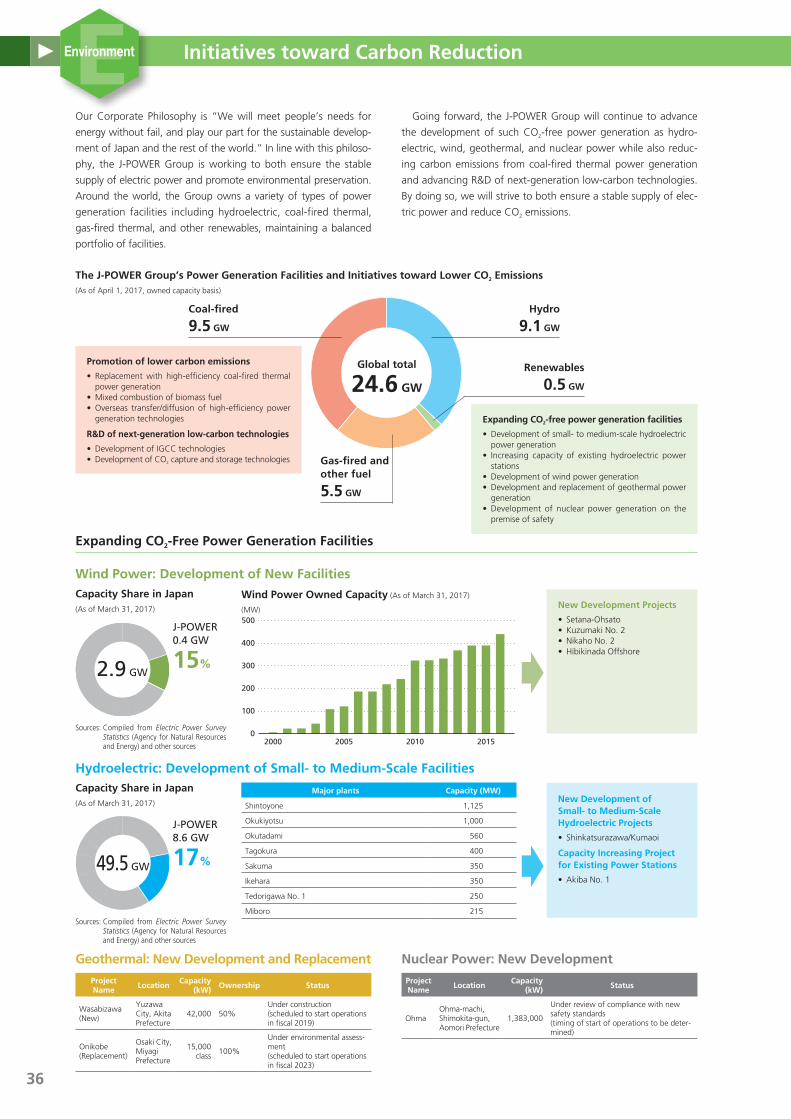
Initiatives toward Carbon Reduction
Our Corporate Philosophy is “We will meet people’s needs for
energy without fail, and play our part for the sustainable develop-
ment of Japan and the rest of the world.” In line with this philoso-
phy, the J-POWER Group is working to both ensure the stable
supply of electric power and promote environmental preservation.
Around the world, the Group owns a variety of types of power
generation facilities including hydroelectric, coal-fired thermal,
gas-fired thermal, and other renewables, maintaining a balanced
portfolio of facilities.
Going forward, the J-POWER Group will continue to advance
the development of such CO2-free power generation as hydro-
electric, wind, geothermal, and nuclear power while also reduc-
ing carbon emissions from coal-fired thermal power generation
and advancing R&D of next-generation low-carbon technologies.
By doing so, we will strive to both ensure a stable supply of elec-
tric power and reduce CO2 emissions.
Geothermal: new Development and Replacement
Project name
LocationCapacity
(kW)ownership status
Wasabizawa (New)
Yuzawa City, Akita Prefecture
42,000 50%Under construction (scheduled to start operations in fiscal 2019)
Onikobe (Replacement)
Osaki City, Miyagi Prefecture
15,000 class
100%
Under environmental assess-ment (scheduled to start operations in fiscal 2023)
nuclear Power: new Development
Project name
LocationCapacity
(kW)status
OhmaOhma-machi, Shimokita-gun, Aomori Prefecture
1,383,000
Under review of compliance with new safety standards (timing of start of operations to be deter-mined)
expanding Co2-Free Power Generation Facilities
Capacity share in Japan(As of March 31, 2017)
Sources: Compiled from Electric Power Survey Statistics (Agency for Natural Resources and Energy) and other sources
J-POWER0.4 GW
15%2.9 GW
new Development Projects
• Setana-Ohsato• Kuzumaki No. 2• Nikaho No. 2• Hibikinada Offshore
Wind Power owned Capacity (As of March 31, 2017)
(MW)
100
200
300
400
0
500
2015201020052000
Wind Power: Development of new Facilities
Capacity share in Japan(As of March 31, 2017)
Sources: Compiled from Electric Power Survey Statistics (Agency for Natural Resources and Energy) and other sources
J-POWER8.6 GW
17%49.5 GW
new Development of small- to Medium-scale Hydroelectric Projects
• Shinkatsurazawa/Kumaoi
Capacity Increasing Project for existing Power stations
• Akiba No. 1
Major plants Capacity (MW)
Shintoyone 1,125
Okukiyotsu 1,000
Okutadami 560
Tagokura 400
Sakuma 350
Ikehara 350
Tedorigawa No. 1 250
Miboro 215
Hydroelectric: Development of small- to Medium-scale Facilities
the J-PoWeR Group’s Power Generation Facilities and Initiatives toward Lower Co2 emissions(As of April 1, 2017, owned capacity basis)
Global total
24.6 GW
Hydro
9.1 GW
Coal-fired
9.5 GW
Gas-fired and other fuel
5.5 GW
Renewables
0.5 GW
Promotion of lower carbon emissions
• Replacement with high-efficiency coal-fired thermal power generation
• Mixed combustion of biomass fuel• Overseas transfer/diffusion of high-efficiency power
generation technologies
R&D of next-generation low-carbon technologies
• Development of IGCC technologies• Development of CO2 capture and storage technologies
expanding Co2-free power generation facilities
• Development of small- to medium-scale hydroelectric power generation
• Increasing capacity of existing hydroelectric power stations
• Development of wind power generation• Development and replacement of geothermal power
generation• Development of nuclear power generation on the
premise of safety
36
EEnvironment
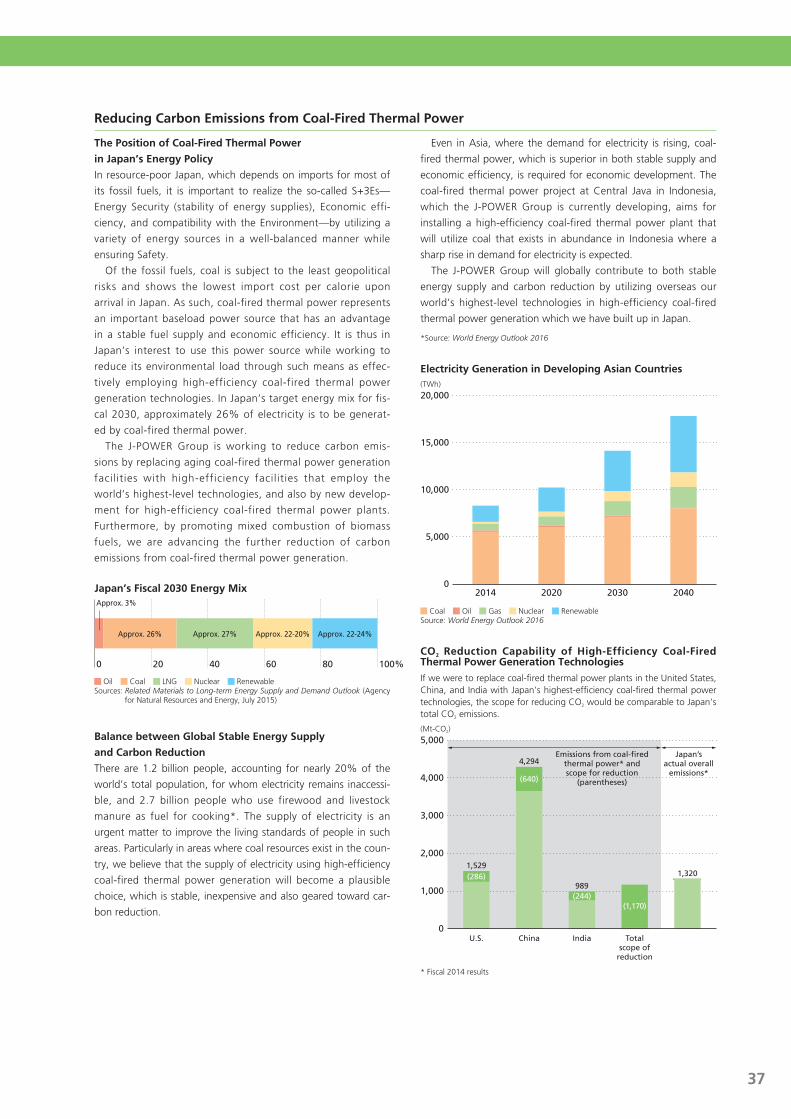
Initiatives toward Carbon Reduction
Reducing Carbon emissions from Coal-Fired thermal Power
the Position of Coal-Fired thermal Power
in Japan’s energy Policy
In resource-poor Japan, which depends on imports for most of
its fossil fuels, it is important to realize the so-called S+3Es—
Energy Security (stability of energy supplies), Economic effi-
ciency, and compatibility with the Environment—by utilizing a
variety of energy sources in a well-balanced manner while
ensuring Safety.
Of the fossil fuels, coal is subject to the least geopolitical
risks and shows the lowest import cost per calorie upon
arrival in Japan. As such, coal-fired thermal power represents
an important baseload power source that has an advantage
in a stable fuel supply and economic efficiency. It is thus in
Japan’s interest to use this power source while working to
reduce its environmental load through such means as effec-
tively employing high-efficiency coal-fired thermal power
generation technologies. In Japan’s target energy mix for fis-
cal 2030, approximately 26% of electricity is to be generat-
ed by coal-fired thermal power.
The J-POWER Group is working to reduce carbon emis-
sions by replacing aging coal-fired thermal power generation
facilities with high-efficiency facilities that employ the
world’s highest-level technologies, and also by new develop-
ment for high-efficiency coal-fired thermal power plants.
Furthermore, by promoting mixed combustion of biomass
fuels, we are advancing the further reduction of carbon
emissions from coal-fired thermal power generation.
Japan’s Fiscal 2030 energy MixApprox. 3%
Approx. 26% Approx. 27% Approx. 22-20% Approx. 22-24%
0 20 40 60 80 100%
Oil Coal LNG Nuclear RenewableSources: Related Materials to Long-term Energy Supply and Demand Outlook (Agency
for Natural Resources and Energy, July 2015)
Balance between Global stable energy supply
and Carbon Reduction
There are 1.2 billion people, accounting for nearly 20% of the
world’s total population, for whom electricity remains inaccessi-
ble, and 2.7 billion people who use firewood and livestock
manure as fuel for cooking*. The supply of electricity is an
urgent matter to improve the living standards of people in such
areas. Particularly in areas where coal resources exist in the coun-
try, we believe that the supply of electricity using high-efficiency
coal-fired thermal power generation will become a plausible
choice, which is stable, inexpensive and also geared toward car-
bon reduction.
Even in Asia, where the demand for electricity is rising, coal-
fired thermal power, which is superior in both stable supply and
economic efficiency, is required for economic development. The
coal-fired thermal power project at Central Java in Indonesia,
which the J-POWER Group is currently developing, aims for
installing a high-efficiency coal-fired thermal power plant that
will utilize coal that exists in abundance in Indonesia where a
sharp rise in demand for electricity is expected.
The J-POWER Group will globally contribute to both stable
energy supply and carbon reduction by utilizing overseas our
world’s highest-level technologies in high-efficiency coal-fired
thermal power generation which we have built up in Japan.
*Source: World Energy Outlook 2016
electricity Generation in Developing Asian Countries(TWh)
10,000
5,000
15,000
0
20,000
2040203020202014
Coal Oil Gas Nuclear RenewableSource: World Energy Outlook 2016
Co2 Reduction Capability of High-efficiency Coal-Fired thermal Power Generation technologies
If we were to replace coal-fired thermal power plants in the United States, China, and India with Japan’s highest-efficiency coal-fired thermal power technologies, the scope for reducing CO2 would be comparable to Japan’s total CO2 emissions.
(Mt-CO2)
U.S.
1,529
India Totalscope of
reduction
989
China
4,294
4,000
3,000
2,000
1,000
0
5,000
(640)
(1,170)
1,320(286)
(244)
Emissions from coal-fired thermal power* and scope for reduction
(parentheses)
Japan’s actual overall
emissions*
* Fiscal 2014 results
37

Initiatives toward Carbon Reduction
Developing next-Generation, Coal-Fired thermal Power technologies and Low-Carbon technologies
J-POWER is working to establish next-generation coal-fired ther-
mal power generation technologies by developing integrated coal
gasification combined cycle (IGCC*1) technologies and integrated
coal gasification fuel cell combined cycle (IGFC*2) technologies as
well as CO2 capture and storage (CCS) technologies. Since fiscal
2002, J-POWER had been engaged in the EAGLE*3 Project in col-
laboration with the New Energy and Industrial Technology
Development Organization (NEDO), aimed at establishing tech-
nologies to realize oxygen-blown IGCC. Employing insights and
results gleaned from the EAGLE Project, the Company has since
been engaged in the Osaki CoolGen Project in collaboration with
The Chugoku Electric Power Co., Inc. We are planning a demon-
stration test of oxygen-blown IGCC in Phase 1; a demonstration
test of IGCC with CO2 separation and capture in Phase 2, which
add CO2 separation and capture to Phase 1; and a demonstration
test of IGFC with CO2 separation and capture in Phase 3, which
add fuel cells to Phase 2. For Phase 1, we have already completed
the construction and trial operations of the IGCC facility and have
started demonstration test operations (166 MW capacity, with a
coal consumption volume of 1,180 tons per day) in March 2017.
In addition, we are currently proceeding with the detailed design
of the CO2 separation and capture facilities for Phase 2.
J-POWER conducted pilot trials aiming for the development of
CO2 separation and capture technologies from fiscal 2007 to
2008 at the Matsushima Thermal Power Plant (Saikai City,
Nagasaki Prefecture) in collaboration with Mitsubishi Heavy
Industries, Ltd. as one of other initiatives to reduce carbon emis-
sions. Additionally, at the Callide A Power Plant in Queensland,
Australia, J-POWER took part in the world’s first trials of an inte-
grated process of oxy-fuel and CCS at a real power plant as part
of a public-private, Japanese-Australian joint project.
*1 Integrated coal gasification combined cycle (IGCC): A combined cycle power gener-ation system with a twin-turbine configuration; a gas turbine driven by the gas pro-duced by gasifying coal and a steam turbine driven by the exhaust gases from the gas turbine
*2 Integrated coal gasification fuel cell combined cycle (IGFC): An integrated power generation system that combines fuel cells with IGCC which achieves the highest level of thermal efficiency as coal-fired thermal power
*3 EAGLE: An oxygen-blown coal gasification project which was conducted at the Wakamatsu Research Institute. The acronym is taken from Coal Energy Application for Gas, Liquid & Electricity.
Phase 1: Oxygen-blown IGCC demonstration
Phase 3: IGFC with CO2 separationand capture
Coal gasification furnace
Exhaust heatrecovery boiler
Chimney
GeneratorSteam turbineGas turbine
OxygenAirAir
CoalCO, H2
CO, H2CO2Shift reactor
CO2 separation and capture To transport and storage
H2 rich gas
Fuel cell
Compressor
Combustor
Steam
Steam
Phase 2: IGCC with CO2 separation and capture
H2 rich gas
Air separation equipment
Area of facility for demonstration tests of CO2 separation and capture
Area of generation facility for demonstration tests of IGCC system
Planned completion of testing facilities (Osakikamijima-cho, Hiroshima Prefecture)
osaki CoolGen Project
2012 2013 2014 2015 2016 2017 2018 2019 2020 2021
Phase 1 Oxygen-blown IGCC
Phase 2IGCC with CO2 separation and capture
Phase 3IGFC with CO2 separation and capture
Demonstration testsDesign/manufacture/installation
Design/manufacture/installation
Design/manufacture/installation
Demonstration tests
Demonstration tests
38
EEnvironment
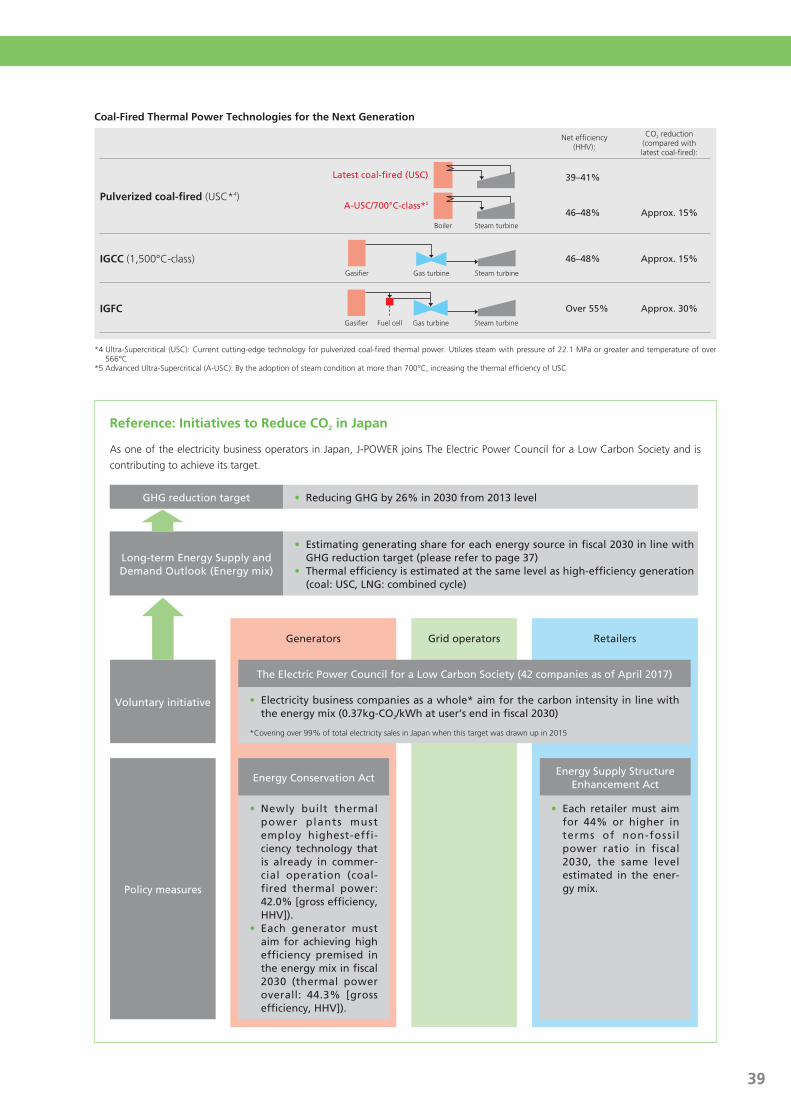
Initiatives toward Carbon Reduction
Coal-Fired thermal Power technologies for the next Generation
*4 Ultra-Supercritical (USC): Current cutting-edge technology for pulverized coal-fired thermal power. Utilizes steam with pressure of 22.1 MPa or greater and temperature of over 566°C
*5 Advanced Ultra-Supercritical (A-USC): By the adoption of steam condition at more than 700°C, increasing the thermal efficiency of USC
Net efficiency(HHV):
CO2 reduction(compared withlatest coal-fired):
IGCC (1,500°C-class) Approx. 15%46–48%
Pulverized coal-fired (USC*4)
39–41%
Approx. 15%46–48%
IGFC Approx. 30%Over 55%
Latest coal-fired (USC)
Boiler Steam turbine
A-USC/700°C-class*5
Gasifier Steam turbineGas turbine
Fuel cellGasifier Steam turbineGas turbine
Reference: Initiatives to Reduce Co2 in Japan
As one of the electricity business operators in Japan, J-POWER joins The Electric Power Council for a Low Carbon Society and is
contributing to achieve its target.
GHG reduction target • Reducing GHG by 26% in 2030 from 2013 level
Long-term Energy Supply and Demand Outlook (Energy mix)
• Estimating generating share for each energy source in fiscal 2030 in line with GHG reduction target (please refer to page 37)
• Thermal efficiency is estimated at the same level as high-efficiency generation (coal: USC, LNG: combined cycle)
Generators Grid operators Retailers
Voluntary initiative
The Electric Power Council for a Low Carbon Society (42 companies as of April 2017)
• Electricity business companies as a whole* aim for the carbon intensity in line with the energy mix (0.37kg-CO2/kWh at user’s end in fiscal 2030)
*Covering over 99% of total electricity sales in Japan when this target was drawn up in 2015
Policy measures
Energy Conservation ActEnergy Supply Structure
Enhancement Act
• Newly built thermal power plants must employ highest-effi-ciency technology that is already in commer-cial operation (coal-fired thermal power: 42.0% [gross efficiency, HHV]).
• Each generator must aim for achieving high efficiency premised in the energy mix in fiscal 2030 (thermal power overall: 44.3% [gross efficiency, HHV]).
• Each retailer must aim for 44% or higher in terms of non-fossil power ratio in fiscal 2030, the same level estimated in the ener-gy mix.
39
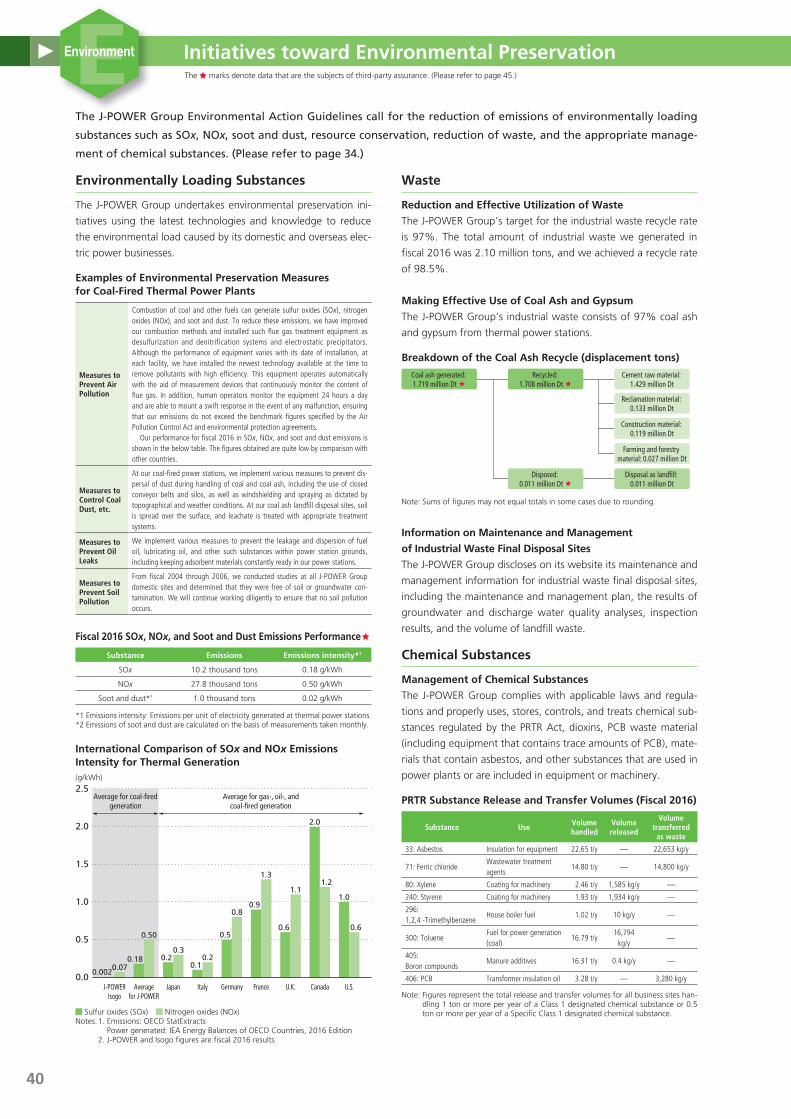
Initiatives toward environmental Preservation
The J-POWER Group Environmental Action Guidelines call for the reduction of emissions of environmentally loading
substances such as SOx, NOx, soot and dust, resource conservation, reduction of waste, and the appropriate manage-
ment of chemical substances. (Please refer to page 34.)
environmentally Loading substances
The J-POWER Group undertakes environmental preservation ini-
tiatives using the latest technologies and knowledge to reduce
the environmental load caused by its domestic and overseas elec-
tric power businesses.
examples of environmental Preservation Measures for Coal-Fired thermal Power Plants
Measures to Prevent Air Pollution
Combustion of coal and other fuels can generate sulfur oxides (SOx), nitrogen oxides (NOx), and soot and dust. To reduce these emissions, we have improved our combustion methods and installed such flue gas treatment equipment as desulfurization and denitrification systems and electrostatic precipitators. Although the performance of equipment varies with its date of installation, at each facility, we have installed the newest technology available at the time to remove pollutants with high efficiency. This equipment operates automatically with the aid of measurement devices that continuously monitor the content of flue gas. In addition, human operators monitor the equipment 24 hours a day and are able to mount a swift response in the event of any malfunction, ensuring that our emissions do not exceed the benchmark figures specified by the Air Pollution Control Act and environmental protection agreements. Our performance for fiscal 2016 in SOx, NOx, and soot and dust emissions is shown in the below table. The figures obtained are quite low by comparison with other countries.
Measures to Control Coal Dust, etc.
At our coal-fired power stations, we implement various measures to prevent dis-persal of dust during handling of coal and coal ash, including the use of closed conveyor belts and silos, as well as windshielding and spraying as dictated by topographical and weather conditions. At our coal ash landfill disposal sites, soil is spread over the surface, and leachate is treated with appropriate treatment systems.
Measures to Prevent Oil Leaks
We implement various measures to prevent the leakage and dispersion of fuel oil, lubricating oil, and other such substances within power station grounds, including keeping adsorbent materials constantly ready in our power stations.
Measures to Prevent Soil Pollution
From fiscal 2004 through 2006, we conducted studies at all J-POWER Group domestic sites and determined that they were free of soil or groundwater con-tamination. We will continue working diligently to ensure that no soil pollution occurs.
Fiscal 2016 sox, nox, and soot and Dust emissions Performanceê
substance emissions emissions intensity*1
SOx 10.2 thousand tons 0.18 g/kWh
NOx 27.8 thousand tons 0.50 g/kWh
Soot and dust*2 1.0 thousand tons 0.02 g/kWh
*1 Emissions intensity: Emissions per unit of electricity generated at thermal power stations*2 Emissions of soot and dust are calculated on the basis of measurements taken monthly.
International Comparison of sox and nox emissions Intensity for thermal Generation(g/kWh)
1.0
1.5
2.0
0.5
0.0
2.5
U.S.CanadaU.K.FranceGermanyItalyJapanAveragefor J-POWER
J-POWERIsogo
0.0020.070.18
0.50
0.20.1
0.2
0.5
0.80.9
1.3
0.6
1.1
2.0
1.2
1.0
0.6
0.3
Average for coal-fired generation
Average for gas-, oil-, and coal-fired generation
Sulfur oxides (SOx) Nitrogen oxides (NOx)Notes: 1. Emissions: OECD StatExtracts
Power generated: IEA Energy Balances of OECD Countries, 2016 Edition 2. J-POWER and Isogo figures are fiscal 2016 results.
Waste
Reduction and effective Utilization of Waste
The J-POWER Group’s target for the industrial waste recycle rate
is 97%. The total amount of industrial waste we generated in
fiscal 2016 was 2.10 million tons, and we achieved a recycle rate
of 98.5%.
Making effective Use of Coal Ash and Gypsum
The J-POWER Group’s industrial waste consists of 97% coal ash
and gypsum from thermal power stations.
Breakdown of the Coal Ash Recycle (displacement tons)
Disposed: 0.011 million Dt ê
Reclamation material: 0.133 million Dt
Construction material: 0.119 million Dt
Farming and forestry material: 0.027 million Dt
Disposal as landfill: 0.011 million Dt
Coal ash generated: 1.719 million Dt ê
Recycled: 1.708 million Dt ê
Cement raw material: 1.429 million Dt
Note: Sums of figures may not equal totals in some cases due to rounding.
Information on Maintenance and Management
of Industrial Waste Final Disposal sites
The J-POWER Group discloses on its website its maintenance and
management information for industrial waste final disposal sites,
including the maintenance and management plan, the results of
groundwater and discharge water quality analyses, inspection
results, and the volume of landfill waste.
Chemical substances
Management of Chemical substances
The J-POWER Group complies with applicable laws and regula-
tions and properly uses, stores, controls, and treats chemical sub-
stances regulated by the PRTR Act, dioxins, PCB waste material
(including equipment that contains trace amounts of PCB), mate-
rials that contain asbestos, and other substances that are used in
power plants or are included in equipment or machinery.
PRtR substance Release and transfer Volumes (Fiscal 2016)
Substance Use Volume handled
Volume released
Volume transferred as waste
33: Asbestos Insulation for equipment 22.65 t/y — 22,653 kg/y
71: Ferric chlorideWastewater treatment agents
14.80 t/y — 14,800 kg/y
80: Xylene Coating for machinery 2.46 t/y 1,585 kg/y —
240: Styrene Coating for machinery 1.93 t/y 1,934 kg/y —
296: 1,2,4 -Trimethylbenzene
House boiler fuel 1.02 t/y 10 kg/y —
300: TolueneFuel for power generation (coal)
16.79 t/y16,794
kg/y—
405: Boron compounds
Manure additives 16.31 t/y 0.4 kg/y —
406: PCB Transformer insulation oil 3.28 t/y — 3,280 kg/y
Note: Figures represent the total release and transfer volumes for all business sites han-dling 1 ton or more per year of a Class 1 designated chemical substance or 0.5 ton or more per year of a Specific Class 1 designated chemical substance.
The ê marks denote data that are the subjects of third-party assurance. (Please refer to page 45.)
40
EEnvironment

Initiatives toward environmental Preservation Preservation of natural environment
In an effort to preserve the natural environment, in the J-POWER Group Environmental Action Guidelines, we state
that we take the natural environment into account in the various stages of business and give consideration to aquatic
environments and biodiversity, as well as implementing forest protection initiatives. (Please refer to page 35.)
environmental Impact Assessment
Before building or expanding power plants, we conduct environ-
mental impact assessments in accordance with applicable laws
and regulations and adequately take the environment into consid-
eration while listening to the opinions of local residents during the
planning stages. After a power plant becomes operational, we
take environmental preservation measures referring to the results
of monitoring performed pursuant to environmental protection
agreements entered into with relevant local governments.
environmental Impact Assessments in Process from Fiscal 2016 onward(Projects after submission of a planning stage statement are listed.)
Project OperatorImplementation
areaImplementation status
The New No. 1 and 2 units renewal project at Takasago Thermal Power Station
J-POWERTakasago City,
Hyogo PrefectureScoping document review completed (in July 2015)
Renewal project at Onikobe Geothermal Power Station
J-POWEROsaki City, Miyagi
PrefectureScoping document review completed (in July 2017)
The No. 2 unit installation project at Kashima Thermal Power Station
Kashima Power Co., Ltd.
Kashima City, Ibaraki Prefecture
All procedures completed (in August 2016) Construction work started (in November 2016)
Nishi-Okinoyama Thermal Power Station (tentative name) installation project
Yamaguchi-Ube Power Generation
Co., Ltd.
Ube City, Yamaguchi Prefecture
Scoping document review completed (in April 2016)
Shin-nikaho Wind Farm Project (tentative name)
J-POWER Nikaho City, Akita
Prefecture
All procedures completed (in April 2016) Construction work started (in July 2017)
Minami Ehime No. 2 Wind Farm Project (tentative name)
J-POWERUwajima City, Ehime
PrefectureScoping document review completed (in January 2016)
Kaminokuni No. 2 Wind Farm Project (tentative name)
J-POWERKaminokuni-cho,
Hiyama-gun, Hokkaido Prefecture
Scoping document under review (as of July 2017)
Preservation of Aquatic environments
From fiscal 2013 onward, the preservation of aquatic environ-
ments has been placed as one of the Corporate Targets for the
J-POWER Group Environmental Management Vision with the aim
of reinforcing our environmental preservation initiatives regard-
ing rivers and the seas.
We undertake environmental preservation measures based on
the specific regional environment and characteristics of each
business site such as taking measures regarding water quality
and accumulation of silt in dam lakes and downstream areas in
the case of hydroelectric power stations, and managing the
effluent into nearby oceans in accordance with applicable laws
and regulations in the case of thermal power stations.
examples of Aquatic environment Preservation Measures for Coal-Fired thermal Power Plants
Measures to Prevent Water Pollution
Wastewater from such facilities as desulfurization units and offices is appro-priately treated in integrated wastewater treatment systems, through coagula-tion, precipitation, filtration, and so forth. Treated water is always monitored by automatic measuring equipment and analyzed periodically to ensure that it meets the standards set under the Water Pollution Prevention Act and envi-ronmental protection agreements.
Measures to Control Thermal Water Discharge
Seawater taken in to cool the steam used in power generation is released as thermal water discharge*. We control intake and discharge properly to reduce their impact on marine life in the vicinity, and monitor the temperature of thermal water discharge on a 24-hour basis to ensure that it remains at or below the reference values established by environmental protection agree-ments.
Cutting Back on Industrial Water Use
Industrial water is used in such equipment as boilers, cooling systems, and wet-type desulfurization systems. Part of this water is released into the atmo-sphere as steam. We are working to recover and reuse wastewater that is not released into the atmosphere as far as possible, in order to reduce our con-sumption of industrial water.
* Thermal water discharge: In thermal and nuclear power generation, the steam that has powered the turbine is cooled and turned to water in a condenser and used again in the boiler. In almost all power stations in Japan, seawater is used for cooling in the condensers. As the sea-water cools the steam passing through the condenser, its temperature rises. It is then returned to the ocean through the discharge outlet, at which point it is referred to as thermal water discharge.
Preservation of Forest
J-POWER owns forests in the areas near its hydroelectric power
facilities located throughout Japan. We appropriately maintain
these valuable forests in accordance with the Forest Protection
Guidelines (formulated in 2007).
Japan’s forests are falling into ruin because of inadequate
management caused by slumping forestry markets, but the
J-POWER Group is contributing to forest protection as well as
the reduction of CO2 emissions, through efforts to combust bio-
mass fuel pellets made from forestry offcuts and other materials
in coal-fired thermal power stations along with coal.
Preservation of Biodiversity
To reinforce our measures in light of the Basic Act on Biodiversity,
from fiscal 2011 onward, the preservation of biodiversity has
been placed as one of the Corporate Targets for the J-POWER
Group Environmental Management Vision.
During the planning and design stages of power generation
facilities, we implement environmental preservation measures
taking into consideration the impact on habitats and breeding
environments as well as on ecological systems based on the results
of environmental impact assessment for wildlife and ecological
systems in the land and ocean areas surrounding the facilities. We
strive to preserve wildlife living in the vicinity of operating power
plants, particularly rare species, and their habitats.
These measures are tailored to local environments and charac-
teristics. For example, every effort is made to avoid outdoor work
during the nesting season of the Japanese golden eagle and
other endangered birds in the vicinity of the Okutadami Dam
and Otori Dam. Another example is the restoration, mainte-
nance, and management of marshes that became landfill areas
when the Okutadami Dam was expanded.
41
EEnvironment
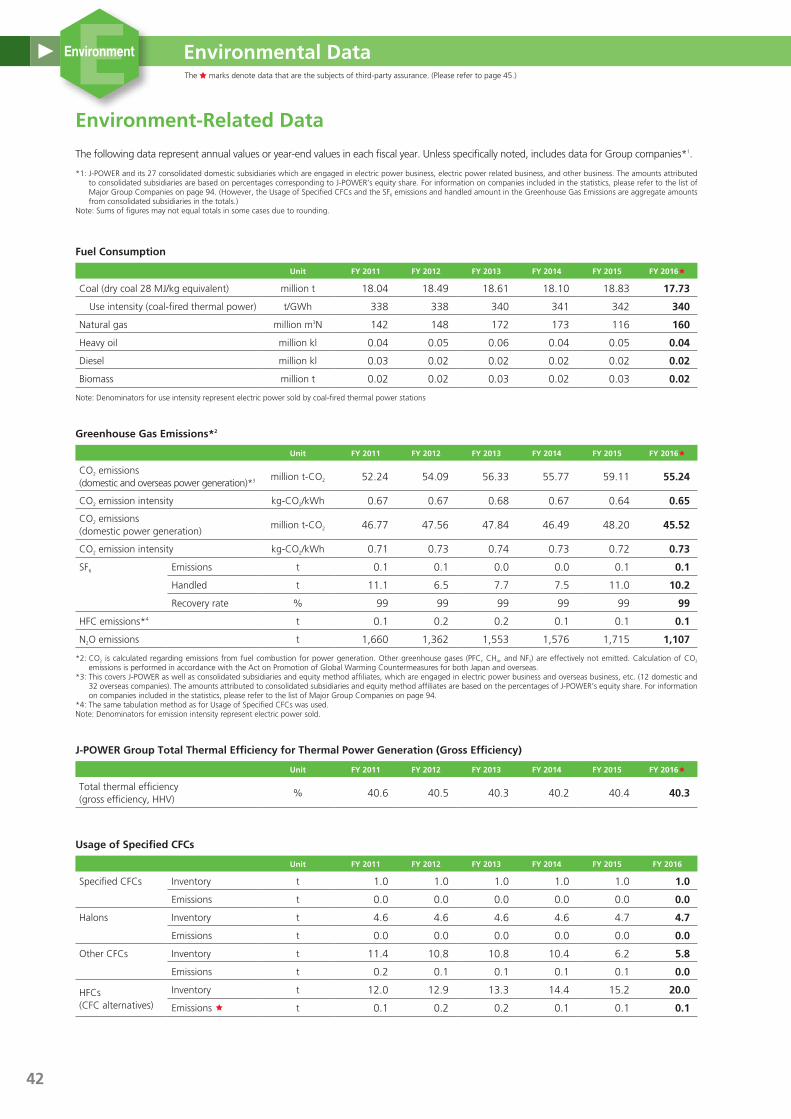
environmental Data
The following data represent annual values or year-end values in each fiscal year. Unless specifically noted, includes data for Group companies*1.
*1: J-POWER and its 27 consolidated domestic subsidiaries which are engaged in electric power business, electric power related business, and other business. The amounts attributed to consolidated subsidiaries are based on percentages corresponding to J-POWER’s equity share. For information on companies included in the statistics, please refer to the list of Major Group Companies on page 94. (However, the Usage of Specified CFCs and the SF6 emissions and handled amount in the Greenhouse Gas Emissions are aggregate amounts from consolidated subsidiaries in the totals.)
Note: Sums of figures may not equal totals in some cases due to rounding.
Fuel Consumption
Unit FY 2011 FY 2012 FY 2013 FY 2014 FY 2015 FY 2016ê
Coal (dry coal 28 MJ/kg equivalent) million t 18.04 18.49 18.61 18.10 18.83 17.73
Use intensity (coal-fired thermal power) t/GWh 338 338 340 341 342 340
Natural gas million m3N 142 148 172 173 116 160
Heavy oil million kl 0.04 0.05 0.06 0.04 0.05 0.04
Diesel million kl 0.03 0.02 0.02 0.02 0.02 0.02
Biomass million t 0.02 0.02 0.03 0.02 0.03 0.02
Note: Denominators for use intensity represent electric power sold by coal-fired thermal power stations
Greenhouse Gas emissions*2
Unit FY 2011 FY 2012 FY 2013 FY 2014 FY 2015 FY 2016ê
CO2 emissions(domestic and overseas power generation)*3 million t-CO2 52.24 54.09 56.33 55.77 59.11 55.24
CO2 emission intensity kg-CO2/kWh 0.67 0.67 0.68 0.67 0.64 0.65
CO2 emissions(domestic power generation)
million t-CO2 46.77 47.56 47.84 46.49 48.20 45.52
CO2 emission intensity kg-CO2/kWh 0.71 0.73 0.74 0.73 0.72 0.73
SF6 Emissions t 0.1 0.1 0.0 0.0 0.1 0.1
Handled t 11.1 6.5 7.7 7.5 11.0 10.2
Recovery rate % 99 99 99 99 99 99
HFC emissions*4 t 0.1 0.2 0.2 0.1 0.1 0.1
N2O emissions t 1,660 1,362 1,553 1,576 1,715 1,107
*2: CO2 is calculated regarding emissions from fuel combustion for power generation. Other greenhouse gases (PFC, CH4, and NF3) are effectively not emitted. Calculation of CO2 emissions is performed in accordance with the Act on Promotion of Global Warming Countermeasures for both Japan and overseas.
*3: This covers J-POWER as well as consolidated subsidiaries and equity method affiliates, which are engaged in electric power business and overseas business, etc. (12 domestic and 32 overseas companies). The amounts attributed to consolidated subsidiaries and equity method affiliates are based on the percentages of J-POWER’s equity share. For information on companies included in the statistics, please refer to the list of Major Group Companies on page 94.
*4: The same tabulation method as for Usage of Specified CFCs was used.Note: Denominators for emission intensity represent electric power sold.
J-PoWeR Group total thermal efficiency for thermal Power Generation (Gross efficiency)
Unit FY 2011 FY 2012 FY 2013 FY 2014 FY 2015 FY 2016ê
Total thermal efficiency(gross efficiency, HHV)
% 40.6 40.5 40.3 40.2 40.4 40.3
Usage of specified CFCs
Unit FY 2011 FY 2012 FY 2013 FY 2014 FY 2015 FY 2016
Specified CFCs Inventory t 1.0 1.0 1.0 1.0 1.0 1.0
Emissions t 0.0 0.0 0.0 0.0 0.0 0.0
Halons Inventory t 4.6 4.6 4.6 4.6 4.7 4.7
Emissions t 0.0 0.0 0.0 0.0 0.0 0.0
Other CFCs Inventory t 11.4 10.8 10.8 10.4 6.2 5.8
Emissions t 0.2 0.1 0.1 0.1 0.1 0.0
HFCs (CFC alternatives)
Inventory t 12.0 12.9 13.3 14.4 15.2 20.0
Emissions ê t 0.1 0.2 0.2 0.1 0.1 0.1
environment-Related Data
The ê marks denote data that are the subjects of third-party assurance. (Please refer to page 45.)
42
EEnvironment

environmental Data
sox, nox, and soot and Dust emissions
Unit FY 2011 FY 2012 FY 2013 FY 2014 FY 2015 FY 2016ê
SOx Emissions thousand t 12.1 12.3 10.7 9.8 10.7 10.2
Intensity (thermal) g/kWh 0.21 0.21 0.18 0.17 0.18 0.18
NOx Emissions thousand t 28.5 30.3 31.1 29.1 29.8 27.8
Intensity (thermal) g/kWh 0.48 0.51 0.52 0.51 0.50 0.50
Soot and dust Emissions thousand t 0.7 0.8 0.8 0.8 0.8 1.0
Intensity (thermal) g/kWh 0.01 0.01 0.01 0.01 0.01 0.02
Notes: 1 Soot and dust emissions are calculated from monthly measurements. 2 Denominators for intensity represent the electricity generated in thermal power stations (excluding geothermal power stations).
Industrial Waste Recycling
Unit FY 2011 FY 2012 FY 2013 FY 2014 FY 2015 FY 2016ê
Volume generated million t 2.38 2.30 2.32 2.14 2.25 2.10
Volume recycled million t 2.33 2.26 2.27 2.11 2.22 2.07
Recycle rate % 98 98 98 99 99 99
Coal Ash and Gypsum Recycling
Unit FY 2011 FY 2012 FY 2013 FY 2014 FY 2015 FY 2016ê
Coal ash Volume generated thousand t 1,957 1,900 1,928 1,773 1,852 1,719
Volume recycled thousand t 1,939 1,882 1,906 1,760 1,839 1,708
Recycle rate % 99.0 99.0 98.9 99.2 99.3 99.4
Gypsum Volume generated thousand t 362 352 322 304 318 310
Recycle rate % 99.8 99.9 100 100 100 100
office Power Consumption
Unit FY 2011 FY 2012 FY 2013 FY 2014 FY 2015 FY 2016
Power consumed by offices (company total) GWh 19.40 19.48 19.04 19.51 19.61 20.83
Head office*5 Power consumption GWh 7.31 6.99 6.94 6.39 6.41 6.37
Lighting/power sockets GWh 1.25 1.33 1.29 1.26 1.25 1.22
*5: J-POWER head office buildingNote: Figures have been adjusted in accordance with the expansion/contraction of the range of data available for compilation.
Fuel Consumption in offices (Gasoline equivalent)
Unit FY 2011 FY 2012 FY 2013 FY 2014 FY 2015 FY 2016
Consumption kl 1,299 1,290 1,293 1,252 1,198 1,230
Note: Figures have been adjusted in accordance with the expansion/contraction of the range of data available for compilation.
Rate of Procurement of Recycled Copy Paper
Unit FY 2011 FY 2012 FY 2013 FY 2014 FY 2015 FY 2016
Copy paper*6 Purchased million sheets 58.77 61.50 61.79 58.53 55.30 54.81
Recycled copy paper*6 Purchased million sheets 58.14 61.25 61.45 57.85 54.76 54.58
Purchase rate % 99 99 99 99 99 100
*6: A4 paper-size equivalent
43
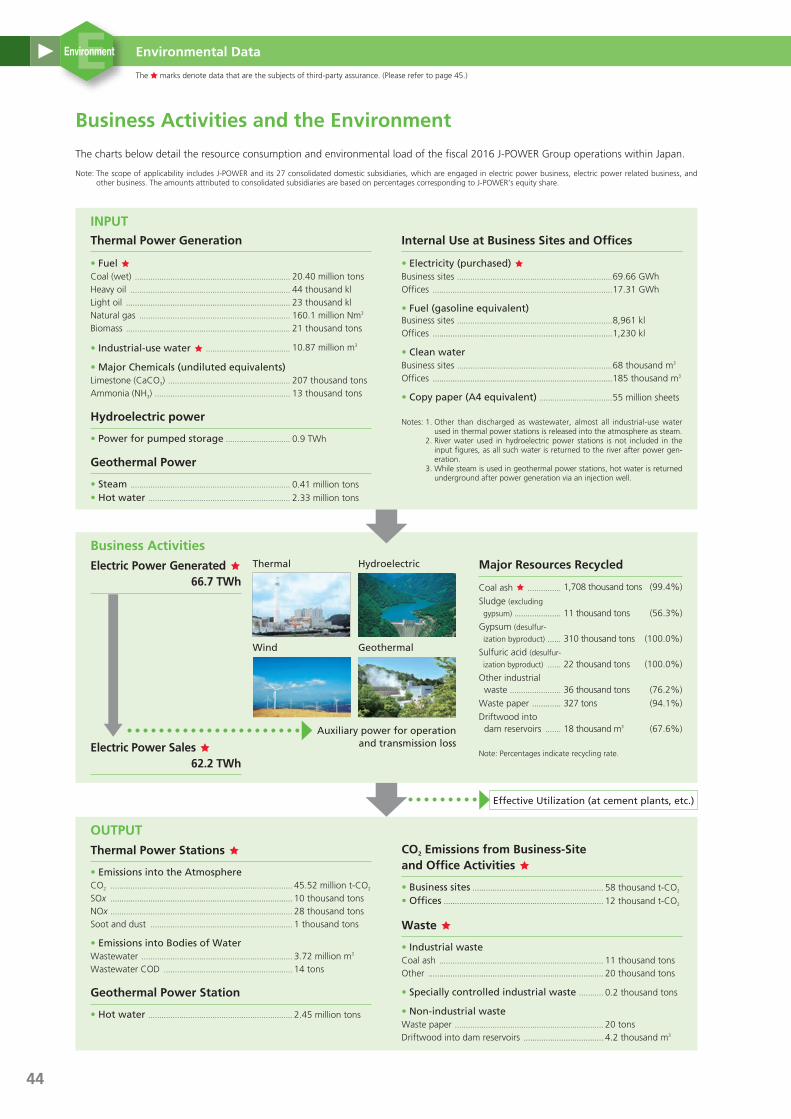
environmental Data
The ê marks denote data that are the subjects of third-party assurance. (Please refer to page 45.)
The charts below detail the resource consumption and environmental load of the fiscal 2016 J-POWER Group operations within Japan.
Note: The scope of applicability includes J-POWER and its 27 consolidated domestic subsidiaries, which are engaged in electric power business, electric power related business, and other business. The amounts attributed to consolidated subsidiaries are based on percentages corresponding to J-POWER’s equity share.
Business Activities and the environment
InPUtthermal Power Generation
• Fuel êCoal (wet) ...................................................................... 20.40 million tonsHeavy oil ........................................................................ 44 thousand klLight oil .......................................................................... 23 thousand klNatural gas .................................................................... 160.1 million Nm3
Biomass .......................................................................... 21 thousand tons
• Industrial-use water ê ...................................... 10.87 million m3
• Major Chemicals (undiluted equivalents)Limestone (CaCO3) ....................................................... 207 thousand tonsAmmonia (NH3) ............................................................. 13 thousand tons
Hydroelectric power
• Power for pumped storage ............................. 0.9 TWh
Geothermal Power
• Steam ........................................................................ 0.41 million tons • Hot water ................................................................ 2.33 million tons
Internal Use at Business sites and offices
• Electricity (purchased) êBusiness sites ......................................................................69.66 GWhOffices .................................................................................17.31 GWh
• Fuel (gasoline equivalent)Business sites ......................................................................8,961 klOffices .................................................................................1,230 kl
• Clean waterBusiness sites ......................................................................68 thousand m3
Offices .................................................................................185 thousand m3
• Copy paper (A4 equivalent) .................................55 million sheets
Notes: 1. Other than discharged as wastewater, almost all industrial-use water used in thermal power stations is released into the atmosphere as steam.
2. River water used in hydroelectric power stations is not included in the input figures, as all such water is returned to the river after power gen-eration.
3. While steam is used in geothermal power stations, hot water is returned underground after power generation via an injection well.
oUtPUt
thermal Power stations ê
• Emissions into the AtmosphereCO2 .................................................................................. 45.52 million t-CO2
SOx .................................................................................. 10 thousand tonsNOx .................................................................................. 28 thousand tonsSoot and dust ................................................................ 1 thousand tons
• Emissions into Bodies of WaterWastewater .................................................................... 3.72 million m3
Wastewater COD .......................................................... 14 tons
Geothermal Power station
• Hot water ................................................................. 2.45 million tons
Co2 emissions from Business-site and office Activities ê
• Business sites ........................................................... 58 thousand t-CO2 • Offices ........................................................................ 12 thousand t-CO2
Waste ê
• Industrial wasteCoal ash .......................................................................... 11 thousand tonsOther ............................................................................... 20 thousand tons
• Specially controlled industrial waste ........... 0.2 thousand tons
• Non-industrial wasteWaste paper ................................................................... 20 tonsDriftwood into dam reservoirs .................................... 4.2 thousand m3
Business Activities
electric Power Generated ê 66.7 tWh
Thermal Hydroelectric
Wind Geothermal
electric Power sales ê� � 62.2 tWh
Auxiliary power for operation and transmission loss
Major Resources Recycled
Coal ash ê ............... 1,708 thousand tons (99.4%)
Sludge (excluding
gypsum) .....................
11 thousand tons
(56.3%)
Gypsum (desulfur-
ization byproduct) ......
310 thousand tons
(100.0%)
Sulfuric acid (desulfur-
ization byproduct) ......
22 thousand tons
(100.0%)
Other industrial waste .......................
36 thousand tons
(76.2%)
Waste paper ............. 327 tons (94.1%)
Driftwood into dam reservoirs .......
18 thousand m3
(67.6%)
Note: Percentages indicate recycling rate.
Effective Utilization (at cement plants, etc.)
44
EEnvironment
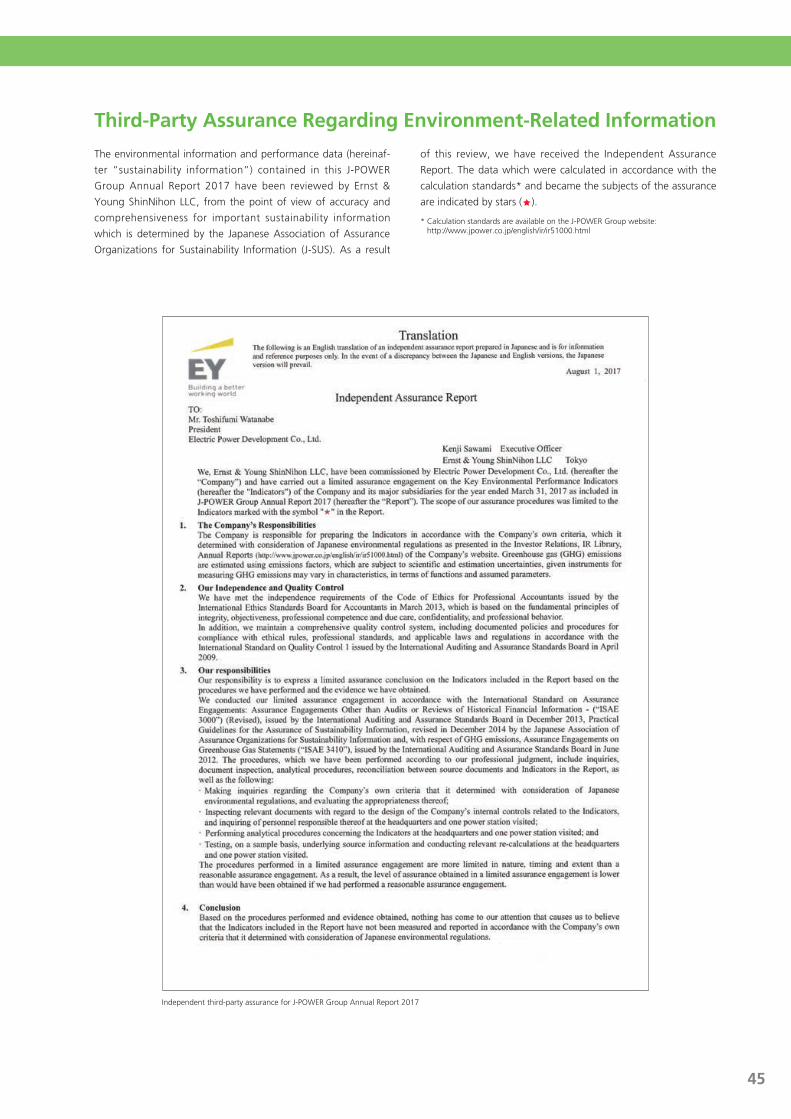
environmental Data
The environmental information and performance data (hereinaf-
ter “sustainability information”) contained in this J-POWER
Group Annual Report 2017 have been reviewed by Ernst &
Young ShinNihon LLC, from the point of view of accuracy and
comprehensiveness for important sustainability information
which is determined by the Japanese Association of Assurance
Organizations for Sustainability Information (J-SUS). As a result
of this review, we have received the Independent Assurance
Report. The data which were calculated in accordance with the
calculation standards* and became the subjects of the assurance
are indicated by stars (ê).
* Calculation standards are available on the J-POWER Group website: http://www.jpower.co.jp/english/ir/ir51000.html
third-Party Assurance Regarding environment-Related Information
Independent third-party assurance for J-POWER Group Annual Report 2017
45

Respect for Human Resources
The J-POWER Group considers each employee to be a valuable human resource that enables its sustainable growth as
a corporation. We strive to provide safe and comfortable working environments, and, at the same time, we endeavor
to create a corporate culture that respects the character and individuality of our employees and makes them feel it
worthwhile to constantly take on new challenges.
The J-POWER Group positions recruitment, making use and development of human resources as crucial measures
for its sustainable growth. We are reinforcing the foundation for career development, with a focus on the CDP
(Career Development Program), and establishing workplace environments and systems that make advantageous use
of diversity, in order to improve individual skills and workforce productivity.
Recruiting and Making Use of Human Resources
the J-PoWeR Group’s Conceptual Approach
to Human Resource Recruitment
The J-POWER Group approach is realizing stable recruiting in the
interest of sustainable growth, seeking human resources from
people in a wide range of fields and age-groups, and providing
employees with opportunities to take an active part. When
recruiting and making use of human resources, we make sure
that we comply with the labor regulations of Japan and other
countries in which we conduct business. In addition, we are also
conducting awareness raising in human rights training in accor-
dance with J-POWER’s Compliance Action Guidelines which stip-
ulate respect for individuality and human rights and prohibition
against discrimination. (Please refer to page 59.) We are engaged
in creating systems and working environments that enable our
diverse personnel to fully demonstrate their capabilities, without
regard for gender, age, or other such distinctions.
number of new Graduates employed (J-PoWeR)
FY2015 FY2016 FY2017
Male 60 66 72
Female 2 3 9
Total 62 69 81
status of Human Resource establishment (J-PoWeR)
Average length of continuous service
20.0 years (as of March 31, 2017)
Turnover rates for three years after joining
1.6% (April 2016)
Measures to Promote Diversity
As a measure to further make use of elderly people, we have an
employment extension system which allows those who have
passed retirement age and desire extension of employment to
continue working until the age of 65. In combination with the
personnel registration system (available up to age of 70), which
introduces job opportunities in the Group, we will harness the
experience, skills, and motivation to work possessed by elderly
people in the Group for the sustained growth of our business. As
of the end of March 2017, 128 employees (J-POWER) continue
to work using the employment extension system.
Our employment rate for persons with disabilities was 2.10%
as of June 1, 2017, which exceeds the statutory rate. We are
enhancing working environments and promoting understanding
of other employees through such initiatives as establishing “the
consultation desk for employees with disabilities on assistance and
working environments” and making office buildings barrier-free.
We will continue making efforts to raise the employment ratio.
We will also take steps to improve our management training
with a view to building a workplace where diverse human
resources can take active part.
Protection of employees’ Rights
In accordance with the laws and regulations of each country in
which we operate, the J-POWER Group protects the basic rights
of its employees, including the prevention of child labor and
forced labor, protection of the right to freedom of association,
protection of the right of collective bargaining, and compliance
with minimum wages. The Group also places a thorough prohibi-
tion on discrimination in all its forms, including on the grounds
of birth, nationality, race, creed, religion, gender, physical condi-
tion, and social status.
In addition, in order to protect the rights of employees and to
maintain and improve their living standards, we obligate employ-
ees who are not in management positions to join labor unions.
In addition to consulting with the labor unions on important
changes in working conditions, including salaries and bonuses,
we hold consultations on management policy with labor unions
once a year in order to reflect the opinions of employees in man-
agement policy.
Internships
J-POWER, JPHYTEC Co., Ltd., and JPec Co., Ltd. offer summer
internships to science students in graduate school, university, or
technical college. The internships provide experience in certain
operations at power stations and other facilities with the aim of
helping the interns’ studies and supporting them in making
future occupation choices. In fiscal 2016, 54 interns from various
areas of Japan took up the challenge of practical training in the
maintenance and operation of electric power facilities.
46
SSocialSSocial

Respect for Human Resources
Human Resource Development
Human Resource Development Programs
Our aim in the J-POWER Group is to develop all our employees
into independent, talented, professional human resources who
contribute to the organization with a multiplicity of specialized
knowledge and a broad perspective. We are adopting the Career
Development Program (CDP) as a measure to achieve that aim.
evaluation and Management system
We established an evaluation system in 2004 that is based on a
goal management system. The system encourages employees to
perform work autonomously, heighten their achievement moti-
vation, and improve their faculty while working toward achieving
their goals. We also set divisional goals to realize divisional strat-
egies. Employees are encouraged to perform jointly to achieve
the divisional goals.
Various training Programs
The J-POWER Group provides various kinds of training programs as
Off-JT, including level-specific training, career training, objec-
tive-specific training, divisional training, selective leadership train-
ing, and training at educational institutions*. Through these
programs, we are developing human resources in line with the CDP.
We have also established training facilities for the technical func-
tions (civil engineering and architectural engineering; hydroelectric
power, transmission and transformation, and telecommunications;
and thermal power) in order to systematically develop engineers.
The human resource development through such training pro-
grams aims for not only making our human resources acquire
the basic knowledge and skills necessary for our business, but
also fostering next-generation leaders, promoting diversity
(enabling diverse human resources to perform actively), and
empowering our veteran employees.
* Training at educational institutions: Training program that sends employees to domestic or overseas business graduate schools or business schools, or offers them a chance to apply for studying abroad.
Helping employees Voluntarily Develop their Careers
and Abilities
J-POWER employs a self-declaration system where employees
declare their career planning hopes to the Company once a year
and discuss with their immediate superiors. We have also intro-
duced a voluntary training incentive program and an academic
training program to support employees developing their abilities
on their own initiative.
CDP overview
Improved management
practices
Enhanced corporate
value
Revitalized organization
Company
CDP
We utilize both on-the-job and off-the-job training sessions to enhance
value for both employees and the Company aiming for win-win relationships.
Enhanced faculty
Enhanced human
resources value
Greater autonomy
Employees
Medium-/long-term, comprehensive,
interactive human resources development
program
Significance Significance・Effectively addresses Company challenges・Effectively promotes human resource
development
・Creates an image of future career・Improves sense of self-realization
47
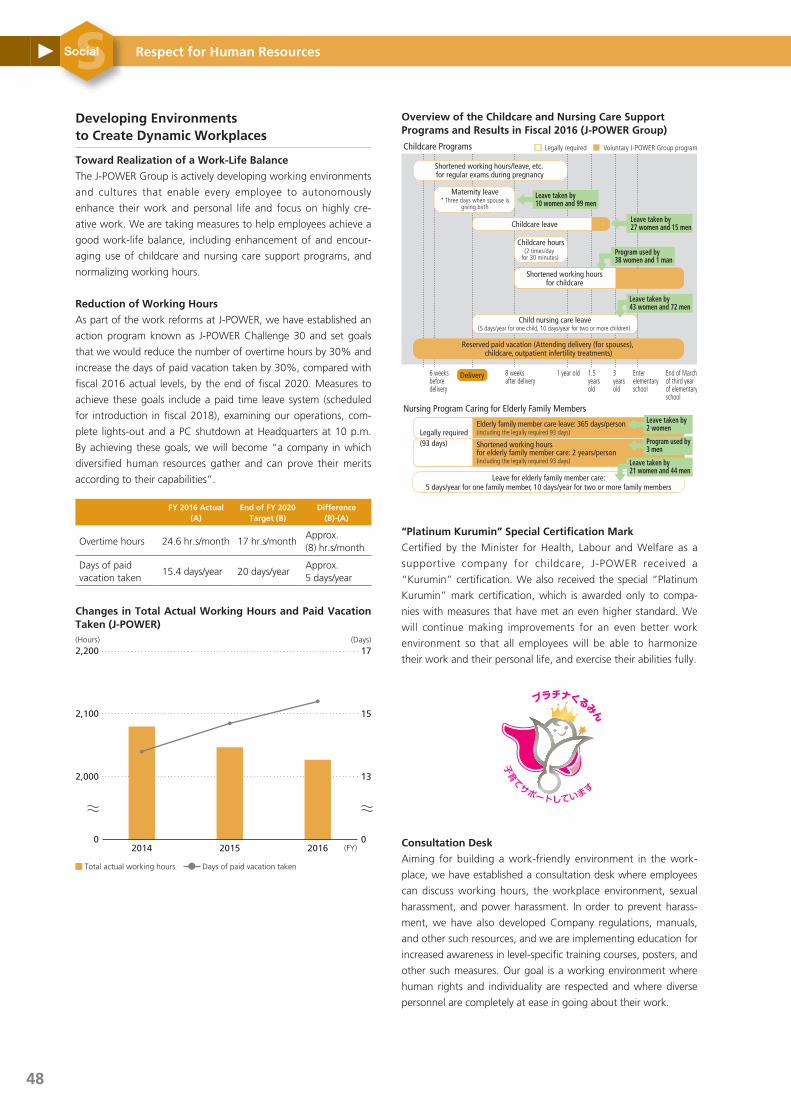
Respect for Human Resources
Developing environments to Create Dynamic Workplaces
toward Realization of a Work-Life Balance
The J-POWER Group is actively developing working environments
and cultures that enable every employee to autonomously
enhance their work and personal life and focus on highly cre-
ative work. We are taking measures to help employees achieve a
good work-life balance, including enhancement of and encour-
aging use of childcare and nursing care support programs, and
normalizing working hours.
Reduction of Working Hours
As part of the work reforms at J-POWER, we have established an
action program known as J-POWER Challenge 30 and set goals
that we would reduce the number of overtime hours by 30% and
increase the days of paid vacation taken by 30%, compared with
fiscal 2016 actual levels, by the end of fiscal 2020. Measures to
achieve these goals include a paid time leave system (scheduled
for introduction in fiscal 2018), examining our operations, com-
plete lights-out and a PC shutdown at Headquarters at 10 p.m.
By achieving these goals, we will become “a company in which
diversified human resources gather and can prove their merits
according to their capabilities”.
FY 2016 Actual (A)
end of FY 2020 target (B)
Difference (B)-(A)
Overtime hours 24.6 hr.s/month 17 hr.s/monthApprox. (8) hr.s/month
Days of paid vacation taken
15.4 days/year 20 days/yearApprox. 5 days/year
Changes in total Actual Working Hours and Paid Vacation taken (J-PoWeR)(Hours) (Days)
2,000
2,100
0
2,200
0
17
15
13
201620152014
Total actual working hours ● Days of paid vacation taken
(FY)
overview of the Childcare and nursing Care support Programs and Results in Fiscal 2016 (J-PoWeR Group)
Childcare Programs
Nursing Program Caring for Elderly Family Members
6 weeksbeforedelivery
8 weeksafter delivery
Delivery 1 year old 1.5yearsold
3yearsold
Enterelementaryschool
End of Marchof third yearof elementaryschool
Shortened working hours/leave, etc. for regular exams during pregnancy
Reserved paid vacation (Attending delivery (for spouses), childcare, outpatient infertility treatments)
Childcare hours(2 times/day
for 30 minutes)
Voluntary J-POWER Group programLegally required
Child nursing care leave(5 days/year for one child, 10 days/year for two or more children)
Leave taken by43 women and 72 men
Maternity leave* Three days when spouse is
giving birth
Leave taken by10 women and 99 men
Leave taken by27 women and 15 menChildcare leave
Shortened working hoursfor childcare
Program used by 38 women and 1 man
Elderly family member care leave: 365 days/person(including the legally required 93 days)
Shortened working hoursfor elderly family member care: 2 years/person(including the legally required 93 days)
Legally required(93 days) Program used by
3 men
Leave taken by2 women
Leave for elderly family member care:5 days/year for one family member, 10 days/year for two or more family members
Leave taken by21 women and 44 men
“Platinum Kurumin” special Certification Mark
Certified by the Minister for Health, Labour and Welfare as a
supportive company for childcare, J-POWER received a
“Kurumin” certification. We also received the special “Platinum
Kurumin” mark certification, which is awarded only to compa-
nies with measures that have met an even higher standard. We
will continue making improvements for an even better work
environment so that all employees will be able to harmonize
their work and their personal life, and exercise their abilities fully.
Consultation Desk
Aiming for building a work-friendly environment in the work-
place, we have established a consultation desk where employees
can discuss working hours, the workplace environment, sexual
harassment, and power harassment. In order to prevent harass-
ment, we have also developed Company regulations, manuals,
and other such resources, and we are implementing education for
increased awareness in level-specific training courses, posters, and
other such measures. Our goal is a working environment where
human rights and individuality are respected and where diverse
personnel are completely at ease in going about their work.
48
SSocial
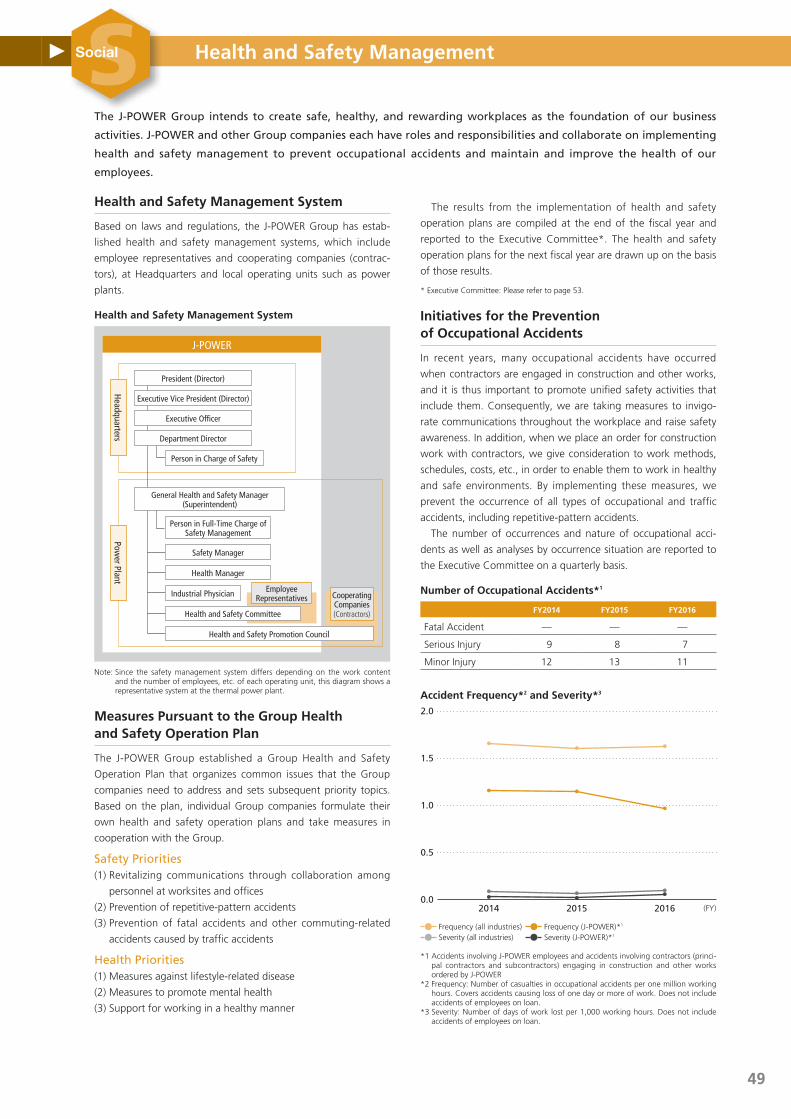
Respect for Human Resources
The J-POWER Group intends to create safe, healthy, and rewarding workplaces as the foundation of our business
activities. J-POWER and other Group companies each have roles and responsibilities and collaborate on implementing
health and safety management to prevent occupational accidents and maintain and improve the health of our
employees.
Health and safety Management system
Based on laws and regulations, the J-POWER Group has estab-
lished health and safety management systems, which include
employee representatives and cooperating companies (contrac-
tors), at Headquarters and local operating units such as power
plants.
Health and safety Management system
Note: Since the safety management system differs depending on the work content and the number of employees, etc. of each operating unit, this diagram shows a representative system at the thermal power plant.
Measures Pursuant to the Group Health and safety operation Plan
The J-POWER Group established a Group Health and Safety
Operation Plan that organizes common issues that the Group
companies need to address and sets subsequent priority topics.
Based on the plan, individual Group companies formulate their
own health and safety operation plans and take measures in
cooperation with the Group.
Safety Priorities(1) Revitalizing communications through collaboration among
personnel at worksites and offices
(2) Prevention of repetitive-pattern accidents
(3) Prevention of fatal accidents and other commuting-related
accidents caused by traffic accidents
Health Priorities(1) Measures against lifestyle-related disease
(2) Measures to promote mental health
(3) Support for working in a healthy manner
The results from the implementation of health and safety
operation plans are compiled at the end of the fiscal year and
reported to the Executive Committee*. The health and safety
operation plans for the next fiscal year are drawn up on the basis
of those results.
* Executive Committee: Please refer to page 53.
Initiatives for the Prevention of occupational Accidents
In recent years, many occupational accidents have occurred
when contractors are engaged in construction and other works,
and it is thus important to promote unified safety activities that
include them. Consequently, we are taking measures to invigo-
rate communications throughout the workplace and raise safety
awareness. In addition, when we place an order for construction
work with contractors, we give consideration to work methods,
schedules, costs, etc., in order to enable them to work in healthy
and safe environments. By implementing these measures, we
prevent the occurrence of all types of occupational and traffic
accidents, including repetitive-pattern accidents.
The number of occurrences and nature of occupational acci-
dents as well as analyses by occurrence situation are reported to
the Executive Committee on a quarterly basis.
number of occupational Accidents*1
FY2014 FY2015 FY2016
Fatal Accident — — —
Serious Injury 9 8 7
Minor Injury 12 13 11
Accident Frequency*2 and severity*3
1.0
1.5
0.5
0.0
2.0
201620152014
Frequency (all industries) Frequency (J-POWER)*1
(FY)
Severity (all industries) Severity (J-POWER)*1
*1 Accidents involving J-POWER employees and accidents involving contractors (princi-pal contractors and subcontractors) engaging in construction and other works ordered by J-POWER
*2 Frequency: Number of casualties in occupational accidents per one million working hours. Covers accidents causing loss of one day or more of work. Does not include accidents of employees on loan.
*3 Severity: Number of days of work lost per 1,000 working hours. Does not include accidents of employees on loan.
Health and safety Management
HeadquartersPow
er Plant
President (Director)
General Health and Safety Manager (Superintendent)
Executive Vice President (Director)
Executive Officer
Department Director
Person in Charge of Safety
J-POWER
Employee Representatives Cooperating
Companies (Contractors)
Health and Safety Promotion Council
Person in Full-Time Charge of Safety Management
Safety Manager
Health Manager
Industrial Physician
Health and Safety Committee
49
SSocial
Health and safety Management
Health and safety training Programs
J-POWER Headquarters implements safety training for Group
companies at head offices and local operating units for the pur-
pose of improving the health and safety levels of the entire
J-POWER Group. In addition, local operating units themselves
implement safety training suitable for their business operations,
such as training for new hires and transferring employees
required by regulations, special training for work involving elec-
tricity, and training for related laws and regulations.
Management-level employees such as superintendents and the
staff members in full-time charge of safety are made to partici-
pate in seminars and courses held by external organizations in
order to improve their health and safety knowledge and man-
agement skills and to raise safety awareness. In fiscal 2016, 865
people participated in those training programs that were held by
J-POWER Headquarters.
Health and safety Management with Regard to Radiation
J-POWER is currently proceeding with construction of the Ohma
Nuclear Power Plant. Currently, construction work is still under
way, and there is no danger of employees and workers being
affected by radiation, but we will have established our health
and safety management system related to radiation by the time
that becomes necessary.
Maintaining the Physical and Mental Health of employees and their Families
To maintain and improve the health of employees and their fami-
lies, we make them have health checks and health maintenance
guidance, and take infectious disease prevention measures. In
addition, we place priority on the prevention of lifestyle-related
disease and mental health disorders. Therefore, we are providing
special health checks, designated health guidance, and health
maintenance and improvement activities*, as well as continuing
the stress check programs. By taking these measures, we support
good physical and mental health of employees and their families.
* Health maintenance and improvement activities: Comprehensive activities which integrate activities aimed at total health, both physical and mental, based on Ministry of Health, Labour and Welfare guidelines on Total Health Promotion Plans (THP), and activities aimed at fostering a vibrant environment through the Company’s unique communication revitalization initiative.
Certified as “White 500” Health and Productivity outstanding Company
J-POWER was recognized as a 2017 Certified Health and
Productivity Outstanding Company, which practices excellent
good health and productivity, under the large enterprise category
(White 500) by the Ministry of Economy, Trade and Industry and
the Nippon Kenko Kaigi (Japan health conference). We consider
that this certification is based on assessments of our efforts in
health activities that emphasize preventive measures against
“lifestyle-related illness/metabolic syndrome” and “mental health
disorders.” We will work to increasingly promote the health of
our employees in the years to come.
Basic Policy on Occupational Health and Safety
The Company aims to create safe, healthy, and rewarding workplaces for the J-POWER Group. The Company and general directors of operating units fully play their part in establishing and operating a robust occupational health and safety management system with cooperation of employees and all concerned, and in remaining in compliance with laws and regulations, and self- defined rules. We also work to promote overall safety management and improve the health and safety standards of the J-POWER Group. Through taking these measures, we prevent occupational accidents, and maintain and promote health.
Creating Rewarding WorkplacesThe Company works to create rewarding workplaces that enable each and every J-POWER Group employee to realize health and self-fulfillment by ensuring, maintaining, and improving workplaces that are safe and comfort-able to work.
Compliance with Rules, Including Laws and RegulationsThe Company complies with external and internal rules, including the rele-vant laws, regulations, and Company regulations, and endeavors to prevent occupational accidents as well as maintain and promote health in the J-POWER Group.
Improvement of Health and Safety ManagementThe Company and general directors of operating units establish and operate a systematic, efficient occupational health and safety management system through supervising safety managers, health managers, and those in charge of safety at the operating units, and gaining the cooperation of employees and all others concerned, and thus work to improve the level of health and safety in the J-POWER Group.
Responsibilities of ManagementThe Company and general directors of operating units recognize their respon-sibility for realization of this basic policy, and take the initiative and set an example for those that follow, as well as keep the relevant parties thoroughly informed of this basic policy. When a situation arises that runs contrary to this aim, the Company and the general directors of operating units themselves will take the initiative to solve the problem while working for investigating the cause and preventing a recurrence, and clarify its root cause and take appropriate measures.
50
SSocial

Health and safety Management
“We pursue harmony with the environment, and thrive in the trust of communities where we live and work.”“We
regard profits as the source of our growth, and share the fruits with the society.” Under this Corporate Philosophy,
the J-POWER Group actively participates in social contribution activities and contributes to social development as a
good corporate citizen. Our activities include support for culture and the arts, cooperation with local communities,
support for participation in volunteer activities, and contributions to the international community.
Specifically, as we place community involvement and harmonizing energy supply with the environment as two main
themes for our activities, we place high value on communicating with, sharing knowledge with, and learning with
local community members and people working to harmonize energy supply with the environment. We are steadily
engaging in activities on this basis as well as supporting the volunteer activities of our employees.
Records of social Contribution Activities
For our social contribution activities in fiscal 2016, we implemented a variety of initiatives that included the following programs.
Program Outline Target Collaborative groupNumber of
participants, etc.
Eco×Ene Experience Tour (Hydroelectric Power Part)
In collaboration with experts who can impart information on the natural environ-ment, we organized hands-on study tours on which visitors experience the power sta-tion and nature with their five senses, notice the connection between energy and the environment that support people’s live-lihoods, and have a fun time while learning with each other.
Children from elementary schools with their parents
KEEP, Inc. (Public Interest Incorporated Foundation)Forum for Environmental
Symbiosis in Shirakawa-Go (NPO)
63 family groups of parents and
children
Stamp Counting Volunteer Experience Event
We organized volunteer experience events in support of an NGO that is active in try-ing to create a world without hunger. Opportunities to experience volunteer work such as counting and sorting unused stamps are provided in the events.
J-POWER Group employees
Hunger Free World (NGO) Six times/year
Workplace Experience Learning for a Local Junior High School in Hyogo Prefecture
At Takasago Thermal Power Station, we accepted junior high school students for workplace experience learning during “Give It a Try Week.” We incorporated a variety of business experiences so that the students gain a real sense of the varied kinds of work at the power station including jobs indirectly related to power generation.
Second-year students from
Takasago Municipal Shoyo Junior High
School
— 6
Coral Watching in Kochi Prefecture
We support an elementary school triathlon tournament held in the town of Nahari in the Nahari River basin, where we conduct hydroelectric power generation. In 2016, to enliven the event, we invited the children who took part to observe the coral living in the nearby sea. They benefited from the opportunity to think about the connection between the forest and the river that nur-tures the sea through seeing the coral from a sightseeing boat.
Participants in the kids’ triathlon
(elementary school pupils)
— 60
support for Volunteer Activities
To support employees’ volunteer activities, we maintain an envi-
ronment, including a volunteer leave of absence system, in
which employees conduct volunteer activities.
Respect for Human Rights
Believing that it is important to respect human rights in our busi-
ness activities, we incorporate human rights training in employee
training programs, as well as provide human rights training in
accordance with the needs of local business units.
Contribution to society
51
SSocial
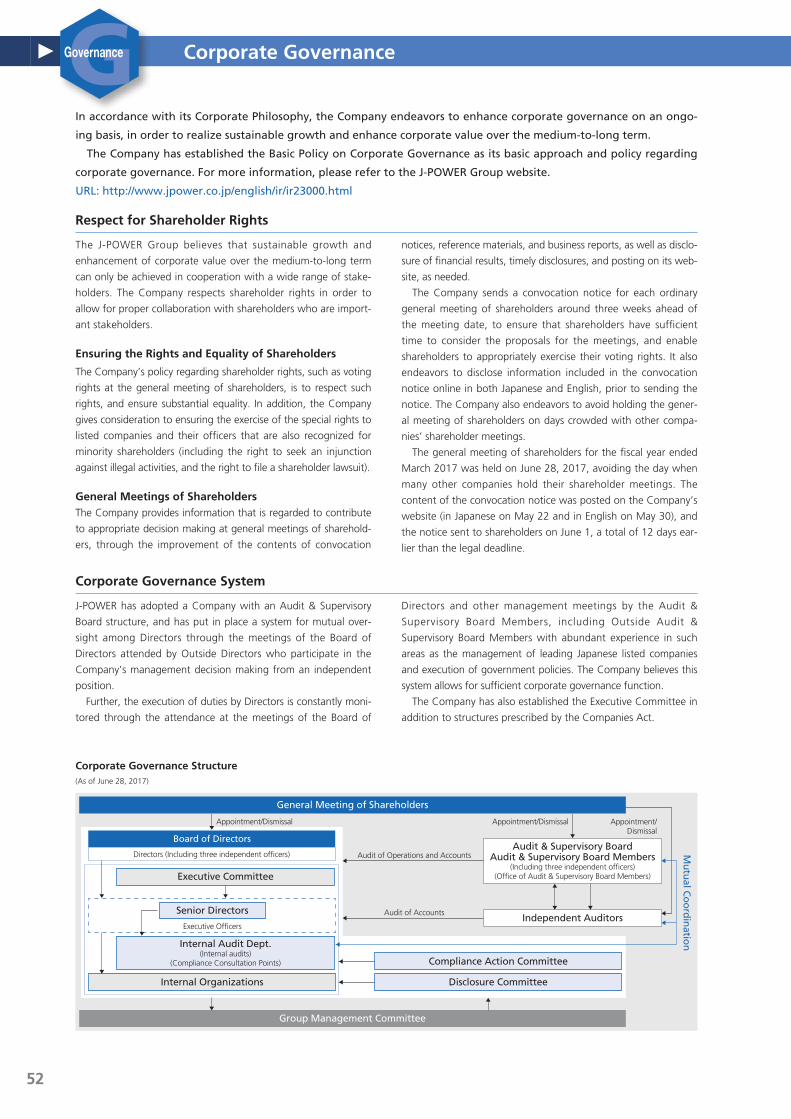
Corporate Governance
In accordance with its Corporate Philosophy, the Company endeavors to enhance corporate governance on an ongo-
ing basis, in order to realize sustainable growth and enhance corporate value over the medium-to-long term.
The Company has established the Basic Policy on Corporate Governance as its basic approach and policy regarding
corporate governance. For more information, please refer to the J-POWER Group website.
URL: http://www.jpower.co.jp/english/ir/ir23000.html
Respect for shareholder Rights
The J-POWER Group believes that sustainable growth and
enhancement of corporate value over the medium-to-long term
can only be achieved in cooperation with a wide range of stake-
holders. The Company respects shareholder rights in order to
allow for proper collaboration with shareholders who are import-
ant stakeholders.
ensuring the Rights and equality of shareholders
The Company’s policy regarding shareholder rights, such as voting
rights at the general meeting of shareholders, is to respect such
rights, and ensure substantial equality. In addition, the Company
gives consideration to ensuring the exercise of the special rights to
listed companies and their officers that are also recognized for
minority shareholders (including the right to seek an injunction
against illegal activities, and the right to file a shareholder lawsuit).
General Meetings of shareholdersThe Company provides information that is regarded to contribute
to appropriate decision making at general meetings of sharehold-
ers, through the improvement of the contents of convocation
notices, reference materials, and business reports, as well as disclo-
sure of financial results, timely disclosures, and posting on its web-
site, as needed.
The Company sends a convocation notice for each ordinary
general meeting of shareholders around three weeks ahead of
the meeting date, to ensure that shareholders have sufficient
time to consider the proposals for the meetings, and enable
shareholders to appropriately exercise their voting rights. It also
endeavors to disclose information included in the convocation
notice online in both Japanese and English, prior to sending the
notice. The Company also endeavors to avoid holding the gener-
al meeting of shareholders on days crowded with other compa-
nies’ shareholder meetings.
The general meeting of shareholders for the fiscal year ended
March 2017 was held on June 28, 2017, avoiding the day when
many other companies hold their shareholder meetings. The
content of the convocation notice was posted on the Company’s
website (in Japanese on May 22 and in English on May 30), and
the notice sent to shareholders on June 1, a total of 12 days ear-
lier than the legal deadline.
Corporate Governance system
J-POWER has adopted a Company with an Audit & Supervisory
Board structure, and has put in place a system for mutual over-
sight among Directors through the meetings of the Board of
Directors attended by Outside Directors who participate in the
Company’s management decision making from an independent
position.
Further, the execution of duties by Directors is constantly moni-
tored through the attendance at the meetings of the Board of
Directors and other management meetings by the Audit &
Supervisory Board Members, including Outside Audit &
Supervisory Board Members with abundant experience in such
areas as the management of leading Japanese listed companies
and execution of government policies. The Company believes this
system allows for sufficient corporate governance function.
The Company has also established the Executive Committee in
addition to structures prescribed by the Companies Act.
Appointment/Dismissal
Appointment/DismissalAppointment/Dismissal
Executive Committee
Internal Audit Dept.(Internal audits)
(Compliance Consultation Points)
Audit & Supervisory Board Audit & Supervisory Board Members
(Including three independent officers) (Office of Audit & Supervisory Board Members)
Audit of Operations and Accounts
Audit of AccountsIndependent Auditors
Mu
tual C
oo
rdin
ation
Group Management Committee
Board of Directors
Internal Organizations
Executive Officers
Directors (Including three independent officers)
Senior Directors
Disclosure Committee
Compliance Action Committee
General Meeting of Shareholders
Corporate Governance structure(As of June 28, 2017)
52
GGovernanceGGovernance

Corporate Governance
Composition of the Board of Directors and the Audit & supervisory Board
Composition of the Board of DirectorsThe Board of Directors is composed of Directors with abundant experi-
ence, distinguished knowledge, and advanced specialization, ensuring
that a balance and diversity of knowledge, experience, and abilities is
maintained as a whole. The number of Directors is 14 or less.
In addition, in order to ensure the effectiveness of independent and
objective management supervision by the Board of Directors, the
Company endeavors to appoint at least 2 Independent Outside
Directors, considering their experience, knowledge, specialization, and
other attributes.
Currently, the total number of Directors is 14, including 3
Independent Outside Directors.
Composition of the Audit & Supervisory BoardThe Audit & Supervisory Board comprises a maximum of 5 Audit &
Supervisory Board Members, at least half of whom are Outside Audit &
Supervisory Board Members. In addition, at least 1 person with appro-
priate knowledge of finance and accounting is appointed as an Audit &
Supervisory Board Member.*
Currently, the total number of the Audit & Supervisory Board
Members is 5, including 3 Independent Outside Audit & Supervisory
Board Members.
* Senior Audit & Supervisory Board Member Hiroshi Fujioka (Independent Outside Audit & Supervisory Board Member) has a high level of knowledge in the area of finance and accounting as he has had long experience in the administration of fiscal and financial issues, etc.
system for the execution of Directors’ Duties
Ensuring Effectiveness in Business ExecutionThe Board of Directors meets monthly in principle*1 and on an as-need-
ed basis, with attendance by all Directors and Audit & Supervisory Board
Members, including Outside Directors and Outside Audit & Supervisory
Board Members. The Executive Committee meets weekly in principle,
with attendance by all Senior Directors*2, Executive Managing Officers,
and full-time Audit & Supervisory Board Members. This committee dis-
cusses matters subject to deliberation by the Board of Directors, signifi-
cant company-wide matters related to business execution by the
President and Executive Vice Presidents based on policies decided by the
Board of Directors, and important matters related to individual business
execution.
In addition to allocating functions for the Board of Directors and
Executive Committee, the Company has established a system in which
Senior Directors and Executive Officers share responsibility for business
execution. This system clarifies responsibilities and authority, enables
appropriate and prompt decision making, and provides for efficient cor-
porate management.
*1 The Board of Directors met 12 times during fiscal 2016.*2 Senior Directors: Chairman, President, and Executive Vice Presidents
Ensuring Appropriateness in Business ExecutionThe Company has established the Internal Audit Department to ensure
proper business execution, which conducts internal audits from a perspec-
tive that is independent of other operating units. In addition, each operat-
ing unit regularly conducts self-audits of its own business execution.
Preventing Conflicts of InterestThe Directors of the Company, in accordance with its Corporate
Philosophy, Corporate Conduct Rules, and Compliance Action
Guidelines*1, exemplify honest and fair conduct based on a spirit of
compliance and business ethics. In addition, the Company works to pre-
vent conflicts of interest in the event that the Company engages in a
transaction with one of its Directors, etc.,*2 by obtaining the approval of
the Board of Directors before the transaction, and reports the results to
the Board of Directors.
*1 Please refer to page 58 for further information on the Corporate Conduct Rules and Compliance Action Guidelines.
*2 Directors or major shareholders (shareholders with shares representing 10% or more of the voting rights in the Company)
Audits by Audit & supervisory Board Members
In accordance with the Companies Act, J-POWER appoints Audit &
Supervisory Board Members, who audit the legality and appropriateness
of Directors’ business execution. At J-POWER’s Headquarters, Audit &
Supervisory Board Members conduct audits by attending the meetings
of the Board of Directors and other important meetings and observing
the status of the execution of Directors’ and Executive Officers’ duties.
In addition, the Audit & Supervisory Board Members perform site visits
to local operating units and subsidiaries in Japan and overseas.
In the course of accounting audits, Audit & Supervisory Board
Members liaise with the Independent Auditors to regularly receive
reports and exchange opinions regarding auditing schedules and results
as a means of ensuring consistency with the Independent Auditors’
auditing methods and results.
When performing audits, Audit & Supervisory Board Members liaise
with the Internal Audit Department.
With regard to staff under the Audit & Supervisory Board Members,
the Company has established the Office of Audit & Supervisory Board
Members as an independent unit outside of the Directors’ chain of com-
mand. The office’s full-time specialist staff assist the Audit & Supervisory
Board Members in the course of their audits.
Group Governance
With regard to the administration of subsidiaries and affiliates, the
J-POWER Group’s basic policy calls for Group-wide business development
in accordance with the Group’s management plan. The administration of
subsidiaries and affiliates is undertaken in accordance with the Company’s
internal regulations, and the Group Management Committee works to
improve the appropriateness of operations for the entire corporate Group.
In addition, the Audit & Supervisory Board Members and the Internal
Audit Department implement audits of subsidiaries and affiliates with the
objective of ensuring proper operations at all Group companies.
evaluation of effectiveness of the Board of Directors
The Company annually analyzes and evaluates the effectiveness of the
Board of Directors to improve its effectiveness, as well as to realize sustain-
able growth and enhance corporate value over the medium-to-long term.
Regarding the evaluation in 2017, the Board of Directors discussed the
matter based on the status of measures implemented based on the previ-
ous year’s analysis and evaluation, and interviews conducted mainly with
Outside Directors and Outside Audit & Supervisory Board Members, and
the chairs of the Board of Directors and Audit & Supervisory Board. As a
result of the discussion, the Company determined the effectiveness of the
Board of Directors to be sufficient. Going forward, the Company will fur-
ther expand the scope of deliberation based on changes in the business
environment, and make continual efforts to enhance the effectiveness of
the Board of Directors.
53
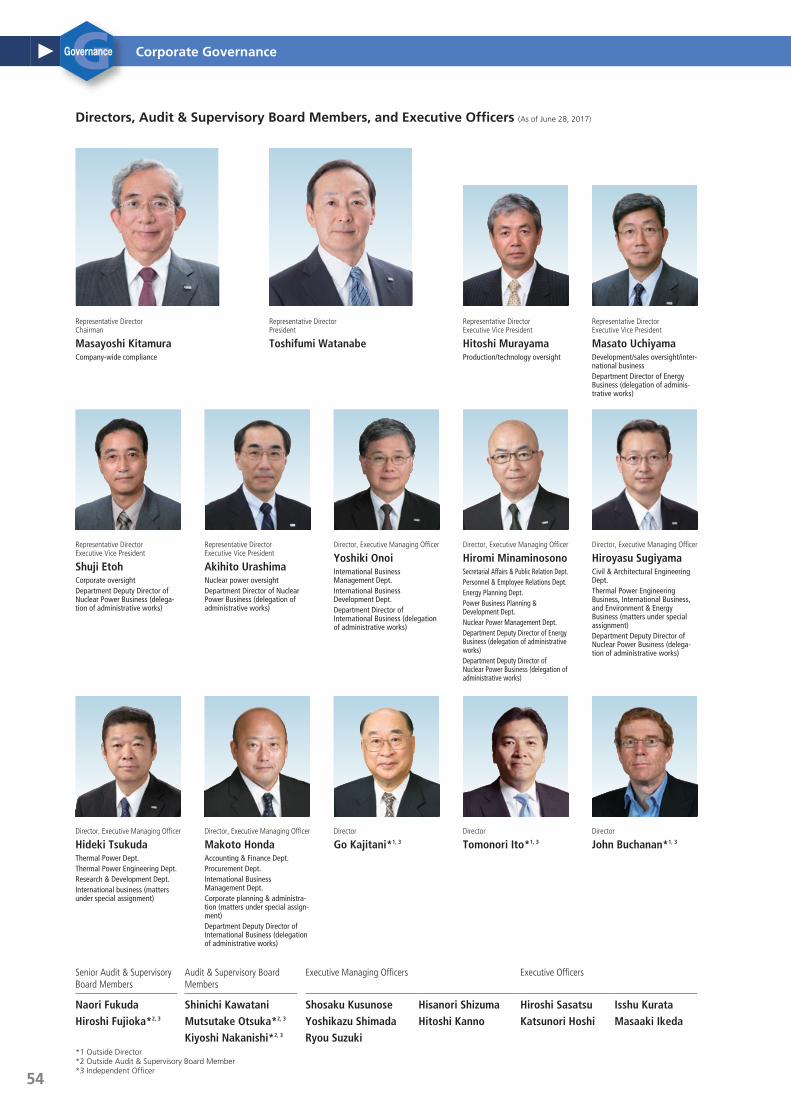
Corporate Governance
Senior Audit & Supervisory Board Members
Audit & Supervisory Board Members
Executive Managing Officers Executive Officers
Naori FukudaHiroshi Fujioka*2, 3
Shinichi KawataniMutsutake Otsuka*2, 3
Kiyoshi Nakanishi*2, 3
Shosaku KusunoseYoshikazu ShimadaRyou Suzuki
Hisanori ShizumaHitoshi Kanno
Hiroshi SasatsuKatsunori Hoshi
Isshu KurataMasaaki Ikeda
*1 Outside Director*2 Outside Audit & Supervisory Board Member*3 Independent Officer
Representative Director Chairman
Masayoshi KitamuraCompany-wide compliance
Representative Director President
Toshifumi Watanabe
Representative Director Executive Vice President
Hitoshi MurayamaProduction/technology oversight
Representative Director Executive Vice President
Masato UchiyamaDevelopment/sales oversight/inter-national businessDepartment Director of Energy Business (delegation of adminis-trative works)
Directors, Audit & supervisory Board Members, and executive officers (As of June 28, 2017)
Representative Director Executive Vice President
Shuji EtohCorporate oversightDepartment Deputy Director of Nuclear Power Business (delega-tion of administrative works)
Representative Director Executive Vice President
Akihito UrashimaNuclear power oversightDepartment Director of Nuclear Power Business (delegation of administrative works)
Director, Executive Managing Officer
Yoshiki OnoiInternational Business Management Dept.International Business Development Dept.Department Director of International Business (delegation of administrative works)
Director, Executive Managing Officer
Hiromi MinaminosonoSecretarial Affairs & Public Relation Dept.Personnel & Employee Relations Dept.Energy Planning Dept.Power Business Planning & Development Dept.Nuclear Power Management Dept.Department Deputy Director of Energy Business (delegation of administrative works)Department Deputy Director of Nuclear Power Business (delegation of administrative works)
Director, Executive Managing Officer
Hiroyasu SugiyamaCivil & Architectural Engineering Dept.Thermal Power Engineering Business, International Business, and Environment & Energy Business (matters under special assignment)Department Deputy Director of Nuclear Power Business (delega-tion of administrative works)
Director, Executive Managing Officer
Hideki TsukudaThermal Power Dept.Thermal Power Engineering Dept.Research & Development Dept.International business (matters under special assignment)
Director, Executive Managing Officer
Makoto HondaAccounting & Finance Dept.Procurement Dept.International Business Management Dept.Corporate planning & administra-tion (matters under special assign-ment)Department Deputy Director of International Business (delegation of administrative works)
Director
Go Kajitani*1, 3
Director
Tomonori Ito*1, 3
Director
John Buchanan*1, 3
54
GGovernance
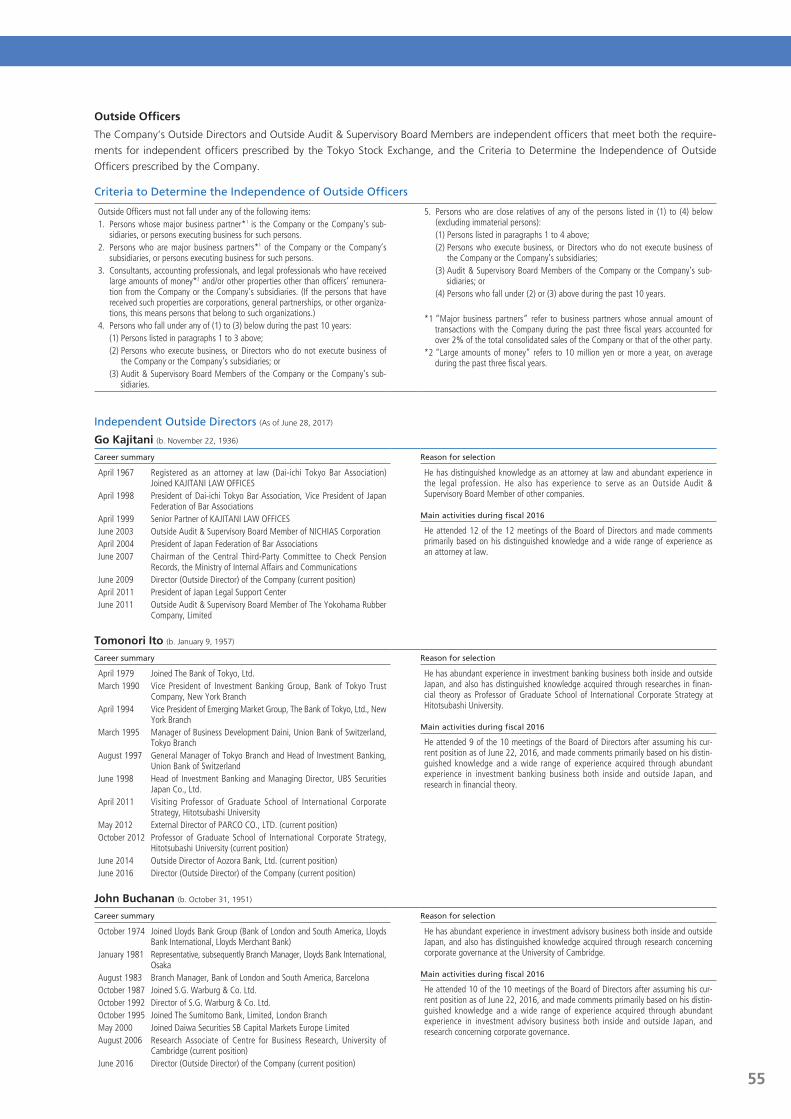
Corporate Governance
outside officers
The Company’s Outside Directors and Outside Audit & Supervisory Board Members are independent officers that meet both the require-
ments for independent officers prescribed by the Tokyo Stock Exchange, and the Criteria to Determine the Independence of Outside
Officers prescribed by the Company.
Criteria to Determine the Independence of Outside Officers
Outside Officers must not fall under any of the following items:1. Persons whose major business partner*1 is the Company or the Company’s sub-
sidiaries, or persons executing business for such persons.2. Persons who are major business partners*1 of the Company or the Company’s
subsidiaries, or persons executing business for such persons.3. Consultants, accounting professionals, and legal professionals who have received
large amounts of money*2 and/or other properties other than officers’ remunera-tion from the Company or the Company’s subsidiaries. (If the persons that have received such properties are corporations, general partnerships, or other organiza-tions, this means persons that belong to such organizations.)
4. Persons who fall under any of (1) to (3) below during the past 10 years:(1) Persons listed in paragraphs 1 to 3 above;(2) Persons who execute business, or Directors who do not execute business of
the Company or the Company’s subsidiaries; or(3) Audit & Supervisory Board Members of the Company or the Company’s sub-
sidiaries.
5. Persons who are close relatives of any of the persons listed in (1) to (4) below (excluding immaterial persons):(1) Persons listed in paragraphs 1 to 4 above;(2) Persons who execute business, or Directors who do not execute business of
the Company or the Company’s subsidiaries;(3) Audit & Supervisory Board Members of the Company or the Company’s sub-
sidiaries; or(4) Persons who fall under (2) or (3) above during the past 10 years.
*1 “Major business partners” refer to business partners whose annual amount of transactions with the Company during the past three fiscal years accounted for over 2% of the total consolidated sales of the Company or that of the other party.
*2 “Large amounts of money” refers to 10 million yen or more a year, on average during the past three fiscal years.
Independent Outside Directors (As of June 28, 2017)
Go Kajitani (b. November 22, 1936)
Career summary Reason for selection
April 1967 Registered as an attorney at law (Dai-ichi Tokyo Bar Association) Joined KAJITANI LAW OFFICES
April 1998 President of Dai-ichi Tokyo Bar Association, Vice President of Japan Federation of Bar Associations
April 1999 Senior Partner of KAJITANI LAW OFFICESJune 2003 Outside Audit & Supervisory Board Member of NICHIAS CorporationApril 2004 President of Japan Federation of Bar AssociationsJune 2007 Chairman of the Central Third-Party Committee to Check Pension
Records, the Ministry of Internal Affairs and CommunicationsJune 2009 Director (Outside Director) of the Company (current position)April 2011 President of Japan Legal Support CenterJune 2011 Outside Audit & Supervisory Board Member of The Yokohama Rubber
Company, Limited
He has distinguished knowledge as an attorney at law and abundant experience in the legal profession. He also has experience to serve as an Outside Audit & Supervisory Board Member of other companies.
Main activities during fiscal 2016
He attended 12 of the 12 meetings of the Board of Directors and made comments primarily based on his distinguished knowledge and a wide range of experience as an attorney at law.
tomonori Ito (b. January 9, 1957)
Career summary Reason for selection
April 1979 Joined The Bank of Tokyo, Ltd.March 1990 Vice President of Investment Banking Group, Bank of Tokyo Trust
Company, New York BranchApril 1994 Vice President of Emerging Market Group, The Bank of Tokyo, Ltd., New
York BranchMarch 1995 Manager of Business Development Daini, Union Bank of Switzerland,
Tokyo BranchAugust 1997 General Manager of Tokyo Branch and Head of Investment Banking,
Union Bank of SwitzerlandJune 1998 Head of Investment Banking and Managing Director, UBS Securities
Japan Co., Ltd.April 2011 Visiting Professor of Graduate School of International Corporate
Strategy, Hitotsubashi UniversityMay 2012 External Director of PARCO CO., LTD. (current position)October 2012 Professor of Graduate School of International Corporate Strategy,
Hitotsubashi University (current position)June 2014 Outside Director of Aozora Bank, Ltd. (current position)June 2016 Director (Outside Director) of the Company (current position)
He has abundant experience in investment banking business both inside and outside Japan, and also has distinguished knowledge acquired through researches in finan-cial theory as Professor of Graduate School of International Corporate Strategy at Hitotsubashi University.
Main activities during fiscal 2016
He attended 9 of the 10 meetings of the Board of Directors after assuming his cur-rent position as of June 22, 2016, and made comments primarily based on his distin-guished knowledge and a wide range of experience acquired through abundant experience in investment banking business both inside and outside Japan, and research in financial theory.
John Buchanan (b. October 31, 1951)
Career summary Reason for selection
October 1974 Joined Lloyds Bank Group (Bank of London and South America, Lloyds Bank International, Lloyds Merchant Bank)
January 1981 Representative, subsequently Branch Manager, Lloyds Bank International, Osaka
August 1983 Branch Manager, Bank of London and South America, BarcelonaOctober 1987 Joined S.G. Warburg & Co. Ltd.October 1992 Director of S.G. Warburg & Co. Ltd.October 1995 Joined The Sumitomo Bank, Limited, London BranchMay 2000 Joined Daiwa Securities SB Capital Markets Europe LimitedAugust 2006 Research Associate of Centre for Business Research, University of
Cambridge (current position)June 2016 Director (Outside Director) of the Company (current position)
He has abundant experience in investment advisory business both inside and outside Japan, and also has distinguished knowledge acquired through research concerning corporate governance at the University of Cambridge.
Main activities during fiscal 2016
He attended 10 of the 10 meetings of the Board of Directors after assuming his cur-rent position as of June 22, 2016, and made comments primarily based on his distin-guished knowledge and a wide range of experience acquired through abundant experience in investment advisory business both inside and outside Japan, and research concerning corporate governance.
55
Corporate Governance
Independent Outside Audit & Supervisory Board Members (As of June 28, 2017)
Hiroshi Fujioka (b. June 2, 1954)
Career summary
April 1977 Joined the Ministry of FinanceJuly 2008 Director-General of Customs and Tariff Bureau, the Ministry of FinanceJuly 2009 Director-General for Policy Planning, the Ministry of Land, Infrastructure,
Transport and TourismJanuary 2012 Senior Executive Vice President of Japan Housing Finance Agency
(Incorporated Administrative Agency)January 2014 Councilor of the Minister’s Secretariat, the Ministry of FinanceJune 2014 Audit & Supervisory Board Member (Outside Audit & Supervisory
Board Member) of the CompanyJune 2015 Senior Audit & Supervisory Board Member (Outside Audit &
Supervisory Board Member) of the Company (current position)June 2016 Outside Corporate Auditor of the Nishi-Nippon City Bank, Ltd.
October 2016 Audit Committee Member (Outside Director) of the Nishi-Nippon City Bank, Ltd. (current position)
Reason for selection
He has distinguished knowledge and abundant experience acquired through working in the administration for a long time, and can be expected to enhance the Company’s management oversight system.
Main activities during fiscal 2016
He attended 12 of the 12 meetings of the Board of Directors and 12 of the 12 meet-ings of the Audit & Supervisory Board, and made comments primarily based on his distinguished knowledge and a wide range of experience in the administration of fis-cal and financial issues, etc.
Mutsutake otsuka (b. January 5, 1943)
Career summary
April 1965 Joined Japanese National RailwaysApril 1987 Joined East Japan Railway Company, General Manager of Finance
DepartmentJune 1990 Director and General Manager of Personnel Department of East
Japan Railway CompanyJune 1992 Executive Director and General Manager of Personnel Department of
East Japan Railway CompanyJune 1997 Executive Vice President and Representative Director and Director
General of Corporate Planning Headquarters of East Japan Railway Company
June 2000 President and Representative Director of East Japan Railway CompanyApril 2006 Chairman and Director of East Japan Railway CompanyApril 2007 Temporary Audit & Supervisory Board Member (Outside Audit &
Supervisory Board Member) of the CompanyJune 2007 Audit & Supervisory Board Member (Outside Audit & Supervisory
Board Member) of the Company (current position)
May 2011 Vice Chairman of Nippon KeidanrenApril 2012 Advisor of East Japan Railway Company (current position)June 2013 Outside Director of JX Holdings, Inc. (currently JXTG Holdings, Inc.)
(current position)June 2014 Outside Director of NIPPON STEEL & SUMITOMO METAL CORPORATION
(current position)
Reason for selection
He has distinguished knowledge and abundant experience as a director of a listed company, and can be expected to contribute to observe the Company’s management intensively.
Main activities during fiscal 2016
He attended 12 of the 12 meetings of the Board of Directors and 12 of the 12 meet-ings of the Audit & Supervisory Board and made comments primarily based on his distinguished knowledge and a wide range of experience in the management of a listed company.
Kiyoshi nakanishi (b. April 2, 1945)
Career summary Reason for selection
April 1970 Joined Toyota Motor Co., Ltd.January 1997 General Manager of No. 3 Engine Technical Department of No. 4
Development Center of TOYOTA MOTOR CORPORATIONJune 2000 Director of TOYOTA MOTOR CORPORATIONJune 2003 Managing Officer of TOYOTA MOTOR CORPORATIONJune 2004 Adviser of TOYOTA MOTOR CORPORATIONJune 2004 Representative Director of GENESIS RESEARCH INSTITUTE, INC.June 2010 Adviser of GENESIS RESEARCH INSTITUTE, INC. (current position)June 2010 Adviser of Toyota Central R&D Labs, Inc.June 2010 Audit & Supervisory Board Member of TOYOTA TECHNOCRAFT Co.,
LTD. (current position)June 2011 Audit & Supervisory Board Member (Outside Audit & Supervisory
Board Member) of the Company (current position)
He has distinguished knowledge and abundant experience as a director of a listed company, and can be expected to contribute to observe the Company’s management intensively.
Main activities during fiscal 2016
He attended 12 of the 12 meetings of the Board of Directors and 12 of the 12 meet-ings of the Audit & Supervisory Board and made comments primarily based on his distinguished knowledge and a wide range of experience in the management of a listed company.
Directors’ and Audit & supervisory Board Members’ Remuneration
By resolution at the 54th Ordinary General Meeting of Shareholders
held on June 28, 2006, total remuneration for Directors was capped at
¥625 million annually (a fixed monthly salary calculated according to
position and a performance-linked bonus paid once a year. Employee
salaries for Directors who serve in dual capacity as employees are
excluded). Directors’ remuneration is determined, within the cap pre-
scribed above, by means of discussion at meetings of the Board of
Directors, after comprehensively taking into account corporate perfor-
mances, his or her position, and other factors, in the light of the char-
acteristics of the Company’s business, namely, aiming to recover
investment through the long-term operation of power plants, etc.
Total remuneration for Audit & Supervisory Board Members was
capped at ¥120 million annually (a fixed monthly salary calculated
according to position) at the same general meeting of shareholders.
Audit & Supervisory Board Members’ remuneration is determined,
within the cap prescribed above, by means of consultation among
Audit & Supervisory Board Members.
Remuneration Paid during Fiscal 2016
Category number of Persons total Amount
Directors (Outside Directors)
16(3)
¥438 million(¥24 million)
Audit & Supervisory Board Members (Outside Audit & Supervisory Board Members)
6(3)
¥111 million(¥44 million)
Total 22 ¥550 million
Notes: 1. The Directors’ remuneration includes a performance-linked bonus of ¥49 mil-lion for fiscal 2016.
2. The number of Directors and the number of Audit & Supervisory Board Members include two Directors and one Audit & Supervisory Board Member, respectively, who retired from office at the end of the 64th Ordinary General Meeting of Shareholders held on June 22, 2016.
Remuneration to Independent Auditors
Total remuneration paid during fiscal 2016 by the Company and its
consolidated subsidiaries to the Independent Auditors who conducted
accounting audits of the J-POWER Group comprised ¥140 million for
auditing procedures and ¥32 million for non-auditing functions.
56
GGovernance
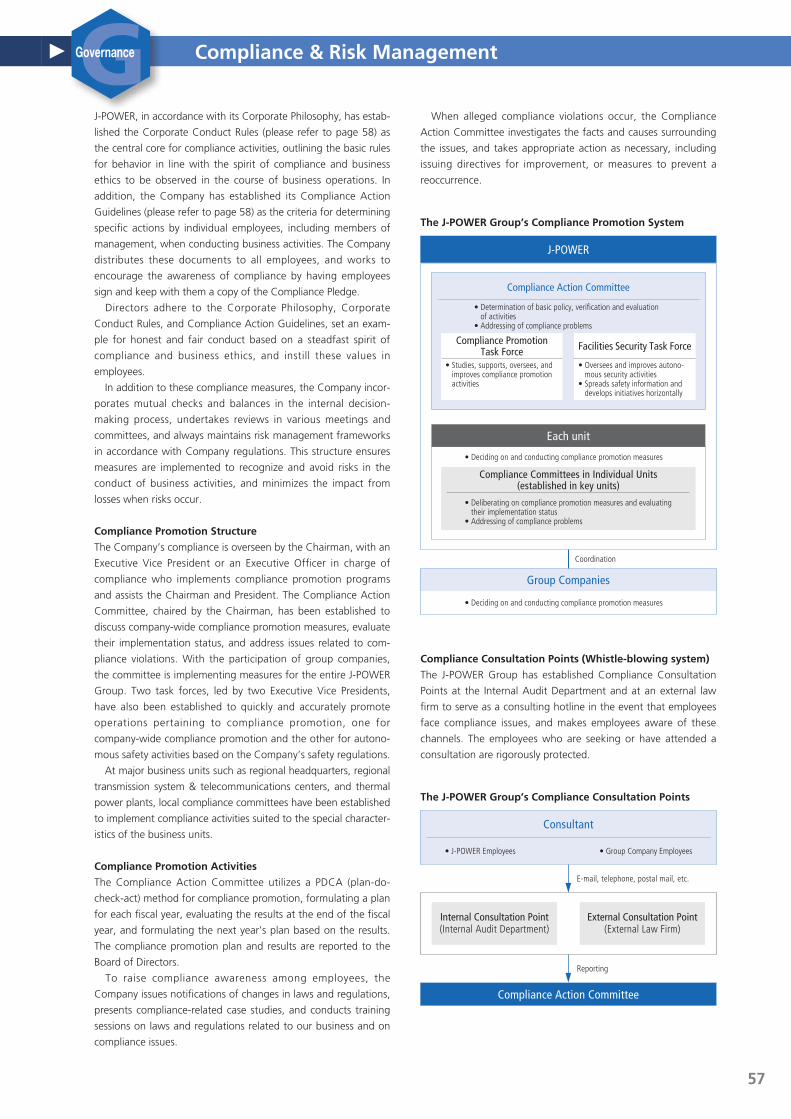
Corporate Governance Compliance & Risk Management
J-POWER, in accordance with its Corporate Philosophy, has estab-
lished the Corporate Conduct Rules (please refer to page 58) as
the central core for compliance activities, outlining the basic rules
for behavior in line with the spirit of compliance and business
ethics to be observed in the course of business operations. In
addition, the Company has established its Compliance Action
Guidelines (please refer to page 58) as the criteria for determining
specific actions by individual employees, including members of
management, when conducting business activities. The Company
distributes these documents to all employees, and works to
encourage the awareness of compliance by having employees
sign and keep with them a copy of the Compliance Pledge.
Directors adhere to the Corporate Philosophy, Corporate
Conduct Rules, and Compliance Action Guidelines, set an exam-
ple for honest and fair conduct based on a steadfast spirit of
compliance and business ethics, and instill these values in
employees.
In addition to these compliance measures, the Company incor-
porates mutual checks and balances in the internal decision -
making process, undertakes reviews in various meetings and
committees, and always maintains risk management frameworks
in accordance with Company regulations. This structure ensures
measures are implemented to recognize and avoid risks in the
conduct of business activities, and minimizes the impact from
losses when risks occur.
Compliance Promotion structure
The Company’s compliance is overseen by the Chairman, with an
Executive Vice President or an Executive Officer in charge of
compliance who implements compliance promotion programs
and assists the Chairman and President. The Compliance Action
Committee, chaired by the Chairman, has been established to
discuss company-wide compliance promotion measures, evaluate
their implementation status, and address issues related to com-
pliance violations. With the participation of group companies,
the committee is implementing measures for the entire J-POWER
Group. Two task forces, led by two Executive Vice Presidents,
have also been established to quickly and accurately promote
operations pertaining to compliance promotion, one for
company -wide compliance promotion and the other for autono-
mous safety activities based on the Company’s safety regulations.
At major business units such as regional headquarters, regional
transmission system & telecommunications centers, and thermal
power plants, local compliance committees have been established
to implement compliance activities suited to the special character-
istics of the business units.
Compliance Promotion Activities
The Compliance Action Committee utilizes a PDCA (plan-do-
check-act) method for compliance promotion, formulating a plan
for each fiscal year, evaluating the results at the end of the fiscal
year, and formulating the next year’s plan based on the results.
The compliance promotion plan and results are reported to the
Board of Directors.
To raise compliance awareness among employees, the
Company issues notifications of changes in laws and regulations,
presents compliance-related case studies, and conducts training
sessions on laws and regulations related to our business and on
compliance issues.
When alleged compliance violations occur, the Compliance
Action Committee investigates the facts and causes surrounding
the issues, and takes appropriate action as necessary, including
issuing directives for improvement, or measures to prevent a
reoccurrence.
Compliance Consultation Points (Whistle-blowing system)
The J-POWER Group has established Compliance Consultation
Points at the Internal Audit Department and at an external law
firm to serve as a consulting hotline in the event that employees
face compliance issues, and makes employees aware of these
channels. The employees who are seeking or have attended a
consultation are rigorously protected.
J-POWER
Group Companies
• Deciding on and conducting compliance promotion measures
Coordination
Compliance Action Committee
• Determination of basic policy, verification and evaluation of activities
• Addressing of compliance problems
Facilities Security Task Force
• Oversees and improves autono-mous security activities
• Spreads safety information and develops initiatives horizontally
Compliance Promotion Task Force
• Studies, supports, oversees, and improves compliance promotion activities
Each unit
• Deciding on and conducting compliance promotion measures
Compliance Committees in Individual Units (established in key units)
• Deliberating on compliance promotion measures and evaluating their implementation status
• Addressing of compliance problems
the J-PoWeR Group’s Compliance Promotion system
Compliance Action Committee
Reporting
E-mail, telephone, postal mail, etc.
• J-POWER Employees • Group Company Employees
External Consultation Point(External Law Firm)
Internal Consultation Point(Internal Audit Department)
Consultant
the J-PoWeR Group’s Compliance Consultation Points
57
GGovernance

Compliance & Risk Management
Corporate Conduct Rules (Revised on April 1, 2004)
Reliable supply of energyWe will put forth every effort to reliably supply energy both in Japan and abroad utilizing our experienced personnel and cutting-edge technology.
Safety assuranceIn conducting operations, we will constantly work to raise safety awareness and give the highest priority to public and worker safety.
Environmental conservationBased on an awareness that our business operations are deeply linked with the environment, we will actively engage in environmental conservation activities.
Communication with societyTo establish communication with society, we will conduct information disclosure and public relations activities in a fair and transparent manner.
Contribution to societyAiming to be a good corporate citizen, we will undertake activities to contribute to society and assist in the development of local communities both in Japan and abroad.
Creation of a rewarding corporate cultureIn addition to providing safe and comfortable work environments, we will respect the individuality of our employees and endeavor to establish a rewarding corporate culture that encourages them to take on new challenges.
Compliance with laws, regulations, and corporate ethicsWe will conduct business in good faith and in a fair manner with a strong commit-ment to compliance and ethics. We will stand firm against anti-social forces that threaten the order and safety of civil society.
Role of top managementRecognizing their responsibility in putting into practice the spirit of these Corporate Conduct Rules, our top management must set an example for others and work to spread awareness of these Rules. Should an event occur that violates the spirit of these Rules, top management must take the initiative in dealing with the problem to determine the causes and prevent recurrence. Top management must also identify and take disciplinary action against those responsible, including themselves.
Barring Relations with Anti-social Forces
The J-POWER Group’s policy is not to maintain relations of any
sort with the anti-social forces that threaten the order and safety
of civil society. The Company has determined the internal depart-
ment to act as a point of contact in the event that demands or
other contacts are received from anti-social forces, and has
established a system that ensures quick collection of information
and appropriate response in cooperation with specialist external
agencies.
Preventing Bribery and Corruption
The J-POWER Group prohibits bribes, illicit payments, and illegal
political donations, as well as entertaining or gifts to public offi-
cials that conflict with the National Public Service Ethics Act or
rules prescribed by government agencies. Also, the Company
does not offer financial or other rewards to foreign government
officials in return for illicit benefits or incentives. We are careful
to avoid actions that might be construed as collusion with politi-
cians or administrative agencies, and strives to establish sound
and transparent relationships.
Disclosure
The Company has established the Disclosure Committee, chaired
by the President, to enhance transparency and accountability in
corporate activities. This committee ensures fair and transparent dis-
closure of company information in a timely and proactive manner.
Compliance with the Internal Control Reporting system
In response to the internal control reporting system for financial
reporting required by Japan’s Financial Instruments and Exchange
Act, the J-POWER Group established, maintains, and evaluates
its internal control system centered on the Accounting & Finance
Department and Internal Audit Department.
In fiscal 2016, continuing from the previous year, the
Company’s management evaluated the status of the develop-
ment and operation of internal controls with respect to compa-
ny-wide internal controls, operational process-related internal
controls, and information technology-based internal controls in
accordance with the implementation standards of Japan’s
Financial Services Agency. The Company determined that its
internal control system for financial reporting is effective. This
evaluation result was submitted as an Internal Control Report to
the Director-General of the Kanto Finance Bureau in June 2017,
following an audit carried out by the Company’s Independent
Auditor.
Going forward, the J-POWER Group will continue to verify the
efficacy of its internal control system, and ensure the reliability of
its financial reporting.
Compliance Action Guidelines (Revised on October 1, 2014)
[1] Basic Matters (omitted)
[2] Compliance Rules1. Relationship with Society(1) Contribution to Societya. We shall contribute to the sustainable development of Japan and the world by
faithfully fulfilling the mission of the J-POWER Group to provide a stable supply of electricity.
b. We shall act sensibly and responsibly as members of society, and conduct our duties with awareness and pride as members of the J-POWER Group.
c. We shall actively participate in social contribution activities as a good corporate citizen, and contribute to the development of society. We shall continually con-duct social contribution activities, including supporting culture and the arts, cooperating with local communities, supporting participation in volunteer activi-ties, and contributing to international society, in order to fulfill our role as a good corporate citizen.
(2) Appropriate Disclosurea. We shall not act in a way that leads to a loss of trust from society, such as dis-
closing false information or data, or willfully concealing information that should be made public.
b. We shall respect diverse views, and not act in a way that hinders the formation of sound public opinion.
c. In written statements and other information released as part of public relations activities, we will never use any slanderous expressions or socially discriminatory language.
(3) Restrictions on Donations and Political Contributionsa. In making political contributions or donations to all sorts of organizations, etc.,
we will comply with the Public Officers Election Act, Political Funds Control Act, and other related laws and regulations, and make them in accordance with reg-ular methods.
b. In accordance with Company regulations, we shall receive prior approval for contributions or donations.
c. We will not offer bribes, illicit payments, or illegal political donations, and be extremely careful not to act in a way that may be construed as colluding with politicians or government agencies. We will strive to build sound and transpar-ent relationships.
(4) Barring Relations with Anti-social Forcesa. To avoid illegal or anti-social behavior, we will have basic legal knowledge, an aware-
ness of social norms and sense of justice, and strive to constantly exercise good sense.b. We will be resolute in dealing with the anti-social forces that threaten the order
and safety of civil society, and never engage in relations of any sort. In the case of an improper demand from anti-social forces or other parties, we will maintain a firm stance, and never seek a resolution with money or other rewards.
58
GGovernance
Compliance & Risk Management
c. We will never use anti-social forces for Company or personal gain.d. We will never conduct business with anti-social forces, or businesses affiliated
with anti-social forces.
(5) Environmental ProtectionWe continuously recognize the importance of environmental protection in all our business activities. We will comply with all environment-related laws and regula-tions, and proactively address global and local environmental issues based on our Environmental Management Vision.
(6) Appropriate Use of Information Systemsa. We recognize that information security as a company with vital infrastructure is
a social responsibility.b. We only use the Company’s information systems for work purposes, and not for
personal matters.c. We strictly manage Company information, and encrypt data removed from
Company premises to prevent the leak or theft of confidential information.d. When using computers or external storage media, we will run a virus scan to
prevent damage from viruses and other malicious programs.e. We will properly manage our ID and password, and never illicitly access systems.f. When using the Internet, we always take care to ensure appropriate use, and, in
our private lives as well, refrain from acts that could undermine the Company’s social credibility.
g. We use software appropriately, and shall not install software with a high risk of information leakage, such as free software or file sharing software.
(7) Protection of Intellectual Property RightsThe Company’s intellectual property rights acquired through research and develop-ment or other business operations (inventions, utility models, designs, copyrights, trademarks, know-how, technical information, etc.) are important Company assets. We will use them properly, and strive to protect those rights.a. We will promptly submit applications and register the results that belong to the
Company, and strive to protect the Company’s intellectual property rights.b. We will never infringe upon the intellectual property rights of others, such as
unauthorized copying of computer software.c. Intellectual property rights of business partners must only be used under appro-
priate license, and never illicitly.
(8) Compliance with Import-Export Laws and Regulationsa. For the export and import of products, we will follow proper import/export and
customs procedures in accordance with relevant laws and regulations.b. We will never import or export prohibited goods.
2. Relationships with Customers, Business Partners, and Competitors(1) Safety and Reliability of Energy Supplies and Product Salesa. In supplying electric power and other forms of energy to society, with constant
priority on ensuring safety, we will fully understand and comply with relevant laws, regulations, and standards. We will also take extreme care with regard to maintenance and operations, and strive to provide a stable energy supply with quality and safety.
b. Similarly with regard to product sales, we will fully understand and comply with safety-related laws and safety standards, from development and manufacture to sales, repair, and maintenance, aiming for higher reliability.
c. When we receive information that hampers safety or reliability, we will promptly confirm the facts, and if a problem is determined, contact the relevant depart-ments and take appropriate action.
(2) Compliance with Antitrust LawsUnder no circumstances will we act in a manner that violates antitrust laws, including participation in cartels or collusion, maintaining of resale prices, or abuse of a dominant bargaining position. We will engage in fair and free competition.a. We will not make any agreements with other business operators that affect
sales prices or terms of sale, and will not engage in collusive bidding or other unreasonable restraint of trade.
b. We will not sell products at inappropriately low prices, restrict the selling prices of customers, or engage in other unfair business practices.
(3) Appropriate Business with SuppliersIn our business relations with suppliers, we will act with good sense and sincerity, and treat suppliers with impartiality and fairness.a. When choosing a supplier from among several companies, we will determine
the optimal partner by fairly comparing and evaluating such factors as quality, price, delivery period, technical development capabilities, stable supply, and financial standing.
b. We will not exert influence which provides certain suppliers with improper favorable treatment.
c. When commissioning business partners for manufacturing, repairs, preparation of information deliverables, or rendering of services, we will conclude contracts and conduct business with a full understanding of the Subcontract Act, taking care to avoid delayed payment or other improper action.
(4) Prevention of Unfair Competitiona. We will not acquire or use the trade secrets of other companies through theft or
other improper means.b. We will not acquire or use the trade secrets of other companies that we know
or suspect to have been obtained through improper means.
(5) Entertaining/Giftsa. Entertaining and gifts to business partners will be within the scope of social
courtesy.b. When we have no choice but to accept entertaining or gifts from customers or
business partners, it must be within the scope of social courtesy.
3. Relationships with Company Assets, Accounting, Shareholders, and Investors
(1) Appropriate Use of Company AssetsCompany assets need to be in a condition for efficient and ready use, and we should handle both tangible and intangible assets appropriately to prevent damage or theft. Company assets or expenditures may not be used for personal purposes.
(2) Appropriate Accounting Management and Tax TreatmentEntries on accounting ledgers or accounting slips will be made in accordance with relevant laws, regulations, and Company regulations. We will not disguise or con-ceal facts, create fictional records, or accumulate off-book assets.
(3) Disclosure of Management InformationWe will provide shareholders and investors with timely and appropriate disclosure of management information, including the Company’s financial condition and sta-tus of business activities. We will clearly convey the Company’s management phi-losophy and policies, and take seriously any opinions or criticism regarding them.
(4) Prohibition on Insider TradingWe will not buy or sell Company stocks or bonds using internal information obtained during the course of business. We will not buy or sell stocks or bonds regarding business partners with which we have a business relationship, competitors, or customers using internal informa-tion obtained during the course of business, prior to the disclosure of such infor-mation to ordinary investors. We will handle internal information appropriately to prevent stock transactions using internal information, and not disclose such information to others not associ-ated with the business.
4. Relationships with Government Agencies and Public Officials(1) Appropriate Approval and Notification Proceduresa. We ensure that necessary procedures are taken such as obtaining approvals and
submitting notifications.b. We will not neglect to submit necessary notifications, alter data, or take any
action that leads to a loss of the Company’s credibility.
(2) Entertaining and Gifts to Public OfficialsWe will not entertain or give gifts to public officials or equivalent persons in a manner that conflicts with the National Public Service Ethics Act or other rules pre-scribed by government agencies. In addition, we will not give, promise, or offer financial or other rewards to for-eign government officials to improperly gain a business advantage, or in return for a business incentive.
5. Relationships with Employees(1) Respect for Human RightsWe will strive to constantly maintain a wholesome work environment, will respect human rights, and will never act in a way that leads to discrimination or denying personality aspects.a. We will not discriminate in any way, including on the grounds of birth, nationality,
race, creed, religion, gender, physical condition, or social status.b. We will not engage in power harassment, sexual harassment, or similar types of
behavior.
(2) Protection of PrivacyWe will strictly manage the personal information of employees and external per-sons obtained during the course of business, and use this information only for business purposes, while preventing leakage of this information.
(3) Workplace Health and SafetyWe will strive to provide a work environment with priority on health and safety, and will understand and comply with laws and regulations regarding workplace health and safety. Should a work-related accident occur, we will minimize the effects of the accident, and faithfully and promptly follow prescribed procedure, such as reporting, to prevent a recurrence.
(4) Compliance with Labor LawsWe will comply with labor-related laws, and strive to maintain a wholesome work environment with a pleasant atmosphere for a wide range of human resources.a. We will comply with the Labor Standards Act, and not impose duties that force
employees to engage in excessive labor or overtime.b. We will comply with the overtime work agreement, and not require or condone
unpaid overtime.c. We will conduct discussions with labor unions in good faith, and establish
healthy labor-management relations.d. We will constantly strive to maintain a healthy mind and body of ourselves, and
pay attention to the physical and mental health of subordinates.
(5) Compliance with Rules of Employmenta. We will adhere to discipline for work, and comply with matters prescribed by
the Rules of Employment.b. We will respect the rights of employees prescribed by the Rules of Employment.
59
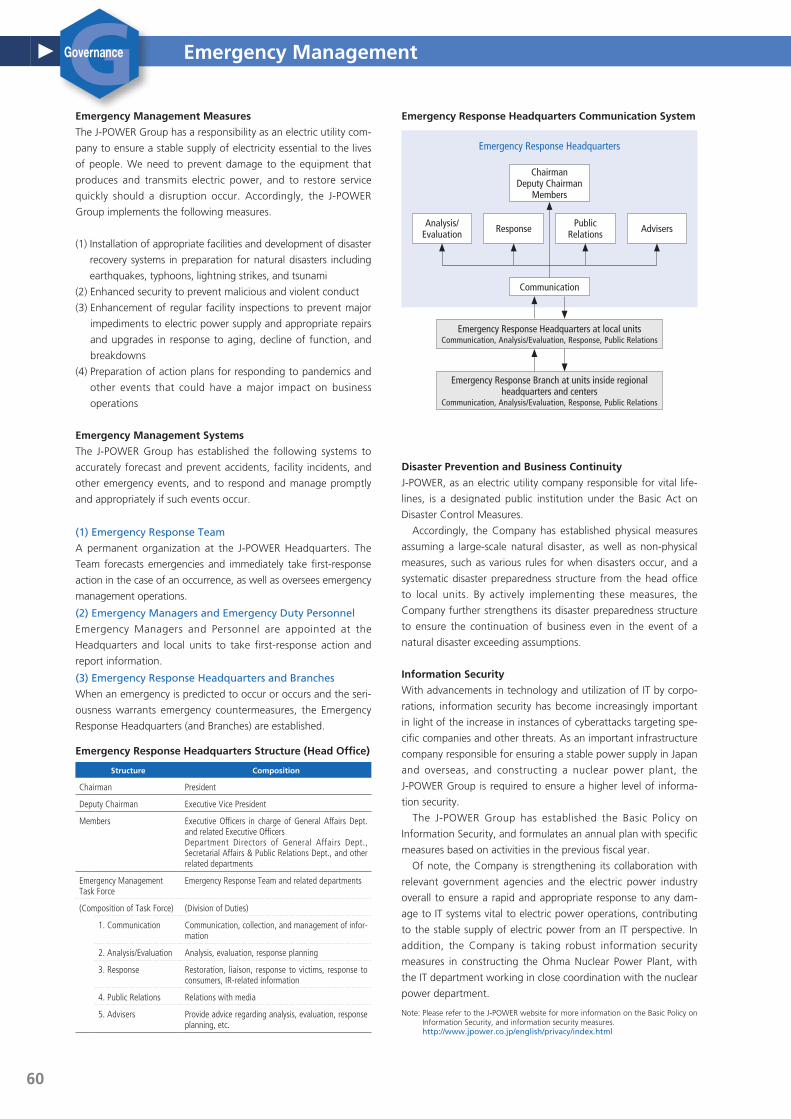
emergency Management
emergency Management Measures
The J-POWER Group has a responsibility as an electric utility com-
pany to ensure a stable supply of electricity essential to the lives
of people. We need to prevent damage to the equipment that
produces and transmits electric power, and to restore service
quickly should a disruption occur. Accordingly, the J-POWER
Group implements the following measures.
(1) Installation of appropriate facilities and development of disaster
recovery systems in preparation for natural disasters including
earthquakes, typhoons, lightning strikes, and tsunami
(2) Enhanced security to prevent malicious and violent conduct
(3) Enhancement of regular facility inspections to prevent major
impediments to electric power supply and appropriate repairs
and upgrades in response to aging, decline of function, and
breakdowns
(4) Preparation of action plans for responding to pandemics and
other events that could have a major impact on business
operations
emergency Management systems
The J-POWER Group has established the following systems to
accurately forecast and prevent accidents, facility incidents, and
other emergency events, and to respond and manage promptly
and appropriately if such events occur.
(1) Emergency Response Team
A permanent organization at the J-POWER Headquarters. The
Team forecasts emergencies and immediately take first-response
action in the case of an occurrence, as well as oversees emergency
management operations.
(2) Emergency Managers and Emergency Duty Personnel
Emergency Managers and Personnel are appointed at the
Headquarters and local units to take first-response action and
report information.
(3) Emergency Response Headquarters and Branches
When an emergency is predicted to occur or occurs and the seri-
ousness warrants emergency countermeasures, the Emergency
Response Headquarters (and Branches) are established.
emergency Response Headquarters structure (Head office)
structure Composition
Chairman President
Deputy Chairman Executive Vice President
Members Executive Officers in charge of General Affairs Dept. and related Executive Officers Department Directors of General Affairs Dept., Secretarial Affairs & Public Relations Dept., and other related departments
Emergency Management Task Force
Emergency Response Team and related departments
(Composition of Task Force) (Division of Duties)
1. Communication Communication, collection, and management of infor-mation
2. Analysis/Evaluation Analysis, evaluation, response planning
3. Response Restoration, liaison, response to victims, response to consumers, IR-related information
4. Public Relations Relations with media
5. Advisers Provide advice regarding analysis, evaluation, response planning, etc.
Disaster Prevention and Business Continuity
J-POWER, as an electric utility company responsible for vital life-
lines, is a designated public institution under the Basic Act on
Disaster Control Measures.
Accordingly, the Company has established physical measures
assuming a large-scale natural disaster, as well as non-physical
measures, such as various rules for when disasters occur, and a
systematic disaster preparedness structure from the head office
to local units. By actively implementing these measures, the
Company further strengthens its disaster preparedness structure
to ensure the continuation of business even in the event of a
natural disaster exceeding assumptions.
Information security
With advancements in technology and utilization of IT by corpo-
rations, information security has become increasingly important
in light of the increase in instances of cyberattacks targeting spe-
cific companies and other threats. As an important infrastructure
company responsible for ensuring a stable power supply in Japan
and overseas, and constructing a nuclear power plant, the
J-POWER Group is required to ensure a higher level of informa-
tion security.
The J-POWER Group has established the Basic Policy on
Information Security, and formulates an annual plan with specific
measures based on activities in the previous fiscal year.
Of note, the Company is strengthening its collaboration with
relevant government agencies and the electric power industry
overall to ensure a rapid and appropriate response to any dam-
age to IT systems vital to electric power operations, contributing
to the stable supply of electric power from an IT perspective. In
addition, the Company is taking robust information security
measures in constructing the Ohma Nuclear Power Plant, with
the IT department working in close coordination with the nuclear
power department.
Note: Please refer to the J-POWER website for more information on the Basic Policy on Information Security, and information security measures. http://www.jpower.co.jp/english/privacy/index.html
Emergency Response Headquarters
Communication
ChairmanDeputy Chairman
Members
Analysis/Evaluation
Public RelationsResponse Advisers
Emergency Response Headquarters at local unitsCommunication, Analysis/Evaluation, Response, Public Relations
Emergency Response Branch at units inside regional headquarters and centers
Communication, Analysis/Evaluation, Response, Public Relations
emergency Response Headquarters Communication system
60
GGovernanceGGovernance

Financial Section/Fact Data62 Consolidated Financial Statements
66 Management’s Discussion and Analysis
72 Financial and Operating Highlights
78 10-Year Consolidated Financial Data
88 10-Year Non-Consolidated Financial Data
94 Major Group Companies
96 Corporate Profile/Stock Information
61
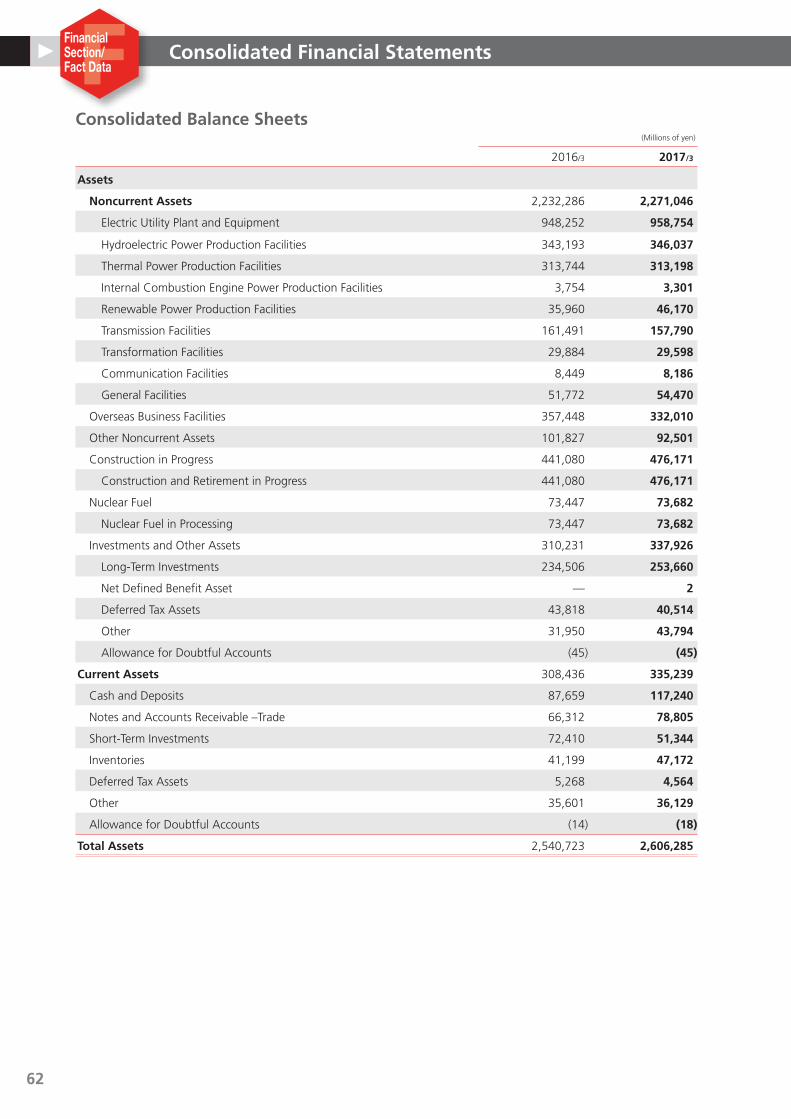
Consolidated Financial Statements
Consolidated Balance Sheets(Millions of yen)
2016/3 2017/3
Assets
Noncurrent Assets 2,232,286 2,271,046
Electric Utility Plant and Equipment 948,252 958,754
Hydroelectric Power Production Facilities 343,193 346,037
Thermal Power Production Facilities 313,744 313,198
Internal Combustion Engine Power Production Facilities 3,754 3,301
Renewable Power Production Facilities 35,960 46,170
Transmission Facilities 161,491 157,790
Transformation Facilities 29,884 29,598
Communication Facilities 8,449 8,186
General Facilities 51,772 54,470
Overseas Business Facilities 357,448 332,010
Other Noncurrent Assets 101,827 92,501
Construction in Progress 441,080 476,171
Construction and Retirement in Progress 441,080 476,171
Nuclear Fuel 73,447 73,682
Nuclear Fuel in Processing 73,447 73,682
Investments and Other Assets 310,231 337,926
Long-Term Investments 234,506 253,660
Net Defined Benefit Asset — 2
Deferred Tax Assets 43,818 40,514
Other 31,950 43,794
Allowance for Doubtful Accounts (45) (45)
Current Assets 308,436 335,239
Cash and Deposits 87,659 117,240
Notes and Accounts Receivable –Trade 66,312 78,805
Short-Term Investments 72,410 51,344
Inventories 41,199 47,172
Deferred Tax Assets 5,268 4,564
Other 35,601 36,129
Allowance for Doubtful Accounts (14) (18)
Total Assets 2,540,723 2,606,285
62
FFinancial Section/Fact Data
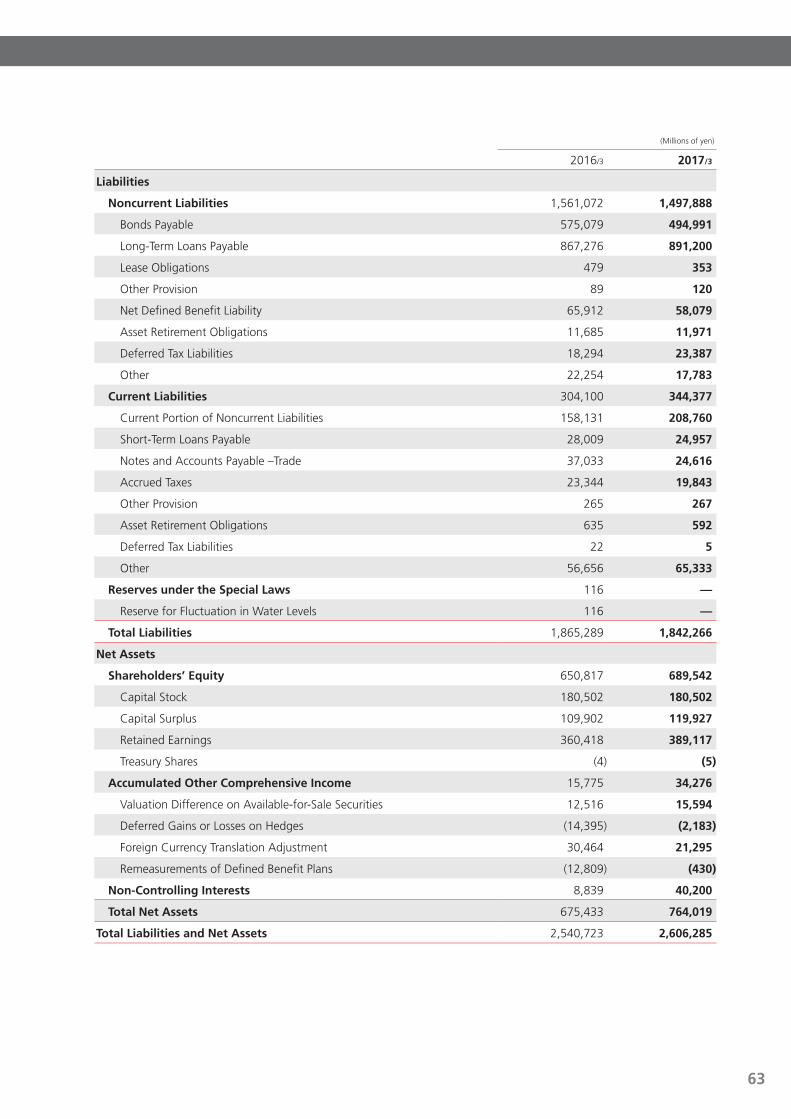
Consolidated Financial Statements
(Millions of yen)
2016/3 2017/3
Liabilities
Noncurrent Liabilities 1,561,072 1,497,888
Bonds Payable 575,079 494,991
Long-Term Loans Payable 867,276 891,200
Lease Obligations 479 353
Other Provision 89 120
Net Defined Benefit Liability 65,912 58,079
Asset Retirement Obligations 11,685 11,971
Deferred Tax Liabilities 18,294 23,387
Other 22,254 17,783
Current Liabilities 304,100 344,377
Current Portion of Noncurrent Liabilities 158,131 208,760
Short-Term Loans Payable 28,009 24,957
Notes and Accounts Payable –Trade 37,033 24,616
Accrued Taxes 23,344 19,843
Other Provision 265 267
Asset Retirement Obligations 635 592
Deferred Tax Liabilities 22 5
Other 56,656 65,333
Reserves under the Special Laws 116 —
Reserve for Fluctuation in Water Levels 116 —
Total Liabilities 1,865,289 1,842,266
Net Assets
Shareholders’ Equity 650,817 689,542
Capital Stock 180,502 180,502
Capital Surplus 109,902 119,927
Retained Earnings 360,418 389,117
Treasury Shares (4) (5)
Accumulated Other Comprehensive Income 15,775 34,276
Valuation Difference on Available-for-Sale Securities 12,516 15,594
Deferred Gains or Losses on Hedges (14,395) (2,183)
Foreign Currency Translation Adjustment 30,464 21,295
Remeasurements of Defined Benefit Plans (12,809) (430)
Non-Controlling Interests 8,839 40,200
Total Net Assets 675,433 764,019
Total Liabilities and Net Assets 2,540,723 2,606,285
63
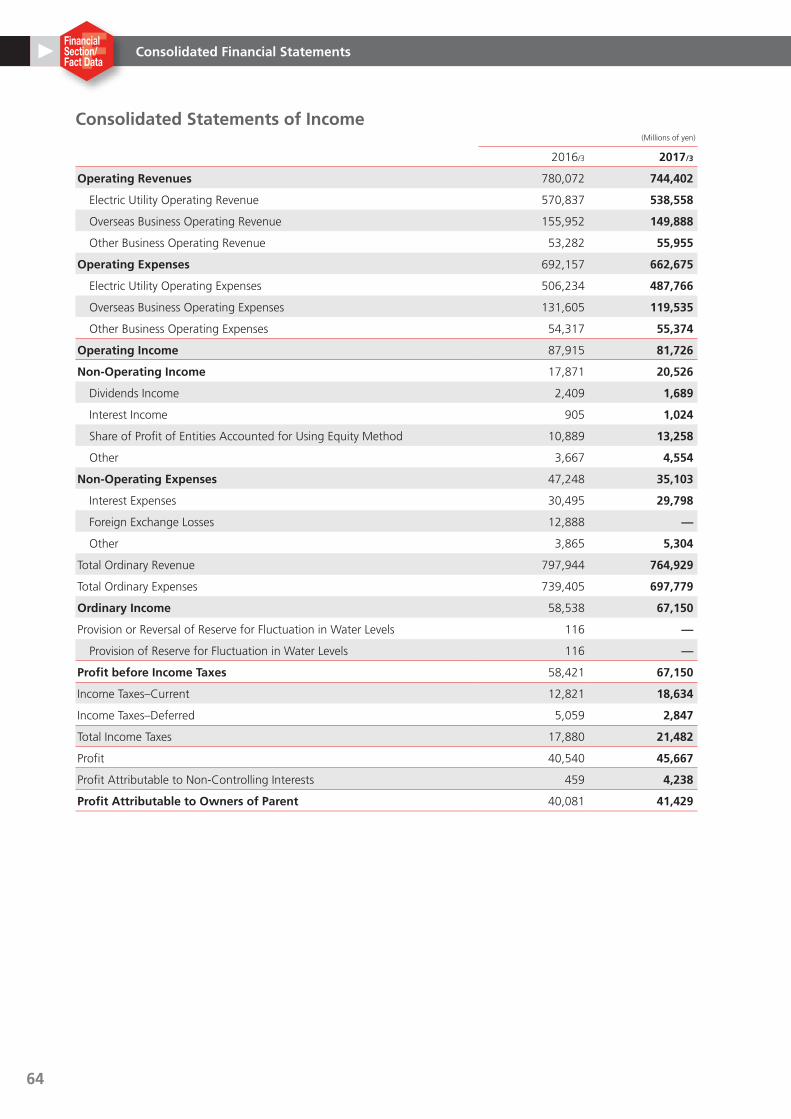
Consolidated Statements of Income(Millions of yen)
2016/3 2017/3
Operating Revenues 780,072 744,402
Electric Utility Operating Revenue 570,837 538,558
Overseas Business Operating Revenue 155,952 149,888
Other Business Operating Revenue 53,282 55,955
Operating Expenses 692,157 662,675
Electric Utility Operating Expenses 506,234 487,766
Overseas Business Operating Expenses 131,605 119,535
Other Business Operating Expenses 54,317 55,374
Operating Income 87,915 81,726
Non-Operating Income 17,871 20,526
Dividends Income 2,409 1,689
Interest Income 905 1,024
Share of Profit of Entities Accounted for Using Equity Method 10,889 13,258
Other 3,667 4,554
Non-Operating Expenses 47,248 35,103
Interest Expenses 30,495 29,798
Foreign Exchange Losses 12,888 —
Other 3,865 5,304
Total Ordinary Revenue 797,944 764,929
Total Ordinary Expenses 739,405 697,779
Ordinary Income 58,538 67,150
Provision or Reversal of Reserve for Fluctuation in Water Levels 116 —
Provision of Reserve for Fluctuation in Water Levels 116 —
Profit before Income Taxes 58,421 67,150
Income Taxes–Current 12,821 18,634
Income Taxes–Deferred 5,059 2,847
Total Income Taxes 17,880 21,482
Profit 40,540 45,667
Profit Attributable to Non-Controlling Interests 459 4,238
Profit Attributable to Owners of Parent 40,081 41,429
Consolidated Financial Statements
64
FFinancial Section/Fact Data

Consolidated Statements of Cash Flows(Millions of yen)
2016/3 2017/3
Cash Flows from Operating Activities
Profit before Income Taxes 58,421 67,150
Depreciation and Amortization 94,582 75,660
Impairment Loss 1,392 2,624
Loss on Retirement of Noncurrent Assets 3,656 2,842
Increase (Decrease) in Net Defined Benefit Liability (3,351) 9,276
Increase (Decrease) in Reserve for Fluctuation in Water Levels 116 —
Interest and Dividends Income (3,314) (2,713)
Interest Expenses 30,495 29,798
Decrease (Increase) in Notes and Accounts Receivable –Trade 2,445 (13,433)
Decrease (Increase) in Inventories (3,259) (5,503)
Increase (Decrease) in Notes and Accounts Payable –Trade (3,085) (6,477)
Share of (Profit) Loss of Entities Accounted for Using Equity Method (10,889) (13,258)
Other, Net 3,134 6,786
Subtotal 170,342 152,753
Interest and Dividends Income Received 13,573 13,229
Interest Expenses Paid (30,554) (30,224)
Income Taxes Paid (7,232) (20,317)
Net Cash Provided by (Used in) Operating Activities 146,130 115,440
Cash Flows from Investing Activities
Purchase of Noncurrent Assets (140,840) (108,149)
Payments of Investment and Loans Receivable (2,537) (18,005)
Collection of Investment and Loans Receivable 15,960 2,577
Other, Net (4,123) (14,086)
Net Cash Provided by (Used in) Investing Activities (131,541) (137,663)
Cash Flows from Financing Activities
Proceeds from Issuance of Bonds — 79,702
Redemption of Bonds (60,999) (90,000)
Proceeds from Long-Term Loans Payable 96,697 83,762
Repayment of Long-Term Loans Payable (110,783) (69,108)
Increase in Short-Term Loans Payable 100,944 87,663
Decrease in Short-Term Loans Payable (102,994) (90,194)
Proceeds from Issuance of Commercial Papers 2,999 15,000
Redemption of Commercial Papers (3,000) (15,000)
Proceeds from Changes in Ownership Interests in Subsidiaries that Do not Result in Change in Scope of Consolidation — 42,363
Cash Dividends Paid (12,811) (12,811)
Other, Net 1,315 (916)
Net Cash Provided by (Used in) Financing Activities (88,632) 30,461
Effect of Exchange Rate Change on Cash and Cash Equivalents (2,446) 267
Net Increase (Decrease) in Cash and Cash Equivalents (76,490) 8,505
Cash and Cash Equivalents at Beginning of Period 236,439 159,949
Cash and Cash Equivalents at End of Period 159,949 168,454
Consolidated Financial Statements
65
Financial Results
Operating Income
Sales (operating revenues) declined 4.6% from the previous
fiscal year to ¥744.4 billion, due mainly to a decline in fuel
prices and a decrease in the load factor of thermal power
plants in the Electric Power Business.
Operating expenses, despite an increase in retirement ben-
efit expenses, decreased 4.3% to ¥662.6 billion, mainly due
to the decrease in fuel costs stemming from the decline of
the fuel price and the decrease in the load factor of thermal
power plants, along with a decrease in depreciation and
amortization costs as a result of J-POWER’s change of the ac-
counting method for depreciation from the subject fiscal year
(from the declining-balance method to the straight-line
method).
As a result, operating income decreased 7.0% from the
previous fiscal year, to ¥81.7 billion, with the operating in-
come margin falling 0.3 point to 11.0%.
Ordinary Income
Ordinary revenue, the balance of operating and non-operat-
ing revenue, decreased 4.1% from the previous fiscal year to
¥764.9 billion. Also, non-operating expenses fell 25.7% to
¥35.1 billion, due mainly to the elimination of foreign ex-
change losses, while ordinary expenses declined 5.6% to
¥697.7 billion. As a result, ordinary income increased 14.7%
from the previous fiscal year to ¥67.1 billion.
Ordinary income by reportable segment for the subject fis-
cal year is as follows.
Electric Power BusinessElectricity sales volume from hydroelectric power plants
decreased 17.6% during the subject fiscal year to 8.5
TWh, due mainly to a decrease in the water supply rate,
from 111% in the previous fiscal year to 92%. Thermal
power electricity sales volume decreased 4.9% to 53.5
TWh, mainly as a result of a decline in the load factor at
J-POWER plants (from 80% to 75% on a non-consolidated
basis). Overall, electricity sales volume decreased 6.7%
from the previous fiscal year to 62.7 TWh.
Sales (electric utility operating revenue) declined 5.6%
from the previous fiscal year to ¥540.2 billion, mainly due
to the decline in the fuel price, and the decrease in the
load factor of thermal power plants.
Segment income decreased 31.1% from the previous
fiscal year to ¥22.2 billion, due mainly to the decline in
sales and an increase in retirement benefit expenses.
Electric Power-Related BusinessSales (other business operating revenue) amounted to
¥357.3 billion, on a par with the previous fiscal year.
Segment income decreased 1.5% from the previous fiscal
year to ¥14.2 billion, due mainly to the posting of an impair-
ment loss for machinery in a coal mine.
Overseas BusinessElectricity sales volume in the overseas business increased
5.7% from the previous fiscal year to 14.6 TWh. This was
due mainly to full-term operation of the U-Thai IPP thermal
power project in Thailand, which commenced commercial
operation in 2015 (Unit No. 1 in June 2015, Unit No. 2 in
December 2015).
Sales (overseas business operating revenue) decreased
3.9% from the previous fiscal year to ¥149.8 billion, due
mainly to the decline in the price of fuel and the foreign ex-
change impact from the stronger yen, offsetting the increase
in electricity sales volume.
Segment income increased 172.0% from the previous fis-
cal year to ¥31.2 billion, due mainly to the commercial oper-
ation of the U-Thai IPP thermal power project in Thailand
throughout the term and the elimination of foreign ex-
change losses.
Other BusinessSales (other business operating revenue) increased 4.0%
from the previous fiscal year to ¥23.9 billion.
Segment income increased 69.9% from the previous fiscal
year to ¥1.3 billion, due mainly to the increase in sales.
Management’s Discussion and Analysis
66
FFinancial Section/Fact Data
Profit before Income Taxes Profit before income taxes increased 14.9% (¥8.7 billion) compared with the previous fiscal year to ¥67.1 billion.
Profit Attributable to Owners of Parent Total income taxes increased 20.1% (¥3.6 billion) year on year to ¥21.4 billion, with profit attributable to owners of parent in-
creasing 3.4% (¥1.3 billion) from the previous fiscal year to ¥41.4 billion.
Earnings per Share Earnings per share were ¥226.33 in fiscal 2016, compared with ¥218.97 in the previous fiscal year.
Dividend Policy
The most-instinctive feature of J-POWER’s business is the utiliza-
tion of long-term project management capabilities, including for
the construction of power plants and other facilities, to invest in
power plants and other types of infrastructure, and recover that
investment through long-term operation of those assets. With
regard to shareholder returns, J-POWER’s top priority is to main-
tain stable dividend levels in line with the characteristics of its
business. Further, the Company works to enhance returns
through long-term initiatives to increase corporate value and
achieve strong growth in a sustainable manner.
In accordance with this basic policy, the Company pays div-
idends from retained earnings twice a year, as an interim and
fiscal year-end dividend. The decision-making body for divi-
dend payments is the Board of Directors for the interim divi-
dend, and the General Meeting of Shareholders for the year-
end dividend.
For fiscal 2016, the Company paid a dividend of ¥70 per
share, comprising interim and year-end dividends of ¥35 per
share. As a result, the payout ratio was 24.9%, with the ratio
of dividends to shareholders’ equity at 2.4%.
Of note, the Company stipulates in the Articles of Incorpo-
ration that it is able to pay an interim dividend as prescribed
by Article 454-5 of the Companies Act.
Financial Position
AssetsTotal assets at the end of the subject fiscal year (March 31,
2017) amounted to ¥2,606.2 billion, an increase of ¥65.5
billion from the previous fiscal year-end. This was due mainly
to an increase in non-current assets.
LiabilitiesTotal liabilities amounted to ¥1,842.2 billion, a decrease of
¥23.0 billion from the previous fiscal year-end. Of this
amount, interest-bearing debt decreased ¥8.7 billion to
¥1,620.0 billion. Non-recourse loans in overseas business ac-
counted for ¥294.7 billion of interest-bearing debt.
Net AssetsTotal net assets increased ¥88.5 billion from the previous fis-
cal year-end to ¥764.0 billion, due mainly to the recording of
profit attributable to owners of parent. The shareholders’ eq-
uity ratio increased from 26.2% at the previous fiscal year-
end to 27.8%.
Management’s Discussion and Analysis
67
Capital ExpendituresCapital expenditures amounted to ¥105.8 billion, a decrease
of ¥20.5 billion from the previous fiscal year. Of that amount,
expenditures in the electric power business amounted to
¥107.8 billion, a decrease of ¥11.3 billion from the previous
fiscal year, and expenditures related to the overseas business
amounted to ¥1.3 billion, a decrease of ¥10.1 billion.
Fund ProcurementThe majority of J-POWER’s financing requirements are related
to capital expenditures and debt refinancing. The Company’s
basic policy is to procure long-term funds. For the procuring
of long-term funds, as means of maintaining low interest
rates and a stable fund procurement, the Company issues
straight bonds and procures long-term loans from financial
institutions. The outstanding balances of straight bonds and
borrowings at March 31, 2017, were ¥655.0 billion and
¥939.3 billion, respectively. For short-term funding, in addi-
tion to working capital the Company obtains flexible bridge
financing from the standpoint of enhancing responsiveness
in procurement. To meet short-term funding needs, the
Company is able to issue up to ¥100.0 billion in commercial
paper.
Cash Flows
Cash Flows from Operating ActivitiesCash inflow from operating activities decreased ¥30.6 billion
from the previous fiscal year to ¥115.4 billion, due mainly to
a decrease in depreciation and amortization cost and an in-
crease in notes and accounts receivable-trade.
Cash Flows from Investing ActivitiesCash outflow from investing activities increased ¥6.1 billion
from the previous fiscal year to ¥137.6 billion, due mainly to
the acquisition of an additional interest in the Elwood Energy
Power Plant in the United States.
Cash Flows from Financing ActivitiesCash inflow from financing activities amounted to ¥30.4 bil-
lion, compared to an outflow of ¥88.6 billion in the previous
fiscal year. This was due mainly to an increase in funds pro-
cured from corporate bonds and the transfer of a portion of
shares in a consolidated subsidiary.
As a result, cash and cash equivalents at March 31, 2017,
increased ¥8.5 billion from the end of the previous fiscal year
to ¥168.4 billion.
Risk Factors
This section discusses the main potential risks related to
J-POWER’s financial position, business results, current and fu-
ture business operations, and other matters. From the per-
spective of actively disclosing information to investors, this
section also provides information to help investors under-
stand business and other risks that the Company does not
necessarily consider significant.
Management’s Discussion and Analysis
68
FFinancial Section/Fact Data

Impact of Reforms to the Electric Power Business Regulations on J-POWER’s Electricity Revenue and BusinessThe Policy on Electricity System Reform was approved by the
Cabinet in April 2013, bringing about drastic changes to the
business environment surrounding J-POWER. Amendments
to the Electricity Business Act fully liberalized market partici-
pation in the retail of electric power in April 2016, and elimi-
nated regulations on wholesale electricity utilities (regulations
of business permits and rates). Further, the legal unbundling
of the transmission and distribution divisions of the former
EPCOs and J-POWER will be required, with an approximate
deadline of 2020. After the legal unbundling of transmission
and distribution divisions, there are plans to review the regu-
lations on electricity retail rates (transitional measures) for the
former EPCOs.
With the revision of electric power business types in the
system reforms, as of April 2016, J-POWER has changed
from a wholesale electricity utility as prescribed in the Elec-
tricity Business Act prior to amendment to an electricity utility
that conducts power generation and transmission businesses.
Cost-basis rate regulations have been repealed, and rates re-
lated to the power generation business are now determined
upon consultation with customers based on market competi-
tion. Rates related to the transmission business remain regu-
lated, with a cost-basis rate system, to maintain a healthy
transmission and distribution network system.
The majority of J-POWER’s operating revenue comprises
rate income from domestic sales to the former EPCOs. As
market competition in the power generation business ad-
vances, to ensure that the value of our power generation
business receives adequate assessment, we are therefore pro-
ceeding with appropriate rate consultations with customers,
primarily the former EPCOs, while proceeding to diversify
customers and trade using the Japan Electric Power Ex-
change (JEPX).
Still, in the case that there are major changes to business
plans or operations due to shifts in long-term electricity de-
mand, further market competition, consultations with cus-
tomers, faults with facilities, or legislation, and such shifts
cause an inability to secure adequate revenue to cover power
generation costs, such a situation may adversely affect our
performance.
Global WarmingJ-POWER owns many coal-fired thermal power plants, which
emit a relatively higher level of CO2 with respect to power
output compared to power plants using other fossil fuels,
such as LNG. The Company is working to increase the effi-
ciency and reduce the carbon emissions of its coal-fired ther-
mal power. Also, we are working to expand our use of CO2-
free power sources, such as renewable energy, and
developing nuclear power plants. Furthermore, based on the
electricity business’s Action Plan for Achieving a Low-Carbon
Society established by electricity utilities including J-POWER
in July 2015, we will do our utmost to achieve the targets set
for the overall electric power industry.
However, going forward, if new legal regulations or other
rules related to global warming countermeasures were to be
introduced, causing major changes to business plans or oper-
ations, it could potentially have an adverse effect on our per-
formance.
New Businesses in and outside Japan, Including Overseas Power Generation BusinessJ-POWER aims to build a new revenue platform by engaging
in new electric power businesses domestically and overseas,
including the overseas power generation business.
Specifically, in the overseas power generation business, we
are applying the experience gleaned through our consulting
services businesses in various countries in the pursuit of inde-
pendent power producer (IPP) projects.
Also, in domestic electric power business, we are proceed-
ing with new development of high-efficiency coal-fired ther-
mal power plants as well as power generation businesses uti-
lizing wind, geothermal, waste-fueled thermal, and other
renewable energies.
However, these businesses may not generate the level of
profits that we anticipate, due to unforeseeable circumstanc-
es, including major changes in operating conditions; changes
in demand or the market environment; and changes in regu-
lations. Changes in our business plans or the suspension of
operations or construction prompted by such circumstances
could result in related expenses or a need for additional
funding that could potentially have an adverse effect on the
results of our operations. Furthermore, some of these busi-
nesses are operated as joint ventures with third parties. In
cases where the joint venture format is revised due to chang-
es in the business environment or J-POWER is a minority eq-
uity owner and thus unable to engage in management and
administration, the results of the joint venture may not bene-
ficially impact our performance. In addition, overseas busi-
nesses entail foreign exchange risk as well as country risk due
to political instability and other factors.
Management’s Discussion and Analysis
69
Capital FundsThe Company has invested a very large amount in power
plants and other facilities. The funds for these investments
have been procured mainly through borrowings and the issu-
ance of bonds payable. We anticipate the need to raise funds
in the future to invest in new domestic and overseas projects,
such as Ohma Nuclear Power Plant and Takehara Thermal
Power Plant New No. 1, and to repay existing obligations. If
we are unable to raise required funds on acceptable terms
and in a timely manner due to the prevailing conditions in the
financial markets, the Company’s credit situation, or other
factors at that time, then this could potentially have material
adverse effects on our business development and profitability.
Ohma Nuclear Power Plant Construction ProjectWith regard to the Ohma Nuclear Power Plant Project, the
Japan Atomic Energy Commission concluded in the August
1995 decision that the plant has a policy-oriented role in en-
hancing flexibility of the plan to use MOX (uranium-plutoni-
um mixed oxide) fuel in light water reactors because the
plant adopts an advanced boiling water reactor with a view
to using MOX fuel for the entire core (full MOX-ABWR). In
addition, the commission expected the implementation of
the plan not only by J-POWER, which has primary responsibil-
ity, but also under the auspices of the government and
EPCOs. Accordingly, under the government’s guidelines, the
Company receives an R&D grant for the use of MOX fuel for
the entire reactor core. Furthermore, the Company has al-
ready concluded basic agreements with nine former EPCOs,
excluding The Okinawa Electric Power Company, Incorporat-
ed, that require the nine former EPCOs to purchase the total
amount of electricity at fair cost.
As a nuclear power plant using MOX fuel for the entire
core, the Ohma Nuclear Power Plant Project received consent
from the local municipality of Ohma as well as Aomori Pre-
fecture and was included by the Electric Power Development
Coordination Council in the national Electric Power Develop-
ment Master Plan as laid out by the Electric Power Develop-
ment Promotion Act in August 1999. (The Electric Power De-
velopment Promotion Act was abolished in October 2003,
and, with it, the system of the Electric Power Development
Master Plan ended. The functions of the plan were taken on
by the major power development site designation system,
under which the project received site designation in February
2005.) In April 2008, the nuclear reactor installation permit
was granted, and, in May of the same year, upon the initial
approval of the construction work plan by the Minister of
Economy, Trade and Industry, construction began. At that
time, planned construction costs were ¥469.0 billion. Con-
struction was suspended immediately after the Great East Ja-
pan Earthquake struck in March 2011 but was resumed in
October 2012.
On December 16, 2014, we submitted an application for
permission for alteration of a reactor installment license and
an application for construction plan approval to the Nuclear
Regulation Authority (NRA) in order to undergo a review of
compliance with the New Safety Standards concerning nucle-
ar power plants enforced by the NRA in July 2013. Specific
examples of the wide-ranging measures include the raising
of assumptions and enhancement of countermeasures with
regard to earthquakes and tsunamis as design basis measures
to prevent severe accidents, combined with the implement-
ing of measures to prevent damage to the core and the con-
tainment vessel as severe accident countermeasures newly
drawn up under the New Safety Standards. Furthermore, as
terrorism countermeasures, such as the deliberate crashing
of an aircraft, we have decided to install the specified severe
accident response facility that will enable reactor decompres-
sion and other functions to be controlled remotely to inhibit
the abnormal release of radioactive material outside due to
damage sustained by the reactor containment vessel. The
construction work for the additional safety enhancement
measures compiled in the above-mentioned application will
commence following confirmation that the content of the
Company’s application conforms to New Safety Standards
when reviewed by the NRA. The Company forecasts that the
additional construction work will cost approximately ¥130.0
billion. Moving forward, J-POWER will seriously and appropri-
ately respond to the NRA’s conformity reviews and steadily
implement necessary safety measures or other measures re-
quired in a full-scale effort to build a safe power plant.
While it is impossible to predict the progress of the compli-
ance review as an examinee, we aim to start construction
work for the additional safety enhancement measures in the
latter half of 2018, and aim to complete it in the latter half
of 2023. However, the construction work schedule for the
additional safety measures may be extended depending on
changes surrounding the nuclear power business, the status
of reviews by the NRA, and additional response to the New
Safety Standards. Also, in such events, construction expenses
may increase further, and other related costs may arise. In
addition, nuclear power generation involves various risks,
such as revisions of plans due to significant changes in condi-
tions around the nuclear power business caused by review of
Japan’s nuclear policy, the advance of market competition, or
other unexpected circumstances, as well as those associated
with the storage and handling of radioactive materials, and
risks other electric power plants are exposed to, such as nat-
ural disasters and unforeseen accidents after operations have
commenced. J-POWER intends to ensure that these risks are
avoided or minimized. However, if any of these risks should
eventuate, it could adversely affect the business performance
of the Company.
Management’s Discussion and Analysis
70
FFinancial Section/Fact Data

Fuel for Coal-Fired Thermal PowerJ-POWER’s coal-fired thermal power plants use imported
coal as their main source of fuel. In procuring imported
coal, the Company purchases coal from diverse sources in
Australia, Indonesia, Russia, and elsewhere to seek both
stable and economical supply. In addition, the Company
holds interests in some coal mines aiming for stable coal
supply. The Company’s imported coal procurement is han-
dled mainly under long-term or approximately one-year
contracts, with spot purchasing to fill gaps as necessary.
Coal purchase prices under long-term contracts are nor-
mally adjusted once per year in light of market prices.
The Company’s fuel cost is impacted by such factors as
changes in imported coal prices, supply and demand for
transport vessels, and problems with the facilities or oper-
ations of suppliers. According to the power purchase
agreements with customers for our major coal-fired ther-
mal power plants, the electricity rates corresponding to
fuel price properly reflect market conditions relating to
fuel procurement. As a result, fluctuations in fuel cost
have a limited impact on the business performance of
J-POWER. However, if coal prices rise sharply, there will be
a delay before the rise in fuel prices is reflected in electrici-
ty rates. This could have a temporary adverse effect on the
results of our performance. Furthermore, should a signifi-
cant fall in coal prices have a significant effect on the per-
formance of the mine in which the Company holds an in-
terest, the Company’s performance could also be adversely
affected.
Natural Disasters and AccidentsShould a natural disaster, human error, terrorist activity, fuel
supply stoppage, or other unforeseen circumstance result in
a major disruption of one of J-POWER’s power plants or
transmission or transformation facilities, or should such an
event disrupt the information systems that control operations
at these facilities, this could potentially hamper our business
operations and consequently have an adverse effect on the
surrounding environment. To prevent accidents at power
plants as well as transmission and transformation facilities,
which are important infrastructure for Japan, to ensure the
safety of involved parties and to preserve the surrounding
environment, J-POWER works to establish security and disas-
ter prevention systems, take accident and disaster prevention
measures and emergency response and recovery counter-
measures, and implement environmental monitoring.
Nevertheless, if an accident or other events were to halt
operations of J-POWER’s power plant, transmission, or trans-
formation facilities, or if an accident or other events were to
negatively impact the surrounding environment, the Compa-
ny’s performance could be adversely affected.
Legal RegulationsElectric power business comprising the majority of J-POWER’s
business is regulated by the Electricity Business Act.
In line with the Amended Electricity Business Act of June
2014, regulations related to wholesale electricity utilities (reg-
ulations on business permits and rates) stipulated in the pre-
vious act were repealed in April 2016. However, J-POWER
will continue to be regulated under the act as an electricity
utility that conducts power generation and transmission busi-
nesses. Thus, J-POWER is subject to business and safety regu-
lations as well as change and suspension orders derived from
such regulations, and also to provisions regarding the cancel-
lation of licenses to operate transmission businesses. Thus,
where we are unable to comply with such laws and regula-
tions, or if such laws or regulations are amended, these may
adversely affect our business operations and performance.
The Company’s business operations are also subject to vari-
ous other laws and regulations. If the Company is unable to
comply with these laws and regulations, or if these laws and
regulations are revised, this could potentially have an adverse
effect on our business operations and performance.
Also, based on the concept of mutual aid for nuclear pow-
er operators, nuclear power business operators are obligated
to contribute to expenses required for the Nuclear Damage
Compensation and Decommissioning Facilitation Corpora-
tion, based on the Nuclear Damage Compensation and De-
commissioning Facilitation Corporation Act, which aims to
build a system that centers on a facilitation organization that
can respond to nuclear damage compensation into the fu-
ture. In relation to the Ohma Nuclear Power Plant Project,
which is currently under way, J-POWER will pay contributions
once the Ohma Nuclear Power Plant commences operation
of the nuclear reactor, as stipulated in the Act on Compensa-
tion for Nuclear Damage. Depending on the amount of such
contributions, this may adversely affect the performance of
the Company.
Management of Business InformationJ-POWER holds a large amount of important information that
must be kept confidential, including personal information.
J-POWER controls this information carefully by implementing
information security measures, employee training programs,
and through other means. However, a leak of sensitive infor-
mation outside the Company could adversely affect J-
POWER’s reputation and business performance.
Management’s Discussion and Analysis
71
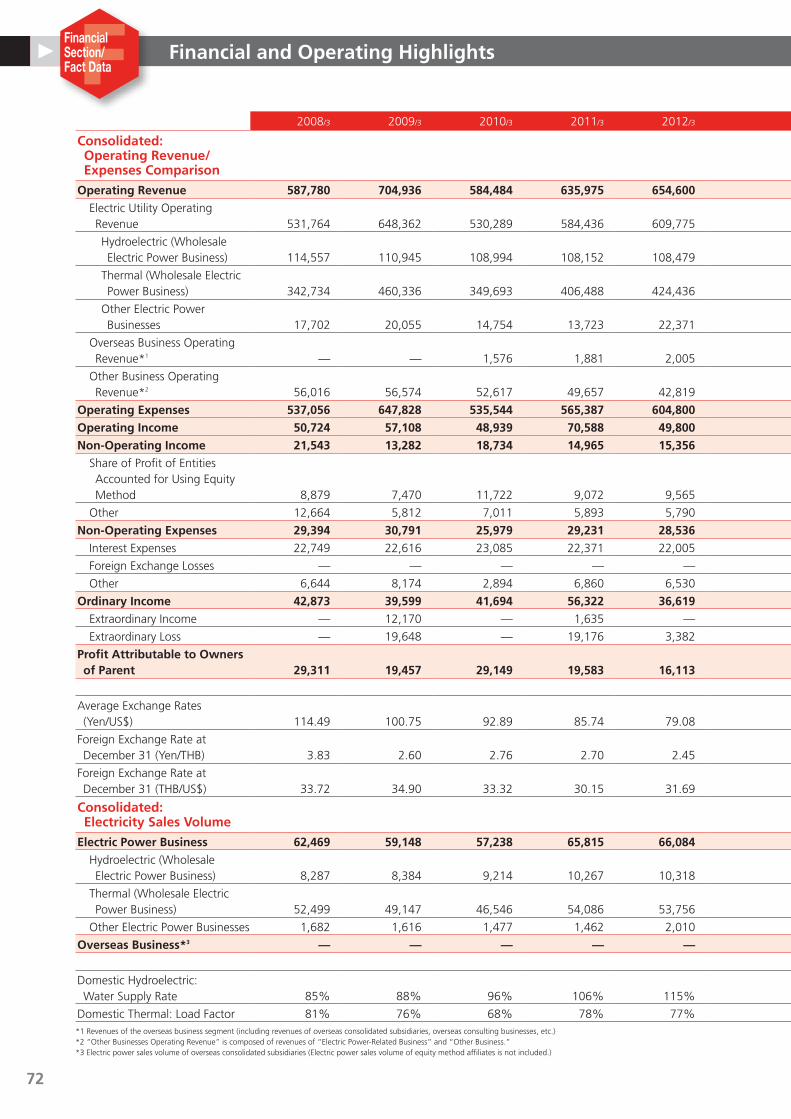
2008/3 2009/3 2010/3 2011/3 2012/3 2013/3 2014/3 2015/3 2016/3
Consolidated: Operating Revenue/ Expenses Comparison (Millions of yen)
Operating Revenue 587,780 704,936 584,484 635,975 654,600 656,056 706,835 750,627 780,072
Electric Utility Operating Revenue 531,764 648,362 530,289 584,436 609,775 605,338 609,080 588,184 570,837
Hydroelectric (Wholesale Electric Power Business) 114,557 110,945 108,994 108,152 108,479 106,681 104,765 105,705 109,034
Thermal (Wholesale Electric Power Business) 342,734 460,336 349,693 406,488 424,436 413,938 411,850 389,192 380,382
Other Electric Power Businesses 17,702 20,055 14,754 13,723 22,371 30,707 37,875 41,707 30,265
Overseas Business Operating Revenue*1 — — 1,576 1,881 2,005 1,647 42,834 108,916 155,952
Other Business Operating Revenue*2 56,016 56,574 52,617 49,657 42,819 49,070 54,920 53,526 53,282
Operating Expenses 537,056 647,828 535,544 565,387 604,800 601,490 647,663 677,767 692,157
Operating Income 50,724 57,108 48,939 70,588 49,800 54,566 59,171 72,859 87,915
Non-Operating Income 21,543 13,282 18,734 14,965 15,356 17,577 22,357 22,714 17,871
Share of Profit of Entities Accounted for Using Equity Method 8,879 7,470 11,722 9,072 9,565 11,728 16,380 15,659 10,889
Other 12,664 5,812 7,011 5,893 5,790 5,849 5,976 7,054 6,981
Non-Operating Expenses 29,394 30,791 25,979 29,231 28,536 27,318 41,451 36,223 47,248
Interest Expenses 22,749 22,616 23,085 22,371 22,005 22,362 25,305 28,224 30,495
Foreign Exchange Losses — — — — — 991 11,190 1,547 12,888
Other 6,644 8,174 2,894 6,860 6,530 3,964 4,955 6,451 3,865
Ordinary Income 42,873 39,599 41,694 56,322 36,619 44,825 40,077 59,350 58,538
Extraordinary Income — 12,170 — 1,635 — — 2,386 2,127 —
Extraordinary Loss — 19,648 — 19,176 3,382 — — — —
Profit Attributable to Owners of Parent 29,311 19,457 29,149 19,583 16,113 29,808 28,694 43,206 40,081
Average Exchange Rates (Yen/US$) 114.49 100.75 92.89 85.74 79.08 82.91 100.17 109.76 120.15
Foreign Exchange Rate at December 31 (Yen/THB) 3.83 2.60 2.76 2.70 2.45 2.82 3.20 3.67 3.34
Foreign Exchange Rate at December 31 (THB/US$) 33.72 34.90 33.32 30.15 31.69 30.63 32.81 32.96 36.09
Consolidated: Electricity Sales Volume (million kWh)
Electric Power Business 62,469 59,148 57,238 65,815 66,084 65,605 65,421 64,049 65,332
Hydroelectric (Wholesale Electric Power Business) 8,287 8,384 9,214 10,267 10,318 9,032 8,759 9,028 10,322
Thermal (Wholesale Electric Power Business) 52,499 49,147 46,546 54,086 53,756 54,333 54,316 52,577 55,010
Other Electric Power Businesses 1,682 1,616 1,477 1,462 2,010 2,239 2,345 2,442 1,985
Overseas Business*3 — — — — — — 3,665 8,678 13,896
Domestic Hydroelectric: Water Supply Rate 85% 88% 96% 106% 115% 102% 99% 98% 111%
Domestic Thermal: Load Factor 81% 76% 68% 78% 77% 78% 79% 76% 80%*1 Revenues of the overseas business segment (including revenues of overseas consolidated subsidiaries, overseas consulting businesses, etc.)*2 “Other Businesses Operating Revenue” is composed of revenues of “Electric Power-Related Business” and “Other Business.”*3 Electric power sales volume of overseas consolidated subsidiaries (Electric power sales volume of equity method affiliates is not included.)
Financial and Operating Highlights
72
FFinancial Section/Fact Data
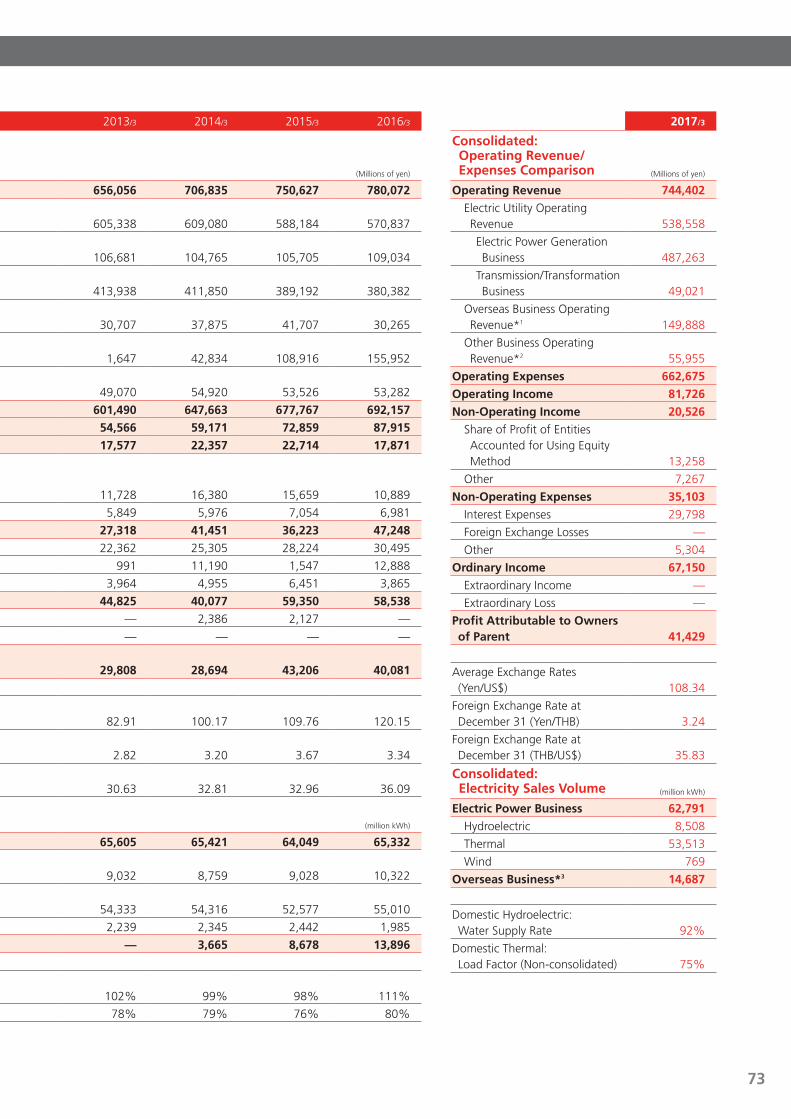
2008/3 2009/3 2010/3 2011/3 2012/3 2013/3 2014/3 2015/3 2016/3
Consolidated: Operating Revenue/ Expenses Comparison (Millions of yen)
Operating Revenue 587,780 704,936 584,484 635,975 654,600 656,056 706,835 750,627 780,072
Electric Utility Operating Revenue 531,764 648,362 530,289 584,436 609,775 605,338 609,080 588,184 570,837
Hydroelectric (Wholesale Electric Power Business) 114,557 110,945 108,994 108,152 108,479 106,681 104,765 105,705 109,034
Thermal (Wholesale Electric Power Business) 342,734 460,336 349,693 406,488 424,436 413,938 411,850 389,192 380,382
Other Electric Power Businesses 17,702 20,055 14,754 13,723 22,371 30,707 37,875 41,707 30,265
Overseas Business Operating Revenue*1 — — 1,576 1,881 2,005 1,647 42,834 108,916 155,952
Other Business Operating Revenue*2 56,016 56,574 52,617 49,657 42,819 49,070 54,920 53,526 53,282
Operating Expenses 537,056 647,828 535,544 565,387 604,800 601,490 647,663 677,767 692,157
Operating Income 50,724 57,108 48,939 70,588 49,800 54,566 59,171 72,859 87,915
Non-Operating Income 21,543 13,282 18,734 14,965 15,356 17,577 22,357 22,714 17,871
Share of Profit of Entities Accounted for Using Equity Method 8,879 7,470 11,722 9,072 9,565 11,728 16,380 15,659 10,889
Other 12,664 5,812 7,011 5,893 5,790 5,849 5,976 7,054 6,981
Non-Operating Expenses 29,394 30,791 25,979 29,231 28,536 27,318 41,451 36,223 47,248
Interest Expenses 22,749 22,616 23,085 22,371 22,005 22,362 25,305 28,224 30,495
Foreign Exchange Losses — — — — — 991 11,190 1,547 12,888
Other 6,644 8,174 2,894 6,860 6,530 3,964 4,955 6,451 3,865
Ordinary Income 42,873 39,599 41,694 56,322 36,619 44,825 40,077 59,350 58,538
Extraordinary Income — 12,170 — 1,635 — — 2,386 2,127 —
Extraordinary Loss — 19,648 — 19,176 3,382 — — — —
Profit Attributable to Owners of Parent 29,311 19,457 29,149 19,583 16,113 29,808 28,694 43,206 40,081
Average Exchange Rates (Yen/US$) 114.49 100.75 92.89 85.74 79.08 82.91 100.17 109.76 120.15
Foreign Exchange Rate at December 31 (Yen/THB) 3.83 2.60 2.76 2.70 2.45 2.82 3.20 3.67 3.34
Foreign Exchange Rate at December 31 (THB/US$) 33.72 34.90 33.32 30.15 31.69 30.63 32.81 32.96 36.09
Consolidated: Electricity Sales Volume (million kWh)
Electric Power Business 62,469 59,148 57,238 65,815 66,084 65,605 65,421 64,049 65,332
Hydroelectric (Wholesale Electric Power Business) 8,287 8,384 9,214 10,267 10,318 9,032 8,759 9,028 10,322
Thermal (Wholesale Electric Power Business) 52,499 49,147 46,546 54,086 53,756 54,333 54,316 52,577 55,010
Other Electric Power Businesses 1,682 1,616 1,477 1,462 2,010 2,239 2,345 2,442 1,985
Overseas Business*3 — — — — — — 3,665 8,678 13,896
Domestic Hydroelectric: Water Supply Rate 85% 88% 96% 106% 115% 102% 99% 98% 111%
Domestic Thermal: Load Factor 81% 76% 68% 78% 77% 78% 79% 76% 80%*1 Revenues of the overseas business segment (including revenues of overseas consolidated subsidiaries, overseas consulting businesses, etc.)*2 “Other Businesses Operating Revenue” is composed of revenues of “Electric Power-Related Business” and “Other Business.”*3 Electric power sales volume of overseas consolidated subsidiaries (Electric power sales volume of equity method affiliates is not included.)
2017/3
Consolidated: Operating Revenue/ Expenses Comparison (Millions of yen)
Operating Revenue 744,402
Electric Utility Operating Revenue 538,558
Electric Power Generation Business 487,263
Transmission/Transformation Business 49,021
Overseas Business Operating Revenue*1 149,888
Other Business Operating Revenue*2 55,955
Operating Expenses 662,675
Operating Income 81,726
Non-Operating Income 20,526
Share of Profit of Entities Accounted for Using Equity Method 13,258
Other 7,267
Non-Operating Expenses 35,103
Interest Expenses 29,798
Foreign Exchange Losses —
Other 5,304
Ordinary Income 67,150
Extraordinary Income —
Extraordinary Loss —
Profit Attributable to Owners of Parent 41,429
Average Exchange Rates (Yen/US$) 108.34
Foreign Exchange Rate at December 31 (Yen/THB) 3.24
Foreign Exchange Rate at December 31 (THB/US$) 35.83
Consolidated: Electricity Sales Volume (million kWh)
Electric Power Business 62,791
Hydroelectric 8,508
Thermal 53,513
Wind 769
Overseas Business*3 14,687
Domestic Hydroelectric: Water Supply Rate 92%
Domestic Thermal: Load Factor (Non-consolidated) 75%
Financial and Operating Highlights
73
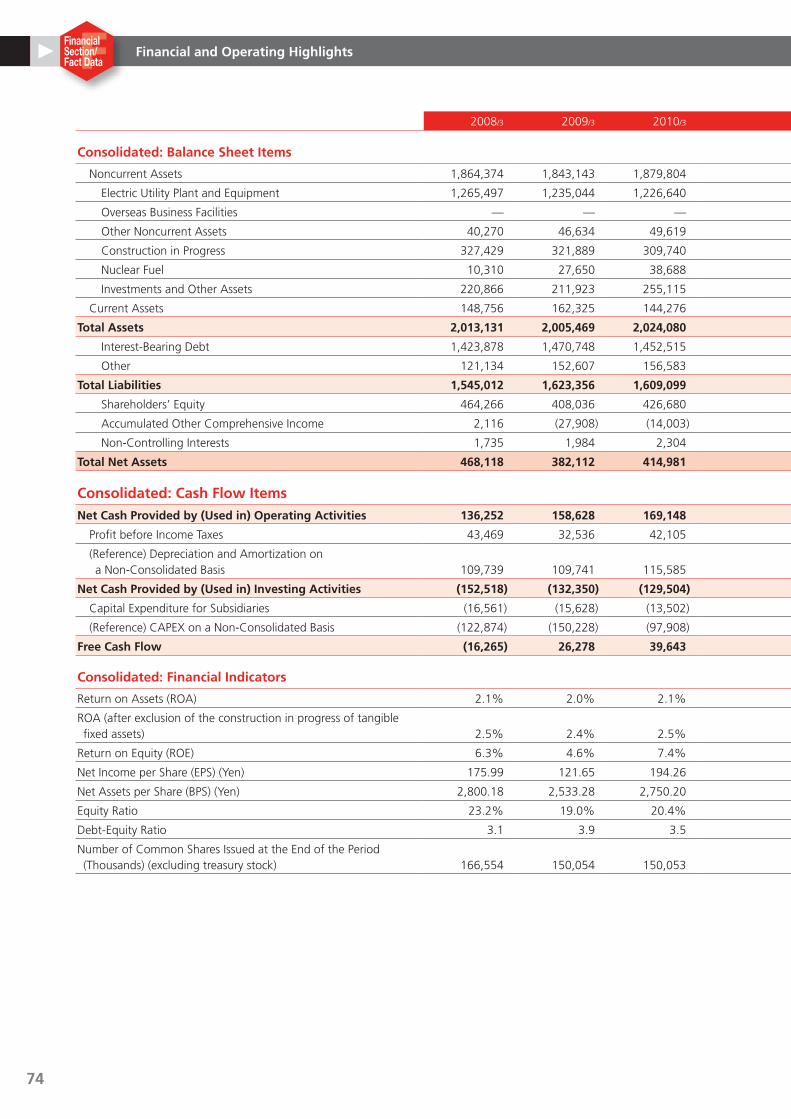
2008/3 2009/3 2010/3 2011/3 2012/3 2013/3 2014/3 2015/3 2016/3 2017/3
Consolidated: Balance Sheet Items (Millions of yen)
Noncurrent Assets 1,864,374 1,843,143 1,879,804 1,842,658 1,849,786 1,975,202 2,149,579 2,275,453 2,232,286 2,271,046
Electric Utility Plant and Equipment 1,265,497 1,235,044 1,226,640 1,178,492 1,111,251 1,058,849 1,023,751 986,552 948,252 958,754
Overseas Business Facilities — — — — — 14,311 125,018 264,800 357,448 332,010
Other Noncurrent Assets 40,270 46,634 49,619 64,920 65,657 104,529 109,787 115,111 101,827 92,501
Construction in Progress 327,429 321,889 309,740 301,676 380,425 464,674 512,604 506,967 441,089 476,171
Nuclear Fuel 10,310 27,650 38,688 46,693 54,157 59,769 69,216 71,467 73,447 73,682
Investments and Other Assets 220,866 211,923 255,115 250,875 238,295 273,067 309,201 330,555 310,231 337,926
Current Assets 148,756 162,325 144,276 169,727 166,607 194,707 235,636 383,695 308,436 335,239
Total Assets 2,013,131 2,005,469 2,024,080 2,012,386 2,016,394 2,169,909 2,385,216 2,659,149 2,540,723 2,606,285
Interest-Bearing Debt 1,423,878 1,470,748 1,452,515 1,429,037 1,435,736 1,523,059 1,649,993 1,723,659 1,628,783 1,620,082
Other 121,134 152,607 156,583 168,450 174,465 192,964 215,745 239,191 236,506 222,183
Total Liabilities 1,545,012 1,623,356 1,609,099 1,597,487 1,610,202 1,716,024 1,865,739 1,962,851 1,865,289 1,842,266
Shareholders’ Equity 464,266 408,036 426,680 435,760 441,369 460,673 478,860 629,463 650,817 689,542
Accumulated Other Comprehensive Income 2,116 (27,908) (14,003) (19,997) (33,985) (6,768) 37,350 59,268 15,775 34,276
Non-Controlling Interests 1,735 1,984 2,304 (863) (1,191) (19) 3,265 7,566 8,839 40,200
Total Net Assets 468,118 382,112 414,981 414,898 406,192 453,885 519,477 696,298 675,433 764,019
Consolidated: Cash Flow Items
Net Cash Provided by (Used in) Operating Activities 136,252 158,628 169,148 151,236 125,891 119,786 122,110 147,813 146,130 115,440
Profit before Income Taxes 43,469 32,536 42,105 38,739 33,237 45,176 42,770 61,598 58,421 67,150
(Reference) Depreciation and Amortization on a Non-Consolidated Basis 109,739 109,741 115,585 106,080 100,423 89,485 81,500 77,824 73,475 49,696
Net Cash Provided by (Used in) Investing Activities (152,518) (132,350) (129,504) (124,675) (136,852) (170,369) (177,375) (142,964) (131,541) (137,663)
Capital Expenditure for Subsidiaries (16,561) (15,628) (13,502) (30,200) (64,235) (100,277) (95,747) (87,971) (37,530) (17,500)
(Reference) CAPEX on a Non-Consolidated Basis (122,874) (150,228) (97,908) (73,796) (68,493) (66,262) (86,554) (61,119) (106,386) (99,844)
Free Cash Flow (16,265) 26,278 39,643 26,560 (10,960) (50,582) (55,264) 4,848 14,588 (22,223)
Consolidated: Financial Indicators
Return on Assets (ROA) 2.1% 2.0% 2.1% 2.8% 1.8% 2.1% 1.8% 2.4% 2.3% 2.6%
ROA (after exclusion of the construction in progress of tangible fixed assets) 2.5% 2.4% 2.5% 3.3% 2.2% 2.7% 2.2% 2.9% 2.8% 3.2%
Return on Equity (ROE) 6.3% 4.6% 7.4% 4.7% 3.9% 6.9% 5.9% 7.2% 5.9% 6.0%
Net Income per Share (EPS) (Yen) 175.99 121.65 194.26 130.51 107.39 198.65 191.23 284.43 218.97 226.33
Net Assets per Share (BPS) (Yen) 2,800.18 2,533.28 2,750.20 2,770.77 2,714.94 3,024.98 3,440.23 3,762.52 3,641.59 3,954.22
Equity Ratio 23.2% 19.0% 20.4% 20.7% 20.2% 20.9% 21.6% 25.9% 26.2% 27.8%
Debt-Equity Ratio 3.1 3.9 3.5 3.4 3.5 3.4 3.2 2.5 2.4 2.2
Number of Common Shares Issued at the End of the Period (Thousands) (excluding treasury stock) 166,554 150,054 150,053 150,053 150,053 150,052 150,051 183,050 183,049 183,049
Financial and Operating Highlights
74
FFinancial Section/Fact Data
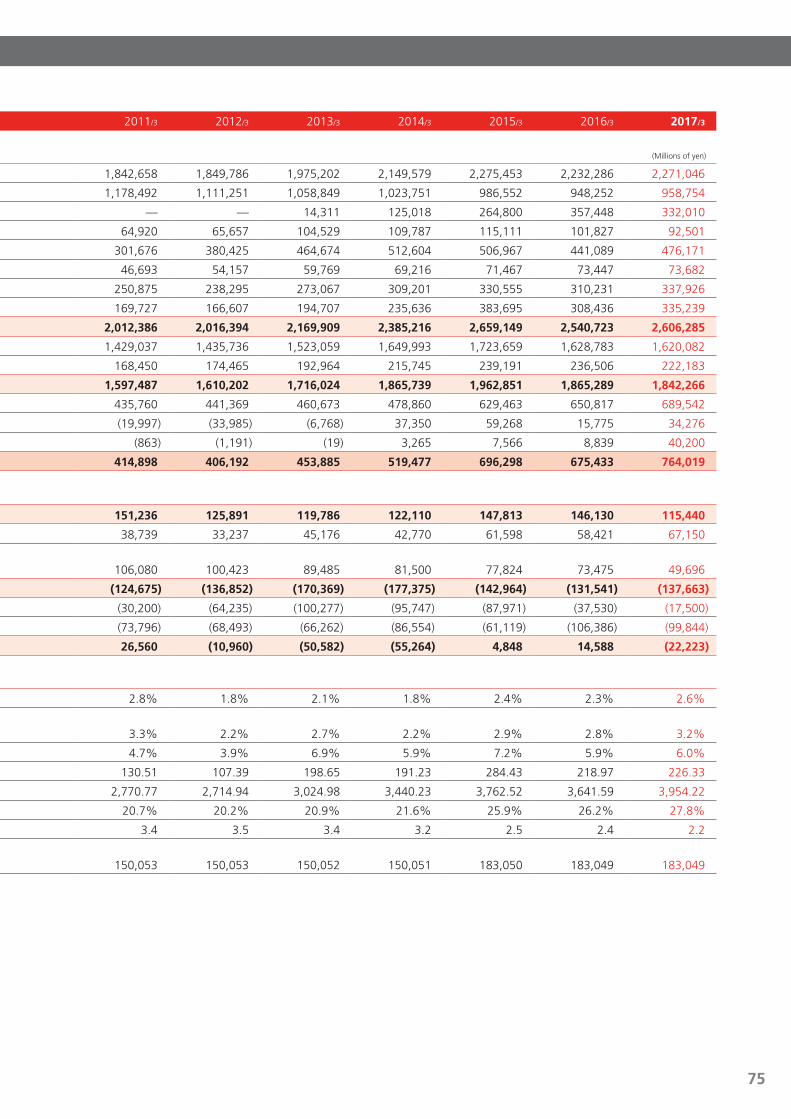
2008/3 2009/3 2010/3 2011/3 2012/3 2013/3 2014/3 2015/3 2016/3 2017/3
Consolidated: Balance Sheet Items (Millions of yen)
Noncurrent Assets 1,864,374 1,843,143 1,879,804 1,842,658 1,849,786 1,975,202 2,149,579 2,275,453 2,232,286 2,271,046
Electric Utility Plant and Equipment 1,265,497 1,235,044 1,226,640 1,178,492 1,111,251 1,058,849 1,023,751 986,552 948,252 958,754
Overseas Business Facilities — — — — — 14,311 125,018 264,800 357,448 332,010
Other Noncurrent Assets 40,270 46,634 49,619 64,920 65,657 104,529 109,787 115,111 101,827 92,501
Construction in Progress 327,429 321,889 309,740 301,676 380,425 464,674 512,604 506,967 441,089 476,171
Nuclear Fuel 10,310 27,650 38,688 46,693 54,157 59,769 69,216 71,467 73,447 73,682
Investments and Other Assets 220,866 211,923 255,115 250,875 238,295 273,067 309,201 330,555 310,231 337,926
Current Assets 148,756 162,325 144,276 169,727 166,607 194,707 235,636 383,695 308,436 335,239
Total Assets 2,013,131 2,005,469 2,024,080 2,012,386 2,016,394 2,169,909 2,385,216 2,659,149 2,540,723 2,606,285
Interest-Bearing Debt 1,423,878 1,470,748 1,452,515 1,429,037 1,435,736 1,523,059 1,649,993 1,723,659 1,628,783 1,620,082
Other 121,134 152,607 156,583 168,450 174,465 192,964 215,745 239,191 236,506 222,183
Total Liabilities 1,545,012 1,623,356 1,609,099 1,597,487 1,610,202 1,716,024 1,865,739 1,962,851 1,865,289 1,842,266
Shareholders’ Equity 464,266 408,036 426,680 435,760 441,369 460,673 478,860 629,463 650,817 689,542
Accumulated Other Comprehensive Income 2,116 (27,908) (14,003) (19,997) (33,985) (6,768) 37,350 59,268 15,775 34,276
Non-Controlling Interests 1,735 1,984 2,304 (863) (1,191) (19) 3,265 7,566 8,839 40,200
Total Net Assets 468,118 382,112 414,981 414,898 406,192 453,885 519,477 696,298 675,433 764,019
Consolidated: Cash Flow Items
Net Cash Provided by (Used in) Operating Activities 136,252 158,628 169,148 151,236 125,891 119,786 122,110 147,813 146,130 115,440
Profit before Income Taxes 43,469 32,536 42,105 38,739 33,237 45,176 42,770 61,598 58,421 67,150
(Reference) Depreciation and Amortization on a Non-Consolidated Basis 109,739 109,741 115,585 106,080 100,423 89,485 81,500 77,824 73,475 49,696
Net Cash Provided by (Used in) Investing Activities (152,518) (132,350) (129,504) (124,675) (136,852) (170,369) (177,375) (142,964) (131,541) (137,663)
Capital Expenditure for Subsidiaries (16,561) (15,628) (13,502) (30,200) (64,235) (100,277) (95,747) (87,971) (37,530) (17,500)
(Reference) CAPEX on a Non-Consolidated Basis (122,874) (150,228) (97,908) (73,796) (68,493) (66,262) (86,554) (61,119) (106,386) (99,844)
Free Cash Flow (16,265) 26,278 39,643 26,560 (10,960) (50,582) (55,264) 4,848 14,588 (22,223)
Consolidated: Financial Indicators
Return on Assets (ROA) 2.1% 2.0% 2.1% 2.8% 1.8% 2.1% 1.8% 2.4% 2.3% 2.6%
ROA (after exclusion of the construction in progress of tangible fixed assets) 2.5% 2.4% 2.5% 3.3% 2.2% 2.7% 2.2% 2.9% 2.8% 3.2%
Return on Equity (ROE) 6.3% 4.6% 7.4% 4.7% 3.9% 6.9% 5.9% 7.2% 5.9% 6.0%
Net Income per Share (EPS) (Yen) 175.99 121.65 194.26 130.51 107.39 198.65 191.23 284.43 218.97 226.33
Net Assets per Share (BPS) (Yen) 2,800.18 2,533.28 2,750.20 2,770.77 2,714.94 3,024.98 3,440.23 3,762.52 3,641.59 3,954.22
Equity Ratio 23.2% 19.0% 20.4% 20.7% 20.2% 20.9% 21.6% 25.9% 26.2% 27.8%
Debt-Equity Ratio 3.1 3.9 3.5 3.4 3.5 3.4 3.2 2.5 2.4 2.2
Number of Common Shares Issued at the End of the Period (Thousands) (excluding treasury stock) 166,554 150,054 150,053 150,053 150,053 150,052 150,051 183,050 183,049 183,049
Financial and Operating Highlights
75
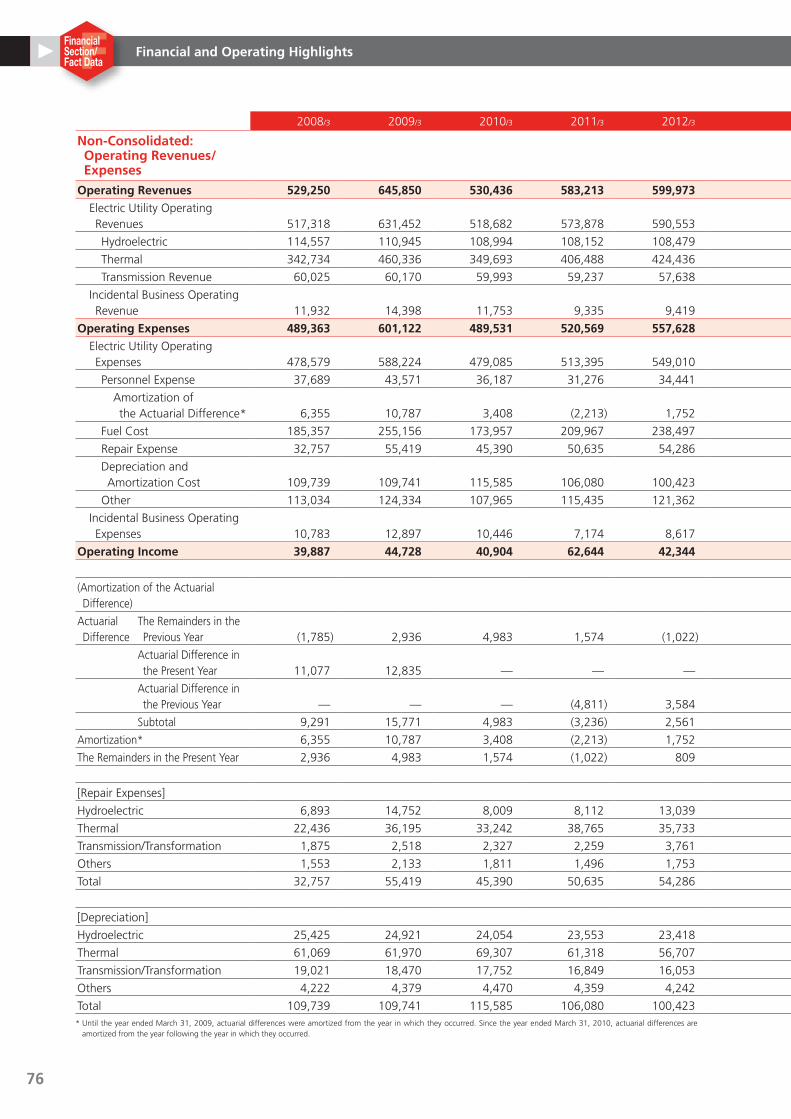
2008/3 2009/3 2010/3 2011/3 2012/3 2013/3 2014/3 2015/3 2016/3
Non-Consolidated: Operating Revenues/ Expenses (Millions of yen)
Operating Revenues 529,250 645,850 530,436 583,213 599,973 586,993 582,861 557,943 552,341
Electric Utility Operating Revenues 517,318 631,452 518,682 573,878 590,553 577,284 572,937 548,580 543,019
Hydroelectric 114,557 110,945 108,994 108,152 108,479 106,681 104,765 105,705 109,034
Thermal 342,734 460,336 349,693 406,488 424,436 413,938 411,935 389,607 381,201
Transmission Revenue 60,025 60,170 59,993 59,237 57,638 56,664 56,236 53,267 52,783
Incidental Business Operating Revenue 11,932 14,398 11,753 9,335 9,419 9,708 9,923 9,363 9,322
Operating Expenses 489,363 601,122 489,531 520,569 557,628 543,659 542,396 513,387 510,770
Electric Utility Operating Expenses 478,579 588,224 479,085 513,395 549,010 534,765 533,444 504,946 502,326
Personnel Expense 37,689 43,571 36,187 31,276 34,441 34,084 29,810 28,566 31,811
Amortization of the Actuarial Difference* 6,355 10,787 3,408 (2,213) 1,752 505 (3,099) (4,372) (2,308)
Fuel Cost 185,357 255,156 173,957 209,967 238,497 238,441 250,259 228,482 218,481
Repair Expense 32,757 55,419 45,390 50,635 54,286 56,454 58,521 61,005 58,325
Depreciation and Amortization Cost 109,739 109,741 115,585 106,080 100,423 89,485 81,500 77,824 73,475
Other 113,034 124,334 107,965 115,435 121,362 116,299 113,352 109,067 120,231
Incidental Business Operating Expenses 10,783 12,897 10,446 7,174 8,617 8,894 8,952 8,441 8,444
Operating Income 39,887 44,728 40,904 62,644 42,344 43,333 40,464 44,555 41,570
(Amortization of the Actuarial Difference)
Actuarial The Remainders in the Difference Previous Year (1,785) 2,936 4,983 1,574 (1,022) 809 233 (1,431) (2,019)
Actuarial Difference in the Present Year 11,077 12,835 — — — — — — —
Actuarial Difference in the Previous Year — — — (4,811) 3,584 (70) (4,746) (4,960) (1,354)
Subtotal 9,291 15,771 4,983 (3,236) 2,561 738 (4,530) (6,392) (3,374)
Amortization* 6,355 10,787 3,408 (2,213) 1,752 505 (3,099) (4,372) (2,308)
The Remainders in the Present Year 2,936 4,983 1,574 (1,022) 809 233 (1,431) (2,019) (1,066)
[Repair Expenses]
Hydroelectric 6,893 14,752 8,009 8,112 13,039 11,340 11,776 13,391 12,160
Thermal 22,436 36,195 33,242 38,765 35,733 40,438 41,942 42,382 40,985
Transmission/Transformation 1,875 2,518 2,327 2,259 3,761 3,161 3,205 3,671 3,495
Others 1,553 2,133 1,811 1,496 1,753 1,513 1,596 1,558 1,683
Total 32,757 55,419 45,390 50,635 54,286 56,454 58,521 61,005 58,325
[Depreciation]
Hydroelectric 25,425 24,921 24,054 23,553 23,418 21,852 21,318 20,947 20,640
Thermal 61,069 61,970 69,307 61,318 56,707 48,411 40,879 37,982 33,409
Transmission/Transformation 19,021 18,470 17,752 16,849 16,053 15,302 15,074 14,395 13,871
Others 4,222 4,379 4,470 4,359 4,242 3,919 4,226 4,500 5,553
Total 109,739 109,741 115,585 106,080 100,423 89,485 81,500 77,824 73,475* Until the year ended March 31, 2009, actuarial differences were amortized from the year in which they occurred. Since the year ended March 31, 2010, actuarial differences are
amortized from the year following the year in which they occurred.
Financial and Operating Highlights
76
FFinancial Section/Fact Data
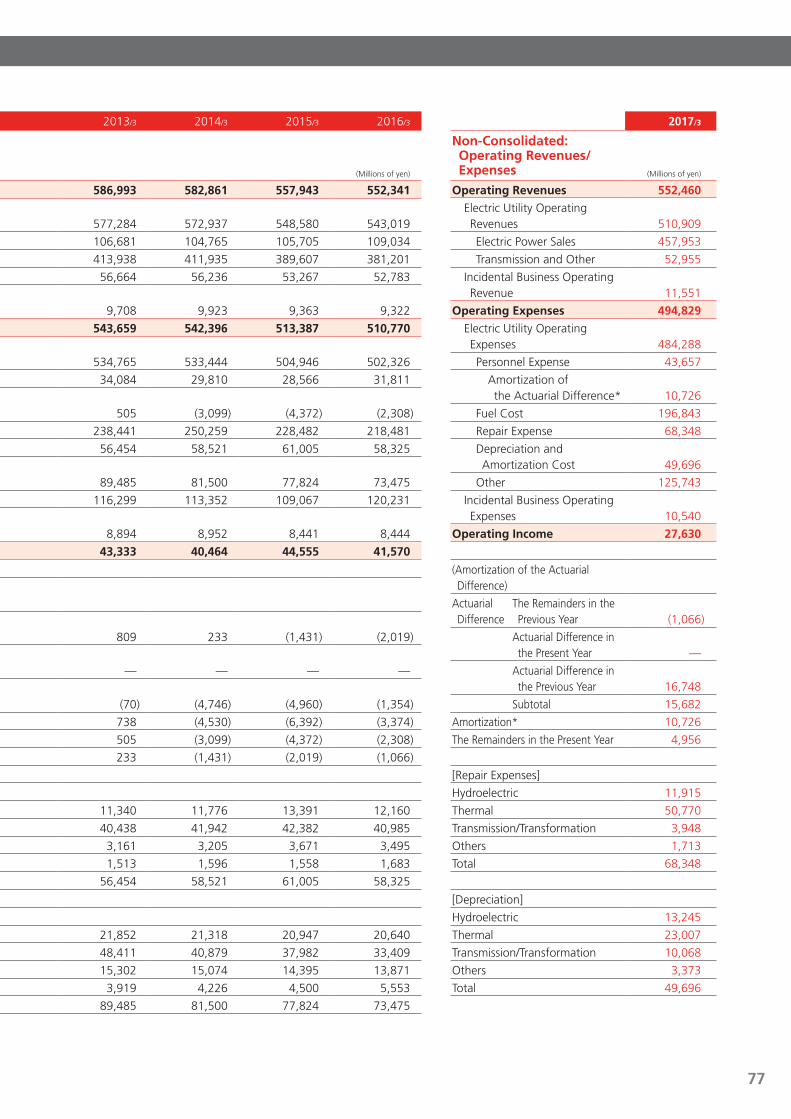
2008/3 2009/3 2010/3 2011/3 2012/3 2013/3 2014/3 2015/3 2016/3
Non-Consolidated: Operating Revenues/ Expenses (Millions of yen)
Operating Revenues 529,250 645,850 530,436 583,213 599,973 586,993 582,861 557,943 552,341
Electric Utility Operating Revenues 517,318 631,452 518,682 573,878 590,553 577,284 572,937 548,580 543,019
Hydroelectric 114,557 110,945 108,994 108,152 108,479 106,681 104,765 105,705 109,034
Thermal 342,734 460,336 349,693 406,488 424,436 413,938 411,935 389,607 381,201
Transmission Revenue 60,025 60,170 59,993 59,237 57,638 56,664 56,236 53,267 52,783
Incidental Business Operating Revenue 11,932 14,398 11,753 9,335 9,419 9,708 9,923 9,363 9,322
Operating Expenses 489,363 601,122 489,531 520,569 557,628 543,659 542,396 513,387 510,770
Electric Utility Operating Expenses 478,579 588,224 479,085 513,395 549,010 534,765 533,444 504,946 502,326
Personnel Expense 37,689 43,571 36,187 31,276 34,441 34,084 29,810 28,566 31,811
Amortization of the Actuarial Difference* 6,355 10,787 3,408 (2,213) 1,752 505 (3,099) (4,372) (2,308)
Fuel Cost 185,357 255,156 173,957 209,967 238,497 238,441 250,259 228,482 218,481
Repair Expense 32,757 55,419 45,390 50,635 54,286 56,454 58,521 61,005 58,325
Depreciation and Amortization Cost 109,739 109,741 115,585 106,080 100,423 89,485 81,500 77,824 73,475
Other 113,034 124,334 107,965 115,435 121,362 116,299 113,352 109,067 120,231
Incidental Business Operating Expenses 10,783 12,897 10,446 7,174 8,617 8,894 8,952 8,441 8,444
Operating Income 39,887 44,728 40,904 62,644 42,344 43,333 40,464 44,555 41,570
(Amortization of the Actuarial Difference)
Actuarial The Remainders in the Difference Previous Year (1,785) 2,936 4,983 1,574 (1,022) 809 233 (1,431) (2,019)
Actuarial Difference in the Present Year 11,077 12,835 — — — — — — —
Actuarial Difference in the Previous Year — — — (4,811) 3,584 (70) (4,746) (4,960) (1,354)
Subtotal 9,291 15,771 4,983 (3,236) 2,561 738 (4,530) (6,392) (3,374)
Amortization* 6,355 10,787 3,408 (2,213) 1,752 505 (3,099) (4,372) (2,308)
The Remainders in the Present Year 2,936 4,983 1,574 (1,022) 809 233 (1,431) (2,019) (1,066)
[Repair Expenses]
Hydroelectric 6,893 14,752 8,009 8,112 13,039 11,340 11,776 13,391 12,160
Thermal 22,436 36,195 33,242 38,765 35,733 40,438 41,942 42,382 40,985
Transmission/Transformation 1,875 2,518 2,327 2,259 3,761 3,161 3,205 3,671 3,495
Others 1,553 2,133 1,811 1,496 1,753 1,513 1,596 1,558 1,683
Total 32,757 55,419 45,390 50,635 54,286 56,454 58,521 61,005 58,325
[Depreciation]
Hydroelectric 25,425 24,921 24,054 23,553 23,418 21,852 21,318 20,947 20,640
Thermal 61,069 61,970 69,307 61,318 56,707 48,411 40,879 37,982 33,409
Transmission/Transformation 19,021 18,470 17,752 16,849 16,053 15,302 15,074 14,395 13,871
Others 4,222 4,379 4,470 4,359 4,242 3,919 4,226 4,500 5,553
Total 109,739 109,741 115,585 106,080 100,423 89,485 81,500 77,824 73,475* Until the year ended March 31, 2009, actuarial differences were amortized from the year in which they occurred. Since the year ended March 31, 2010, actuarial differences are
amortized from the year following the year in which they occurred.
2017/3
Non-Consolidated: Operating Revenues/ Expenses (Millions of yen)
Operating Revenues 552,460
Electric Utility Operating Revenues 510,909
Electric Power Sales 457,953
Transmission and Other 52,955
Incidental Business Operating Revenue 11,551
Operating Expenses 494,829
Electric Utility Operating Expenses 484,288
Personnel Expense 43,657
Amortization of the Actuarial Difference* 10,726
Fuel Cost 196,843
Repair Expense 68,348
Depreciation and Amortization Cost 49,696
Other 125,743
Incidental Business Operating Expenses 10,540
Operating Income 27,630
(Amortization of the Actuarial Difference)
Actuarial The Remainders in the Difference Previous Year (1,066)
Actuarial Difference in the Present Year —
Actuarial Difference in the Previous Year 16,748
Subtotal 15,682
Amortization* 10,726
The Remainders in the Present Year 4,956
[Repair Expenses]
Hydroelectric 11,915
Thermal 50,770
Transmission/Transformation 3,948
Others 1,713
Total 68,348
[Depreciation]
Hydroelectric 13,245
Thermal 23,007
Transmission/Transformation 10,068
Others 3,373
Total 49,696
Financial and Operating Highlights
77
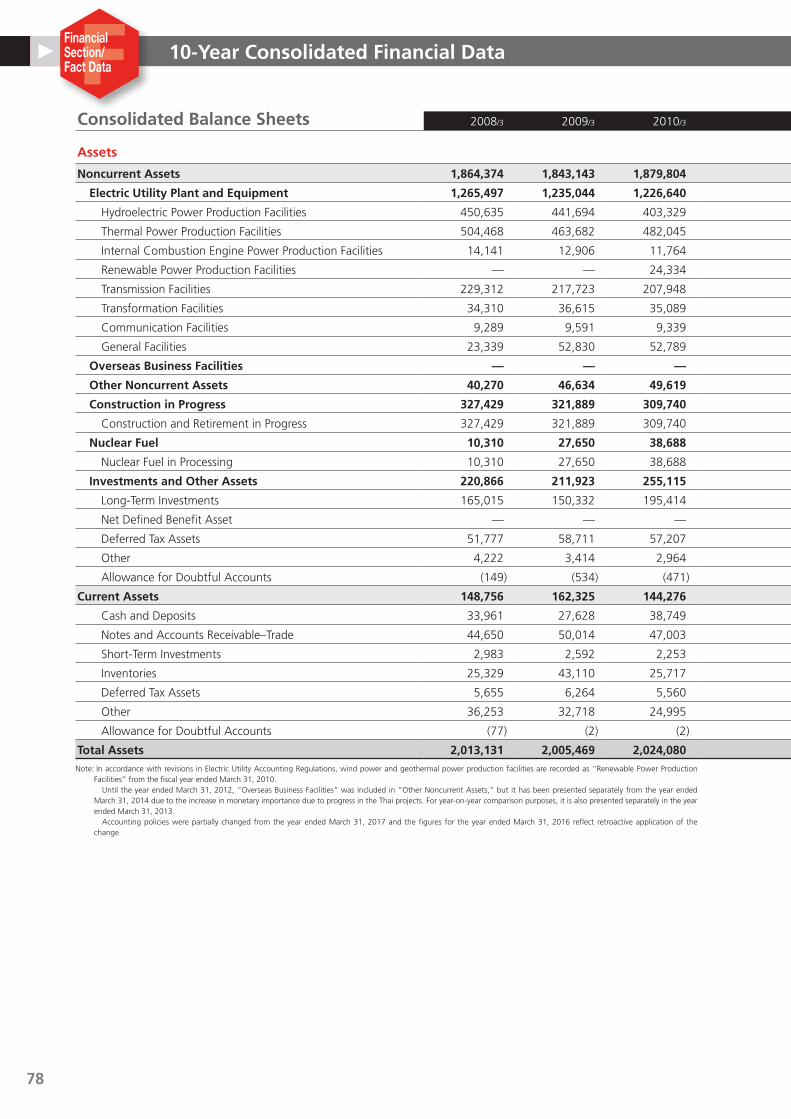
Consolidated Balance Sheets 2008/3 2009/3 2010/3 2011/3 2012/3 2013/3 2014/3 2015/3 2016/3 2017/3
Assets (Millions of yen)
Noncurrent Assets 1,864,374 1,843,143 1,879,804 1,842,658 1,849,786 1,975,202 2,149,579 2,275,453 2,232,286 2,271,046
Electric Utility Plant and Equipment 1,265,497 1,235,044 1,226,640 1,178,492 1,111,251 1,058,849 1,023,751 986,552 948,252 958,754
Hydroelectric Power Production Facilities 450,635 441,694 403,329 389,892 374,510 363,437 355,616 348,911 343,193 346,037
Thermal Power Production Facilities 504,468 463,682 482,045 454,823 423,049 387,957 362,307 334,252 313,744 313,198
Internal Combustion Engine Power Production Facilities 14,141 12,906 11,764 4,694 4,296 3,956 5,414 5,105 3,754 3,301
Renewable Power Production Facilities — — 24,334 38,436 34,479 31,358 36,698 40,877 35,960 46,170
Transmission Facilities 229,312 217,723 207,948 197,163 186,274 185,754 176,102 168,680 161,491 157,790
Transformation Facilities 34,310 36,615 35,089 34,456 31,774 30,608 30,482 30,206 29,884 29,598
Communication Facilities 9,289 9,591 9,339 9,539 9,065 8,638 8,596 8,469 8,449 8,186
General Facilities 23,339 52,830 52,789 49,486 47,801 47,137 48,532 50,049 51,772 54,470
Overseas Business Facilities — — — — — 14,311 125,018 264,800 357,448 332,010
Other Noncurrent Assets 40,270 46,634 49,619 64,920 65,657 104,529 109,787 115,111 101,827 92,501
Construction in Progress 327,429 321,889 309,740 301,676 380,425 464,674 512,604 506,967 441,080 476,171
Construction and Retirement in Progress 327,429 321,889 309,740 301,676 380,425 464,674 512,604 506,967 441,080 476,171
Nuclear Fuel 10,310 27,650 38,688 46,693 54,157 59,769 69,216 71,467 73,447 73,682
Nuclear Fuel in Processing 10,310 27,650 38,688 46,693 54,157 59,769 69,216 71,467 73,447 73,682
Investments and Other Assets 220,866 211,923 255,115 250,875 238,295 273,067 309,201 330,555 310,231 337,926
Long-Term Investments 165,015 150,332 195,414 181,934 181,132 202,464 244,181 269,891 234,506 253,660
Net Defined Benefit Asset — — — — — — — 278 — 2
Deferred Tax Assets 51,777 58,711 57,207 56,843 52,571 47,234 40,734 38,705 43,818 40,514
Other 4,222 3,414 2,964 13,292 5,653 24,416 24,331 21,725 31,950 43,794
Allowance for Doubtful Accounts (149) (534) (471) (1,196) (1,062) (1,047) (45) (45) (45) (45)
Current Assets 148,756 162,325 144,276 169,727 166,607 194,707 235,636 383,695 308,436 335,239
Cash and Deposits 33,961 27,628 38,749 37,202 35,112 49,283 50,333 69,151 87,659 117,240
Notes and Accounts Receivable–Trade 44,650 50,014 47,003 57,781 59,283 61,644 70,135 71,288 66,312 78,805
Short-Term Investments 2,983 2,592 2,253 2,346 1,331 402 35,000 167,433 72,410 51,344
Inventories 25,329 43,110 25,717 32,400 34,972 38,160 34,053 37,781 41,199 47,172
Deferred Tax Assets 5,655 6,264 5,560 5,998 6,688 7,423 8,637 5,736 5,268 4,564
Other 36,253 32,718 24,995 34,006 29,284 37,847 37,477 32,337 35,601 36,129
Allowance for Doubtful Accounts (77) (2) (2) (9) (63) (54) (0) (32) (14) (18)
Total Assets 2,013,131 2,005,469 2,024,080 2,012,386 2,016,394 2,169,909 2,385,216 2,659,149 2,540,723 2,606,285Note: In accordance with revisions in Electric Utility Accounting Regulations, wind power and geothermal power production facilities are recorded as “Renewable Power Production
Facilities” from the fiscal year ended March 31, 2010. Until the year ended March 31, 2012, “Overseas Business Facilities” was included in “Other Noncurrent Assets,” but it has been presented separately from the year ended March 31, 2014 due to the increase in monetary importance due to progress in the Thai projects. For year-on-year comparison purposes, it is also presented separately in the year ended March 31, 2013. Accounting policies were partially changed from the year ended March 31, 2017 and the figures for the year ended March 31, 2016 reflect retroactive application of the change.
10-Year Consolidated Financial Data
78
FFinancial Section/Fact Data
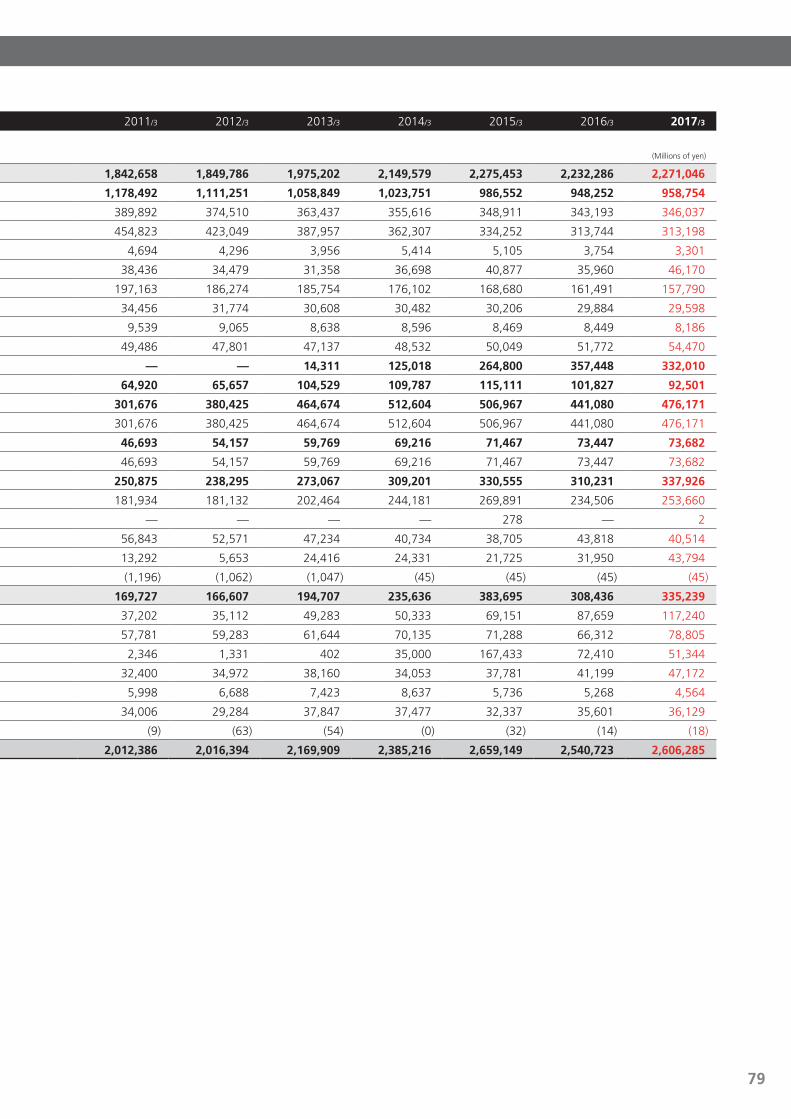
Consolidated Balance Sheets 2008/3 2009/3 2010/3 2011/3 2012/3 2013/3 2014/3 2015/3 2016/3 2017/3
Assets (Millions of yen)
Noncurrent Assets 1,864,374 1,843,143 1,879,804 1,842,658 1,849,786 1,975,202 2,149,579 2,275,453 2,232,286 2,271,046
Electric Utility Plant and Equipment 1,265,497 1,235,044 1,226,640 1,178,492 1,111,251 1,058,849 1,023,751 986,552 948,252 958,754
Hydroelectric Power Production Facilities 450,635 441,694 403,329 389,892 374,510 363,437 355,616 348,911 343,193 346,037
Thermal Power Production Facilities 504,468 463,682 482,045 454,823 423,049 387,957 362,307 334,252 313,744 313,198
Internal Combustion Engine Power Production Facilities 14,141 12,906 11,764 4,694 4,296 3,956 5,414 5,105 3,754 3,301
Renewable Power Production Facilities — — 24,334 38,436 34,479 31,358 36,698 40,877 35,960 46,170
Transmission Facilities 229,312 217,723 207,948 197,163 186,274 185,754 176,102 168,680 161,491 157,790
Transformation Facilities 34,310 36,615 35,089 34,456 31,774 30,608 30,482 30,206 29,884 29,598
Communication Facilities 9,289 9,591 9,339 9,539 9,065 8,638 8,596 8,469 8,449 8,186
General Facilities 23,339 52,830 52,789 49,486 47,801 47,137 48,532 50,049 51,772 54,470
Overseas Business Facilities — — — — — 14,311 125,018 264,800 357,448 332,010
Other Noncurrent Assets 40,270 46,634 49,619 64,920 65,657 104,529 109,787 115,111 101,827 92,501
Construction in Progress 327,429 321,889 309,740 301,676 380,425 464,674 512,604 506,967 441,080 476,171
Construction and Retirement in Progress 327,429 321,889 309,740 301,676 380,425 464,674 512,604 506,967 441,080 476,171
Nuclear Fuel 10,310 27,650 38,688 46,693 54,157 59,769 69,216 71,467 73,447 73,682
Nuclear Fuel in Processing 10,310 27,650 38,688 46,693 54,157 59,769 69,216 71,467 73,447 73,682
Investments and Other Assets 220,866 211,923 255,115 250,875 238,295 273,067 309,201 330,555 310,231 337,926
Long-Term Investments 165,015 150,332 195,414 181,934 181,132 202,464 244,181 269,891 234,506 253,660
Net Defined Benefit Asset — — — — — — — 278 — 2
Deferred Tax Assets 51,777 58,711 57,207 56,843 52,571 47,234 40,734 38,705 43,818 40,514
Other 4,222 3,414 2,964 13,292 5,653 24,416 24,331 21,725 31,950 43,794
Allowance for Doubtful Accounts (149) (534) (471) (1,196) (1,062) (1,047) (45) (45) (45) (45)
Current Assets 148,756 162,325 144,276 169,727 166,607 194,707 235,636 383,695 308,436 335,239
Cash and Deposits 33,961 27,628 38,749 37,202 35,112 49,283 50,333 69,151 87,659 117,240
Notes and Accounts Receivable–Trade 44,650 50,014 47,003 57,781 59,283 61,644 70,135 71,288 66,312 78,805
Short-Term Investments 2,983 2,592 2,253 2,346 1,331 402 35,000 167,433 72,410 51,344
Inventories 25,329 43,110 25,717 32,400 34,972 38,160 34,053 37,781 41,199 47,172
Deferred Tax Assets 5,655 6,264 5,560 5,998 6,688 7,423 8,637 5,736 5,268 4,564
Other 36,253 32,718 24,995 34,006 29,284 37,847 37,477 32,337 35,601 36,129
Allowance for Doubtful Accounts (77) (2) (2) (9) (63) (54) (0) (32) (14) (18)
Total Assets 2,013,131 2,005,469 2,024,080 2,012,386 2,016,394 2,169,909 2,385,216 2,659,149 2,540,723 2,606,285Note: In accordance with revisions in Electric Utility Accounting Regulations, wind power and geothermal power production facilities are recorded as “Renewable Power Production
Facilities” from the fiscal year ended March 31, 2010. Until the year ended March 31, 2012, “Overseas Business Facilities” was included in “Other Noncurrent Assets,” but it has been presented separately from the year ended March 31, 2014 due to the increase in monetary importance due to progress in the Thai projects. For year-on-year comparison purposes, it is also presented separately in the year ended March 31, 2013. Accounting policies were partially changed from the year ended March 31, 2017 and the figures for the year ended March 31, 2016 reflect retroactive application of the change.
10-Year Consolidated Financial Data
79

2008/3 2009/3 2010/3 2011/3 2012/3 2013/3 2014/3 2015/3 2016/3 2017/3
Liabilities (Millions of yen)
Noncurrent Liabilities 1,276,354 1,304,830 1,346,526 1,319,146 1,324,663 1,402,287 1,522,905 1,633,825 1,561,072 1,497,888
Bonds Payable 602,903 717,867 689,883 734,898 714,914 694,930 691,346 666,061 575,079 494,991
Long-Term Loans Payable 624,495 513,239 580,925 500,913 522,407 608,977 741,509 857,846 867,276 891,200
Lease Obligations — 520 811 1,093 983 982 981 697 479 353
Provision for Retirement Benefits 39,083 51,931 57,855 57,069 58,015 59,012 — — — —
Other Provision 553 1,098 1,111 16 25 36 43 84 89 120
Net Defined Benefit Liability — — — — — — 49,071 48,901 65,912 58,079
Asset Retirement Obligations — — — 3,620 4,585 3,971 6,644 7,510 11,685 11,971
Deferred Tax Liabilities 1,462 2,352 3,459 5,869 6,390 7,801 14,730 20,394 18,294 23,387
Other 7,856 17,820 12,479 15,666 17,339 26,574 18,579 32,327 22,254 17,783
Current Liabilities 267,097 317,379 261,837 277,563 284,761 313,311 342,714 329,025 304,100 344,377
Current Portion of Noncurrent Liabilities 101,565 120,700 142,923 162,958 166,342 196,999 207,968 169,754 158,131 208,760
Short-Term Loans Payable 6,126 9,098 13,327 17,528 18,443 18,475 20,318 30,044 28,009 24,957
Commercial Papers 88,949 109,971 24,998 11,999 12,999 3,999 — — — —
Notes and Accounts Payable –Trade 14,790 10,144 14,804 20,112 20,011 25,049 33,197 44,035 37,033 24,616
Accrued Taxes 11,407 16,317 7,952 21,322 11,408 10,811 8,791 13,516 23,344 19,843
Other Provision 555 713 855 317 325 273 302 270 265 267
Asset Retirement Obligations — — — 473 626 1,495 245 372 635 592
Deferred Tax Liabilities 2 9 5 11 4 3 9 5 22 5
Other 43,700 50,423 56,970 42,839 54,599 56,202 71,880 71,027 56,656 65,333
Reserves under Special Laws 1,560 1,146 734 777 777 425 119 — 116 —
Reserve for Fluctuation in Water Levels 1,560 1,146 734 777 777 425 119 — 116 —
Total Liabilities 1,545,012 1,623,356 1,609,099 1,597,487 1,610,202 1,716,024 1,865,739 1,962,851 1,865,289 1,842,266
Net Assets
Shareholders’ Equity 464,266 408,036 426,680 435,760 441,369 460,673 478,860 629,463 650,817 689,542
Capital Stock 152,449 152,449 152,449 152,449 152,449 152,449 152,449 180,502 180,502 180,502
Capital Surplus 81,849 81,849 81,849 81,849 81,849 81,849 81,849 109,902 109,902 119,927
Retained Earnings 230,032 236,998 255,643 264,724 270,334 289,639 307,829 339,061 360,418 389,117
Treasury Shares (64) (63,260) (63,262) (63,263) (63,264) (63,265) (63,268) (2) (4) (5)
Accumulated Other Comprehensive Income 2,116 (27,908) (14,003) (19,997) (33,985) (6,768) 37,350 59,268 15,775 34,276
Valuation Difference on Available-for-Sale Securities 1,934 (404) 2,960 (137) (772) 4,855 9,030 19,860 12,516 15,594
Deferred Gains or Losses on Hedges (6,759) (6,285) (3,747) 611 (4,209) (6,929) 1,772 (15,821) (14,395) (2,183)
Foreign Currency Translation Adjustment 6,941 (21,217) (13,217) (20,471) (29,003) (4,693) 22,955 53,205 30,464 21,295
Remeasurements of Defined Benefit Plans — — — — — — 3,592 2,023 (12,809) (430)
Non-Controlling Interests 1,735 1,984 2,304 (863) (1,191) (19) 3,265 7,566 8,839 40,200
Total Net Assets 468,118 382,112 414,981 414,898 406,192 453,885 519,477 696,298 675,433 764,019
Total Liabilities and Net Assets 2,013,131 2,005,469 2,024,080 2,012,386 2,016,394 2,169,909 2,385,216 2,659,149 2,540,723 2,606,285Note: The “Accounting Standards for Retirement Benefits” (Corporate Accounting Standard No. 26 of May 17, 2012) and the “Guidelines for Applying Accounting Standards for
Retirement Benefits” (Corporate Accounting Standard Application Guideline No. 25 of May 17, 2012) are applied from the end of the consolidated fiscal year ended March 31, 2014. Accounting policies were partially changed from the year ended March 31, 2017 and the figures for the year ended March 31, 2016 reflect retroactive application of the change.
10-Year Consolidated Financial Data
80
FFinancial Section/Fact Data
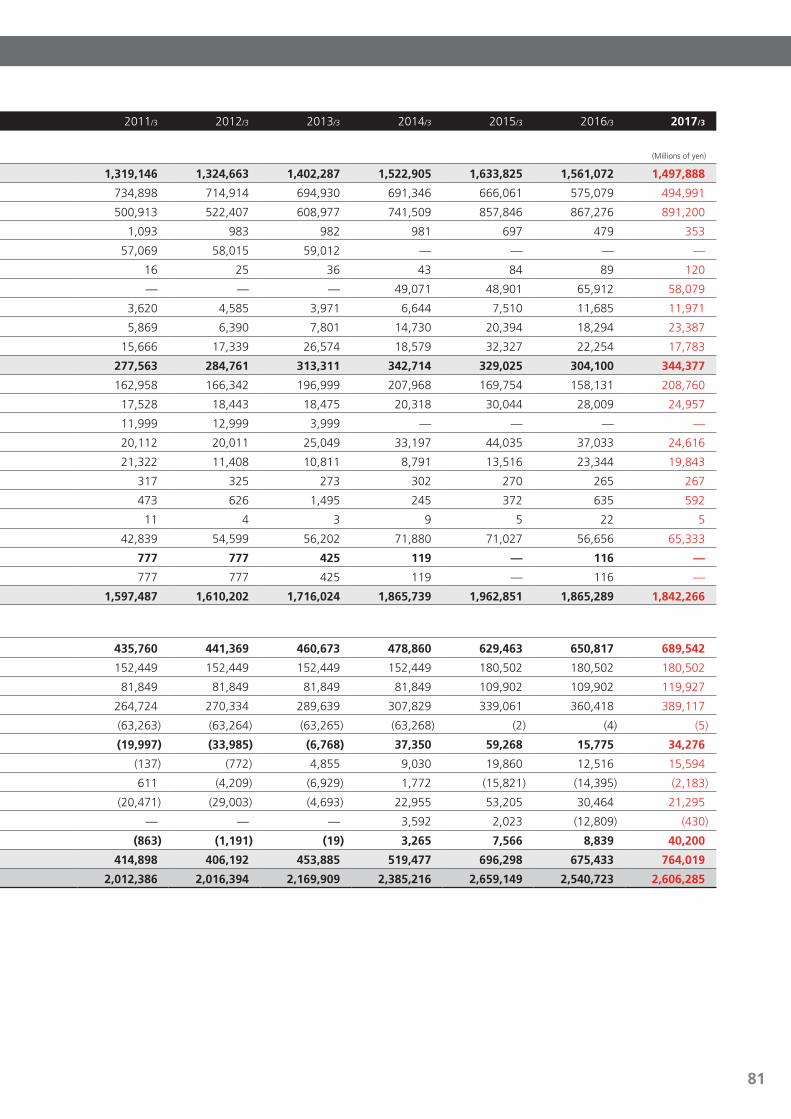
2008/3 2009/3 2010/3 2011/3 2012/3 2013/3 2014/3 2015/3 2016/3 2017/3
Liabilities (Millions of yen)
Noncurrent Liabilities 1,276,354 1,304,830 1,346,526 1,319,146 1,324,663 1,402,287 1,522,905 1,633,825 1,561,072 1,497,888
Bonds Payable 602,903 717,867 689,883 734,898 714,914 694,930 691,346 666,061 575,079 494,991
Long-Term Loans Payable 624,495 513,239 580,925 500,913 522,407 608,977 741,509 857,846 867,276 891,200
Lease Obligations — 520 811 1,093 983 982 981 697 479 353
Provision for Retirement Benefits 39,083 51,931 57,855 57,069 58,015 59,012 — — — —
Other Provision 553 1,098 1,111 16 25 36 43 84 89 120
Net Defined Benefit Liability — — — — — — 49,071 48,901 65,912 58,079
Asset Retirement Obligations — — — 3,620 4,585 3,971 6,644 7,510 11,685 11,971
Deferred Tax Liabilities 1,462 2,352 3,459 5,869 6,390 7,801 14,730 20,394 18,294 23,387
Other 7,856 17,820 12,479 15,666 17,339 26,574 18,579 32,327 22,254 17,783
Current Liabilities 267,097 317,379 261,837 277,563 284,761 313,311 342,714 329,025 304,100 344,377
Current Portion of Noncurrent Liabilities 101,565 120,700 142,923 162,958 166,342 196,999 207,968 169,754 158,131 208,760
Short-Term Loans Payable 6,126 9,098 13,327 17,528 18,443 18,475 20,318 30,044 28,009 24,957
Commercial Papers 88,949 109,971 24,998 11,999 12,999 3,999 — — — —
Notes and Accounts Payable –Trade 14,790 10,144 14,804 20,112 20,011 25,049 33,197 44,035 37,033 24,616
Accrued Taxes 11,407 16,317 7,952 21,322 11,408 10,811 8,791 13,516 23,344 19,843
Other Provision 555 713 855 317 325 273 302 270 265 267
Asset Retirement Obligations — — — 473 626 1,495 245 372 635 592
Deferred Tax Liabilities 2 9 5 11 4 3 9 5 22 5
Other 43,700 50,423 56,970 42,839 54,599 56,202 71,880 71,027 56,656 65,333
Reserves under Special Laws 1,560 1,146 734 777 777 425 119 — 116 —
Reserve for Fluctuation in Water Levels 1,560 1,146 734 777 777 425 119 — 116 —
Total Liabilities 1,545,012 1,623,356 1,609,099 1,597,487 1,610,202 1,716,024 1,865,739 1,962,851 1,865,289 1,842,266
Net Assets
Shareholders’ Equity 464,266 408,036 426,680 435,760 441,369 460,673 478,860 629,463 650,817 689,542
Capital Stock 152,449 152,449 152,449 152,449 152,449 152,449 152,449 180,502 180,502 180,502
Capital Surplus 81,849 81,849 81,849 81,849 81,849 81,849 81,849 109,902 109,902 119,927
Retained Earnings 230,032 236,998 255,643 264,724 270,334 289,639 307,829 339,061 360,418 389,117
Treasury Shares (64) (63,260) (63,262) (63,263) (63,264) (63,265) (63,268) (2) (4) (5)
Accumulated Other Comprehensive Income 2,116 (27,908) (14,003) (19,997) (33,985) (6,768) 37,350 59,268 15,775 34,276
Valuation Difference on Available-for-Sale Securities 1,934 (404) 2,960 (137) (772) 4,855 9,030 19,860 12,516 15,594
Deferred Gains or Losses on Hedges (6,759) (6,285) (3,747) 611 (4,209) (6,929) 1,772 (15,821) (14,395) (2,183)
Foreign Currency Translation Adjustment 6,941 (21,217) (13,217) (20,471) (29,003) (4,693) 22,955 53,205 30,464 21,295
Remeasurements of Defined Benefit Plans — — — — — — 3,592 2,023 (12,809) (430)
Non-Controlling Interests 1,735 1,984 2,304 (863) (1,191) (19) 3,265 7,566 8,839 40,200
Total Net Assets 468,118 382,112 414,981 414,898 406,192 453,885 519,477 696,298 675,433 764,019
Total Liabilities and Net Assets 2,013,131 2,005,469 2,024,080 2,012,386 2,016,394 2,169,909 2,385,216 2,659,149 2,540,723 2,606,285Note: The “Accounting Standards for Retirement Benefits” (Corporate Accounting Standard No. 26 of May 17, 2012) and the “Guidelines for Applying Accounting Standards for
Retirement Benefits” (Corporate Accounting Standard Application Guideline No. 25 of May 17, 2012) are applied from the end of the consolidated fiscal year ended March 31, 2014. Accounting policies were partially changed from the year ended March 31, 2017 and the figures for the year ended March 31, 2016 reflect retroactive application of the change.
10-Year Consolidated Financial Data
81
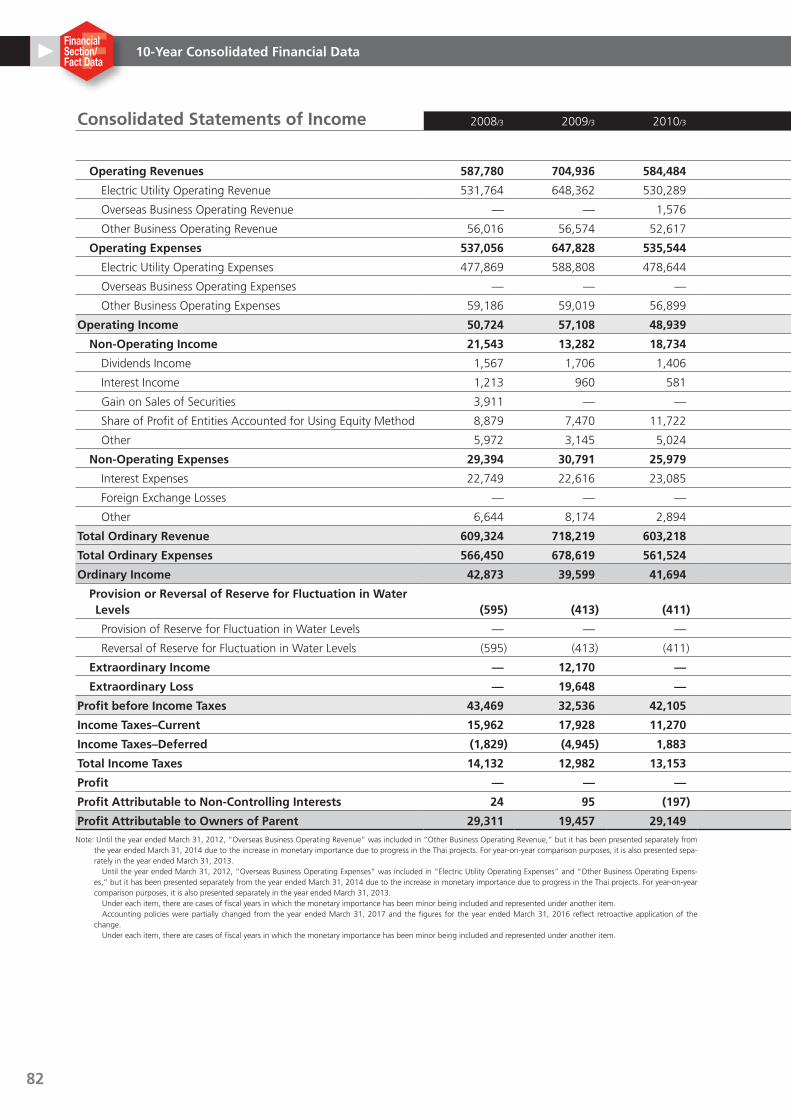
Consolidated Statements of Income 2008/3 2009/3 2010/3 2011/3 2012/3 2013/3 2014/3 2015/3 2016/3 2017/3
(Millions of yen)
Operating Revenues 587,780 704,936 584,484 635,975 654,600 656,056 706,835 750,627 780,072 744,402
Electric Utility Operating Revenue 531,764 648,362 530,289 584,436 609,775 605,338 609,080 588,184 570,837 538,558
Overseas Business Operating Revenue — — 1,576 1,881 2,005 1,647 42,834 108,916 155,952 149,888
Other Business Operating Revenue 56,016 56,574 52,617 49,657 42,819 49,070 54,920 53,526 53,282 55,955
Operating Expenses 537,056 647,828 535,544 565,387 604,800 601,490 647,663 677,767 692,157 662,675
Electric Utility Operating Expenses 477,869 588,808 478,644 509,116 553,873 540,134 545,430 521,351 506,234 487,766
Overseas Business Operating Expenses — — — — — 8,346 43,899 98,979 131,605 119,535
Other Business Operating Expenses 59,186 59,019 56,899 56,271 50,927 53,009 58,333 57,436 54,317 55,374
Operating Income 50,724 57,108 48,939 70,588 49,800 54,566 59,171 72,859 87,915 81,726
Non-Operating Income 21,543 13,282 18,734 14,965 15,356 17,577 22,357 22,714 17,871 20,526
Dividends Income 1,567 1,706 1,406 1,499 1,315 1,321 1,454 1,869 2,409 1,689
Interest Income 1,213 960 581 1,220 968 1,195 1,054 1,155 905 1,024
Gain on Sales of Securities 3,911 — — — — — — — — —
Share of Profit of Entities Accounted for Using Equity Method 8,879 7,470 11,722 9,072 9,565 11,728 16,380 15,659 10,889 13,258
Other 5,972 3,145 5,024 3,172 3,506 3,331 3,468 4,030 3,667 4,554
Non-Operating Expenses 29,394 30,791 25,979 29,231 28,536 27,318 41,451 36,223 47,248 35,103
Interest Expenses 22,749 22,616 23,085 22,371 22,005 22,362 25,305 28,224 30,495 29,798
Foreign Exchange Losses — — — — — 991 11,190 1,547 12,888 —
Other 6,644 8,174 2,894 6,860 6,530 3,964 4,955 6,451 3,865 5,304
Total Ordinary Revenue 609,324 718,219 603,218 650,941 669,957 673,634 729,192 773,341 797,944 764,929
Total Ordinary Expenses 566,450 678,619 561,524 594,619 633,337 628,808 689,115 713,991 739,405 697,779
Ordinary Income 42,873 39,599 41,694 56,322 36,619 44,825 40,077 59,350 58,538 67,150
Provision or Reversal of Reserve for Fluctuation in Water Levels (595) (413) (411) 42 — (351) (306) (119) 116 —
Provision of Reserve for Fluctuation in Water Levels — — — 42 — — — — 116 —
Reversal of Reserve for Fluctuation in Water Levels (595) (413) (411) — — (351) (306) (119) — —
Extraordinary Income — 12,170 — 1,635 — — 2,386 2,127 — —
Extraordinary Loss — 19,648 — 19,176 3,382 — — — — —
Profit before Income Taxes 43,469 32,536 42,105 38,739 33,237 45,176 42,770 61,598 58,421 67,150
Income Taxes–Current 15,962 17,928 11,270 20,403 12,953 11,940 8,372 7,468 12,821 18,634
Income Taxes–Deferred (1,829) (4,945) 1,883 2,459 4,370 3,622 6,579 9,917 5,059 2,847
Total Income Taxes 14,132 12,982 13,153 22,863 17,324 15,562 14,952 17,386 17,880 21,482
Profit — — — 15,876 15,913 29,613 27,817 44,212 40,540 45,667
Profit Attributable to Non-Controlling Interests 24 95 (197) (3,707) (200) (194) (876) 1,005 459 4,238
Profit Attributable to Owners of Parent 29,311 19,457 29,149 19,583 16,113 29,808 28,694 43,206 40,081 41,429Note: Until the year ended March 31, 2012, “Overseas Business Operating Revenue” was included in “Other Business Operating Revenue,” but it has been presented separately from
the year ended March 31, 2014 due to the increase in monetary importance due to progress in the Thai projects. For year-on-year comparison purposes, it is also presented sepa-rately in the year ended March 31, 2013. Until the year ended March 31, 2012, “Overseas Business Operating Expenses” was included in “Electric Utility Operating Expenses” and “Other Business Operating Expens-es,” but it has been presented separately from the year ended March 31, 2014 due to the increase in monetary importance due to progress in the Thai projects. For year-on-year comparison purposes, it is also presented separately in the year ended March 31, 2013. Under each item, there are cases of fiscal years in which the monetary importance has been minor being included and represented under another item. Accounting policies were partially changed from the year ended March 31, 2017 and the figures for the year ended March 31, 2016 reflect retroactive application of the change. Under each item, there are cases of fiscal years in which the monetary importance has been minor being included and represented under another item.
10-Year Consolidated Financial Data
82
FFinancial Section/Fact Data
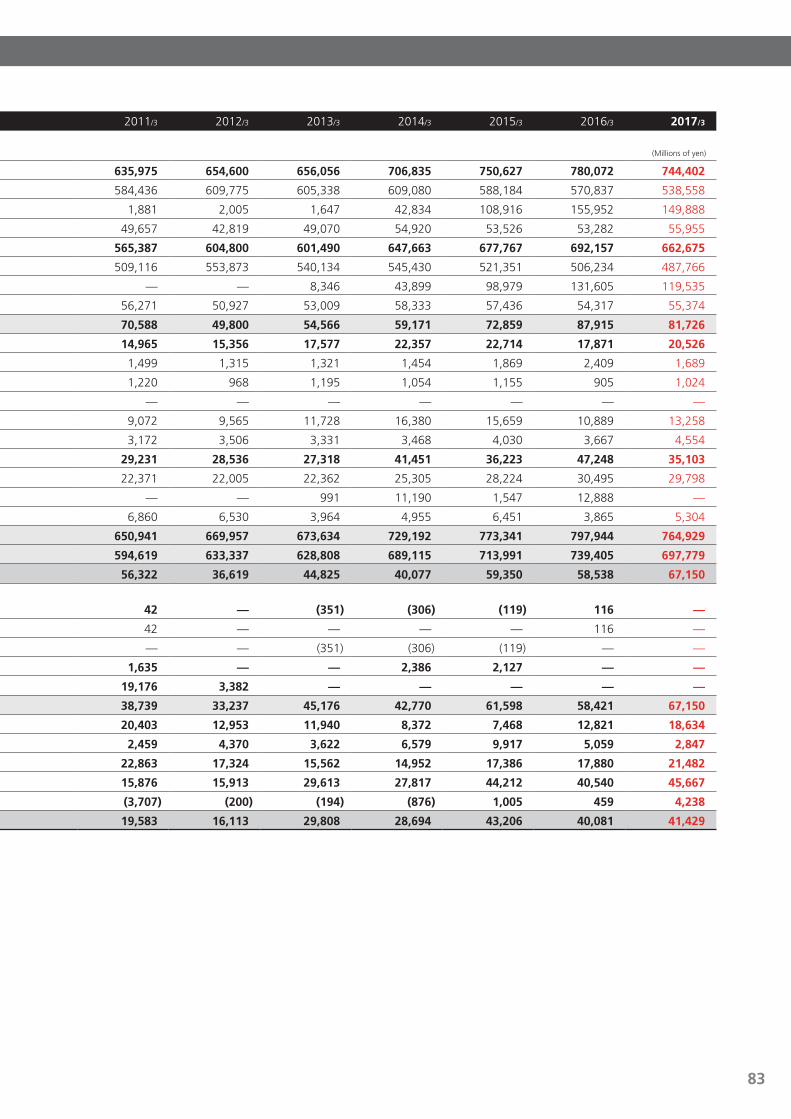
Consolidated Statements of Income 2008/3 2009/3 2010/3 2011/3 2012/3 2013/3 2014/3 2015/3 2016/3 2017/3
(Millions of yen)
Operating Revenues 587,780 704,936 584,484 635,975 654,600 656,056 706,835 750,627 780,072 744,402
Electric Utility Operating Revenue 531,764 648,362 530,289 584,436 609,775 605,338 609,080 588,184 570,837 538,558
Overseas Business Operating Revenue — — 1,576 1,881 2,005 1,647 42,834 108,916 155,952 149,888
Other Business Operating Revenue 56,016 56,574 52,617 49,657 42,819 49,070 54,920 53,526 53,282 55,955
Operating Expenses 537,056 647,828 535,544 565,387 604,800 601,490 647,663 677,767 692,157 662,675
Electric Utility Operating Expenses 477,869 588,808 478,644 509,116 553,873 540,134 545,430 521,351 506,234 487,766
Overseas Business Operating Expenses — — — — — 8,346 43,899 98,979 131,605 119,535
Other Business Operating Expenses 59,186 59,019 56,899 56,271 50,927 53,009 58,333 57,436 54,317 55,374
Operating Income 50,724 57,108 48,939 70,588 49,800 54,566 59,171 72,859 87,915 81,726
Non-Operating Income 21,543 13,282 18,734 14,965 15,356 17,577 22,357 22,714 17,871 20,526
Dividends Income 1,567 1,706 1,406 1,499 1,315 1,321 1,454 1,869 2,409 1,689
Interest Income 1,213 960 581 1,220 968 1,195 1,054 1,155 905 1,024
Gain on Sales of Securities 3,911 — — — — — — — — —
Share of Profit of Entities Accounted for Using Equity Method 8,879 7,470 11,722 9,072 9,565 11,728 16,380 15,659 10,889 13,258
Other 5,972 3,145 5,024 3,172 3,506 3,331 3,468 4,030 3,667 4,554
Non-Operating Expenses 29,394 30,791 25,979 29,231 28,536 27,318 41,451 36,223 47,248 35,103
Interest Expenses 22,749 22,616 23,085 22,371 22,005 22,362 25,305 28,224 30,495 29,798
Foreign Exchange Losses — — — — — 991 11,190 1,547 12,888 —
Other 6,644 8,174 2,894 6,860 6,530 3,964 4,955 6,451 3,865 5,304
Total Ordinary Revenue 609,324 718,219 603,218 650,941 669,957 673,634 729,192 773,341 797,944 764,929
Total Ordinary Expenses 566,450 678,619 561,524 594,619 633,337 628,808 689,115 713,991 739,405 697,779
Ordinary Income 42,873 39,599 41,694 56,322 36,619 44,825 40,077 59,350 58,538 67,150
Provision or Reversal of Reserve for Fluctuation in Water Levels (595) (413) (411) 42 — (351) (306) (119) 116 —
Provision of Reserve for Fluctuation in Water Levels — — — 42 — — — — 116 —
Reversal of Reserve for Fluctuation in Water Levels (595) (413) (411) — — (351) (306) (119) — —
Extraordinary Income — 12,170 — 1,635 — — 2,386 2,127 — —
Extraordinary Loss — 19,648 — 19,176 3,382 — — — — —
Profit before Income Taxes 43,469 32,536 42,105 38,739 33,237 45,176 42,770 61,598 58,421 67,150
Income Taxes–Current 15,962 17,928 11,270 20,403 12,953 11,940 8,372 7,468 12,821 18,634
Income Taxes–Deferred (1,829) (4,945) 1,883 2,459 4,370 3,622 6,579 9,917 5,059 2,847
Total Income Taxes 14,132 12,982 13,153 22,863 17,324 15,562 14,952 17,386 17,880 21,482
Profit — — — 15,876 15,913 29,613 27,817 44,212 40,540 45,667
Profit Attributable to Non-Controlling Interests 24 95 (197) (3,707) (200) (194) (876) 1,005 459 4,238
Profit Attributable to Owners of Parent 29,311 19,457 29,149 19,583 16,113 29,808 28,694 43,206 40,081 41,429Note: Until the year ended March 31, 2012, “Overseas Business Operating Revenue” was included in “Other Business Operating Revenue,” but it has been presented separately from
the year ended March 31, 2014 due to the increase in monetary importance due to progress in the Thai projects. For year-on-year comparison purposes, it is also presented sepa-rately in the year ended March 31, 2013. Until the year ended March 31, 2012, “Overseas Business Operating Expenses” was included in “Electric Utility Operating Expenses” and “Other Business Operating Expens-es,” but it has been presented separately from the year ended March 31, 2014 due to the increase in monetary importance due to progress in the Thai projects. For year-on-year comparison purposes, it is also presented separately in the year ended March 31, 2013. Under each item, there are cases of fiscal years in which the monetary importance has been minor being included and represented under another item. Accounting policies were partially changed from the year ended March 31, 2017 and the figures for the year ended March 31, 2016 reflect retroactive application of the change. Under each item, there are cases of fiscal years in which the monetary importance has been minor being included and represented under another item.
10-Year Consolidated Financial Data
83
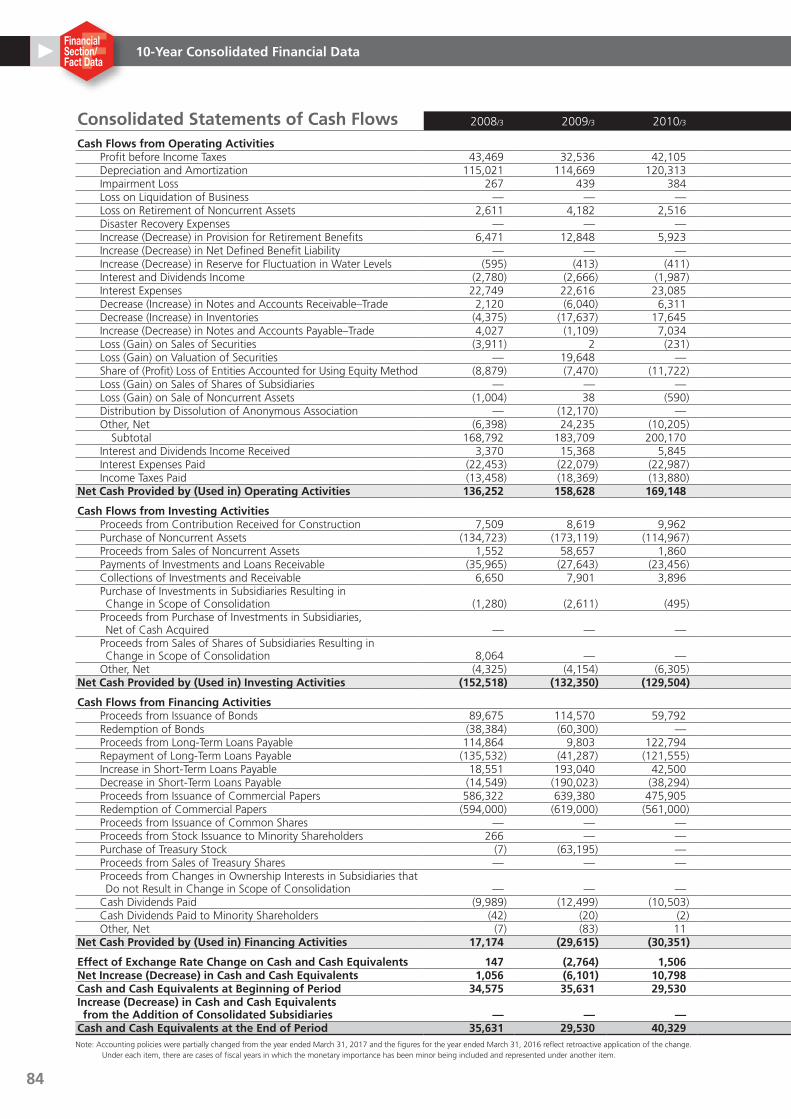
Consolidated Statements of Cash Flows 2008/3 2009/3 2010/3 2011/3 2012/3 2013/3 2014/3 2015/3 2016/3 2017/3
Cash Flows from Operating Activities (Millions of yen)
Profit before Income Taxes 43,469 32,536 42,105 38,739 33,237 45,176 42,770 61,598 58,421 67,150 Depreciation and Amortization 115,021 114,669 120,313 111,644 105,271 95,254 91,408 93,309 94,582 75,660 Impairment Loss 267 439 384 9,266 946 — 14 2,489 1,392 2,624 Loss on Liquidation of Business — — — 4,550 — — — — — — Loss on Retirement of Noncurrent Assets 2,611 4,182 2,516 2,941 2,434 2,418 2,241 2,359 3,656 2,842 Disaster Recovery Expenses — — — — 3,382 — — — — — Increase (Decrease) in Provision for Retirement Benefits 6,471 12,848 5,923 (779) 971 987 — — — — Increase (Decrease) in Net Defined Benefit Liability — — — — — — (4,800) (4,611) (3,351) 9,276 Increase (Decrease) in Reserve for Fluctuation in Water Levels (595) (413) (411) 42 — (351) (306) (119) 116 — Interest and Dividends Income (2,780) (2,666) (1,987) (2,720) (2,284) (2,517) (2,508) (3,024) (3,314) (2,713) Interest Expenses 22,749 22,616 23,085 22,371 22,005 22,362 25,305 28,224 30,495 29,798 Decrease (Increase) in Notes and Accounts Receivable–Trade 2,120 (6,040) 6,311 (10,753) (1,607) (2,133) (7,753) 23 2,445 (13,433) Decrease (Increase) in Inventories (4,375) (17,637) 17,645 (6,132) (2,488) (3,133) 4,223 (3,593) (3,259) (5,503) Increase (Decrease) in Notes and Accounts Payable–Trade 4,027 (1,109) 7,034 3,171 3,148 5,642 9,244 6,639 (3,085) (6,477) Loss (Gain) on Sales of Securities (3,911) 2 (231) (1,450) (484) (620) (280) (252) — — Loss (Gain) on Valuation of Securities — 19,648 — 5,359 1,791 242 — — — — Share of (Profit) Loss of Entities Accounted for Using Equity Method (8,879) (7,470) (11,722) (9,072) (9,565) (11,728) (16,380) (15,659) (10,889) (13,258) Loss (Gain) on Sales of Shares of Subsidiaries — — — — — — — (2,127) — — Loss (Gain) on Sale of Noncurrent Assets (1,004) 38 (590) 432 747 526 — — — — Distribution by Dissolution of Anonymous Association — (12,170) — — — — — — — — Other, Net (6,398) 24,235 (10,205) 8,355 8,526 (8,742) 2,123 6,841 3,134 6,786 Subtotal 168,792 183,709 200,170 175,965 166,031 143,385 145,302 172,097 170,342 152,753 Interest and Dividends Income Received 3,370 15,368 5,845 7,644 6,869 7,926 12,626 10,735 13,573 13,229 Interest Expenses Paid (22,453) (22,079) (22,987) (22,881) (21,765) (21,974) (25,131) (28,211) (30,554) (30,224) Income Taxes Paid (13,458) (18,369) (13,880) (9,492) (25,244) (9,552) (10,687) (6,807) (7,232) (20,317)Net Cash Provided by (Used in) Operating Activities 136,252 158,628 169,148 151,236 125,891 119,786 122,110 147,813 146,130 115,440
Cash Flows from Investing Activities Proceeds from Contribution Received for Construction 7,509 8,619 9,962 7,068 3,102 6,343 — — — — Purchase of Noncurrent Assets (134,723) (173,119) (114,967) (115,827) (133,711) (165,201) (176,982) (148,404) (140,840) (108,149) Proceeds from Sales of Noncurrent Assets 1,552 58,657 1,860 2,453 2,285 — — — — — Payments of Investments and Loans Receivable (35,965) (27,643) (23,456) (14,184) (6,068) (1,347) (1,149) (4,429) (2,537) (18,005) Collections of Investments and Receivable 6,650 7,901 3,896 5,235 4,915 7,938 6,460 4,053 15,960 2,577 Purchase of Investments in Subsidiaries Resulting in
Change in Scope of Consolidation (1,280) (2,611) (495) — — — — — — — Proceeds from Purchase of Investments in Subsidiaries,
Net of Cash Acquired — — — — — — — — — — Proceeds from Sales of Shares of Subsidiaries Resulting in
Change in Scope of Consolidation 8,064 — — — 1,425 — — 1,665 — — Other, Net (4,325) (4,154) (6,305) (9,419) (8,802) (18,101) (5,704) 4,150 (4,123) (14,086)Net Cash Provided by (Used in) Investing Activities (152,518) (132,350) (129,504) (124,675) (136,852) (170,369) (177,375) (142,964) (131,541) (137,663)
Cash Flows from Financing Activities Proceeds from Issuance of Bonds 89,675 114,570 59,792 79,726 — 39,877 79,740 39,858 — 79,702 Redemption of Bonds (38,384) (60,300) — (88,000) (35,000) (20,000) (63,599) (85,298) (60,999) (90,000) Proceeds from Long-Term Loans Payable 114,864 9,803 122,794 49,036 176,745 207,887 241,625 189,320 96,697 83,762 Repayment of Long-Term Loans Payable (135,532) (41,287) (121,555) (53,988) (127,173) (146,048) (158,518) (120,062) (110,783) (69,108) Increase in Short-Term Loans Payable 18,551 193,040 42,500 84,880 103,760 108,500 97,221 104,942 100,944 87,663 Decrease in Short-Term Loans Payable (14,549) (190,023) (38,294) (80,680) (103,070) (110,038) (95,374) (95,582) (102,994) (90,194) Proceeds from Issuance of Commercial Papers 586,322 639,380 475,905 392,965 359,968 326,969 83,996 — 2,999 15,000 Redemption of Commercial Papers (594,000) (619,000) (561,000) (406,000) (359,000) (336,000) (88,000) — (3,000) (15,000) Proceeds from Issuance of Common Shares — — — — — — — 59,359 — — Proceeds from Stock Issuance to Minority Shareholders 266 — — — — — — — — — Purchase of Treasury Stock (7) (63,195) — — — — — — — — Proceeds from Sales of Treasury Shares — — — — — — — 59,740 — — Proceeds from Changes in Ownership Interests in Subsidiaries that
Do not Result in Change in Scope of Consolidation — — — — — — — — — 42,363 Cash Dividends Paid (9,989) (12,499) (10,503) (10,503) (10,502) (10,501) (10,504) (10,505) (12,811) (12,811) Cash Dividends Paid to Minority Shareholders (42) (20) (2) (8) (196) — — — — — Other, Net (7) (83) 11 3,398 3,764 856 1,709 2,148 1,315 (916)Net Cash Provided by (Used in) Financing Activities 17,174 (29,615) (30,351) (29,172) 9,296 61,502 88,295 143,920 (88,632) 30,461
Effect of Exchange Rate Change on Cash and Cash Equivalents 147 (2,764) 1,506 285 (585) 2,615 3,297 2,446 (2,446) 267Net Increase (Decrease) in Cash and Cash Equivalents 1,056 (6,101) 10,798 (2,326) (2,248) 13,535 36,328 151,216 (76,490) 8,505Cash and Cash Equivalents at Beginning of Period 34,575 35,631 29,530 40,329 38,002 35,359 48,894 85,223 236,439 159,949Increase (Decrease) in Cash and Cash Equivalents from the Addition of Consolidated Subsidiaries — — — — (394) — — — — —Cash and Cash Equivalents at the End of Period 35,631 29,530 40,329 38,002 35,359 48,894 85,223 236,439 159,949 168,454Note: Accounting policies were partially changed from the year ended March 31, 2017 and the figures for the year ended March 31, 2016 reflect retroactive application of the change.
Under each item, there are cases of fiscal years in which the monetary importance has been minor being included and represented under another item.
10-Year Consolidated Financial Data
84
FFinancial Section/Fact Data
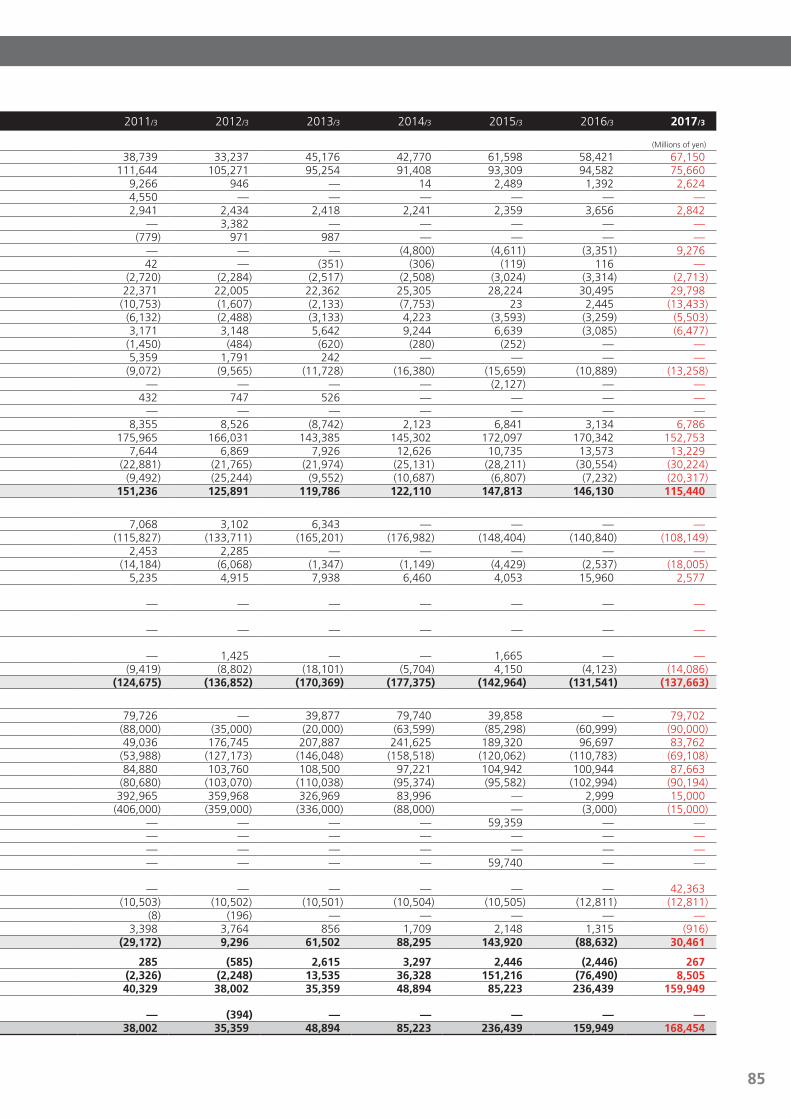
Consolidated Statements of Cash Flows 2008/3 2009/3 2010/3 2011/3 2012/3 2013/3 2014/3 2015/3 2016/3 2017/3
Cash Flows from Operating Activities (Millions of yen)
Profit before Income Taxes 43,469 32,536 42,105 38,739 33,237 45,176 42,770 61,598 58,421 67,150 Depreciation and Amortization 115,021 114,669 120,313 111,644 105,271 95,254 91,408 93,309 94,582 75,660 Impairment Loss 267 439 384 9,266 946 — 14 2,489 1,392 2,624 Loss on Liquidation of Business — — — 4,550 — — — — — — Loss on Retirement of Noncurrent Assets 2,611 4,182 2,516 2,941 2,434 2,418 2,241 2,359 3,656 2,842 Disaster Recovery Expenses — — — — 3,382 — — — — — Increase (Decrease) in Provision for Retirement Benefits 6,471 12,848 5,923 (779) 971 987 — — — — Increase (Decrease) in Net Defined Benefit Liability — — — — — — (4,800) (4,611) (3,351) 9,276 Increase (Decrease) in Reserve for Fluctuation in Water Levels (595) (413) (411) 42 — (351) (306) (119) 116 — Interest and Dividends Income (2,780) (2,666) (1,987) (2,720) (2,284) (2,517) (2,508) (3,024) (3,314) (2,713) Interest Expenses 22,749 22,616 23,085 22,371 22,005 22,362 25,305 28,224 30,495 29,798 Decrease (Increase) in Notes and Accounts Receivable–Trade 2,120 (6,040) 6,311 (10,753) (1,607) (2,133) (7,753) 23 2,445 (13,433) Decrease (Increase) in Inventories (4,375) (17,637) 17,645 (6,132) (2,488) (3,133) 4,223 (3,593) (3,259) (5,503) Increase (Decrease) in Notes and Accounts Payable–Trade 4,027 (1,109) 7,034 3,171 3,148 5,642 9,244 6,639 (3,085) (6,477) Loss (Gain) on Sales of Securities (3,911) 2 (231) (1,450) (484) (620) (280) (252) — — Loss (Gain) on Valuation of Securities — 19,648 — 5,359 1,791 242 — — — — Share of (Profit) Loss of Entities Accounted for Using Equity Method (8,879) (7,470) (11,722) (9,072) (9,565) (11,728) (16,380) (15,659) (10,889) (13,258) Loss (Gain) on Sales of Shares of Subsidiaries — — — — — — — (2,127) — — Loss (Gain) on Sale of Noncurrent Assets (1,004) 38 (590) 432 747 526 — — — — Distribution by Dissolution of Anonymous Association — (12,170) — — — — — — — — Other, Net (6,398) 24,235 (10,205) 8,355 8,526 (8,742) 2,123 6,841 3,134 6,786 Subtotal 168,792 183,709 200,170 175,965 166,031 143,385 145,302 172,097 170,342 152,753 Interest and Dividends Income Received 3,370 15,368 5,845 7,644 6,869 7,926 12,626 10,735 13,573 13,229 Interest Expenses Paid (22,453) (22,079) (22,987) (22,881) (21,765) (21,974) (25,131) (28,211) (30,554) (30,224) Income Taxes Paid (13,458) (18,369) (13,880) (9,492) (25,244) (9,552) (10,687) (6,807) (7,232) (20,317)Net Cash Provided by (Used in) Operating Activities 136,252 158,628 169,148 151,236 125,891 119,786 122,110 147,813 146,130 115,440
Cash Flows from Investing Activities Proceeds from Contribution Received for Construction 7,509 8,619 9,962 7,068 3,102 6,343 — — — — Purchase of Noncurrent Assets (134,723) (173,119) (114,967) (115,827) (133,711) (165,201) (176,982) (148,404) (140,840) (108,149) Proceeds from Sales of Noncurrent Assets 1,552 58,657 1,860 2,453 2,285 — — — — — Payments of Investments and Loans Receivable (35,965) (27,643) (23,456) (14,184) (6,068) (1,347) (1,149) (4,429) (2,537) (18,005) Collections of Investments and Receivable 6,650 7,901 3,896 5,235 4,915 7,938 6,460 4,053 15,960 2,577 Purchase of Investments in Subsidiaries Resulting in
Change in Scope of Consolidation (1,280) (2,611) (495) — — — — — — — Proceeds from Purchase of Investments in Subsidiaries,
Net of Cash Acquired — — — — — — — — — — Proceeds from Sales of Shares of Subsidiaries Resulting in
Change in Scope of Consolidation 8,064 — — — 1,425 — — 1,665 — — Other, Net (4,325) (4,154) (6,305) (9,419) (8,802) (18,101) (5,704) 4,150 (4,123) (14,086)Net Cash Provided by (Used in) Investing Activities (152,518) (132,350) (129,504) (124,675) (136,852) (170,369) (177,375) (142,964) (131,541) (137,663)
Cash Flows from Financing Activities Proceeds from Issuance of Bonds 89,675 114,570 59,792 79,726 — 39,877 79,740 39,858 — 79,702 Redemption of Bonds (38,384) (60,300) — (88,000) (35,000) (20,000) (63,599) (85,298) (60,999) (90,000) Proceeds from Long-Term Loans Payable 114,864 9,803 122,794 49,036 176,745 207,887 241,625 189,320 96,697 83,762 Repayment of Long-Term Loans Payable (135,532) (41,287) (121,555) (53,988) (127,173) (146,048) (158,518) (120,062) (110,783) (69,108) Increase in Short-Term Loans Payable 18,551 193,040 42,500 84,880 103,760 108,500 97,221 104,942 100,944 87,663 Decrease in Short-Term Loans Payable (14,549) (190,023) (38,294) (80,680) (103,070) (110,038) (95,374) (95,582) (102,994) (90,194) Proceeds from Issuance of Commercial Papers 586,322 639,380 475,905 392,965 359,968 326,969 83,996 — 2,999 15,000 Redemption of Commercial Papers (594,000) (619,000) (561,000) (406,000) (359,000) (336,000) (88,000) — (3,000) (15,000) Proceeds from Issuance of Common Shares — — — — — — — 59,359 — — Proceeds from Stock Issuance to Minority Shareholders 266 — — — — — — — — — Purchase of Treasury Stock (7) (63,195) — — — — — — — — Proceeds from Sales of Treasury Shares — — — — — — — 59,740 — — Proceeds from Changes in Ownership Interests in Subsidiaries that
Do not Result in Change in Scope of Consolidation — — — — — — — — — 42,363 Cash Dividends Paid (9,989) (12,499) (10,503) (10,503) (10,502) (10,501) (10,504) (10,505) (12,811) (12,811) Cash Dividends Paid to Minority Shareholders (42) (20) (2) (8) (196) — — — — — Other, Net (7) (83) 11 3,398 3,764 856 1,709 2,148 1,315 (916)Net Cash Provided by (Used in) Financing Activities 17,174 (29,615) (30,351) (29,172) 9,296 61,502 88,295 143,920 (88,632) 30,461
Effect of Exchange Rate Change on Cash and Cash Equivalents 147 (2,764) 1,506 285 (585) 2,615 3,297 2,446 (2,446) 267Net Increase (Decrease) in Cash and Cash Equivalents 1,056 (6,101) 10,798 (2,326) (2,248) 13,535 36,328 151,216 (76,490) 8,505Cash and Cash Equivalents at Beginning of Period 34,575 35,631 29,530 40,329 38,002 35,359 48,894 85,223 236,439 159,949Increase (Decrease) in Cash and Cash Equivalents from the Addition of Consolidated Subsidiaries — — — — (394) — — — — —Cash and Cash Equivalents at the End of Period 35,631 29,530 40,329 38,002 35,359 48,894 85,223 236,439 159,949 168,454Note: Accounting policies were partially changed from the year ended March 31, 2017 and the figures for the year ended March 31, 2016 reflect retroactive application of the change.
Under each item, there are cases of fiscal years in which the monetary importance has been minor being included and represented under another item.
10-Year Consolidated Financial Data
85
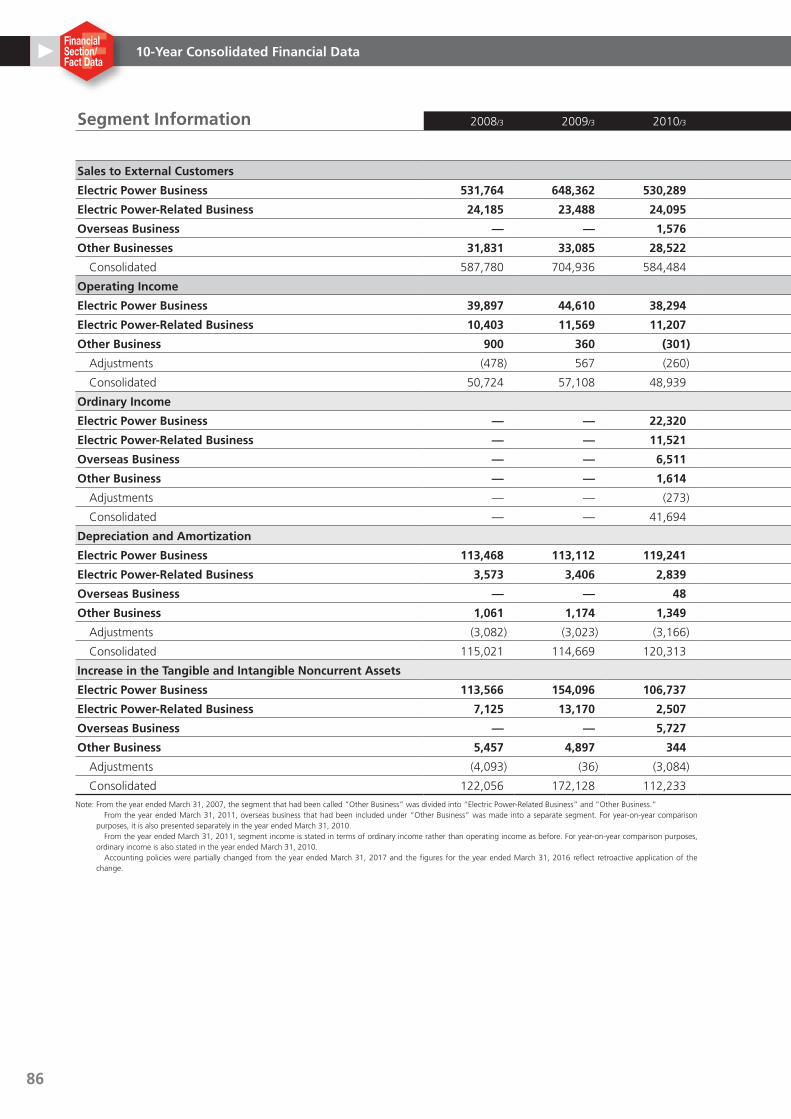
Segment Information 2008/3 2009/3 2010/3 2011/3 2012/3 2013/3 2014/3 2015/3 2016/3 2017/3
(Millions of yen)
Sales to External Customers
Electric Power Business 531,764 648,362 530,289 584,436 609,775 605,338 609,080 588,184 570,837 538,558
Electric Power-Related Business 24,185 23,488 24,095 26,294 23,133 26,599 29,944 30,467 31,973 34,004
Overseas Business — — 1,576 1,881 2,005 1,647 42,834 108,916 155,952 149,888
Other Businesses 31,831 33,085 28,522 23,363 19,686 22,471 24,975 23,059 21,309 21,950
Consolidated 587,780 704,936 584,484 635,975 654,600 656,056 706,835 750,627 780,072 744,402
Operating Income
Electric Power Business 39,897 44,610 38,294 — — — — — — —
Electric Power-Related Business 10,403 11,569 11,207 — — — — — — —
Other Business 900 360 (301) — — — — — — —
Adjustments (478) 567 (260) — — — — — — —
Consolidated 50,724 57,108 48,939 — — — — — — —
Ordinary Income
Electric Power Business — — 22,320 41,832 22,290 31,088 29,088 33,386 32,239 22,212
Electric Power-Related Business — — 11,521 10,425 8,373 9,099 9,626 8,970 14,462 14,244
Overseas Business — — 6,511 5,047 3,499 3,907 52 15,990 11,483 31,229
Other Business — — 1,614 (1,517) (3) 986 956 611 810 1,376
Adjustments — — (273) 533 2,460 (256) 353 392 (456) (1,912)
Consolidated — — 41,694 56,322 36,619 44,825 40,077 59,350 58,538 67,150
Depreciation and Amortization
Electric Power Business 113,468 113,112 119,241 110,179 104,344 93,163 85,173 81,924 77,628 54,650
Electric Power-Related Business 3,573 3,406 2,839 3,362 3,514 4,498 5,308 5,776 6,252 5,975
Overseas Business — — 48 115 55 84 3,299 7,820 12,833 16,448
Other Business 1,061 1,174 1,349 1,231 521 492 512 468 422 314
Adjustments (3,082) (3,023) (3,166) (3,244) (3,164) (2,984) (2,884) (2,680) (2,553) (1,728)
Consolidated 115,021 114,669 120,313 111,644 105,271 95,254 91,408 93,309 94,582 75,660
Increase in the Tangible and Intangible Noncurrent Assets
Electric Power Business 113,566 154,096 106,737 70,742 68,286 69,390 94,307 67,038 119,176 107,841
Electric Power-Related Business 7,125 13,170 2,507 5,236 7,119 46,713 4,889 7,071 2,820 2,153
Overseas Business — — 5,727 18,091 62,548 60,175 95,815 75,158 11,472 1,358
Other Business 5,457 4,897 344 643 340 494 546 317 301 553
Adjustments (4,093) (36) (3,084) (1,584) (570) (1,667) (532) (2,692) (7,450) (6,070)
Consolidated 122,056 172,128 112,233 93,128 137,725 175,106 195,026 146,894 126,320 105,837
Note: From the year ended March 31, 2007, the segment that had been called “Other Business” was divided into “Electric Power-Related Business” and “Other Business.” From the year ended March 31, 2011, overseas business that had been included under “Other Business” was made into a separate segment. For year-on-year comparison purposes, it is also presented separately in the year ended March 31, 2010. From the year ended March 31, 2011, segment income is stated in terms of ordinary income rather than operating income as before. For year-on-year comparison purposes, ordinary income is also stated in the year ended March 31, 2010. Accounting policies were partially changed from the year ended March 31, 2017 and the figures for the year ended March 31, 2016 reflect retroactive application of the change.
10-Year Consolidated Financial Data
86
FFinancial Section/Fact Data

Segment Information 2008/3 2009/3 2010/3 2011/3 2012/3 2013/3 2014/3 2015/3 2016/3 2017/3
(Millions of yen)
Sales to External Customers
Electric Power Business 531,764 648,362 530,289 584,436 609,775 605,338 609,080 588,184 570,837 538,558
Electric Power-Related Business 24,185 23,488 24,095 26,294 23,133 26,599 29,944 30,467 31,973 34,004
Overseas Business — — 1,576 1,881 2,005 1,647 42,834 108,916 155,952 149,888
Other Businesses 31,831 33,085 28,522 23,363 19,686 22,471 24,975 23,059 21,309 21,950
Consolidated 587,780 704,936 584,484 635,975 654,600 656,056 706,835 750,627 780,072 744,402
Operating Income
Electric Power Business 39,897 44,610 38,294 — — — — — — —
Electric Power-Related Business 10,403 11,569 11,207 — — — — — — —
Other Business 900 360 (301) — — — — — — —
Adjustments (478) 567 (260) — — — — — — —
Consolidated 50,724 57,108 48,939 — — — — — — —
Ordinary Income
Electric Power Business — — 22,320 41,832 22,290 31,088 29,088 33,386 32,239 22,212
Electric Power-Related Business — — 11,521 10,425 8,373 9,099 9,626 8,970 14,462 14,244
Overseas Business — — 6,511 5,047 3,499 3,907 52 15,990 11,483 31,229
Other Business — — 1,614 (1,517) (3) 986 956 611 810 1,376
Adjustments — — (273) 533 2,460 (256) 353 392 (456) (1,912)
Consolidated — — 41,694 56,322 36,619 44,825 40,077 59,350 58,538 67,150
Depreciation and Amortization
Electric Power Business 113,468 113,112 119,241 110,179 104,344 93,163 85,173 81,924 77,628 54,650
Electric Power-Related Business 3,573 3,406 2,839 3,362 3,514 4,498 5,308 5,776 6,252 5,975
Overseas Business — — 48 115 55 84 3,299 7,820 12,833 16,448
Other Business 1,061 1,174 1,349 1,231 521 492 512 468 422 314
Adjustments (3,082) (3,023) (3,166) (3,244) (3,164) (2,984) (2,884) (2,680) (2,553) (1,728)
Consolidated 115,021 114,669 120,313 111,644 105,271 95,254 91,408 93,309 94,582 75,660
Increase in the Tangible and Intangible Noncurrent Assets
Electric Power Business 113,566 154,096 106,737 70,742 68,286 69,390 94,307 67,038 119,176 107,841
Electric Power-Related Business 7,125 13,170 2,507 5,236 7,119 46,713 4,889 7,071 2,820 2,153
Overseas Business — — 5,727 18,091 62,548 60,175 95,815 75,158 11,472 1,358
Other Business 5,457 4,897 344 643 340 494 546 317 301 553
Adjustments (4,093) (36) (3,084) (1,584) (570) (1,667) (532) (2,692) (7,450) (6,070)
Consolidated 122,056 172,128 112,233 93,128 137,725 175,106 195,026 146,894 126,320 105,837
Note: From the year ended March 31, 2007, the segment that had been called “Other Business” was divided into “Electric Power-Related Business” and “Other Business.” From the year ended March 31, 2011, overseas business that had been included under “Other Business” was made into a separate segment. For year-on-year comparison purposes, it is also presented separately in the year ended March 31, 2010. From the year ended March 31, 2011, segment income is stated in terms of ordinary income rather than operating income as before. For year-on-year comparison purposes, ordinary income is also stated in the year ended March 31, 2010. Accounting policies were partially changed from the year ended March 31, 2017 and the figures for the year ended March 31, 2016 reflect retroactive application of the change.
10-Year Consolidated Financial Data
87

Non-Consolidated Balance Sheets 2008/3 2009/3 2010/3 2011/3 2012/3 2013/3 2014/3 2015/3 2016/3 2017/3
Assets (Millions of yen)
Noncurrent Assets 1,819,393 1,796,175 1,808,678 1,768,302 1,728,454 1,749,201 1,780,429 1,795,979 1,820,204 1,892,648
Electric Utility Plant and Equipment 1,254,172 1,220,808 1,215,919 1,159,857 1,095,654 1,045,889 1,003,628 965,328 931,795 932,819
Hydroelectric Power Production Facilities 441,129 428,270 413,221 399,744 384,125 372,980 365,343 359,001 353,685 357,508
Thermal Power Production Facilities 510,443 469,618 489,556 462,070 429,797 394,071 367,935 341,313 320,428 318,961
Renewable Power Production Facilities — — 2,084 1,765 1,526 1,533 1,541 2,523 1,061 939
Transmission Facilities 233,026 221,274 211,312 200,373 189,304 188,695 178,925 171,471 164,220 160,596
Transformation Facilities 35,559 37,929 36,360 35,721 32,944 31,762 31,645 31,424 31,132 30,988
Communication Facilities 10,125 10,384 10,121 10,274 9,767 9,308 9,257 9,095 9,039 8,815
General Facilities 23,887 53,331 53,261 49,907 48,187 47,537 48,979 50,497 52,227 55,009
Incidental Business Facilities 2,504 2,321 2,070 2,297 2,186 1,980 2,213 2,088 1,944 2,199
Non-Operating Facilities 607 461 248 335 260 798 857 406 331 313
Construction in Progress 326,336 313,664 287,204 295,682 315,318 331,810 367,748 384,957 438,730 483,067
Construction in Progress 326,175 313,542 286,540 295,449 314,737 331,120 367,563 384,859 438,592 482,143
Retirement in Progress 161 121 664 233 580 690 185 98 138 923
Nuclear Fuel 10,310 27,650 38,688 46,693 54,157 59,769 69,216 71,467 73,447 73,682
Nuclear Fuel in Processing 10,310 27,650 38,688 46,693 54,157 59,769 69,216 71,467 73,447 73,682
Investments and Other Assets 225,462 231,268 264,546 263,435 260,877 308,954 336,763 371,731 373,953 400,565
Long-Term Investments 72,069 46,787 72,083 62,572 60,522 67,029 70,612 83,250 61,773 63,824
Long-Term Investments for Subsidiaries and Affiliates 117,195 143,118 152,399 164,876 169,582 212,363 236,195 252,708 265,759 277,179
Long-Term Prepaid Expenses 3,256 2,164 1,824 2,480 1,548 3,760 9,597 16,718 25,553 36,609
Deferred Tax Assets 33,515 40,084 39,079 38,992 35,411 31,004 24,041 19,203 20,866 22,953
Allowance for Doubtful Accounts (574) (886) (840) (5,485) (6,188) (5,204) (3,682) (149) — —
Current Assets 90,896 114,416 93,826 116,528 115,806 121,090 146,302 262,629 165,044 168,232
Cash and Deposits 4,051 4,973 5,151 4,362 4,295 4,440 3,934 4,380 3,969 5,169
Accounts Receivable –Trade 39,036 44,178 39,848 49,264 50,745 48,758 46,228 32,145 26,789 43,488
Other Accounts Receivable 7,198 5,186 4,870 4,845 507 3,618 782 649 4,636 2,838
Short-Term Investments — 22 — — — — 35,000 167,398 72,399 51,000
Supplies 21,800 38,414 19,087 28,529 31,565 33,083 28,210 30,048 31,758 36,360
Advance Payments — — — — — — — — 71 —
Prepaid Expenses 1,355 1,002 1,219 1,672 2,388 2,405 2,370 2,385 2,140 2,752
Short-Term Receivables from Subsidiaries and Affiliates 5,793 4,880 9,516 11,637 6,876 7,808 11,079 6,197 5,293 5,381
Deferred Tax Assets 3,482 4,150 2,993 3,732 4,599 4,917 5,289 3,885 3,217 2,305
Other Current Assets 8,198 11,622 11,138 12,604 14,895 16,166 13,405 15,539 14,767 18,936
Allowance for Doubtful Accounts (20) (14) — (121) (65) (108) — — — —
Total Assets 1,910,290 1,910,592 1,902,504 1,884,830 1,844,261 1,870,291 1,926,731 2,058,609 1,985,248 2,060,881Notes: 1. Owing to the abolition of the Electric Power Development Promotion Law during the year ended March 31, 2004, “accounts receivable-overseas technical services” and
“overseas technical service charge in advance” are now recorded as “other current assets” and “other current liabilities,” in accordance with electric utility accounting regu-lations.
2. Corresponding to the revision of electric utility accounting regulations, the disclosure of “Renewable Power Production Utilities” began and a geothermal power production facility was booked as “Renewable Power Production Facilities” from the year ended March 31, 2010.
3. Accounting policies were partially changed from the year ended March 31, 2017 and the figures for the year ended March 31, 2016 reflect retroactive application of the change.
10-Year Non-Consolidated Financial Data
88
FFinancial Section/Fact Data

Non-Consolidated Balance Sheets 2008/3 2009/3 2010/3 2011/3 2012/3 2013/3 2014/3 2015/3 2016/3 2017/3
Assets (Millions of yen)
Noncurrent Assets 1,819,393 1,796,175 1,808,678 1,768,302 1,728,454 1,749,201 1,780,429 1,795,979 1,820,204 1,892,648
Electric Utility Plant and Equipment 1,254,172 1,220,808 1,215,919 1,159,857 1,095,654 1,045,889 1,003,628 965,328 931,795 932,819
Hydroelectric Power Production Facilities 441,129 428,270 413,221 399,744 384,125 372,980 365,343 359,001 353,685 357,508
Thermal Power Production Facilities 510,443 469,618 489,556 462,070 429,797 394,071 367,935 341,313 320,428 318,961
Renewable Power Production Facilities — — 2,084 1,765 1,526 1,533 1,541 2,523 1,061 939
Transmission Facilities 233,026 221,274 211,312 200,373 189,304 188,695 178,925 171,471 164,220 160,596
Transformation Facilities 35,559 37,929 36,360 35,721 32,944 31,762 31,645 31,424 31,132 30,988
Communication Facilities 10,125 10,384 10,121 10,274 9,767 9,308 9,257 9,095 9,039 8,815
General Facilities 23,887 53,331 53,261 49,907 48,187 47,537 48,979 50,497 52,227 55,009
Incidental Business Facilities 2,504 2,321 2,070 2,297 2,186 1,980 2,213 2,088 1,944 2,199
Non-Operating Facilities 607 461 248 335 260 798 857 406 331 313
Construction in Progress 326,336 313,664 287,204 295,682 315,318 331,810 367,748 384,957 438,730 483,067
Construction in Progress 326,175 313,542 286,540 295,449 314,737 331,120 367,563 384,859 438,592 482,143
Retirement in Progress 161 121 664 233 580 690 185 98 138 923
Nuclear Fuel 10,310 27,650 38,688 46,693 54,157 59,769 69,216 71,467 73,447 73,682
Nuclear Fuel in Processing 10,310 27,650 38,688 46,693 54,157 59,769 69,216 71,467 73,447 73,682
Investments and Other Assets 225,462 231,268 264,546 263,435 260,877 308,954 336,763 371,731 373,953 400,565
Long-Term Investments 72,069 46,787 72,083 62,572 60,522 67,029 70,612 83,250 61,773 63,824
Long-Term Investments for Subsidiaries and Affiliates 117,195 143,118 152,399 164,876 169,582 212,363 236,195 252,708 265,759 277,179
Long-Term Prepaid Expenses 3,256 2,164 1,824 2,480 1,548 3,760 9,597 16,718 25,553 36,609
Deferred Tax Assets 33,515 40,084 39,079 38,992 35,411 31,004 24,041 19,203 20,866 22,953
Allowance for Doubtful Accounts (574) (886) (840) (5,485) (6,188) (5,204) (3,682) (149) — —
Current Assets 90,896 114,416 93,826 116,528 115,806 121,090 146,302 262,629 165,044 168,232
Cash and Deposits 4,051 4,973 5,151 4,362 4,295 4,440 3,934 4,380 3,969 5,169
Accounts Receivable –Trade 39,036 44,178 39,848 49,264 50,745 48,758 46,228 32,145 26,789 43,488
Other Accounts Receivable 7,198 5,186 4,870 4,845 507 3,618 782 649 4,636 2,838
Short-Term Investments — 22 — — — — 35,000 167,398 72,399 51,000
Supplies 21,800 38,414 19,087 28,529 31,565 33,083 28,210 30,048 31,758 36,360
Advance Payments — — — — — — — — 71 —
Prepaid Expenses 1,355 1,002 1,219 1,672 2,388 2,405 2,370 2,385 2,140 2,752
Short-Term Receivables from Subsidiaries and Affiliates 5,793 4,880 9,516 11,637 6,876 7,808 11,079 6,197 5,293 5,381
Deferred Tax Assets 3,482 4,150 2,993 3,732 4,599 4,917 5,289 3,885 3,217 2,305
Other Current Assets 8,198 11,622 11,138 12,604 14,895 16,166 13,405 15,539 14,767 18,936
Allowance for Doubtful Accounts (20) (14) — (121) (65) (108) — — — —
Total Assets 1,910,290 1,910,592 1,902,504 1,884,830 1,844,261 1,870,291 1,926,731 2,058,609 1,985,248 2,060,881Notes: 1. Owing to the abolition of the Electric Power Development Promotion Law during the year ended March 31, 2004, “accounts receivable-overseas technical services” and
“overseas technical service charge in advance” are now recorded as “other current assets” and “other current liabilities,” in accordance with electric utility accounting regu-lations.
2. Corresponding to the revision of electric utility accounting regulations, the disclosure of “Renewable Power Production Utilities” began and a geothermal power production facility was booked as “Renewable Power Production Facilities” from the year ended March 31, 2010.
3. Accounting policies were partially changed from the year ended March 31, 2017 and the figures for the year ended March 31, 2016 reflect retroactive application of the change.
10-Year Non-Consolidated Financial Data
89
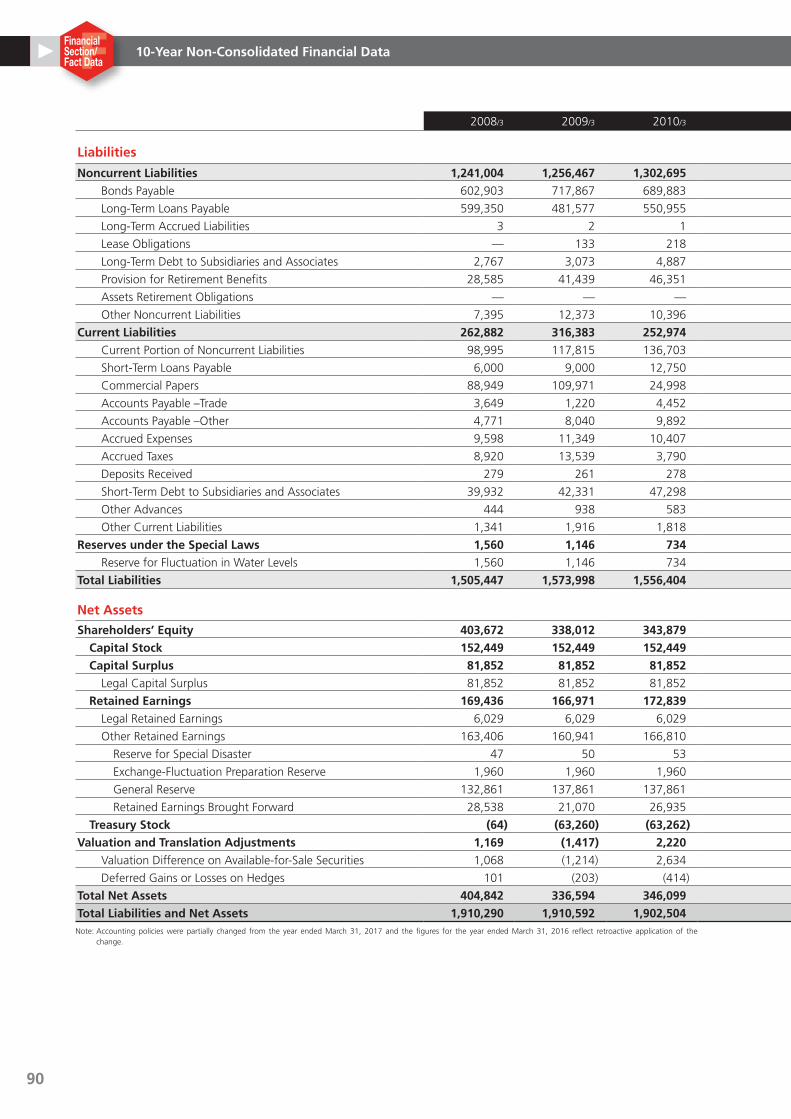
2008/3 2009/3 2010/3 2011/3 2012/3 2013/3 2014/3 2015/3 2016/3 2017/3
Liabilities (Millions of yen)
Noncurrent Liabilities 1,241,004 1,256,467 1,302,695 1,257,747 1,211,719 1,206,654 1,226,516 1,245,889 1,184,707 1,156,280
Bonds Payable 602,903 717,867 689,883 734,898 714,914 694,930 691,346 666,061 575,079 494,991
Long-Term Loans Payable 599,350 481,577 550,955 461,256 429,373 438,228 479,549 524,557 562,520 605,486
Long-Term Accrued Liabilities 3 2 1 0 — — 269 271 269 269
Lease Obligations — 133 218 314 392 374 342 249 188 133
Long-Term Debt to Subsidiaries and Associates 2,767 3,073 4,887 5,709 5,192 4,999 4,932 6,346 1,425 1,805
Provision for Retirement Benefits 28,585 41,439 46,351 45,259 46,053 47,155 42,089 41,945 38,548 47,395
Assets Retirement Obligations — — — 158 175 189 202 214 1,604 1,646
Other Noncurrent Liabilities 7,395 12,373 10,396 10,149 15,617 20,777 7,784 6,242 5,070 4,552
Current Liabilities 262,882 316,383 252,974 277,226 285,725 304,261 325,406 300,443 282,557 342,408
Current Portion of Noncurrent Liabilities 98,995 117,815 136,703 159,747 163,166 192,821 201,395 157,661 145,540 190,745
Short-Term Loans Payable 6,000 9,000 12,750 17,350 18,350 18,350 18,350 18,350 16,250 16,650
Commercial Papers 88,949 109,971 24,998 11,999 12,999 3,999 — — — —
Accounts Payable –Trade 3,649 1,220 4,452 5,055 2,194 2,375 1,839 3,341 1,731 6,141
Accounts Payable –Other 4,771 8,040 9,892 2,970 3,094 2,843 8,362 11,996 7,587 10,560
Accrued Expenses 9,598 11,349 10,407 9,760 10,191 10,276 9,519 10,801 10,016 14,391
Accrued Taxes 8,920 13,539 3,790 18,821 8,877 7,201 4,919 7,972 9,319 7,362
Deposits Received 279 261 278 282 454 474 308 315 323 294
Short-Term Debt to Subsidiaries and Associates 39,932 42,331 47,298 47,634 60,697 59,093 74,979 84,544 87,863 92,253
Other Advances 444 938 583 1,034 666 741 694 602 786 3,067
Other Current Liabilities 1,341 1,916 1,818 2,569 5,032 6,081 5,037 4,857 3,137 941
Reserves under the Special Laws 1,560 1,146 734 777 777 425 119 — 116 —
Reserve for Fluctuation in Water Levels 1,560 1,146 734 777 777 425 119 — 116 —
Total Liabilities 1,505,447 1,573,998 1,556,404 1,535,751 1,498,222 1,511,341 1,552,042 1,546,332 1,467,381 1,498,688
Net Assets
Shareholders’ Equity 403,672 338,012 343,879 348,159 346,824 354,914 366,524 494,713 506,807 545,629
Capital Stock 152,449 152,449 152,449 152,449 152,449 152,449 152,449 180,502 180,502 180,502
Capital Surplus 81,852 81,852 81,852 81,852 81,852 81,852 81,852 109,904 109,904 109,904
Legal Capital Surplus 81,852 81,852 81,852 81,852 81,852 81,852 81,852 109,904 109,904 109,904
Retained Earnings 169,436 166,971 172,839 177,121 175,787 183,878 195,491 204,309 216,405 255,228
Legal Retained Earnings 6,029 6,029 6,029 6,029 6,029 6,029 6,029 6,029 6,029 6,029
Other Retained Earnings 163,406 160,941 166,810 171,092 169,758 177,848 189,462 198,280 210,375 249,198
Reserve for Special Disaster 47 50 53 57 70 77 82 65 66 69
Exchange-Fluctuation Preparation Reserve 1,960 1,960 1,960 1,960 1,960 1,960 1,960 1,960 1,960 1,960
General Reserve 132,861 137,861 137,861 142,861 147,861 147,861 152,861 152,861 162,861 182,861
Retained Earnings Brought Forward 28,538 21,070 26,935 26,213 19,866 27,950 34,558 43,393 45,488 64,308
Treasury Stock (64) (63,260) (63,262) (63,263) (63,264) (63,265) (63,268) (2) (4) (5)
Valuation and Translation Adjustments 1,169 (1,417) 2,220 919 (785) 4,035 8,164 17,562 11,059 16,562
Valuation Difference on Available-for-Sale Securities 1,068 (1,214) 2,634 (479) (1,158) 4,281 8,154 18,663 11,178 14,276
Deferred Gains or Losses on Hedges 101 (203) (414) 1,399 373 (245) 9 (1,101) (118) 2,286
Total Net Assets 404,842 336,594 346,099 349,079 346,039 358,950 374,689 512,276 517,867 562,192
Total Liabilities and Net Assets 1,910,290 1,910,592 1,902,504 1,884,830 1,844,261 1,870,291 1,926,731 2,058,609 1,985,248 2,060,881Note: Accounting policies were partially changed from the year ended March 31, 2017 and the figures for the year ended March 31, 2016 reflect retroactive application of the
change.
10-Year Non-Consolidated Financial Data
90
FFinancial Section/Fact Data

2008/3 2009/3 2010/3 2011/3 2012/3 2013/3 2014/3 2015/3 2016/3 2017/3
Liabilities (Millions of yen)
Noncurrent Liabilities 1,241,004 1,256,467 1,302,695 1,257,747 1,211,719 1,206,654 1,226,516 1,245,889 1,184,707 1,156,280
Bonds Payable 602,903 717,867 689,883 734,898 714,914 694,930 691,346 666,061 575,079 494,991
Long-Term Loans Payable 599,350 481,577 550,955 461,256 429,373 438,228 479,549 524,557 562,520 605,486
Long-Term Accrued Liabilities 3 2 1 0 — — 269 271 269 269
Lease Obligations — 133 218 314 392 374 342 249 188 133
Long-Term Debt to Subsidiaries and Associates 2,767 3,073 4,887 5,709 5,192 4,999 4,932 6,346 1,425 1,805
Provision for Retirement Benefits 28,585 41,439 46,351 45,259 46,053 47,155 42,089 41,945 38,548 47,395
Assets Retirement Obligations — — — 158 175 189 202 214 1,604 1,646
Other Noncurrent Liabilities 7,395 12,373 10,396 10,149 15,617 20,777 7,784 6,242 5,070 4,552
Current Liabilities 262,882 316,383 252,974 277,226 285,725 304,261 325,406 300,443 282,557 342,408
Current Portion of Noncurrent Liabilities 98,995 117,815 136,703 159,747 163,166 192,821 201,395 157,661 145,540 190,745
Short-Term Loans Payable 6,000 9,000 12,750 17,350 18,350 18,350 18,350 18,350 16,250 16,650
Commercial Papers 88,949 109,971 24,998 11,999 12,999 3,999 — — — —
Accounts Payable –Trade 3,649 1,220 4,452 5,055 2,194 2,375 1,839 3,341 1,731 6,141
Accounts Payable –Other 4,771 8,040 9,892 2,970 3,094 2,843 8,362 11,996 7,587 10,560
Accrued Expenses 9,598 11,349 10,407 9,760 10,191 10,276 9,519 10,801 10,016 14,391
Accrued Taxes 8,920 13,539 3,790 18,821 8,877 7,201 4,919 7,972 9,319 7,362
Deposits Received 279 261 278 282 454 474 308 315 323 294
Short-Term Debt to Subsidiaries and Associates 39,932 42,331 47,298 47,634 60,697 59,093 74,979 84,544 87,863 92,253
Other Advances 444 938 583 1,034 666 741 694 602 786 3,067
Other Current Liabilities 1,341 1,916 1,818 2,569 5,032 6,081 5,037 4,857 3,137 941
Reserves under the Special Laws 1,560 1,146 734 777 777 425 119 — 116 —
Reserve for Fluctuation in Water Levels 1,560 1,146 734 777 777 425 119 — 116 —
Total Liabilities 1,505,447 1,573,998 1,556,404 1,535,751 1,498,222 1,511,341 1,552,042 1,546,332 1,467,381 1,498,688
Net Assets
Shareholders’ Equity 403,672 338,012 343,879 348,159 346,824 354,914 366,524 494,713 506,807 545,629
Capital Stock 152,449 152,449 152,449 152,449 152,449 152,449 152,449 180,502 180,502 180,502
Capital Surplus 81,852 81,852 81,852 81,852 81,852 81,852 81,852 109,904 109,904 109,904
Legal Capital Surplus 81,852 81,852 81,852 81,852 81,852 81,852 81,852 109,904 109,904 109,904
Retained Earnings 169,436 166,971 172,839 177,121 175,787 183,878 195,491 204,309 216,405 255,228
Legal Retained Earnings 6,029 6,029 6,029 6,029 6,029 6,029 6,029 6,029 6,029 6,029
Other Retained Earnings 163,406 160,941 166,810 171,092 169,758 177,848 189,462 198,280 210,375 249,198
Reserve for Special Disaster 47 50 53 57 70 77 82 65 66 69
Exchange-Fluctuation Preparation Reserve 1,960 1,960 1,960 1,960 1,960 1,960 1,960 1,960 1,960 1,960
General Reserve 132,861 137,861 137,861 142,861 147,861 147,861 152,861 152,861 162,861 182,861
Retained Earnings Brought Forward 28,538 21,070 26,935 26,213 19,866 27,950 34,558 43,393 45,488 64,308
Treasury Stock (64) (63,260) (63,262) (63,263) (63,264) (63,265) (63,268) (2) (4) (5)
Valuation and Translation Adjustments 1,169 (1,417) 2,220 919 (785) 4,035 8,164 17,562 11,059 16,562
Valuation Difference on Available-for-Sale Securities 1,068 (1,214) 2,634 (479) (1,158) 4,281 8,154 18,663 11,178 14,276
Deferred Gains or Losses on Hedges 101 (203) (414) 1,399 373 (245) 9 (1,101) (118) 2,286
Total Net Assets 404,842 336,594 346,099 349,079 346,039 358,950 374,689 512,276 517,867 562,192
Total Liabilities and Net Assets 1,910,290 1,910,592 1,902,504 1,884,830 1,844,261 1,870,291 1,926,731 2,058,609 1,985,248 2,060,881Note: Accounting policies were partially changed from the year ended March 31, 2017 and the figures for the year ended March 31, 2016 reflect retroactive application of the
change.
10-Year Non-Consolidated Financial Data
91
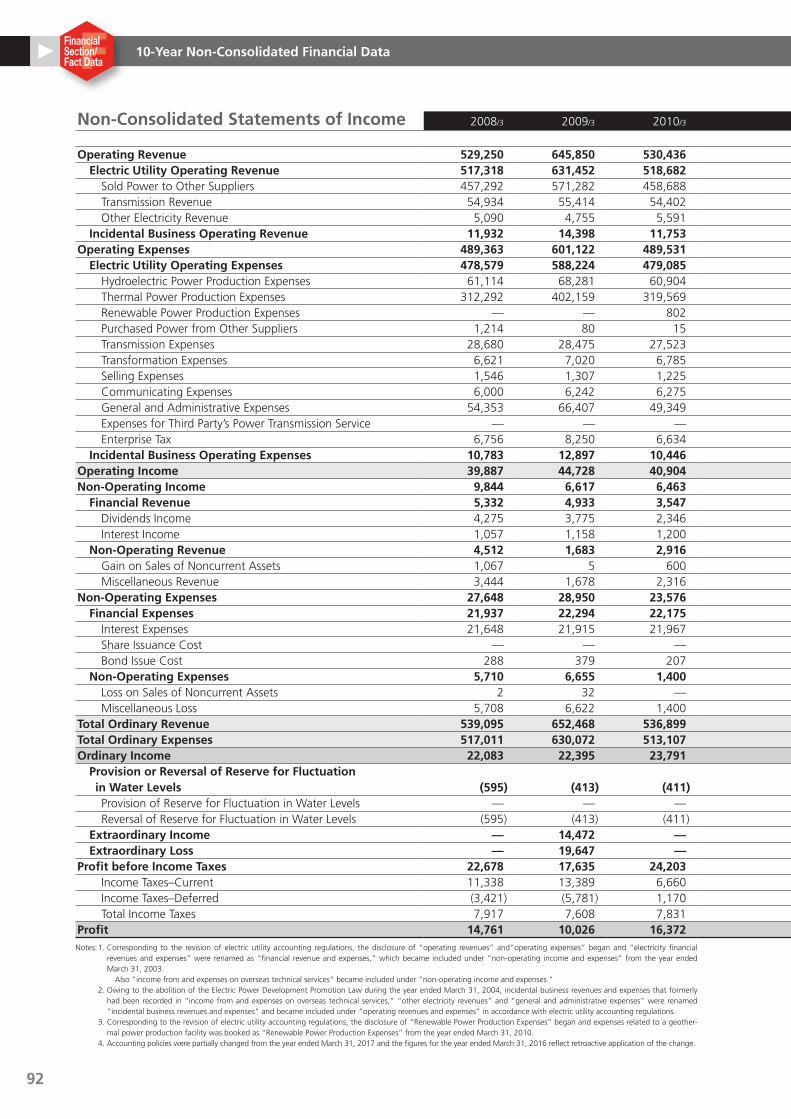
Non-Consolidated Statements of Income 2008/3 2009/3 2010/3 2011/3 2012/3 2013/3 2014/3 2015/3 2016/3 2017/3
(Millions of yen)
Operating Revenue 529,250 645,850 530,436 583,213 599,973 586,993 582,861 557,943 552,341 522,460 Electric Utility Operating Revenue 517,318 631,452 518,682 573,878 590,553 577,284 572,937 548,580 543,019 510,909 Sold Power to Other Suppliers 457,292 571,282 458,688 514,640 532,915 520,620 516,701 495,313 490,235 457,953 Transmission Revenue 54,934 55,414 54,402 54,343 53,059 52,632 52,182 49,281 48,991 49,021 Other Electricity Revenue 5,090 4,755 5,591 4,894 4,579 4,031 4,054 3,985 3,792 3,933 Incidental Business Operating Revenue 11,932 14,398 11,753 9,335 9,419 9,708 9,923 9,363 9,322 11,551Operating Expenses 489,363 601,122 489,531 520,569 557,628 543,659 542,396 513,387 510,770 494,829 Electric Utility Operating Expenses 478,579 588,224 479,085 513,395 549,010 534,765 533,444 504,946 502,326 484,288 Hydroelectric Power Production Expenses 61,114 68,281 60,904 60,005 66,325 60,762 60,633 62,171 62,715 57,093 Thermal Power Production Expenses 312,292 402,159 319,569 358,156 381,201 377,701 383,857 359,690 344,062 322,317 Renewable Power Production Expenses — — 802 976 2,274 2,036 926 367 2,183 645 Purchased Power from Other Suppliers 1,214 80 15 1,388 3,428 256 520 10 14 4,283 Transmission Expenses 28,680 28,475 27,523 26,943 29,031 26,586 27,054 26,459 25,848 23,560 Transformation Expenses 6,621 7,020 6,785 6,453 5,968 6,623 6,218 6,317 6,338 5,751 Selling Expenses 1,546 1,307 1,225 1,223 1,482 2,570 3,197 1,244 1,362 1,209 Communicating Expenses 6,000 6,242 6,275 6,480 6,360 5,815 4,714 4,853 4,671 4,301 General and Administrative Expenses 54,353 66,407 49,349 44,466 45,429 45,040 39,018 36,828 48,135 58,071 Expenses for Third Party’s Power Transmission Service — — — — — — — — — 478 Enterprise Tax 6,756 8,250 6,634 7,300 7,508 7,371 7,301 7,001 6,993 6,577 Incidental Business Operating Expenses 10,783 12,897 10,446 7,174 8,617 8,894 8,952 8,441 8,444 10,540Operating Income 39,887 44,728 40,904 62,644 42,344 43,333 40,464 44,555 41,570 27,630Non-Operating Income 9,844 6,617 6,463 6,348 9,089 8,304 14,773 8,599 18,319 45,458 Financial Revenue 5,332 4,933 3,547 4,649 6,726 6,063 11,700 6,626 17,079 43,456 Dividends Income 4,275 3,775 2,346 3,403 5,401 4,395 10,275 5,250 15,825 42,543 Interest Income 1,057 1,158 1,200 1,246 1,325 1,668 1,425 1,375 1,253 913 Non-Operating Revenue 4,512 1,683 2,916 1,699 2,362 2,241 3,072 1,973 1,240 2,002 Gain on Sales of Noncurrent Assets 1,067 5 600 82 76 109 89 3 10 2 Miscellaneous Revenue 3,444 1,678 2,316 1,616 2,286 2,131 2,983 1,969 1,230 1,999Non-Operating Expenses 27,648 28,950 23,576 25,800 25,756 22,799 24,177 24,217 19,715 16,619 Financial Expenses 21,937 22,294 22,175 21,627 20,525 20,707 20,348 19,531 17,874 15,739 Interest Expenses 21,648 21,915 21,967 21,353 20,525 20,585 20,088 19,115 17,874 15,442 Share Issuance Cost — — — — — — — 274 — — Bond Issue Cost 288 379 207 273 — 122 259 141 — 297 Non-Operating Expenses 5,710 6,655 1,400 4,173 5,230 2,091 3,829 4,685 1,840 879 Loss on Sales of Noncurrent Assets 2 32 — 625 643 630 631 55 4 15 Miscellaneous Loss 5,708 6,622 1,400 3,547 4,587 1,461 3,197 4,629 1,835 863Total Ordinary Revenue 539,095 652,468 536,899 589,561 609,062 595,298 597,635 566,543 570,661 567,919Total Ordinary Expenses 517,011 630,072 513,107 546,370 583,384 566,459 566,574 537,605 530,486 511,449Ordinary Income 22,083 22,395 23,791 43,191 25,677 28,839 31,060 28,938 40,174 56,470 Provision or Reversal of Reserve for Fluctuation
in Water Levels (595) (413) (411) 42 — (351) (306) (119) 116 — Provision of Reserve for Fluctuation in Water Levels — — — 42 — — — — 116 — Reversal of Reserve for Fluctuation in Water Levels (595) (413) (411) — — (351) (306) (119) — — Extraordinary Income — 14,472 — 1,635 — — — 2,280 — — Extraordinary Loss — 19,647 — 13,757 3,434 — — — — —Profit before Income Taxes 22,678 17,635 24,203 31,027 22,243 29,190 31,367 31,337 40,058 56,470 Income Taxes–Current 11,338 13,389 6,660 16,395 10,148 7,999 4,375 3,444 6,267 7,691 Income Taxes–Deferred (3,421) (5,781) 1,170 (153) 2,924 2,596 4,874 5,450 2,970 (2,773) Total Income Taxes 7,917 7,608 7,831 16,242 13,073 10,595 9,250 8,895 9,238 4,917Profit 14,761 10,026 16,372 14,785 9,169 18,594 22,117 22,442 30,820 51,552Notes: 1. Corresponding to the revision of electric utility accounting regulations, the disclosure of “operating revenues” and“operating expenses” began and “electricity financial
revenues and expenses” were renamed as “financial revenue and expenses,” which became included under “non-operating income and expenses” from the year ended March 31, 2003. Also “income from and expenses on overseas technical services” became included under “non-operating income and expenses.”
2. Owing to the abolition of the Electric Power Development Promotion Law during the year ended March 31, 2004, incidental business revenues and expenses that formerly had been recorded in “income from and expenses on overseas technical services,” “other electricity revenues” and “general and administrative expenses” were renamed “incidental business revenues and expenses” and became included under “operating revenues and expenses” in accordance with electric utility accounting regulations.
3. Corresponding to the revision of electric utility accounting regulations, the disclosure of “Renewable Power Production Expenses” began and expenses related to a geother-mal power production facility was booked as “Renewable Power Production Expenses” from the year ended March 31, 2010.
4. Accounting policies were partially changed from the year ended March 31, 2017 and the figures for the year ended March 31, 2016 reflect retroactive application of the change.
10-Year Non-Consolidated Financial Data
92
FFinancial Section/Fact Data

Non-Consolidated Statements of Income 2008/3 2009/3 2010/3 2011/3 2012/3 2013/3 2014/3 2015/3 2016/3 2017/3
(Millions of yen)
Operating Revenue 529,250 645,850 530,436 583,213 599,973 586,993 582,861 557,943 552,341 522,460 Electric Utility Operating Revenue 517,318 631,452 518,682 573,878 590,553 577,284 572,937 548,580 543,019 510,909 Sold Power to Other Suppliers 457,292 571,282 458,688 514,640 532,915 520,620 516,701 495,313 490,235 457,953 Transmission Revenue 54,934 55,414 54,402 54,343 53,059 52,632 52,182 49,281 48,991 49,021 Other Electricity Revenue 5,090 4,755 5,591 4,894 4,579 4,031 4,054 3,985 3,792 3,933 Incidental Business Operating Revenue 11,932 14,398 11,753 9,335 9,419 9,708 9,923 9,363 9,322 11,551Operating Expenses 489,363 601,122 489,531 520,569 557,628 543,659 542,396 513,387 510,770 494,829 Electric Utility Operating Expenses 478,579 588,224 479,085 513,395 549,010 534,765 533,444 504,946 502,326 484,288 Hydroelectric Power Production Expenses 61,114 68,281 60,904 60,005 66,325 60,762 60,633 62,171 62,715 57,093 Thermal Power Production Expenses 312,292 402,159 319,569 358,156 381,201 377,701 383,857 359,690 344,062 322,317 Renewable Power Production Expenses — — 802 976 2,274 2,036 926 367 2,183 645 Purchased Power from Other Suppliers 1,214 80 15 1,388 3,428 256 520 10 14 4,283 Transmission Expenses 28,680 28,475 27,523 26,943 29,031 26,586 27,054 26,459 25,848 23,560 Transformation Expenses 6,621 7,020 6,785 6,453 5,968 6,623 6,218 6,317 6,338 5,751 Selling Expenses 1,546 1,307 1,225 1,223 1,482 2,570 3,197 1,244 1,362 1,209 Communicating Expenses 6,000 6,242 6,275 6,480 6,360 5,815 4,714 4,853 4,671 4,301 General and Administrative Expenses 54,353 66,407 49,349 44,466 45,429 45,040 39,018 36,828 48,135 58,071 Expenses for Third Party’s Power Transmission Service — — — — — — — — — 478 Enterprise Tax 6,756 8,250 6,634 7,300 7,508 7,371 7,301 7,001 6,993 6,577 Incidental Business Operating Expenses 10,783 12,897 10,446 7,174 8,617 8,894 8,952 8,441 8,444 10,540Operating Income 39,887 44,728 40,904 62,644 42,344 43,333 40,464 44,555 41,570 27,630Non-Operating Income 9,844 6,617 6,463 6,348 9,089 8,304 14,773 8,599 18,319 45,458 Financial Revenue 5,332 4,933 3,547 4,649 6,726 6,063 11,700 6,626 17,079 43,456 Dividends Income 4,275 3,775 2,346 3,403 5,401 4,395 10,275 5,250 15,825 42,543 Interest Income 1,057 1,158 1,200 1,246 1,325 1,668 1,425 1,375 1,253 913 Non-Operating Revenue 4,512 1,683 2,916 1,699 2,362 2,241 3,072 1,973 1,240 2,002 Gain on Sales of Noncurrent Assets 1,067 5 600 82 76 109 89 3 10 2 Miscellaneous Revenue 3,444 1,678 2,316 1,616 2,286 2,131 2,983 1,969 1,230 1,999Non-Operating Expenses 27,648 28,950 23,576 25,800 25,756 22,799 24,177 24,217 19,715 16,619 Financial Expenses 21,937 22,294 22,175 21,627 20,525 20,707 20,348 19,531 17,874 15,739 Interest Expenses 21,648 21,915 21,967 21,353 20,525 20,585 20,088 19,115 17,874 15,442 Share Issuance Cost — — — — — — — 274 — — Bond Issue Cost 288 379 207 273 — 122 259 141 — 297 Non-Operating Expenses 5,710 6,655 1,400 4,173 5,230 2,091 3,829 4,685 1,840 879 Loss on Sales of Noncurrent Assets 2 32 — 625 643 630 631 55 4 15 Miscellaneous Loss 5,708 6,622 1,400 3,547 4,587 1,461 3,197 4,629 1,835 863Total Ordinary Revenue 539,095 652,468 536,899 589,561 609,062 595,298 597,635 566,543 570,661 567,919Total Ordinary Expenses 517,011 630,072 513,107 546,370 583,384 566,459 566,574 537,605 530,486 511,449Ordinary Income 22,083 22,395 23,791 43,191 25,677 28,839 31,060 28,938 40,174 56,470 Provision or Reversal of Reserve for Fluctuation
in Water Levels (595) (413) (411) 42 — (351) (306) (119) 116 — Provision of Reserve for Fluctuation in Water Levels — — — 42 — — — — 116 — Reversal of Reserve for Fluctuation in Water Levels (595) (413) (411) — — (351) (306) (119) — — Extraordinary Income — 14,472 — 1,635 — — — 2,280 — — Extraordinary Loss — 19,647 — 13,757 3,434 — — — — —Profit before Income Taxes 22,678 17,635 24,203 31,027 22,243 29,190 31,367 31,337 40,058 56,470 Income Taxes–Current 11,338 13,389 6,660 16,395 10,148 7,999 4,375 3,444 6,267 7,691 Income Taxes–Deferred (3,421) (5,781) 1,170 (153) 2,924 2,596 4,874 5,450 2,970 (2,773) Total Income Taxes 7,917 7,608 7,831 16,242 13,073 10,595 9,250 8,895 9,238 4,917Profit 14,761 10,026 16,372 14,785 9,169 18,594 22,117 22,442 30,820 51,552Notes: 1. Corresponding to the revision of electric utility accounting regulations, the disclosure of “operating revenues” and“operating expenses” began and “electricity financial
revenues and expenses” were renamed as “financial revenue and expenses,” which became included under “non-operating income and expenses” from the year ended March 31, 2003. Also “income from and expenses on overseas technical services” became included under “non-operating income and expenses.”
2. Owing to the abolition of the Electric Power Development Promotion Law during the year ended March 31, 2004, incidental business revenues and expenses that formerly had been recorded in “income from and expenses on overseas technical services,” “other electricity revenues” and “general and administrative expenses” were renamed “incidental business revenues and expenses” and became included under “operating revenues and expenses” in accordance with electric utility accounting regulations.
3. Corresponding to the revision of electric utility accounting regulations, the disclosure of “Renewable Power Production Expenses” began and expenses related to a geother-mal power production facility was booked as “Renewable Power Production Expenses” from the year ended March 31, 2010.
4. Accounting policies were partially changed from the year ended March 31, 2017 and the figures for the year ended March 31, 2016 reflect retroactive application of the change.
10-Year Non-Consolidated Financial Data
93

(As of March 31, 2017)
Company Name Main Businesses Equity Stake (%) (1) (2)
Co
nso
lidated
Sub
sidiaries
Electric Power BusinessBay Side Energy Co., Ltd. Thermal power business 100.0 u u
Mihama Seaside Power Co., Ltd. Thermal power business 100.0 u u
ITOIGAWA POWER Inc. Thermal power business 64.0 u u
J-Wind Co., Ltd. Wind power business 100.0 u u
Japan Clean Energy Development Co., Ltd. Wind power business 100.0 u u
Yurihonjo Wind Power Co., Ltd. Wind power business 100.0 u u
Minami Kyushu Wind Power Co., Ltd. Wind power business 98.8 u u
J-Wind OOMA Co., Ltd. Wind power business 100.0 u u
J-Wind NIKAHO Co., Ltd. Wind power business 100.0J-Wind KUZUMAKI Co., Ltd. Wind power business 100.0J-Wind SETANA Co., Ltd. Wind power business 90.0Nagasaki-Shikamachi Wind Power Co., Ltd. Wind power business 70.0 u u
Nikaho-Kogen Wind Power Co., Ltd. Wind power business 100.0 u u
Electric Power-Related Business
JPec Co., Ltd.
Construction, technical development, design, consulting, maintenance, and research for thermal and nuclear power plants; unloading and transporting of coal at thermal power plants; sale of fly ash; shipping of coal for thermal power plants; research and planning of environmental conservation
100.0 u
JPHYTECH Co., Ltd.
Construction, technical development, design, consulting, maintenance, and research for hydroelectric power plants, substations, and transmission lines; surveying of and compensation for construction sites; civil engineering, construction management, and construction services
100.0 u
JP Business Service Corporation Operation of welfare facilities; facility maintenance; business process outsourcing; development of computer software 100.0 u
KEC Corporation Construction and maintenance of electronic and communications facilities 100.0 u
JP Design Co., Ltd. Design, management, and research for electric power facilities and other facilities and construction consulting 100.0 u
J-POWER RESOURCES Co., Ltd. Import, sales, and transportation of coal 100.0 u
J-POWER AUSTRALIA PTY. LTD. Investments in coal mines in Australia 100.0JPOWER GENEX CAPITAL Co., Ltd. Management of IPP projects 100.0J-Wind Service Co., Ltd. Maintenance and operation of wind power plants 100.0 u
J-POWER EnTech Co., Inc. Engineering services for atmospheric and water pollutant removal equipment 100.0 u
Miyazaki Wood Pellet Co., Ltd. Operation of manufacturing facilities of wood pellets and procurement of forest offcut 98.3 u
JM Activated Coke, Inc. Manufacturing, sales, and marketing of activated coke 90.0 u
EPDC CoalTech and Marine Co., Ltd. Marine transportation of ash and fly ash100.0
(100.0)*
and 11 companiesOverseas BusinessJ-Power Investment Netherlands B.V. Management of investments 100.0
J-POWER Holdings (Thailand) Co., Ltd. Management of investments100.0
(100.0)
J-POWER Generation (Thailand) Co., Ltd. Management of investments, research and development of projects100.0
(100.0)
Gulf JP Co., Ltd. Management of investments 60.0
(60.0)
Gulf JP NS Co., Ltd. Thermal power business 60.0
(60.0)u
Gulf JP UT Co., Ltd. Thermal power business 60.0
(60.0)u
Gulf JP NNK Co., Ltd. Thermal power business 60.0
(60.0)u
Gulf JP CRN Co., Ltd. Thermal power business 60.0
(60.0)u
Gulf JP NK2 Co., Ltd. Thermal power business 60.0
(60.0)u
Gulf JP TLC Co., Ltd. Thermal power business 60.0
(60.0)u
Gulf JP KP1 Co., Ltd. Thermal power business 60.0
(60.0)u
Gulf JP KP2 Co., Ltd. Thermal power business 60.0
(60.0)u
Gulf JP NLL Co., Ltd. Thermal power business 45.0
(45.0)u
J-POWER North America Holdings Co., Ltd. Management of investments 100.0
J-POWER USA Investment Co., Ltd. Management of investments100.0
(100.0)
J-POWER USA Development Co., Ltd. Management of investments, research and development of projects100.0
(100.0)J-POWER Consulting (China) Co., Ltd. Management of investments, research and development of projects 100.0and 13 companies
Major Group Companies
(1) 27 domestic consolidated subsidiaries which are coverd in the environment-related data calculation Note: In addition to the companies shown in the lists, coverage includes JP Enterprise Corporation (100% equity stake by J-POWER) and Biocoal Yokohama-South CO., LTD. (60% equity stake by J-POWER). *Data for EPDC CoalTech and Marine Co., Ltd., are included as a portion of JPec Co., Ltd., data.
(2) 12 domestic electric power business companies and 32 overseas business companies which are coverd in the calculation of CO2 emissions for domestic and overseas power generation
94
FFinancial Section/Fact Data
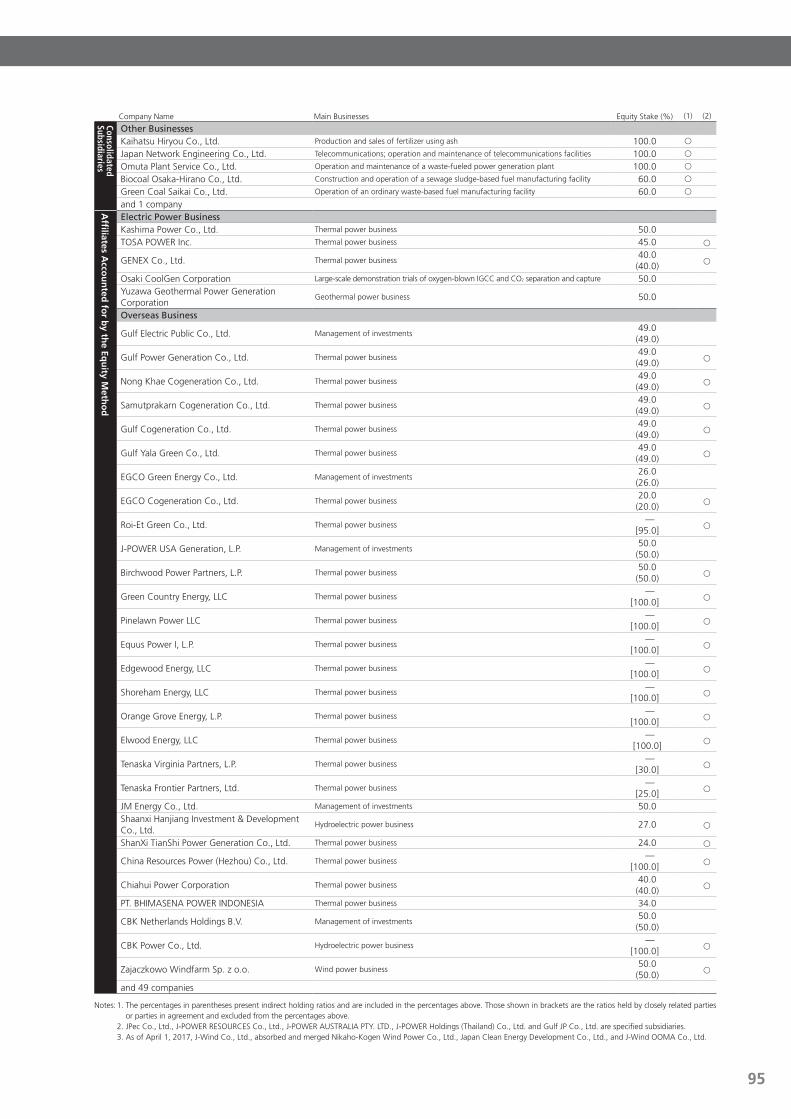
Company Name Main Businesses Equity Stake (%) (1) (2)
Other BusinessesKaihatsu Hiryou Co., Ltd. Production and sales of fertilizer using ash 100.0 u
Japan Network Engineering Co., Ltd. Telecommunications; operation and maintenance of telecommunications facilities 100.0 u
Omuta Plant Service Co., Ltd. Operation and maintenance of a waste-fueled power generation plant 100.0 u
Biocoal Osaka-Hirano Co., Ltd. Construction and operation of a sewage sludge-based fuel manufacturing facility 60.0 u
Green Coal Saikai Co., Ltd. Operation of an ordinary waste-based fuel manufacturing facility 60.0 u
and 1 company
Affi
liates Acco
un
ted fo
r by th
e Equ
ity Meth
od
Electric Power BusinessKashima Power Co., Ltd. Thermal power business 50.0TOSA POWER Inc. Thermal power business 45.0 u
GENEX Co., Ltd. Thermal power business 40.0
(40.0)u
Osaki CoolGen Corporation Large-scale demonstration trials of oxygen-blown IGCC and CO2 separation and capture 50.0Yuzawa Geothermal Power Generation Corporation
Geothermal power business 50.0
Overseas Business
Gulf Electric Public Co., Ltd. Management of investments 49.0
(49.0)
Gulf Power Generation Co., Ltd. Thermal power business 49.0
(49.0)u
Nong Khae Cogeneration Co., Ltd. Thermal power business 49.0
(49.0)u
Samutprakarn Cogeneration Co., Ltd. Thermal power business 49.0
(49.0)u
Gulf Cogeneration Co., Ltd. Thermal power business 49.0
(49.0)u
Gulf Yala Green Co., Ltd. Thermal power business 49.0
(49.0)u
EGCO Green Energy Co., Ltd. Management of investments 26.0
(26.0)
EGCO Cogeneration Co., Ltd. Thermal power business 20.0
(20.0)u
Roi-Et Green Co., Ltd. Thermal power business —
[95.0]u
J-POWER USA Generation, L.P. Management of investments 50.0
(50.0)
Birchwood Power Partners, L.P. Thermal power business 50.0
(50.0)u
Green Country Energy, LLC Thermal power business —
[100.0]u
Pinelawn Power LLC Thermal power business —
[100.0]u
Equus Power I, L.P. Thermal power business —
[100.0]u
Edgewood Energy, LLC Thermal power business —
[100.0]u
Shoreham Energy, LLC Thermal power business —
[100.0]u
Orange Grove Energy, L.P. Thermal power business —
[100.0]u
Elwood Energy, LLC Thermal power business —
[100.0]u
Tenaska Virginia Partners, L.P. Thermal power business —
[30.0]u
Tenaska Frontier Partners, Ltd. Thermal power business —
[25.0]u
JM Energy Co., Ltd. Management of investments 50.0Shaanxi Hanjiang Investment & Development Co., Ltd.
Hydroelectric power business 27.0 u
ShanXi TianShi Power Generation Co., Ltd. Thermal power business 24.0 u
China Resources Power (Hezhou) Co., Ltd. Thermal power business —
[100.0]u
Chiahui Power Corporation Thermal power business 40.0
(40.0)u
PT. BHIMASENA POWER INDONESIA Thermal power business 34.0
CBK Netherlands Holdings B.V. Management of investments 50.0
(50.0)
CBK Power Co., Ltd. Hydroelectric power business —
[100.0]u
Zajaczkowo Windfarm Sp. z o.o. Wind power business 50.0
(50.0)u
and 49 companies
Notes: 1. The percentages in parentheses present indirect holding ratios and are included in the percentages above. Those shown in brackets are the ratios held by closely related parties or parties in agreement and excluded from the percentages above.
2. JPec Co., Ltd., J-POWER RESOURCES Co., Ltd., J-POWER AUSTRALIA PTY. LTD., J-POWER Holdings (Thailand) Co., Ltd. and Gulf JP Co., Ltd. are specified subsidiaries. 3. As of April 1, 2017, J-Wind Co., Ltd., absorbed and merged Nikaho-Kogen Wind Power Co., Ltd., Japan Clean Energy Development Co., Ltd., and J-Wind OOMA Co., Ltd.
Major Group Companies
ConsolidatedSubsidiaries
95
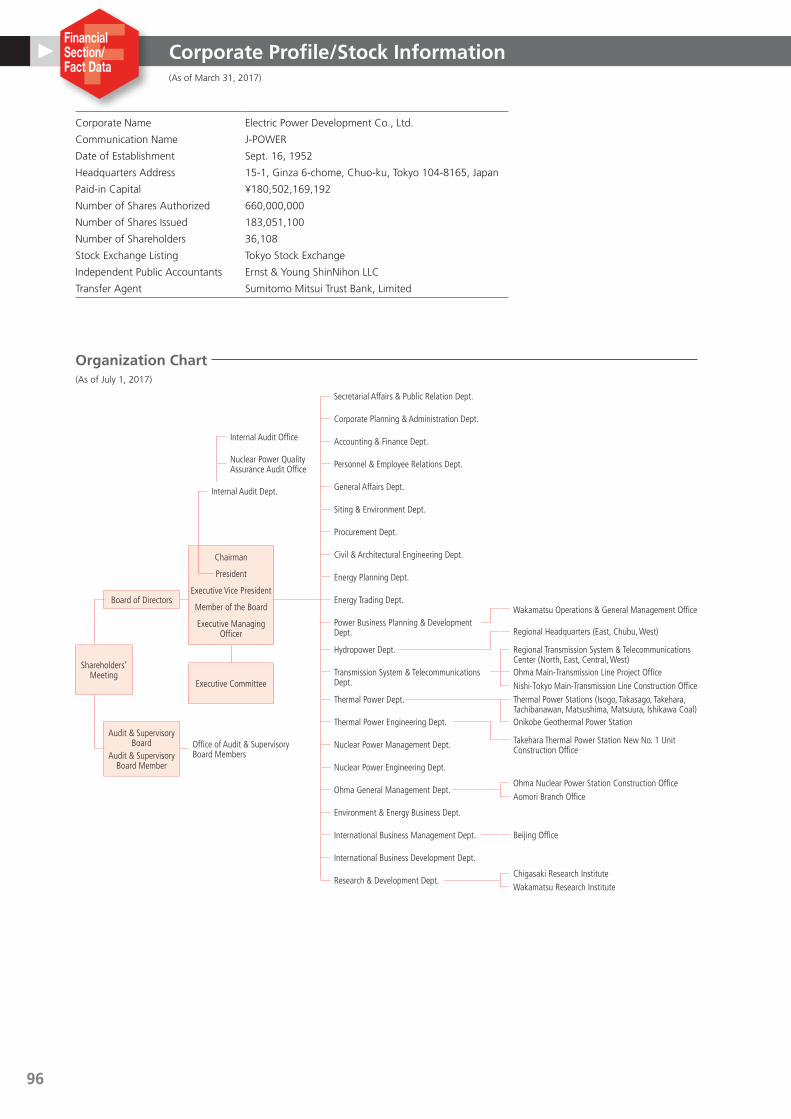
(As of March 31, 2017)
Corporate Name Electric Power Development Co., Ltd.
Communication Name J-POWER
Date of Establishment Sept. 16, 1952
Headquarters Address 15-1, Ginza 6-chome, Chuo-ku, Tokyo 104-8165, Japan
Paid-in Capital ¥180,502,169,192
Number of Shares Authorized 660,000,000
Number of Shares Issued 183,051,100
Number of Shareholders 36,108
Stock Exchange Listing Tokyo Stock Exchange
Independent Public Accountants Ernst & Young ShinNihon LLC
Transfer Agent Sumitomo Mitsui Trust Bank, Limited
Organization Chart (As of July 1, 2017)
Corporate Profile/Stock Information
Internal Audit Office
Nuclear Power Quality Assurance Audit Office
Internal Audit Dept.
Chairman
President
Executive Vice President
Member of the Board
Executive Managing Officer
Board of Directors
Shareholders’ Meeting
Executive Committee
Audit & Supervisory Board
Audit & Supervisory Board Member
Office of Audit & Supervisory Board Members
Secretarial Affairs & Public Relation Dept.
Corporate Planning & Administration Dept.
Accounting & Finance Dept.
Personnel & Employee Relations Dept.
General Affairs Dept.
Siting & Environment Dept.
Procurement Dept.
Civil & Architectural Engineering Dept.
Energy Planning Dept.
Energy Trading Dept.
Power Business Planning & Development Dept.
Hydropower Dept.
Transmission System & Telecommunications Dept.
Thermal Power Dept.
Thermal Power Engineering Dept.
Nuclear Power Management Dept.
Nuclear Power Engineering Dept.
Ohma General Management Dept.
Environment & Energy Business Dept.
International Business Management Dept.
International Business Development Dept.
Research & Development Dept.
Wakamatsu Operations & General Management Office
Regional Headquarters (East, Chubu, West)
Regional Transmission System & Telecommunications Center (North, East, Central, West)Ohma Main-Transmission Line Project Office
Nishi-Tokyo Main-Transmission Line Construction Office
Thermal Power Stations (Isogo, Takasago, Takehara, Tachibanawan, Matsushima, Matsuura, Ishikawa Coal)Onikobe Geothermal Power Station
Takehara Thermal Power Station New No. 1 Unit Construction Office
Ohma Nuclear Power Station Construction Office
Aomori Branch Office
Beijing Office
Chigasaki Research Institute
Wakamatsu Research Institute
96
FFinancial Section/Fact Data
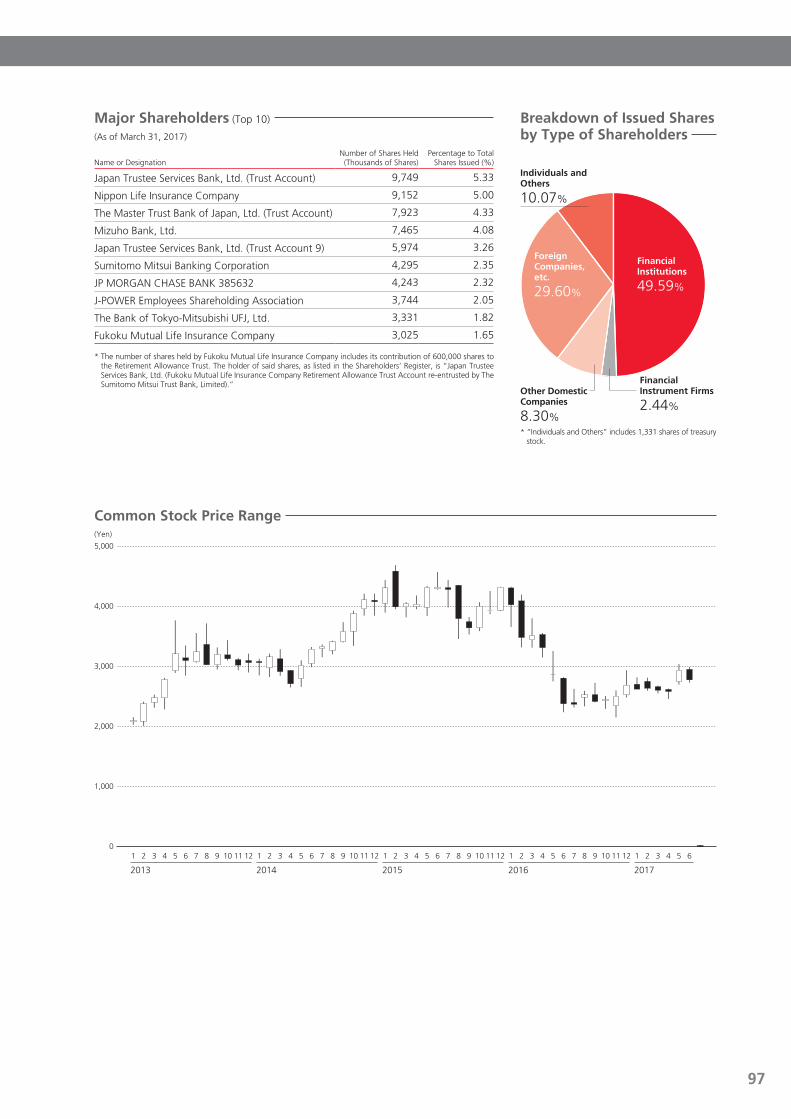
Breakdown of Issued shares by type of shareholders
Major shareholders (Top 10) (As of March 31, 2017)
Name or DesignationNumber of Shares Held (Thousands of Shares)
Percentage to Total Shares Issued (%)
Japan Trustee Services Bank, Ltd. (Trust Account) 9,749 5.33
Nippon Life Insurance Company 9,152 5.00
The Master Trust Bank of Japan, Ltd. (Trust Account) 7,923 4.33
Mizuho Bank, Ltd. 7,465 4.08
Japan Trustee Services Bank, Ltd. (Trust Account 9) 5,974 3.26
Sumitomo Mitsui Banking Corporation 4,295 2.35
JP MORGAN CHASE BANK 385632 4,243 2.32
J-POWER Employees Shareholding Association 3,744 2.05
The Bank of Tokyo-Mitsubishi UFJ, Ltd. 3,331 1.82
Fukoku Mutual Life Insurance Company 3,025 1.65
* The number of shares held by Fukoku Mutual Life Insurance Company includes its contribution of 600,000 shares to the Retirement Allowance Trust. The holder of said shares, as listed in the Shareholders’ Register, is “Japan Trustee Services Bank, Ltd. (Fukoku Mutual Life Insurance Company Retirement Allowance Trust Account re-entrusted by The Sumitomo Mitsui Trust Bank, Limited).” Financial
Instrument Firms
2.44%
other Domestic Companies
8.30%
Foreign Companies, etc.
29.60%
Financial Institutions
49.59%
Individuals and others
10.07%
Common stock Price Range
5,000
4,000
3,000
2,000
1,000
0654321121110987654321121110987654321121110987654321121110987654321
20172016201520142013
(Yen)
* “Individuals and Others” includes 1,331 shares of treasury stock.
97
J-POWER GroupAnnual Report2017
J-POW
ER G
rou
p A
nn
ual R
epo
rt 2017
Printed in Japan2017.9
Electric Power Development Co., Ltd.Corporate Planning & Administration DepartmentCorporate Planning Office15-1, Ginza 6-chome, Chuo-ku, Tokyo 104-8165, JAPAN TEL: +81-3-3546-2211 E-Mail: [email protected]://www.jpower.co.jp/english/
環境対応マーク 印刷会社にてはりつけます
2017.92017.9
Printed in Japan2017.9