
Environment and Climate Change - Welcome to … and Climate Change 191 9 Environment and Climate...
32
9 Environment and Climate Change 9.1 ENVIRONMENT 9.1.1. Protection of the environment has to be a central part of any sustainable inclusive growth strategy. This aspect of development is especially important in the Eleventh Plan when consciousness of the dangers of environmental degradation has increased greatly. Population growth, urbanization, and anthropogenic development employing energy-intensive technologies have resulted in injecting a heavy load of pollutants into the environment. More recently, the issue assumed special importance because of the accumulation of evidence of global warming and the associated climate change that it is likely to bring. 9.1.2. An important feature of any environmental strategy is that environmental objectives require action in several areas, which typically lie in the purview of different ministries. The Ministry of Environment and Forests (MoEF) has the important role of monitoring the development process and its environmental impact in a perspective of sustainable development and to devise suitable regulatory structures to achieve the desired results. While this role is crucial, environmental objectives can only be achieved if environmental concerns are internalized in policymaking in a large number of sectors. This would require sharing of responsibility at all levels of government and across sectors with respect to monitoring of pollution, enforcement of regulations, and development of programmes for mitigation and abatement. Regulatory enforcement must also be combined with incentives, including market and fiscal mechanisms to encourage both industry and people in their day-to-day working lives to act in a manner responsive to environmental concerns. Sustainable use of natural resources also requires community participation with a responsible role assigned to the communities for conservation. 9.1.3. In this chapter, we outline the main issues in the traditional area of environment and also consider the new challenges posed by climate change. OVERVIEW 9.1.4. The Tenth Plan was a period of extensive review of environmental processes and law. The first National Environment Policy was put into place in May 2006. Also, the re-engineering of the environmental clearance process and Environmental Impact Assessment (EIA) Notification and review of the Coastal Regulation Zone Notification were undertaken to improve the quality of environmental governance. The Eleventh Plan must build on this experience by integrating environment considerations into policymaking in all sectors of the economy— infrastructure, transport, water supply, sanitation, industry, agriculture, and anti-poverty programmes. It also calls for strengthening the oversight and regulatory framework for environment management so that development decisions do not impinge adversely on sustainability. 9.1.5. Some initiatives needed to integrate environmental concerns into planning and developmental activities across all the sectors are given below: • Environment is a residual Central subject. Since regulation and enforcement in this area cannot be handled by the Central Government alone and the responsibility of maintaining the environment rests at all levels of government, we need to consider
Transcript of Environment and Climate Change - Welcome to … and Climate Change 191 9 Environment and Climate...

Environment and Climate Change 191
9Environment and Climate Change
9.1 ENVIRONMENT9.1.1. Protection of the environment has to be a centralpart of any sustainable inclusive growth strategy. Thisaspect of development is especially important inthe Eleventh Plan when consciousness of the dangersof environmental degradation has increased greatly.Population growth, urbanization, and anthropogenicdevelopment employing energy-intensive technologieshave resulted in injecting a heavy load of pollutants intothe environment. More recently, the issue assumed specialimportance because of the accumulation of evidence ofglobal warming and the associated climate change that itis likely to bring.
9.1.2. An important feature of any environmentalstrategy is that environmental objectives require actionin several areas, which typically lie in the purview ofdifferent ministries. The Ministry of Environmentand Forests (MoEF) has the important role of monitoringthe development process and its environmental impactin a perspective of sustainable development and to devisesuitable regulatory structures to achieve the desiredresults. While this role is crucial, environmental objectivescan only be achieved if environmental concerns areinternalized in policymaking in a large number of sectors.This would require sharing of responsibility at alllevels of government and across sectors with respect tomonitoring of pollution, enforcement of regulations,and development of programmes for mitigation andabatement. Regulatory enforcement must also becombined with incentives, including market and fiscalmechanisms to encourage both industry and people intheir day-to-day working lives to act in a mannerresponsive to environmental concerns. Sustainable
use of natural resources also requires communityparticipation with a responsible role assigned to thecommunities for conservation.
9.1.3. In this chapter, we outline the main issues in thetraditional area of environment and also consider the newchallenges posed by climate change.
OVERVIEW9.1.4. The Tenth Plan was a period of extensive reviewof environmental processes and law. The first NationalEnvironment Policy was put into place in May 2006. Also,the re-engineering of the environmental clearance processand Environmental Impact Assessment (EIA) Notificationand review of the Coastal Regulation Zone Notificationwere undertaken to improve the quality of environmentalgovernance. The Eleventh Plan must build on thisexperience by integrating environment considerationsinto policymaking in all sectors of the economy—infrastructure, transport, water supply, sanitation, industry,agriculture, and anti-poverty programmes. It also callsfor strengthening the oversight and regulatory frameworkfor environment management so that developmentdecisions do not impinge adversely on sustainability.
9.1.5. Some initiatives needed to integrate environmentalconcerns into planning and developmental activitiesacross all the sectors are given below:
• Environment is a residual Central subject. Sinceregulation and enforcement in this area cannot behandled by the Central Government alone and theresponsibility of maintaining the environment restsat all levels of government, we need to consider

192 Eleventh Five Year Plan
whether environment can be made a concurrentsubject in the constitution. This will help the StateGovernments and the local authorities to enact andnotify their own enforcement laws and rules to ensurecompliance of relevant environmental norms.
• There is a case for setting up an independent, statutorybody on sustainable development with the specificresponsibility of guiding government policies andprogrammes for making them more socially andenvironmentally sustainable, and to monitor andevaluate their outcomes. This body should compriseeminent environmental experts and citizens with along and publicly known record in environmentalresearch or action. It should have adequate powers toaddress environment concerns and not be a purelyadvisory body.
• The State Pollution Control Boards should berestructured into statutory Environment ProtectionAuthorities with the mandate of developing regulations,standards and upgraded facilities for enforcingcompliance.
• At the district level, the scheme of Paryavaran Vahinis,or committees of concerned citizens, should be revivedto serve as environmental watchdogs and undertakeselective first hand monitoring of the environmentalsituation in the districts.
• For improving the quality and transparency of theenvironmental clearance process, prior informedconsent of the local self governments of the respectivearea, as specifically provided in PESA, may beintroduced for proposals requiring environmentalclearance. Public hearing should also be mademandatory for the activities specified in the EIAnotification.
ENVIRONMENTAL IMPACT ASSESSMENT (EIA)9.1.6. EIA is an important management tool forintegrating environmental concerns in the developmentprocess and for improved decision making. The MoEFin 1994 issued the first EIA Notification prescribingmandatory environmental clearance for 32 categoriesof developmental activities. The process involvedconsideration of environmental consequences beforestarting projects and included procedures like EIA study,public hearing in certain cases, and consideration of theoutcome by expert groups before issuing of finalclearance by MoEF. This process takes time, often causinglong delays in commencement of projects. MoEF organizeda re-engineering of the process and a fresh notificationwas issued in September 2006. The specific modificationsmade in the EIA notification are summarized inTable 9.1.1.
Step Pre 2006 Notification position As per 2006 Notification
Activities requiring 32 activities including infrastructure in 39 activities in eight categories including mining/clearance respect of petroleum and chemicals, exploration/power generation, primary processing,
exploration, hazardous industries, large material processing, material production, manufacturing/tourism projects, thermal power plants, fabrication, service sector, infrastructure, andconstruction and industrial estates. construction.
Process Clearance based on recommendation of Clearance by designated EIA authorities at the Central orExpert Committees set up by the Ministry. State level based on prescribed dimensions of the projects
in the Notification.At the Central and State level, Expert Appraisal Committeesprovide recommendations for decision-making.
Categories of projects No categories defined as MoEF was the Two categories prescribed namely, (i) to be dealt at thesole authority for granting clearance. Central level and (ii) delegated to the State EIA Authority
for clearance.
Processing time 180 days. Cat. A: 120 days.excl. EIA/EMP Cat. B: 30 days.
Public Consultation Requirement of public hearing at the Public hearing prescribed for all Category A and some ofdiscretion of government. the Category B projects (defined as B1).
Source: Environment Clearance Notifications, 1994 and 2006.
TABLE 9.1.1Changes in Environment Clearance Notification, 2006

Environment and Climate Change 193
9.1.7. The new process came into effect on 14 September2006. As State level authorities and committees are in theprocess of being set up, the impact of the new process isyet to be seen.
AFFORESTATION9.1.8. Forests play a critical role in environment protectionin two ways. They help to absorb carbon dioxide in theatmosphere thus mitigating the build up of GHGs. Theyalso help to cope with water stress by trapping water thatwould otherwise run off and this is especially so whenforests exist in upper ends of catchments. Unfortunately,both benefits are eroded by deforestation largely as aresult of human pressure to exploit forest resources. Whilesome exploitation of forests may be appropriate, thesustainability of forest resources is determined by thequantum of withdrawals.
9.1.9. The existing information on forest/tree coverbased on the satellite data of 2002 indicates a greencover of 23.68%. There has been a net improvement of0.65% between 2000 and 2002. Presuming that thesame growth rate continues till 2007, the Tenth Plantarget of 25% may have been achieved by 2007. Thiswill be variable in the data of 2008, to be used for theState of Forest Report (SFR) 2009.
9.1.10. The present extent of forest lands in the countryis 77.47 million ha. However, not all the forest lands areunder the tree canopy and trees grow outside forestsalso. SFR 2003 of Forest Survey of India indicates a treecover of over 67.83 million ha, that is, 20.64% of the landarea. This extent aggregates the blocks of more than 1 haarea under tree cover. Outside this, nearly 10 m ha areahas been assessed as under tree cover in smaller than 1ha patches outside forests. This brings the total greencover up to 77.83 million ha or 23.68% of the total area.Out of this, dense forests have declined from 416809 sqkm in 2001 to 390564 sq km, that is, a fall of 6%. Thoughover the last few years the extent of forest coverhas stabilized, the low extent of good forests is a matterof concern.
9.1.11. Severe pressure for meeting growing livelihood,industrial, and development needs have been some ofthe critical contributing factors. A demand–supply gapof almost 64 million cubic meters has been projectedfor timber in 2006. The shortage is being met through
import since 1985 amounting to nearly Rs 9000 crore(2003–04). Against a sustainable availability of fuel woodof only 17 million tonnes from the forests, the annualfuel wood requirement has been estimated to be above200 million tonnes. With development of technologiesfor use of even smaller sizes of wood for structural uses,small wood is also not available for fuel. India may havesufficient food to eat but it does not have sufficient fuelwood to cook it. Forests also meet about one-third offodder requirement. The total production of Non TimberForest Produce (NTFP) has been assessed as worth aboutRs 4188 crore annually (Institute of Economic Growth,2002). Ever increasing herbal markets are only to putfurther pressures.
9.1.12. While the gaps are huge, potential forimprovement of productivity exists. The status of greencover is an indicator of status of productivity of forests.The following strategies have been evolving in the sectorfor improving the status of green cover.
Participatory Forest Management orJoint Forest Management (JFM)9.1.13. Initiated with the circular of the MoEF on 1 June1990 on people’s involvement in forest conservation andmanagement, the JFM regime has evolved graduallyand at present 106479 such committees (22 millionparticipants) are functioning in 28 States covering 22.02million ha of forests. This participatory regime is seen asa potential strength of forest management for the forestfringes. The challenge now is to effectively empowerthe local communities with appropriate rights andresponsibilities, and ensure that substantial benefits fromforest conservation accrue to them.
9.1.14. A similar approach has been attempted in wild-life management also. In Project Tiger, India, Eco-development Project was implemented during 1995–2005 under Global Environment Facility (GEF) withfocus on village eco-development through optimum useof local resources and involvement of local people inconservation of protected areas. Integration of thisapproach to protected area management through shareddecision-making and full integration of conservation andlivelihoods across the landscape are yet to be realized. Also,the recognition of a large range and diversity of communitytraditions or new initiatives towards conservation isvery weak.

194 Eleventh Five Year Plan
Social Forestry9.1.15. The First Five Year Plan, as far back as 1951,indicated the scope for establishment of village plantations.Subsequently, a series of externally aided social forestryprojects during the 1980s and allocation of 25% of DistrictRural Development Agency funds under National RuralEmployment Programme, Rural Landless EmploymentGuarantee Programme, and so on, for social afforestationprovided impetus to social forestry. This provision wasnot pursued since the Eighth Plan. Regeneration of forestsand growing of trees being a long-term activity, did notreceive due focus in the rural development programmes.Even the Watershed Management Programme aims moreat equitable sharing and caring of watershed benefits, andafforestation remains a latent component. The cost normsof these programmes are not able to support substantialafforestation activities requiring strong wage contribution.
Agro and Farm Forestry9.1.16. The social forestry programmes also includeextension and promotion of agro and farm forestry inthe farm sector. The farmers of the States like Punjab,Haryana, Himachal Pradesh, Uttar Pradesh, Karnataka,and Tamil Nadu have adopted agro forestry. However,the forward linkages with the user industry andfacilitation by the State agencies have not existed. Thus,the sector suffers from problems of unorganized marketsdriven by middlemen, depriving the farmers of optimumprices for their produce. Conservative exim regulations,cutting and transit controls act as disincentives fordiversification into the species which face controls butare economically important.
Strategy for the Eleventh Plan9.1.17. The monitorable target of the Eleventh Five YearPlan is to increase the forest cover by 5% of the totalgeographical area. This would require an additional coverof about 16 million ha. Out of this, 5 million ha could bebrought under the tree cover within the recorded forestarea while the rest would be added through agro forestryand social forestry. However, the policy target is to have33% forest and tree cover ultimately which will requireadditional coverage of about 10–11 million ha. This willhave to be done mainly outside the recorded forest area.
9.1.18. The target of 33% forest and tree cover reflectsthe tree component without accounting for other vibrantnon-tree natural biomes like grasslands. The amendmentof the target of the 1952 policy, of one-third area under
forests, to forest/tree cover resulted in a shift of focus fromecological habitats to tree cover. Further recognition ofbiodiversity characteristics and ecological servicesrendered by habitats like grasslands, natural desertecosystems, alpine, and riparian habitats suggests thatseveral biomes, even if devoid of tree component, can berecognized as ‘green cover’ and accounted so. Recognizingthese facts, the following strategic principles will beadopted for dealing with the green cover.
9.1.19. The policy objective of 33% tree/forest covershould be revisited for its definition on ecologicalconsiderations. The green cover should include the existingnatural ecosystems within which the tree cover constitutesa sub-set.
9.1.20. Enabling environment for social and participatoryregimes should be the aim of Central efforts, as isbeing done through the JFM mode under the NationalAfforestation Programme.
9.1.21. Implementation of the Central programmes hasmet with difficulties on fund flow management at theState level. It is advisable to undertake activities in projectmode with earmarked funding, as is done in the externallyaided projects.
IMPROVING AIR QUALITY9.1.22. The Air (Prevention and Control of Pollution)Act, 1981 is the main legislation for regulating air quality,through the Pollution Control Boards (PCBs) in theStates. The Central Pollution Control Board (CPCB) hasidentified 2301 medium and large scale polluting industrialunits under 17 highly polluting categories. The requisitepollution control devices are reported to have beenprovided in 1927 units, while 235 have been closed andthe 139 are still defaulting. CPCB also monitors ambientair quality at 308 stations covering 115 cities/towns in28 States and four UTs in the country to: (i) determinethe status and trend in ambient air quality on significantparameters like benzene and polyaromatic hydrocarbons(PAH); (ii) assess health hazard and the damage tomaterials; (iii) develop preventive and corrective measures;and (iv) understand the natural cleansing process.Presently, the criteria pollutants monitored by Central/State PCBs and associate agencies include sulphur dioxide(SO2), NOx, and Respirable Suspended Particulate Matter(RSPM). Other parameters for toxic trace matters PAHare also monitored for select cities.

Environment and Climate Change 195
9.1.23. A programme for real time air quality monitoringfor cities with population of more than 1 million wasstarted during the Tenth Plan. The automatic airquality monitoring systems are operational in Jodhpur,Patna, Pune, and Sholapur while those in Kanpur,Varanasi, Jharia, and Kolkata will be functional soon.As many as 76 cities/towns are found to exceedacceptable limits of these parameters mainly dueto vehicular and industrial pollution measured interms of ambient air quality in residential, industrialand sensitive areas for SO2, oxides of nitrogen, SuspendedParticulate Matter, RSPM, ammonia, and carbonmonoxide.
9.1.24. Figure 9.1.1 displays the average air quality levelsof select Asian cities between 2000 and 2004. The chartshows that New Delhi, Mumbai, and Kolkata have failedto meet the WHO standards as far as Total SuspendedParticulate Matter and RSPM are concerned. Beijing andShanghai, though better than Indian cities, also couldnot meet the WHO standards in this respect. The otherAsian cities which failed to meet the required standardswere Jakarta, Katmandu, Seoul, Dhaka, and Colombo.As far as SO2, and NO2 are concerned, New Delhi andMumbai were much better than the prescribed WHOstandards whereas several Asian cities exceeded thesafe limits.
9.1.25. Action Plans for improvement of air quality havebeen drawn for 16 identified cities on the advice of theSupreme Court. Based on the basic format prepared byCPCB for this purpose, the State PCBs have been askedto evolve such plans for their respective areas.
9.1.26. During the Eleventh Plan period, all Centralprogrammes on outdoor pollution should be reorganizedunder a National Air Quality Plan, which will cover (i) Citybased Clean Air Action Plans (CAAPs) and (ii) PollutionControl and Prevention in Industrial Areas programmes.The ongoing national programme for monitoring airquality will be taken forward for achieving real time data.This would help in creating early warning systems andthus enforcing the Plan target of conforming air andwater quality to WHO standards.
9.1.27. The entire Air Quality Monitoring network shouldbe expanded from the current 308 stations to 1000 stations.Real time monitoring of PM2.5 (Particulate Matter 2.5micron), ozone, VOCs (Volatile Organic Compounds),PAH, secondary pollutants—sulphates and nitrates—willbe organized in about 15 cities per year, to cover the 76cities which currently exceed the four specified levels ofair pollution. Source monitoring of VOC, BTX (benzene,toluene, and xylene), and toxic heavy metals will beinitiated to develop control measures.
350
50
100
150
200
250
300
0
Con
cen
trat
ion
mg/
m1
Ban
gkok
Bei
jing
Bu
san
Col
ombo
Dh
aka
Han
oi
Ho
Ch
i Min
h C
ity
Hon
g K
ong
Jaka
rta
Kat
hm
andu
Kol
kata
Man
ila
Mu
mba
i
New
Del
hi
Seou
l
Shan
ghai
Sin
gapo
re
Taip
ai
Toky
o
City
TSP limit = 60–90 mg/m
PM limit = 50 mg/m
TSP
PM
SO limit = 50 mg/m
NO limit = 40 mg/m
SO
NO
Source: CAI-Asia (2006c).
FIGURE 9.1.1: Urban Air Quality in Select Asian Cities, 2000–04

196 Eleventh Five Year Plan
9.1.28. Vehicular pollution is a major source of airpollution in our cities and control of vehicular pollutionshould have high priority in planning for a clean urbanenvironment. Some of the initiatives needed to controlvehicular emissions are listed in Box 9.1.1.
9.1.29. More generally, effective urban transport plan-ning, with appropriate initiatives for the developmentof public transport is particularly important. CAAPshould therefore be integrated with the National
Urban Transport Policy and the JNNURM to ensureoptimal development of public transport includingboth bus and rail based mass rapid transit systems.CAAP should also be the basis of all Central and Statefunding with appropriate provision of penalties fornon-compliance.
9.1.30. The monitorable target in air quality should beto achieve WHO standards of air quality in all major citiesby 2011–12.
Box 9.1.1Strategy to Control Vehicular Emissions
• There should be uniform fuel quality and emission standards across India. The road map proposed in the government’sAuto Fuel Policy must be accelerated and tightened to cover all cities and to implement Euro IV standards.
• The use of diesel in private vehicles must be discouraged. The present distortions in pricing under which diesel is muchcheaper than petrol, encourages the growth of diesel vehicles leading to cheap and toxic motorization.
• All Central funding for the transport sector must be linked to the implementation of car restraint measures includingparking charges designed to recover the full cost of using parking space (linked to the real estate and construction costs)and rationalization of road and other transportation related taxes (such as passenger tax, sales tax, and so on) to reducethe tax burden on public transport and increase it for the personal motorized transport.
• The government should impose higher annual taxes on personal transport, which should be used to create a dedicatedfund for public transport.
Designated-Best-Use Class of water Criteria
Drinking water source without conventional A 1. Total Coliform—Most Probable No. (MPN)/100ml < 50treatment but after disinfection 2. pH – 6.5–8.5
3. DO > 6mg/litre4. BOD (5 days 20∞C) – < 2mg/litre
Outdoor bathing (Organized) B 1. Total Coliform (MPN)/100ml – < 5002. pH – 6.5–8.53. DO – > 5mg/l4. BOD – (5 days 20∞C) – < 3mg/l
Drinking water source after conventional treatment C 1. Total Coliform (MPN)/100ml – < 5000and disinfection 2. pH – 6.5 – 9.0
3. DO > 4mg/litre4. BOD – (5 days 20∞C) – < 3mg/l
Propagation of wildlife and fisheries D 1. pH – 6.5–8.52. DO – > 4mg/litre3. Free Ammonia (as N) – < 1.2 mg/l
Irrigation, industrial cooling, controlled E 1. pH – 6.5–8.5waste disposal 2. Electrical Conductivity—(25∞C) micro mhos/cm < 2250
3. Sodium Absorption Ratio Max. 264. Boron Max. 2mg/l
Below-E Not Meeting A, B, C, D & E Criteria
Source: CPCB.
TABLE 9.1.2Notified Standards for Water Quality

Environment and Climate Change 197
WATER QUALITY
Monitoring Water Pollution9.1.31. The Water (Prevention and Control of Pollution)Act, 1974 regulates water quality through the State PCBs.The CPCB, under MoEF, has established a nationwidenetwork for water quality monitoring comprising 1019stations in 27 States and six UTs. The monitoring is doneon a monthly or quarterly basis for surface water and ona half-yearly basis for groundwater. The monitoringnetwork covers 200 rivers, 60 lakes, five tanks, three ponds,three creeks, 13 canals, 17 drains, and 321 wells. Watersamples are analysed for 28 parameters including physicalparameters, nutrients, major ions, and organic andbacteriological parameters.
National River Conservation Plan (NRCP)9.1.32. The different standards of water quality requiredfor drinking, bathing, and irrigation are given in Table 9.1.2.
9.1.33. Out of the various parameters monitored,Biochemical Oxygen Demand (BOD) and Coliforms arecritical. Maintenance of certain level of flow that couldensure a minimum assimilative capacity in water bodiesremains a matter of concern, especially in the light ofincreasing consumptive demands of various sectors suchas household, industry, and agriculture. Based onmonitoring done during the last 10 years, 14% of riverinelength is highly polluted (BOD more than 6 mg/litre)and 19% moderately polluted (BOD—3 to 6 mg/litre).A total of 86 polluted stretches have been identified andaction plans for improving the water quality in them arebeing prepared.
9.1.34. As small-scale industries do not have adequateresources, space or skilled manpower to treat theirwastewater, a scheme of Common Effluent TreatmentPlants (CETPs) was initiated in June 1990. The CETPsare partially funded by the GoI. Eighty-eight CETPscovering more than 10000 polluting industries have beenset up during the Tenth Plan. However, the performanceof these units has been generally unsatisfactory largelydue to improper operation and maintenance. Thiscalls for strengthening of enforcement. Charters onCorporate Responsibility on Environmental Protectionin respect of 17 categories of highly polluting industrieshave also been formulated in collaboration with theconcerned industries.
9.1.35. It is necessary to consider rivers holistically toevolve plans to restore their ecological health and improvethe water quality to bathing standards. Cities and townslocated on the banks have been found to be gross pollutersand these have been taken up for planning andimplementing schemes to ensure that only treatedwastewater is discharged into the rivers.
9.1.36. Untreated sewage dumped into our rivers is amajor cause of river pollution. The total sewage generationin the country is about 33000 MLD (million litres perday). Against this, the total average treatment capacity isonly 6190 MLD and 40% of that capacity is in Delhi.This underlines the urgent need to expand the sewagetreatment capacity in the country.
9.1.37. The NRCP has covered 160 towns along 34polluted river stretches in 20 States and has created 2055MLD of sewage treatment plant (STP) capacity till now,which is approximately 38% of the approved capacity of5435 MLD to be set up under the Plan. The average capacityutilization of existing STP capacity is reported to be about72% against the desirable capacity utilization of 100%.Under-utilization of capacity is due to factors like irregularpower supply, absence of connections between domesticsewage drains and STPs, failure of States to provide formaintenance costs of STPs, and so on.
9.1.38. Under the Ganga Action Plan (GAP) Phase-I,sewage treatment capacity of 869 MLD was set upcovering 25 Class-I towns in Uttar Pradesh, Bihar,and West Bengal. This amounted to 35% of the totalsewage treatment capacity needed. As a result of theimplementation of GAP I, the length of the pollutedstretch of the river was reduced from 740 km to 437 km(Kannauj to Varanasi). Phase-II (1993) covered Ganga’stributaries (Yamuna, Damodar, and Gomti) in 96 townsin seven States. It is estimated that another 20% of thepollution load of Ganga would be covered on completionof the on-going works under NRCP. However, there willstill be a gap of nearly 45% of the pollution load to beaddressed in the future.
9.1.39. Other major river cleaning projects cover Gomtiriver in Uttar Pradesh; Yamuna River in Delhi; MusiRiver in Hyderabad and Pamba River in Kerala. The 22km stretch of the Yamuna in Delhi between Wazirabadand Okhla, is critically polluted. A sewage treatment

198 Eleventh Five Year Plan
capacity of 2960 MLD was required to handle the entiredischarge load in Delhi. However, the STP capacitycreated is about 2500 MLD only, leaving a gap of about460 MLD. More importantly, the existing STPs areable to treat only about 1600 MLD (about 64%capacity utilization) due to dilapidated condition oftrunk sewers.
9.1.40. The impact reported by MoEF reveals that BODis within the prescribed standards (BOD less than 3 mg/l and Dissolved Oxygen [DO] more than 6 mg/l forBathing Quality) at most major cities along the Ganges.However, as shown in Table 9.1.3 below, the stretch fromKannauj to Allahabad has not yet achieved bathing qualitystandard. As shown in Table 9.1.4, the stretch of Yamunariver between Delhi and Etawah in Uttar Pradesh is noteven of bathing standard.
9.1.41. The rivers Narmada, Mahanadi, Brahmini,Baitarni, Subarnrekha, Beas, and Chambal maintain DOlevels of 4.0 mg/l or above throughout the year. In theGanga, Yamuna, Krishna, Sabarmati, Tapi, Sutlej however,the DO level goes as low as 0.3 mg/l.
Strategy for the Eleventh Plan9.1.42. The country’s first river action programme—GAP—completes over 20 years and the NRCP completes10 years in 2007. The experience of the first 20 years needsto be used to design an effective and affordable rivercleaning programme for the future.
• A basic objective must be to maintain minimum flows,which are threatened by withdrawal of water to meetthe needs of agriculture and industry, and to ensuretreatment of sewage and effluents.
• As urban sewage load is the dominant factor causingriver pollution, integration of the NRCP and NationalLake Conservation Plan (NLCP) with the urbandevelopment programmes and agencies is essential. Itshould be ensured that by 2011–12 no untreated sewageis drained into the rivers.
• For receiving assistance under the NRCP/NLCP,ULBs should be fully involved in developing theprogramme along with specific statutory responsibilityfor operating and maintaining the treatment facilitiescreated.
• The City Development Plans should incorporateenvironmental management services as the numberone priority in JNNURM and Urban Infrastructure
Station/Location 1986 2006
DO BOD DO BOD(mg/l) (mg/l) (mg/l) (mg/l)
Rishikesh 8.10 1.70 8.30 1.00
Haridwar D/S 8.10 1.80 8.10 1.30
Garhmukteshwar 7.80 2.20 7.70 2.10
Kannauj U/S 7.20 5.50 7.35 1.11
Kannauj D/S na na 6.45 4.20
Kanpur U/S 7.20 7.20 6.20 6.80
Kanpur D/S 6.70 8.60 3.90 6.80
Allahabad U/S 6.40 11.40 7.10 4.90
Allahabad D/S 6.60 15.50 8.50 3.20
Varanasi U/S 5.60 10.10 8.70 2.10
Varanasi D/S 5.90 10.60 8.65 2.25
Patna U/S 8.40 2.00 7.40 2.05
Patna D/S 8.10 2.20 8.10 2.30
Rajmahal 7.80 1.80 7.20 1.95
Palta 6.96 2.58
Uluberia 6.46 2.64
Source: CPCB.
TABLE 9.1.3Water Quality Data for River Ganga
(Summer Average, March–June)
Station/Location 1986 2006
DO BOD DO BOD(mg/l) (mg/l) (mg/l) (mg/l)
Tajewala 11.70 1.20 11.20 1.50
Kalanaur 10.40 1.05 7.30 2.50
Sonepat 9.75 3.00 8.40 2.50
Palla 13.95 6.00 8.00 4.80
Nizamuddin Bridge 0.30 25.00 0.00 31.30
Agra Canal 0.35 26.50 0.00 28.30
Majhawali 0.50 22.00 3.05 26.00
Mathura 8.10 4.00 5.40 15.30
Mathura D/S 8.50 2.50 5.77 15.00
Agra U/S 10.65 4.50 8.40 15.00
Agra D/S 1.65 9.00 8.17 14.80
Batteshwar 13.90 11.00 9.68 14.00
Etawah 11.16 7.00 16.90 15.50
Udi 9.71 2.00 13.30 3.00
Auraiya Juhika 8.14 5.00 8.40 1.80
Source: CPCB.
TABLE 9.1.4Water Quality Data for River Yamuna
(Summer Average, March–June)

Environment and Climate Change 199
Development Scheme for Small and Medium Towns(UIDSSMT). Mechanisms are needed to ensure thatthe urban areas covered under these programmesprovide for full treatment of the sewage generated.
• For the plan period, the River ConservationProgramme should aim at completing the projectsin hand and new projects should be considered onlyin towns which are not covered under JNNURMand UIDSSMT.
• The NRCP should encourage installations on commandarea basis to facilitate investment in the treatment ofmaximum quantity of sewage and reuse in the vicinity.In other words, decentralized systems of wastewatertreatment need to be encouraged as against centralized,large, end-of-pipe treatment units.
• The wastewater management strategy needs toemphasize the use of state-of-the-art GeographicalInformation System (GIS)-based decision supportsystems.
• Water efficiency in flushes and gadgets should beplanned in order to reduce wastewater generation.Recycling/reuse of treated sewage in cities should bepromoted. Resident groups should be sensitized towardswater conservation, recycling, and reuse.
National Lake Conservation Plan (NLCP)9.1.43. The NLCP was approved as a 100% Centrallyfunded scheme during the Ninth Plan with the objectiveof restoring the polluted and degraded lakes of thecountry. To begin with, NLCP proposed to cover urbanlakes of tourist importance. The scope of work has beenexpanded during the Tenth Plan to include rural waterbodies also. Under the programme, conservation of 46lakes in 13 States has been taken up through 31 projects.So far, projects for 10 lakes have been completed and 10more are likely to be completed. Improvement in thequality of water in the lakes in the completed projects ismore marked than in the river conservation projects. Thescheme now provides assistance to States on a 70:30sharing basis and till date the estimated approved cost isabout Rs 565 crore.
9.1.44. The activities covered under NLCP includeinterception and treatment of pollution loads enteringthe lake, lake cleaning interventions such as desilting, de-weeding, bioremediation, catchment area treatment, lakefront eco-development like bunding, fencing, shore linedevelopment, and creation of facilities for public recreationand entertainment.
Dal Lake Conservation Project (DLCP)9.1.45. The DLCP was approved by the government at acost of Rs 298.76 crore in September 2005. As an exception,this project is being implemented entirely by the CentralGovernment. The expected date of completion of theproject is March 2010. The works envisaged includeinterception and diversion of pollutants entering the lake,setting up of six STPs, desilting, de-weeding, removal ofencroachments in the project area, and so on. The GoIhas released Rs 70 crore for the project till 2006–07. Utilizingthis, three out of six STPs have been made operational. Theremaining three STPs are expected to be commissionedby December 2007. The progress of implementation is,however, slow due to delay in relocation of families whoneed to be shifted from the project area of the lake.
9.1.46. While the lakes conservation plan focuses onpollution abatement in lakes, the larger objective ofconservation of lakes is the maintenance of the aquaticecosystems. Keeping this in view, wetlands will beintegrated with NLCP and the programme’s objectiveswill cover conservation of life forms apart from mitigatingpollution and augmenting catchments.
Water Pollution9.1.47. Effluent standards, environmental laboratories,and government analysts have been notified under theEnvironment (Protection) Act. There is a need for muchstronger monitoring and enforcement for expandedcoverage by both the Central and State Pollution ControlBoards. Greater awareness and involvement of local(affected) communities and local governments incompliance and monitoring is critically important.While compliance will cover treatment and recycling ofused water, monitoring should include the extent andquality of the treated water, and water quality of the waterbodies providing or receiving the water in treated oruntreated form.
9.1.48. The Joint Parliamentary Committee on pesticideresidues in and safety standards for soft drinks, fruit juice,and other beverages has suggested notifying qualitystandards for drinking water. These quality standardsshould be made mandatory.
WASTE MANAGEMENT9.1.49. Municipal Solid Waste (Management andHandling) Rules, 2000 stipulated that these were to becomplied by December 2003. Under these rules, all local

200 Eleventh Five Year Plan
bodies were expected to undertake segregation of wasteand its collection, storage, transportation, processing, anddisposal. While the Ministry of Urban Developmentreported that Jodhpur in Rajasthan, Sirsa in Haryana, andNamakkal in Tamil Nadu have been making good effortstowards compliance, no other city/town in the countryhas taken the required steps. Some local bodies are reportedto have taken initiatives to set up waste processing anddisposal facilities. These local bodies are generating about1.2 lakh tonnes of municipal solid waste every day andtreatment is not a priority in their plans.
Urban Solid Waste Management9.1.50. Management of industrial and municipal wasteis a serious challenge because of its magnitude andthe resources required. The JNNURM covers programmesfor urban waste disposal. The scheme of Balanced Use ofFertilizer under the Ministry of Agriculture strengthensthe soil-testing programme in the country and encouragesefficient fertilizer use and composting of urbanbiodegradable waste. The Ministry of New and RenewableEnergy (MNRE, previously MNES) has formulated aNational Programme on Energy Recovery from urban andindustrial waste. These programmes need convergence andexploitation of synergies.
Strategy for the Eleventh Plan9.1.51. Collection, treatment and disposal of solid wasteare the responsibility of the ULBs. These bodies must bemade specifically accountable in this respect. The SupremeCourt directions for municipal solid waste collection andmanagement which require segregation, sanitary landfills,and other safe options of treatment should be part of aMaster Plan. The following measures also need to be taken.
• Processes for waste minimization and segregationshould be promoted and pursued. The existingregulations have to be revisited to see the changesneeded and the investments required.
• The role of CPCB and MoEF must be clarified. Theyshould be charged with enforcing the rules throughthe ULBs and not rest satisfied solely from being thekey standard setting and pollution monitoring agency.
• Assistance for projects for treatment and disposal ofhazardous and biomedical waste should be providedas incentive for compliance.
• Avoidance of waste going to the landfill should be thepriority for all ULBs.
• For smaller and medium towns and cities, regional/shared landfills/waste processing infrastructure should
be considered. For larger cities, the problem ofavailability of land should be addressed.
• Programmes like JNNURM and UIDSSMT need to linkassistance to the progress in solid waste management.During the Plan period, all Class I cities should havesanitary landfills in place.
9.1.52. The PCBs are responsible for enforcingManagement of Hazardous Waste and Biomedical Wastes(Management and Handling) Rules. It is assessed thatabout 4.4 million tonnes of hazardous waste are generatedannually by over 13000 units. At the instance of theSupreme Court, an inventory of dumpsites is being carriedout. MoEF provides assistance for installing Transport,Storage, and Disposal Facilities (TSDF) for managementof hazardous waste generating industrial clusters. So far,six such systems have been supported in PPP mode. Theaverage capacity of these units is 1–1.2 lakh tonnes perannum. Biomedical waste is generally disposed of byincinerators or conventional methods. At least 17 units,mostly incinerators, were set up by industry associations.Some health care facilities have installed their ownbiomedical waste treatment facilities and others areavailing the services of Common Bio-medical WasteTreatment Facilities (CBWTF). There were 157 CBWTFs,including eight under installation, in the country as onMarch 2007.
9.1.53. During Eleventh Plan period, an institutionalmechanism would be required to be put in place to ensurethat issues related to handling of industrial, hazardousand bio-medical wastes are also dealt under JNNURMand UIDSSMT. Funding through these two umbrellaschemes should be made conditional upon appropriatemeasures being taken in respect of these issues. In placesnot covered under JNNURM and UIDSSMT, an effectivemechanism should be put into place to ensure strictmonitoring and compliance by the concerned localauthorities. A framework for management of e-waste alsoneeds to be put into place.
BIODIVERSITY9.1.54. Habitat conversion or land use changes, landdegradation, and pollution result in the decline of ecologicalgoods and services needed for human welfare. TheBiological Diversity Act, 2002 and Rules, 2004 provide forconstitution of State Boards (SBBs) and ManagementCommittees (BMCs) for conservation, documentationand sustainable utilization of biodiversity and for buildingup capacities of these bodies. Chronicling in the form of

Environment and Climate Change 201
People’s Biodiversity Registers will be the only way wecan identify changes happening due to climate change.There is a need to develop appropriate methodology andmodels for conducting such an exercise. Documentationof traditional knowledge should also include adaptationof such knowledge in line with the present needsof conservation.
Biosphere Reserves9.1.55. This programme was started in 1986 withUNESCO (Management and Biosphere) support forintegrating social, cultural, and ecological values ofecologically rich landscapes. The primary focus wason monitoring and designing conservation strategies.With a Tenth Plan outlay of Rs 35 crore, the programmehas not been able to deliver an effective outcome forthe existing biosphere reserves. There is a need toreinforce the information and strategic back up forthe management of protected areas in the core ofbiosphere reserves.
9.1.56. Keeping in view the facts that village eco-development and participatory management of habitatsare part of protected areas management schemes, theprimary objectives of this programme will be research,documentation, and monitoring of the dynamics ofhuman ecosystem interface. The programme should focuson cross-sectoral linkages between biochemical resourcesand human livelihood.
Mountain Ecosystems9.1.57. The MoEF has established an autonomousinstitute, the G.B. Pant Institute of Himalayan Environmentand Development (GBPIHED), with the overall mandateof dealing with issues relating to the environment of theIndian Himalayan Region. The results of project studiesof the Institute also have implications on issues such asclimate change and land degradation. However, theoutput falls far too short of what is needed to be donefor the Himalayan ecosystems.
9.1.58. During the Eleventh Plan period, GBPIHEDshould reorient its activities to evolve as a resourcecentre for the Himalayan States and GoI for advice onsustainable development of the Indian HimalayanRegion. The focus of research should include socio-economic development of the mountain habitations.An Indian Alpine Initiative should also be started fortracking the dynamics of alpine biomes in the context ofclimate change.
Coastal Zone Management9.1.59. The earlier Coastal Regulation Zone notificationprescribed regulation of activities based on uniformprinciples of vulnerability of coastal areas against humanactivity. Coastal areas are currently classified in fourcategories (CZ 1 to 4) with different principles fordevelopment activities. Category 1 includes ecologicallysensitive areas, category 4 includes islands, and categories2 and 3 permit construction activities based onvulnerability. The Swaminathan Committee prescribedthat the local circumstances and vulnerabilities shouldbe the basis of coastal zone management and regulations.For this purpose, use of scientific, social, and localinformation should be made in environmental managementplans for coastal areas. Conservation of life forms (andtheir habitats such as nesting/spawning sites) andintegration of their environments with human well-being should be essential components of such plans.Participation of civil society and fishing/coastalcommunities in the State level coastal zone managementcommittees should be ensured for conservation andsustainable harvests.
Botanical Survey of India (BSI) andZoological Survey of India (ZSI)9.1.60. The Botanical and Zoological Survey of India aretoday facing major challenges in view of the new regimeon genetic resources, provisions of the BiochemicalDiversity Act, and fast evolving knowledge and informationenvironment. Use of recent trends in organizing informationand modern skills in exploration and documentation willbe given priority. These institutions will develop intoprime repositories of information on plants and animals,and as referral institutes. Collaboration and linkages withother institutions as part of a network will be encouraged.
ENVIRONMENTAL AWARENESS AND EDUCATION9.1.61. The Environment Education in School Systemproject initiated in 1999 strengthens environmenteducation in the formal school curriculum throughinfusion of appropriate education material. Introductionof environmental concepts in Business/ManagementEducation is another focus area. A committee comprisingrepresentatives from management institutions, AICTE,UGC, industry, and MoEF is working on this.
9.1.62. During the Eleventh Plan, the programme ofEnvironmental Education, Training, and Extension maybe continued with further linkages with the publicity andawareness mechanisms of State forest departments.

202 Eleventh Five Year Plan
This may include a manual on public participation inall activities of MoEF. Public transport like railways,buses, and even airways can be extensively used forenvironmental awareness through well designed awarenessmaterial. Information generated by student activities onlocal environmental issues may be integrated with thedatabase under the National Environmental MonitoringProgramme (NEMP). Capacity building, such as trainingof trainers, should also be focused on.
9.1.63. The National Museum of Natural History(NMNH), New Delhi, and three regional museums atMysore, Bhubaneshwar, and Bhopal will be made moreeffective in natural history education and awareness withthe introduction of the state-of-the-art education andinterpretation methods. The MoEF has contemplatedsetting up of a new regional museum at Sawai Madhopurwith focus on the life forms of the region, the details ofwhich are being worked out.
National Environmental MonitoringProgramme (NEMP)9.1.64. The Steering Committee on Environment andForests for the Eleventh Plan has suggested a unified NEMPfor ecology, environmental chemistry, public health, andsocio-environmental studies. This programme wouldtrack the status and change in the socially relevantbiophysical parameters and their social impacts, whereverpossible. NEMP may have sub-programmes on forest coverand ecosystem services, apart from air and water pollution.The programme may have linkages with educational,scientific, and social organizations working in therelevant fields. Accordingly, the existing programme forEnvironment Information System (ENVIS) will bereshaped to provide information in interactive formats foreffective use. Real time sharing of data on environmentalparameters collected under NEMP will be implemented. Aspecial portal could also be organized for environmentaldata from school and college student projects.
ENVIRONMENTAL RESEARCH AND DEVELOPMENT9.1.65. The MoEF supports nine Centres of Excellencein research which need to be strengthened.
9.1.66. During the Eleventh Plan period, environmentalpolicies and programmes will need strong researchbackup. The identified research priorities will be metby a combination of open, competitive research grantprogrammes, and dedicated support to special organizationsand centres of excellence.
• An ‘Environmental Research Grants’ programmeshould focus on the relevant areas such as cleantechnologies, preventive strategies, hazardoussubstances management, and so on. There should bespecial programmes on Ecosystem Health, Pollutionand Health, Ecological Footprint, NTFP regenerationecology, Invasive species, Fire Ecology, and Forest-Watershed Services.
• Documentation of traditional and communityknowledge should be a special area of research.
• Special mechanisms may be set up for co-ordinationand management of research amongst agencies likeIndian Council of Forestry Research and Education(ICFRE), ICAR, CSIR, DBT, DST, and UGC, as wellas multilateral and bilateral donors and privatefoundations.
• The All India Coordinated Project on Taxonomy(AICOPTAX) needs strengthening in order to bringmore taxa of lower organisms and issues like moleculartaxonomy.
Taxonomy Capacity Building9.1.67. The implementation of the Biological DiversityAct, 2002 and Rules, 2004 and National EnvironmentalPolicy, 2006 calls for an adequate number of trainedtaxonomists. Existing programmes on botanical gardensand taxonomic capacity building assume immensesignificance in this respect. MoEF provided assistance to72 botanical gardens during the Tenth Plan and underan AICOPTAX, 11 coordinating centres and two centresfor training have been supported at various institutions.
9.1.68. AICOPTAX should be augmented for capacitybuilding (including human resources) in Taxonomy. TheZSI and BSI will be the key institutions to organizetaxonomic capacity building programmes and train youngIndian taxonomists for forest, wildlife and management.
CONSERVATION OF NATURAL RESOURCESAND ECOSYSTEMS9.1.69. Inland aquatic systems (excluding paddy fields)cover 5.3% of the country’s land area but harbour 15%and 20% of India’s floral and faunal diversities, respectively.There are wide gaps in knowledge relating to hydrologicalparameters, ecosystem processes, and aquatic life formsin these systems. Information on the physico-chemicalaspects of water quality in rivers and lakes has becomeavailable largely because of the support from the NationalRiver Conservation Directorate (NRCD) and the CPCB,but that on aspects such as area, depth, hydrology, and

Environment and Climate Change 203
ecosystem processes (functions) is practically non-existent.The existing programmes on conservation accordinglyneed a revamp.
9.1.70. The Scheme on Conservation and Managementof Mangroves, Coral Reefs, and Wetlands has been too smallto make an impact on the conservation of these ecosystems.Mangroves and coral reefs are mainly found on governmentlands. Development of appropriate institutions to motivatepeople to cooperate in the conservation efforts of thesesystems will be a priority area. More protected areas areneeded for the conservation of coral reefs. Restoration andplantation programmes for mangroves are necessary tomake these eco-systems function as effective barriersagainst invasion of land by sea. The existing programmeson wetlands, mangroves, and coral reefs will be extendedto mountains, grasslands, and alpine ecosystems.
9.1.71. Initiatives on conservation need to be moreeffectively integrated with development and povertyreduction. The principles of Community Reserves underthe Wild Life (Protection) Act may be useful in suchefforts. Long-term plans for conservation of such habitatswill be important. Wetlands will be part of NLCP andthe objectives will cover conservation of life forms apartfrom mitigating pollution and augmenting catchments.
• An information system will be set up for islands, coralreefs, mangroves, and wetlands by developing aconsolidated and easily accessible database of allrecorded species.
• Support activities will include participatory researchfor inventory and valuation of freshwater ecosystems,measures to tackle serious threats to them and ensureconservation, as also the livelihood security ofdependent communities.
• With regard to linkage between biodiversity and climatechange, it should be recognized that biodiversity is animportant tool to find solutions for tackling the impactof climate change on rural populations that dependon biomass for their livelihood.
• There is a need to recognize the potential of biodiversityto provide solutions for adaptation in the form oftraditional crop varieties and donors for creatingGMOs.
• National agro biodiversity hotspot mapping andidentification of important agro biodiversity landscapeswill be undertaken for conservation with theparticipation of farmers and pastoralist groups.Regions with high concentration of genetic diversity
on major and important crops may be declared as ‘genesanctuaries’ for conservation and enrichment ofdiversity, involving communities through diversitybased income generation and incentives.
• The regulatory mechanism for trials and adoptionof GMOs will be required to be based on scientific,socio-economic, and EIA in the long as well as shortterm. The process of a regulatory regime, therefore,should be consultative and transparent, based on theprescribed scientific, logical, and progressive norms,taking into account factors of human health andenvironmental health.
• Awareness generation will be important for ensuringeffective outreach of the prescribed process forpromotion of appropriately and adequately testedGMOs, mechanisms for enforcement of procedures,and processes for safeguarding ecological and healthsafety will be established.
OTHER PROGRAMMES9.1.72. Several ongoing programmes of NoEF on specificsubjects will continue to be pursued during the EleventhPlan period. This includes the Environment Planning andCoordination project for Madhya Pradesh and Nagaland,Environmental authorities and tribunals, the Taj ProtectionMission, National Natural Resource Management systems,IT, Adaptation and Capacity Building on Climate Change,and so on. Such programmes, with specific mandatederived from the Supreme Court or externally aidedprojects, will continue till their logical conclusion.
9.2 CLIMATE CHANGE9.2.1. Global Climate Change due to rising levels of GHGsin the atmosphere is one of the most serious environmentalconcerns of our time. The Intergovernmental Panel onClimate Change (IPCC), established in 1988 by the WorldMeteorological Organization and the United NationsEnvironment Programme, has worked extensively onevaluating past trends and the future prospects of climatechange. The synthesis report of the Fourth AssessmentReport (AR4) of the Panel was released in November 2007.
9.2.2. The IPCC reports present a grim picture. It isestimated that the Earth’s surface temperature has risenby 0.6±0.2˚C over the twentieth century. In the last 50years, the rise has been 0.13 + 0.07˚C per decade and therecent years have been the warmest since 1860, the yearfrom which regular instrumental records are available.The Panel has concluded that the fact of global warmingis unequivocal and there is enough evidence to indicate

204 Eleventh Five Year Plan
that this is due to anthropogenic reasons. Although someof these conclusions have been disputed, the assessmentof the IPCC represents a broad and growing consensusin the scientific community worldwide. The current levelof atmospheric CO2 is estimated as 379 parts per million(ppm) compared with the pre-industrial level of only 280ppm. The annual growth rate of CO2 concentration hasbeen greater in the last 10 years (1.9 ppm/yr) comparedto the last 40 years (1.4 ppm/yr). Halocarbons (chloro-flouro-carbons etc.) in the atmosphere, however, areobserved to be decreasing due to their phase out underthe Montreal Protocol.
9.2.3. Since warming depends upon the total stock ofGHG in the atmosphere, continued emissions beyondthe earth’s absorptive capacity necessarily imply a rise intemperature. If emissions continue to increase as atpresent, a warming of about 0.2˚C per decade is projectedby IPCC. If emissions are stabilized at the 2000 level, thewarming could be about 0.1˚C per decade. The SpecialReport on Emission Scenarios projects that surface airtemperatures could rise by between 1.1 and 6.4˚C overthe twenty-first century. In most cases, the temperaturerise may be 2–4˚C. The sea level rise is projected to be 18to 59 cm.
IMPACT AND IMPLICATIONS OF CLIMATE CHANGE9.2.4. Climate changes noted in the IPCC Assessmentreports include recession of glaciers, thawing ofpermafrost, lengthening of mid- to high-latitude growingseasons, pole-ward and altitudinal shifts of plant andanimal ranges, decline in some plant and animalpopulations, early flowering of trees, and changes ininsect populations and egg-laying in birds. Associationsbetween changes in regional temperatures and theobserved changes in physical and biological systems havebeen documented in many aquatic, terrestrial, andmarine environments.
• The water cycle is totally dependent on the temperatureregime. Increasing global temperature and resultantfaster retreat of most glaciers is expected to affect thesnow fed perennial water regimes. Accordingly, thevegetation status of catchments, magnitude andfrequency of floods, precipitation, runoff andgroundwater recharge may all be affected. Thesechanges may substantially affect hydropowergeneration, and may also require an increase inirrigation due to higher crop evaporative demand.
• Through the twentieth century, the average rate of
global sea level rise has been 1.7 + 0.5 mm/yr. Themaximum rise since 1992 has been observed in theWestern Pacific and the Eastern Indian Ocean. Thistrend could result in loss of land due to inundation,erosion, floods, and salt-water intrusion, adverselyaffecting coastal agriculture, tourism, fisheries andaquaculture, human settlements, and health.
• Changing environmental attributes are sure to affectthe species spectrum and the profile and compositionof forests is also likely to change. The degree to whichterrestrial ecosystems will continue to be net sinksfor carbon is uncertain. In arid or semi-arid areas,productivity is expected to decrease. Trends of dryingup of wetlands and degradation of ecosystems havebeen observed.
• Estimated crop yield responses to climate change varywidely, depending upon species, cultivation practicesand soil properties; pests, and pathogens; the directeffects of carbon dioxide (CO
2) on plants; and
interactions between CO2, air temperature, water
stress, mineral nutrition, air quality, and adaptiveresponses. Even though increased CO
2 concentration
can stimulate crop growth and yield, this benefit maynot always overcome the adverse effects of excessiveheat and drought. The AR4 projects a decline in globalrice production by 3.8% by the end of the twentyfirst century.
• Changes in the severity and frequency of extreme heatand cold, and of floods and droughts, coupled withlocal air pollution and aero allergens may result inchanges in infectious disease occurrence, in local foodproduction and also cause under nutrition, leading toimpaired child development. There will also be healthconsequences of population displacement and economicdisruption. For India, the risks of malaria and heatstress related mortality have been projected by IPCC.Increase in flooding and droughts are associated withincreased risk of drowning, diarrhoeal and respiratorydiseases, and hunger and malnutrition. Adaptiveoptions like health-oriented management of theenvironment (including air and water quality, foodsafety, urban and housing design, and surface watermanagement), and appropriate medical interventionsare normally related to income levels. Therefore, thepoor are more vulnerable. Human settlements arealso expected to be affected by changes in resourceproductivity or market demand for goods and servicescausing structural and functional adaptations leadingto migration, which in turn would result in changesin living conditions.

Environment and Climate Change 205
9.2.5. Global warming will affect us seriously. For SouthAsia, warming has been projected to be above the globalmean and in South East Asia, equal to the global mean.The impact projections for India indicate a rise of 0.68˚Cin the twentieth century with an increasing trend in theannual mean temperature. Precipitation is likely toincrease and extreme rainfall and other climatic eventsmay occur more frequently. Extreme rains in the SouthWest monsoon and fewer rainy days along the East Coasthave been projected. An increase in temperatures of 0.5˚Cto 1.5˚C could produce a decline of between 2.5% inwheat and maize production in India.
9.2.6. Existing research based on formal modelingsuggests that a scenario of warming between 2–3˚C wouldlead to a permanent loss of up to 3% in the global output.In countries with predominantly agrarian economies,the projected increase in temperature and reduction inprecipitation could, in the absence of adaptive responsessuch as increased irrigation, related agricultural researchand related infrastructural interventions, dampeneconomic growth by reducing agricultural productivity.These impacts can be moderated by efforts at adaptationbut these are expected to be costly and will imposea burden on both producers and consumers. Climatechange would therefore result in lower incomes of thevulnerable populations and increase in the absolutenumber of people at risk of hunger unless these outcomescan be countered through the development of costeffective technologies.
RESPONSES TO CLIMATE CHANGE9.2.7. The serious consequences of climate change,including especially the consequences for India, leadnaturally to the question of what should be our response.Two types of responses need to be considered. The firstrelates to adaptation, i.e., measures that have to be takengiven the very high likelihood that climate change willoccur and will have adverse effects. The second relates tomitigation, i.e., steps to be taken that might reduce theextent of climate change.
9.2.8. Recognizing the importance of climate changeissues, the Prime Minister established a Council onClimate Change under his chairmanship in June 2007 toco-ordinate national action for assessment, adaptation, andmitigation of climate change. Earlier, the government hadset up an expert committee to study the impact of climatechange. One of the important decisions taken by thePrime Minister’s Council is that a National Action Plan
will be prepared compiling action taken by India foraddressing the challenge of climate change and the actionthat needs to be taken in the future.
Adaptation9.2.9. Since a substantial adverse change in climateappears unavoidable even with the optimal mitigationresponse, the process of adaptation to climate changemust have priority. The most important adaptationmeasure is development itself. A stronger economy ismore able to adapt both in terms of the cost of adaptationand technological capability. Achieving rapid economicgrowth as targeted in the Eleventh Plan is therefore a keyelement in adaptation. As mentioned earlier, the PrimeMinister’s Council on Climate Change has decided thata National Action Plan on Climate Change compilingaction taken by India for addressing the challenge ofclimate change and the action that it proposes to take,should be prepared as India’s National Report on ClimateChange. The Action Plan will deal with key vulnerabilitiesof India to Climate Change and, in particular, the impacton water resources, forests, coastal areas, agriculture, andhealth. An action plan for adaptation to climate changewould require (i) action in the area of agriculturalresearch to evolve varieties that can cope with likelyclimate changes, (ii) action to cope with likely increasesin water stress, (iii) action to be able to cope with a greaterfrequency in natural disasters. The institutional networkcreated at the time of preparation of India’s initialNational Communication to United Nations FrameworkConvention on Climate Change (UNFCCC) exists andis currently engaged in the preparation of informationon India’s second National Communication.
9.2.10. In the changing temperature and water regimes,improvement of productivity potential and water useefficiency of agricultural crops, specifically in regimes ofwater shortage and extreme variations of temperature,will be priority areas of research.
9.2.11. The adaptation response needs to be incorporatedin the relevant programmes, including those relating towatershed management, coastal zone planning andregulation, forestry management, agricultural technologiesand practices, and health.
9.2.12. Work on the potential impact, forecasting systemsand adaptations in response to Climate Change will bethe key concerns for future development. For projectionsand early warning systems, understanding of the

206 Eleventh Five Year Plan
processes which could show discernible changes wellbefore the actual impact starts is essential.
Mitigation9.2.13. Recognizing the need for international co-operationin devising an effective mitigation strategy, in 1992, theinternational community established the UNFCCC whichestablished the principle of ‘common but differentiatedresponsibility’ between the industrialized countries(Annex 1 countries) and the developing countries (non-Annex 1 countries), taking account of the respectivecapacities. The Annex 1 countries were required to bringdown their GHG emissions to 1990 levels by 2000. In 1997,the Kyoto Protocol under the UNFCCC was adopted,which set legally binding targets for GHG reductionby individual industrialized countries totaling 5.2%below their aggregate 1990 emissions during the ‘firstcommitment period’, 2008–12. Under the provisions ofthe Kyoto Protocol, non Annex I Parties (India is in thiscategory) are not obliged to reduce emissions of GHG.So far, 176 countries, including India (and the regionaleconomic organization EEC), have ratified the Protocol.The US and some other countries have not ratified theProtocol till now. Most of the industrialized countriesthus far have not achieved significant progress in reducingtheir GHG emissions in the manner required in the firstcommitment period.
9.2.14. An optimum approach to mitigation from aglobal perspective is only possible if all countriescooperate to facilitate collective action. This is becausemitigation actions are characterized by the classic problemof externality—the benefits of the action of any onecountry do not accrue only to the country itself but tothe entire global community, while the costs of mitigationare fully internalized. Without co-operative action, allcountries taken together will do less mitigation than iscollectively optimum. The challenge lies in determining abasis for collective action which is fair, provides equitableentitlement to the global environment space with burdensharing in a manner which recognizes the very differentlevels of development and also the very different degreesof historical responsibility for causing the problem in thefirst place. Such differenciation among the countries ofthe world has been accepted by the UNFCCC and theKyoto Protocol. This must be effectively operationalizedto create an environment of trust and co-operation.
9.2.15. The first commitment period of the Kyoto Protocolis 2008–2012 and as per the provisions of the Kyoto
Protocol and discussion at the 13th Conference ofParties at Bali in December 2007, Bali Action Plan wascommenced which intends to enable the full, effective,and sustained implementation of the Conventionthrough long-term co-operative action, now, upto andbeyond 2012. As part of the Bali Action Plan, a processhas also been initiated to determine the GHG reductioncommitments of industrialized countries (Annex 1countries) under the Kyoto Protocol, beyond 2012. Theprecise nature of the outcomes of this process would bedetermined in a two year negotiating time table endingin 2009.
9.2.16. There is no doubt that the accumulation of GHG,which is the cause of global warming, has occurredoverwhelmingly due to the emissions of industrialcountries and it is therefore entirely appropriate that theburden of mitigation must fall on them. It is for thisreason that the first commitment period in the KyotoProtocol entailed commitment for reduction only by theindustrialized countries.
9.2.17. With a share of just 4% of global emissions, anyamount of mitigation by India will not affect climatechange. A substantial commitment to reduce emissionsby the major industrialized countries will be required.Nevertheless, as contribution to the global emissionsreduction effort, the Eleventh Plan would focus on effortsto ensure that the emissions intensity of India’s GHGcontinues to decline. The correct approach in mitigationis to define the obligations of different parties on the basisof common but differentiated responsibility and differencesin respective capabilities. India’s view on burden sharingis based on this approach. Our National EnvironmentalPolicy of 2006 requires ‘equal per capita entitlements ofglobal environmental resources to all countries’. At themeeting of the G 8 +5 in Heiligendamm in July 2007,Prime Minister Manmohan Singh indicated that we aredetermined to see that India’s per capita emissions neverexceed the per capita emissions of the industrializedcountries. This formulation focuses on per capita emissionsrather than total emissions as the relevant variable, andalso provides industrial countries with an incentive toreduce their level of emissions as quickly as possible.
9.2.18. While optimal mitigation strategies will nodoubt evolve in time from the ongoing internationalnegotiations, India is already taking a number ofinitiatives in clean energy including renewable energy andaction to increase energy efficiency and conservation.

Environment and Climate Change 207
One of the objectives of the Eleventh Plan is to reducethe energy intensity per unit of GHG by 20% from theperiod 2007–08 to 2016–17. We will also initiate actionto increase our access to cleaner and renewable energyby fully exploiting existing resources (e.g., hydropowerand wind power) developing nuclear power, and alsosupporting research in newer areas such as biofuels fromagro-waste, solar energy, etc.
9.2.19. The CDM is a flexible arrangement under theKyoto Protocol which enables industrialized countries tomeet their emission reduction obligations by encouragingadoption of sustainable and environmentally friendlytechnologies in developing countries. India’s CDMpotential is a significant component of the global CDMmarket. Till 14 February 2008, out of a total of 871projects accorded Host Country Approval, 314 projectsin India have been registered by the CDM ExecutiveBoard, so far the highest in any country. However, interms of the corresponding Certified Emission Reduction(CERs), India is second to China.
ALLOCATIONS IN THE ELEVENTH PLAN9.2.20. The total projected GBS in the Eleventh Planfor the MoEF is Rs 8842 crore (at 2006–07 price) andRs 10000 crore (at current price).
9.3 DISASTER MANAGEMENT
OVERVIEW9.3.1. Many regions in India are highly vulnerable tonatural and other disasters on account of geologicalconditions. About 60% of the landmass is susceptible toearthquakes and over 8% is prone to floods. Of the nearly7500 kilometers long coastline, approximately 5700kilometers is prone to cyclones. 68% area is susceptible todrought. All this entails huge economic losses and causesdevelopmental setbacks. Disasters are no longer limitedto natural catastrophes. Man-made emergencies oftencause bigger disasters in terms of fatalities and economiclosses. With urbanization and concentration of populationin metropolitan cities, more and more people are becomingvulnerable to locational disasters. So, the developmentprocess needs to be sensitive towards disaster prevention,preparedness and mitigation. Disaster management hastherefore emerged as a high priority for the country. Goingbeyond the historical focus on relief and rehabilitation afterthe event, there is a need to look ahead and plan for disasterpreparedness and mitigation in order to ensure thatperiodic shocks to our development efforts are minimized.
9.3.2. Disaster risk reduction has not been highlightedin the policies and programmes of various plan schemes.The country’s commitment to mainstreaming disasterrisk reduction into the process of development planningat all levels so as to achieve sustainable development is yetto be carried forward across sectors through actionableprogrammes for achieving the desired result.
TENTH FIVE YEAR PLAN STRATEGY AND APPROACH9.3.3. The Tenth Five Year Plan (2002–07), preparedin the backdrop of the Orissa super cyclone, Gujaratearthquake, and end of the International Decade of NaturalDisaster Reduction, recognized disaster management as adevelopment issue for the first time. The Plan devoted aseparate chapter to disaster management and made anumber of important prescriptions to mainstream disasterrisk reduction into the process of development.
9.3.4. The Tenth Plan prescriptions on disaster managementcan broadly be divided into three categories:
(i) Policy guidelines at the macro level that would informand guide the preparation and implementation ofdevelopment plans across sectors;
(ii) Operational guidelines for integrating disastermanagement practices into development plans andprogrammes, and
(iii) Specific developmental schemes for prevention andmitigation of disasters.
9.3.5. At the macro level, the Plan emphasized that ‘whilehazards, both natural or otherwise, are inevitable, thedisasters that follow need not be so and the society canbe prepared to cope with them effectively whenever theyoccur’ and called for a ‘multi-pronged strategy for totalrisk management, comprising prevention, preparedness,response and recovery, on the one hand, and for initiatingdevelopment efforts aimed towards risk reduction andmitigation, on the other’. It stated that only then couldwe look forward to ‘sustainable development’.
9.3.6. At the operational level, the Plan made a numberof very important suggestions, as given below:
• Streamlining institutional arrangements for disasterresponse by an integrated approach involving civilianand military resources; setting up a modern, permanentnational command centre or operations room withredundant communications and data links to all Statecapitals; establishing a quick response team particularly

208 Eleventh Five Year Plan
for search and rescue operations; developing standardoperating system for dealing with humanitarian andrelief assistance from non-government sources; andformulating a unified legislation for dealing with alltypes of disasters.
• Building disaster prevention and preparedness indevelopment planning by introducing a rigorousprocess of vulnerability analysis and risk assessment,maintaining comprehensive database and resourceinventories at all levels, developing state-of-the-artinfrastructure for mitigation planning, and establishinga Disaster Knowledge Network for the use of disastermanagers, decision makers, community, and so on.
• Developing a nation-wide culture of prevention byintroducing disaster management in the schoolcurriculum, including relevant aspects of disastermanagement in professional courses, enhancing thecapacity of disaster managers by better trainingfacilities and creating a massive awareness at all levels.
• Encouraging community level initiatives for disasterpreparedness by involving people at the grass roots,particularly those who are more vulnerable, for betterpreparedness and response.
• Developing appropriate zonal regulations, designstandards, building codes, and performancespecifications for safe construction.
• Inclusion of disaster mitigation analysis in alldevelopment schemes in vulnerable areas throughwhich the feasibility of a project is assessed with respectto vulnerability of the area.
• Building disaster mitigation components into alldevelopment projects financed under the Plan.
9.3.7. The Tenth Plan felt that planned expenditure ondisaster mitigation and prevention measures was requiredin addition to a Calamity Relief Fund. The Plan, however,
stopped short of recommending any specific plan schemefor prevention, mitigation or preparedness for disastersnor did it allocate any amount for such scheme, exceptmaking a general recommendation that ‘Creation offaculties in disaster management in all 28 states is proposedto be taken up in the Tenth Plan in addition to communitymobilization, human resource development, establishmentof Control Rooms and forging international cooperationin disaster management. There is also an urgent needfor strengthening the disaster management pedagogyby creating disaster management faculties in universities,rural development institutes and other organizations ofpremier research.’
IMPLEMENTATION OF SCHEMES IN THE TENTH PLAN9.3.8. A Central Sector Plan Scheme, the National DisasterMitigation Programme (NDMP), has been implementedsince 1993–94. The scheme mainly provided for trainingand capacity building of government functionaries andother stakeholders to manage disasters in an effectivemanner. This scheme was transferred from the Ministryof Agriculture to the Ministry of Home Affairs in June2002. The allocation for this scheme was raised from Rs6.30 crore in the Eighth Plan to Rs 16.32 crore in the NinthPlan and to Rs 30.77 crore in Tenth Plan. The annualallocations under various components of the schemeduring the Tenth Five Year Plan are in Table 9.3.1.
9.3.9. Out of the eight components of the above scheme,only two components namely ‘Grants-in-Aid’ and‘Professional Services’ were developmental in nature,while the remaining components were on revenueexpenses. The major activities under the grants-in-aid include the setting up of the National Centre forDisaster Management at the Indian Institute of PublicAdministration, now upgraded as a statutory organization
(Rs in lakh)
S. No. Head 2002–03 2003–04 2004–05 2005–06 2006–07 Total
1. Grants-in-aid 262.00 349.00 474.00 505.00 600.00 2190.002. Professional Services 20.00 29.00 54.00 110.00 150.00 363.003. Machinery & Equipments 2.00 20.00 30.00 15.00 10.00 77.004. Foreign Travel 80.00 30.00 25.00 40.00 50.00 225.005. Contribution 20.00 20.00 20.00 17.00 20.00 97.006. Office Expenses 2.50 3.00 2.00 2.00 2.00 11.507. Advertisement & Publicity 20.00 10.00 25.00 1.00 1.00 57.008. Other Charges 0.50 26.00 10.00 10.00 10.00 56.50
Total 407.00 487.00 640.00 700.00 843.00 3077.00
Source: Disaster Management Division (MHA).
TABLE 9.3.1National Disaster Mitigation Programme—Year-wise Allocation of Funds in the Tenth Five Year Plan
Environment and Climate Change 209
known as National Institute of Disaster Management(NIDM), creation of 29 disaster management faculties/Centres in 28 States, research and consultancy services,and documentation of major disaster events. The facultiesdid not have sufficient back-up from the States with theresult that only limited activities are undertaken by theCentres. Even meagre allocations provided by the CentralGovernment as grants-in-aid were not fully utilized inmany of the States. The allocation of Rs 21.90 crore tothe training institutes during the Tenth Five Year Plan wasmainly used on NIDM which incurred an expenditure ofRs 11.56 crore. Nearly 71000 persons have been impartedtraining under the programme (Table 9.3.1).
9.3.10. The National Cyclone Risk Mitigation Project isanother Plan Scheme proposed to be implemented withWorld Bank assistance. The project is presently at thestage of preparation of Detailed Project Report. It coversall 13 cyclone prone coastal States and UTs. Investmentsare to be made in upgradation of cyclone forecasting,tracking and warning systems, construction work ofcyclone shelters, road linkages, plantation, retro-fittingsof vital lifeline installations, strengthening of national andregional training institutions, setting up a techno-legalregime for cyclone mitigation and for strong managementand monitoring system. As regards upgradation of cycloneforecasting, tracking and warning systems, this activityis proposed to be taken up either as part of the project orindependently by the IMD.
9.3.11. The Ministry of Home Affairs is alsoimplementing Phase II of a Community based DisasterRisk Mitigation (DRM) Programme in 169 multi hazarddistricts in 17 States/UTs with the support of UNDPunder a multi-donor programme at a total estimated costof Rs 153 crore (US$ 34 million). Under this programme,disaster management plans are being prepared fromvillage to district; village volunteers are being trained infirst-aid, search and rescue, evacuation and relief andshelter management; disaster management teams arebeing constituted at the district and sub-district levelsand mock drills are being conducted at all levels. This100% externally funded programme is, however, outsidethe framework of the Plan and is being implemented onthe non-Plan side. It is the largest community based DRMprogramme in the world. Phase I of the programme wasimplemented in the three States of Gujarat, Orissa, andBihar during 2002–06 and has been rated well in a recentevaluation conducted by a team of consultants. Whilethe general feedback on Phase II of the programme is
good, there is a definite need to increase the scope to coverother deficient areas too, in order to draw the full benefitfrom this.
INSTITUTIONAL AND OTHER INITIATIVES IN THETENTH PLAN9.3.12. The following significant initiatives on disastermanagement were taken during the Tenth Five YearPlan period:
• The Disaster Management Act, 2005 has been enactedfor establishing requisite institutional mechanisms fordrawing up and monitoring the implementation ofdisaster management plans, ensuring measures byvarious wings of the government for prevention andmitigating the effects of disasters, and for undertakinga holistic, co-ordinated, and prompt response to anydisaster situation.
• The National Disaster Management Authority (NDMA),under the Chairmanship of the Prime Minister, hasbeen set up in terms of the Act. NDMA is an apexbody responsible for laying down of policies, plansand guidelines on disaster management so as toensure timely and effective response to disasters. TheAuthority has prepared a Draft National Policy onDisaster Management and has taken up preparationof guidelines on prevention, mitigation, response, andrecovery in regard to various types of disasters such asearthquake, flood, landslides, industrial disaster, andso on. The guidelines on management of earthquake,chemical disasters, and chemical (industrial) disastershave been finalized and circulated.
• The State Governments are in the process of settingup State and district Disaster Management Authorities.The provisions of the Act relevant to the States/UTshave been brought into force w.e.f. 1 August 2007.While Arunachal Pradesh, Goa, Gujarat, HimachalPradesh, Kerala, Mizoram, Puducherry, Punjab, andUttar Pradesh are reported to have constituted SDMAsas per the Act, the other States/UTs are in the processof constituting the same.
• An eight battalion-strong National Disaster ResponseForce has been set up comprising of 144 specializedresponse teams on various types of disasters of which72 teams are for nuclear, biological, and chemical(NBC) disasters.
• The Civil Defence set-up in the country is proposedto be revamped to strengthen local efforts for disasterpreparedness and effective response. Similarly, the FireServices are also proposed to be strengthened/

210 Eleventh Five Year Plan
modernized to convert them into a multi-hazardresponse force.
• The National Institute of Disaster Management hasbeen set up for training, capacity building, research,and documentation on various natural and manmadedisasters. A comprehensive Human Resource Plan forDisaster Management has also been developed.
• Disaster Management has been included in thecurriculum of middle and secondary school education.The subject has also been included in the post-inductionand in-service training of civil and police officers.Modules have also been identified to include disastermanagement aspects in the course curriculum forengineering, architecture, and medical degrees.
• A committee of experts has finalized the Model buildingby-laws for town and country planning legislations, landuse zonation, and development control legislations. Themunicipalities and city development authorities allover the country have been advised to make necessarychanges in their respective by-laws and regulations inaccordance with the model laws.
• The Bureau of Indian Standards has issued buildingcodes for construction of different types of buildingsin different seismic zones in the country. The NationalBuilding Code has also been revised, taking intoconsideration the natural hazards and risks of variousregions of the country.
• The National Programme for Capacity Building ofEngineers in Earthquake Risk Management to train10000 engineers and 10000 architects on safeconstruction techniques and architectural practices isunder implementation.
• A Web-enabled centralized inventory of resourceshas been developed to minimize response time inemergencies. Over 110000 records from 600 districtshave been uploaded.
• Safe construction practices and dos and don’ts forvarious hazards are being disseminated for creatingpublic awareness.
ELEVENTH PLAN
Vision and Strategy9.3.13. The Tenth Plan has set into motion the process ofshift in focus from response-centric disaster managementcovering rescue, relief, rehabilitation, and reconstructionto laying greater emphasis on the other elements ofdisaster management cycle—prevention, mitigation,and preparedness—as a means to avert or soften the
impact of future emergencies. The Eleventh Plan aims atconsolidating the process by giving impetus to projectsand programmes that develop and nurture the cultureof safety and the integration of disaster prevention andmitigation into the development process. The guidanceand direction to achieve this paradigm shift will needto flow from NDMA, and in the true spirit of theDisaster Management Act, to all stakeholders includingState Governments and UTs, right up to the PRIs.Communities at large will need to be mobilized toachieve this common objective as they are the firstresponders. Even the best of isolated efforts will not bearfruit unless they are part of an overall, well- consideredapproach, and responsibilities of all stakeholders areclearly spelt out and accountability and sustainabilityfactored in.
9.3.14. Projects and programmes undertaken may besuch that they address the felt national needs and withwell acknowledged prioritization. With scarce resources,it will be imperative to put in place suitable mechanismswhich will facilitate systematic project and programmeappraisal. Support will have to be lent to programmesand projects that will lead to sustainable development,with assurance of disaster risk reduction built in. Thequestion of vulnerability will also have to be considered,not only in the physical sense but in a comprehensivesense; vulnerability could also be social, ecological,organizational, educational, attitudinal, political, cultural,and economical.
9.3.15. For an objective screening and scrutiny ofdevelopment projects in a speedy manner, it is essential thatprofessionalism in project formulation is insisted upon.Well-considered and well-drafted, need-based projectproposals with in-built disaster prevention and mitigationfeatures, as brought out above, should usually sail throughthe decision making process. These projects would needto be based on sufficient studies, reliable assumptions,and have regard for the latest advances in science andtechnology.
9.3.16. To ensure thoroughness in project formulation,all the expected requirements need to be clearly articulatedand the project appraisal procedure kept simple andstraightforward. One set of standard guidelines may notbe adequate in addressing all the complex set of issues andthere is clearly a need to evolve a multi-pronged approachto address a host of interlinked issues.
Environment and Climate Change 211
9.3.17. For the assessment of impact of any majordevelopment scheme in a given zone of hazard, it isimperative that the proposal takes in its stride what all couldgo wrong (damage scenarios) and shows how the projectdesign is fashioned to counter that likely damage scenario.Conceptualization of damage scenarios will require qualityscientific studies in a multi-disciplinary environment, andgeneration of new data, besides filling data gaps.
9.3.18. The SoI needs to be entrusted with theresponsibility of generating large-scale maps which willform the basis for disaster management studies. They willalso need to generate a Digital Elevation Map (DEM) ofhigh resolution (1/2m interval along vertical) for thepurpose of 3D terrain modelling. There will be a need tocarry out prioritization of the areas on which the SoIwill carry out the 1:10000 mapping for the whole countryand map all towns and cities on 1:2000 scales. Coastalzones and flood prone areas of the country will need toget priority in the preparation of DEM. NDMA, inconsultation with National Informatics Centre (NIC),National Spatial Data Infrastructure, National RemoteSensing Agency, and DoS is actively promoting theuse of GIS in all institutions concerned with disastermanagement. Priority will have to be given to highlyvulnerable areas for generating the database for mappingas well as hazard vulnerability and risk assessment relatedto disasters like cyclone, flood earthquake, chemical andindustrial, etc.
9.3.19. Data-sharing among the various data generatorsis an even more important aspect and needs to beaddressed. All such schemes getting Plan funds will betreated as national asset and data would be made availablewithout any pre-condition for use for disaster managementauthorities and others.
9.3.20. The national emergency communication network,involving the contemporary space and terrestrial-basedtechnologies, in a highly synergistic configuration andwith considerable redundancy, needs to be developed anddeployed countrywide. With almost a 100% reliability, thisnetwork must ensure real-time dissemination of warningsand information direct to the affected community andlocal authorities.
9.3.21. Research on all aspects of disaster mitigation whichhas the potential to save lives and property needs to beencouraged. NDMA could provide the necessary policy
direction to Science related ministries and departmentsboth at the Central and State levels to foster, promote, andsustain research and development work through need-based disaster mitigation and management projects.
9.3.22. A well sensitized and prepared community formsone of the most important links in the process of bettermanagement of disasters. For that reason, ‘ExtendedDisaster Risk Mitigation Project’ has been identified forbeing taken up for preparation of a Project Report duringthe Plan. This will be supplemented by activities undervarious other national/State level mitigation projects.As far as Community Based Disaster Managementis concerned, a degree of convergence is required to bebrought into community mobilization, participation,awareness, and capacity building aspects of all concernedsocial sector schemes like women and child development,rural development, drinking water, sanitation, and so on.The concerned ministries may consider inclusion ofdisaster management content into their plans and makeprovision of funds in their respective schemes.
9.3.23. It is essential that while clearing plans for StateGovernments, there is an integrated approach, particularlyfor creation of adequate capacity for relief and rescueoperations.
9.3.24. There is need for evolution of a broad classificationof anticipated projects that would come up for clearanceby the Planning Commission. One possible classificationcould be:
• Projects specifically designed in response to theNDMA Strategy, Guidelines and Action Plan, and
• Development projects with built-in environmentalpreservation and disaster mitigation features in tunewith the philosophy of mainstreaming mitigationmeasures into development projects.
9.3.25. Assistance is needed for State level mitigationprojects, especially drafting of State, district, and panchayatlevel disaster management plans and in continuoussustenance, modernization, and upgradation of disastermanagement capacity.
9.3.26. In view of the focus on disaster mitigation ofprojects, institution building, aimed at training a new breedof disaster managers, and establishment of centres/ institutesfully equipped to carry out specialized investigations and

212 Eleventh Five Year Plan
post-disaster studies, would need to be encouraged. Thetraining and skills of the 72 teams for NBC disasters inthe eight battalions of the National Disaster ResponseForce have to be improved and sharpened.
9.3.27. Out of the eight battalions of the National DisasterResponse Force already sanctioned by the government,two Battalions already have the basic infrastructure. Whilethe existing infrastructure has to be upgraded for thesetwo Battalions, completely new infrastructure has to becreated for the remaining six Battalions.
Mainstreaming Disaster Management intoDevelopment Planning9.3.28. Mainstreaming disaster management into thedevelopment planning process essentially means lookingcritically at each activity that is being planned, not onlyfrom the perspective of reducing the disaster vulnerabilityof that activity, but also from the perspective of minimizingthat activity’s potential contribution to the hazard. Everydevelopment plan of a ministry/department shouldincorporate elements of impact assessment, risk reduction,and the ‘do no harm’ approach. Examples of this approachare urban planning and zoning, upgradation of buildingcodes and their effective enforcement, adoption of disasterresilient housing designs and construction of school andhospitals, flood proofing, response preparedness planning,insurance, establishment of early warning systems forvarious types of disasters, generating communityawareness, creating technical competence and promotingresearch among engineers, architects, health experts,and scientists.
9.3.29. State governments need to give priority in theirplans for schemes regarding hazard identification andrisk assessment once they have prepared the project paper,completed preliminary work, and drawn up the detailsof the scheme. Hazard identification and risk assessmentacross the country must be bound by uniformly followedprocedures, fine-tuned to local conditions. In the absenceof such procedures, any sporadic activity based on somead hoc procedure carries the potential of doing moreharm than good. It will be essential that while clearingplans of State Governments, there is an integrated approachparticularly for creation of adequate capacity for reliefand rescue operations, for example, for funding projects forconstruction of school buildings. Some school buildingsneed to be identified which will be used as relief centresand buildings designed so that they withstand the impactof disasters and also have adequate capacity to provide
space as relief centres. Such schools should be equippedwith essential services which become important at the timeof a disaster.
9.3.30. State governments will need to make compre-hensive Management Action Plans for achieving long-term results in a phased manner. To make these plansmore meaningful, workshops and training programmesare to be organized at local/regional/national levels forcapacity building and awareness generation/communityparticipation.
9.3.31. Outside the framework of Plan schemes, manyinnovative measures can be adopted to encourage disasterrisk reduction measures by the corporate sector, non-government organizations, and individuals. Fiscalmeasures like rebates on income and property tax forretrofitting unsafe buildings, compulsory risk insurancefor bank loan on all types of properties, and so on, shalldefinitely help to mobilize resources for safe constructionand retrofitting of existing constructions in all disasterprone areas. Similarly, many innovative measures maybe taken for promoting public–private–communitypartnership for disaster risk reduction.
Principles for Project Appraisal from theDisaster Management Perspective9.3.32. To assist the Planning Commission in appraisal ofprojects, broad and generic guidelines which are not disasteror theme specific have to be adopted. Conceptualizationof hazard scenarios and associated vulnerability and riskassessments in a given situation will necessarily have todepend on available maps, Master Plans and building andland use regulations, National Building Code of India,and the various safety Standards and Codes of the Bureauof Indian Standards. The guidelines will have to coverthe following aspects:
• The location of the project is to be carefully considered,especially if this is in a multi-hazard prone area/districtrecognized by the NDMA. Multi-hazard pronedistricts are reported in the latest National BuildingCode of India of the Bureau of Indian Standards. Thelisting has been revised by the Building MaterialsTechnology Promotion Council of India, currentlyunder the consideration of NDMA.
• The project/scheme should be based on a detailedhazard and risk assessment; wherever required,environmental clearance will also be taken. The riskassessment will usually involve the following factors:

Environment and Climate Change 213
– Assessment of degree of hazard, based on highresolution single/multiple hazard maps interpretedin the light of all available historic records,publications, site-specific information, and studies.For all major projects/schemes, where such mapsare presently unavailable, the project/scheme shouldbe supported by adequate site-specific seismo-tectonic, geological, geo-physical, and geotechnicalstudies and analyses. Data gaps, assumptionsmade, and their implications should be brought out.Where high resolution multi-hazard maps are notavailable, multi-hazard assessment is to be madeby coalescing the information on single hazards.
– All such site specific risk assessment studies shouldbe referenced to a national high resolution geospatialdatabase so as to facilitate temporal analysis of futureassessment impact studies in the area and also enableintegration of all other assessment studies carriedout in the vicinity. Through such a process it will bepossible to evolve a national database of assessmentstudies which, in turn, will facilitate refinement ofNational Hazard and Vulnerability Mapping.
– Assessment of vulnerability against a hazard of agiven magnitude should be carried out. Thevulnerability of an individual or a group of indi-viduals or of any element or an infrastructure likea flyover or a bridge, for a hazard of a givenmagnitude, will vary from 0 to 1 depending on thedegree of mitigation built into the design. Forexample, an earthquake of magnitude 7 on theRichter scale may render very unsafe schoolchildren in a poorly built school (vulnerability = 1)whereas the residents of an earthquake-resistantneighbouring house for the same magnitude ofearthquake, may be safe (vulnerability = 0). Thisdistinction is essential because existence of hazarddoes not automatically mean vulnerability, andvulnerability does not necessarily have to be 1. Thequestion of vulnerability has to be considered notonly in a physical sense but in a comprehensivesense. Vulnerability could be physical, social, eco-logical, organizational, educational, attitudinal,political, cultural, or economical. Vulnerabilityassessment may also take note of medical care andcasualty management that would be possible in thevicinity in case of natural or man-made disaster.
– Assessment of risk against a given hazard will be afunction of hazard and vulnerability.
– Identification of elements at risk like population,properties, economic activities, public services, is
to be brought out. By overlaying the infrastructuremap of an area on the corresponding hazard mapof the same scale, elements at risk can be identified.
– Particularly while carrying out hazard identificationand risk assessment for industrial estates, issueslike release scenario, consequences in terms ofheat generation over pressure and toxicities,identification of hazardous chemicals, processes andoperations, identification of important receptors,both environmental and physical, classification ofunits which have potential for creating an off siteemergency, and so on, need to be addressed.
• The reliability of hazard, vulnerability, and riskassessments will depend upon the quality of maps andother investigational data and various uncertaintiesinvolved due to inadequacy of data and other factors.It is therefore important that all major stages ofproject/scheme development, namely, planning, siteinvestigations and designs, are subject to a process ofrigorous peer review and accordingly certified.
9.3.33. Where projects specifically identified anddesigned for disaster management are to be appraised,the following factors would need to be considered:
• The proposed project or scheme (i) is to be need basedand demand driven; (ii) must fall within the highpriority bracket, linked with the development plan ofthe area; (iii) should have well stipulated goals, clearlyidentified stakeholders and beneficiaries; (iv) shouldbe fully backed with analyses of risks and quantifiedbenefits in terms of disaster safety; and (v) shouldclearly reflect implications of not taking up the projectin terms of disaster related risks, environmentalprotection, and economic development.
• Projects/schemes which yield multiplier effect for thegreatest good of the largest number will deservepriority. For example, a well drafted practical disasteremergency plan for a school or disaster managementplan for a district can inspire other schools anddistricts to yield the snow-balling (multiplier) effect.Similarly, development of a knowledge based,multi-media disaster mitigation product whentranslated in different vernacular languages may atonce multiply benefits.
• Project merit rating should also depend on thefollowing factors:– Breaking new ground in terms of scientific,
technological or management innovation, includingpeoples’ participation. For instance, development

214 Eleventh Five Year Plan
of an innovative early warning system against aparticular type of disaster using simple, readilymonitored indicators.
– Delivering ‘Best Practices’ for others to emulate andgetting inspired by them. For example, bestpractices of engineered constructions in a givenearthquake-affected hilly area.
– Choice of appropriate technology. For example,partially prefabricated construction technologywill be more appropriate than the cast-in-placeconstruction technology in a post-disasterreconstruction programme in a given situation.
– Employment generation. For example, a judiciousman-machine mix in the construction of floodprevention works may help generate employmentin an area without unduly compromising onefficiency of work.
– Sustainable capacity building. It is the key toempowering a village, district, State, or a region sothat each one of them can, as far as possible,manage their own affairs in the event of a disaster.For example, water sampling and testing capacityat local level when post-disaster situations threatenepidemics.
– Pro-active engagement of communities andspreading the culture of safety in communities andother levels. Disaster education and communityleadership development, public awarenessdevelopment, gender mainstreaming, special focuson the needs of women and children, vocationaltraining of unemployed youth, and concern forphysically challenged persons will add weight tothe project/scheme.
• Since disasters know no district or State boundaries,projects of interest to two or more districts or Statesmay score over those yielding localized benefits. Bythe same logic, national level mission-mode projects/schemes should get preference over others.
Financial Provisions for Disaster Management9.3.34. It is important that a portion of the Plan fundsis earmarked for efforts that directly or indirectly help indisaster management. Ideally, each project should provideadequately for the disaster mitigation and managementexpenditure that is identified by the appraisal processdescribed in the previous section as being necessary. Inaddition, Central and State Governments may, dependingupon their own hazard assessments, earmark a suitable
and adequate amount for disaster mitigation schemesthat are implemented over a definite time period.
9.3.35. The projects to be taken up should include:
• All schemes for generating basic input data for hazardand vulnerability impact analysis.
• Stand-alone disaster management projects suchas mitigation projects, awareness programmes,capacity building projects, community based disastermanagement projects, upgrading early warningsystems, failsafe disaster management communicationnetwork, micro-zoning, and so on.
• Mainstreaming disaster reduction into already approvedprojects in sectors of education, housing, infrastructure,urban development, and the like. For example, projectsalready under implementation such as the SSA, whichcaters to the construction of school buildings, could bereviewed. The design of the school building under theprogramme could include hazard resistant features, atleast in multi-hazard prone (earthquake, cyclone, flood),high-risk areas so that these are safe. Similarly, existinginfrastructure like bridges and roads will need to bestrengthened and upgraded to mitigate disaster at asubsequent stage.
Schemes/Programmes Identified/Proposed tobe taken up in the Eleventh Five Year Plan9.3.36. National level initiatives/projects for disastermanagement, identified and recommended by the WorkingGroup on Disaster Management and the NDMA for beingtaken up during the Eleventh Five Year Plan are indicatedat Annexure 9.3. However, details of these projects/schemes will have to be worked out through preparationof project reports. Thereafter, such schemes as are approvedfor implementation during the Eleventh Five Year Planwill have to be accommodated within the sectoralallocations of the ministries concerned.
9.3.37. Apart from the projects/schemes mentionedabove, a number of ongoing and proposed schemes ofvarious ministries and departments of the GoI have a director indirect bearing on disaster management as these addto preparedness for responding to disasters or constitutethe efforts towards recovery from the impact of disasters.Similarly, many developmental projects/schemes takecare of the vulnerability to different kinds of disasters andprovide for mitigation of their effects.

Environment and Climate Change 215
S. Schemes/Programmes Financial Performance Tenth Plan (Rs in crore)
No. Outlay BE RE Actual Exp.
Environment
1 Central Pollution Control Board (CPCB) 100.00 147.90 138.90 140.06
2 Industrial Pollution Abatement through Preventive Strategies 5.00 4.60 4.48 1.48
3 Common Effluent Treatment Plants (CETP) 25.00 20.27 20.25 20.10
4 Environmental Management in Heritage Pilgrimage and 170.00 59.02 25.03 25.00Tourism Centres, including Taj Protection
5 Establishment of Environment Protection Authorities 15.00 18.80 18.22 13.83and Environment Commission and Tribunal
6 Assistance for Abatement of Pollution and Environment 19.67 21.00 24.69 25.00Policy and Law
7 Environmental Health 10.00 2.00 0.05 1.03
8 Clean Technologies 25.00 12.50 9.19 5.18
9 Environmental Impact Assessment (EIA) 13.00 11.80 11.07 12.35
10 Industrial Pollution Prevention Project (EAP) 10.00 10.00 13.54 13.55
11 Hazardous Substances Management 70.00 37.00 32.91 30.71
12 Botanical Survey of India (BSI) 85.00 61.50 49.54 47.89
13 Zoological Survey of India (ZSI) 45.00 49.37 50.87 45.51
14 G.B. Pant Institute of Himalayan Environment and Development 35.00 34.00 36.96 37.00
15 Biosphere Reserves 35.00 37.20 37.87 36.62
16 Conservation and Management of Mangroves, Coral Reefs, 54.00 55.00 57.55 57.11and Wetlands
17 Assistance of Botanical Gardens 15.00 9.50 7.25 6.96
18 Biodiversity Conservation 12.00 15.00 17.00 15.51
19 Taxonomy Capacity Building Project 10.00 8.50 8.34 8.96
20 Institute of Biodiversity 16.00 1.00 0.00 0.00
21 Research and Development 24.00 20.07 20.83 20.78
22 Environment Education, Training, and Awareness 125.00 143.00 125.25 118.16
23 National Museum of Natural History (NMNH) 40.00 31.50 28.56 26.71
24 Centres of Excellence 45.00 38.00 36.56 33.28
25 Environmental Information System (ENVIS) 14.00 17.50 20.03 19.55
26 National Natural Resource Management System (NNRMS) 7.00 23.50 22.50 22.74
27 Environment Management Capacity Building Project (EMCB) (EAP) 48.98 80.00 48.29 46.14
28 Indo-Canada Environment Facility (ICEF) (EAP) 35.00 0.05 0.04 0.00
29 GoI-UNDP-CCF Programme (EAP) 3.00 13.00 9.50 9.06
30 Global Environment Facility (EAP) 0.05 0.01 0.01 0.00
31 International Co-operation Activities 8.00 9.20 9.92 10.13
32 Canada Assisted Centre for Excellence in Environmental Science, 1.00 0.11 0.02 0.00Technology, and Policy (EAP)
33 Indo-German Technical Co-operation Project (EAP) 6.00 0.50 0.01 0.00
34 State of Environment Project 6.00 6.15 7.26 6.26
ANNEXURE 9.1Financial Performance in the Tenth Plan
(Annexure 9.1 contd.)
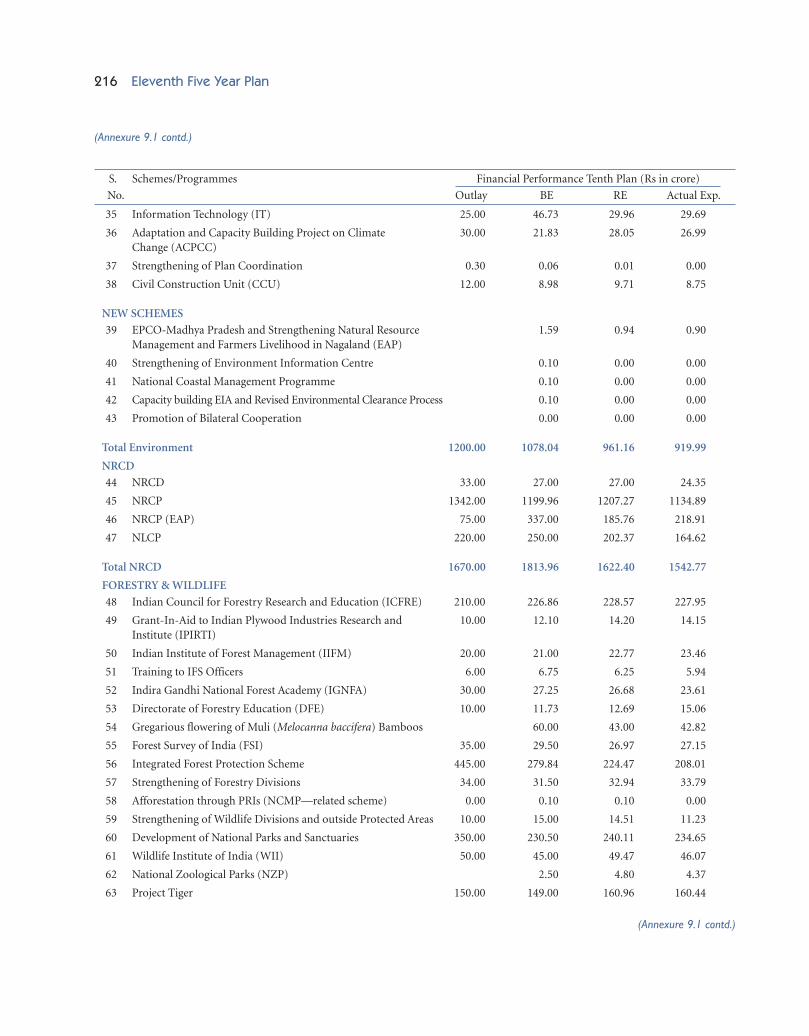
216 Eleventh Five Year Plan
(Annexure 9.1 contd.)
S. Schemes/Programmes Financial Performance Tenth Plan (Rs in crore)
No. Outlay BE RE Actual Exp.
35 Information Technology (IT) 25.00 46.73 29.96 29.69
36 Adaptation and Capacity Building Project on Climate 30.00 21.83 28.05 26.99Change (ACPCC)
37 Strengthening of Plan Coordination 0.30 0.06 0.01 0.00
38 Civil Construction Unit (CCU) 12.00 8.98 9.71 8.75
NEW SCHEMES
39 EPCO-Madhya Pradesh and Strengthening Natural Resource 1.59 0.94 0.90Management and Farmers Livelihood in Nagaland (EAP)
40 Strengthening of Environment Information Centre 0.10 0.00 0.00
41 National Coastal Management Programme 0.10 0.00 0.00
42 Capacity building EIA and Revised Environmental Clearance Process 0.10 0.00 0.00
43 Promotion of Bilateral Cooperation 0.00 0.00 0.00
Total Environment 1200.00 1078.04 961.16 919.99
NRCD
44 NRCD 33.00 27.00 27.00 24.35
45 NRCP 1342.00 1199.96 1207.27 1134.89
46 NRCP (EAP) 75.00 337.00 185.76 218.91
47 NLCP 220.00 250.00 202.37 164.62
Total NRCD 1670.00 1813.96 1622.40 1542.77
FORESTRY & WILDLIFE
48 Indian Council for Forestry Research and Education (ICFRE) 210.00 226.86 228.57 227.95
49 Grant-In-Aid to Indian Plywood Industries Research and 10.00 12.10 14.20 14.15Institute (IPIRTI)
50 Indian Institute of Forest Management (IIFM) 20.00 21.00 22.77 23.46
51 Training to IFS Officers 6.00 6.75 6.25 5.94
52 Indira Gandhi National Forest Academy (IGNFA) 30.00 27.25 26.68 23.61
53 Directorate of Forestry Education (DFE) 10.00 11.73 12.69 15.06
54 Gregarious flowering of Muli (Melocanna baccifera) Bamboos 60.00 43.00 42.82
55 Forest Survey of India (FSI) 35.00 29.50 26.97 27.15
56 Integrated Forest Protection Scheme 445.00 279.84 224.47 208.01
57 Strengthening of Forestry Divisions 34.00 31.50 32.94 33.79
58 Afforestation through PRIs (NCMP—related scheme) 0.00 0.10 0.10 0.00
59 Strengthening of Wildlife Divisions and outside Protected Areas 10.00 15.00 14.51 11.23
60 Development of National Parks and Sanctuaries 350.00 230.50 240.11 234.65
61 Wildlife Institute of India (WII) 50.00 45.00 49.47 46.07
62 National Zoological Parks (NZP) 2.50 4.80 4.37
63 Project Tiger 150.00 149.00 160.96 160.44
(Annexure 9.1 contd.)
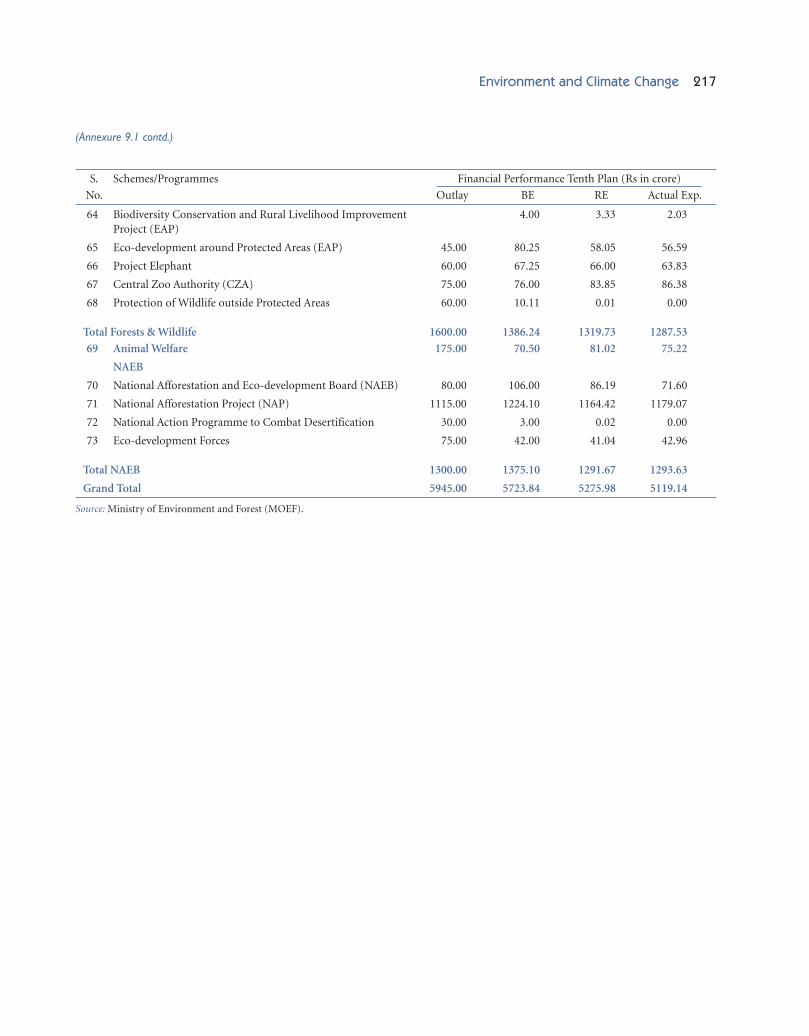
Environment and Climate Change 217
(Annexure 9.1 contd.)
S. Schemes/Programmes Financial Performance Tenth Plan (Rs in crore)
No. Outlay BE RE Actual Exp.
64 Biodiversity Conservation and Rural Livelihood Improvement 4.00 3.33 2.03Project (EAP)
65 Eco-development around Protected Areas (EAP) 45.00 80.25 58.05 56.59
66 Project Elephant 60.00 67.25 66.00 63.83
67 Central Zoo Authority (CZA) 75.00 76.00 83.85 86.38
68 Protection of Wildlife outside Protected Areas 60.00 10.11 0.01 0.00
Total Forests & Wildlife 1600.00 1386.24 1319.73 1287.53
69 Animal Welfare 175.00 70.50 81.02 75.22
NAEB
70 National Afforestation and Eco-development Board (NAEB) 80.00 106.00 86.19 71.60
71 National Afforestation Project (NAP) 1115.00 1224.10 1164.42 1179.07
72 National Action Programme to Combat Desertification 30.00 3.00 0.02 0.00
73 Eco-development Forces 75.00 42.00 41.04 42.96
Total NAEB 1300.00 1375.10 1291.67 1293.63
Grand Total 5945.00 5723.84 5275.98 5119.14
Source: Ministry of Environment and Forest (MOEF).

218 Eleventh Five Year Plan
S. Schemes/Programmes Physical Performance
No. Targets Achievements
1 Central Pollution Control National Ambient Air Quality Ambient air quality monitoring at 321Board (CPCB) Monitoring Program (NAMP) locations; water quality monitoring at
1019 locations.
2 Environmental Management Moratorium due to court case.in Heritage Pilgrimage andTourism Centres IncludingTaj Protection
3 Clean Technologies Life Cycle Assessment (LCA) studies Ten projects on Clean Technologies for foodand demonstration projects preservation, arsenic removal, bio-remediation
of lakes, recycling of marble slurry, developmentof natural dyes; adhesives from forest waste;development of bamboo composites; utilizationof anode muds and chips; air pollution controlpackage for medium-scale lime kilns anddevelopment of eco-friendly welding machines.
4 Hazardous Substances Management of chemical emergencies 6 TSDFs set up.Management and hazardous substances
5 Environment Education, Assistance to 100000 eco-clubs and 33778 eco-clubs created (total 91378); 9784Training and Awareness 10000 organizations organizations.
6 National River Conservation Projects for 34 polluted river stretches 308 projects completed; creating treatmentPlan (NRCP) in 160 towns for treating 5435 capacity for 2055 MLD sewage.
MLD sewage.
7 National Lake Conservation Conservation of 35 lakes, 28 projects Approved works in 42 new lakes; projects forPlan 10 lakes completed.
8 Indian Council for Forestry Co-ordinating research, education in 414 research projects initiated; 23 universitiesResearch and Education (ICFRE) institutes/universities supported.
9 Integrated Forest Protection Assistance to States and UTs for Assistance for fire protection (196819 km) andScheme identified activities forest boundary (219418 nos) consolidation.
10 Development of National Parks Assistance to States and UTs for Assistance to 342 national parks andand Sanctuaries national parks and sanctuaries sanctuaries being provided.
(total 606)
11 Project Tiger Funding support to 28 Tiger Reserves Funding support to 28 Tiger Reserves coveredin the area of 37761 sq km.
12 Project Elephant Assistance to 15 States for elephant Funds released for 25 Elephant Reserves inconservation. 15 States.
13 Central Zoo Authority (CZA) Assistance for management of zoos 293 zoos evaluated; 42 supported.
14 Animal Welfare Animal Welfare Board and Animal Welfare Board and National Instituteconstruction of National Institute of of Animal Welfare functioning.Animal Welfare.
15 National Afforestation and Evaluation of projects and assistance 650 projects evaluated.Eco-development Board (NAEB) to NGOs for afforestation.
16 National Afforestation Project Afforestation project-based assistance 729 projects involving 6.45 lakh ha in 29 States(NAP) to JFMCs. taken up.
17 Eco-development Forces Support to 4 Eco Task Force battalions 4 Eco Task Force battalions supported.
Source: MOEF.
ANNEXURE 9.2Physical Performance of Important Plan Schemes of the Tenth Plan
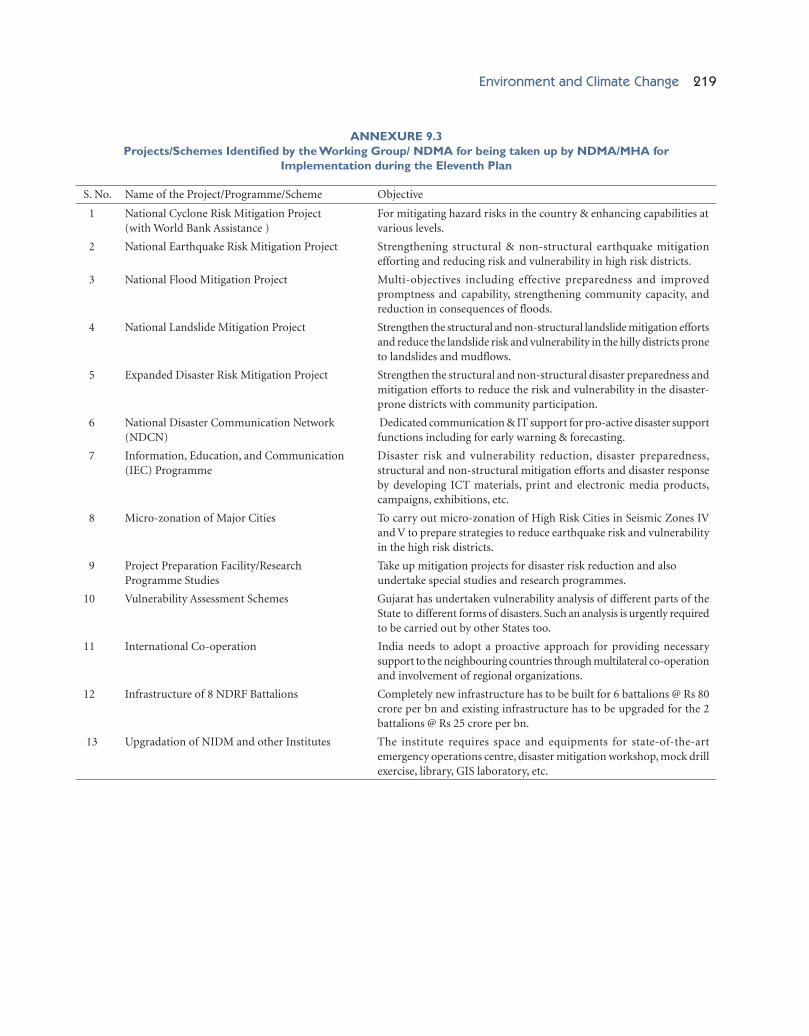
Environment and Climate Change 219
S. No. Name of the Project/Programme/Scheme Objective
1 National Cyclone Risk Mitigation Project For mitigating hazard risks in the country & enhancing capabilities at(with World Bank Assistance ) various levels.
2 National Earthquake Risk Mitigation Project Strengthening structural & non-structural earthquake mitigationefforting and reducing risk and vulnerability in high risk districts.
3 National Flood Mitigation Project Multi-objectives including effective preparedness and improvedpromptness and capability, strengthening community capacity, andreduction in consequences of floods.
4 National Landslide Mitigation Project Strengthen the structural and non-structural landslide mitigation effortsand reduce the landslide risk and vulnerability in the hilly districts proneto landslides and mudflows.
5 Expanded Disaster Risk Mitigation Project Strengthen the structural and non-structural disaster preparedness andmitigation efforts to reduce the risk and vulnerability in the disaster-prone districts with community participation.
6 National Disaster Communication Network Dedicated communication & IT support for pro-active disaster support(NDCN) functions including for early warning & forecasting.
7 Information, Education, and Communication Disaster risk and vulnerability reduction, disaster preparedness,(IEC) Programme structural and non-structural mitigation efforts and disaster response
by developing ICT materials, print and electronic media products,campaigns, exhibitions, etc.
8 Micro-zonation of Major Cities To carry out micro-zonation of High Risk Cities in Seismic Zones IVand V to prepare strategies to reduce earthquake risk and vulnerabilityin the high risk districts.
9 Project Preparation Facility/Research Take up mitigation projects for disaster risk reduction and alsoProgramme Studies undertake special studies and research programmes.
10 Vulnerability Assessment Schemes Gujarat has undertaken vulnerability analysis of different parts of theState to different forms of disasters. Such an analysis is urgently requiredto be carried out by other States too.
11 International Co-operation India needs to adopt a proactive approach for providing necessarysupport to the neighbouring countries through multilateral co-operationand involvement of regional organizations.
12 Infrastructure of 8 NDRF Battalions Completely new infrastructure has to be built for 6 battalions @ Rs 80crore per bn and existing infrastructure has to be upgraded for the 2battalions @ Rs 25 crore per bn.
13 Upgradation of NIDM and other Institutes The institute requires space and equipments for state-of-the-artemergency operations centre, disaster mitigation workshop, mock drillexercise, library, GIS laboratory, etc.
ANNEXURE 9.3Projects/Schemes Identified by the Working Group/ NDMA for being taken up by NDMA/MHA for
Implementation during the Eleventh Plan

220 Eleventh Five Year Plan
(Rs lakh)
Forestry & Wildlife Ecology & Environment
S. State Plan Projected Agreed Actual Projected Agreed ActualNo. State/ UT Outlay Outlay Outlay Expenditure Outlay Outlay Expenditure
1 Andhra Pradesh 4661400 123779 113262.86 80076.85 620 203.72 316.29
2 Arunachal Pradesh 388832 7700 9529.87 8403.42 42 208.91 38.46
3 Assam 831522 7736 11235 9076.1 65 79 29.45
4 Bihar 2100000 4514 7953.92 6267.25 0 0 0
5 Chhattisgarh 1100000 32718 39180 46844.04 783 679.5 370.13
6 Goa 320000 2500 2908.95 2880.93 300 795.45 799.33
7 Gujarat 4000700 93634 75445.7 66076.37 2766 2196 1010.44
8 Haryana 1028500 12733 32125 30612.03 283 407 277.46
9 Himachal Pradesh 1030000 42377 36748.49 36344.2 50 27 82.59
10 Jammu & Kashmir 1450000 36358 23794.13 23096.74 3619 465.42 288.4987
11 Jharkhand 1463274 46277 49802 46875.73 0 0 0
12 Karnataka 4355822 73396 51408.83 46677.84 1285 5535 2417.584
13 Kerala 2400000 17500 22789 21348.75 0 0
14 Madhya Pradesh 2618993 35275 64458.82 81330.29 5112 9663.63 8388.896
15 Maharastra 6663200 68279 10997.81 10729 1200 627.71 500
16 Manipur 280400 1744 3704.66 3560.81 495 1714 556.75
17 Meghalaya 300900 5250 6596 6093.89 275 300 174.34
18 Mizoram 230001 2846 4285 4515.88 19 20 11.04
19 Nagaland 222765 2250 2535 2828.24 100 178 272
20 Orissa 1900000 69446 22899.95 6083.94 2030 2482.29 2561.305
21 Punjab 1865700 28075 40800.6 30500.46 572 203.1 26.08
22 Rajasthan 2731800 115320 52592.87 31584.73 464 100.95 35.8972
23 Sikkim 165574 3500 3564.2 3510.45 500 160 125.97
24 Tamilnadu 4000000 134810 63561.93 64601.18 11305 1578.16 486.2261
25 Tripura 450000 4835 4273.65 4113.03 446 209 243.3531
26 Uttar Pradesh 5970800 120800 49784 48642.5 235525 24979 2628.58
27 Uttaranchal 763000 20693 56223.18 62063.17 5902 2900 1505
28 West Bengal 2864100 16443 12908.12 6823.73 1688 1259.99 2487.03
Total (States) 56157283 1130788 875369.54 791561.55 275446 56972.83 25643.7
UTs
29 Andaman & Nicobar 248300 7243 6369 6097.71 0 40 32.88
30 Chandigarh 100000 1733 2455 1916 270 323 188.13
31 Dadra & Nagar Haveli 30400 1200 1657 1733.87 0 0 0
32 Daman & Diu 24500 278 200 173.38 0 5 13.1
33 Delhi 2300000 2600 2300 14791.16 4800 2705 998.6
34 Lakshadweep 43700 92.3 91.7 46 400.3 163.3 102.52
35 Pondicherry 190649 500 859 819.54 176 244 257.13
Total (UTs) 2937549 13646.3 13931.7 25577.66 5646.3 3480.3 1592.38
Total (States/UTs) 59094832 1144434.3 889301.24 817139.21 281092.3 60453.13 27236.08
Percentage to Total 100 1.94 1.50 1.38 0.48 0.10 0.05
Source: Planning Commission.
ANNEXURE 9.4Tenth Plan Outlay and Actual Expenditure in Environment and Forest Sectors (States and UTs)
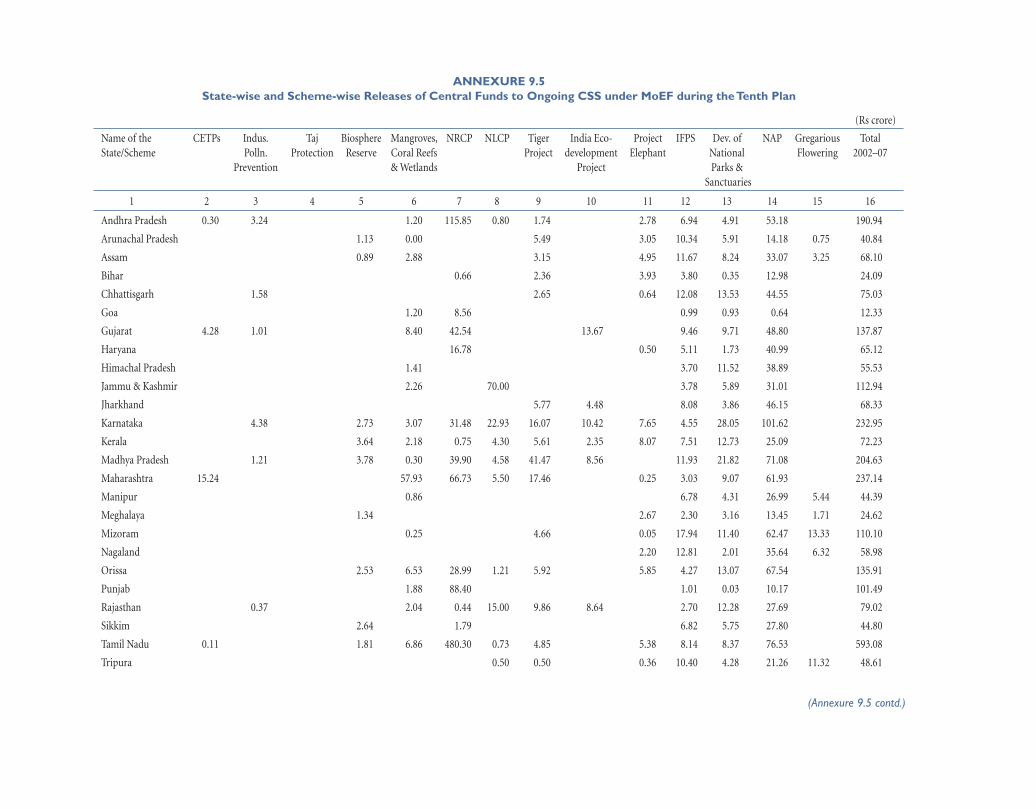
Environm
ent and Clim
ate Change221
ANNEXURE 9.5State-wise and Scheme-wise Releases of Central Funds to Ongoing CSS under MoEF during the Tenth Plan
(Rs crore)
Name of the CETPs Indus. Taj Biosphere Mangroves, NRCP NLCP Tiger India Eco- Project IFPS Dev. of NAP Gregarious TotalState/Scheme Polln. Protection Reserve Coral Reefs Project development Elephant National Flowering 2002–07
Prevention & Wetlands Project Parks & Sanctuaries
1 2 3 4 5 6 7 8 9 10 11 12 13 14 15 16
Andhra Pradesh 0.30 3.24 1.20 115.85 0.80 1.74 2.78 6.94 4.91 53.18 190.94
Arunachal Pradesh 1.13 0.00 5.49 3.05 10.34 5.91 14.18 0.75 40.84
Assam 0.89 2.88 3.15 4.95 11.67 8.24 33.07 3.25 68.10
Bihar 0.66 2.36 3.93 3.80 0.35 12.98 24.09
Chhattisgarh 1.58 2.65 0.64 12.08 13.53 44.55 75.03
Goa 1.20 8.56 0.99 0.93 0.64 12.33
Gujarat 4.28 1.01 8.40 42.54 13.67 9.46 9.71 48.80 137.87
Haryana 16.78 0.50 5.11 1.73 40.99 65.12
Himachal Pradesh 1.41 3.70 11.52 38.89 55.53
Jammu & Kashmir 2.26 70.00 3.78 5.89 31.01 112.94
Jharkhand 5.77 4.48 8.08 3.86 46.15 68.33
Karnataka 4.38 2.73 3.07 31.48 22.93 16.07 10.42 7.65 4.55 28.05 101.62 232.95
Kerala 3.64 2.18 0.75 4.30 5.61 2.35 8.07 7.51 12.73 25.09 72.23
Madhya Pradesh 1.21 3.78 0.30 39.90 4.58 41.47 8.56 11.93 21.82 71.08 204.63
Maharashtra 15.24 57.93 66.73 5.50 17.46 0.25 3.03 9.07 61.93 237.14
Manipur 0.86 6.78 4.31 26.99 5.44 44.39
Meghalaya 1.34 2.67 2.30 3.16 13.45 1.71 24.62
Mizoram 0.25 4.66 0.05 17.94 11.40 62.47 13.33 110.10
Nagaland 2.20 12.81 2.01 35.64 6.32 58.98
Orissa 2.53 6.53 28.99 1.21 5.92 5.85 4.27 13.07 67.54 135.91
Punjab 1.88 88.40 1.01 0.03 10.17 101.49
Rajasthan 0.37 2.04 0.44 15.00 9.86 8.64 2.70 12.28 27.69 79.02
Sikkim 2.64 1.79 6.82 5.75 27.80 44.80
Tamil Nadu 0.11 1.81 6.86 480.30 0.73 4.85 5.38 8.14 8.37 76.53 593.08
Tripura 0.50 0.50 0.36 10.40 4.28 21.26 11.32 48.61
(Annexure 9.5 contd.)

(Annexure 9.5 contd.)
(Rs crore)
Name of the CETPs Indus. Taj Biosphere Mangroves, NRCP NLCP Tiger India Eco- Project IFPS Dev. of NAP Gregarious TotalState/Scheme Polln. Protection Reserve Coral Reefs Project development Elephant National Flowering 2002–07
Prevention & Wetlands Project Parks & Sanctuaries
1 2 3 4 5 6 7 8 9 10 11 12 13 14 15 16
Uttar Pradesh 0.24 1.00 121.07 1.49 7.37 0.18 5.61 12.25 89.01 238.22
Uttaranchal 3.50 0.42 20.02 31.94 9.12 6.10 13.37 4.28 44.41 133.
West Bengal 3.52 7.53 135.56 5.11 9.10 4.14 6.97 8.45 14.26 27.79 222.42
Total States 19.93 11.79 0.24 27.50 108.21 1199.82 164.09 153.16 52.26 61.58 203.58 233.70 1154.91 42.12 3432.88
Union Terrotories
Andaman & Nicobar 2.50 0.83 2.11 5.45
Chandigarh 0.95 0.14 1.09
Dadra & Nagar 0.52 0.70 1.22
Delhi 121.25 0.20 121.45
Lakshadweep 0.30 0.30
Total UTs 3.45 1.13 121.25 0.52 3.15 129.50
Total States/UTs 19.93 11.79 0.24 30.95 109.34 1321.07 164.09 153.16 52.26 61.58 204.10 236.84 1154.91 42.12 3562.38
Source: MOEF.