Environment and Behavior - Alliance for Community...
25
http://eab.sagepub.com/ Environment and Behavior http://eab.sagepub.com/content/early/2014/01/22/0013916513518064 The online version of this article can be found at: DOI: 10.1177/0013916513518064 published online 27 January 2014 Environment and Behavior Meghan T. Holtan, Susan L. Dieterlen and William C. Sullivan Baltimore, Maryland Social Life Under Cover: Tree Canopy and Social Capital in Published by: http://www.sagepublications.com On behalf of: Environmental Design Research Association can be found at: Environment and Behavior Additional services and information for http://eab.sagepub.com/cgi/alerts Email Alerts: http://eab.sagepub.com/subscriptions Subscriptions: http://www.sagepub.com/journalsReprints.nav Reprints: http://www.sagepub.com/journalsPermissions.nav Permissions: What is This? - Jan 27, 2014 OnlineFirst Version of Record >> at Yale University Library on January 31, 2014 eab.sagepub.com Downloaded from at Yale University Library on January 31, 2014 eab.sagepub.com Downloaded from
-
Upload
nguyenthien -
Category
Documents
-
view
219 -
download
3
Transcript of Environment and Behavior - Alliance for Community...

http://eab.sagepub.com/Environment and Behavior
http://eab.sagepub.com/content/early/2014/01/22/0013916513518064The online version of this article can be found at:
DOI: 10.1177/0013916513518064
published online 27 January 2014Environment and BehaviorMeghan T. Holtan, Susan L. Dieterlen and William C. Sullivan
Baltimore, MarylandSocial Life Under Cover: Tree Canopy and Social Capital in
Published by:
http://www.sagepublications.com
On behalf of:
Environmental Design Research Association
can be found at:Environment and BehaviorAdditional services and information for
http://eab.sagepub.com/cgi/alertsEmail Alerts:
http://eab.sagepub.com/subscriptionsSubscriptions:
http://www.sagepub.com/journalsReprints.navReprints:
http://www.sagepub.com/journalsPermissions.navPermissions:
What is This?
- Jan 27, 2014OnlineFirst Version of Record >>
at Yale University Library on January 31, 2014eab.sagepub.comDownloaded from at Yale University Library on January 31, 2014eab.sagepub.comDownloaded from

Environment and Behavior 1 –24
© 2014 SAGE Publications Reprints and permissions:
sagepub.com/journalsPermissions.navDOI: 10.1177/0013916513518064
eab.sagepub.com
Article
Social Life Under Cover: Tree Canopy and Social Capital in Baltimore, Maryland
Meghan T. Holtan1, Susan L. Dieterlen1, and William C. Sullivan2
AbstractTo what extent does the density of the tree cover in a city relate to the amount of social capital among neighbors? To address this question, we linked social survey data (N = 361) from the Baltimore Ecosystem Study with socioeconomic, urban form, and green space data at the census block group level using a geographic information system. We found a systematically positive relationship between the density of urban tree canopy at the neighborhood block group level and the amount of social capital at the individual level (r = .241, p < .01). Multiple regression analyses showed that tree canopy added a 22.72% increase in explanatory power to the model for social capital. This research adds a new variable—neighborhood tree canopy—to the typologies of green space that affect human social connection. Trees are a relatively inexpensive and easy intervention to enhance the strength of social ties among neighbors.
Keywordssocial capital, neighborhoods, tree canopy, ecosystem services, green space
1State University of New York, College of Environmental Science and Forestry, Syracuse, USA2University of Illinois at Urbana Champaign, USA
Corresponding Author:Meghan Holtan, State University of New York, College of Environmental Science and Forestry, 441 West Fifth Avenue, Suite 202, Anchorage, Alaska, 99501, USA. Email: [email protected]
518064 EABXXX10.1177/0013916513518064Environment and BehaviorHoltan et alresearch-article2014
at Yale University Library on January 31, 2014eab.sagepub.comDownloaded from
2 Environment and Behavior
Introduction
More than 80% of the population in the United States lives in urban areas (U.S. Census Bureau, 2010b). Despite our urbanism, we are more dependent on natural ecosystems than ever before. In urban ecosystems, the urban forest regulates climate, air, and water quality and supports the cultural life of resi-dents through recreation and aesthetics. Yet substantially more research has been conducted on the regulatory benefits of the urban forest or its effect on property values than in understanding how the urban forest supports resi-dents’ social relations (see, for example, Mansfield, Pattanayak, McDow, McDonald, & Halpin, 2005; Mcpherson, Nowak, & Rowntree, 1994). The Baltimore Ecosystem Study (BES) is a long-term study of human and urban environment interactions that provided the publicly available data that com-prises a majority of this study. In this study, we identified statistical relation-ships between green space characteristics, including neighborhood tree canopy, and an individual’s social capital, or the value inherent in neighbor-hood social connections.
The Benefits of Green Space
The ambiguity of the term green space accounts in part for the diverse and at times contradictory findings of benefits and correlations between green space and human health and well-being (Lee & Maheswaran, 2011). Green space has been defined broadly as “any vegetated land or water within or adjoining an urban area” (Greenspace Scotland, 2008) and can include urban trees, shrubs, and ground vegetation (Smardon, 1988). It has also been used as a synonym for “public open space” (Lee & Maheswaran, 2011) and “green neighborhood common spaces” (Kuo, Sullivan, Coley, & Brunson, 1998) and measured through varying methods such as photo surveys (Kuo, Bacaicoa, & Sullivan, 1998) and remote sensing (Groenewegen, van den Berg, de Vries, & Verheij, 2006; Troy, Grove, & O’Neil-Dunne, 2012). In this study, we rec-ognize and distinguish between the effects of personal green space such as yards, the programmed green space of parks and the diffuse green space of neighborhood tree canopy.
The benefits of green space for human well-being are well documented. Views of nature have been related to decreased hospital patient recovery times (Ulrich, 1984) and increased feelings of peace, escape from distraction, and neighborhood satisfaction (R. Kaplan, 2001). A walk in the forest has been shown to reduce levels of stress hormones, heart rate, and blood pres-sure (Park, Tsunetsugu, Kasetani, Kagawa, & Miyazaki, 2010), and regulate the effects of environmental stress (Yamaguchi, Deguchi, & Miyazaki, 2006).
at Yale University Library on January 31, 2014eab.sagepub.comDownloaded from

Holtan et al 3
If people are drawn to green space for mental health benefits, they are likely to meet other people seeking the same relaxation and restoration. Use medi-ates the relationship between green space and social ties (Kuo, Sullivan, et al., 1998). The resultant social interaction in and around green spaces can also be measured using social capital indicators.
The study of the relationship between tree canopy and social capital falls within the robust literature that establishes a connection between green space and neighborhood social connections measured at the individual level. For instance, a number of studies in Chicago public housing neighborhoods in which residents were randomly assigned to apartments with varying levels of nearby green spaces found positive relationships between green common spaces and neighborhood social connections (Coley, Kuo, & Sullivan, 1997; Kuo, Sullivan, et al., 1998; Sullivan, Kuo, & Depooter, 2004). These green common spaces were also positively associated with sense of community and social integration (Kuo, Sullivan, et al., 1998; Kweon, Sullivan, & Wiley, 1998). Because of the random assignment of residents in these neighbor-hoods, the researchers argued that the findings were due to the increased use of the green spaces, which then led to stronger social ties, rather than the possibility that residents with more potential to form social ties had selected apartments in greener areas.
In addition to the Chicago studies, two European national scale studies found an independent positive relation between proximity to parks and col-lective efficacy (Cohen, Inagami, & Finch, 2008) and between green space and less loneliness and more social supports in the Netherlands (Maas, van Dillen, Verheij, & Groenewegen, 2009).
These findings from Chicago and Europe were particularly salient for young people, the elderly, and low-income people in urban environments, pointing to the importance of green space for populations that are less mobile and have less access to green space outside of their neighborhood. These studies also demonstrate the need for a more fine-grained measurement of green spaces over a large geographic area. In the Chicago studies, research was restricted to vulnerable populations and green space was limited to what little existed in the public housing developments. In the two national-level studies, green space was operationalized as natural areas, urban green spaces, and agricultural areas based on a 25 by 25-m land cover grid. (Maas, Verheij, Groenewegen, de Vries, & Spreeuwenberg, 2006). This technique cannot measure trees in yards or along the road. In contrast, the technology we lever-aged in this study allowed us to quantify the density of greenery at the neigh-borhood scale throughout the city.
Given that people react differently to various types of nature in neighbor-hood settings (Coley et al., 1997; R. Kaplan & Kaplan, 1989), measuring tree
at Yale University Library on January 31, 2014eab.sagepub.comDownloaded from

4 Environment and Behavior
cover may be especially relevant to outcomes such as social ties and social capital. Tree canopy functions as a green web that has ecological, economic, and, we would suppose, social benefits. In addition, planting street trees is a relatively easy public intervention that individual neighbors can take respon-sibility for and maintain (Jones, Davis, & Bradford, 2013). In contrast to parks, which may be designed for certain demographic groups, tree canopy benefits the neighborhood as a whole, providing shade from the summer sun, habitat for birds, and flood mitigation during heavy rains (Mcpherson et al., 1994).
Social Capital in the Neighborhood Context
For the purposes of this study, we defined social capital as “the shared knowl-edge, norms, rules and networks that facilitate collective experience within a neighborhood” (Vemuri, Grove, Wilson, & Burch, 2011, p. 6). This definition is consistent with the design of the BES survey that provided social capital data for this study. Similar studies have operationalized social capital by ask-ing participants about trust, mutual cooperation, and the closeness of neigh-borhood ties (Leyden, 2003; Putnam, 2000; Rogers, Halstead, Gardner, & Carlson, 2010).
Despite contradictory definitions (Coleman, 1988; Hanifan, 1916; Jacobs, 1961) and critiques (Portes, 1998; Taormina, Kuok, & Wei, 2012) of its valid-ity as a construct at times, social capital remains viable for measuring neigh-borhood social relations. Surveys of neighborly trust reflect actual neighbor relations, and higher social capital relates to tangible outcomes such as reduced crime, increased physical activity, and public participation (Lindström, 2011; Putnam, 2000). Although the environment does not create social capital, it provides opportunities for social interaction that facilitate strong neighborhood networks (Halpern, 2005; Sullivan et al., 2004). Literature that tests this relationship studies the effect at the individual level of neighborhood design characteristics. The physical form of a neighborhood affects interactions and can increase social capital and connection (Appleyard & Lintell, 1982; Jacobs, 1961). For example, walkable neighborhood envi-ronments are correlated with higher levels of social capital than “sprawling,” car-dependent neighborhoods (Leyden, 2003; Putnam, 2000; Rogers et al., 2010). Social relationships in these neighborhoods are reflected in social capital measured at the individual level. Therefore, neighborhood character-istics are appropriate predictors of social capital.
This study uses a common method of measuring social capital, but adds the novel use of tree canopy as the independent variable, in place of the more abstract green space variables used in previous studies. Recent innovations in remote sensing have made tree canopy data widely available, and its use as a
at Yale University Library on January 31, 2014eab.sagepub.comDownloaded from

Holtan et al 5
variable has become more common in urban ecological research (Troy et al., 2012; Zhou & Troy, 2008).
Our hypothesis grows from an understanding of how greener neighbor-hood spaces might result in greater levels of social capital. Tree canopy cre-ates opportunities for interaction at the street level by increasing use of the streets as people are drawn outside their homes to enjoy the restorative ben-efits of greenery and by making streets a more pleasant place to linger should one encounter a neighbor. This understanding is supported by a number of studies. Wood and Giles-Corti (2008) identified three levels of environmental influence on social capital: the neighborhood context, the neighborhood design, and specific neighborhood elements, one of which is access to green-ery. Broyles, Mowen, Theall, Gustat, and Rung (2011) found parks with users with greater levels of social capital had greater levels of use, which supports a relationship between green space and social capital, as well as the relation-ship’s incidental benefits (Broyles et al., 2011). Vemuri et al. (2011) found that social capital correlated with neighborhood satisfaction and access to a clean natural environment in Baltimore. What we do not know, however, is the extent to which the density of nearby tree canopy is associated with the strength of social capital reported by individuals. Until recently, it has been difficult to accurately quantify tree canopy in the urban setting.
New Technology and Measuring Green Spaces
Increases in remote sensing technology, such as Light Detecting and Ranging (LiDAR), have allowed researchers to study the relationship between tree canopy and indicators of human health and well-being. Donovan, Michael, and Butry (2011) found a correlation between tree canopy and birth out-comes, and hypothesized stress reduction as the vehicle for better maternal health and consequently, improved birth outcomes. Recent research from Baltimore has used LiDAR to demonstrate a 10% increase in tree canopy to be associated with a 12% drop in crime (Troy et al., 2012). Advances in aerial imagery have also allowed researchers to identify correlates of tree canopy such as urban form, and socioeconomic status (Grove, Cadenasso, et al., 2006; Heynen & Lindsey, 2003).
Other studies have measured “green space” based on experts’ ratings of the greenness of neighborhood common spaces (Kweon et al., 1998) or satel-lite imagery to measure parks across an entire country (Maas et al., 2009). LiDAR-derived data enabled us to measure a new green space typology in social effects research—tree canopy across an entire neighborhood. The quality and availability of data permit us to control for possible confounding and antecedent variables like land use, socioeconomic status, neighborhood design, and individual characteristics.
at Yale University Library on January 31, 2014eab.sagepub.comDownloaded from

6 Environment and Behavior
We add to the literature that links the health of ecosystems to the health of human inhabitants. We investigated whether neighborhood tree canopy cover functions similarly to other types of green spaces that promote and support neighborhood social life. Our hypothesis is that tree canopy cover at the cen-sus block group level will be positively correlated with an individual’s social capital, while controlling for possible confounding factors like individual age, neighborhood aggregates of socioeconomic status, and neighborhood urban form.
Methods
The Baltimore Ecosystem Study
We used data collected and created as part of the Baltimore Ecosystem Study (BES), located in the Baltimore Metropolitan Region. The BES is one of two National Science Foundation-funded urban Long Term Ecological Research (LTER) sites in the nation.The purpose of the LTER is to study the relation-ship between social, geophysical, and biological dynamics. Scientists in many disciplines from universities and local, federal, and state government agencies partner with community groups to study the complex interaction between people and the environment (Cadenasso, Pickett, & Grove, 2006). The research focuses on urban watersheds, patch dynamics, and building a human ecosystem framework. The data that have been collected are open and available for public download and use. BES data are the source of the social survey data and land cover data we used in the study.
Study Area
The study area includes Baltimore, Maryland, which is home to more than 600,000 people in 92 square miles. Baltimore City is the cultural and finan-cial center of the Baltimore-Townson Metropolitan Statistical Area (MSA), which is home to almost 3 million people (U.S. Census Bureau, 2010a). Baltimore originated as a port city and manufacturing hub for the eastern seaboard. The decline of American manufacturing, sprawl to surrounding Baltimore County, and disinvestment in general has negatively affected the physical, natural and social environment within the city. At the same time, a 1960s urban growth ring, aggressive preservation plans, and community activism have preserved and maintained high quality green spaces through-out the city. Tree canopy within the city varies from neighborhoods with vir-tually no tree canopy to neighborhoods that are three quarters shaded with trees. The average tree canopy cover for the city is 24%. The city has a goal of 40% by year 2040 (www.baltimoretreetrust.org).
at Yale University Library on January 31, 2014eab.sagepub.comDownloaded from

Holtan et al 7
Data
Social survey. Data for individual level characteristics, including the measure of social capital, came from the BES’s 2006 Greater Baltimore Recreation and Neighborhood Questionnaire (hereafter the BES Survey; Vemuri & Grove, 2006). The 2006 BES survey was a revised version of those from 1999, 2000, and 2003 used to measure changing perceptions, attitudes, and behaviors about recreation, amenities, and quality of life in the Greater Balti-more area. More detailed description of BES survey design and analysis can be found in articles such as Vemuri et al. (2011).
The original survey was conducted with a sample of Baltimore MSA resi-dents stratified by level of urbanization and socioeconomic status. Geographic information and telephone numbers for each participant were purchased from Claritas marketing firm. Target completion rates for each sampling unit ranged from 50 to 150 participants depending on the population size of the unit. Contact was made with the initial stratified sample of 4,880 potential participants over the age of 18. Surveys were administered by telephone using Computer Assisted Telephone Interviewing. Repeated callbacks and postcard follow-ups were used to increase response rates. Researchers obtained a response rate of 36.1%, a generally acceptable rate in social sur-vey research. Focus groups and pretests were used to ensure the wording of the questionnaire design (Vemuri, 2010). We obtained the survey data in an Excel spreadsheet through the BES data coordinator; the survey instrument and survey methodology were available for public download through the BES website.
Secondary data sample selection. We selected cases that were in the 510 Fed-eral Information Processing Standards (FIPS) county code to select only resi-dents within the Baltimore City line (n = 709). This was to keep the sample predominantly urban and eliminate correlations between tree canopy and agricultural land uses. We included questions about social capital, personal green space, and demographics.
Missing values are a common problem in social survey research. Of the initial 709 cases, we removed nine because they lacked values for four or more of the social capital variables of interest. We used a case mean method to replace the remaining missing values in questions relating to social capital. We rounded the mean of existing values for social capital-related questions to the nearest whole number to replace the missing values. This is an appropri-ate technique because the questions are highly correlated, relate to one con-struct, and will be used to form a summative scale index for the purposes of analysis (Roth & Switzer, 1999).
at Yale University Library on January 31, 2014eab.sagepub.comDownloaded from

8 Environment and Behavior
Finally, we selected only the cases that had more than the median percent of residential land in the neighborhood for analysis (median residential land use per block group = 77%). This was to limit the analysis to predominantly residential neighborhoods and avoid the confounding factors of large swaths of undeveloped land, natural areas, or large industrial or institutional uses that are also correlated with tree canopy and could potentially affect the mea-surement of neighborhood connection (Heynen & Lindsey, 2003). The final sample size was 361 individuals. These individuals were distributed across 191 block groups of the 710 block groups in the city, at an average of two responses per block group.
Variables
Individual characteristics. We derived social capital, the dependent variable, from the 2006 BES Survey. Residents were asked to score seven statements about their neighborhood on a scale from 1 to 5. Of the seven questions, we included the five questions that related most to qualities that described neigh-borhood social connection and association, as opposed to outside group involvement in neighborhood activities (see Table 1). The index we con-structed for social capital closely resembled other summative scales measur-ing social capital, including previous studies published by the BES research team (Vemuri et al., 2011), and other studies of social capital (for example, the American Community Social Capital Benchmark Survey; Broyles et al., 2011; Leyden, 2003; Putnam, 2000). The Cronbach’s alpha for the index was .835. The individual ’s age was also included in the analysis to account for that main predictor of social capital (Putnam, 2000).
Green space characteristics. We included neighborhood tree canopy, access to a green yard and access to parks within the neighborhood as green space characteristics in the analysis. Tree canopy data came from a 2007 geographic dataset made available through the BES public data access website (BES, 2007). The data were the product of high-resolution aerial imagery and light detecting and ranging (LiDAR) technology, which is classified using light intensity and surface heights. In addition to tree canopy, grass/shrub, water, buildings, roads, bare earth and impervious surfaces can be classified. We calculated neighborhood tree canopy as a percentage of the census block group. We used bivariate responses to questions from the 2006 BES survey asking residents whether they had a yard with grass or trees to model the impact of personal green space.
Land use data from 2008, including parks, came from Baltimore City Enterprise Geographic Information Services. The land use data were avail-able at the parcel level and also included all rights of way so that the land use
at Yale University Library on January 31, 2014eab.sagepub.comDownloaded from
Holtan et al 9
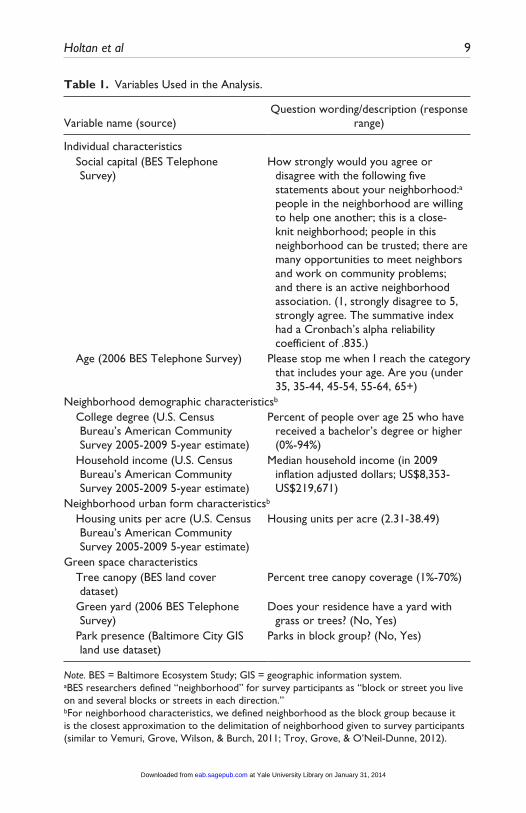
Table 1. Variables Used in the Analysis.
Variable name (source)Question wording/description (response
range)
Individual characteristics Social capital (BES Telephone
Survey)How strongly would you agree or
disagree with the following five statements about your neighborhood:a people in the neighborhood are willing to help one another; this is a close-knit neighborhood; people in this neighborhood can be trusted; there are many opportunities to meet neighbors and work on community problems; and there is an active neighborhood association. (1, strongly disagree to 5, strongly agree. The summative index had a Cronbach’s alpha reliability coefficient of .835.)
Age (2006 BES Telephone Survey) Please stop me when I reach the category that includes your age. Are you (under 35, 35-44, 45-54, 55-64, 65+)
Neighborhood demographic characteristicsb
College degree (U.S. Census Bureau’s American Community Survey 2005-2009 5-year estimate)
Percent of people over age 25 who have received a bachelor’s degree or higher (0%-94%)
Household income (U.S. Census Bureau’s American Community Survey 2005-2009 5-year estimate)
Median household income (in 2009 inflation adjusted dollars; US$8,353-US$219,671)
Neighborhood urban form characteristicsb
Housing units per acre (U.S. Census Bureau’s American Community Survey 2005-2009 5-year estimate)
Housing units per acre (2.31-38.49)
Green space characteristics Tree canopy (BES land cover
dataset)Percent tree canopy coverage (1%-70%)
Green yard (2006 BES Telephone Survey)
Does your residence have a yard with grass or trees? (No, Yes)
Park presence (Baltimore City GIS land use dataset)
Parks in block group? (No, Yes)
Note. BES = Baltimore Ecosystem Study; GIS = geographic information system.aBES researchers defined “neighborhood” for survey participants as “block or street you live on and several blocks or streets in each direction.”bFor neighborhood characteristics, we defined neighborhood as the block group because it is the closest approximation to the delimitation of neighborhood given to survey participants (similar to Vemuri, Grove, Wilson, & Burch, 2011; Troy, Grove, & O’Neil-Dunne, 2012).
at Yale University Library on January 31, 2014eab.sagepub.comDownloaded from

10 Environment and Behavior
dataset formed a complete cover of the land area of Baltimore City. Multiple potential land use categories existed to identify green space including parks and recreation, natural area, cemetery, undeveloped, private recreational, public institutional, and public institutional-non-city. We selected the parks and recreation land use for analysis because parks are specifically pro-grammed for public use and enjoyment of nature and outdoors. We calculated the parks as a bivariate measure of the presence of a park and recreation land use in the block group.
We omitted public institutions, such as schools, or private recreation sites, like golf courses, because these land uses are not accessible to all people at all hours. In addition, schools can function as sites of access and perpetuation of social capital (Hanifan, 1916), and we did not want to confound the impact of schools’ green space with their social networks. Similarly, though undevel-oped land does contain patches of green space, it is also representative of other land use, planning, and historical mechanisms that are not part of this study. Natural areas and cemeteries make up less than 3% of the total land area of the city and do not occur frequently enough to include. In addition, their primary purpose is not social meeting, whereas parks have a social function.
Neighborhood socioeconomic data. We obtained socioeconomic data for block groups from the American Community Survey 5-year estimate for 2005-2009 (U.S. Census Bureau, 2011) to statistically control for variables that can influence tree canopy cover. Studies have found that median income can pre-dict vegetation richness (Martin, Warren, & Kinzig, 2004) and education level is a correlate of tree canopy cover (Heynen & Lindsey, 2003). These variables are also correlated with factors that could potentially affect social capital. We constructed the education-level variable as a percentage of resi-dents in the block group who had attained a bachelors degree or higher.
Neighborhood urban form. We included neighborhood urban form variables to additionally control for variables that could affect the relationship between tree canopy and social capital. Housing unit density is a measure of units per acre to control for space available where trees can be planted (Grove, Cade-nasso, et al., 2006). Housing unit density is also a partial indicator of walk-ability (Cerin, Leslie, Owen, & Bauman, 2007; Leslie, Cerin, DuToit, Owen, & Bauman, 2007) and sprawl and could control for other potential correlates of social capital (Leyden, 2003; Putnam, 2000; Rogers et al., 2010).
We omitted the median age of the structures of the neighborhood from the analysis because housing age has been shown to have a curvilinear relation-ship with tree canopy (Grove, Cadenasso, et al., 2006). Trees in newer neighbor-hoods have not had the time to attain functional maturity in terms of canopy cover. In contrast, older neighborhoods may have had mature trees that have died
at Yale University Library on January 31, 2014eab.sagepub.comDownloaded from

Holtan et al 11
and not been replaced. Further complicating this relationship is that older neigh-borhoods in Baltimore may have smaller lot sizes, and therefore less space for trees. We decided to omit architectural variables due to sample size and these confounding variables, which is not unprecedented (Vemuri et al., 2011).
Case construction. Neighborhood was defined for survey participants as including “both the block or street [they] live on and several blocks in either direction” (Vemuri, 2010, p. 2). We operationalized neighborhood for the biophysical, built environment, and socioeconomic variables as the census block group (similar to Troy et al., 2012; Vemuri et al., 2011). We joined the neighborhood variables to survey responses using a common FIPS identifier for block group (U.S. Census Bureau MAF/TIGER database, 2009). We used ESRI’s ArcMap 10 to calculate land use and land cover percentages within the block group. We determined the total land area for each block group from the land use dataset to avoid including the water area of Chesapeake Bay in the waterfront block groups’ analyses. The land use dataset was a continuous cover including taxable parcels and transportation rights of way, so that all land within the city was included. The final product of this data preparation was a set of cases (N = 361) that included individual survey responses and the characteristics of the neighborhoods where respondents lived. Table 1 describes the variables used in the analysis.
Results
Table 2 presents the descriptive statistics for the subset of the BES survey sample that was used for this analysis. The 2005-2009 5-year estimate from the American Community Survey by the U.S. Census Bureau provides a comparison. The survey sample was more white, female, wealthier, and
Table 2. Socioeconomic Characteristics of the Survey Sample and Baltimore City.
Female (%)
White Caucasian
(%)
Household income
> US$50,000 (%)
College-educated
(over age 25) (%)
Employed (over age 16)
(%)
Married (over age 15)
(%)
Own home (%)
BES survey sample (N = 361)
68.7 45.4 47.1 45.8 53.9 43.6 70.6
City of Baltimorea
53.5 30.9 36.8 23.3 53.9 26.6 50.7b
Note. BES = Baltimore Ecosystem Study.aSource. U.S. Census Bureau (2006) American Community Survey 1-year estimate.bThis is the rate of owner occupied housing units.
at Yale University Library on January 31, 2014eab.sagepub.comDownloaded from

12 Environment and Behavior
Table 3. Descriptive Statistics of Variables Used in the Analysis (N = 361).
Minimum Maximum M SD
Social capitala 5 25 17.07 5.451Ageb 1 5 2.99 1.422College degree 0% 94% 31% 26%Household income US$8,353 US$219,671 US$50,978 US$32,251Housing units per acre 2.31 38.49 12.0212 7.60392Tree canopy 1% 70% 27% 16%Green yarda 0 1 0.81 0.396Park presence 0 1 0.2 0.404
aIndicates variable measured at the individual level. The other variables were measured at the neighborhood level.bAge was measured at the individual level, n = 356.
.educated than the population of Baltimore City as a whole. This is typical of other telephone surveys (Dillman, Smyth, & Christian, 2009). In addition, survey participants included in this analysis were more likely to be married and own their own home. The survey sample characteristic that most closely approximates Baltimore City was the percent of employed people over the age of 16. Both samples had an employment rate of just under 54%. However, the survey sample employment rate might reflect a higher number of retired participants who were more likely to be at home and willing to answer a tele-phone survey (Dillman et al., 2009). The slightly skewed representation of Baltimore City’s population in the survey sample affects the generalizability of the study. These differences between the general population and survey sample were more extreme than for previous BES studies (Vemuri et al., 2011). This might be because this study was limited to Baltimore City, which has fewer white residents, lower average income, and lower home ownership rates than the Baltimore region that comprised the full BES survey sample. Table 3 shows the descriptive statistics for the variables in the analysis.
On average, survey participants had a slightly better than average level of social capital, as indicated by the mean score of 17.07 on the social capital scale. An individual who answered “neutral” to all of the statements about social capital would have received a 15 on the social capital index. Thus, the average participant agreed at least twice or strongly agreed once to a question about social capital. The descriptive statistics show that the sample lived in neighborhoods with a US$50,978 median household income and the neigh-borhood average percentage of people who have college degrees is 30%. The socioeconomic statistics demonstrate the wide variety of neighborhoods in Baltimore. Housing density ranged from 2 to 38 units per acre. The average
at Yale University Library on January 31, 2014eab.sagepub.comDownloaded from

Holtan et al 13
neighborhood canopy cover was 27%, only slightly higher than the citywide average of 24%. Eighty-one percent of the survey participants lived in a house with trees or grass in the yard, and 20% of the neighborhoods where participants lived contain a park.
Were the Major Variables Related?
The correlation matrix in Table 4 presents correlations between the variables included in the analysis. Social capital had a statistically significant, positive correlation with tree canopy (Pearson’s r = .241, p < .01). Social capital was also correlated with college degree (Pearson’s r = .245, p < .01) and household income (Pearson’s r = .201, p < .01), and inversely correlated with housing units per acre (Pearson’s r = −.141, p < .01). Social capital was not correlated with the other two green space variables of green yard and park presence. Contrary to previous literature, age was not significantly correlated with social capital.
Tree canopy was also significantly correlated with neighborhood median household income (Pearson’s r = .406, p < .01) and education levels (Pearson’s r = .466, p < .01). There was a strong, significant negative correlation between tree canopy and housing unit density (−.688, p < .01). This perhaps reflects the lack of space to plant trees, the lower income of neighborhoods and his-toric maintenance of street trees due to unequal distribution of city services..
Does Green Space Predict Social Capital After Other Factors Are Considered?
We performed multiple linear regressions using SPSS and the enter method, which simultaneously adds all variables to the model. We first modeled the relationship between green space and social capital.
Table 4. Bivariate Correlations Between Variables of Interest and Social Capital (N = 361).
Social capital AgeCollege degree
Household income
Housing units per
acreTree
canopyGreen yard
Age .080 College degree .245** −.142** Household income .201** −.088 .655** Housing units per acre −.141** −.026 −.107* −.268** Tree canopy .241** .043 .466** .406** −.688** Green yard .085 .056 .011 .107* −.474** .387** Park presence −.025 .053 .014 −.151** −.042 .219** .058
*p < .05 level, two-tailed. **p < .01 level, two-tailed.
at Yale University Library on January 31, 2014eab.sagepub.comDownloaded from

14 Environment and Behavior
Table 5. Green Space Regression Model for Social Capital (N = 361).
β σ
(Constant) .000Tree canopy .264 .000Green yard −.012 .825Park presence −.082 .120Adjusted R2 = .057
Table 5 shows that the green space linear regression model accounted for almost 6% of the variation in participants’ reported social capital. Tree can-opy contributed the most to the model (β = .264), and was significant at the p < .01 level. The other two green space variables did not contribute signifi-cantly to the model.
Next, we conducted three multiple regressions using other available social capital predictors, neighborhood socioeconomic variables, and other vari-ables that affect tree canopy and that might falsely affect its contribution to social capital. Table 6 displays the results of these three models. In the first model, we included all variables except the green space variables. The sec-ond model included green space variables other than tree canopy. Tree can-opy was added to the final model to see if any explanatory power was added after accounting for the other factors.
Table 6 shows that Model 1, which did not include green space variables, accounts for 7.3% of the variation in social capital. Participant age, neighbor-hood education levels, and housing units per acre contributed
significantly to the model. However, when the green space variables other than tree canopy were added to the model, the explanatory power of the model decreased to 7.1%, though this was not a statistically significant change. When tree canopy was added to the model, the explanatory power increased to 7.6% of the variation in participants’ social capital, which was greater than the other models alone. In the full model (Model 3), age, tree canopy cover, and neighborhood education levels were the only variables that contributed significantly to the model.
We then conducted a regression using only the significant variables from the full models. Table 7 shows that the adjusted R2 increased from .066 to .081 when tree canopy was added to the model using only the significant variables from the previous models. Tree canopy added 1.5% more predictive power to the model of social capital. All variables were significant at the p < .01 level, except for age, which was significant at the .05 level in the second model.
at Yale University Library on January 31, 2014eab.sagepub.comDownloaded from

Holtan et al 15
Discussion
Our hypothesis was that tree canopy cover at the census block group level would be positively correlated with social capital and that this relationship would hold after controlling for possible confounding factors like individual age, neighborhood aggregates of socioeconomic status and neighborhood urban form. The bivariate correlations and regression models suggested a significant relationship between tree canopy and social capital. This was con-sistent with other findings on the relationship between green space and social benefits. Green space close to an individual’s home has been shown to have a significant relationship with social support (Maas et al., 2009). Our findings
Table 6. Full Regression Models for Social Capital (n = 356).
Model β σ
1 (Constant) .000 Age .112 .031 College degree .225 .001 Household income .033 .637 Housing units per acre −.103 .0552 (Constant) .000 Age .113 .030 College degree .235 .001 Household income .019 .792 Housing units per acre −.091 .132 Green yard .034 .559 Park presence −.042 .4263 (Constant) .000 Age .102 .051 College degree .172 .029 Household income .019 .796 Housing units per acre .000 .996 Green yard .021 .726 Park presence −.070 .206 Tree canopy .154 .086Model 1 adjusted R2 = .073; σ F change = .000Model 2 adjusted R2 = .071; σ F change = .626Model 3 adjusted R2 = .076; σ F change = .086
at Yale University Library on January 31, 2014eab.sagepub.comDownloaded from

16 Environment and Behavior
Table 7. Regression Models for Social Capital, Significant Variables Only (n = 356).
Model β σ
1 (Constant) .000 Age .117 .025 College degree .258 .0002 (Constant) .000 Age .100 .054 College degree .187 .002 Tree canopy .147 .011Model 1 adjusted R2 = .066; σ F change = .000Model 2 adjusted R2 = .081; σ F change = .011
provide an additional scale of influence. Not only are closer parks better for neighborhood social life (Maas et al., 2009), the findings here demonstrate that the green fabric of a neighborhood created by tree canopy also facilitates the social health that is vital to neighborhood functioning.
The purpose of the study was not to fully model social capital. Rather, we used existing data to better understand the added effects of tree canopy as a new measurement of green space. Using only the statistically significant vari-ables and adding tree canopy to the final model increased the model’s explan-atory power by 22.72%, from explaining 6.6% to 8.1% of the variation in an individual’s social capital. The Pearson’s correlations in Table 4 show that tree canopy has a similar strength and significance as the neighborhood socioeconomic indicators of household income and education, two estab-lished correlates of social capital (Putnam, 2000). Given the complexity of modeling social capital, these positive and statistically significant results should be welcome by researchers, community advocates and policy makers wanting to make the case for investing in the urban tree canopy.
The mechanism by which tree canopy facilitates increased levels of social capital is likely through driving increased use of sidewalks and outdoor spaces with trees. The Chicago studies also suggested use of outdoor space as a mediator between green space and social interaction (Coley et al., 1997; Kuo, Sullivan, et al., 1998; Sullivan et al., 2004). Alternatively, perhaps neighborhoods with greater tree canopy cover provide stress reduction. Neighborhoods with higher levels of tree canopy create a feeling of escape that is essential to mental restoration, or increase the sense of mystery that draws walkers around the corner to the next block to meet their neighbors (R.
at Yale University Library on January 31, 2014eab.sagepub.comDownloaded from

Holtan et al 17
Kaplan & Kaplan, 1989). Although Kuo, Sullivan, et al. (1998) did not find that stress reduction, mental fatigue, or mood mediated the relationship between green common spaces and social ties, this is possibly an area for future study given the different structure of neighborhood tree canopy from green common spaces in public housing. Finally, it is possible that tree can-opy increases neighborhood satisfaction (R. Kaplan, 2001; Vemuri et al., 2011), which in turn bolsters social capital.
While tree canopy was significantly correlated with having a green yard (Pearson’s r = .387, p < .01), the green yard itself did not correlate with social capital or add additional explanatory power to the regression models. This lends credence to the hypothesis that the relationship between tree canopy and social factors are the result of increased use of neighborhood common spaces that are made more hospitable because of tree canopy. One policy implication would be that it is important that trees are planted in shared pub-lic spaces, like sidewalk planting strips, for the whole neighborhood to ben-efit. The lack of relationship between a green yard and social capital runs contrary to the yard’s status as a public–private space that facilitates interac-tion much like a porch (Wilkerson, Carlson, Yen, & Michael, 2011).
The lack of significant relationship between park presence in the neigh-borhood and social capital could be a response to a perceived threat of crime or unappealing parks. Thus, green space would not facilitate the creation of social capital through opportunities for informal interaction because fewer people would be in these areas. Due to cuts endemic to urban parks’ budgets, Baltimore parks might have varying levels of maintenance and use and thus do not unilaterally facilitate social interaction and social capital as would be suggested by previous literature on neighborhood common spaces (Kuo, Sullivan, et al., 1998). Future research might investigate the extent to which tree canopy has a stronger relationship to neighborhood social life where parks and common green spaces are used less. Other research could include multiple constructions of green space at different scales of analysis, including tree canopy, yards, small and large parks, and natural open spaces.
Tree canopy is one part of a complex relationship between neighborhood urban form and socioeconomic characteristics. We chose to keep housing unit density as a variable in the models, but we acknowledge the presence of mediating variables. Denser neighborhoods have less physical space for tree canopy, though they can be more walkable. However, unlike the findings of Leyden (2003) and Rogers et al. (2010), housing unit density as a partial indicator of walkability had a small but significant negative correlation with social capital. It is possible that denser housing in the study area is located in lower income, higher crime neighborhoods that do not facilitate social capital via walkability and proximity to neighbors. We added tree canopy to the
at Yale University Library on January 31, 2014eab.sagepub.comDownloaded from

18 Environment and Behavior
model last to best account for the impact of tree canopy among multiple inter-related variables. Further research should include a comparison across a broader range of neighborhood housing densities or include a more refined index of walkability (such as explored in Smith et al., 2008).
It is possible that higher income neighborhoods also have less crime and thus a higher level of trust. Crime was not included in this model because crime is also correlated with lower social capital and we wanted to avoid issues of reverse causality (Kennedy, Kawachi, Prothrow-Stith, Lochner, & Gupta, 1998). However, lower crime rates have been correlated with greater tree canopy cover (Donovan & Prestemon, 2012; Kuo & Sullivan, 2001; Troy et al., 2012). The relationship between neighborhood socioeconomic status, neighborhood green space, crime, the perception of safety and security, and residents’ social capital is another open area in environmental design research.
The findings also provide contrast to existing literature on social capital. Unlike what Putnam (2000) might suggest, age was not correlated with social capital. However, it was useful as a predictor when other variables were mod-eled together. In all three regression models, participant age contributed a statistically significant amount to the model’s explanatory power, consistent with Putnam’s (2000) hypothesis that older people have more social capital. The low level of significance of age and the low adjusted R2 of the full model reflected that the purpose of the study was not to fully model social capital, but rather to understand the relationship between neighborhood tree canopy and social interaction, using social capital as a robust indicator. Social factors are difficult to model because of their complexity; thus, the relative impor-tance of tree canopy in this model suggests its inclusion in further studies.
The limitations of this study included generalizability, a cross-sectional design and the limitations of secondary data collection. The sample used did not exactly match the larger environment of the city studied. Baltimore has vegetation patterns, an urban form and history that are particular to the Northeastern United States. The cross-sectional design cannot rule out selec-tion threats to internal validity, whereby residents who prefer high levels of social capital also choose neighborhoods with more tree canopy. In addition, having used secondary data, it was difficult to know the cause of any errors in missing values or sampling.
As expected, we found that tree canopy was significantly and positively correlated with social capital. When accounting for possible confounding variables like socioeconomic status and urban form, neighborhood tree can-opy cover explained an additional 1.5% of the variation in an individual’s social capital, an increase of 22.72%. The relationships between the variables suggest a complex interaction between social capital and the environment. In spite of this complexity, these findings suggest that more street trees should
at Yale University Library on January 31, 2014eab.sagepub.comDownloaded from

Holtan et al 19
be planted in neighborhood public spaces. Trees are a relatively simple and affordable public works intervention (Mcpherson et al., 1994), provide the quickest access to the restorative benefits of green space needed by busy people (S. Kaplan, 1995), and have multiple additional human health and environmental benefits (Mcpherson et al., 1994). There are few drawbacks to planting trees in response to the desire for increased neighborhood interac-tions (Wood & Giles-Corti, 2008). Researchers and design professionals should continue to include neighborhood tree canopy in the network of green space that supports the social benefits of urban ecosystems.
Acknowledgment
This research would not have been possible without the data that was shared by the National Science Foundation funded Baltimore Ecosystem Study Long Term Ecological Research program housed within the Cary Institute of Ecosystem Studies.
Declaration of Conflicting Interests
The author(s) declared no potential conflicts of interest with respect to the research, authorship, and/or publication of this article.
Funding
The author(s) received no financial support for the research, authorship, and/or publi-cation of this article.
References
Appleyard, D., & Lintell, M. (1982). The environmental quality of city streets: The res-idents’ viewpoint. In S. Kaplan & R. Kaplan (Eds.), Humanscape: Environments for people (pp. 233-258). Ann Arbor, MI: Ulrich’s Books.
Baltimore City Enterprise Geographic Information Services. (2008). Baltimore city land use [Data file]. Retrieved from http://www.baltimo-recity.gov/OfficeoftheMayor/MayoralOffices/InformationTechnology/EnterpriseGeographicInformationServices.aspx
Baltimore Ecosystem Study. (2007). Baltimore City land cover [Data file]. Available from www.beslter.org
Broyles, S. T., Mowen, A. J., Theall, K. P., Gustat, J., & Rung, A. L. (2011). Integrating social capital into a park-use and active-living framework. American Journal of Preventive Medicine, 40, 522-529. doi:10.1016/j.amepre.2010.12.028
Cadenasso, M. L., Pickett, S. T. A., & Grove, M. J. (2006). Integrative approaches to investigating human-natural systems: The Baltimore ecosystem study. Natures Sciences Sociétés, 14, 4-14. doi:10.1051/nss:2006002
Cerin, E., Leslie, E., Owen, N., & Bauman, A. (2007). Applying GIS in physical activity research: Community “walkability” and walking behaviors. In P. C. Lai
at Yale University Library on January 31, 2014eab.sagepub.comDownloaded from

20 Environment and Behavior
& A. S. H. Mak (Eds.), GIS for health and the environment development in the Asia Pacific region (pp. 72-89). Retrieved from http://dx.doi.org/10.1007/978-3-540-71318-0_6
Cohen, D. A., Inagami, S., & Finch, B. (2008). The built environment and collective efficacy. Health & Place, 14, 198-208. doi:10.1016/j.healthplace.2007.06.001
Coleman, J. S. (1988). Social capital in the creation of human capital. American Journal of Sociology, 94 (Supplement: Organizations and Institutions: Sociological and Economic Approaches to the Analysis of Social Structure), S95-S120. Retrieved from http://www.jstor.org/stable/2780243
Coley, R. L., Kuo, F. E., & Sullivan, W. C. (1997). Where does community grow? The social context created by nature in urban public housing. Environment and Behavior, 29, 468-494. doi:10.1177/001391659702900402
Dillman, D. A., Smyth, J. D., & Christian, L. M. (2009). Internet, mail, and mixed-mode surveys: The tailored design method. Hoboken, NJ: Wiley & Sons. Retrieved from http://books.google.com/books?id=s1naAAAAMAAJ&pgis=1
Donovan, G., Michael, Y., & Butry, D. (2011). Urban trees and the risk of poor birth outcomes. Health & Place, 17, 390-393. doi:10.1016/j.healthplace.2010.11.004
Donovan, G., & Prestemon, J. (2012). The effect of trees on crime in Portland, Oregon. Environment and Behavior, 44, 3-30. doi:10.1177/0013916510383238
Greenspace Scotland. (2008). Health impact assessment of greenspace: A guide. Stirling: Author.
Groenewegen, P. P., van den Berg, A. E., de Vries, S., & Verheij, R. A. (2006). Vitamin G: Effects of green space on health, well-being, and social safety. BMC public health, 6, Article 149. doi:10.1186/1471-2458-6-149
Grove, J. M., Cadenasso, M. L., Burch, W. R. Jr., Pickett, S. T. A., Schwarz, K., Neil-dunne, J. O., . . .Boone, C. (2006). Data and methods comparing social structure and vegetation structure of urban neighborhoods in Baltimore, Maryland. Society & Natural Resources, 19, 117-136.
Halpern, D. (2005). Social capital. Cambridge, MA: Polity Press.Hanifan, L. J. (1916). The rural American community center. The ANNALS of the
American Academy of Political and Social Science, 67(130), 130-138. Retrieved from http://www.jstor.org/stable/1013498
Heynen, N. C., & Lindsey, G. (2003). Correlates of urban forest canopy cover: Implications for local public works. Public Works Management Policy, 8(33), 33-47. doi:10.1177/1087724X03253604
Jacobs, J. (1961). Death and life of great American cities. New York, NY: Random House.
Jones, R., Davis, K., & Bradford, J. (2013). The value of trees: Factors influencing homeowner support for protecting local urban trees. Environment and Behavior, 45, 650-676. doi:10.1177/0013916512439409
Kaplan, R. (2001). The nature of the view from home: Psychological benefits. Environment and Behavior, 33, 507-542. doi:10.1177/00139160121973115
Kaplan, R., & Kaplan, S. (1989). The experience of nature: A psychological perspec-tive. New York, NY: Cambridge University Press. (Republished, 1995 in Ann Arbor, MI: Ulrich’s Books Inc.)
at Yale University Library on January 31, 2014eab.sagepub.comDownloaded from

Holtan et al 21
Kaplan, S. (1995). The urban forest as a source of psychological well-being. In G. A. Bradley (Ed.), Urban forest landscapes: Integrating multidisciplinary per-spectives. Seattle: University of Washington Press. Retrieved from http://books.google.com/books?hl=en&lr=&id=PfxEX4UkTbEC&pgis=1
Kennedy, B. P., Kawachi, I., Prothrow-Stith, D., Lochner, K., & Gupta, V. (1998). Social capital, income inequality, and firearm violent crime. Social Science Medicine, 47, 7-17. Retrieved from http://www.sciencedirect.com/science/arti-cle/pii/S0277953698000975
Kuo, F. E., Bacaicoa, M., & Sullivan, W. C. (1998). Transforming inner-city land-scapes: Trees, sense of safety, and preference. Environment and Behavior, 30, 28-59.
Kuo, F. E., & Sullivan, W. (2001). Environment and crime in the inner city: Does vegetation reduce crime? Environment and Behavior, 33, 343-367. doi:10.1177/0013916501333002
Kuo, F. E., Sullivan, W. C., Coley, R. L., & Brunson, L. (1998). Fertile ground for community: Inner-city neighborhood common spaces. Journal of Community Psychology, 26, 823-851. doi:10.1023/A:1022294028903
Kweon, B. S., Sullivan, W. C., & Wiley, A. W. (1998). Green common spaces and the social integration of inner-city older adults. Environment and Behavior, 30, 832-858. doi:10.1177/001391659803000605
Lee, A. C. K., & Maheswaran, R. (2011). The health benefits of urban green spaces: A review of the evidence. Journal of Public Health, 33, 212-222. doi:10.1093/pubmed/fdq068
Leslie, E., Cerin, E., DuToit, L., Owen, N., & Bauman, A. (2007). Objectively assessing “walkability” of local communities: Using GIS to identify the relevant environmental attributes. In P. C. Lai & A. S. H. Mak (Eds.), GIS for health and the environment development in the Asia Pacific region (pp. 91-104). doi:10.1007/978-3-540-71318-0_7
Leyden, K. M. (2003). Social capital and the built environment: The importance of walkable neighborhoods. American Journal of Public Health, 93, 1546-1551. doi:10.2105/AJPH.93.9.1546
Lindström, M. (2011). Social capital, desire to increase physical activity and leisure-time physical activity: A population-based study. Public Health, 125, 442-447. doi:10.1016/j.puhe.2011.01.015
Maas, J., van Dillen, S. M. E., Verheij, R., & Groenewegen, P. P. (2009). Social contacts as a possible mechanism behind the relation between green space and health. Health & Place, 15, 586-595. doi:10.1016/j.healthplace.2008.09.006
Maas, J., Verheij, R. A, Groenewegen, P. P., de Vries, S., & Spreeuwenberg, P. (2006). Green space, urbanity, and health: How strong is the relation? Journal of Epidemiology & Community Health, 60, 587-592. doi:10.1136/jech.2005.043125
Mansfield, C., Pattanayak, S. K., McDow, W., McDonald, R., & Halpin, P. (2005). Shades of Green: Measuring the value of urban forests in the housing market. Journal of Forest Economics, 11, 177-199. doi:10.1016/j.jfe.2005.08.002
Martin, C. A., Warren, P. S., & Kinzig, A. P. (2004). Neighborhood socioeconomic status is a useful predictor of perennial landscape vegetation in residential
at Yale University Library on January 31, 2014eab.sagepub.comDownloaded from

22 Environment and Behavior
neighborhoods and embedded small parks of Phoenix, AZ. Landscape and Urban Planning, 69, 355-368. doi:10.1016/j.landurbplan.2003.10.034
Mcpherson, E. G., Nowak, D. J., & Rowntree, R. A. (1994). Chicago’s urban forest ecosystem: Results of the Chicago urban forest climate project. Retrieved from http://www.nrs.fs.fed.us/pubs/gtr/gtr_ne186.pdf
Park, B. J., Tsunetsugu, Y., Kasetani, T., Kagawa, T., & Miyazaki, Y. (2010). The physiological effects of Shinrin-yoku (taking in the forest atmosphere or forest bathing): Evidence from field experiments in 24 forests across Japan. Environmental Health and Preventive Medicine, 15, 18-26. Retrieved from http://www.pubmedcentral.nih.gov/articlerender.fcgi?artid=2793346&tool=pmcentrez&rendertype=abstract
Portes, A. (1998). Social capital: Its origins and applications in modern sociology. Annual Review of Sociology, 24, 1-24. Retrieved from http://www.jstor.org/stable/223472
Putnam, R. (2000). Bowling alone: The collapse and revival of American community. New York, NY: Simon & Shuster.
Rogers, S. H., Halstead, J. M., Gardner, K. H., & Carlson, C. H. (2010). Examining walkability and social capital as indicators of quality of life at the municipal and neighborhood scales. Applied Research Quality of Life, 6, 201-213. doi:10.1007/s11482-010-9132-4
Roth, P., & Switzer, F. (1999). Missing data: Instrument-level Heffalumps and item-level Woozles (Vol. 4). Research Methods Forum. Retrieved from http://division.aomonline.org/rm/1999_RMD_Forum_Missing_Data.htm
Smardon, R. C. (1988). Perception and aesthetics of the urban environment: Review of the role of vegetation. Landscape and Urban Planning, 15, 85-106.
Smith, K. R., Brown, B. B., Yamada, I., Kowaleski-Jones, L., Zick, C. D., & Fan, J. X. (2008). Walkability and body mass index: Density, design, and new diversity measures. American. Journal of Preventive Medicine, 35, 237-244.
Sullivan, W. C., Kuo, F. E., & Depooter, S. F. (2004). The fruit of urban nature: Vital neighborhood spaces. Environment and Behavior, 36, 678-700. doi:10.1177/0193841X04264945
Taormina, R. J., Kuok, A. C. H., & Wei, W. (2012). Social capital as dehumaniz-ing terminology. Advances in Applied Sociology, 2, 143-148. doi:10.4236/aas-oci.2012.22019
Troy, A., Grove, J. M., & O’Neil-Dunne, J. (2012). The relationship between tree canopy and crime rates across an urban–rural gradient in the greater Baltimore region. Landscape and Urban Planning, 106, 262-270. doi:10.1016/j.landurb-plan.2012.03.010
Ulrich, R. (1984). View through a window may influence recovery from surgery. Science, 224, 420-421. doi:10.1126/science.6143402
U.S. Census Bureau. (2006). American Community Survey 2006 1-year estimates [Data file]. Retrieved from http://factfinder2.census.gov/faces/nav/jsf/pages/index.xhtml
U.S. Census Bureau. (2010a). 2010 decennial census [Data file]. Retrieved from: http://factfinder2.census.gov/faces/nav/jsf/pages/index.xhtml
at Yale University Library on January 31, 2014eab.sagepub.comDownloaded from
http://www.pubmedcentral.nih.gov/articlerender.fcgi?artid=2793346&tool=pmcentrez&rendertype=abstract

Holtan et al 23
U.S. Census Bureau. (2010b). 2010 urban and rural classification main page. US Census Bureau Geography Division. Retrieved from http://www.census.gov/geo/www/ua/2010urbanruralclass.html
U.S. Census Bureau. (2011). American Community Survey 2005 to 2009 5-year esti-mates [Data file]. Social Explorer. Retrieved from http://www.socialexplorer.com/pub/home/home.aspx
U.S. Census Bureau MAF/TIGER Database. (2009). TIGER/Line blockgroup shape-files for Maryland [Data file]. Retrieved from: http://www.census.gov/cgi-bin/geo/shapefiles2009/national-files
Vemuri, A. W. (2010). BES household telephone survey overview. Baltimore Ecosystem Study. Retrieved from http://www.beslter.org/data_Browser.asp
Vemuri, A. W., & Grove, J. M. (2006). Baltimore ecosystem study household tele-phone survey [Data file]. Baltimore, MD: Baltimore Ecosystem Study.
Vemuri, A. W., Grove, J. M., Wilson, M. A., & Burch, W. R. (2011). A tale of two scales: Evaluating the relationship among life satisfaction, social capital, income, and the natural environment at individual and neighborhood levels in metropolitan Baltimore. Environment and Behavior, 43, 3-25. doi:10.1177/0013916509338551
Wilkerson, A., Carlson, N. E., Yen, I. H., & Michael, Y. L. (2011). Neighborhood physical features and relationships with neighbors: Does positive physical envi-ronment increase neighborliness? Environment and Behavior, 44, 595-615. doi:10.1177/0013916511402058
Wood, L., & Giles-Corti, B. (2008). Is there a place for social capital in the psychol-ogy of health and place? Journal of Environmental Psychology, 28, 154-163. doi:10.1016/j.jenvp.2007.11.003
Yamaguchi, M., Deguchi, M., & Miyazaki, Y. (2006). The effects of exercise in forest and urban environments on sympathetic nervous activity of normal young adults. The Journal of International Medical Research, 34, 152-159. Retrieved from http://www.ingentaconnect.com/content/field/jimr/2006/00000034/00000002/art00004
Zhou, W., & Troy, A. (2008). An object oriented approach for analysing and char-acterizing urban landscape at the parcel level. International Journal of Remote Sensing, 29, 3119-3135. doi:10.1080/01431160701469065
Author Biographies
Meghan Holtan recently graduated from the State University of New York College of Environmental Science and Forestry with a master’s degree in environmental sci-ence with a concentration in environmental and community land planning. She works as a planning analyst at Agnew::Beck Consulting, a multidisciplinary firm in Anchorage, Alaska, where her interests include community engagement and environ-mental planning in Alaskan communities.
Susan Dieterlen is an assistant professor of landscape architecture in the College of Environmental Science and Forestry at the State University of New York. Dr. Dieterlen’s research interests include sociocultural issues in the built environment and
at Yale University Library on January 31, 2014eab.sagepub.comDownloaded from

24 Environment and Behavior
postindustrial communities, as well as strengthening connections between landscape architectural research and practice.
William Sullivan is professor of landscape architecture at the University of Illinois where he examines (a) the health benefits of having everyday contact with green places and (b) citizen participation in environmental design. He teaches on campus and at the Danville Correctional Center—a medium and high security prison—and is an active member of the Education Justice Project at Illinois.
at Yale University Library on January 31, 2014eab.sagepub.comDownloaded from