Enviromental Report 2019 - Amazon Web Services
Ongoing Efforts to Ensure Coexistence with the Global Environment The Eisai Group conducts business operations while emphasizing protection of the global environment based on the Eisai Network Companies (ENW) Environmental Protection Policy. By quantitatively assessing resource input and environmental impact of our operations, we strive to reduce our burden on the environment and promote environmental protection activities worldwide. 1 *1 This is an acronym for Environmental, Social and Governance. Today, business development considering these three aspects is regarded as important for a company’s long-term growth. *2 This is an abbreviation of the Task Force on Climate-related Financial Disclosures. This is a climate-related financial information disclosure task force set up by the Financial Stability Board. Eisai Environmental Report 2019 In addition to observing environmental laws and regulations, ordinances and agreements with local governments, the Eisai Group implements more stringent voluntary standards and undertakes business activities to ensure harmony with the global environment. In the course of conducting business activities worldwide, we are working to reduce the environmental impact at each stage of business, while also committing to contributing to the achievement of the UN’s medium-term development plan (SDGs). The Eisai Group, which has signed the United Nations Global Compact, recognizes the importance of protecting the global environment and executes its social responsibilities from an environmental perspective. In fiscal 2018, the Eisai Group set SBT (Science Based Targets: Targets for reducing greenhouse gas (GHG) emissions based on scientific grounds) toward fiscal 2030. We submitted these targets to SBTi (Science Based Targets initiative) in March 2019 and SBTi subsequently approved them in May 2019. Going forward, we will strengthen our initiatives for reducing GHG emissions and will contribute to mitigating global warming from a medium- to-long-term perspective. Recently, global companies are being asked to undertake business activities giving consideration to the sustainable development of society. Above all, climate change is seen as the most important ESG *1 issue. In June 2019, the Eisai Group expressed support for TCFD *2 recommendations with the aims of considering climate-related financial risks and opportunities in business activities as well as strengthening governance and publicly disclosing company information. In the future, we will respond to ESG issues while undertaking the global development of our healthcare business, which gives first thoughts to patients and their families. Promoting Environmental Activities for the Sustainable Development of Society Fundamental Environmental Protection Policy Eisai and its Group companies (hereafter ENW) place global environmental protection as an important component of business operations and strive to maintain the environment. Environmental Protection Guidelines 1. ENW is aware of the “dignity and importance of nature” and adopts measures to maintain the global environment in all business operations. 2. ENW places environmental protection as a top priority at all stages of corporate activities from research and development, production, distribution and sales to product usage and disposal. 3. ENW constructs and operates an environmental management system and promotes environmentally protective operations. 4. ENW complies with all applicable laws, regulations and agreements concerning environmental protection, and each company implements voluntary standards that exceed the minimum standards set forth in the applicable laws, regulations and agreements. 5. ENW actively introduces advanced environmental technology to be at the forefront of reducing environmental impacts. 6. ENW reduces usage of resources and energy as well as reduces or recycles waste products in all business operations. 7. ENW reduces usage and promotes the removal of chemical substances that cause environmental pollutant emission and prevents environmental pollution. 8. ENW shares the fundamental policy on environmental protection and implements educational training to strengthen specialties at each workplace progressively and continuously. 9. ENW actively discloses information on policies, objectives, programs and results concerning environmental protection. Eisai Network Companies (ENW) Environmental Protection Policy
Transcript of Enviromental Report 2019 - Amazon Web Services

Ongoing Efforts to Ensure Coexistence with the Global EnvironmentThe Eisai Group conducts business operations while emphasizing protection of the global environment based on the Eisai Network Companies (ENW) Environmental Protection Policy. By quantitatively assessing resource input and environmental impact of our operations, we strive to reduce our burden on the environment and promote environmental protection activities worldwide.
1
*1 This is an acronym for Environmental, Social and Governance. Today, business development considering these three aspects is regarded as important for a company’s long-term growth.
*2 This is an abbreviation of the Task Force on Climate-related Financial Disclosures. This is a climate-related financial information disclosure task force set up by the Financial Stability Board.
Eisai Environmental Report 2019
In addition to observing environmental laws and regulations, ordinances and agreements with local governments, the Eisai Group implements more stringent voluntary standards and undertakes business activities to ensure harmony with the global environment. In the course of conducting business activities worldwide, we are working to reduce the environmental impact at each stage of business, while also committing to contributing to the achievement of the UN’s medium-term development plan (SDGs). The Eisai Group, which has signed the United Nations Global Compact, recognizes the importance of protecting the global environment and executes its social responsibilities from an environmental perspective.
In fiscal 2018, the Eisai Group set SBT (Science Based Targets: Targets for reducing greenhouse gas (GHG) emissions based on scientific grounds) toward fiscal 2030. We submitted these targets to SBTi (Science Based Targets initiative) in March 2019 and SBTi subsequently approved them in May 2019. Going forward, we will strengthen our initiatives for reducing GHG emissions and will contribute to mitigating global warming from a medium- to-long-term perspective.
Recently, global companies are being asked to undertake business activities giving consideration to the sustainable development of society. Above all, climate change is seen as the most important ESG*1 issue. In June 2019, the Eisai Group expressed support for TCFD*2 recommendations with the aims of considering climate-related financial risks and opportunities in business activities as well as strengthening governance and publicly disclosing company information. In the future, we will respond to ESG issues while undertaking the global development of our healthcare business, which gives first thoughts to patients and their families.
Promoting Environmental Activities for the Sustainable Development of Society
Fundamental Environmental Protection Policy
Eisai and its Group companies (hereafter ENW) place global environmental protection as an important component of business operations and strive to maintain the environment.
Environmental Protection Guidelines
1. ENW is aware of the “dignity and importance of nature” and adopts measures to maintain the global environment in all business operations.
2. ENW places environmental protection as a top priority at all stages of corporate activities from research and development, production, distribution and sales to product usage and disposal.
3. ENW constructs and operates an environmental management system and promotes environmentally protective operations.
4. ENW complies with all applicable laws, regulations and agreements concerning environmental protection, and each company implements voluntary standards that exceed the minimum standards set forth in the applicable laws, regulations and agreements.
5. ENW actively introduces advanced environmental technology to be at the forefront of reducing environmental impacts.
6. ENW reduces usage of resources and energy as well as reduces or recycles waste products in all business operations.
7. ENW reduces usage and promotes the removal of chemical substances that cause environmental pollutant emission and prevents environmental pollution.
8. ENW shares the fundamental policy on environmental protection and implements educational training to strengthen specialties at each workplace progressively and continuously.
9. ENW actively discloses information on policies, objectives, programs and results concerning environmental protection.
Eisai Network Companies (ENW) Environmental Protection Policy

2
●Kawashima Plant (Gifu)●Kashima Plant (Ibaraki)●Tsukuba Research Laboratories (Ibaraki)●KAN Research Institute (Hyogo)●EA Pharma Co., Ltd., Fukushima Plant (Fukushima)●EA Pharma Co., Ltd., Drug Discovery Research Institute (Kanagawa)
●Bogor Plant (Indonesia)
Suzhou Plant (China)●
●
Benxi Plant (China)●
Eisai Knowledge Centre, India (India)
●European Knowledge Centre (United Kingdom)
Andover Research Institute (United States)●●H3 Biomedicine Inc. (United States)●Baltimore Plant (United States)
Morphotek Inc. (United States)●
Manufacturing and Drug Discovery Research Sites Worldwide
Editorial Policy
This report describes the Eisai Group’s approach toward environmental protection and provides details of environmental activities undertaken during fiscal 2018. The report has been developed in reference to the Environmental Reporting Guidelines (2018 Version) issued by Japan’s Ministry of the Environment and includes Eisai’s efforts both in and outside Japan.
Scope of Reporting
The scope of data aggregation in this report primarily covers Eisai Co., Ltd. and its Group companies in Japan as well as its production sites and research centers outside Japan. The scope of individual data is specified as needed.
Period Covered
The data has been aggregated based on the results achieved from April 1, 2018 to March 31, 2019.
Inquiries
For inquiries regarding this report, please contact:Eisai Co., Ltd.General Affairs and Environmental & Safety Affairs DepartmentTel: +81-3-3817-5358Fax: +81-3-3811-9982

3
Glossary and CO2 Emissions Coefficient
Glossary Energy Consumption and CO2 Emissions Coefficient Used in Emissions Calculations
Term Description
ISO 14001An international standard for environmental management issued by the International Organization for Standardization
EA21EcoAction 21: An environmental management system certification for small- and medium-sized enterprises issued by Japan’s Ministry of the Environment
PRTR
Pollutant Release and Transfer Register: A system for understanding, collecting and publicly disclosing information on the extent to which chemical substances involving environmental risk are either released into the environment or are contained in waste matter and transferred from operational sites
Act on Controlling Emissions of
Fluorocarbons
The abbreviated title of the Act on Rational Use and Proper Management of Fluorocarbons. The purpose of the act is to prevent the leakage of fluorocarbons that cause depletion of the ozone layer or global warming at each stage from production to disposal.
SOx Sulfur oxides
NOx Nitrogen oxides
BODBiochemical oxygen demand: A measure used to evaluate the quality of river water and factory wastewater
Scope 1Energy-derived direct greenhouse gas (GHG) emissions. GHG emissions released directly into the atmosphere through the use of fuels
Scope 2Energy-derived indirect GHG emissions. GHG emissions associated with the use of purchased energy (electricity and heat)
Scope 3Among GHG emissions associated with business activities in a supply chain, these are indirect GHG emissions that exclude the company.
VOCsVolatile organic compounds: Organic compounds that are volatile at ordinary temperatures and cause air pollution through the generation of photochemical oxidants
Zero emissionsThe Eisai Group uses this term as a target of emission management. It indicates a ratio of waste sent to landfill to total waste of less than 1.0%
Energy typeCalorific value per unit CO2 emissions coefficient
FY2018 In and after FY2013 In and before FY2012
Electric power 9.97 (GJ/MWh) Note
LPG 50.1 (GJ/tons) 3.01 (tons/tons) 3.00 (tons/tons)
LNG 54.5 (GJ/tons)*1 2.76 (tons/tons)*1 2.70 (tons/tons)
Natural gas 40.5 (GJ/1,000 Nm3)*1 2.07 (tons/1,000 Nm3)*1 2.22 (tons/1,000 Nm3)
Processed natural gas 41.2 (GJ/1,000 Nm3)*1 2.12 (tons/1,000 Nm3)*1 2.23 (tons/1,000 Nm3)
Kerosene 36.5 (GJ/kl) 2.50 (tons/kl) 2.49 (tons/kl)
Light oil 38.1 (GJ/kl) 2.62 (tons/kl) 2.59 (tons/kl)
Fuel oil A 38.9 (GJ/kl) 2.76 (tons/kl) 2.71 (tons/kl)
Gasoline 33.1 (GJ/kl) 2.28 (tons/kl) 2.32 (tons/kl)
Industrial steam 1.02 (GJ/GJ) 0.06 (tons/GJ)*2
Hot water and cold water
1.36 (GJ/GJ) 0.057 (tons/GJ)
Note: Emissions in Japan up until fiscal 2014 are calculated using the emissions coefficient announced by the Federation of Electric Power Companies of Japan (FEPC). Calculations from fiscal 2015 use the emissions coefficient reported by the Electric Power Council for a Low Carbon Society. In calculating emissions outside Japan, the emissions coefficient is taken from the following source. However, the coefficient for fiscal 2015 is used to calculate emissions for fiscal 2016 and 2018, since corresponding figures are not available from the source. IEA: CO2 EMISSIONS FROM FUEL COMBUSTION (2017)
*1 Revised based on the “Revised Standard Calorific Value and Carbon Emission Factor” within General Energy Statistics.*2 Changed to coefficients under the Energy Saving Act.
4
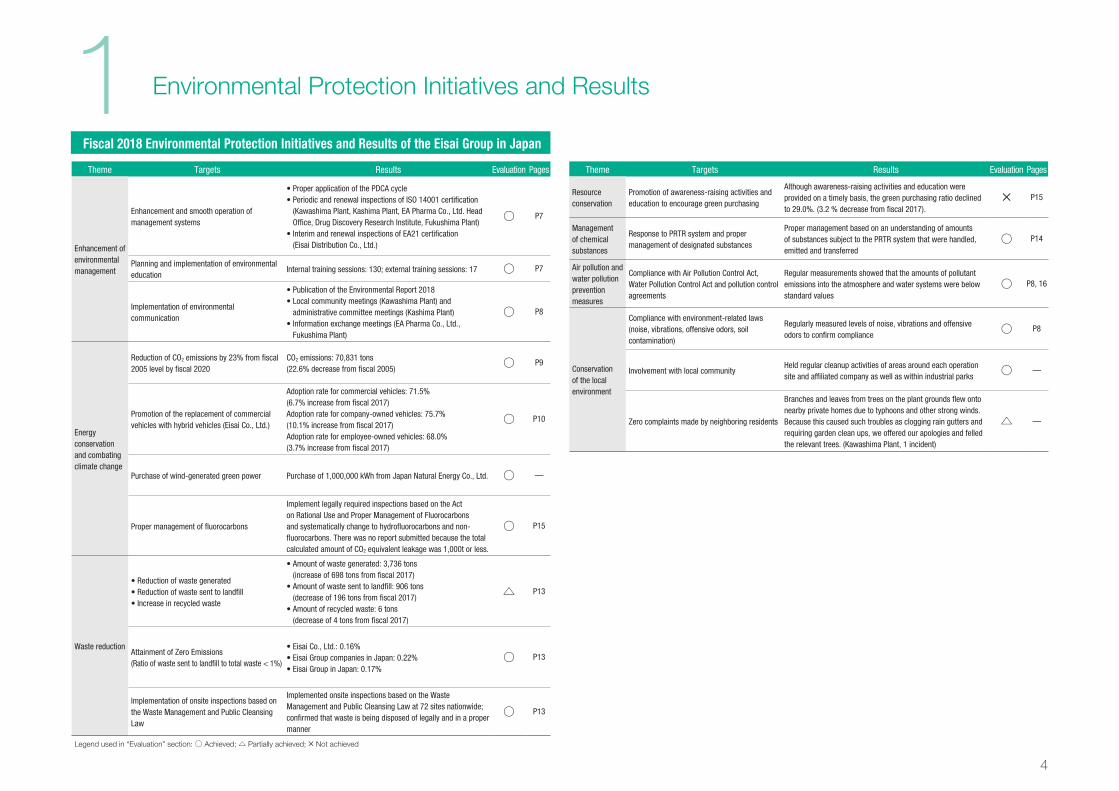
Environmental Protection Initiatives and Results
Fiscal 2018 Environmental Protection Initiatives and Results of the Eisai Group in Japan
1Theme Targets Results Evaluation Pages
Enhancement of environmental management
Enhancement and smooth operation of management systems
• Proper application of the PDCA cycle• Periodic and renewal inspections of ISO 14001 certification
(Kawashima Plant, Kashima Plant, EA Pharma Co., Ltd. Head Office, Drug Discovery Research Institute, Fukushima Plant)
• Interim and renewal inspections of EA21 certification (Eisai Distribution Co., Ltd.)
○ P7
Planning and implementation of environmental education
Internal training sessions: 130; external training sessions: 17 ○ P7
Implementation of environmental communication
• Publication of the Environmental Report 2018• Local community meetings (Kawashima Plant) and
administrative committee meetings (Kashima Plant)• Information exchange meetings (EA Pharma Co., Ltd.,
Fukushima Plant)
○ P8
Energy conservation and combating climate change
Reduction of CO2 emissions by 23% from fiscal 2005 level by fiscal 2020
CO2 emissions: 70,831 tons(22.6% decrease from fiscal 2005)
○ P9
Promotion of the replacement of commercial vehicles with hybrid vehicles (Eisai Co., Ltd.)
Adoption rate for commercial vehicles: 71.5%(6.7% increase from fiscal 2017)Adoption rate for company-owned vehicles: 75.7%(10.1% increase from fiscal 2017)Adoption rate for employee-owned vehicles: 68.0%(3.7% increase from fiscal 2017)
○ P10
Purchase of wind-generated green power Purchase of 1,000,000 kWh from Japan Natural Energy Co., Ltd. ○ —
Proper management of fluorocarbons
Implement legally required inspections based on the Act on Rational Use and Proper Management of Fluorocarbons and systematically change to hydrofluorocarbons and non-fluorocarbons. There was no report submitted because the total calculated amount of CO2 equivalent leakage was 1,000t or less.
○ P15
Waste reduction
• Reduction of waste generated• Reduction of waste sent to landfill• Increase in recycled waste
• Amount of waste generated: 3,736 tons (increase of 698 tons from fiscal 2017)
• Amount of waste sent to landfill: 906 tons (decrease of 196 tons from fiscal 2017)
• Amount of recycled waste: 6 tons (decrease of 4 tons from fiscal 2017)
△ P13
Attainment of Zero Emissions (Ratio of waste sent to landfill to total waste < 1%)
• Eisai Co., Ltd.: 0.16%• Eisai Group companies in Japan: 0.22%• Eisai Group in Japan: 0.17%
○ P13
Implementation of onsite inspections based on the Waste Management and Public Cleansing Law
Implemented onsite inspections based on the Waste Management and Public Cleansing Law at 72 sites nationwide; confirmed that waste is being disposed of legally and in a proper manner
○ P13
Legend used in “Evaluation” section: ○ Achieved; △ Partially achieved; × Not achieved
Theme Targets Results Evaluation Pages
Resource conservation
Promotion of awareness-raising activities and education to encourage green purchasing
Although awareness-raising activities and education were provided on a timely basis, the green purchasing ratio declined to 29.0%. (3.2 % decrease from fiscal 2017).
× P15
Management of chemical substances
Response to PRTR system and proper management of designated substances
Proper management based on an understanding of amounts of substances subject to the PRTR system that were handled, emitted and transferred
○ P14
Air pollution and water pollution prevention measures
Compliance with Air Pollution Control Act, Water Pollution Control Act and pollution control agreements
Regular measurements showed that the amounts of pollutant emissions into the atmosphere and water systems were below standard values
○ P8, 16
Conservation of the local environment
Compliance with environment-related laws (noise, vibrations, offensive odors, soil contamination)
Regularly measured levels of noise, vibrations and offensive odors to confirm compliance
○ P8
Involvement with local communityHeld regular cleanup activities of areas around each operation site and affiliated company as well as within industrial parks
○ —
Zero complaints made by neighboring residents
Branches and leaves from trees on the plant grounds flew onto nearby private homes due to typhoons and other strong winds. Because this caused such troubles as clogging rain gutters and requiring garden clean ups, we offered our apologies and felled the relevant trees. (Kawashima Plant, 1 incident)
△ —

OUTPUTEnvironmental Impact
TotalGroup companies in JapanEisai Co., Ltd.
TotalEisai Co., Ltd. Group companies in Japan TotalGroup companies
in JapanEisai Co., Ltd.
TotalGroup companies in JapanEisai Co., Ltd.
INPUTResource Input
Energy
Electric power (MWh)
LPG (tons)
Processed natural gas (1,000 Nm3)
Kerosene (kl)
Light oil (kl)
Gasoline (kl)
Fuel oil A (kl)
Industrial steam (GJ)
Hot water (GJ)
Cold water (GJ)
73,867
41
6,206
0
5
1,157
30
50,380
0
169
24,099
972
437
52
16
486
0
0
0
0
97,967
1,013
6,643
52
20
1,643
30
50,380
0
169
Water
Water consumption (1,000m3)
Clean water (1,000m3)
Industrial water (1,000m3)
Groundwater (1,000m3)
Desalinated water (1,000m3)
Recycled water (1,000m3)
2,598
143
1
2,361
7
87
110
108
0
0
0
2
2,709
250
1
2,361
7
89
TotalGroup companies in JapanEisai Co., Ltd.
Atmospheric Emissions (from operational sites)
CO2 (Scope 1, 2) (tons)
SOx (tons)
NOx (tons)
Soot and dust (tons)
PRTR substances (release into the atmosphere) (tons)
53,044
0.2
9.6
0.4
16
17,787
0.0
0.5
0.0
0.5
70,831
0.2
10.1
0.4
16
PRTR Substances
Total amount handled(including unreported amount)(tons)
TotalGroup companies in JapanEisai Co., Ltd.
233 28 261
TotalGroup companies in JapanEisai Co., Ltd.
Waste
Amount generated (tons)
Amount recycled (tons)
Amount sent to landfill (tons)
Wastewater discharge (1,000m3)
BOD (tons)
Nitrogen (tons)
Phosphorous (tons)
PRTR substances (off-site transfer as waste) (tons)
PRTR substances (release into water bodies) (tons)
3,070
615
5
2,299
5.8
2.3
0.1
130
0.0
665
291
1
66
0.1
0.0
0.0
27.2
0.0
3,736
906
6
2,366
5.9
2.4
0.1
157
0.0
TotalGroup companies in JapanEisai Co., Ltd.
Containers and Packaging Recycling
Recycling of containers and packaging materials (obligatory recycling amount) (tons)
1,714 177 1,891
Exhaust Gas from Vehicles
CO2 emissions from commercial vehicles (tons)
CO2 emissions from business-use vehicles other than commercial vehicles (tons)
2,631
8
1,063
51
3,694
59
Indirect CO2 Emissions (Scope 3*)
Purchased goods and services (tons)
Capital goods (tons)
Fuel- and energy-related activities not included in Scope 1 or 2 (tons)
Transportation and delivery (upstream) (tons)
Waste generated in operations (tons)
Business travel (tons)
Employee commuting (tons)
Transportation and delivery (downstream) (tons)
End of life treatment of sold products (tons)
254,092
36,421
4,168
610
4,237
412
494
1,682
690
94,720
9,064
853
323
811
298
923
688
427
348,812
45,486
5,021
934
5,048
710
1,417
2,371
1,117
Other
Copy paper consumption(10,000 sheets) 1,126
Total
3,281
Group companies in Japan
2,155
Eisai Co., Ltd.
5
Resource Input and Environmental Impact
Resource Input and Environmental Impact Data of the Eisai Group in Japan
2
Note: Due to rounding, the sum of “Eisai Co., Ltd.” and “Group companies in Japan” may not correspond to “Total” for some items.
* Calculations based on the Basic Guidelines on Accounting for Greenhouse Gas Emissions Throughout the Supply Chain, Version 2.3 and the database to account for Greenhouse Gas Emissions of Organizations Throughout the Supply Chain, Version 2.6 (released by the Ministry of the Environment and the Ministry of Economy, Trade and Industry).
6
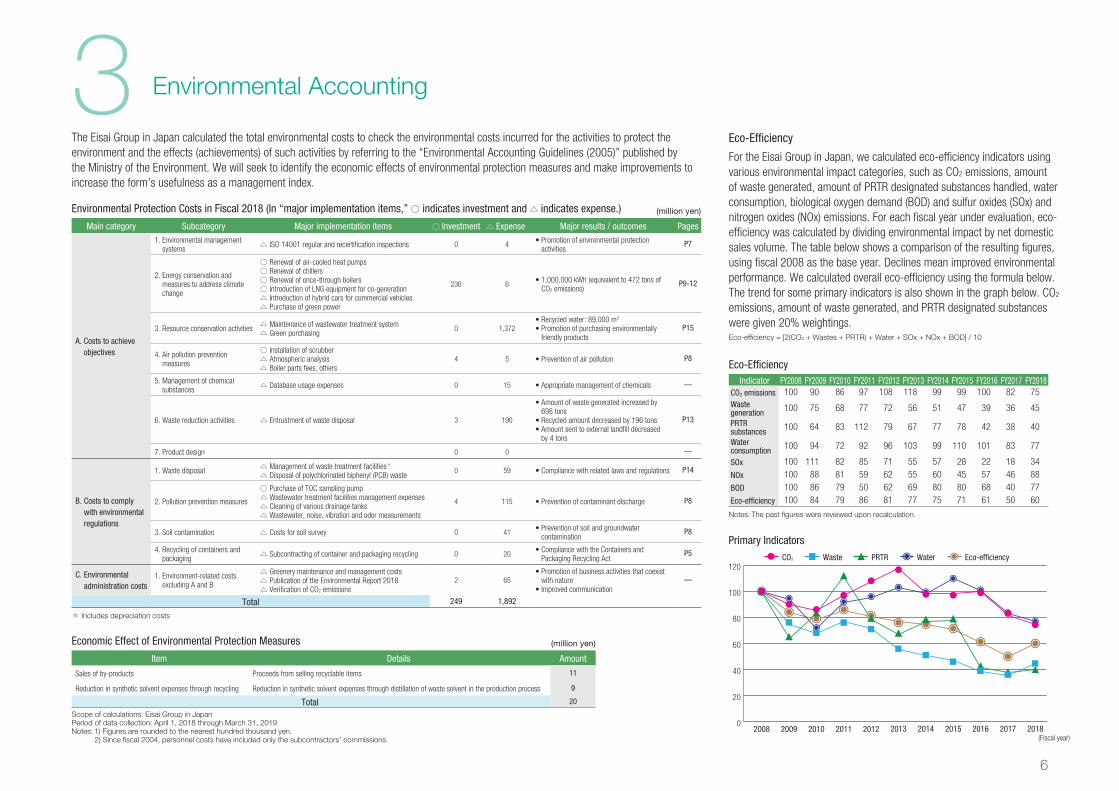
Environmental Accounting3The Eisai Group in Japan calculated the total environmental costs to check the environmental costs incurred for the activities to protect the environment and the effects (achievements) of such activities by referring to the “Environmental Accounting Guidelines (2005)” published by the Ministry of the Environment. We will seek to identify the economic effects of environmental protection measures and make improvements to increase the form’s usefulness as a management index.
Primary Indicators
Environmental Protection Costs in Fiscal 2018 (In “major implementation items,” ○ indicates investment and △ indicates expense.)
Main category Subcategory Major implementation items ○ Investment △ Expense Major results / outcomes Pages
A. Costs to achieve objectives
1. Environmental management systems △ ISO 14001 regular and recertification inspections 0 4
• Promotion of environmental protection activities
P7
2. Energy conservation and measures to address climate change
○ Renewal of air-cooled heat pumps○ Renewal of chillers○ Renewal of once-through boilers○ Introduction of LNG equipment for co-generation△ Introduction of hybrid cars for commercial vehicles△ Purchase of green power
236 6• 1,000,000 kWh (equivalent to 472 tons of
CO2 emissions)P9-12
3. Resource conservation activities △ Maintenance of wastewater treatment system△ Green purchasing
0 1,372• Recycled water: 89,000 m3
• Promotion of purchasing environmentally friendly products
P15
4. Air pollution prevention measures
○ Installation of scrubber△ Atmospheric analysis△ Boiler parts fees, others
4 5 • Prevention of air pollution P8
5. Management of chemical substances △ Database usage expenses 0 15 • Appropriate management of chemicals —
6. Waste reduction activities △ Entrustment of waste disposal 3 190
• Amount of waste generated increased by 698 tons
• Recycled amount decreased by 196 tons• Amount sent to external landfill decreased
by 4 tons
P13
7. Product design 0 0 —
B. Costs to comply with environmental regulations
1. Waste disposal △ Management of waste treatment facilities*
△ Disposal of polychlorinated biphenyl (PCB) waste0 59 • Compliance with related laws and regulations P14
2. Pollution prevention measures
○ Purchase of TOC sampling pump△ Wastewater treatment facilities management expenses△ Cleaning of various drainage tanks△ Wastewater, noise, vibration and odor measurements
4 115 • Prevention of contaminant discharge P8
3. Soil contamination △ Costs for soil survey 0 41• Prevention of soil and groundwater
contaminationP8
4. Recycling of containers and packaging △ Subcontracting of container and packaging recycling 0 20
• Compliance with the Containers and Packaging Recycling Act
P5
C. Environmental administration costs
1. Environment-related costs excluding A and B
△ Greenery maintenance and management costs△ Publication of the Environmental Report 2018△ Verification of CO2 emissions
2 65• Promotion of business activities that coexist
with nature• Improved communication
—
Total 249 1,892
* Includes depreciation costs
(million yen)
Scope of calculations: Eisai Group in JapanPeriod of data collection: April 1, 2018 through March 31, 2019Notes: 1) Figures are rounded to the nearest hundred thousand yen. 2) Since fiscal 2004, personnel costs have included only the subcontractors’ commissions.
Economic Effect of Environmental Protection Measures (million yen)
Item Details Amount
Sales of by-products Proceeds from selling recyclable items 11
Reduction in synthetic solvent expenses through recycling Reduction in synthetic solvent expenses through distillation of waste solvent in the production process 9
Total 20
Eco-Efficiency
For the Eisai Group in Japan, we calculated eco-efficiency indicators using various environmental impact categories, such as CO2 emissions, amount of waste generated, amount of PRTR designated substances handled, water consumption, biological oxygen demand (BOD) and sulfur oxides (SOx) and nitrogen oxides (NOx) emissions. For each fiscal year under evaluation, eco-efficiency was calculated by dividing environmental impact by net domestic sales volume. The table below shows a comparison of the resulting figures, using fiscal 2008 as the base year. Declines mean improved environmental performance. We calculated overall eco-efficiency using the formula below. The trend for some primary indicators is also shown in the graph below. CO2 emissions, amount of waste generated, and PRTR designated substances were given 20% weightings. Eco-efficiency = [2(CO2 + Wastes + PRTR) + Water + SOx + NOx + BOD] / 10
Notes: The past figures were reviewed upon recalculation.
Eco-EfficiencyIndicator FY2008 FY2009 FY2010 FY2011 FY2012 FY2013 FY2014 FY2015 FY2016 FY2017 FY2018
CO2 emissions 100 90 86 97 108 118 99 99 100 82 75Waste generation 100 75 68 77 72 56 51 47 39 36 45
PRTR substances 100 64 83 112 79 67 77 78 42 38 40
Water consumption 100 94 72 92 96 103 99 110 101 83 77
SOx 100 111 82 85 71 55 57 28 22 18 34NOx 100 88 81 59 62 55 60 45 57 46 88BOD 100 86 79 50 62 69 80 80 68 40 77Eco-efficiency 100 84 79 86 81 77 75 71 61 50 60
CO2 WaterWaste PRTR Eco-efficiency
0
60
40
20
80
100
120
2008 2009 2010 2011 2012 2014 2015 20162013 20182017(Fiscal year)

7
The Eisai Group established the Company-Wide Environment and Safety Committee as a decision-making body for deliberation of important environmental issues.
To the present, the committee mainly carried out discussions focused on Japan. However, the committee is now promoting global activities encompassing topics from overseas. We are also strengthening activities for ascertaining environment-related risks and for establishing measures to reduce them.
Moreover, as a consultative body promoting the environmental activities of Group companies in Japan, the Eisai Group also established the Environment and Safety Conference of Group
In order to promote environmental protection activities ensuring coexistence with the global environment, it is important that all employees have a proper understanding of the relationship between their daily work and environmental problems, and that they make efforts to enhance their own individual awareness for problem-solving. At the Eisai Group, operational sites and Group companies voluntarily formulate education programs in accordance with their respective
The Eisai Group has environmental internal audits conducted by a department specializing in internal auditing. This department makes efforts to undertake objective audits from an independent standpoint, and the audits cover all Group companies in and outside Japan. The audits for fiscal 2018 indicated that there were no urgent or serious issues.
External inspections are also carried out once a year at those operational sites and Group companies that have acquired ISO 14001 certification to confirm the validity of their environmental
Environmental Management
Promotion Structure Environmental Education
Internal Audits
business characteristics and local issues. In addition to education targeted at all workers, education is also provided for various levels of employees, along with further efforts to improve the learning content. Furthermore, for the purpose of developing environmental educators and officially qualified employees and improving the level of environmental awareness of individual employees, we also actively promote participation in both internal and external professional training courses.
management systems. During fiscal 2018, no serious material issues were identified by external auditing organizations. Furthermore, these certified operational sites and companies also educate their own internal auditors and seek to raise the level of their audits through training. The results of each annual independent internal audit are reflected in the ongoing improvement of the Group’s environmental management and translate into the enhanced quality of our environmental protection activities.
Companies in Japan to share information and discuss relevant activities.
Each operational site of the Eisai Group has established its own unique management system to promote environmental activities. Eisai’s main production sites in Japan as well as the Suzhou Plant in China and Vizag Plant in India have all acquired ISO 14001 certification and are conducting activities based on the ISO standard while striving to raise awareness through environmental education and environmental risk management training. Besides complying with environmental laws, ordinances and agreements, we periodically conduct internal environmental audits by a department specializing in internal auditing to identify and solve issues.
4
Operational Sites Certified under ISO 14001
●Eisai Co., Ltd., Kawashima Plant and Kashima Plant●EA Pharma Co., Ltd., Fukushima Plant, Drug Discovery Research Institute and Head Office●Eisai China Inc., Suzhou Plant●Eisai Pharmaceuticals India Pvt. Ltd., Vizag Plant
Structure to Promote Environmental Management
* The Eisai Co., Ltd. office complex that serves as the corporate headquarters for the Eisai Group
Eisai Co., Ltd. Operational sites / Headquarters office complex*
Communication officesGroup Companies outside Japan
Corporate Officer Responsible for General Affairs,
Environmental & Safety Affairs
Company-Wide Environment
and Safety Committee
Environment-related meetings
General Affairs and Environmental & Safety
Affairs Department
Environment and Safety Conference of Group Companies in Japan
Group Companies in Japan Environment-related meetings
Specific Projects•Energy Conservation Study Meeting•Waste Processing Study Meeting

8
The Eisai Group in Japan has compiled its procedures for responding to environmental incidents in its Disaster and Accident Response Manual and the Industrial Accident Reporting and Compilation Standards. We aim to minimize damage by collecting accurate information and taking swift and appropriate action and at the same time make every possible effort to prevent recurrence. At production plants and research facilities, in particular, we have been preparing for an emergency by regularly conducting emergency
The Eisai Group in Japan is committed to observing environmental laws and regulations, ordinances and agreements with local governments. In particular, at production plants and research facilities, we regularly measure the environmental burden of causative agents in air pollution and water pollution to check that there are no problems. Also, from the perspective of protecting the neighboring environment, we conducted regular measurements of noise, vibrations and offensive odors at production plants and research facilities and confirmed that these all were below the regulatory values. We also made steady progress in our response to the Act on Rational Use and Proper Management of Fluorocarbons and submitted each type of environmental notification to the relevant authorities without any delay.
In September 2018 the Honjo Facility ceased business. Along with this, from October 2018
In promoting our business activities, mutual understanding and cooperation with the local community is extremely important. As such, the Kawashima Plant has been holding local community meetings every year since 2008 as a platform for sharing information and enhancing communication with the local community. The plant invites neighborhood representatives and government officials to these meetings to introduce its production activities and environmental protection initiatives and also listen directly to participants’ comments and requests to the plant.
Similar initiatives are also undertaken by the Fukushima Plant of EA Pharma Co., Ltd. to share
Environmental Risk Management
Compliance with Laws and Regulations
Environmental Communication
Environmental Incident Report
information on the plant’s environmental and local community contribution activities and cultivate a deeper mutual understanding.
drills assuming, for instance, the leak of hazardous chemical substances from wastewater, exhaust gas or effluents as situations that significantly affect the environment.
Along with these efforts, we issued our own independent guidelines, working to identify sources of risks, and enhancing our risk management structure with a view to further ensuring appropriate environmental risk management Group-wide, including Group companies outside Japan.
through January 2019, we conducted a soil survey based on the Soil Contamination Countermeasures Act and a voluntary groundwater survey. As a result, specified toxic substances exceeding standard values were detected in some soil on the grounds. We reported the results to Saitama Prefecture and received designation as an Area for which Notification Is Required upon Change to Form or Nature.
We coated all contaminated points and implemented anti-scattering measures for the surface soil.
Additionally, upon implementing groundwater testing at the points where contamination was found, we confirmed there were no residual pollutants exceeding standard values. In the future, we will continue to make appropriate responses in accordance with laws, ordinances and regulations under the guidance of Saitama Prefecture.
Environmental Incidents and Countermeasures in Fiscal 2018Environmental
incident Operational site/company Details Response
Leakage Kawashima Plant
Fluorocarbon refrigerant leaked from refrigeration equipment for air conditioning installed at the No. 3 Drug Formulation Building.
After discovering the leakage, we immediately contacted the Kagamihara fire department headquarters. A crack developed in the flare connection part of the refrigerant piping linking the compressor and expansion valve. We believe the main cause of the leakage was metal fatigue in the refrigerant piping that occurred because the anti-vibration rubber was tightened excessively during an overhaul prior to equipment operation. We restored the anti-vibration rubber to a normal state, replaced the damaged piping and refilled the refrigerant. We then confirmed the facility was operating normally and resumed usage.

9
The Eisai Group is working to reduce CO2 emissions from business activities to contribute to climate change mitigation. In particular, the Eisai Group in Japan has steadily implemented a CO2 emission reduction plan toward fiscal 2020. Nonetheless, today there is a need for medium- and long-term GHG reduction initiatives based on scientific grounds to curb the advance of climate change. Accordingly, the Eisai Group has established SBT toward fiscal 2030 as detailed below and has started undertaking related initiatives. These targets have been approved
Establishing SBT (Science Based Targets: Targets for Reducing GreenhouseGas (GHG) Emissions Based on Scientific Grounds)
by the international NGO SBTi. (https://sciencebasedtargets.org/)
Plan for Adopting Renewable EnergyThe Eisai Group has worked to reduce CO2 emissions accompanying our business activities from a CSR perspective. Today even more aggressive reductions are being demanded for climate change mitigation. In the future, we will systematically raise our renewable energy adoption rate and work to further reduce CO2 emissions.
5
State of SBT Progress*
The Eisai Group in Japan is promoting initiatives for the formation of a low-carbon society to help solve the problem of climate change. Eisai Co., Ltd. is participating in the Commitment to a Low Carbon Society initiated by the Federation of Pharmaceutical Manufacturers’ Associations of Japan (FPMAJ), and the Eisai Group in Japan is implementing relevant initiatives based on its own medium-term plan for the reduction of CO2 emissions toward fiscal 2020.
In fiscal 2018, an increase in the volume of production, mainly for anti-cancer agents and anti-epileptic agents, resulted in an increase in energy consumption at plants both in and outside Japan. Nevertheless, the Eisai Group in Japan was able to hold down CO2 emissions to 70,831 tons, a 1.8% increase from the previous fiscal year, by steadily
carrying out energy-saving activities cultivated to the present.
Overseas, energy consumption rose significantly along with an expansion of the Suzhou Plant (China), and this led to an increase in CO2 emissions of around 3,500 tons. On the other hand, the Vizag Plant (India) began purchasing solar power from outside the company in September 2018. This resulted in an approximately 4,000 ton decrease in CO2 emissions and contributed significantly to a reduction of CO2 emissions for the entire Eisai Group. Total emissions for the Eisai Group combining domestic Group and overseas plants and research laboratories were held to a 1.6% increase from the previous fiscal year.
Initiatives toward the Formation of a Low-Carbon Society
• A 30% reduction in GHG emissions (scope 1+2) by fiscal 2030 compared with fiscal 2016
• A 30% reduction in GHG emissions (within scope 3, emissions from purchased products and services) by fiscal 2030 compared with fiscal 2016
Scope 1: GHG emissions released directly into the atmosphere through the use of fuels
Scope 2: GHG emissions associated with the use of purchased energy (electricity and heat)
Scope 3: Indirect GHG emissions in the supply chain excluding the company
* Scope 2 emissions are calculated based on a market-based method.
Efforts toward the SDGs
Formation of a Low-Carbon Society
0
20,000
40,000
60,000
80,000
100,000
120,000
140,000
160,000
2016 2017 2018
134,547 134,547133,282 135,984
132,017140,417
(t)
(Fiscal year)(Fiscal year)
Planned emissions Emissions results
0
100,000
200,000
300,000
400,000
500,000
Emissions results
2016 2017
430,251 447,608 452,453
(t)
2018 (Fiscal year)
Cumulative emissions results
2018 (Fiscal year)2016 2017
134,547134,547
267,829
270,531
399,847
410,948
(t)
0
100,000
200,000
300,000
400,000
500,000
Planned cumulative CO2 emissions
50
60
70
80
90
100
70.4
2016 2017
79.874.6
(t/million yen)
2018 (Fiscal year)
Eisai Group in Japan CO2 Emissions *1Notes: Historical data was
revised along with a change in emission factors (Refer to page 3).
*1 Emissions from commercial vehicles are not included.
Trends in scope (1+2) CO2 emissions
Scope 3 CO2 emissions (Category 1)
Trends in scope (1+2) cumulative CO2 emissions
Renewable energy adoption target
Scope 3 CO2 emissions (Category 1)/net sales
2018 20192016 202020172015
3.8
16.0
28.0
0.6 0.6
(%)
0
10
20
30
2021 (Fiscal year)
20050
20,000
40,000
60,000
80,000
120,000
100,000
2010 2011 2012 2013 2014 20162015 2017
91,558
73,66372,299
91,98882,494
93,119
76,953
101,815
69,610 70,831
(t) Eisai Co., Ltd. Group companies in Japan
2018 (Fiscal year)

10
Eisai Co., Ltd. also undertakes efforts to reduce CO2 emissions from sales operations. The replacement of commercial vehicles with hybrid vehicles (HV) has been proceeding steadily, and in principle, a changeover to HVs is required when purchasing new vehicles since 2010. The adoption rate of HVs rose 6.7% to 71.5% in fiscal 2018, and CO2 emissions originating from commercial vehicles decreased 15.2% from fiscal 2017 to 2,631 tons. We will continue shifting to more fuel-efficient vehicles as part of our efforts to further reduce emissions.
Efforts concerning Commercial Vehicles
Commercial Vehicles CO2 Emissions
Commercial Vehicles CO2 Emissions (Trends in Emissions by Region)
The Eisai Group in Japan strives to save electricity throughout the year, not only during the power-saving campaigns held in summer and winter. Offices, including administration and sales offices, are trying to save power through such means as controlling the temperature of air-conditioning systems, turning off lights when not in use and shutting down computers and others when employees leave their seats for a while. At large buildings, we have installed demand controllers to control peak power. We are also focusing on raising employee awareness of reducing power by implementing regular energy-saving patrols and visualizing actual power savings achieved. CO2 emissions originating from office activities of the Eisai Group in Japan in fiscal 2018 totaled 2,972
tons, a 9.9% decrease from fiscal 2017.
Efforts Undertaken at Offices
CO2 Emissions by Region*2, *3
Region Scope 1 Scope 2 Total
Japan 22,965 51,620 74,585
Asia 9,414 21,262 30,676
U.S. 9,668 15,461 25,129
EMEA 6,217 4,845 11,062
(tons)
*2 Including emissions from vehicles for commercial use in and outside Japan*3 Including emissions from business activities at offices in and outside Japan
Office Activities CO2 Emissions (Eisai Group in Japan)
Notes: Past data was revised along with a change in emission factors (Refer to page 3).
0
1,000
2,000
3,000
4,000
5,000(t)
2013 2015 20162014 2017 2018
4,511
3,981
3,4393,705
3,3002,972
(Fiscal year)
CO2 Emissions Breakdown by Scope (Scopes 1 and 2, Eisai Group)
Scope 1 Scope 2 Total
Production plants 23,055 55,680 78,735
Research facilities 11,164 24,736 35,900
Offices 2,468 10,039 12,508
Warehouse 153 2,732 2,886
Vehicles for commercial and other business use 11,424 — 11,424
Total 48,264 93,187 141,453
(tons)
20152014 2016 2017 2018 (Fiscal year)
(CO2/t) (%)
0
1,000
3,000
2,000
4,000
5,000
6,000
0
10
20
30
40
50
80
70
60
CO2 emissions
Hybrid vehicle adoption rate
59.8
62.3
52.3
64.871.5
4,7285,190
3,786
3,1022,631
ChinaJapan Asia/Latin America U.S. EMEA0
1,000
3,000
2,000
4,000
5,000
6,000 2016 Fiscal year 2017 Fiscal year 2018 Fiscal year
73 18 19
5,082
4,319
3,694
1,256
2,7722,419
1,317
2,3172,761 2,830
2,0092,457
(t)
Eisai Group CO2 Emissions *1Notes: Past data was revised
along with a change in emission factors (Refer to page 3).
*1 Emissions from business activities at offices outside Japan are not included.
0
60,000
20,00040,000
100,000
80,000
120,000
140,000
160,000
180,000(CO2/t)
120,224125,071
145,239157,889 164,448
143,731
168,914
118,625 120,562
2010 2011 2012 20142013 20162015 2017 2018 (Fiscal year)
Eisai Group in Japan Overseas operational sites

11
The Eisai Group recognizes that raising resilience toward climate change-related business impacts in addition to reducing CO2 emissions accompanying business activities are essential for continuing to fulfill our corporate social responsibilities as a pharmaceutical company. This is why we expressed our support for the recommendations of the Task Force on Climate-related Financial Disclosures
(TCFD)* in June 2019, and we are also performing analyses of climate-related risks and opportunities utilizing the TCFD framework. By accurately ascertaining the impacts of climate change on business over the medium and long terms, we will effectively work to reduce risk and create opportunities and sequentially expand and upgrade information disclosure.
Enhancing Resilience to Climate Change-related Risk and Performing Analyses of Climate Change Impacts Utilizing the TCFD Framework
GovernanceOur structure to promote environmental protection is as shown in “4. Environmental Management.” Regarding climate-related risks and opportunities, Eisai also launched a cross-organizational project, with the Corporate Officers in charge of General Affairs and Environmental and Safety Affairs as the overall persons in charge. This project will identify climate-related risks and opportunities. In the future, we will consider strategies for raising resilience and climate-related risk management.
StrategyEisai recognizes that climate-related risks and opportunities are important elements for consideration in strategy formulation. The World Health Organization (WHO) forecasts an increase in tropical diseases due to climate change and Eisai is pushing ahead with the development of pharmaceuticals for malaria and neglected tropical diseases (NTDs).
The chart below shows the results of analysis as well as countermeasures regarding climate-related risks and opportunities in Eisai’s business and supply chain. In the future, Eisai plans to perform detailed analysis of items considered to be of even higher risk while promoting scenario analysis to evaluate long-term climate-related risks and opportunities.
Risk ManagementEisai has begun analyzing the impact of climate change on our business over the medium and long terms. In the future, besides existing risk management activities (CSA: Control Self Assessment), we plan to also carry out centralized management of climate-related risks at the Risk Management Committee.
Metrics and TargetsIn raising resilience to climate change risk as well, we believe it is important to make efforts to reduce GHGs not only at the Company but also throughout our entire supply chain. Climate-related metrics and targets are as shown in “5. Formation of a Low-Carbon Society (pages 9-10).”
* TCFD is a private-sector-led task force for disclosing climate-related financial information and is positioned under the Financial Stability Board (FSB) comprising representatives from the central banks, financial supervisory authorities, ministries of finance and other agencies from 25 main countries and regions. It aims to identify and disclose the financial impact of risks and opportunities arising from climate change and publicly announces its recommendations.
Major climate-related risks and opportunities Response measures
Physical risks
Impediments to production activities and procurement activities due to increases in natural disasters Promote risk analysis and resilience countermeasures for operational sites and suppliers
Supply shortage of pharmaceuticals in the event of a simultaneous occurrence of rising healthcare needs and impediments to production activities due to natural disasters
Strengthen structure for providing stable supplies in times of emergencies
Transition risks
Rises in manufacturing costs and logistics costs due to increased prices for fuels, electric power and other items
Minimize impacts through expansion of renewable energy use
Impact of strengthened environmental regulations on the operations of production plants and suppliers
Strengthen environmental management of plants and suppliers in anticipation of future environmental regulations
Opportunity loss in the case of delayed responses to rising environmental requirements Steady reduction in GHG emissions for the attainment of SBT(* Please refer to page 9 for details.)
Opportunities
Obtain market opportunities by responding to rising healthcare needs due to climate change Develop pharmaceuticals for the treatment of malaria and NTDs
Enhancement of corporate value from outside the company through environmental considerations Promote environmental considerations, coexistence with local communitiesWe are working to protect biodiversity, including the protection of depleted plants, at the Kawashima Plant and The Naito Museum of Pharmaceutical Science and Industry.(* Please refer here for details on The Naito Museum of Pharmaceutical Science and Industry. http://www.eisai.co.jp/museum/english/index.html)
12
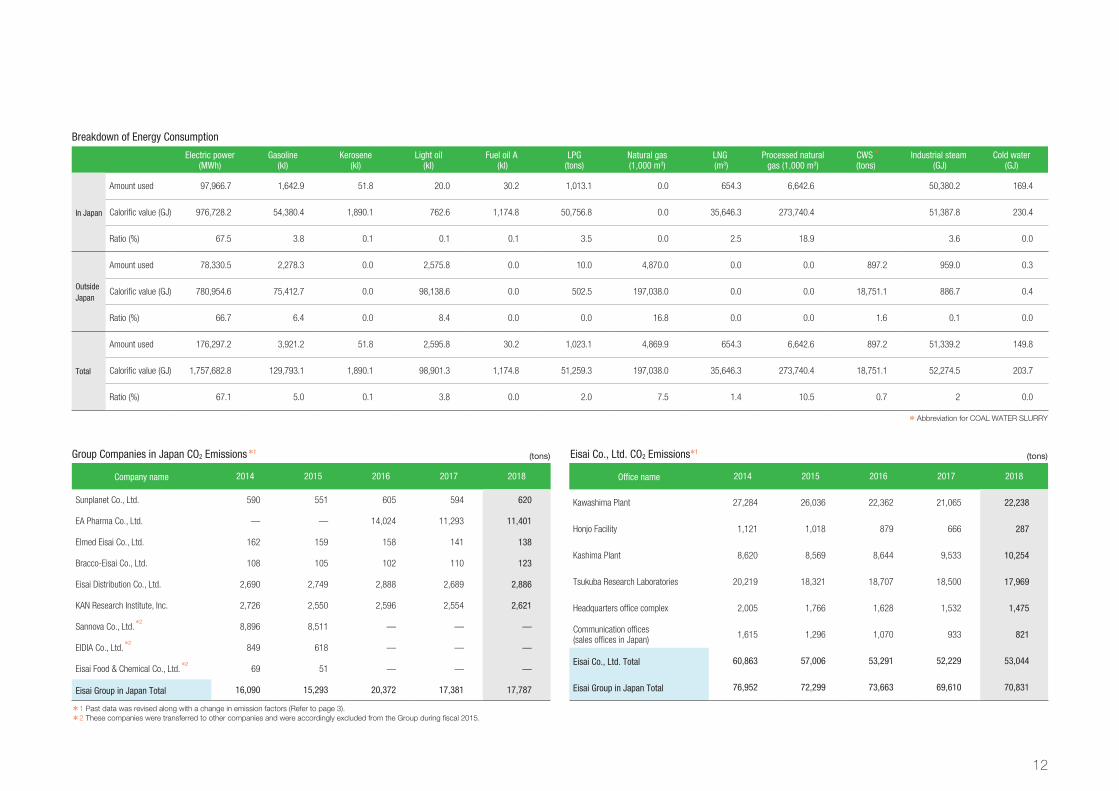
Group Companies in Japan CO2 Emissions *1
Company name 2014 2015 2016 2017 2018
Sunplanet Co., Ltd. 590 551 605 594 620
EA Pharma Co., Ltd. — — 14,024 11,293 11,401
Elmed Eisai Co., Ltd. 162 159 158 141 138
Bracco-Eisai Co., Ltd. 108 105 102 110 123
Eisai Distribution Co., Ltd. 2,690 2,749 2,888 2,689 2,886
KAN Research Institute, Inc. 2,726 2,550 2,596 2,554 2,621
Sannova Co., Ltd.*2
8,896 8,511 — — —
EIDIA Co., Ltd.*2
849 618 — — —
Eisai Food & Chemical Co., Ltd.*2
69 51 — — —
Eisai Group in Japan Total 16,090 15,293 20,372 17,381 17,787
(tons) Eisai Co., Ltd. CO2 Emissions*1
Office name 2014 2015 2016 2017 2018
Kawashima Plant 27,284 26,036 22,362 21,065 22,238
Honjo Facility 1,121 1,018 879 666 287
Kashima Plant 8,620 8,569 8,644 9,533 10,254
Tsukuba Research Laboratories 20,219 18,321 18,707 18,500 17,969
Headquarters office complex 2,005 1,766 1,628 1,532 1,475
Communication offices (sales offices in Japan) 1,615 1,296 1,070 933 821
Eisai Co., Ltd. Total 60,863 57,006 53,291 52,229 53,044
Eisai Group in Japan Total 76,952 72,299 73,663 69,610 70,831
(tons)
Breakdown of Energy Consumption
Electric power (MWh)
Gasoline (kl)
Kerosene (kl)
Light oil (kl)
Fuel oil A (kl)
LPG (tons)
Natural gas (1,000 m3)
LNG (m3)
Processed natural gas (1,000 m3)
CWS *
(tons)Industrial steam
(GJ)Cold water
(GJ)
In Japan
Amount used 97,966.7 1,642.9 51.8 20.0 30.2 1,013.1 0.0 654.3 6,642.6 50,380.2 169.4
Calorific value (GJ) 976,728.2 54,380.4 1,890.1 762.6 1,174.8 50,756.8 0.0 35,646.3 273,740.4 51,387.8 230.4
Ratio (%) 67.5 3.8 0.1 0.1 0.1 3.5 0.0 2.5 18.9 3.6 0.0
Outside Japan
Amount used 78,330.5 2,278.3 0.0 2,575.8 0.0 10.0 4,870.0 0.0 0.0 897.2 959.0 0.3
Calorific value (GJ) 780,954.6 75,412.7 0.0 98,138.6 0.0 502.5 197,038.0 0.0 0.0 18,751.1 886.7 0.4
Ratio (%) 66.7 6.4 0.0 8.4 0.0 0.0 16.8 0.0 0.0 1.6 0.1 0.0
Total
Amount used 176,297.2 3,921.2 51.8 2,595.8 30.2 1,023.1 4,869.9 654.3 6,642.6 897.2 51,339.2 149.8
Calorific value (GJ) 1,757,682.8 129,793.1 1,890.1 98,901.3 1,174.8 51,259.3 197,038.0 35,646.3 273,740.4 18,751.1 52,274.5 203.7
Ratio (%) 67.1 5.0 0.1 3.8 0.0 2.0 7.5 1.4 10.5 0.7 2 0.0
* Abbreviation for COAL WATER SLURRY
*1 Past data was revised along with a change in emission factors (Refer to page 3).*2 These companies were transferred to other companies and were accordingly excluded from the Group during fiscal 2015.

13
Establishment of a Recycling-Oriented Society
Waste Reduction Results in Fiscal 2018
6
Initiative for Recycling Resources
Onsite Inspections of Waste-Processing Companies
Efforts toward the SDGs
The Eisai Group in Japan is working to achieve zero emissions, which involves reducing the ratio of waste sent to landfill to the amount of waste generated to 1% or less, and conducting waste disposal with three goals in mind; specifically, reduce the amount of waste generated, increase the amount of recycled waste and decrease the amount of waste sent to landfill. In fiscal 2018, we attained zero emissions for the 11th consecutive fiscal year; however, the total amount of waste generated increased by 23%. The main cause was an increase in waste sludge, waste oil and waste acids and alkali attributable to an increase in production at the plants in Japan. Moreover, an increase in the entrustment of waste disposal of
waste plastics that were previously sold also led to the increase in waste generated. The amount of waste disposal in Japan increased due to recent waste plastic import restrictions in China and Southeast Asia, and this caused a decrease in the recycling ratio (including valuables sold).
At the same time, we are continuing recycling by undertaking the thorough sorting of waste. We placed priority on recycling by selling wastepaper, valuable metals and plastics in the disposal of waste. Although the amount of waste generated increased significantly from the previous fiscal year, the amount of waste sent to landfill declined 36% from the previous fiscal year and led to the attainment of zero emissions.
In order to promote the establishment of a recycling-oriented society, it is essential to reduce the amount of waste generated in addition to reusing and recycling resources such as metal, glass, waste oil and paper products from waste. Based on this perspective, we actively promote the sale of equipment and devices for reuse as well as the recycling of scrap metal, glass bottles and waste oil. Also, to reduce the total amount of wastepaper, we are promoting the sale of wastepaper while
avoiding generation of unnecessary waste by devising better ways to proceed with meetings and to copy documents. At the Kashima Plant, we have expanded the scope of our efforts to promote the sale of wastepaper in Japan from operational sites and the head office to include sales offices. We also continue to reuse organic solvents, such as those used in the manufacture of active pharmaceutical ingredients, and sell these as auxiliary fuel for waste oil.
The Eisai Group in Japan has been conducting regular onsite inspections of its waste disposal contractors. For the purpose of checking that waste is being disposed of properly, periodic inspections are carried out for contractors engaged in the collection, transport, intermediate processing and final disposal of waste. During fiscal 2018, a total of 72 onsite inspections were conducted by the Eisai
Group in Japan at sites around the country, and it was confirmed that waste is being disposed of in an appropriate manner.
For potential new contractors, we conduct careful screening that includes onsite inspections with priority given to government-certified excellent industrial waste management contractors.
Total Waste and the Ratio of Waste Sent to Landfill to Total Waste Recycled Waste and Recycling Rate
Total Waste for the Past Five Fiscal Years
FY2014 FY2015 FY2016 FY2017 FY2018Sludge 1,636 1,276 885 724 900Waste oil 663 744 739 910 1,075Waste acids and alkali 608 756 534 568 790Waste plastic 412 313 245 266 388Scrap metal 43 18 42 52 76Glass and ceramic waste 34 22 32 24 21Industrial waste and other 105 122 222 205 213General waste 500 232 236 289 273Amount of waste generated 4,001 3,481 2,935 3,038 3,736Amount sold 1,879 2,360 1,622 1,648 1,699Amount of waste generated and sold 5,880 5,841 4,557 4,686 5,435
(tons)
2014 2015 2016 2017
(%)
0
2,000
4,000
6,000
1,000
3,000
5,000
0.0
0.5
1.0
1.5
0.170.17
0.790.79
0.470.47
0.280.28
0.330.33
4,0014,001
3,481
2,9353,038
3,736
2018(Fiscal year)
(t)
Total waste Ratio of waste sent to landfill to total waste Amount recycled
Recycling rate
Amount recycled (including valuables)
Recycling rate (including valuables)
(t)
0
2,000
1,000
4,000
3,000
5,000
6,000
0
20
10
30
40
70
60
50
2014 2015 2016 2017 2018(Fiscal year)
2,9732,973
3,3723,372
2,8602,8602,7492,749
2,6062,606
1,0941,094 1,0111,0111,2381,238
1,1021,102902902
50.6
57.7
62.8
58.7
47.9
27.327.329.029.0
42.242.2
36.336.3
24.324.3
(%)

14
Management of Chemical Substances
Proper Management of PRTR Substances
Volatile Organic Compounds (VOCs) Release Control
7
Amount of VOCs Released from Production Plants and Research Facilities in Japan
Chemical substances that are used in the research and development and production of pharmaceutical products include some substances subject to the PRTR system that could have an impact on the environment. The amounts of these substances handled, released into the environment and transferred as waste need to be understood and properly managed. Therefore, in addition to using our unique reagent management system to monitor the usage of reagents by the Eisai Group in Japan, we are also striving to reduce our usage of PRTR substances and to control their release into the environment. With regard to the usage of these substances exceeding the amount of the designated limit, we surely report this matter to the relevant prefectural governments without delay.
The amount of chemical substances used in the manufacturing processes depends largely on
the volume of pharmaceutical products produced. To maintain the quality of active pharmaceutical ingredients, it is not easy to change manufacturing conditions after entering the commercial production phase. Therefore, we try to reduce the amount of chemical substances used by utilizing alternative solvents from the research and development stage and by developing synthesis processes that reduce the usage. At the same time, we actively promote the reuse of organic solvents and incorporate various means into the manufacturing processes to minimize their release into the atmosphere.
The total amount of PRTR substances handled by the Eisai Group in Japan during fiscal 2018 remained almost the same as the previous fiscal year’s level, coming to 261 tons. Notifications were made to authorities for seven substances, one less substance than in fiscal 2017.
VOCs, such as ethyl acetate, acetone and methanol, are highly volatile and turn into gas in the atmosphere, and as is the case with NOx discharged from production plants, cause the generation of photochemical oxidants. In view of preventing air pollution, these substances need to be controlled to reduce their release into the atmosphere.
In response, main production plants and research facilities of the Eisai Group in Japan implement the same level of efforts as for PRTR substances to reduce the usage of VOCs and stipulate equipment operating procedures to minimize their release
from production or research processes. The graph below shows the amount handled and released into the atmosphere of 55 substances (taken from the Ministry of the Environment’s list of major 100 VOCs, excluding PRTR substances) for the past five fiscal years.
The total amount of VOCs handled during fiscal 2018 increased from fiscal 2017, due mainly to an increase in the production output of the Kashima Plant. Despite an increase in the amount of VOCs handled by the Eisai Group in Japan, the amount released into the atmosphere was reduced.
Fiscal 2018 PRTR Data Reported to Authorities* (Eisai Group in Japan) (tons)
Chemical name Substance no.
Number of operational
sitesAmount handled
Release TransferInto the
atmosphereInto water
bodies As waste To sewage
Acetonitrile 13 3 19.840 0.178 0.000 19.662 0.000 Ethylbenzene 53 1 9.860 0.000 0.000 1.579 0.000 Dichloromethane (also known as methylene chloride) 186 2 188.432 15.442 0.000 96.165 0.000 N, N-dimethylformamide 232 1 15.264 0.000 0.000 15.264 0.000 Toluene 300 1 5.241 0.031 0.000 5.210 0.000 Hexane 392 1 13.807 0.233 0.000 13.574 0.000 Formaldehyde 411 1 2.791 0.174 0.000 0.769 0.000
Actual Use of Substances Subject to the PRTR System
0
200
400
600
800
Amount handled Amount released Transfers
28
191
499
3786
476
25
135
258
23
117
267
16
157
261
(t)
2014 2015 2016 20182017(Fiscal year)
Amount released into the atmosphereAmount handled(t)
922
40
1,132
53
891
37
950
25
964
180
500
1,000
1,500
(Fiscal year)2014 2016 20182015 2017
* Actual data on usage of PRTR designated chemical substances

15
Saving Resources
Effective Use of Water Resources
8
Eisai Group Water Consumption and Amount of Wastewater *
2015 20172014 2016 2018 (Fiscal year)0
1,000
2,000
3,000
4,000
2,7262,694
3,323 3,453
2,449
3,149
2,446
2,982
2,584
3,089
(1,000m3) Amount of WastewaterWater Consumption
Green Purchasing
Proper Management of Polychlorinated Biphenyl (PCB) Waste
Management of Fluorocarbons
The Eisai Group in Japan is systematically getting rid of and renewing equipment that contains fluorocarbons and changing to equipment that uses hydrofluorocarbons (HFC) and non-fluorocarbons (NON), which do not have an ozone layer depletion effect.
Fluorocarbons have a strong greenhouse gas effect and therefore we conduct regular inspections to prevent leakage incidents. At the same time, in the event of leakage, we make efforts to immediately
share information and prevent a recurrence. When disposing of equipment, we properly destroy and dispose of fluorocarbons according to the Fluorocarbons Recovery and Destruction Law.
The leakage volume of fluorocarbons of Eisai Co., Ltd. in fiscal 2018 that we calculated under the Act on Controlling Emissions of Fluorocarbons was equivalent to 508 tons of CO2, which fell below the threshold for notification to the Ministry of Health, Labour and Welfare.
PCB waste still held by Eisai Quantity
Fluorescent ballast 238
Oil containing PCB (reagent) 3 bags (37.5g)
PCB contaminants 3 bags (2.6014kg)
High-voltage capacitors 1
Transformer 1
We store PCB waste properly in enclosures with locks and warning signs and with measures to prevent vaporization, dispersion and leakage. With respect to PCB waste stored at the Honjo Facility, Kawashima Plant and Tsukuba Research Laboratories, in fiscal 2018 waste disposal for the portions stored at the Honjo Facility and Tsukuba Research Laboratories were completed.
Along with the enforcement of the amended PCB Special Measures Act on August 1, 2016, we implemented surveys of any additional generation of PCB waste materials at Group companies in Japan. As a result, a new case was found at the Kawashima
Plant and the amounts in storage are as shown in the chart below. In the future, we will systematically progress with waste disposal. We promptly reported on the state of disposal and storage to the relevant prefectural governments in accordance with the PCB Special Measures Act.
Efforts toward the SDGs
As the sufficient acquisition of water resources is absolutely essential for the production of high-quality pharmaceuticals, the Eisai Group is working to ensure the quality of water discharged from its production plants and research facilities and is also implementing initiatives to reduce water consumption. We have an acute awareness of the need to conserve water and are taking such steps as minimizing consumption of water for production, reusing wastewater and working to use water resources effectively. In addition, we have established a framework for preventing the contamination of groundwater at Eisai production plants and research facilities in Japan in response to the Water Pollution Control Law.
We implemented a questionnaire at overseas plants and research laboratories based on a medium-term outlook. The results of the questionnaire showed that no plants or research laboratories are situated in regions where there is a high risk of operations being suspended due to a water shortage. However, based on analysis results of the database Think Hazard, there is expected to be medium-level risk of water shortages in China, India and Indonesia. While always considering the risk of facing water shortages due to changes in the environment accompanying the advance of climate change, we will work to ensure stable supplies of high-quality products.
As one environmental effort undertaken by employees on a daily basis, the Eisai Group in Japan is promoting green purchasing, an initiative to purchase what is needed in the quantity needed, and if there are two products equivalent in both quality and price, to give preference to the one that is more environment-friendly. By this initiative, we are gearing our efforts toward shifting away from a society of mass-
production, mass-consumption and mass-waste. Eisai Co., Ltd., in particular, has been actively committed to this initiative through participation in the Green Purchasing Network* and in accordance with its own Green Purchasing Guidelines.
* A network of companies, local governments and consumer groups (private organizations) supporting the concept of green purchasing
* The past figures were reviewed upon recalculation.

16
Air Pollutant Emissions and Pollutant Load in Wastewater9Air Pollutant Emissions* Pollutant Load in Wastewater * Air Pollutant Emissions in Fiscal 2018 by Site
Category Operational site/Company SOx (kg) NOx (kg) Soot and dust (kg)
Eisai Group in Japan
Kawashima Plant 153 6,880 330
Tsukuba Research Laboratories – 2,755 95
EA Pharma Fukushima Plant 0.02 492 9
Subtotal 153 10,126 435
Group Companies outside Japan
Andover Research Institute 20 3,080 60
Vizag Plant 11,640 17,630 6,789
Morphotek Inc. 7 262 15
Baltimore Plant 3,091 2,367 –Subtotal 11,667 23,339 6,864
Total 11,820 33,465 7,299
Note: “–” indicates that no measurement was taken.
Pollutant Load in Wastewater in Fiscal 2018 by Site
Category Operational site/Company BOD (kg)
COD (kg)
Nitrogen (kg)
Phosphorus(kg)
Eisai Group in Japan
Kawashima Plant 2,251 – 2,307 52
Tsukuba Research Laboratories 2,809 – – –Kashima Plant 775 496 – –Honjo Facility 5 – 18 3
EA Pharma Fukushima Plant 32 – 36 27
KAN Research Institute 15 – – –Subtotal 5,887 496 2,361 82
Group Companies outside Japan
Morphotek Inc. 3,657 – 279 123
Suzhou Plant – – – 36
Vizag Plant 14,755 46,248 703 –Subtotal 18,411 46,248 982 159
Total 24,298 46,744 3,343 241
Note: “–” indicates that no measurement was taken.
0 10 20 30 40(t)
■Magnified scale
0
0 5 10 15 20
0 1 2
■Magnified scale
2 4 6531 7 8
■Eisai Group in Japan ■Group Companies outside Japan
2014
(Fiscal year)
2018
2017
2016
2015
SOx
NOx
2014
2018
2017
2016
2015
2014
2018
2017
2016
2015
Sootand dust
25(t)
2014
2018
2017
2016
2015
BOD
(Fiscal year)
2014
2018
2017
2016
2015
Nitrogen
2014
2018
2017
2016
2015
Phosphorus
■Eisai Group in Japan ■Group Companies outside Japan
1.37.5
0.67.4
0.57.4
0.48.8
10.2 25.5
7.3 21.6
9.2 17.5
8.5 16.4
10.1 23.3
0.44.3
0.33.9
0.53.2
0.44.6
8.0 8.2
7.6 6.8
6.5 8.7
4.7 9.8
5.9 18.4
3.0 1.2
3.0 1.5
2.2 0.1
2.5 0.4
0.1
0.1
0.2
0.3
0.10.0
0.10.0
0.211.7
0.46.9
2.4 1.0
0.10.2
* The past figures were reviewed upon recalculation.

17
Resource Input and Environmental Impact (Eisai Group in Japan)10Principal PRTR Substances Handled
2016 2017 2018
Kawashima Plant
Acetonitrile (tons) 0.9 1.8 1.9
Tsukuba Research Laboratories
Acetonitrile (tons) 2.8 2.6 3.6
Dichloromethane (tons) 1.4 0.8 0.5
Hexane (tons) 0.2 0.2 0.2
Kashima Plant
Acetonitrile (tons) 19 17 14
Ethylbenzene (tons) 4 5 10
Ethylenediamine (tons) 0 2 0
Dichloromethane (tons) 157 166 164
N, N-dimethylformamide (tons) 7 11 15
Toluene (tons) 18 23 5
Formaldehyde (tons) 1.4 1.5 2.8
Hexane (tons) 13 1 14
EA Pharma Co., Ltd., Fukushima Plant
Acetonitrile (tons) 0.7 0.9 1.0
Dichloromethane (tons) 27.7 29.6 24.7
KAN Research Institute, Inc.
Xylene (kg) 3 0 3
Chloroform (kg) 1.5 1.5 3.3
Formaldehyde (kg) 2.1 2.7 1.8
Kashima Plant (FY)2016 2017 2018
Energy consumption
Electricity (MWh) 11,860 13,103 14,533
Industrial steam (GJ) 41,698 50,246 50,380
Liquefied petroleum gas (LPG) (tons) 1 6 6
Waste treatment
Amount generated (tons) 1,210 1,380 1,761
Recycled amount (tons) 739 588 256
Amount sent to landfill (tons) 0.0 0.0 0.0
Air pollutant emissions and pollutant load in wastewater
SOx (kg) – – –
NOx (kg) – – –
Soot and dust (kg) – – –
Water consumption (1,000 m3) 53 56 55
Wastewater discharge (1,000 m3) 49 49 52
BOD (kg) 779 394 775
Nitrogen (kg) 76 148 0
Phosphorus (kg) 24 27 0
EA Pharma Co., Ltd., Fukushima Plant (FY)2016 2017 2018
Energy consumption
Electricity (MWh) 12,206 12,313 12,539
Liquefied petroleum gas (LPG) (tons) 1,569 1,541 963
Waste treatment
Amount generated (tons) 464 370 393
Recycled amount (tons) 119 94 129
Amount sent to landfill (tons) 0.3 0.3 0.0
Air pollutant emissions and pollutant load in wastewater
SOx (kg) 0.0* 0.0 0.0
NOx (kg) 694 649 492
Soot and dust (kg) 12.6 15.9 9.0
Water consumption (1,000 m3) 75 78 73
Wastewater discharge (1,000 m3) 51 41 32
BOD (kg) 117 105 32
Nitrogen (kg) 65 54 36
Phosphorus (kg) 24 19 27
KAN Research Institute, Inc. (FY)2016 2017 2018
Energy consumption
Electricity (MWh) 3,289 3,362 3,455
Processed natural gas (tons) 424 418 428
Waste treatment
Amount generated (tons) 42 44 40
Recycled amount (tons) 11 10 8
Amount sent to landfill (tons) 0.8 0.8 0.8
Air pollutant emissions and pollutant load in wastewater
SOx (kg) – – –
NOx (kg) – – –
Soot and dust (kg) – – –
Water consumption (1,000 m3) 16 16 16
Wastewater discharge (1,000 m3) 16 16 15
BOD (kg) 16 348 15
Nitrogen (kg) – – –
Phosphorus (kg) – – –
“–” indicates that no measurement was taken.
“–” indicates that no measurement was taken.
“–” indicates that no measurement was taken.
Kawashima Plant (FY)2016 2017 2018
Energy consumption
Electricity (MWh) 26,597 25,012 27,393
Processed natural gas (tons) 4,072 4,076 4,032
Liquefied petroleum gas (LPG) (tons) 3 5 34
Waste treatment
Amount generated (tons) 602 503 635
Recycled amount (tons) 67 76 175
Amount sent to landfill (tons) 0.1 0.1 0.1
Air pollutant emissions and pollutant load in wastewater
SOx (kg) 480 447 153
NOx (kg) 6,172 4,719 6,880
Soot and dust (kg) 318 218 330
Water consumption (1,000 m3) 2,317 2,181 2,272
Wastewater discharge (1,000 m3) 1,938 1,979 2,088
BOD (kg) 2,151 2,413 2,251
Nitrogen (kg) 1,971 2,278 2,307
Phosphorus (kg) 39 43 52
Tsukuba Research Laboratories (FY)2016 2017 2018
Energy consumption
Electricity (MWh) 27,357 27,558 27,010
Processed natural gas (tons) 2,116 2,226 2,116
Fuel oil A (kl) 37 40 30
Waste treatment
Amount generated (tons) 193 159 174
Recycled amount (tons) 73 69 77
Amount sent to landfill (tons)* 1.3 1.5 1.7
Air pollutant emissions and pollutant load in wastewater
SOx (kg) – – –
NOx (kg) 2,334 3,097 2,755
Soot and dust (kg) 135 180 95
Water consumption (1,000 m3) 167 147 163
Recycled water (1,000 m3) 96 100 87
Wastewater discharge (1,000 m3) 142 125 138
BOD (kg) 3,291 1,434 2,809
Nitrogen (kg) – – –
Phosphorus (kg) – – –
* Corrected value

18
11
*1 One U.S. ton = 0.907185 metric tons*2 One decatherm = 1,055 MJ
Resource Input and Environmental Impact (Group Companies outside Japan)
Eisai China Inc., Suzhou Plant (Jiangsu, China) (FY)2016 2017 2018
Energy consumption
Electricity (MWh) 11,900 11,623 14,752
Liquefied natural gas (LNG) (m3) 631 767
Natural gas (1,000 m3) – – 1,468
Industrial steam (tons) 12,258 10,909 959
Waste treatment
Amount generated (tons) 381 399 212
Recycled amount (tons) 335 341 122
Amount incinerated (tons) 46 58 91
Pollutant load in wastewater
Water consumption (1,000 m3) 46 36 40
Wastewater discharge (1,000 m3) 37 29 32
Phosphorus (kg) 2 25 36
Eisai Knowledge Centre, India (Andhra Pradesh, India) (FY)2016 2017 2018
Energy consumption
Electricity (MWh) 11,482 13.068 15,322
Light oil (kl) 614 681 1,003
Liquefied petroleum gas (LPG) (tons) 6 9 9
Waste treatment
Amount generated (tons) 126 210 286
Recycled amount (m3) 109 189 264
Amount incinerated (tons) 16 21 22
Air pollutant emissions
SOx (kg) 7,388 8,738 11,640
NOx (kg) 10,944 13,126 17,630
Soot and dust (kg) 2,919 4,558 6,789
Pollutant load in wastewater
Water consumption (1,000 m3) 111 138 157
Wastewater discharge (1,000 m3) 36 48 83
COD (kg) 15,255 10,531 46,248
BOD (kg) 8,650 9.847 14,755
Nitrogen (kg) 245 402 703
Eisai Inc., Andover Research Institute (Massachusetts, U.S.) (FY)2016 2017 2018
Energy consumption
Electricity (MWh) 8,965 8,680 6,675
Natural gas (1,000 m3) 1,588 1,575 1,100
Light oil (kl) 5 12 2
Waste treatment
Amount generated (U.S. tons)*1 131 162 162
Recycled amount (U.S. tons) 34 55 28
Amount sent to landfill (U.S. tons) 50 77 89
Air pollutant emissions
SOx (kg) 20 20 20
NOx (kg) 3,020 2,990 3,080
Soot and dust (kg) 60 50 60
Pollutant load in wastewater
Water consumption (1,000 m3) 29 29 28
European Knowledge Centre (Hertfordshire, U.K.) (FY)2016 2017 2018
Energy consumption
Electricity (MWh) 6,223 6,700 6,728
Natural gas (1,000 m3) 816 894 854
Light oil (kl) 3 3 0.3
Waste treatment
Amount generated (tons) 197 217 209
Recycled amount (tons) 197 217 209
Amount sent to landfill (tons) 0 0 0
Pollutant load in wastewater
Water consumption (1,000 m3) 18 19 22
Wastewater discharge (1,000 m3) 18 19 22
Principal Chemical Substances Used2016 2017 2018
Suzhou PlantEthanol (tons) 40.5 28.8 7.2Methanol (tons) 0.7 0.6 0.7Acetonitrile (tons) 0.7 0.9 0.7Benxi PlantEthanol (tons) 40.5 41.7 24.0Methanol (tons) 0.5 1.3 1.1Ether (tons) 0.3 0.8 0.6Bogor PlantMethanol (l) 209.0 204.0 210.0Acetonitrile (l) 83.3 106.0 90.0Anhydrous ethanol (l) 25.2 11.4 10.5Eisai Knowledge Centre, IndiaEthyl acetate (tons) 4.0 15.5 23.3Acetone (tons) 12.4 14.9 22.1Isopropyl acetate (tons) 1.4 20 40.5Methanol (tons) 55.8 132.2 257.1Ethanol (tons) 12.7 51.3 86.0Methyl-t-butyl ether (tons) 4.4 13.1 18.9n-heptane (tons) 2.8 4.9 6.9Tetrahydrofuran (tons) 10.8 12.8 29.32-Methyltetrahydrofuran (tons) 3.6 7.6Dimethyl sulfoxide (tons) 0.3 0.1 39.8Concentrated hydrochloric acid (tons) 3.9 11.2 25.4Dichloromethane (tons) 5.6 0.6 5.5European Knowledge CentreAcetonitrile (tons) 0.2 0.2 0.3Methanol (tons) 0.1 0.2 0.1Ethanol (tons) 0.0 0.1 0.2Andover Research InstituteMethanol (U.S. tons) 1.3 1.6 0.9Ethyl acetate (U.S. tons) 3.3 2.9 1.7Acetonitrile (U.S. tons) 2.7 2.6 1.5Heptane (U.S. tons) 2.4 2 0.9Dichloromethane (U.S. tons) 2.1 1.7 1.3Methyl-t-butyl ether (U.S. tons) 0.3 0.3 0.5Morphotek Inc.Decon Quat 100 (quaternary ammonium solution) (kl) 3.8 78.5 54.0Decon Spore (kl) 1.6 24.5 14.7Decon Clean (residual remover) (kl) 1.4 19.6 9.8H3 Biomedicine Inc.Acetonitrile (tons) 0.8 0.7 0.6Dichloromethane (tons) 0.5 0.2 0.2Ethyl acetate (tons) 0.3 0.2 0.2Hexane (tons) 0.3 0.2 0.2Methanol (tons) 0.4 0.2 0.2Baltimore PlantDichloromethane (kg) 459 435 226Petroleum ether (kg) 86 105 42Anhydrous acetate (kg) 49 30 23Anhydrous ether (kg) 26 33 9
Morphotek Inc. (Pennsylvania, U.S.) (FY)2016 2017 2018
Energy consumption
Electricity (MWh) 8,675 8,777 8,963
Natural gas (decatherms)*2 48,883 55,039 53,859
Light oil (kl) 19 10 12
Waste treatment
Amount generated (tons) 131 120 120
Recycled amount (tons) 33 30 30
Amount sent to landfill (tons) 81 74 64
Air pollutant emissions
SOx (kg) 30 8 7
NOx (kg) 3,570 284 262
Soot and dust (kg) 260 12 15
Pollutant load in wastewater
Water consumption (1,000 m3) 45 42 45
Wastewater discharge (1,000 m3) 27 24 26
BOD (kg) – 3,657
Nitrogen (kg) 84 9 279
Phosphorus (kg) – 12 123
H3 Biomedicine Inc. (Massachusetts, U.S.) (FY)2016 2017 2018
Energy consumption
Electricity (MWh) 4,075 3,917 3,839
Natural gas (decatherms)*2 4,190 5,674 8,361
Waste treatment
Amount generated (tons) 35 35 27
Recycled amount (tons) 14 18 12
Amount sent to landfill (tons) 0.2 0 0.1
Pollutant load in wastewater
Water consumption (1,000 m3) 7.8 11 8
Wastewater discharge (1,000 m3) 7.8 11 8
Eisai Inc., Baltimore Plant (Maryland, U.S.) (FY)2016 2017 2018
Energy consumption
Electricity (MWh) 5,485 5,562 5,604
Natural gas (decatherms)*2 17,032 18,676 17,214
Waste treatment
Amount generated (tons) 21 21 23
Recycled amount (tons) 8 8 8
Amount sent to landfill (tons) 10 12 12
Pollutant load in wastewater
Water consumption (1,000 m3) 7
Wastewater discharge (1,000 m3) 7
“–” indicates that no measurement was taken.
PT Eisai Indonesia, Bogor Plant (West Java, Indonesia) (FY)2016 2017 2018
Energy consumption
Electricity (MWh) 1,033 926 986
Light oil (kl) 2 1 1
Liquefied petroleum gas (LPG) (tons) 1 1 0.02
Waste treatment
Amount generated (tons) 8 5 3
Recycled amount (tons) 8 5 3
Amount sent to landfill (tons) 0 0 0
Pollutant load in wastewater
Water consumption (1,000 m3) 6.4 5.4 5.5
Wastewater discharge (1,000 m3) 0.4 2.5 0.4
BOD (kg) 3.4 2.3
Phosphorus (kg) 0.8 4
Eisai (Liaoning) Pharmaceutical Co., Ltd., Benxi Plant (Liaoning, China) (FY)2016 2017 2018
Energy consumption
Electricity (MWh) 2,980 3,669 3,771
CWS (tons) 2,166 2,656 897
Natural gas (1,000 m3) – – 483
Light oil (kl) 12 10 9
Waste treatment
Amount generated (tons) 182 132 –
Recycled amount (tons) 12 16 17
Amount sent to landfill (tons) – – –
Pollutant load in wastewater
Water consumption (1,000 m3) 78 74 68
Wastewater discharge (1,000 m3) 62 59 40
“–” indicates that no measurement was taken.
“–” indicates that no measurement was taken.

19
As an indicator of sustainability, we calculated the relationship between the environmental impact accompanying business activities and management indicators in working toward the formation of a sustainable society. Along with the increase in numerical values, we believe we are carrying out business activities with even higher sustainability in terms of environmental aspects.
1312Waste productivity *2
GHG productivity *3 Water productivity *4
*1 Net sales (million yen)/amount of energy used (MWh)
*3 Net sales (million yen)/amount of CO2 emissions (t)
*2 Net sales (hundred million yen)/amount of waste generated (t)
*4 Net sales (hundred million yen)/amount of water resources input (thousand m3)
Third-Party Verification of Greenhouse Gas Emissions Volume
Sustainability-related Indicators
Eisai Co., Ltd. undergoes third-party verifications to improve the accuracy of measurement, aggregation, calculation and reporting methods for the amounts of greenhouse gasses emitted by the Group. In fiscal 2019, seven business operational sites in Japan and nine business operational sites outside Japan, centering on production plants and research facilities, underwent verifications for Scope 1 emissions, Scope 2 emissions and Scope 3 emissions (Category 1). (Period to be verified:April 1, 2018 - March 31, 2019)
Energy productivity *1
2016 20182017
0.76
0.81
0.88
(million yen / MWh)
0.5
0.6
0.7
0.8
0.9
1.0
(Fiscal year)
1.30
1.39
1.35
1.0
1.2
1.1
1.3
1.4
1.5
(hundred million yen / t)
2016 20182017 (Fiscal year)
4.01
4.41
4.57
3.5
4.0
4.5
5.0
(million yen / t)
2016 20182017 (Fiscal year)
1.71
2.01 2.08
1.0
1.5
2.0
2.5
3.0
(hundred million yen / thousand m3)
2016 20182017 (Fiscal year)