Env101 - EARTH SYSTEMS
31
25/09/2015 1 ENV101 - EARTH SYSTEMS THE HYDROSPHERE AND THE WATER CYCLE Presented By Ian Lancaster KSI Land and Water Planning EARTH SYSTEMS Before talking about the water cycle there are some things we need to review. Remember that water is made up of molecules of oxygen and hydrogen atoms, H 2 O that are always moving. And how fast these molecules are moving determines whether the water will be a solid, a liquid, or a gas. And just how fast these molecules move is determined by heat energy, how hot or how cold they are. WATER CHEMISTRY •Of course, molecules are way too small to be seen. But if you can visualize the molecules as small balls, molecules of water in the three states of matter might appear something like this: Solid Liquid Gas •We will first look at our model of solid water called “ice.” The molecules are tightly packed and vibrating in place. •When there is only a small amount of heat energy the molecules are packed so tightly together that they form ice. • At sea level, water is transformed into ice, or frozen, at 0 degrees Celsius. This is the solid form.
Transcript of Env101 - EARTH SYSTEMS

25/09/2015
1
ENV101 - EARTH SYSTEMS
THE HYDROSPHERE AND THE WATER CYCLE
Presented By Ian Lancaster
KSI Land and Water Planning
EARTH SYSTEMS
Before talking about the water cycle there
are some things we need to review.
Remember that water is made up of
molecules of oxygen and hydrogen atoms,
H2O that are always moving.
And how fast these molecules are
moving determines whether the water
will be a solid, a liquid, or a gas.
And just how fast these molecules move
is determined by heat energy, how hot
or how cold they are.
WATER CHEMISTRY
•Of course, molecules are way too small to
be seen. But if you can visualize the
molecules as small balls, molecules of water
in the three states of matter might appear
something like this:
Solid Liquid Gas
•We will first look at our model of solid water called
“ice.” The molecules are tightly packed and vibrating in
place.
•When there is only a small amount of heat energy the
molecules are packed so tightly together that they form
ice.
• At sea level, water is transformed into ice, or frozen, at
0 degrees Celsius. This is the solid form.

25/09/2015
2
•Next, we have our model of liquid water molecules.
•When there is more heat energy, the molecules move
about more vigorously within their container.
• At sea level the liquid form can range between 0 and
100 degrees.
•Finally, we have our model of molecules of gaseous
water called “water vapor.”
•There is even more heat energy now, and the molecules
are moving rapidly, banging on the walls of whatever
container they are in, escaping where ever there is an
opening.
• The important thing is that the amount of heat energy
determines whether our H2O molecules are a solid, liquid or gas.
• Adding or subtracting heat energy can cause water to change
from one phase, like ice or liquid or gas, to another.
• Water vapor is water in the form of a gas.
• Like most gases, water vapor is invisible.
• Even though we cannot see them, air always contains molecules
of water vapor mixed in with molecules of nitrogen, oxygen,
argon and carbon dioxide.
• Having learned that there is always some water vapor found
in air, we should also understand that:
• The warmer the air the more water vapor molecules there are.
• The cooler the air the fewer water vapor molecules there are.
Water molecules in air do not remain in one state of matter or
another; they are constantly changing back and forth between
stages.
Stage changes between vapor, liquid and solid happen because of
temperature changes.
When liquid water molecules gain heat energy they become water
vapor (evaporation): when water vapor molecules lose heat energy
they become a liquid (condensation).
http://www.expla
inthatstuff.com/sta
tes-of-matter.html
creative commons
license condensation
evaporation
Water on the Earth’s surface is continually
evaporating—changing from a liquid to the
gas called water vapor.
Now let’s look at the water cycle.
Although the water cycle is like a circle that has
no beginning or end, we will start our study
with:
evaporation.
Even on a cool, dull day the energy from the Sun
heats the surface of the sea causing some of the
water to change from a liquid into water vapor.
This process is called EVAPORATION.

25/09/2015
3
Here we see
a diagram of
some liquid
water
molecules
gaining
enough heat
energy from
the sun to
change into
molecules of
water vapor.
However, remember:
1. Water molecules are too small
to see without a microscope
2. Water vapor is invisible
Nearly 90% of the the water vapor in our
atmosphere comes from the oceans, seas and
other bodies of water (lakes, rivers, streams)
through evaporation.
We know that water is evaporating from the
water shown above but we cannot see it.
Water vapor is invisible.
The remaining 10% of the moisture found in the
atmosphere is released by plants through
transpiration—release of water vapor from leaves.
While most of the water vapor for the water cycle comes from
evaporation, transpiration adds a lot of water vapor. For
example, a cornfield 1 hectare in size can transpire as much as
40 kilolitres of water every day.
Now that we understand that there is
water vapor in the air, the next step to
be examined in the water cycle is:
Condensation
Clouds form as the result of condensation—
water vapor that is cooled changes to liquid
water.
This process of condensation is constantly
occurring all around us as water vapor
molecules in the air bump into cool surfaces.
Because when water vapor molecules strike
a cooler surface, they slow down and
sometimes change into tiny droplets of liquid
water that look like “fog”.
Over time, these tiny droplets of water join
together forming larger and larger drops.
Water vapor hitting the sides
of a cold glass or water
bottle condenses (changes
from a gas to a liquid).
condensation

25/09/2015
4
Flicker.com creative commons with attribution SophieG Flicker.com creative commons with attribution jessicafm
As time passes the water droplets
increase in size.
http://www.epa.gov/
Flickr.com creative commons with attribtuion House of Sims
Water vapor
condensing on a
cold window.
More condensation
Water vapor
condensing on a
cold mirror.
More condensation
Water vapor condensing on the cold
car windshield.
More
condensation
Water vapor condensing on grass or
a spider web--dew.
More condensation
Steam is not water
vapor.
Like the “fog” on
the window or
mirror, steam is
made up of tiny
water droplets.
When the water vapor from the boiling water
hits the cooler air outside the tea kettle, it
condenses as tiny water droplets.
More condensation
condensation

25/09/2015
5
At night sometimes, water vapor condenses
as it comes in contact with the cool ground
creating fog—a cloud on the ground.
More condensation
Bridge peeking above the fog on the ground.
As you move
up in the
atmosphere it
becomes
colder and
colder.
However, unlike fog, most clouds do not form on the
ground; they form high up in the sky where the air is
is much cooler.
Flickr.com creative commons Anosmia
As water vapor is cooled high in the atmosphere it
condenses into tiny water droplets—a cloud.
Here we see pictures of clouds high up in the sky.
Clouds—another product of condensation.
Now we have to ask what causes this warm air
that is loaded with water vapor to rise ?
Usually this “lifting” of warm air is caused by
another of our “cycles.”
Convection
The tendency of hotter and therefore lighter
(molecules further apart) liquids and gases
to rise, and for colder, heavier (molecules
closer together) liquids and gases to sink.
hotter and therefore
less dense (lighter)
material rises
colder,
denser
(heavier)
material
sinks
colder,
denser
(heavier)
material
sinks
under the influence of gravity.

25/09/2015
6
http://www.explaint
hatstuff.com/states-
of-matter.html
creative commons
licence
Here is convection in action. Another demonstration of cool dry air
sinking and pushing up warm moist air.
Warm air
(less dense)
pulled less
hard by gravity
and therefore
being pushed
up by cold air.
Cool air
(more dense)
being pulled
by gravity.
Smoke from burning stick.
Burning candle
warming air.
Now let’s look at how convection
currents on Earth are important in
the formation of clouds.
Warm air, with lots of water
vapor, rises and cools.
As a result of the cooling,
the water vapor in the air
changes into tiny water
droplets of liquid
water—a cloud is
formed.
The Sun heats the ground.
The ground then warms the
air above it.
The tiny water
droplets making up
clouds are big
enough to be seen in
large groups (like a
cloud) but too small
for gravity to
overcome the rising
warm air.
gravity
warm air
Small, yes. But just how small? The
droplets created from condensing
water molecules are so small that
millions of cloud droplets are needed
to produce a single rain drop. They
are kept aloft by the slowly rising
convection currents.

25/09/2015
7
Here you can see the rising warm air building
up a thundercloud.
However, as the tiny droplets inside
the cloud collide, they join and
droplets grow in size.
Finally water drops form.
Which brings us to the next
part of the water cycle,
Precipitation.
When these
drops become
too large for
the rising air to
hold them up,
they fall as rain
(precipitation).
Some precipitation that falls on the
ground flows over the land to streams
and rivers and finally to the ocean.
This is called surface run off.
Getting this fallen water (precipitation)
back to the rivers, lakes and oceans is also
part of the water cycle. Water can take
two paths back to larger bodies, one is on
the surface and the other is underground.
You can easily observe this surface run-off if it
is water running down your driveway, along the
curb of your street and into a storm sewer.

25/09/2015
8
During a heavy rain, water flows over the soil filling creeks
which then flow into streams and finally into rivers. The surface
runoff that flows into a creek is beginning its journey back to
the ocean. BREAK AND QUESTIONS
Blue Planet (5starttv)
https://youtu.be/WBRXJvDk4dQ
Clouds at Berry Springs
Hydro Electrca - Peru
Lagos Sandoval - Amazonia Rio Madre - Amazonia
Pacific Ocean - Galapogos
Iguazu Falls - Brasil
Salkantay - Peru
Total water on Earth
sea water 97 %
fresh water 3 %
Total fresh water
ice 68.7%
surface water (liquid) 0.3%
other 0.9%
groundwater 30.1%
lakes 87 %
swamps 11%
Total surface fresh water (liquid)
rivers 2%
Primitive atmosphere: • carbon dioxide
• water vapour
Origin of the hydrosphere
IS THERE WATER ON
OTHER PLANETS?
4,500 million years ago Present
condensation
gaseous water
liquid water
solid water
Temperature 15 ºC
Water on other rocky planets
Mercury
Venus
Mars

25/09/2015
9
Water on other rocky planets
Ice may exist in craters
at the poles according
to radar.
Venus
Mars
Water on other rocky planets
• Frozen water under the
polar caps
• Liquid water in the past
Mercury
Venus
Mars
Water on other rocky planets
• No surface water
• Traces of water vapour
in the atmosphere
Mercury
Venus
Mars
What are some properties of water?
It is highly cohesive and adhesive. It absorbs a lot of heat.
It is an excellent solvent. It expands on freezing.
Natural disasters produced by water
Tsunamis
River flooding Flash flooding
Torrential rain
87 %
• It is salty. • It contains dissolved gases from: - wave action
- the activity of aquatic plants and animals • Temperature varies with depth.
What is sea water like?
Proportions of dissolved salts
chlorides
2 % others
11 % sulphates
25/09/2015
10
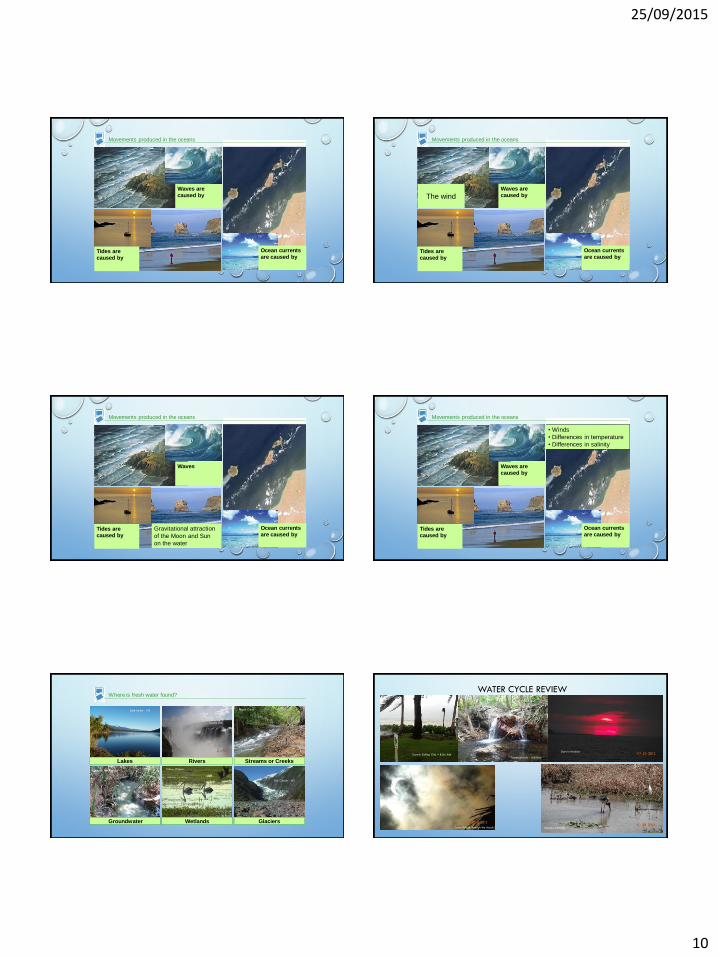
Movements produced in the oceans
Ocean currents are caused by
Waves are caused by
Tides are caused by
Movements produced in the oceans
The wind
Tides are caused by
Ocean currents are caused by
Waves are caused by
Movements produced in the oceans
Gravitational attraction
of the Moon and Sun
on the water
Waves
Tides are caused by
Ocean currents are caused by
Movements produced in the oceans
• Winds
• Differences in temperature
• Differences in salinity
Waves are caused by
Tides are caused by
Ocean currents are caused by
Where is fresh water found?
Lakes
Groundwater
Rivers Streams or Creeks
Wetlands Glaciers
Lake Ianthe - NZ
Iguazu falls
Rapid Creek
Katherine Hot Springs Yellow Waters
Fox Glacier - NZ
WATER CYCLE REVIEW
Darwin Sailing Club – 8.3m tide Tabletop walk - Litchfield
Darwin Harbour
Lunar Eclipse through the clouds Kakadu wetlands

25/09/2015
11
What is the water cycle?
water storage in ice and snow
precipitation
evaporation
condensation in the form of clouds
surface runoff
evapotranspiration
infiltration
What is the water cycle?
permeable rock
groundwater
water storage in ice and snow
precipitation
evaporation
condensation in the form of clouds
surface runoff
evapotranspiration
infiltration
What is the water cycle?
water storage in ice and snow
precipitation
evaporation
condensation in the form of clouds
surface runoff
evapotranspiration
infiltration

25/09/2015
12
What is the water cycle?
water storage in ice and snow
precipitation
evaporation
condensation in the form of clouds
surface runoff
evapotranspiration
infiltration
Hailstone formation •
THE WATER CYCLE (US National Science
Foundation)
HTTPS://YOUTU.BE/AL-DO-HGUIK
EARTHS WATER CYCLE (NASA)
HTTPS://YOUTU.BE/OADKPH9YQBS
Condensation

25/09/2015
13
BREAK AND QUESTIONS
NT Water Resources – Constraints,
Opportunities and Climate Change Ian Lancaster

25/09/2015
14
DROUGHT WET – LOW TO MOD VARIABILITY
80
MID WET – LOW VARIABILITY
81
LATE WET – MODERATE VARIABILITY
82
EARLY DRY – MODERATE TO HIGH VARIABILITY
83
EARLY DRY – EXTREME VARIABILITY
84

25/09/2015
15
DRY –LOW VARIABILITY >10MM
85
MID DRY – LOW VARIABILITY >10MM
86
MID DRY – LOW VARIABILITY >10MM
87
LATE DRY – EXTREME VARIABILITY
88
BUILDUP – MOD TO HIGH VARIABILITY
89
BUILDUP– MODERATE VARIABILITY
90
25/09/2015
16
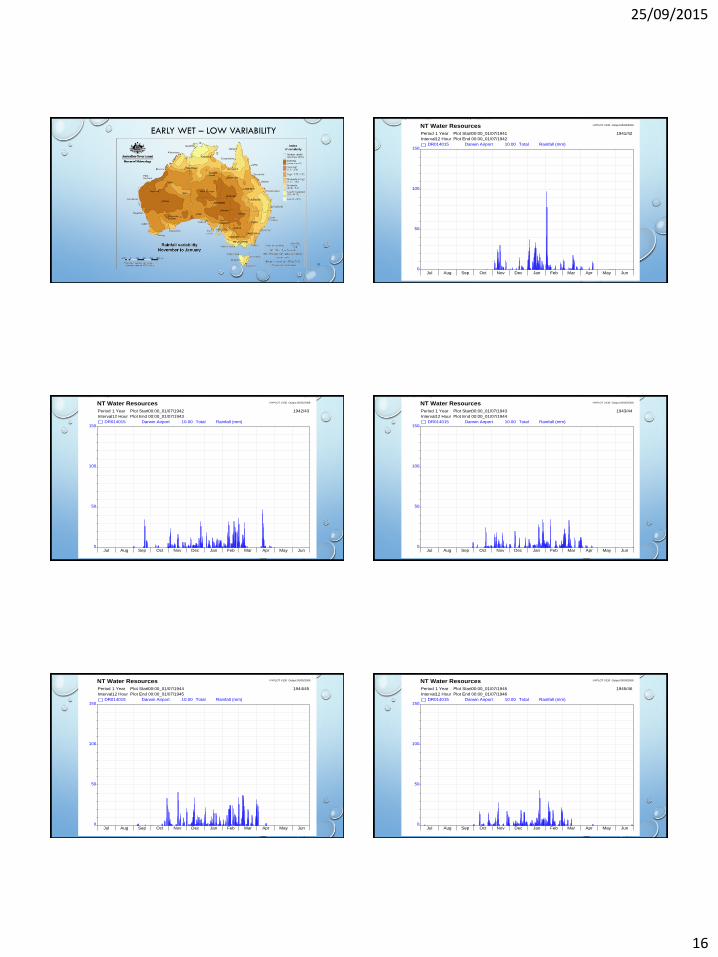
EARLY WET – LOW VARIABILITY
91
NT Water Resources HYPLOT V130 Output 05/05/2008
Period 1 Year Plot Start00:00_01/07/1941 1941/42
Interval12 Hour Plot End 00:00_01/07/1942
DR014015 Darwin Airport 10.00 Total Rainfall (mm)
0
50
100
150
Jul Aug Sep Oct Nov Dec Jan Feb Mar Apr May Jun
NT Water Resources HYPLOT V130 Output 05/05/2008
Period 1 Year Plot Start00:00_01/07/1942 1942/43
Interval12 Hour Plot End 00:00_01/07/1943
DR014015 Darwin Airport 10.00 Total Rainfall (mm)
0
50
100
150
Jul Aug Sep Oct Nov Dec Jan Feb Mar Apr May Jun
NT Water Resources HYPLOT V130 Output 05/05/2008
Period 1 Year Plot Start00:00_01/07/1943 1943/44
Interval12 Hour Plot End 00:00_01/07/1944
DR014015 Darwin Airport 10.00 Total Rainfall (mm)
0
50
100
150
Jul Aug Sep Oct Nov Dec Jan Feb Mar Apr May Jun
NT Water Resources HYPLOT V130 Output 05/05/2008
Period 1 Year Plot Start00:00_01/07/1944 1944/45
Interval12 Hour Plot End 00:00_01/07/1945
DR014015 Darwin Airport 10.00 Total Rainfall (mm)
0
50
100
150
Jul Aug Sep Oct Nov Dec Jan Feb Mar Apr May Jun
NT Water Resources HYPLOT V130 Output 05/05/2008
Period 1 Year Plot Start00:00_01/07/1945 1945/46
Interval12 Hour Plot End 00:00_01/07/1946
DR014015 Darwin Airport 10.00 Total Rainfall (mm)
0
50
100
150
Jul Aug Sep Oct Nov Dec Jan Feb Mar Apr May Jun

25/09/2015
17
NT Water Resources HYPLOT V130 Output 05/05/2008
Period 1 Year Plot Start00:00_01/07/1946 1946/47
Interval12 Hour Plot End 00:00_01/07/1947
DR014015 Darwin Airport 10.00 Total Rainfall (mm)
0
50
100
150
Jul Aug Sep Oct Nov Dec Jan Feb Mar Apr May Jun
NT Water Resources HYPLOT V130 Output 05/05/2008
Period 1 Year Plot Start00:00_01/07/1947 1947/48
Interval12 Hour Plot End 00:00_01/07/1948
DR014015 Darwin Airport 10.00 Total Rainfall (mm)
0
50
100
150
Jul Aug Sep Oct Nov Dec Jan Feb Mar Apr May Jun
NT Water Resources HYPLOT V130 Output 05/05/2008
Period 1 Year Plot Start00:00_01/07/1948 1948/49
Interval12 Hour Plot End 00:00_01/07/1949
DR014015 Darwin Airport 10.00 Total Rainfall (mm)
0
50
100
150
Jul Aug Sep Oct Nov Dec Jan Feb Mar Apr May Jun
NT Water Resources HYPLOT V130 Output 05/05/2008
Period 1 Year Plot Start00:00_01/07/1949 1949/50
Interval12 Hour Plot End 00:00_01/07/1950
DR014015 Darwin Airport 10.00 Total Rainfall (mm)
0
50
100
150
Jul Aug Sep Oct Nov Dec Jan Feb Mar Apr May Jun
NT Water Resources HYPLOT V130 Output 05/05/2008
Period 1 Year Plot Start00:00_01/07/1950 1950/51
Interval12 Hour Plot End 00:00_01/07/1951
DR014015 Darwin Airport 10.00 Total Rainfall (mm)
0
50
100
150
Jul Aug Sep Oct Nov Dec Jan Feb Mar Apr May Jun
NT Water Resources HYPLOT V130 Output 05/05/2008
Period 1 Year Plot Start00:00_01/07/1951 1951/52
Interval12 Hour Plot End 00:00_01/07/1952
DR014015 Darwin Airport 10.00 Total Rainfall (mm)
0
50
100
150
Jul Aug Sep Oct Nov Dec Jan Feb Mar Apr May Jun

25/09/2015
18
NT Water Resources HYPLOT V130 Output 05/05/2008
Period 1 Year Plot Start00:00_01/07/1952 1952/53
Interval12 Hour Plot End 00:00_01/07/1953
DR014015 Darwin Airport 10.00 Total Rainfall (mm)
0
50
100
150
Jul Aug Sep Oct Nov Dec Jan Feb Mar Apr May Jun
NT Water Resources HYPLOT V130 Output 05/05/2008
Period 1 Year Plot Start00:00_01/07/1953 1953/54
Interval12 Hour Plot End 00:00_01/07/1954
DR014015 Darwin Airport 10.00 Total Rainfall (mm)
0
50
100
150
Jul Aug Sep Oct Nov Dec Jan Feb Mar Apr May Jun
NT Water Resources HYPLOT V130 Output 05/05/2008
Period 1 Year Plot Start00:00_01/07/1954 1954/55
Interval12 Hour Plot End 00:00_01/07/1955
DR014015 Darwin Airport 10.00 Total Rainfall (mm)
0
50
100
150
Jul Aug Sep Oct Nov Dec Jan Feb Mar Apr May Jun
NT Water Resources HYPLOT V130 Output 05/05/2008
Period 1 Year Plot Start00:00_01/07/1955 1955/56
Interval12 Hour Plot End 00:00_01/07/1956
DR014015 Darwin Airport 10.00 Total Rainfall (mm)
0
50
100
150
Jul Aug Sep Oct Nov Dec Jan Feb Mar Apr May Jun
NT Water Resources HYPLOT V130 Output 05/05/2008
Period 1 Year Plot Start00:00_01/07/1956 1956/57
Interval12 Hour Plot End 00:00_01/07/1957
DR014015 Darwin Airport 10.00 Total Rainfall (mm)
0
50
100
150
Jul Aug Sep Oct Nov Dec Jan Feb Mar Apr May Jun
NT Water Resources HYPLOT V130 Output 05/05/2008
Period 1 Year Plot Start00:00_01/07/1957 1957/58
Interval12 Hour Plot End 00:00_01/07/1958
DR014015 Darwin Airport 10.00 Total Rainfall (mm)
0
50
100
150
Jul Aug Sep Oct Nov Dec Jan Feb Mar Apr May Jun

25/09/2015
19
NT Water Resources HYPLOT V130 Output 05/05/2008
Period 1 Year Plot Start00:00_01/07/1958 1958/59
Interval12 Hour Plot End 00:00_01/07/1959
DR014015 Darwin Airport 10.00 Total Rainfall (mm)
0
50
100
150
Jul Aug Sep Oct Nov Dec Jan Feb Mar Apr May Jun
NT Water Resources HYPLOT V130 Output 05/05/2008
Period 1 Year Plot Start00:00_01/07/1959 1959/60
Interval12 Hour Plot End 00:00_01/07/1960
DR014015 Darwin Airport 10.00 Total Rainfall (mm)
0
50
100
150
Jul Aug Sep Oct Nov Dec Jan Feb Mar Apr May Jun
NT Water Resources HYPLOT V130 Output 05/05/2008
Period 1 Year Plot Start00:00_01/07/1960 1960/61
Interval12 Hour Plot End 00:00_01/07/1961
DR014015 Darwin Airport 10.00 Total Rainfall (mm)
0
50
100
150
Jul Aug Sep Oct Nov Dec Jan Feb Mar Apr May Jun
NT Water Resources HYPLOT V130 Output 05/05/2008
Period 1 Year Plot Start00:00_01/07/1961 1961/62
Interval12 Hour Plot End 00:00_01/07/1962
DR014015 Darwin Airport 10.00 Total Rainfall (mm)
0
50
100
150
Jul Aug Sep Oct Nov Dec Jan Feb Mar Apr May Jun
NT Water Resources HYPLOT V130 Output 05/05/2008
Period 1 Year Plot Start00:00_01/07/1962 1962/63
Interval12 Hour Plot End 00:00_01/07/1963
DR014015 Darwin Airport 10.00 Total Rainfall (mm)
0
50
100
150
Jul Aug Sep Oct Nov Dec Jan Feb Mar Apr May Jun
NT Water Resources HYPLOT V130 Output 05/05/2008
Period 1 Year Plot Start00:00_01/07/1963 1963/64
Interval12 Hour Plot End 00:00_01/07/1964
DR014015 Darwin Airport 10.00 Total Rainfall (mm)
0
50
100
150
Jul Aug Sep Oct Nov Dec Jan Feb Mar Apr May Jun

25/09/2015
20
NT Water Resources HYPLOT V130 Output 05/05/2008
Period 1 Year Plot Start00:00_01/07/1964 1964/65
Interval12 Hour Plot End 00:00_01/07/1965
DR014015 Darwin Airport 10.00 Total Rainfall (mm)
0
50
100
150
Jul Aug Sep Oct Nov Dec Jan Feb Mar Apr May Jun
NT Water Resources HYPLOT V130 Output 05/05/2008
Period 1 Year Plot Start00:00_01/07/1965 1965/66
Interval12 Hour Plot End 00:00_01/07/1966
DR014015 Darwin Airport 10.00 Total Rainfall (mm)
0
50
100
150
Jul Aug Sep Oct Nov Dec Jan Feb Mar Apr May Jun
NT Water Resources HYPLOT V130 Output 05/05/2008
Period 1 Year Plot Start00:00_01/07/1966 1966/67
Interval12 Hour Plot End 00:00_01/07/1967
DR014015 Darwin Airport 10.00 Total Rainfall (mm)
0
50
100
150
Jul Aug Sep Oct Nov Dec Jan Feb Mar Apr May Jun
NT Water Resources HYPLOT V130 Output 05/05/2008
Period 1 Year Plot Start00:00_01/07/1967 1967/68
Interval12 Hour Plot End 00:00_01/07/1968
DR014015 Darwin Airport 10.00 Total Rainfall (mm)
0
50
100
150
Jul Aug Sep Oct Nov Dec Jan Feb Mar Apr May Jun
NT Water Resources HYPLOT V130 Output 05/05/2008
Period 1 Year Plot Start00:00_01/07/1968 1968/69
Interval12 Hour Plot End 00:00_01/07/1969
DR014015 Darwin Airport 10.00 Total Rainfall (mm)
0
50
100
150
Jul Aug Sep Oct Nov Dec Jan Feb Mar Apr May Jun
NT Water Resources HYPLOT V130 Output 05/05/2008
Period 1 Year Plot Start00:00_01/07/1969 1969/70
Interval12 Hour Plot End 00:00_01/07/1970
DR014015 Darwin Airport 10.00 Total Rainfall (mm)
0
50
100
150
Jul Aug Sep Oct Nov Dec Jan Feb Mar Apr May Jun

25/09/2015
21
NT Water Resources HYPLOT V130 Output 05/05/2008
Period 1 Year Plot Start00:00_01/07/1970 1970/71
Interval12 Hour Plot End 00:00_01/07/1971
DR014015 Darwin Airport 10.00 Total Rainfall (mm)
0
50
100
150
Jul Aug Sep Oct Nov Dec Jan Feb Mar Apr May Jun
NT Water Resources HYPLOT V130 Output 05/05/2008
Period 1 Year Plot Start00:00_01/07/1971 1971/72
Interval12 Hour Plot End 00:00_01/07/1972
DR014015 Darwin Airport 10.00 Total Rainfall (mm)
0
50
100
150
Jul Aug Sep Oct Nov Dec Jan Feb Mar Apr May Jun
NT Water Resources HYPLOT V130 Output 05/05/2008
Period 1 Year Plot Start00:00_01/07/1972 1972/73
Interval12 Hour Plot End 00:00_01/07/1973
DR014015 Darwin Airport 10.00 Total Rainfall (mm)
0
50
100
150
Jul Aug Sep Oct Nov Dec Jan Feb Mar Apr May Jun
NT Water Resources HYPLOT V130 Output 05/05/2008
Period 1 Year Plot Start00:00_01/07/1973 1973/74
Interval12 Hour Plot End 00:00_01/07/1974
DR014015 Darwin Airport 10.00 Total Rainfall (mm)
0
50
100
150
Jul Aug Sep Oct Nov Dec Jan Feb Mar Apr May Jun
NT Water Resources HYPLOT V130 Output 05/05/2008
Period 1 Year Plot Start00:00_01/07/1974 1974/75
Interval12 Hour Plot End 00:00_01/07/1975
DR014015 Darwin Airport 10.00 Total Rainfall (mm)
0
50
100
150
Jul Aug Sep Oct Nov Dec Jan Feb Mar Apr May Jun
NT Water Resources HYPLOT V130 Output 05/05/2008
Period 1 Year Plot Start00:00_01/07/1975 1975/76
Interval12 Hour Plot End 00:00_01/07/1976
DR014015 Darwin Airport 10.00 Total Rainfall (mm)
0
50
100
150
Jul Aug Sep Oct Nov Dec Jan Feb Mar Apr May Jun

25/09/2015
22
NT Water Resources HYPLOT V130 Output 05/05/2008
Period 1 Year Plot Start00:00_01/07/1976 1976/77
Interval12 Hour Plot End 00:00_01/07/1977
DR014015 Darwin Airport 10.00 Total Rainfall (mm)
0
50
100
150
Jul Aug Sep Oct Nov Dec Jan Feb Mar Apr May Jun
NT Water Resources HYPLOT V130 Output 05/05/2008
Period 1 Year Plot Start00:00_01/07/1977 1977/78
Interval12 Hour Plot End 00:00_01/07/1978
DR014015 Darwin Airport 10.00 Total Rainfall (mm)
0
50
100
150
Jul Aug Sep Oct Nov Dec Jan Feb Mar Apr May Jun
NT Water Resources HYPLOT V130 Output 05/05/2008
Period 1 Year Plot Start00:00_01/07/1978 1978/79
Interval12 Hour Plot End 00:00_01/07/1979
DR014015 Darwin Airport 10.00 Total Rainfall (mm)
0
50
100
150
Jul Aug Sep Oct Nov Dec Jan Feb Mar Apr May Jun
NT Water Resources HYPLOT V130 Output 05/05/2008
Period 1 Year Plot Start00:00_01/07/1979 1979/80
Interval12 Hour Plot End 00:00_01/07/1980
DR014015 Darwin Airport 10.00 Total Rainfall (mm)
0
50
100
150
Jul Aug Sep Oct Nov Dec Jan Feb Mar Apr May Jun
NT Water Resources HYPLOT V130 Output 05/05/2008
Period 1 Year Plot Start00:00_01/07/1980 1980/81
Interval12 Hour Plot End 00:00_01/07/1981
DR014015 Darwin Airport 10.00 Total Rainfall (mm)
0
50
100
150
Jul Aug Sep Oct Nov Dec Jan Feb Mar Apr May Jun
NT Water Resources HYPLOT V130 Output 05/05/2008
Period 1 Year Plot Start00:00_01/07/1981 1981/82
Interval12 Hour Plot End 00:00_01/07/1982
DR014015 Darwin Airport 10.00 Total Rainfall (mm)
0
50
100
150
Jul Aug Sep Oct Nov Dec Jan Feb Mar Apr May Jun
25/09/2015
23
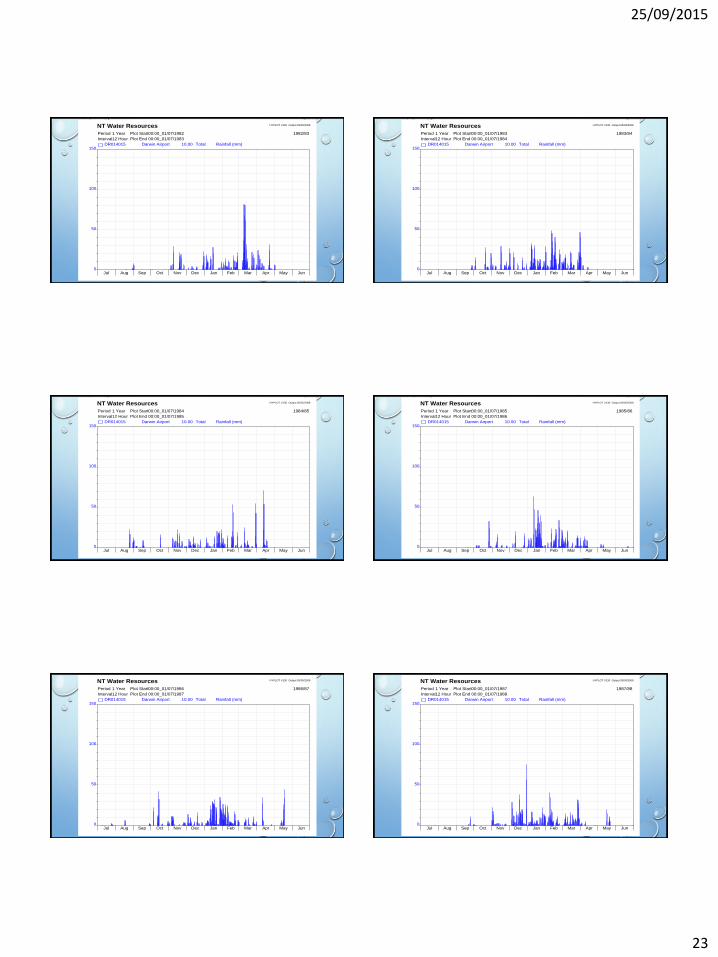
NT Water Resources HYPLOT V130 Output 05/05/2008
Period 1 Year Plot Start00:00_01/07/1982 1982/83
Interval12 Hour Plot End 00:00_01/07/1983
DR014015 Darwin Airport 10.00 Total Rainfall (mm)
0
50
100
150
Jul Aug Sep Oct Nov Dec Jan Feb Mar Apr May Jun
NT Water Resources HYPLOT V130 Output 05/05/2008
Period 1 Year Plot Start00:00_01/07/1983 1983/84
Interval12 Hour Plot End 00:00_01/07/1984
DR014015 Darwin Airport 10.00 Total Rainfall (mm)
0
50
100
150
Jul Aug Sep Oct Nov Dec Jan Feb Mar Apr May Jun
NT Water Resources HYPLOT V130 Output 05/05/2008
Period 1 Year Plot Start00:00_01/07/1984 1984/85
Interval12 Hour Plot End 00:00_01/07/1985
DR014015 Darwin Airport 10.00 Total Rainfall (mm)
0
50
100
150
Jul Aug Sep Oct Nov Dec Jan Feb Mar Apr May Jun
NT Water Resources HYPLOT V130 Output 05/05/2008
Period 1 Year Plot Start00:00_01/07/1985 1985/86
Interval12 Hour Plot End 00:00_01/07/1986
DR014015 Darwin Airport 10.00 Total Rainfall (mm)
0
50
100
150
Jul Aug Sep Oct Nov Dec Jan Feb Mar Apr May Jun
NT Water Resources HYPLOT V130 Output 05/05/2008
Period 1 Year Plot Start00:00_01/07/1986 1986/87
Interval12 Hour Plot End 00:00_01/07/1987
DR014015 Darwin Airport 10.00 Total Rainfall (mm)
0
50
100
150
Jul Aug Sep Oct Nov Dec Jan Feb Mar Apr May Jun
NT Water Resources HYPLOT V130 Output 05/05/2008
Period 1 Year Plot Start00:00_01/07/1987 1987/88
Interval12 Hour Plot End 00:00_01/07/1988
DR014015 Darwin Airport 10.00 Total Rainfall (mm)
0
50
100
150
Jul Aug Sep Oct Nov Dec Jan Feb Mar Apr May Jun
25/09/2015
24
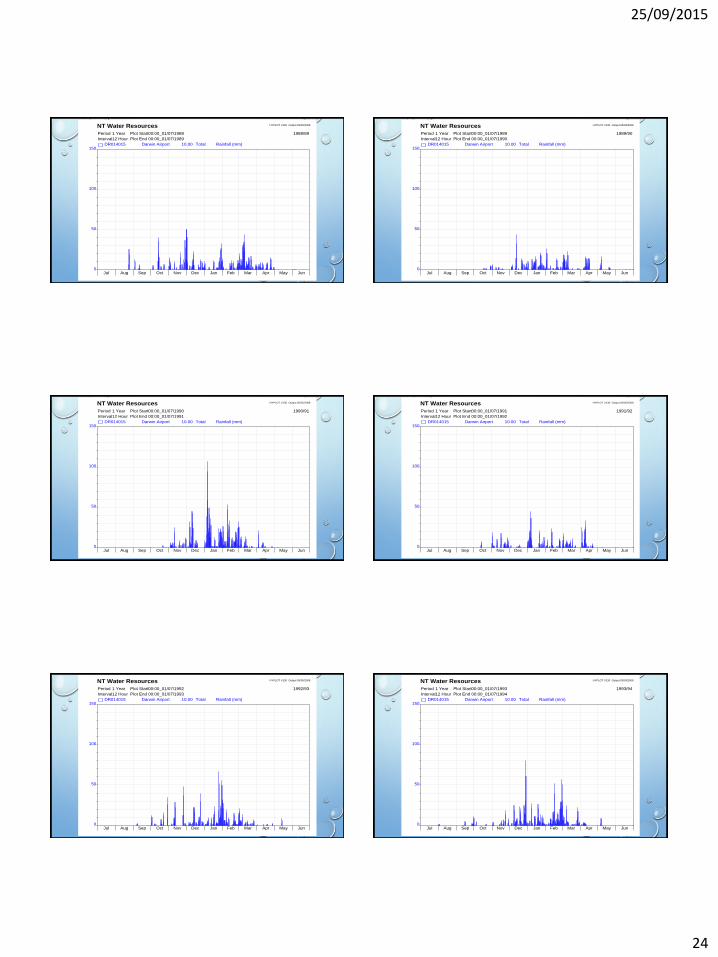
NT Water Resources HYPLOT V130 Output 05/05/2008
Period 1 Year Plot Start00:00_01/07/1988 1988/89
Interval12 Hour Plot End 00:00_01/07/1989
DR014015 Darwin Airport 10.00 Total Rainfall (mm)
0
50
100
150
Jul Aug Sep Oct Nov Dec Jan Feb Mar Apr May Jun
NT Water Resources HYPLOT V130 Output 05/05/2008
Period 1 Year Plot Start00:00_01/07/1989 1989/90
Interval12 Hour Plot End 00:00_01/07/1990
DR014015 Darwin Airport 10.00 Total Rainfall (mm)
0
50
100
150
Jul Aug Sep Oct Nov Dec Jan Feb Mar Apr May Jun
NT Water Resources HYPLOT V130 Output 05/05/2008
Period 1 Year Plot Start00:00_01/07/1990 1990/91
Interval12 Hour Plot End 00:00_01/07/1991
DR014015 Darwin Airport 10.00 Total Rainfall (mm)
0
50
100
150
Jul Aug Sep Oct Nov Dec Jan Feb Mar Apr May Jun
NT Water Resources HYPLOT V130 Output 05/05/2008
Period 1 Year Plot Start00:00_01/07/1991 1991/92
Interval12 Hour Plot End 00:00_01/07/1992
DR014015 Darwin Airport 10.00 Total Rainfall (mm)
0
50
100
150
Jul Aug Sep Oct Nov Dec Jan Feb Mar Apr May Jun
NT Water Resources HYPLOT V130 Output 05/05/2008
Period 1 Year Plot Start00:00_01/07/1992 1992/93
Interval12 Hour Plot End 00:00_01/07/1993
DR014015 Darwin Airport 10.00 Total Rainfall (mm)
0
50
100
150
Jul Aug Sep Oct Nov Dec Jan Feb Mar Apr May Jun
NT Water Resources HYPLOT V130 Output 05/05/2008
Period 1 Year Plot Start00:00_01/07/1993 1993/94
Interval12 Hour Plot End 00:00_01/07/1994
DR014015 Darwin Airport 10.00 Total Rainfall (mm)
0
50
100
150
Jul Aug Sep Oct Nov Dec Jan Feb Mar Apr May Jun

25/09/2015
25
NT Water Resources HYPLOT V130 Output 05/05/2008
Period 1 Year Plot Start00:00_01/07/1994 1994/95
Interval12 Hour Plot End 00:00_01/07/1995
DR014015 Darwin Airport 10.00 Total Rainfall (mm)
0
50
100
150
Jul Aug Sep Oct Nov Dec Jan Feb Mar Apr May Jun
NT Water Resources HYPLOT V130 Output 05/05/2008
Period 1 Year Plot Start00:00_01/07/1995 1995/96
Interval12 Hour Plot End 00:00_01/07/1996
DR014015 Darwin Airport 10.00 Total Rainfall (mm)
0
50
100
150
Jul Aug Sep Oct Nov Dec Jan Feb Mar Apr May Jun
NT Water Resources HYPLOT V130 Output 05/05/2008
Period 1 Year Plot Start00:00_01/07/1996 1996/97
Interval12 Hour Plot End 00:00_01/07/1997
DR014015 Darwin Airport 10.00 Total Rainfall (mm)
0
50
100
150
Jul Aug Sep Oct Nov Dec Jan Feb Mar Apr May Jun
NT Water Resources HYPLOT V130 Output 05/05/2008
Period 1 Year Plot Start00:00_01/07/1997 1997/98
Interval12 Hour Plot End 00:00_01/07/1998
DR014015 Darwin Airport 10.00 Total Rainfall (mm)
0
50
100
150
Jul Aug Sep Oct Nov Dec Jan Feb Mar Apr May Jun
NT Water Resources HYPLOT V130 Output 05/05/2008
Period 1 Year Plot Start00:00_01/07/1998 1998/99
Interval12 Hour Plot End 00:00_01/07/1999
DR014015 Darwin Airport 10.00 Total Rainfall (mm)
0
50
100
150
Jul Aug Sep Oct Nov Dec Jan Feb Mar Apr May Jun
NT Water Resources HYPLOT V130 Output 05/05/2008
Period 1 Year Plot Start00:00_01/07/1999 1999/00
Interval12 Hour Plot End 00:00_01/07/2000
DR014015 Darwin Airport 10.00 Total Rainfall (mm)
0
50
100
150
Jul Aug Sep Oct Nov Dec Jan Feb Mar Apr May Jun

25/09/2015
26
NT Water Resources HYPLOT V130 Output 05/05/2008
Period 1 Year Plot Start00:00_01/07/2000 2000/01
Interval12 Hour Plot End 00:00_01/07/2001
DR014015 Darwin Airport 10.00 Total Rainfall (mm)
0
50
100
150
Jul Aug Sep Oct Nov Dec Jan Feb Mar Apr May Jun
NT Water Resources HYPLOT V130 Output 05/05/2008
Period 1 Year Plot Start00:00_01/07/2001 2001/02
Interval12 Hour Plot End 00:00_01/07/2002
DR014015 Darwin Airport 10.00 Total Rainfall (mm)
0
50
100
150
Jul Aug Sep Oct Nov Dec Jan Feb Mar Apr May Jun
NT Water Resources HYPLOT V130 Output 05/05/2008
Period 1 Year Plot Start00:00_01/07/2002 2002/03
Interval12 Hour Plot End 00:00_01/07/2003
DR014015 Darwin Airport 10.00 Total Rainfall (mm)
0
50
100
150
Jul Aug Sep Oct Nov Dec Jan Feb Mar Apr May Jun
1988/89 A LONG WET
NT Water Resources HYPLOT V130 Output 05/05/2008
Period 1 Year Plot Start00:00_01/07/1988 1988/89
Interval12 Hour Plot End 00:00_01/07/1989
DR014015 Darwin Airport 10.00 Total Rainfall (mm)
0
10
20
30
40
50
60
Jul Aug Sep Oct Nov Dec Jan Feb Mar Apr May Jun
1949/50 A SHORT ONE NT Water Resources HYPLOT V130 Output 05/05/2008
Period 1 Year Plot Start00:00_01/07/1949 1949/50
Interval12 Hour Plot End 00:00_01/07/1950
DR014015 Darwin Airport 10.00 Total Rainfall (mm)
0
20
40
60
80
100
Jul Aug Sep Oct Nov Dec Jan Feb Mar Apr May Jun
1969 A DRY FEBRUARY
NT Water Resources HYPLOT V130 Output 05/05/2008
Period 1 Year Plot Start00:00_01/07/1968 1968/69
Interval12 Hour Plot End 00:00_01/07/1969
DR014015 Darwin Airport 10.00 Total Rainfall (mm)
0
25
50
75
Jul Aug Sep Oct Nov Dec Jan Feb Mar Apr May Jun156

25/09/2015
27
LONG TERM VARIABILITY
157
South Australia
Western Australia
North Australia
East Australia
DRY TIMES AT WILDMAN
158
WET TIMES AT WILDMAN
159
WET DRY IN ARNHEM LAND
160
Calvert River – August 1984 500 L/S Calvert River – November 2007 3643 L/S
LONG TERM RAINFALL TREND
161
CONSTRAINTS AND OPPORTUNITIES

25/09/2015
28
Springs
DALY BASIN
Tindal
Jinduckin
Oolloo
GDE- KATHERINE RIVER
The low Level- Katherine River GDE- Dry Season at Katherine River Sinkhole discharge
KATHERINE HOT SPRINGS
DALY RIVER SPRING

25/09/2015
29
Douglas River Dorrisvale Xing – Daly River
Daly River – Bank slumping AGRICULTURAL TIMELINE IN THE NT • YEAR MILESTONE COMMENT
• 2008 MAJOR LAND USE CHANGE IN DALY MIS FORESTRY
• 2007 BANANA PRODUCTION STOPS PRIMARILY DUE TO PANAMA DISEASE
• 2006 REVIEW SHOWS 156 CROPS TRIALED BY NT
• 2002 TABLE GRAPES DECLINE NEMATODES
• 2001 MANGO SEA FREIGHT TRIALS TO HONG KONG
• 1999 DOUBLING VALUE OF HORT EVERY 5 YEARS STOPS INDUSTRY GROWTH PLATEAUS
• 1997 PANAMA DISEASE IN BANANAS
MAJOR SLUMP IN LIVE CATTLE MAJOR GROWERS EFFECTED
• 1996 CONSERVATION FARMING SYSTEM NO TILL PLUS LEGUME ROTATION
• 1995 TIWI ISLAND FORESTRY PROJECT ACACIA MANGIUM FOR PULP IN
PARTNERSHIP WITH TLC STARTS
• 1993 CITRUS CANKER OUTBREAK
• 1992 LARGE SCALE BANANA PRODUCTION
• 1991 LIVE CATTLE EXPORTS AFTER BTEC RESURGENCE
• 1990 MELONS - THRIPS PALMII INDUSTRY COLLAPSES
KENAF RESEARCH CEASES
• 1989 TABLE GRAPES START AT TI TREE
172
AG TIMELINE CONTINUED
• YEAR MILESTONE COMMENT
• 1988 CUT FLOWER INDUSTRY STARTS
NURSERY SECTOR EXPANDS
BRUCELLOSIS FREEDOM
• LATE 80SKENAF RESEARCH STARTS
• 1984 KATHERINE MEATWORKS CLOSE UNION DISPUTE
• 1980S MOST CATTLE SOLD FOR US HAMBURGER MARKET
• 1980 MANBALLOO MANGOES START SINGLE LARGE PLANTING
• 1975 BUFFALO EXPORTS RECOMMENCE BRUNEI
• MID 70S CATTLE PRICES FALL, LIVE CATTLE TRADE RESTARTS
• 1970 BTEC START CULLING OF TB INFECTED STOCK
• 1968 RICE OPERATIONS CEASE AT TORTILLA
• 1967 TIPPERARY BOUGHT BY TEXANS THOUSANDS OF HA OF SORGHAM
• 1960S ORD RIVER SCHEME DEVELOPED
• 1964 LARGE SCALE SOWING OF IMPROVED PASTURES
• 1955 TERRITORY RICE LTD LASTED 15 YEARS @ COASTAL PLAINS AND TORTILLA
• 1940/50 LEGUME HAY FARMING DEVELOPED
173
RICE FARMING AT HUMPTY DOO
174

25/09/2015
30
HARVESTING AT HUMPTY DOO
175
RICE CULTIVATION IN THE NORTH
176
OPPORTUNITIES – WET SEASON HARVESTING SURFACE WATER DRAINAGE
OFF-STREAM STORAGE
179
OPPORTUNITIES – WET SEASON CROPPING
180

25/09/2015
31
Opportunities – Forestry OPPORTUNITIES - RESOURCE UTILISATION
182
STARK REALITIES OF A MODERN WORLD
183
A REMINDER
184
Photo by Arthur
Mostead. Sourced from
the Murray Darling
Basin Commission.
Photo by Arthur
Mostead. Sourced from
the Murray Darling
Basin Commission.