Entrepreneurship in the EU and Beyond
201
page 1 This survey was requested by Directorate-General for Enterprise and Industry, and coordinated by Directorate-General Communication This document does not represent the point of view of the European Commission. The interpretations and opinions contained in it are solely those of the authors. Flash Eurobarometer 283 – The Gallup Organization Flash Eurobarometer Entrepreneurship in the EU and beyond A survey in the EU, EFTA countries, Croatia, Turkey, the US, Japan, South Korea and China Analytical report Fieldwork: December 2009 Publication: May 2010 European Commission
-
Upload
patricia-gallardo -
Category
Documents
-
view
228 -
download
1
description
The European commission recently put out a report following a survey they did on entrepreneurship throughout the EU, EFTA countries, Croatia, Turkey, the US, Japan, South Korea and China. There is some great stuff in the report about how people view entrepreneurs and entrepreneurship. If you have not already seen the report I highly recommend having a glance at it. I have included the links below to the full report and the summary as well as some interesting items we found in the survey.
Transcript of Entrepreneurship in the EU and Beyond
page 1
Flash Eurobarometer
Consumer protection
and consumer rights
Analytical Report for
Cyprus- third wave
Fieldwork: June 2008
Publication: June 2008
This survey was requested by Directorate-General for Enterprise and Industry, and
coordinated by Directorate-General Communication
This document does not represent the point of view of the European Commission. The interpretations
and opinions contained in it are solely those of the authors.
European
Commission
Fla
sh
Eu
rob
aro
me
ter
28
3 –
Th
e G
allu
p O
rga
niz
ati
on
Flash Eurobarometer
Entrepreneurship in the EU
and beyond
A survey in the EU, EFTA countries, Croatia,
Turkey, the US, Japan, South Korea and China
Analytical report
Fieldwork: December 2009
Publication: May 2010
European
Commission

Flash EB Series #283
Entrepreneurship
in the EU and beyond
Survey conducted by The Gallup Organization,
Hungary upon the request of Directorate-General for Enterprise
and Industry
Coordinated by Directorate-General Communication
This document does not represent the point of
view of the European Commission. The interpretations and opinions contained in it
are solely those of the authors.
THE GALLUP ORGANIZATION
Flash EB No 283 – Entrepreneurship Analytical report
page 3
Table of contents
Table of contents ................................................................................................................................... 3
Introduction .......................................................................................................................................... 4
1. Self-employment vs. employee status .............................................................................................. 5
1.1 Preference for being self-employed rather than being an employee .......................................... 12
1.2 Explaining the choice for self-employment or employee status ................................................. 16
2. The image of entrepreneurs in society .......................................................................................... 24
2.1 How entrepreneurs are regarded ................................................................................................. 24
2.2 Attitudes towards entrepreneurs vs. other professional classes .................................................. 31
3. Feasibility of becoming self-employed .......................................................................................... 35
3.1 Feasibility of becoming self-employed in the next five years .................................................... 35
3.2 Reasons for self-employment not being feasible ........................................................................ 38
3.3 Preference for being self-employed vs. its feasibility ................................................................ 41
4. What would you do if you inherited a significant amount of money? ....................................... 43
5. Entrepreneurship and business activity ....................................................................................... 45
5.1 Experience of starting up a business........................................................................................... 45
5.2 Entrepreneurial activity .............................................................................................................. 47
5.3 Business discontinuity and failure .............................................................................................. 50
6. Starting up a business – necessary factors ................................................................................... 52
6.1 Important factors when starting up a business ............................................................................ 53
6.2 Preference to set up a new business or to take over an existing one .......................................... 63
6.3 Choosing to grow a new business quickly or progressively ....................................................... 66
6.4 Opportunity-driven vs. necessity-driven entrepreneurship ......................................................... 67
7. Business start-ups: perceptions about risks and barriers ........................................................... 70
7.1 Greatest fears when starting up a business ................................................................................. 70
7.2 Perceived barriers to entrepreneurship ....................................................................................... 75
8. Entrepreneurship: attitudes and personality characteristics ..................................................... 87
8.1 Agreement with statements about personality characteristics .................................................... 87
8.2 Personality characteristics associated with entrepreneurship ..................................................... 96
9. The impact of school education on entrepreneurship ................................................................. 97
I. Annex tables .................................................................................................................................. 107
II. Survey details ............................................................................................................................... 187
III. Questionnaire ............................................................................................................................. 193
Analytical report Flash EB No 283 – Entrepreneurship
page 4
Introduction
One of the main challenges facing EU Member States is the need to boost entrepreneurship. That was
one of the objectives set by the Lisbon European Council, in March 2000, with a view to improving
the Union’s performance in terms of employment, economic reform and social cohesion. The
European Commission opened the public debate by publishing, at the start of 2003, a Green Paper on
“Entrepreneurship in Europe”, which focused on two questions in particular:
Why do so few Europeans set up their own business?
Why are so few European businesses growing?
The development of entrepreneurship has important benefits, both economically and socially.
Entrepreneurship is not only a driving force for job creation, competitiveness and growth; it also
contributes to personal fulfilment and the achievement of social objectives. Moreover, numerous
factors play a role in the decision to start up a business, for example, the existence of a suitable
opportunity or market, any prevailing administrative complexities, financial obstacles or the need to
acquire new skills. That is why the EU considers that it has a duty to encourage entrepreneurial
initiatives and unlock the growth potential of its businesses and citizens.
The European Commission’s Directorate-General “Enterprise and Industry” has been studying, for the
past 10 years, the development of entrepreneurship in EU Member States, and has compared European
opinions with those outside of Europe, especially in the US. In the current survey – Flash
Eurobarometer No283 “Entrepreneurship in the EU and beyond” – the opinions of residents in some
Asian countries have been added to this comparison.
The earliest surveys1 covered the EU15
2, US, Iceland and Norway. The accession of 10 new Member
States to the EU, on 1 May 2004, enlarged the scope of the surveys conducted in 2004 (Flash No160)
and 2007 (No192) which, while ensuring the continuation of previous surveys, covered 28 countries –
the EU253, together with the US, Iceland and Norway. The current survey – Flash Eurobarometer
No283 “Entrepreneurship in the EU and beyond” – covers 36 countries:
the 27 EU Member States4
two candidate countries: Croatia and Turkey
three EFTA countries: Iceland, Norway and Switzerland
the US
three Asian countries: China, Japan and South Korea.
Flash Eurobarometer No283 “Entrepreneurship in the EU and beyond” covers topics such as the
development of entrepreneurship, how entrepreneurial mindsets are being fuelled and what encourages
people to become entrepreneurs. It provides data about public attitudes on issues such as
entrepreneurship, entrepreneurial education, risk-taking, start-ups, obstacles to entrepreneurship and
business failures.
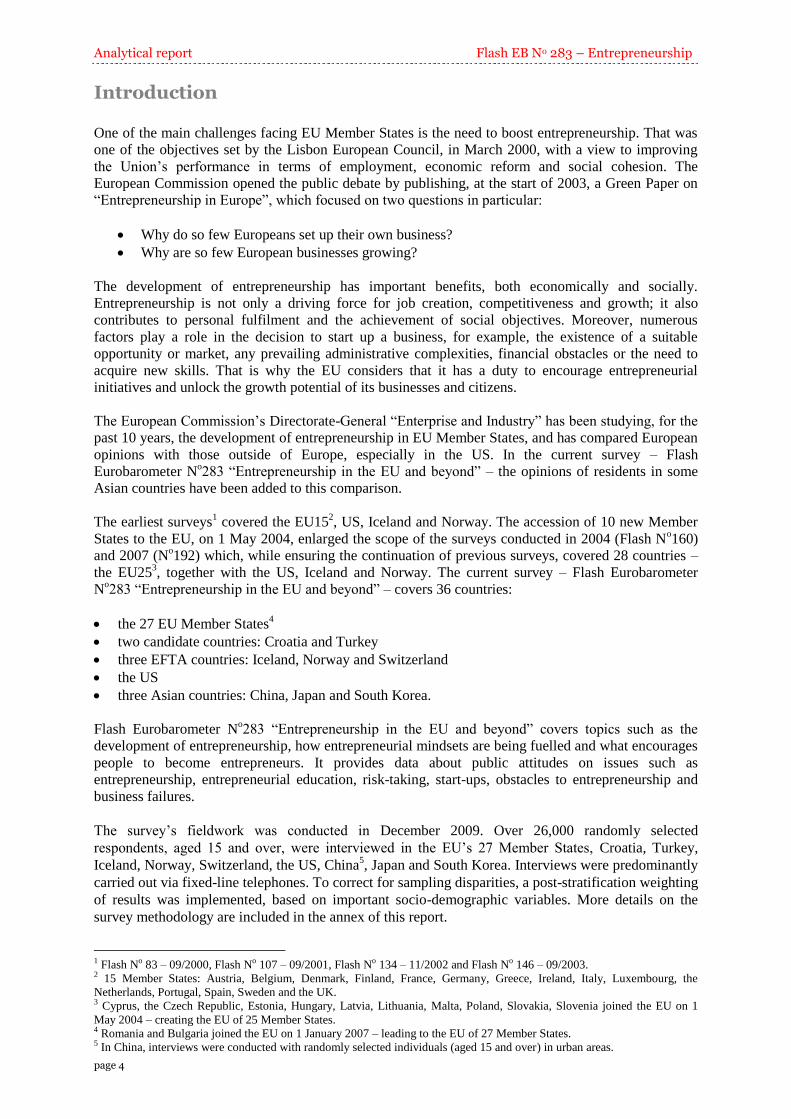
The survey’s fieldwork was conducted in December 2009. Over 26,000 randomly selected
respondents, aged 15 and over, were interviewed in the EU’s 27 Member States, Croatia, Turkey,
Iceland, Norway, Switzerland, the US, China5, Japan and South Korea. Interviews were predominantly
carried out via fixed-line telephones. To correct for sampling disparities, a post-stratification weighting
of results was implemented, based on important socio-demographic variables. More details on the
survey methodology are included in the annex of this report.
1 Flash No 83 – 09/2000, Flash No 107 – 09/2001, Flash No 134 – 11/2002 and Flash No 146 – 09/2003. 2 15 Member States: Austria, Belgium, Denmark, Finland, France, Germany, Greece, Ireland, Italy, Luxembourg, the
Netherlands, Portugal, Spain, Sweden and the UK. 3 Cyprus, the Czech Republic, Estonia, Hungary, Latvia, Lithuania, Malta, Poland, Slovakia, Slovenia joined the EU on 1
May 2004 – creating the EU of 25 Member States. 4 Romania and Bulgaria joined the EU on 1 January 2007 – leading to the EU of 27 Member States. 5 In China, interviews were conducted with randomly selected individuals (aged 15 and over) in urban areas.
Flash EB No 283 – Entrepreneurship Analytical report
page 5
Main findings
Self-employed or an employee – preferences and reasons
Preferences
EU citizens were almost evenly divided in their preference for being self-employed or having
employee status: 45% would prefer the former and 49% the latter. These EU-level results,
however, tended to hide large variations between individual Member States: the preference for
being self-employed varied from 26% in Slovakia to 66% in Cyprus.
In 18 EU Member States, respondents who preferred employee status outnumbered those who
would opt for self-employment.
Looking at 2000-2009, there have been major changes within individual EU Member States:
for example, in Cyprus, preference for self-employment was stable between 2004 and 2007,
but increased by 12 percentage points to 66% in 2009; in Portugal, the proportion of
respondents with a preference for self-employment has decreased to 51% (-20 points from
2002).
In the EU, men, younger interviewees, those with higher levels of education or those still in
education, and respondents with an entrepreneurial family background were more likely than
their counterparts to prefer to be self-employed.
Reasons for opting between self-employment or employee status
As for reasons why respondents would prefer to be an employee, four in 10 EU citizens
referred to a “regular and fixed income” and 35% mentioned “stability of employment”.
Across all of the surveyed countries, a regular, fixed income (vs. an irregular, variable income)
was mentioned most frequently as a reason for preferring employee status by respondents in
Turkey and Hungary (75% and 70%, respectively) and least often by respondents in China, the
US and Iceland (11%-14%).
Respondents in eastern European countries appeared to be more likely than their counterparts
in all other countries (expect for China) to name some constraints of being self-employed
(such as a lack of finances or lack of an appropriate business idea) as the reason for their
preference for employee status.
A large majority of EU citizens who expressed a preference for self-employment made this
choice because of the freedom provided, such as personal independence, self-fulfilment and
the chance to do something of personal interest (mentioned by 68%) or freedom to choose
their own place and time of work (35%).
Society’s image of entrepreneurs
How entrepreneurs are regarded by society
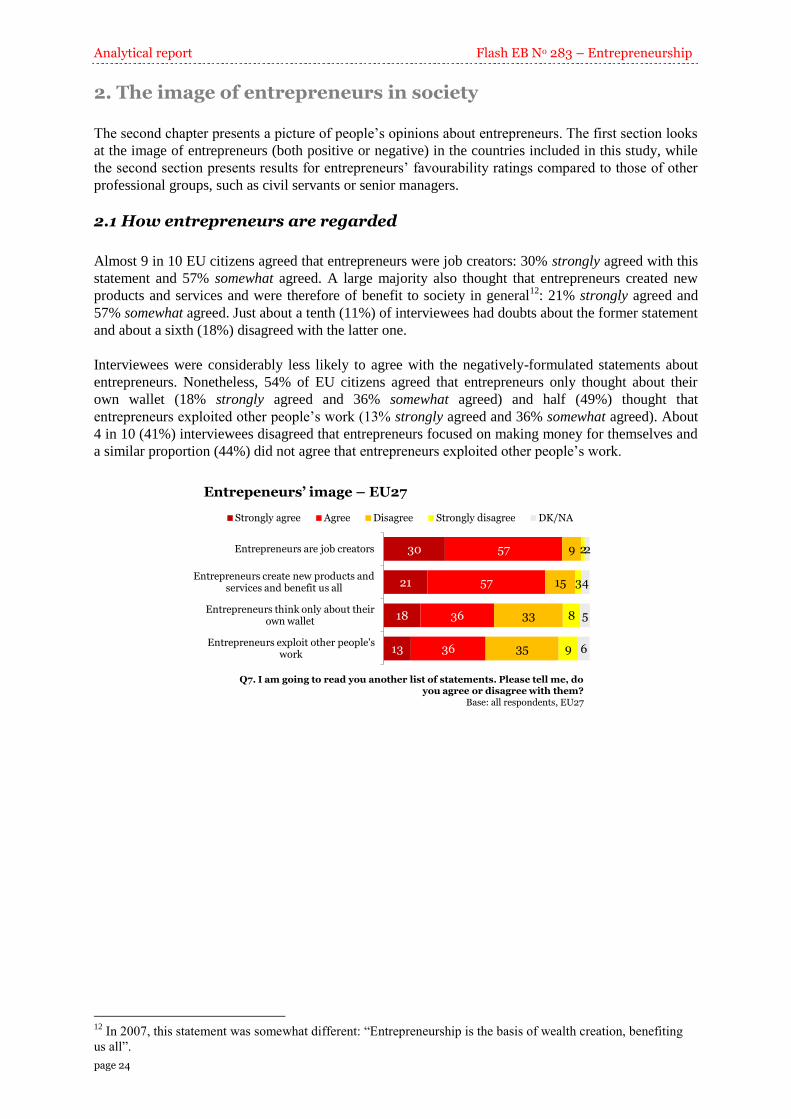
Almost 9 in 10 EU citizens agreed that entrepreneurs were job creators and a large majority
also thought that entrepreneurs created new products and services and were therefore of
benefit to society in general (78%).
Respondents across all countries included in the survey were in agreement that entrepreneurs
were both job creators and that they created new products and services and were therefore of
benefit to everyone; the US stood out with 60% and 56%, respectively, of interviewees who
strongly agreed with both statements.
Interviewees across the EU were not so likely to agree that entrepreneurs only thought about
their own wallet (54%) and that they exploited other people’s work (49%).
Analytical report Flash EB No 283 – Entrepreneurship
page 6
Comparing the 2007 and 2009 results, however, respondents in almost all countries were now
more likely to agree that entrepreneurs only thought about their wallet or that they exploited
other people’s work; these increases were particularly noticeable in Slovakia and Estonia.
Attitudes towards entrepreneurs compared to other professional classes
Entrepreneurs were rated favourably by 49% of EU respondents; only people working in the
liberal professions (such as lawyers, architects etc.) received a higher rating (58%).
While 83% of Danes and 78% of Finns held a favourable opinion about entrepreneurs, this
proportion dropped to 26% in Hungary.
Respondents in Iceland and the US (82% and 73%, respectively) shared this favourable
attitude towards entrepreneurs.
There were seven countries where entrepreneurs were ranked above all other professional
classes: Denmark, Iceland, Finland, the US, Ireland, Norway and Portugal.
Across almost all socio-demographic segments in the EU, entrepreneurs received the second
highest ratings – behind people working in the liberal professions.
Feasibility (or otherwise) of becoming self-employed
Feasibility of becoming self-employed
Two-thirds of EU citizens who were not (yet) self-employed at the time of the survey felt that
becoming self-employed in the next five years was unrealistic.
Several Nordic countries were among those with the highest proportions of respondents who
felt that becoming self-employed was realistic; in China, 49% of respondents thought this was
a possibility compared to just 12% of Japanese.
In almost half of all of the countries surveyed, the proportion of respondents who considered it
feasible to become self-employed in the next five years has decreased by at least five
percentage points from 2007 to 2009. The most significant decreases were seen in Slovakia,
Latvia and Lithuania.
In the EU, men, younger interviewees, those with an entrepreneurial family background,
respondents with higher levels of education and those still in education were more likely than
their counterparts to consider it feasible to become self-employed in the next five years.
Reasons for self-employment not being feasible
Focusing on EU citizens under the age of 65, 29% said it was not possible for them to become
self-employed because they did not have the finances to start-up a business and 15% said that
the timing was not right due to the current economic climate.
Bad timing due to the current economic climate was given as a reason why it would not be
feasible to become self-employed by 44% of Hungarian and 33% of Cypriot respondents aged
between 15 and 64; this reason was mentioned, however, by just 4%-5% of respondents in
Germany, the Netherlands, Sweden, Norway and Switzerland.
More than half of Croatian (55%), Hungarian (63%), Bulgarian (61%) and Romanian (68%)
15-64 year-olds, who considered it unrealistic to become self-employed in the next five years,
said it was a lack of finances that would prevent them from starting up a business.
Throughout the EU, a lack of finances was most often cited as a reason for not being able to
become self-employed by 25-39 year-olds, manual workers and respondents with financial
problems (41%, 44% and 42%, respectively, compared to an EU average of 24% for all ages).
Flash EB No 283 – Entrepreneurship Analytical report
page 7
The preference for being self-employed compared to its feasibility
Looking at those who were not self-employed, in most countries, the proportion of
respondents who considered it feasible to become self-employed in the next five years was
lower than the proportion of those who would like to be self-employed.
In the Nordic countries, however, an opposite trend was seen – i.e. the preference to be self-
employed was lower than the perceived feasibility of gaining such a status; for example, 49%
of non-self-employed Swedish respondents said it would be feasible to become self-employed
in the next five years, whereas just 28% had an actual preference for changing their status.
Likelihood of respondents starting up a business in the event that a significant amount of money
was inherited
Four in 10 Romanians, Turkish and Chinese respondents (41%-42%) and a third of Bulgarians
would start a business if they inherited a significant amount of money; there were more than
10 countries, however, where less than a tenth of respondents would consider doing this - for
example, 5% in Denmark and Japan and 6% in both Austria and Iceland.
In most countries, and in the EU overall, a relative majority of respondents would either save
the money or use it to buy a house or to repay their mortgage.
Entrepreneurship and business activity
Current entrepreneurial activity
Four percent of EU citizens were currently in the embryonic phase, i.e. taking the necessary
steps to start up a business, 3% were running a new business and 6% were running an
established business. In total, 12% of EU citizens were currently involved in entrepreneurial
activity.
Within the EU, Finland and Cyprus had the highest rates of entrepreneurial activity (25% and
19%, respectively). Belgium, Denmark, France, Luxembourg, Malta, Slovakia and Slovenia,
on the other hand, had entrepreneurship rates below 10%. Outside the EU, the level of
entrepreneurial activity was the highest in China (27%), followed by Turkey (23%), the US
(21%) and Iceland (20%).
A comparison between the 2007 and 2009 results showed the largest decreases in
entrepreneurial activity in Latvia and Estonia. In 2007, roughly a fifth of respondents in both
countries were starting up or running a business (18% and 22%, respectively). In 2009,
however, these proportions have been almost halved: to 10% in Latvia and 13% in Estonia.
Finland and Cyprus have seen an increase in entrepreneurial activity in comparison to previous
years: Finland has increased by 14 percentage points: from 11% in 2007 to 25% in 2009, in
Cyprus, this increase has been smaller, from 12% in 2004 to 19% in 2009 (+7 percentage
points).
Entrepreneurship rates in the EU were higher for men, 25-54 year-olds, respondents with a
higher level of education, respondents without financial difficulties and those with an
entrepreneurial family background.
Never considered starting a business
In the EU, the proportion of respondents who had never thought about starting up a business
ranged from 32% in Greece to 65% in Luxembourg. The latter country was followed by
Belgium and Slovakia, where 62%-63% of interviewees had never thought about starting up a
business.
Analytical report Flash EB No 283 – Entrepreneurship
page 8
The Japanese were the most likely to have never considered starting up a business, while the
Chinese were the least likely to say this (67% and 22%, respectively).
Business failure
In most of the surveyed countries, respondents who said they had sold, transferred or closed
their business outnumbered those who said that their business had failed. For example, 34% of
British respondents having business experience said that they had sold, transferred or closed
their business and 9% reported a business failure.
Points to consider during business start-ups
Key driving factors
As in previous years, EU citizens, in almost all countries, who had once started up a business
or who were thinking about taking the necessary steps to start one, were most likely to answer
that an appropriate business idea (85%) and receiving the necessary financial means (81%)
had motivated them to start up a business.
A slim majority of EU citizens (56%) identified dissatisfaction with their previous situation as
an important element in their decision to take steps to start up a business.
This same factor influenced three-quarters of Slovak and Turkish interviewees. Furthermore,
five eastern European countries – Lithuania, the Czech Republic, Hungary, Romania and Latvia
– joined these two with between 69% and 72% of respondents who said that dissatisfaction with
their previous situation had influenced their decision to start up a business.
Slovakia and Latvia had the largest increases in the proportion of respondents who said
dissatisfaction with their previous situation had influenced their decision to start up a business
(Slovakia: from 59% in 2007 to 76% in 2009; Latvia: from 59% to 71%).
Starting a new or taking over an existing business?
Across almost all countries surveyed, for respondents with business experience, the proportion
who would prefer to set up a new business largely outnumbered those who would prefer to
take over an existing venture: in the EU, 61% for the former and 24% for the latter.
Recommended rate of growth
About a sixth (17%) of EU citizens would advise a friend who had just started a business to try
to expand it as quickly as possible; roughly three-quarters (74%) would give the advice to
grow it slowly (if at all).
There were, however, large variations between individual countries included in the survey:
41% French respondents said that the best approach for a new business would be to expand it
as quickly as possible, but just 3% of Icelandic respondents shared this view.
Throughout the EU, younger respondents, full-time students and those with a high level of
education were more likely than their counterparts to feel that the best approach for a new
business would be to expand it as quickly as possible.
Opportunity or necessity
In the EU, among respondents who had started up a business or were currently taking steps to
start one, 55% answered that they had started/were starting this business because they saw an
opportunity and 28% did so out of necessity.
Respondents in Denmark and the Netherlands were the most likely to say they had
started/were starting a business because they had seen an opportunity (81% and 78%,
Flash EB No 283 – Entrepreneurship Analytical report
page 9
respectively). In Estonia, Bulgaria and Greece, less than 4 in 10 responded in that way (36%-
39%).
The US and Switzerland scored higher than the EU average in terms of the proportion of
respondents identifying opportunity-driven entrepreneurship (62% and 65%, respectively, vs.
55%).
The highest proportion of necessity-driven entrepreneurship was measured in South Korea
(64% – compared to 18% “opportunity-driven”). In China and Japan, 50% of respondents
answered that they had starting/were starting a business out of necessity.
Perceptions about the risks involved and barriers to starting up a business
Greatest fears
When EU citizens were asked what they would fear most if they were starting up a business in
today’s economic climate, about half (49%) said it was the possibility of going bankrupt. The
uncertainty of not having a regular income was mentioned by 40% of respondents and a
somewhat lower proportion (37%) selected the risk of losing their property.
Respondents in Lithuania, Croatia and Turkey were the most likely to answer that they would
fear the possibility of going bankrupt if they were setting up a business (57%-59%). Six in 10
Hungarians and about half of Greeks, Poles and Swedes (51%-52%) were most afraid of the
uncertainty of not having a regular income when starting up a business.
In 24 of the countries surveyed, the possibility of going bankrupt, the uncertainty of not
having a regular income and the risk of losing their property were the three most mentioned
fears associated with a business start-up.
Perceived barriers
Roughly 8 in 10 EU citizens agreed that it was difficult to start up a business due to a lack of
available financial support. A large majority of respondents (71%) also agreed that business
start-ups were difficult due to complex administrative procedures.
Furthermore, across all EU Member States, a majority of interviewees agreed that it was
difficult to start one’s own business due to a lack of available financial support and that it was
difficult to start up one’s own business due to complex administrative procedures.
Across the EU, on average, more respondents now said it was difficult to start up a business
due to a lack of available financial support compared to the number in 2007: 81% in 2009
compared to 75% in 2007. The proportion saying sufficient information needed to start up a
business was not available has also increased: from 46% in 2007 to 51% in 2009.
In the EU, older respondents, those with a lower level of education, manual workers and
respondents who found it hard to manage on their current household income tended to be
somewhat more likely to agree that business start-ups were difficult due to a lack of financial
support, complex administrative procedures and problems in obtaining sufficient information.
The part played by attitudes and personality characteristics in business start-ups
In the EU, the proportion of respondents who agreed that they were generally willing to take
risks ranged from less than half of respondents in Hungary and Lithuania (43% and 46%,
respectively) to 73% in Cyprus, Ireland and Romania.
A similar variation in the total level of agreement was also seen across the other countries
included in this study: respondents in Japan were the least likely to say they were risk-takers
(39%) and respondents in the US were the most likely to fit that profile (82%).
Analytical report Flash EB No 283 – Entrepreneurship
page 10
Respondents in the US most frequently agreed that they liked situations in which they
competed with others (77%). The US was followed by Ireland, Luxembourg, Malta and China,
where roughly 7 in 10 interviewees agreed that they liked to compete with others.
In all countries surveyed, except Japan, a majority of interviewees agreed with the statement
that they were inventive people; the level of agreement ranged from 59% in Korea to 93% in
Cyprus.
EU citizens having business experience were more likely than their counterparts to be willing
to take risks, enjoy competition and to have a feeling they were inventive. For example, while
62% of respondents who did not have any business experience agreed that they were generally
willing to take risks, this proportion rose to 76% for respondents who had started up a business
or who were currently taking steps to start up such a venture.
The impact of school education
Equal proportions of EU citizens agreed, or rather disagreed, that their school education had
helped them to develop a sort of entrepreneurial attitude (49%-49%).
Roughly 4 in 10 EU citizens agreed that their school education gave them the skills and know-
how to enable them to become an entrepreneur (39%); just a quarter agreed, however, that
their education had also made them interested in becoming an entrepreneur.
In the EU, the proportion of interviewees who agreed that their school education had helped
them to develop an entrepreneurial attitude ranged from roughly a quarter (26%) in Latvia to
more than double that proportion in Cyprus and Portugal (63%-64%).
None of the EU countries reached the levels measured in Turkey, the US and China where
more than two-thirds of respondents agreed that that their school education had helped them to
develop an entrepreneurial attitude (68%-73%).
Furthermore, respondents in Turkey, the US and China most frequently agreed that their
school education had helped them to better understand the role of entrepreneurs in society;
more than 7 in 10 respondents in these countries agreed with the statement.
For both of the above two statements, the US had the most respondents strongly agreeing
(36% and 35%, respectively).
A comparison, between 2007 and 2009 results, concerning the extent to which respondents
agreed that their school education prepared them to become entrepreneurs showed that, in
2007, a number of European countries scored better than the US in stimulating
entrepreneurship (e.g. Norway 74%, Portugal 71% vs. US 63%); in 2009, however, the US
outscored all European countries (US 73%, Cyprus 64%, Portugal 63%).
The EU in comparison to the US and China6
Chinese respondents were much more likely to say they would prefer to be self-employed
rather than an employee (71% vs. 55% of Americans and 45% of EU citizens).
Entrepreneurs have a better image in the US than in the EU and China: 85% of American
respondents saw entrepreneurs as job creators, vs. 87%-88% of Chinese and EU citizens;
similar numbers were seen for opinions about entrepreneurs being beneficial for all.
In the event of receiving a significant inheritance, a relative majority of Chinese would start a
business (41%); in comparison, 48% of Americans would save the money and EU citizens
would either save the money (30%) or buy a house (31%).
6 In China, interviews were conducted with randomly selected individuals (aged 15 and over) in 50 cities; this
sample covered 115,000,000 of the 615,000,000 urban inhabitants – and accurately represented the total urban
population.
Flash EB No 283 – Entrepreneurship Analytical report
page 11
Over a third (37%) of Chinese respondents would expand a new business as quickly as
possible; the figures for the EU and the US were, respectively, 17% and 14%.
Half of Chinese respondents who had started a business said this had been necessity-driven; in
comparison, 62% of Americans and 55% of EU citizens said they had seen an opportunity.
American respondents were more likely than EU citizens and Chinese respondents to say they
were risk-takers and liked competition (77%-82%); in comparison, the proportions for EU
citizens were 55%-65% and for Chinese respondents, 65%-69%.
When the impact of school education on entrepreneurship was measured, the US and China
were seen to be ahead of the EU in all aspects: when asked to agree that a sense of initiative
had been engendered, an understanding of entrepreneurship gained, and the necessary skills
and interest developed, the proportions of Americans and Chinese respondents agreeing were,
respectively, 51%-73% and 53%-75%; the proportions for the EU were 25%-49%.
Furthermore, since 2007, the US proportions have been increasing whilst the EU proportions
have been decreasing.
Analytical report Flash EB No 283 – Entrepreneurship
page 12
1. Self-employment vs. employee status
This first chapter examines EU citizens’ preferences for being self-employed or employed7 in today’s
economic climate; these choices are compared with the results recorded in the period 2000-2007. In
addition, EU citizens’ preferences are compared with those of citizens in other European countries, the
US and in a number of countries in Asia.
1.1 Preference for being self-employed rather than being an employee
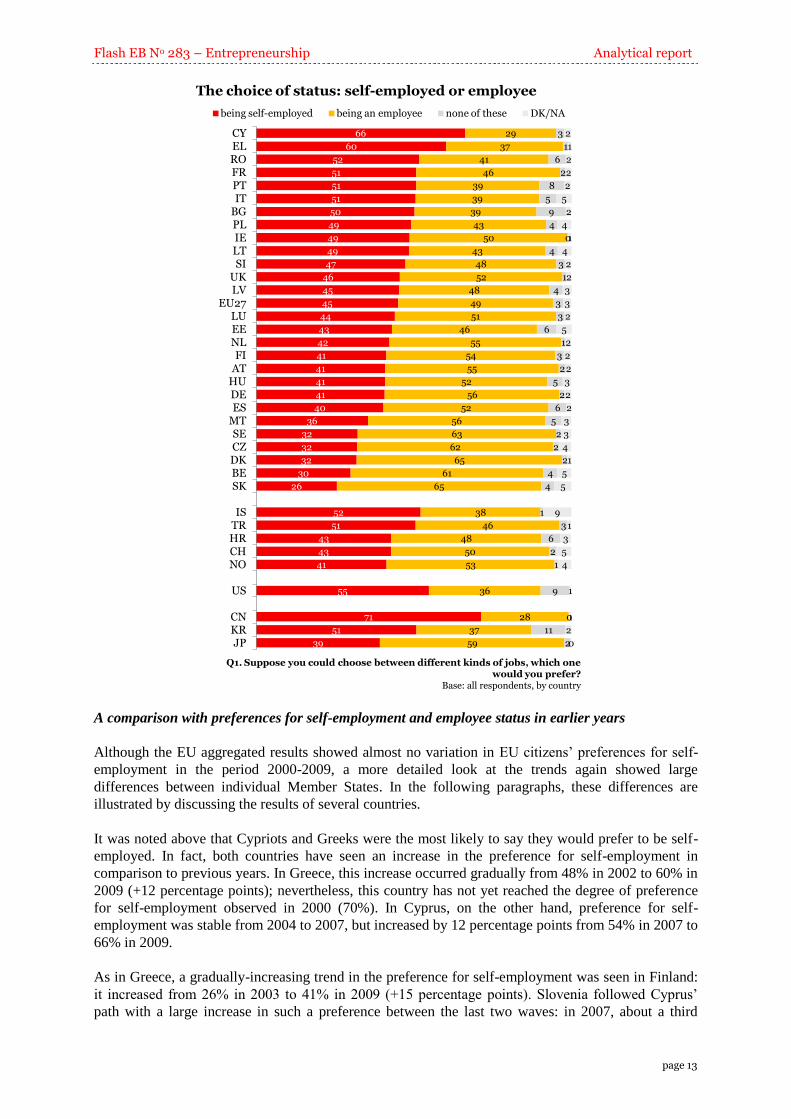
EU citizens appeared to be almost evenly divided in their preference for being self-employed or for
having employee status: 45% would prefer the former and 49% the latter. These EU-level results,
however, tended to hide large variations between individual Member States; the chart on the next page
shows that the preference for being self-employed varied from 26% in Slovakia to 66% in Cyprus.
Similarly, while just 29% of Cypriots would prefer to be an employee, this proportion increased to
65% for Slovaks and Danes.
Respondents in Cyprus and Greece were the most likely to answer that they would prefer to be self-
employed rather than an employee (66% and 60%, respectively, selected “self-employment”). In a
further eight countries – Ireland, Lithuania, Poland, Bulgaria, France, Italy, Portugal and Romania –
about half of respondents expressed such a preference (49%-52%).
In almost all other EU Member States, however, respondents who preferred employee status
outnumbered those who would opt for self-employment. For example, 55% of Dutch residents would
prefer to be an employee, while 42% would choose self-employment. The proportions of respondents
who selected “employee status” were the highest in Belgium (61%), the Czech Republic (62%),
Sweden (63%), Denmark and Slovakia (both 65%). In these five countries, less than a third of
respondents said they would prefer to be self-employed (26%-32%).
In the US, a majority of respondents would opt for self-employment, while just over a third would
prefer to be an employee (55% vs. 36%). Similar results were seen in Iceland (52% “self-employment”
vs. 38% “employee status”), Turkey (51% vs. 46%) and South Korea (51% vs. 37%). Respondents in
China8, however, were the most likely to say they would prefer to be self-employed rather than an
employee (71% vs. 28%).
The results in Croatia, Norway and Switzerland, on the other hand, were similar to those in the
majority of EU Member States: more respondents preferred “employee status” than “self-
employment”. For example, 53% of Norwegians expressed a preference for employee status and 41%
would prefer to be self-employed.
7 Employees are individuals who work for a company in return for financial or other compensation and benefits;
self-employed individuals earn their livelihood directly from their own trade or business rather than as an
employee. 8 Note that interviews in China were concentrated in urban areas. Interviews were conducted with randomly
selected individuals (aged 15 and over) in 50 cities; this sample covered 115,000,000 of the 615,000,000 urban
inhabitants – and accurately represented the total urban population.
Flash EB No 283 – Entrepreneurship Analytical report
page 13
The choice of status: self-employed or employee
66
60
52
51
51
51
50
49
49
49
47
46
45
45
44
43
42
41
41
41
41
40
36
32
32
32
30
26
52
51
43
43
41
55
71
51
39
29
37
41
46
39
39
39
43
50
43
48
52
48
49
51
46
55
54
55
52
56
52
56
63
62
65
61
65
38
46
48
50
53
36
28
37
59
3
1
6
2
8
5
9
4
0
4
3
1
4
3
3
6
1
3
2
5
2
6
5
2
2
2
4
4
1
3
6
2
1
9
0
11
2
2
1
2
2
2
5
2
4
1
4
2
2
3
3
2
5
2
2
2
3
2
2
3
3
4
1
5
5
9
1
3
5
4
1
1
2
0
CYELROFRPTIT
BGPLIELTSI
UKLV
EU27LUEENLFI
ATHUDEES
MTSECZDKBESK
ISTRHRCHNO
US
CNKRJP
being self-employed being an employee none of these DK/NA
Q1. Suppose you could choose between different kinds of jobs, which one would you prefer?
Base: all respondents, by country
A comparison with preferences for self-employment and employee status in earlier years
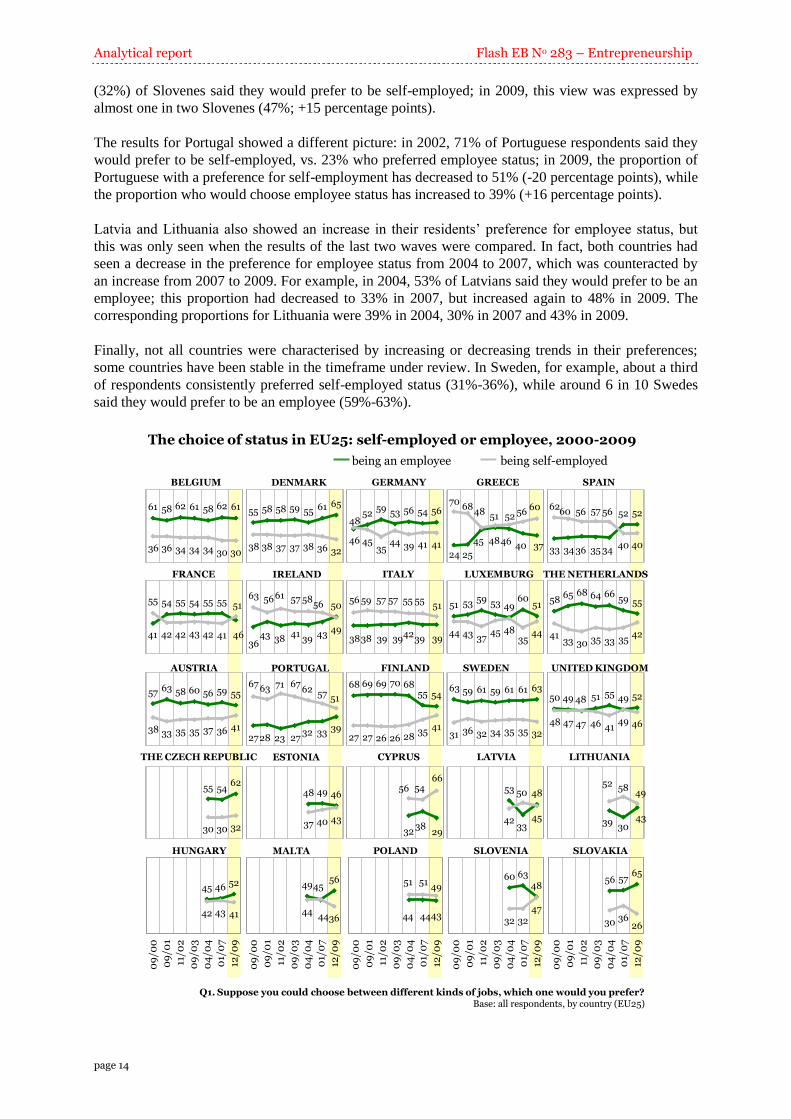
Although the EU aggregated results showed almost no variation in EU citizens’ preferences for self-
employment in the period 2000-2009, a more detailed look at the trends again showed large
differences between individual Member States. In the following paragraphs, these differences are
illustrated by discussing the results of several countries.
It was noted above that Cypriots and Greeks were the most likely to say they would prefer to be self-
employed. In fact, both countries have seen an increase in the preference for self-employment in
comparison to previous years. In Greece, this increase occurred gradually from 48% in 2002 to 60% in
2009 (+12 percentage points); nevertheless, this country has not yet reached the degree of preference
for self-employment observed in 2000 (70%). In Cyprus, on the other hand, preference for self-
employment was stable from 2004 to 2007, but increased by 12 percentage points from 54% in 2007 to
66% in 2009.
As in Greece, a gradually-increasing trend in the preference for self-employment was seen in Finland:
it increased from 26% in 2003 to 41% in 2009 (+15 percentage points). Slovenia followed Cyprus’
path with a large increase in such a preference between the last two waves: in 2007, about a third
Analytical report Flash EB No 283 – Entrepreneurship
page 14
(32%) of Slovenes said they would prefer to be self-employed; in 2009, this view was expressed by
almost one in two Slovenes (47%; +15 percentage points).
The results for Portugal showed a different picture: in 2002, 71% of Portuguese respondents said they
would prefer to be self-employed, vs. 23% who preferred employee status; in 2009, the proportion of
Portuguese with a preference for self-employment has decreased to 51% (-20 percentage points), while
the proportion who would choose employee status has increased to 39% (+16 percentage points).
Latvia and Lithuania also showed an increase in their residents’ preference for employee status, but
this was only seen when the results of the last two waves were compared. In fact, both countries had
seen a decrease in the preference for employee status from 2004 to 2007, which was counteracted by
an increase from 2007 to 2009. For example, in 2004, 53% of Latvians said they would prefer to be an
employee; this proportion had decreased to 33% in 2007, but increased again to 48% in 2009. The
corresponding proportions for Lithuania were 39% in 2004, 30% in 2007 and 43% in 2009.
Finally, not all countries were characterised by increasing or decreasing trends in their preferences;
some countries have been stable in the timeframe under review. In Sweden, for example, about a third
of respondents consistently preferred self-employed status (31%-36%), while around 6 in 10 Swedes
said they would prefer to be an employee (59%-63%).
60 6348
32 3247
09
/00
09
/01
11/0
2
09
/03
04
/04
01/
07
12/0
9
45 46 52
42 43 41
09
/00
09
/01
11/0
2
09
/03
04
/04
01/
07
12/0
9
49
44
56
44
45
36
09
/00
09
/01
11/0
2
09
/03
04
/04
01/
07
12/0
9
44 4443
51 5149
09
/00
09
/01
11/0
2
09
/03
04
/04
01/
07
12/0
9
56 5765
30 3626
09
/00
09
/01
11/0
2
09
/03
04
/04
01/
07
12/0
9
55 5462
30 30 32
The choice of status in EU25: self-employed or employee, 2000-2009
BELGIUM
FRANCE
being an employee being self-employed
DENMARK
IRELAND
GERMANY
ITALY
GREECE
LUXEMBURG
SPAIN
THE NETHERLANDS
61 58 62 61 58 62 61
36 36 34 34 34 30 30
THE CZECH REPUBLIC ESTONIA CYPRUS LATVIA LITHUANIA
AUSTRIA PORTUGAL FINLAND SWEDEN UNITED KINGDOM
HUNGARY MALTA POLAND SLOVENIA SLOVAKIA
55 58 58 59 55 61 65
38 38 37 37 38 36 3246
5259 53 56 54 56
48
4535
44 39 41 4124 25
45 4846 40 37
7068
4851 52 56
60
33 34 36 35 34
52 5262
60 56 57 56
40 40
41
54 55 54 55 55
46
55
42 42 43 42 41
51
3643 38
4139 43
5063 5661 57 58
56
493838 39 39
4239 39
56 59 57 57 55 5551 51 53 59 53 49
6051
44 43 3745 48
3544
5865 68 64 66
59 55
4133 30 35 33 35
42
57 63 58 60 56 59 55
38 33 35 35 37 36 412728 23 27
32 33 39
6763 71 6762 57 51
68 69 69 70 6855 54
27 27 26 26 2835 41
63 59 61 59 61 61 63
31 36 32 34 35 35 32
50 49
47
51 55 49 52
48 47
48
46 4149 46
48 49 46
37 40 43
3238
29
56 5466
53
33
48
42
50
45 3930
43
52 5849
Q1. Suppose you could choose between different kinds of jobs, which one would you prefer?Base: all respondents, by country (EU25)
Flash EB No 283 – Entrepreneurship Analytical report
page 15
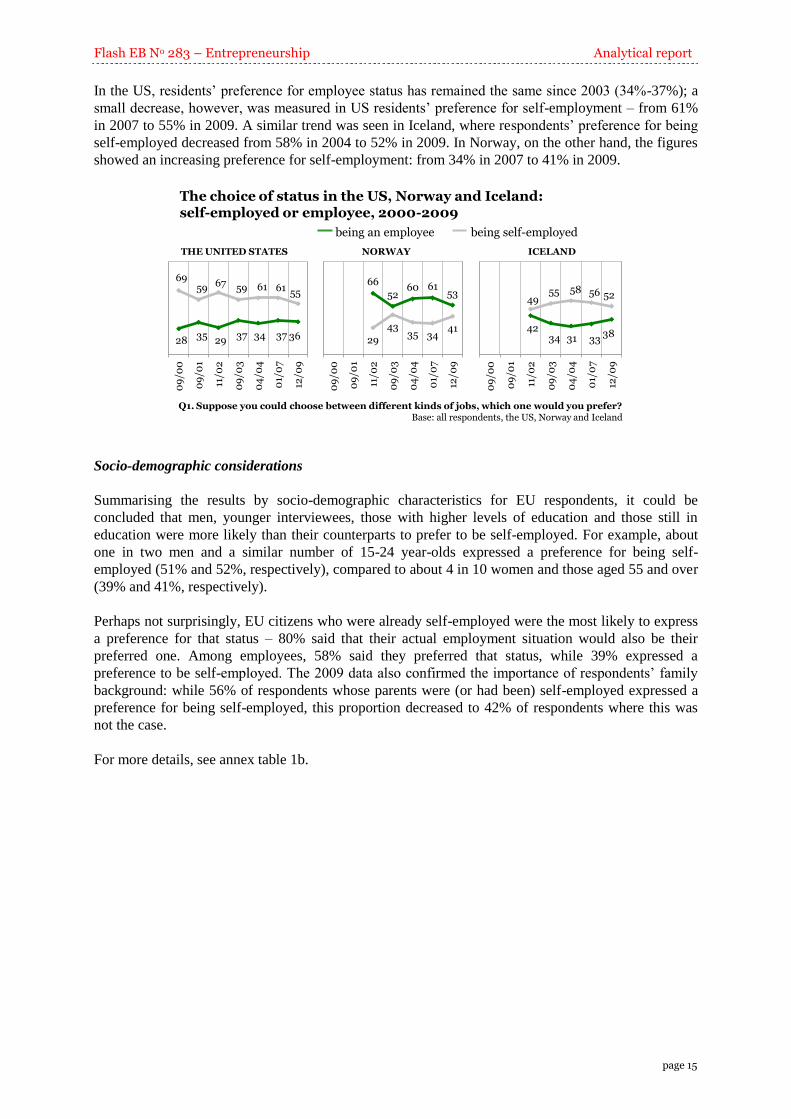
In the US, residents’ preference for employee status has remained the same since 2003 (34%-37%); a
small decrease, however, was measured in US residents’ preference for self-employment – from 61%
in 2007 to 55% in 2009. A similar trend was seen in Iceland, where respondents’ preference for being
self-employed decreased from 58% in 2004 to 52% in 2009. In Norway, on the other hand, the figures
showed an increasing preference for self-employment: from 34% in 2007 to 41% in 2009.
The choice of status in the US, Norway and Iceland: self-employed or employee, 2000-2009
Q1. Suppose you could choose between different kinds of jobs, which one would you prefer?Base: all respondents, the US, Norway and Iceland
66
5260 61
53
29
4335 34
410
9/0
0
09
/01
11/0
2
09
/03
04
/04
01/
07
12/0
9
4234 31 33
38
4955 58 56 52
09
/00
09
/01
11/0
2
09
/03
04
/04
01/
07
12/0
9
being an employee being self-employed
28 35 29 37 34 37 36
6959 67 59 61 61 55
09
/00
09
/01
11/0
2
09
/03
04
/04
01/
07
12/0
9
THE UNITED STATES NORWAY ICELAND
Socio-demographic considerations
Summarising the results by socio-demographic characteristics for EU respondents, it could be
concluded that men, younger interviewees, those with higher levels of education and those still in
education were more likely than their counterparts to prefer to be self-employed. For example, about
one in two men and a similar number of 15-24 year-olds expressed a preference for being self-
employed (51% and 52%, respectively), compared to about 4 in 10 women and those aged 55 and over
(39% and 41%, respectively).
Perhaps not surprisingly, EU citizens who were already self-employed were the most likely to express
a preference for that status – 80% said that their actual employment situation would also be their
preferred one. Among employees, 58% said they preferred that status, while 39% expressed a
preference to be self-employed. The 2009 data also confirmed the importance of respondents’ family
background: while 56% of respondents whose parents were (or had been) self-employed expressed a
preference for being self-employed, this proportion decreased to 42% of respondents where this was
not the case.
For more details, see annex table 1b.
Analytical report Flash EB No 283 – Entrepreneurship
page 16
1.2 Explaining the choice for self-employment or employee status9
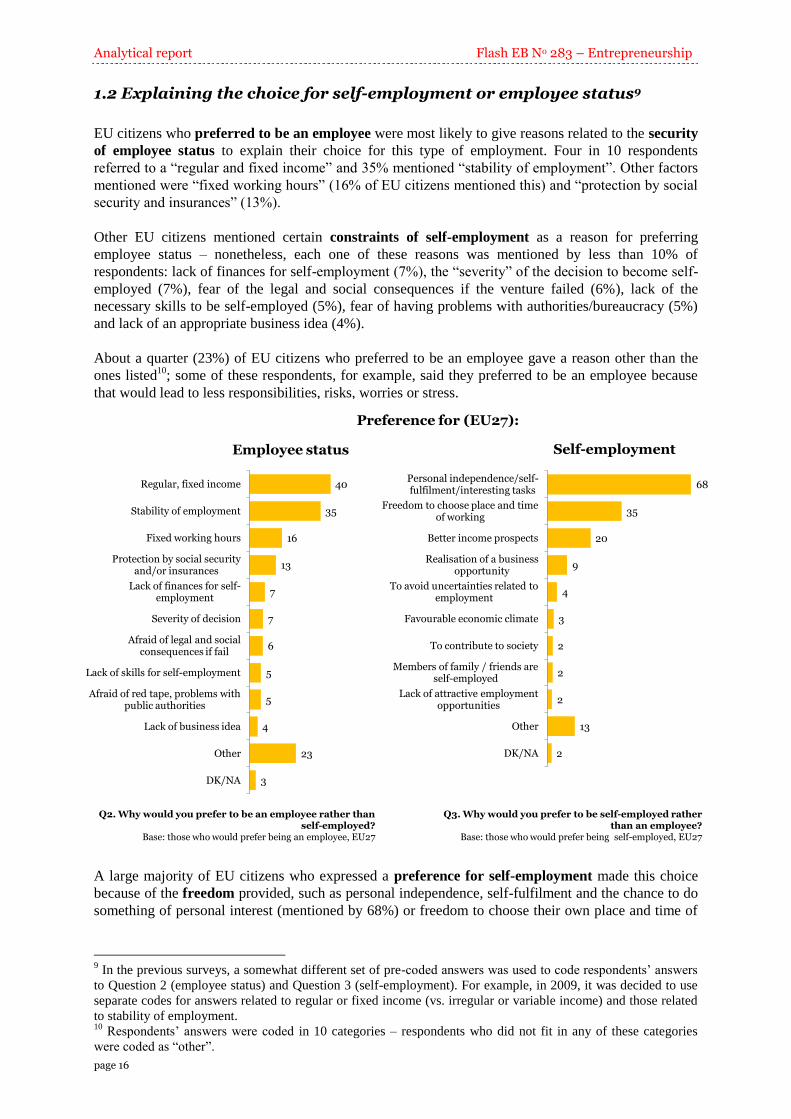
EU citizens who preferred to be an employee were most likely to give reasons related to the security
of employee status to explain their choice for this type of employment. Four in 10 respondents
referred to a “regular and fixed income” and 35% mentioned “stability of employment”. Other factors
mentioned were “fixed working hours” (16% of EU citizens mentioned this) and “protection by social
security and insurances” (13%).
Other EU citizens mentioned certain constraints of self-employment as a reason for preferring
employee status – nonetheless, each one of these reasons was mentioned by less than 10% of
respondents: lack of finances for self-employment (7%), the “severity” of the decision to become self-
employed (7%), fear of the legal and social consequences if the venture failed (6%), lack of the
necessary skills to be self-employed (5%), fear of having problems with authorities/bureaucracy (5%)
and lack of an appropriate business idea (4%).
About a quarter (23%) of EU citizens who preferred to be an employee gave a reason other than the
ones listed10
; some of these respondents, for example, said they preferred to be an employee because
that would lead to less responsibilities, risks, worries or stress.
Employee status
40
35
16
13
7
7
6
5
5
4
23
3
Regular, fixed income
Stability of employment
Fixed working hours
Protection by social security and/or insurances
Lack of finances for self-employment
Severity of decision
Afraid of legal and social consequences if fail
Lack of skills for self-employment
Afraid of red tape, problems with public authorities
Lack of business idea
Other
DK/NA
Q2. Why would you prefer to be an employee rather than self-employed?
Base: those who would prefer being an employee, EU27
68
35
20
9
4
3
2
2
2
13
2
Personal independence/self-fulfilment/interesting tasks
Freedom to choose place and time of working
Better income prospects
Realisation of a business opportunity
To avoid uncertainties related to employment
Favourable economic climate
To contribute to society
Members of family / friends are self-employed
Lack of attractive employment opportunities
Other
DK/NA
Self-employment
Preference for (EU27):
Q3. Why would you prefer to be self-employed rather than an employee?
Base: those who would prefer being self-employed, EU27
Width: 10
A large majority of EU citizens who expressed a preference for self-employment made this choice
because of the freedom provided, such as personal independence, self-fulfilment and the chance to do
something of personal interest (mentioned by 68%) or freedom to choose their own place and time of
9 In the previous surveys, a somewhat different set of pre-coded answers was used to code respondents’ answers
to Question 2 (employee status) and Question 3 (self-employment). For example, in 2009, it was decided to use
separate codes for answers related to regular or fixed income (vs. irregular or variable income) and those related
to stability of employment. 10
Respondents’ answers were coded in 10 categories – respondents who did not fit in any of these categories
were coded as “other”.
Flash EB No 283 – Entrepreneurship Analytical report
page 17
work (35%). A fifth of EU citizens would prefer to be self-employed because this would offer better
income prospects.
Some EU citizens had more opportunistic reasons for preferring to be self-employed: 9% said it
would enable them to realise a business opportunity, 3% said it was due to the favourable economic
climate and 2% wanted to contribute to society.
Just 2% of EU citizens expressed a preference for being self-employed because their family members
or friends were also in that category. Furthermore, relatively few EU citizens preferred to be self-
employed to avoid the uncertainties of being an employee (4%) or because of the lack of attractive
employment opportunities (2%).
Somewhat more than 1 in 10 (13%) EU citizens who expressed a preference for self-employment
listed a reason other than the ones listed so far11
. Some of these respondents talked about the
attractiveness of being their own boss and having to face new challenges on a regular basis.
Country variations – reasons for preferring employee status
Security of employee status
A regular, fixed income (vs. an irregular, variable income) was mentioned most frequently as a
reason for preferring employee status by respondents in Turkey and Hungary (75% and 70%,
respectively) and least often by respondents in China (11%), Iceland and the US (both 14%).
Respondents in the latter countries, and in the UK, were also the least likely to list “fixed working
hours” as a reason for their choice (4%-7%), while respondents in Hungary – once again – were the
most likely to name this advantage of being an employee (39%).
Respondents in Turkey were also the most prone to say they would prefer to be an employee because
this brought the protection of social security and other insurances (47%). In Greece, Malta,
Sweden, Iceland and the US, however, not more than 5% of respondents gave this reason.
The proportion of respondents who mentioned “stability of employment” as an adv5antage of being
an employee ranged from about 1 in 10 respondents in Turkey (10%), Austria (11%) and Germany
(12%) to two-thirds in Luxembourg (67%). In South Korea, 61% of respondents mentioned this reason
– in China, however, the figure was just 15%.
Constraints of self-employment
Respondents in eastern European countries appeared to be more likely than their counterparts in other
countries (expect for China) to name some constraints of being self-employed as the reason for their
preference for employee status.
For example, about a third Romanians (32%) and Hungarians (33%) would choose to be an employee
because they did not have adequate finances to become self-employed; in Belgium, Denmark,
Finland, France, Greece, the Netherlands, Iceland and Norway, however, just 1% or 2% of respondents
gave this reason. Similarly, about a fifth Latvians (18%) and Hungarians (20%) mentioned their lack
of the requisite skills to become self-employed, compared to just 1% of respondents in Italy, Turkey
and the US.
Chinese respondents, however, were the most likely to explain their preference for employee status
because it would be (too) difficult to become self-employed: 36% mentioned a lack of finances for
self-employment, 33% a lack of entrepreneurial skills, 22% were afraid of the legal and social
consequences if the venture failed and 15% felt they did not have an appropriate business idea.
11
Respondents’ answers were coded in 9 categories – respondents who did not fit in any of these categories were
coded as “other”.
Analytical report Flash EB No 283 – Entrepreneurship
page 18
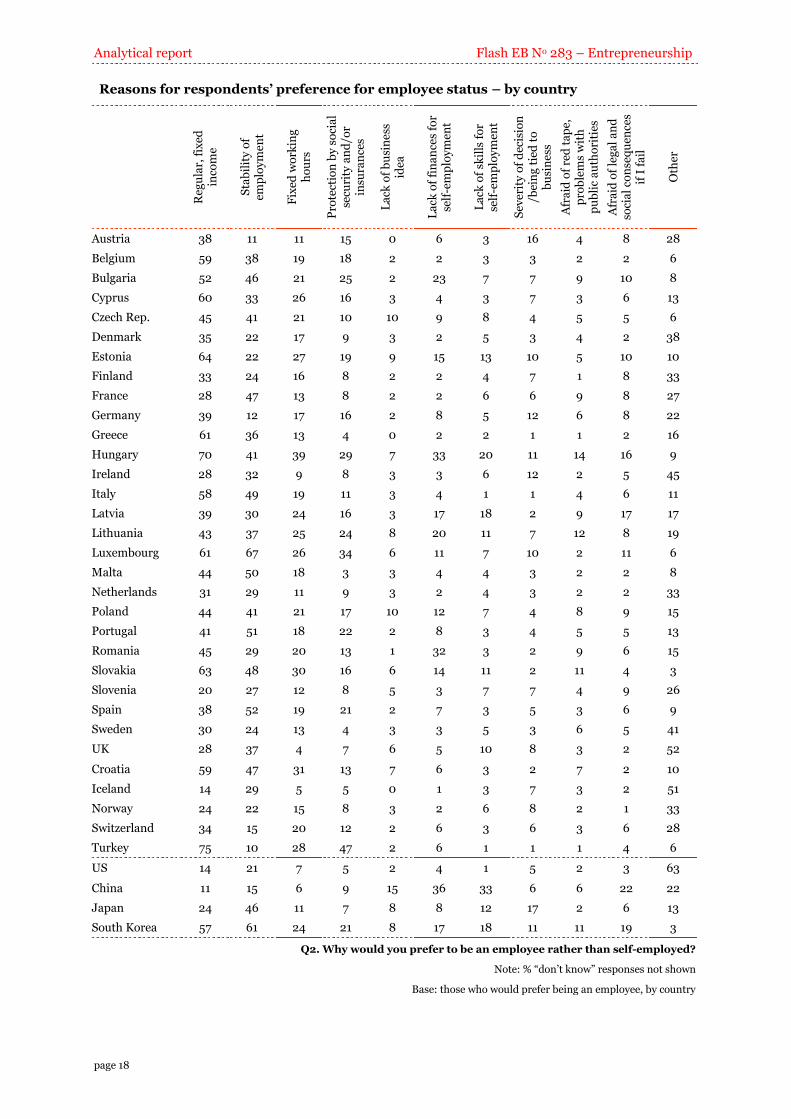
Reasons for respondents’ preference for employee status – by country
Reg
ula
r, f
ixed
in
com
e
Sta
bil
ity
of
emp
loy
me
nt
Fix
ed w
ork
ing
h
ou
rs
Pro
tect
ion
by
so
cia
l se
curi
ty a
nd
/or
insu
ran
ces
La
ck o
f b
usi
ne
ss
idea
La
ck o
f fi
na
nce
s fo
r se
lf-e
mp
loy
men
t
La
ck o
f sk
ills
fo
r se
lf-e
mp
loy
men
t
Sev
erit
y o
f d
ecis
ion
/b
ein
g t
ied
to
b
usi
ne
ss
Afr
aid
of
red
ta
pe,
p
rob
lem
s w
ith
p
ub
lic
au
tho
riti
es
Afr
aid
of
leg
al
an
d
soci
al
con
seq
uen
ces
if I
fa
il
Oth
er
Austria 38 11 11 15 0 6 3 16 4 8 28
Belgium 59 38 19 18 2 2 3 3 2 2 6
Bulgaria 52 46 21 25 2 23 7 7 9 10 8
Cyprus 60 33 26 16 3 4 3 7 3 6 13
Czech Rep. 45 41 21 10 10 9 8 4 5 5 6
Denmark 35 22 17 9 3 2 5 3 4 2 38
Estonia 64 22 27 19 9 15 13 10 5 10 10
Finland 33 24 16 8 2 2 4 7 1 8 33
France 28 47 13 8 2 2 6 6 9 8 27
Germany 39 12 17 16 2 8 5 12 6 8 22
Greece 61 36 13 4 0 2 2 1 1 2 16
Hungary 70 41 39 29 7 33 20 11 14 16 9
Ireland 28 32 9 8 3 3 6 12 2 5 45
Italy 58 49 19 11 3 4 1 1 4 6 11
Latvia 39 30 24 16 3 17 18 2 9 17 17
Lithuania 43 37 25 24 8 20 11 7 12 8 19
Luxembourg 61 67 26 34 6 11 7 10 2 11 6
Malta 44 50 18 3 3 4 4 3 2 2 8
Netherlands 31 29 11 9 3 2 4 3 2 2 33
Poland 44 41 21 17 10 12 7 4 8 9 15
Portugal 41 51 18 22 2 8 3 4 5 5 13
Romania 45 29 20 13 1 32 3 2 9 6 15
Slovakia 63 48 30 16 6 14 11 2 11 4 3
Slovenia 20 27 12 8 5 3 7 7 4 9 26
Spain 38 52 19 21 2 7 3 5 3 6 9
Sweden 30 24 13 4 3 3 5 3 6 5 41
UK 28 37 4 7 6 5 10 8 3 2 52
Croatia 59 47 31 13 7 6 3 2 7 2 10
Iceland 14 29 5 5 0 1 3 7 3 2 51
Norway 24 22 15 8 3 2 6 8 2 1 33
Switzerland 34 15 20 12 2 6 3 6 3 6 28
Turkey 75 10 28 47 2 6 1 1 1 4 6
US 14 21 7 5 2 4 1 5 2 3 63
China 11 15 6 9 15 36 33 6 6 22 22
Japan 24 46 11 7 8 8 12 17 2 6 13
South Korea 57 61 24 21 8 17 18 11 11 19 3
Q2. Why would you prefer to be an employee rather than self-employed?
Note: % “don’t know” responses not shown
Base: those who would prefer being an employee, by country
Flash EB No 283 – Entrepreneurship Analytical report
page 19
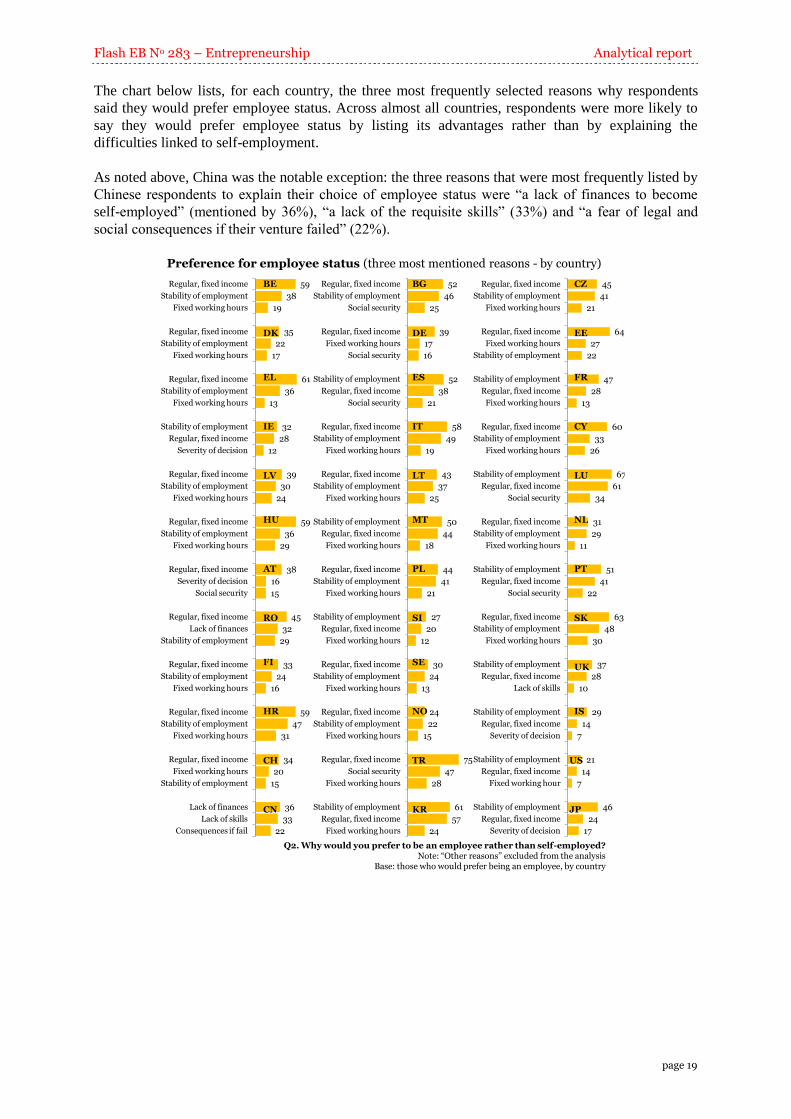
The chart below lists, for each country, the three most frequently selected reasons why respondents
said they would prefer employee status. Across almost all countries, respondents were more likely to
say they would prefer employee status by listing its advantages rather than by explaining the
difficulties linked to self-employment.
As noted above, China was the notable exception: the three reasons that were most frequently listed by
Chinese respondents to explain their choice of employee status were “a lack of finances to become
self-employed” (mentioned by 36%), “a lack of the requisite skills” (33%) and “a fear of legal and
social consequences if their venture failed” (22%).
Preference for employee status (three most mentioned reasons - by country)
59
38
19
35
22
17
61
36
13
32
28
12
39
30
24
59
36
29
38
16
15
45
32
29
33
24
16
59
47
31
34
20
15
36
33
22
Regular, fixed income
Stability of employment
Fixed working hours
Regular, fixed income
Stability of employment
Fixed working hours
Regular, fixed income
Stability of employment
Fixed working hours
Stability of employment
Regular, fixed income
Severity of decision
Regular, fixed income
Stability of employment
Fixed working hours
Regular, fixed income
Stability of employment
Fixed working hours
Regular, fixed income
Severity of decision
Social security
Regular, fixed income
Lack of finances
Stability of employment
Regular, fixed income
Stability of employment
Fixed working hours
Regular, fixed income
Stability of employment
Fixed working hours
Regular, fixed income
Fixed working hours
Stability of employment
Lack of finances
Lack of skills
Consequences if fail
DK
BE
IE
EL
HU
LV
RO
AT
HR
FI
CN
CH
Q2. Why would you prefer to be an employee rather than self-employed?Note: “Other reasons” excluded from the analysis
Base: those who would prefer being an employee, by country
52
46
25
39
17
16
52
38
21
58
49
19
43
37
25
50
44
18
44
41
21
27
20
12
30
24
13
24
22
15
75
47
28
61
57
24
Regular, fixed income
Stability of employment
Social security
Regular, fixed income
Fixed working hours
Social security
Stability of employment
Regular, fixed income
Social security
Regular, fixed income
Stability of employment
Fixed working hours
Regular, fixed income
Stability of employment
Fixed working hours
Stability of employment
Regular, fixed income
Fixed working hours
Regular, fixed income
Stability of employment
Fixed working hours
Stability of employment
Regular, fixed income
Fixed working hours
Regular, fixed income
Stability of employment
Fixed working hours
Regular, fixed income
Stability of employment
Fixed working hours
Regular, fixed income
Social security
Fixed working hours
Stability of employment
Regular, fixed income
Fixed working hours
BG
DE
ES
IT
LT
MT
PL
SI
SE
NO
TR
KR
45
41
21
64
27
22
47
28
13
60
33
26
67
61
34
31
29
11
51
41
22
63
48
30
37
28
10
29
14
7
21
14
7
46
24
17
Regular, fixed income
Stability of employment
Fixed working hours
Regular, fixed income
Fixed working hours
Stability of employment
Stability of employment
Regular, fixed income
Fixed working hours
Regular, fixed income
Stability of employment
Fixed working hours
Stability of employment
Regular, fixed income
Social security
Regular, fixed income
Stability of employment
Fixed working hours
Stability of employment
Regular, fixed income
Social security
Regular, fixed income
Stability of employment
Fixed working hours
Stability of employment
Regular, fixed income
Lack of skills
Stability of employment
Regular, fixed income
Severity of decision
Stability of employment
Regular, fixed income
Fixed working hour
Stability of employment
Regular, fixed income
Severity of decision
CZ
EE
FR
CY
LU
NL
PT
SK
UK
IS
US
JP
Analytical report Flash EB No 283 – Entrepreneurship
page 20
Country variations – reasons for preferring self-employment
Across all EU Member States, more than half of respondents who expressed a preference for self-
employment made this choice because they associated it with personal independence, self-fulfilment
and the chance to do something of personal interest. The proportion selecting this reason ranged
from less than half in Iceland and Japan (43%-45%) to more than 8 in 10 respondents in Hungary
(83%).
The “freedom to choose their own place and time of work” was most frequently mentioned by
respondents in Luxembourg (68%). In Ireland, South Korea, Hungary and the UK, between 47% and
54% of respondents gave this reason. Respondents in Germany and Greece, on the other hand, were
the least likely to name this particular advantage of being self-employed (21% and 18%, respectively).
The proportion of respondents who would prefer to be self-employed because it would offer better
income prospects ranged from less than 4% in Finland to 60% in Hungary. Other countries where less
than a tenth of interviewees listed this reason were Iceland, Norway, Switzerland, France, Japan and
the Netherlands (6%-9%). Croatia, Slovakia and Lithuania, on the other hand, were closer to Hungary;
between 44% and 48% of respondents thought they would have better income prospects.
Respondents in Hungary and Slovakia were not only among the most likely to prefer to be self-
employed because this would offer better income prospects, but also because it would avoid the
uncertainties of being an employee (20% and 16%, respectively). This reason was also important for
21% of respondents in South Korea. However, in half of the countries, less than 5% of respondents
said they would prefer self-employment to avoid the uncertainties of being an employee.
In 20 of the 36 countries surveyed, 10% or more respondents said they would like to be self-employed
as it would enable them to realise a particular business opportunity. Respondents in Hungary
(26%), the Czech Republic (24%) and Portugal (20%) were the most likely to give this reason. The
proportions of respondents, however, who said they would prefer self-employment due to a
favourable economic climate or because they wanted to contribute to society was below 10% in
almost all countries.
In just a few countries, more than 1 in 20 respondents said they would prefer to be self-employed
because of the lack of attractive employment opportunities (for example, 7% in Bulgaria and 8% in
Turkey). Similarly, in almost all countries surveyed, choosing to be self-employed because family
members or friends were in that category was not a determining factor. The only exceptions were
Japan and Hungary where, respectively, 15% and 10% of respondents mentioned that their preference
to be self-employed was influenced by a similar background of family members or friends.

Flash EB No 283 – Entrepreneurship Analytical report
page 21
Reasons for respondents’ preference for self-employment – by country
P
erso
na
l in
dep
end
en
ce/s
elf-
fulf
ilm
ent
etc.
Fre
edo
m t
o c
ho
ose
p
lace
an
d t
ime
of
wo
rkin
g
Bet
ter
inco
me
pro
spec
ts
Rea
lisa
tio
n o
f a
b
usi
ne
ss o
pp
ort
un
ity
Fa
vo
ura
ble
eco
no
mic
cl
ima
te
To
co
ntr
ibu
te t
o
soci
ety
To
av
oid
un
cert
ain
tie
s re
late
d t
o e
mp
loy
me
nt
La
ck o
f a
ttra
ctiv
e em
plo
ym
en
t o
pp
ort
un
itie
s
Fa
mil
y/f
rien
ds
are
se
lf-e
mp
loy
ed
Oth
er
Austria 69 24 14 8 1 1 1 2 3 14
Belgium 57 24 15 16 4 4 3 2 3 3
Bulgaria 68 34 29 10 10 4 5 7 3 3
Cyprus 81 31 24 10 9 3 5 2 2 5
Czech Rep. 69 28 29 24 4 1 6 5 3 1
Denmark 54 39 10 8 3 2 0 1 3 28
Estonia 79 43 34 17 5 7 13 6 2 3
Finland 80 25 4 4 3 2 2 2 2 16
France 74 44 8 4 1 2 3 1 1 12
Germany 73 21 12 9 3 2 4 1 2 15
Greece 68 18 22 3 6 1 1 1 1 13
Hungary 83 48 60 26 11 6 20 14 15 8
Ireland 56 47 12 2 0 0 1 0 1 29
Italy 59 36 22 13 2 1 4 2 2 4
Latvia 72 28 26 12 2 9 12 1 2 14
Lithuania 67 31 48 14 3 7 5 4 2 11
Luxembourg 74 68 21 18 6 6 9 2 2 4
Malta 61 24 25 7 7 1 2 2 1 3
Netherlands 55 29 9 5 3 1 1 1 1 19
Poland 71 31 32 11 3 2 11 2 2 7
Portugal 75 23 23 20 6 6 3 3 2 4
Romania 55 30 39 14 1 8 10 2 5 15
Slovakia 73 39 46 17 6 0 16 1 5 1
Slovenia 54 32 14 13 1 2 5 0 0 18
Spain 76 36 14 6 5 2 2 3 3 6
Sweden 54 37 12 13 4 5 5 2 5 22
UK 65 54 26 6 0 1 1 2 1 32
Croatia 62 37 44 17 2 2 9 2 2 2
Iceland 43 42 6 2 2 2 2 3 2 31
Norway 54 37 7 8 2 2 0 1 2 18
Switzerland 68 31 7 6 2 1 2 3 2 16
Turkey 70 30 25 11 8 11 6 8 5 5
US 51 23 7 2 1 1 1 0 0 42
China 69 37 30 1 3 3 6 2 1 6
Japan 45 38 8 12 5 3 6 3 10 10
South Korea 57 47 34 18 6 10 21 8 5 4
Q3. Why would you prefer to be self-employed rather than an employee?
Note: % “don’t know” responses not shown
Base: those who would prefer being self-employed, by country
Analytical report Flash EB No 283 – Entrepreneurship
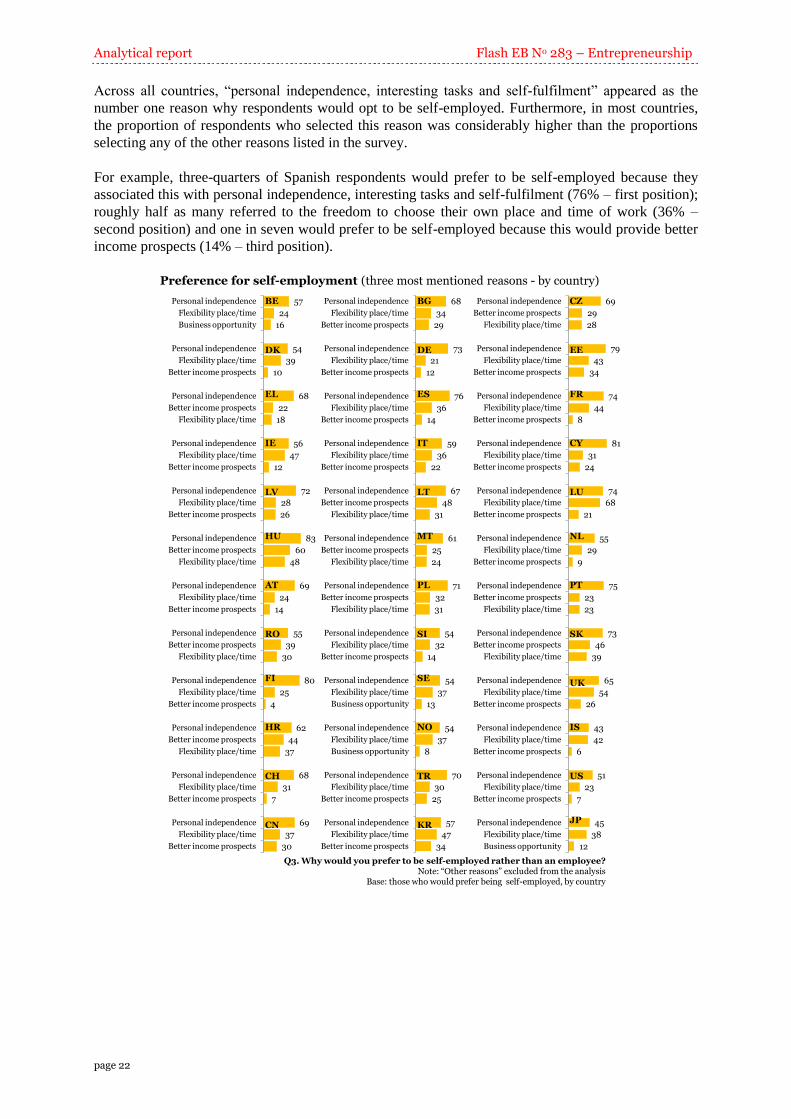
page 22
Across all countries, “personal independence, interesting tasks and self-fulfilment” appeared as the
number one reason why respondents would opt to be self-employed. Furthermore, in most countries,
the proportion of respondents who selected this reason was considerably higher than the proportions
selecting any of the other reasons listed in the survey.
For example, three-quarters of Spanish respondents would prefer to be self-employed because they
associated this with personal independence, interesting tasks and self-fulfilment (76% – first position);
roughly half as many referred to the freedom to choose their own place and time of work (36% –
second position) and one in seven would prefer to be self-employed because this would provide better
income prospects (14% – third position).
Preference for self-employment (three most mentioned reasons - by country)
57
24
16
54
39
10
68
22
18
56
47
12
72
28
26
83
60
48
69
24
14
55
39
30
80
25
4
62
44
37
68
31
7
69
37
30
Personal independence
Flexibility place/time
Business opportunity
Personal independence
Flexibility place/time
Better income prospects
Personal independence
Better income prospects
Flexibility place/time
Personal independence
Flexibility place/time
Better income prospects
Personal independence
Flexibility place/time
Better income prospects
Personal independence
Better income prospects
Flexibility place/time
Personal independence
Flexibility place/time
Better income prospects
Personal independence
Better income prospects
Flexibility place/time
Personal independence
Flexibility place/time
Better income prospects
Personal independence
Better income prospects
Flexibility place/time
Personal independence
Flexibility place/time
Better income prospects
Personal independence
Flexibility place/time
Better income prospects
DK
BE
IE
EL
HU
LV
RO
AT
HR
FI
CN
CH
Q3. Why would you prefer to be self-employed rather than an employee?Note: “Other reasons” excluded from the analysis
Base: those who would prefer being self-employed, by country
68
34
29
73
21
12
76
36
14
59
36
22
67
48
31
61
25
24
71
32
31
54
32
14
54
37
13
54
37
8
70
30
25
57
47
34
Personal independence
Flexibility place/time
Better income prospects
Personal independence
Flexibility place/time
Better income prospects
Personal independence
Flexibility place/time
Better income prospects
Personal independence
Flexibility place/time
Better income prospects
Personal independence
Better income prospects
Flexibility place/time
Personal independence
Better income prospects
Flexibility place/time
Personal independence
Better income prospects
Flexibility place/time
Personal independence
Flexibility place/time
Better income prospects
Personal independence
Flexibility place/time
Business opportunity
Personal independence
Flexibility place/time
Business opportunity
Personal independence
Flexibility place/time
Better income prospects
Personal independence
Flexibility place/time
Better income prospects
BG
DE
ES
IT
LT
MT
PL
SI
SE
NO
TR
KR
69
29
28
79
43
34
74
44
8
81
31
24
74
68
21
55
29
9
75
23
23
73
46
39
65
54
26
43
42
6
51
23
7
45
38
12
Personal independence
Better income prospects
Flexibility place/time
Personal independence
Flexibility place/time
Better income prospects
Personal independence
Flexibility place/time
Better income prospects
Personal independence
Flexibility place/time
Better income prospects
Personal independence
Flexibility place/time
Better income prospects
Personal independence
Flexibility place/time
Better income prospects
Personal independence
Better income prospects
Flexibility place/time
Personal independence
Better income prospects
Flexibility place/time
Personal independence
Flexibility place/time
Better income prospects
Personal independence
Flexibility place/time
Better income prospects
Personal independence
Flexibility place/time
Better income prospects
Personal independence
Flexibility place/time
Business opportunity
CZ
EE
FR
CY
LU
NL
PT
SK
UK
IS
US
JP

Flash EB No 283 – Entrepreneurship Analytical report
page 23
Socio-demographic considerations
Reasons for preferring employee status
Throughout the EU, across all socio-demographic segments, respondents who preferred to be an
employee were most likely to mention a “regular and fixed income” and “stability of employment” as
reasons for this choice.
A “regular and fixed income” was most frequently mentioned by 40-54 year-olds (45% vs. 33% of 15-
24 year-olds), respondents with the lowest level of education (46% vs. 36% of the most educated
respondents), respondents who found it hard to manage on their current household income (47%-51%
vs. 33% of those who could live comfortably on their current income) and by currently self-employed
respondents (52% vs. 36% of employees). No group stood out as being particularly more likely to
select “stability of employment” as a reason to prefer employee status.
The 15-24 year-olds and full-time students were the least likely to not only mention a “regular and
fixed income” as a reason to opt for employee status, but also to list other factors related to security,
such as “stability of employment” (mentioned by 29%-32%) and “protection of social security and
other insurances” (mentioned by 9%-10%). On the other hand, they were somewhat more likely to list
certain constraints of self-employment. For example, 7% of 15-24 year-olds and full-time students
mentioned the lack of an appropriate business idea that would allow them to be self-employed, compared
to 3%-4% of older respondents and those who had completed their education.
The proportion of respondents who would choose to be an employee because they did not have
adequate finances was highest among manual workers (14% vs. 5% of employees) and those who
found it very hard to manage on their current household income (16% vs. 3% of those who could live
comfortably on their current income).
Reasons for preferring self-employment
Throughout the EU, across all socio-demographic segments, about two-thirds, or more, of respondents
who expressed a preference for self-employment associated this type of employment with personal
independence, self-fulfilment and the chance to do something of personal interest (64%-72%).
Other reasons for choosing self-employment, across all socio-demographic segments, were “freedom
to choose a place and time of work” and “better income prospects”. The results for these two reasons,
however, showed a larger variation across groups than the results discussed in the previous paragraph.
For example, while about a quarter of 15-39 year-olds would prefer to be self-employed because of
better income prospects, this reason was selected by just 16% of over 54 year-olds. Similarly, 37% of
respondents with the highest level of education would prefer to be self-employed because of the
freedom to choose their own place and time of work, compared to 29% of respondents with the lowest
level of education.
For more details, see annex table 2b and 3b.
Analytical report Flash EB No 283 – Entrepreneurship
page 24
2. The image of entrepreneurs in society
The second chapter presents a picture of people’s opinions about entrepreneurs. The first section looks
at the image of entrepreneurs (both positive or negative) in the countries included in this study, while
the second section presents results for entrepreneurs’ favourability ratings compared to those of other
professional groups, such as civil servants or senior managers.
2.1 How entrepreneurs are regarded
Almost 9 in 10 EU citizens agreed that entrepreneurs were job creators: 30% strongly agreed with this
statement and 57% somewhat agreed. A large majority also thought that entrepreneurs created new
products and services and were therefore of benefit to society in general12
: 21% strongly agreed and
57% somewhat agreed. Just about a tenth (11%) of interviewees had doubts about the former statement
and about a sixth (18%) disagreed with the latter one.
Interviewees were considerably less likely to agree with the negatively-formulated statements about
entrepreneurs. Nonetheless, 54% of EU citizens agreed that entrepreneurs only thought about their
own wallet (18% strongly agreed and 36% somewhat agreed) and half (49%) thought that
entrepreneurs exploited other people’s work (13% strongly agreed and 36% somewhat agreed). About
4 in 10 (41%) interviewees disagreed that entrepreneurs focused on making money for themselves and
a similar proportion (44%) did not agree that entrepreneurs exploited other people’s work.
Entrepeneurs’ image – EU27
30
21
18
13
57
57
36
36
9
15
33
35
2
3
8
9
2
4
5
6
Entrepreneurs are job creators
Entrepreneurs create new products and services and benefit us all
Entrepreneurs think only about their own wallet
Entrepreneurs exploit other people's work
Strongly agree Agree Disagree Strongly disagree DK/NA
Q7. I am going to read you another list of statements. Please tell me, do you agree or disagree with them?
Base: all respondents, EU27
12
In 2007, this statement was somewhat different: “Entrepreneurship is the basis of wealth creation, benefiting
us all”.
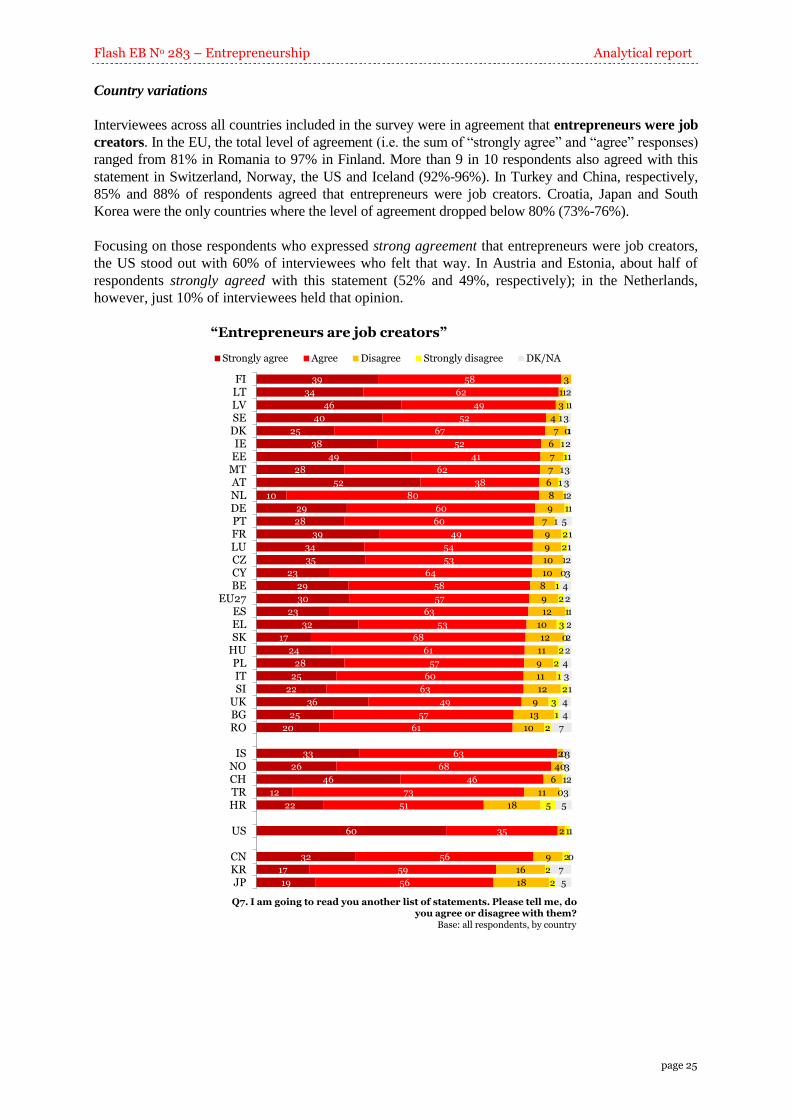
Flash EB No 283 – Entrepreneurship Analytical report
page 25
Country variations
Interviewees across all countries included in the survey were in agreement that entrepreneurs were job
creators. In the EU, the total level of agreement (i.e. the sum of “strongly agree” and “agree” responses)
ranged from 81% in Romania to 97% in Finland. More than 9 in 10 respondents also agreed with this
statement in Switzerland, Norway, the US and Iceland (92%-96%). In Turkey and China, respectively,
85% and 88% of respondents agreed that entrepreneurs were job creators. Croatia, Japan and South
Korea were the only countries where the level of agreement dropped below 80% (73%-76%).
Focusing on those respondents who expressed strong agreement that entrepreneurs were job creators,
the US stood out with 60% of interviewees who felt that way. In Austria and Estonia, about half of
respondents strongly agreed with this statement (52% and 49%, respectively); in the Netherlands,
however, just 10% of interviewees held that opinion.
“Entrepreneurs are job creators”
39
34
46
40
25
38
49
28
52
10
29
28
39
34
35
23
29
30
23
32
17
24
28
25
22
36
25
20
33
26
46
12
22
60
32
17
19
58
62
49
52
67
52
41
62
38
80
60
60
49
54
53
64
58
57
63
53
68
61
57
60
63
49
57
61
63
68
46
73
51
35
56
59
56
3
1
3
4
7
6
7
7
6
8
9
7
9
9
10
10
8
9
12
10
12
11
9
11
12
9
13
10
2
4
6
11
18
2
9
16
18
1
1
1
0
1
1
1
1
1
1
1
2
2
1
0
1
2
1
3
0
2
2
1
2
3
1
2
0
0
1
0
5
1
2
2
2
2
1
3
1
2
1
3
3
2
1
5
1
1
2
3
4
2
1
2
2
2
4
3
1
4
4
7
3
3
2
3
5
1
0
7
5
FILTLVSEDKIE
EEMTATNLDEPTFRLUCZCYBE
EU27ESELSK
HUPLITSI
UKBGRO
ISNOCHTRHR
US
CNKRJP
Strongly agree Agree Disagree Strongly disagree DK/NA
Q7. I am going to read you another list of statements. Please tell me, do you agree or disagree with them?
Base: all respondents, by country
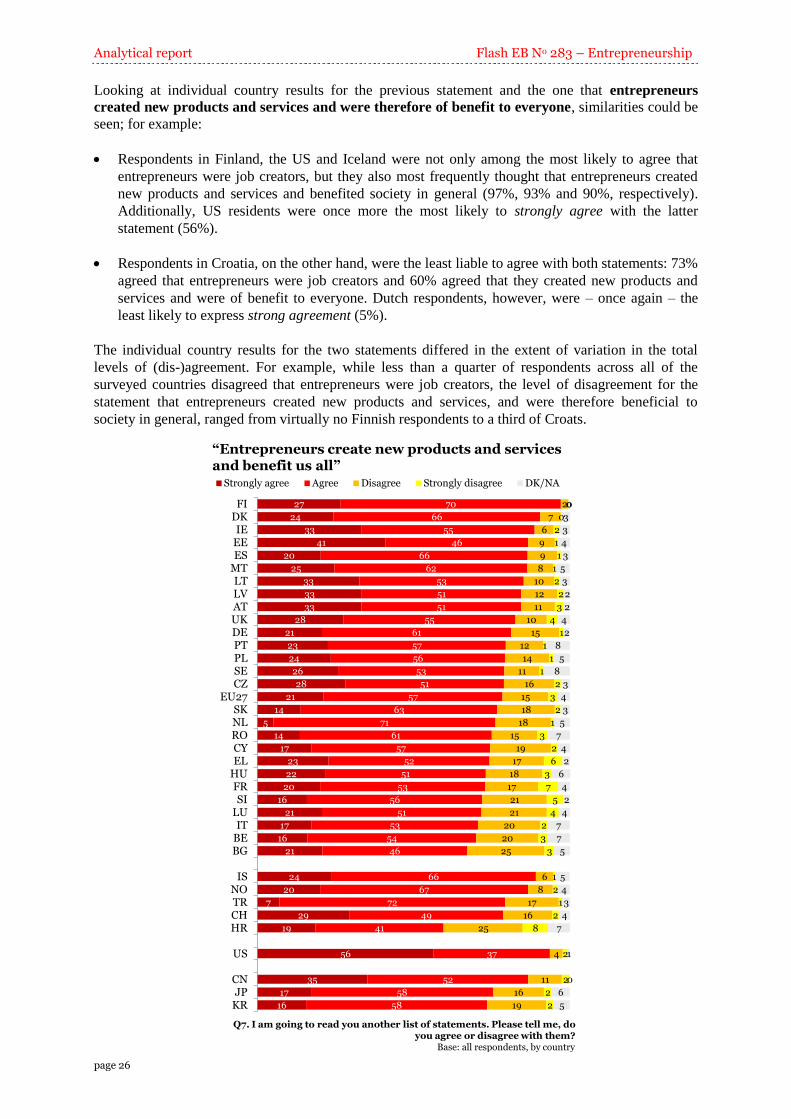
Analytical report Flash EB No 283 – Entrepreneurship
page 26
Looking at individual country results for the previous statement and the one that entrepreneurs
created new products and services and were therefore of benefit to everyone, similarities could be
seen; for example:
Respondents in Finland, the US and Iceland were not only among the most likely to agree that
entrepreneurs were job creators, but they also most frequently thought that entrepreneurs created
new products and services and benefited society in general (97%, 93% and 90%, respectively).
Additionally, US residents were once more the most likely to strongly agree with the latter
statement (56%).
Respondents in Croatia, on the other hand, were the least liable to agree with both statements: 73%
agreed that entrepreneurs were job creators and 60% agreed that they created new products and
services and were of benefit to everyone. Dutch respondents, however, were – once again – the
least likely to express strong agreement (5%).
The individual country results for the two statements differed in the extent of variation in the total
levels of (dis-)agreement. For example, while less than a quarter of respondents across all of the
surveyed countries disagreed that entrepreneurs were job creators, the level of disagreement for the
statement that entrepreneurs created new products and services, and were therefore beneficial to
society in general, ranged from virtually no Finnish respondents to a third of Croats.
“Entrepreneurs create new products and services and benefit us all”
27
24
33
41
20
25
33
33
33
28
21
23
24
26
28
21
14
5
14
17
23
22
20
16
21
17
16
21
24
20
7
29
19
56
35
17
16
70
66
55
46
66
62
53
51
51
55
61
57
56
53
51
57
63
71
61
57
52
51
53
56
51
53
54
46
66
67
72
49
41
37
52
58
58
2
7
6
9
9
8
10
12
11
10
15
12
14
11
16
15
18
18
15
19
17
18
17
21
21
20
20
25
6
8
17
16
25
4
11
16
19
0
0
2
1
1
1
2
2
3
4
1
1
1
1
2
3
2
1
3
2
6
3
7
5
4
2
3
3
1
2
1
2
8
2
2
2
2
0
3
3
4
3
5
3
2
2
4
2
8
5
8
3
4
3
5
7
4
2
6
4
2
4
7
7
5
5
4
3
4
7
1
0
6
5
FIDKIE
EEES
MTLTLVATUKDEPTPLSECZ
EU27SKNLROCYEL
HUFRSI
LUIT
BEBG
ISNOTRCHHR
US
CNJP
KR
Strongly agree Agree Disagree Strongly disagree DK/NA
Q7. I am going to read you another list of statements. Please tell me, do you agree or disagree with them?
Base: all respondents, by country

Flash EB No 283 – Entrepreneurship Analytical report
page 27
In the EU, the proportion of respondents who disagreed that entrepreneurs only thought about their
wallet ranged from 21% in Greece to 72% in Denmark. Countries where a majority of respondents
disagreed with the statement were Denmark (see above), Finland (67%), the Netherlands (61%),
Sweden (60%) and Ireland (58%). In Cyprus and Bulgaria, as in Greece, a quarter of respondents or
less disagreed (23% and 25%, respectively) – in these three countries, at least 7 in 10 agreed that
entrepreneurs focused on their own profits (78% in Greece, 75% in Cyprus and 71% in Bulgaria).
A large variation in the total level of disagreement was also seen across the other countries included in
this study. For example, while just over a quarter of respondents in Croatia disagreed that
entrepreneurs only thought about their wallet, this proportion increased to more than two-thirds in the
US (67%), Norway (73%) and Iceland (76%). It is also worth noting that the US again stood out from
the pack with 35% of respondents who strongly disagreed with this statement.
Focusing on those choosing the more extreme (negative) response – i.e. those who strongly agreed
that entrepreneurs focused on their own profits – it was noted that the proportion of interviewees
selecting this response ranged from less than 5% in Denmark, Finland, the Netherlands and Iceland to
3 in 10 or more respondents in Cyprus (31%), Croatia (32%), Bulgaria (35%) and Greece (43%).
“Entrepreneurs think only about their own wallet”
13
11
5
14
12
11
5
7
16
13
13
5
9
8
8
6
8
3
5
4
4
6
3
3
1
3
3
5
19
14
13
5
7
35
22
6
2
59
56
56
46
46
38
44
41
30
34
32
39
33
34
33
30
27
30
29
29
28
25
26
24
26
22
20
16
57
59
37
36
20
32
34
44
35
21
28
33
26
27
32
31
36
32
29
36
34
34
37
36
40
38
47
38
41
37
37
42
43
47
36
44
35
16
17
34
47
37
21
25
34
45
3
4
3
8
14
14
19
11
18
18
17
14
17
17
18
20
20
18
24
23
26
30
22
23
23
35
31
43
2
5
12
8
32
10
19
9
12
4
1
3
6
3
5
2
5
4
6
3
8
7
4
5
5
7
2
5
4
5
2
7
7
4
3
3
1
6
4
4
4
4
2
0
6
6
DKFI
NLSEIE
ATLVDEFRUKLUPTBECZ
EU27HU
ITESLTEEPLSI
MTROSKBGCYEL
ISNOCHTRHR
US
CNJP
KR
Strongly disagree Disagree Agree Strongly agree DK/NA
Q7. I am going to read you another list of statements. Please tell me, do you agree or disagree with them?
Base: all respondents, by country

Analytical report Flash EB No 283 – Entrepreneurship
page 28
Respondents in Iceland and Denmark were also the most likely to disagree that entrepreneurs
exploited other people’s work (77% and 75%, respectively). However, while just 15% of Danes
strongly disagreed with this statement, almost twice as many Icelanders did so (28%). Respondents in
the US were once more the most likely to strongly disagree that entrepreneurs exploited other people’s
work (34%).
As for the previous statement, in a majority of countries in this study, more than half of respondents
agreed that entrepreneurs exploited other people’s work. In Lithuania and Greece, more than three-
quarters of respondents accepted this proposition (79% and 77%, respectively). Other countries, where
the total level of agreement was above 70%, included Cyprus, Estonia, Slovenia and Slovakia (72%-
73%). The Greeks, however, were the most likely to have no doubt at all that entrepreneurs exploited
other people’s work – 37% strongly agreed with the statement.
“Entrepreneurs exploit other people’s work”
15
12
10
18
17
13
10
17
9
11
9
2
8
8
4
7
10
5
6
3
6
3
3
4
3
4
6
2
28
10
17
3
8
34
23
3
4
60
48
49
41
39
39
42
34
42
34
35
42
35
33
36
31
27
32
22
23
20
21
21
20
21
18
15
16
49
53
44
47
18
34
34
36
28
18
30
29
27
28
27
32
31
42
39
36
48
42
41
47
49
43
43
46
48
40
51
43
42
47
42
40
53
12
25
25
39
36
21
29
45
51
4
6
8
8
7
13
10
15
6
11
13
5
12
12
10
10
7
11
18
17
30
22
27
31
25
30
37
26
2
4
9
6
32
10
15
9
8
3
4
5
7
8
9
7
3
2
6
6
3
4
7
3
3
12
10
9
10
4
3
7
3
4
7
2
3
9
8
6
5
6
2
0
7
10
DKIE
DEATCZUKBEFRFI
HUEU27
NLLVITESLUSEPTROMTBGSKPLSI
CYEEELLT
ISNOCHTRHR
US
CNKRJP
Strongly disagree Disagree Agree Strongly agree DK/NA
Q7. I am going to read you another list of statements. Please tell me, do you agree or disagree with them?
Base: all respondents, by country
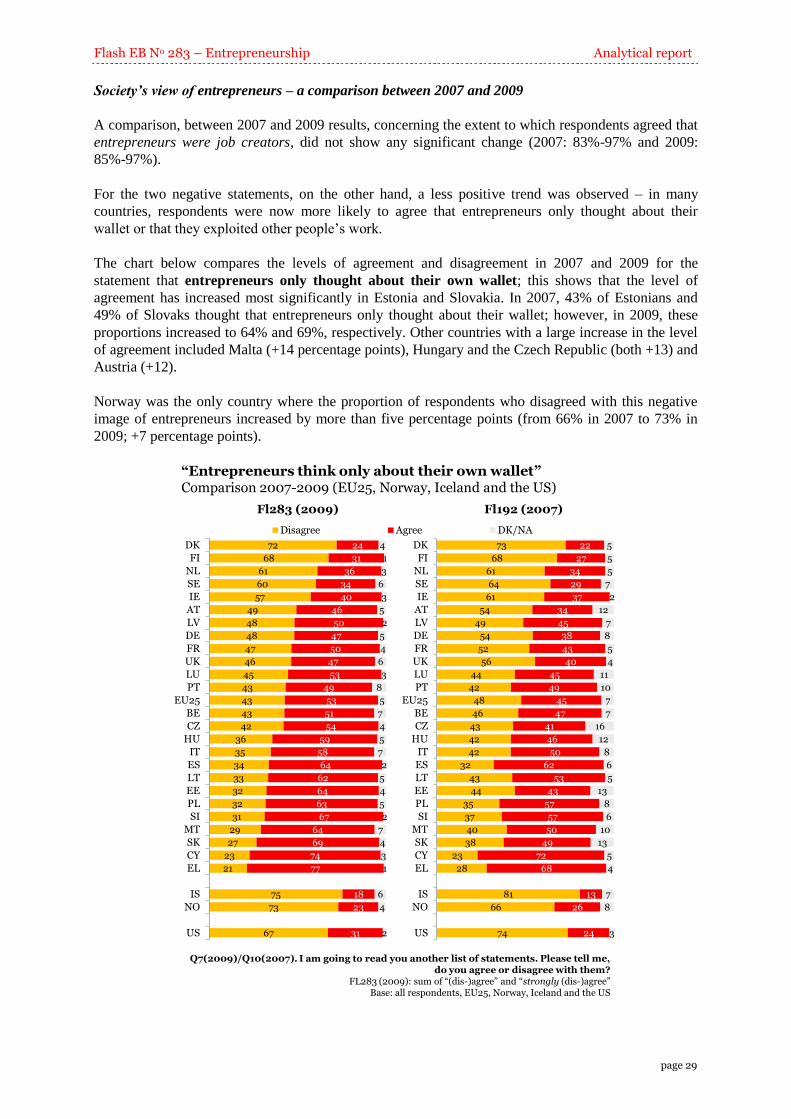
Flash EB No 283 – Entrepreneurship Analytical report
page 29
Society’s view of entrepreneurs – a comparison between 2007 and 2009
A comparison, between 2007 and 2009 results, concerning the extent to which respondents agreed that
entrepreneurs were job creators, did not show any significant change (2007: 83%-97% and 2009:
85%-97%).
For the two negative statements, on the other hand, a less positive trend was observed – in many
countries, respondents were now more likely to agree that entrepreneurs only thought about their
wallet or that they exploited other people’s work.
The chart below compares the levels of agreement and disagreement in 2007 and 2009 for the
statement that entrepreneurs only thought about their own wallet; this shows that the level of
agreement has increased most significantly in Estonia and Slovakia. In 2007, 43% of Estonians and
49% of Slovaks thought that entrepreneurs only thought about their wallet; however, in 2009, these
proportions increased to 64% and 69%, respectively. Other countries with a large increase in the level
of agreement included Malta (+14 percentage points), Hungary and the Czech Republic (both +13) and
Austria (+12).
Norway was the only country where the proportion of respondents who disagreed with this negative
image of entrepreneurs increased by more than five percentage points (from 66% in 2007 to 73% in
2009; +7 percentage points).
72
68
61
60
57
49
48
48
47
46
45
43
43
43
42
36
35
34
33
32
32
31
29
27
23
21
75
73
67
24
31
36
34
40
46
50
47
50
47
53
49
53
51
54
59
58
64
62
64
63
67
64
69
74
77
18
23
31
4
1
3
6
3
5
2
5
4
6
3
8
5
7
4
5
7
2
5
4
5
2
7
4
3
1
6
4
2
DK
FI
NL
SE
IE
AT
LV
DE
FR
UK
LU
PT
EU25
BE
CZ
HU
IT
ES
LT
EE
PL
SI
MT
SK
CY
EL
IS
NO
US
Disagree Agree DK/NA
73
68
61
64
61
54
49
54
52
56
44
42
48
46
43
42
42
32
43
44
35
37
40
38
23
28
81
66
74
22
27
34
29
37
34
45
38
43
40
45
49
45
47
41
46
50
62
53
43
57
57
50
49
72
68
13
26
24
5
5
5
7
2
12
7
8
5
4
11
10
7
7
16
12
8
6
5
13
8
6
10
13
5
4
7
8
3
DK
FI
NL
SE
IE
AT
LV
DE
FR
UK
LU
PT
EU25
BE
CZ
HU
IT
ES
LT
EE
PL
SI
MT
SK
CY
EL
IS
NO
US
“Entrepreneurs think only about their own wallet”Comparison 2007-2009 (EU25, Norway, Iceland and the US)
Q7(2009)/Q10(2007). I am going to read you another list of statements. Please tell me, do you agree or disagree with them?
FL283 (2009): sum of “(dis-)agree” and “strongly (dis-)agree”Base: all respondents, EU25, Norway, Iceland and the US
Fl283 (2009) Fl192 (2007)
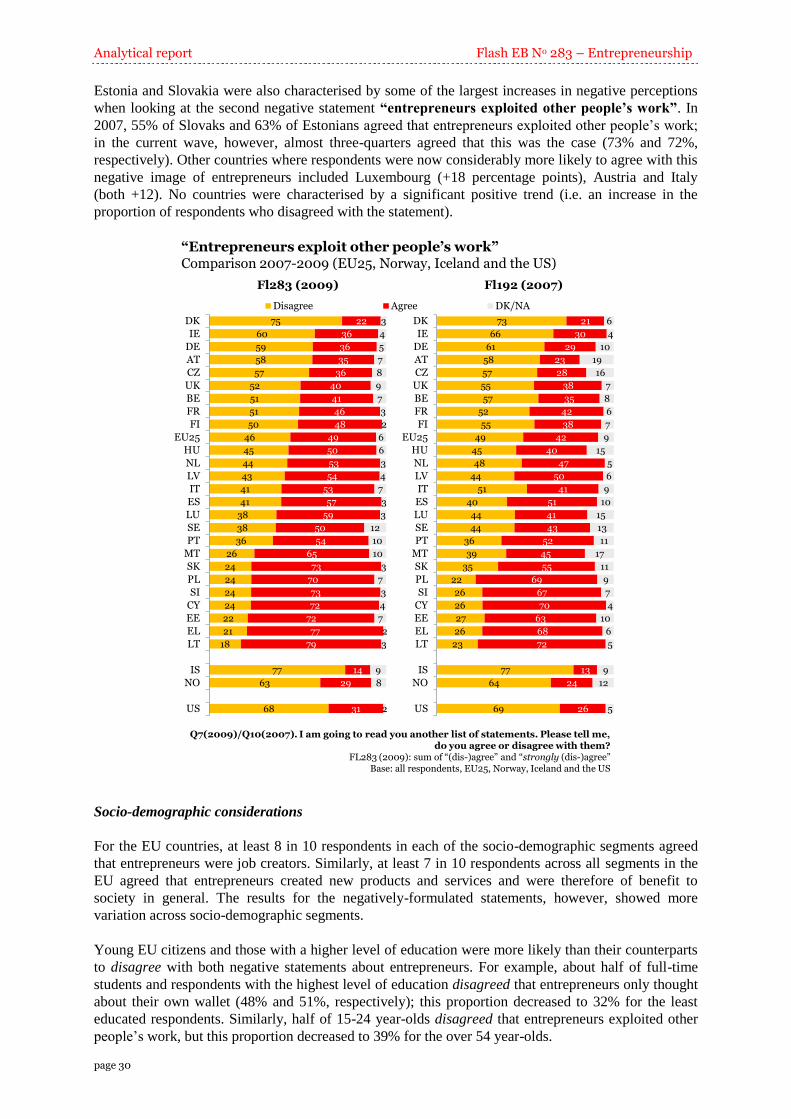
Analytical report Flash EB No 283 – Entrepreneurship
page 30
Estonia and Slovakia were also characterised by some of the largest increases in negative perceptions
when looking at the second negative statement “entrepreneurs exploited other people’s work”. In
2007, 55% of Slovaks and 63% of Estonians agreed that entrepreneurs exploited other people’s work;
in the current wave, however, almost three-quarters agreed that this was the case (73% and 72%,
respectively). Other countries where respondents were now considerably more likely to agree with this
negative image of entrepreneurs included Luxembourg (+18 percentage points), Austria and Italy
(both +12). No countries were characterised by a significant positive trend (i.e. an increase in the
proportion of respondents who disagreed with the statement).
75
60
59
58
57
52
51
51
50
46
45
44
43
41
41
38
38
36
26
24
24
24
24
22
21
18
77
63
68
22
36
36
35
36
40
41
46
48
49
50
53
54
53
57
59
50
54
65
73
70
73
72
72
77
79
14
29
31
3
4
5
7
8
9
7
3
2
6
6
3
4
7
3
3
12
10
10
3
7
3
4
7
2
3
9
8
2
DK
IE
DE
AT
CZ
UK
BE
FR
FI
EU25
HU
NL
LV
IT
ES
LU
SE
PT
MT
SK
PL
SI
CY
EE
EL
LT
IS
NO
US
Disagree Agree DK/NA
73
66
61
58
57
55
57
52
55
49
45
48
44
51
40
44
44
36
39
35
22
26
26
27
26
23
77
64
69
21
30
29
23
28
38
35
42
38
42
40
47
50
41
51
41
43
52
45
55
69
67
70
63
68
72
13
24
26
6
4
10
19
16
7
8
6
7
9
15
5
6
9
10
15
13
11
17
11
9
7
4
10
6
5
9
12
5
DK
IE
DE
AT
CZ
UK
BE
FR
FI
EU25
HU
NL
LV
IT
ES
LU
SE
PT
MT
SK
PL
SI
CY
EE
EL
LT
IS
NO
US
“Entrepreneurs exploit other people’s work”Comparison 2007-2009 (EU25, Norway, Iceland and the US)
Q7(2009)/Q10(2007). I am going to read you another list of statements. Please tell me, do you agree or disagree with them?
FL283 (2009): sum of “(dis-)agree” and “strongly (dis-)agree”Base: all respondents, EU25, Norway, Iceland and the US
Fl283 (2009) Fl192 (2007)
Socio-demographic considerations
For the EU countries, at least 8 in 10 respondents in each of the socio-demographic segments agreed
that entrepreneurs were job creators. Similarly, at least 7 in 10 respondents across all segments in the
EU agreed that entrepreneurs created new products and services and were therefore of benefit to
society in general. The results for the negatively-formulated statements, however, showed more
variation across socio-demographic segments.
Young EU citizens and those with a higher level of education were more likely than their counterparts
to disagree with both negative statements about entrepreneurs. For example, about half of full-time
students and respondents with the highest level of education disagreed that entrepreneurs only thought
about their own wallet (48% and 51%, respectively); this proportion decreased to 32% for the least
educated respondents. Similarly, half of 15-24 year-olds disagreed that entrepreneurs exploited other
people’s work, but this proportion decreased to 39% for the over 54 year-olds.
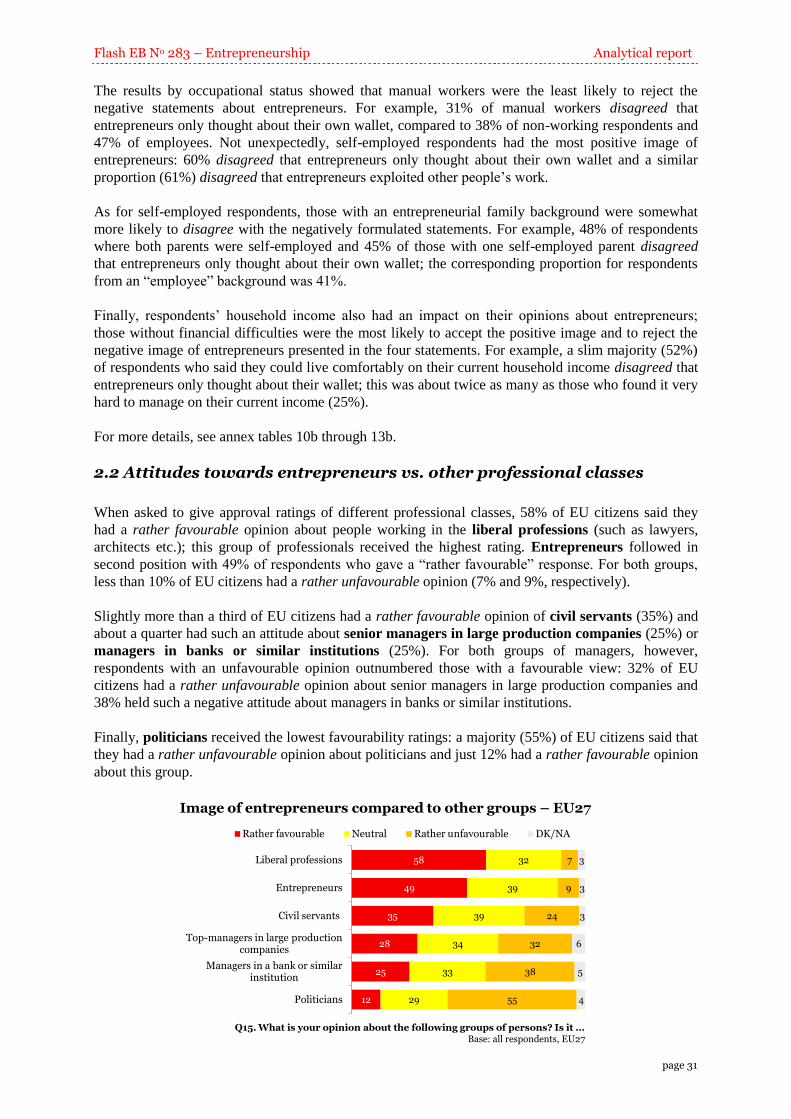
Flash EB No 283 – Entrepreneurship Analytical report
page 31
The results by occupational status showed that manual workers were the least likely to reject the
negative statements about entrepreneurs. For example, 31% of manual workers disagreed that
entrepreneurs only thought about their own wallet, compared to 38% of non-working respondents and
47% of employees. Not unexpectedly, self-employed respondents had the most positive image of
entrepreneurs: 60% disagreed that entrepreneurs only thought about their own wallet and a similar
proportion (61%) disagreed that entrepreneurs exploited other people’s work.
As for self-employed respondents, those with an entrepreneurial family background were somewhat
more likely to disagree with the negatively formulated statements. For example, 48% of respondents
where both parents were self-employed and 45% of those with one self-employed parent disagreed
that entrepreneurs only thought about their own wallet; the corresponding proportion for respondents
from an “employee” background was 41%.
Finally, respondents’ household income also had an impact on their opinions about entrepreneurs;
those without financial difficulties were the most likely to accept the positive image and to reject the
negative image of entrepreneurs presented in the four statements. For example, a slim majority (52%)
of respondents who said they could live comfortably on their current household income disagreed that
entrepreneurs only thought about their wallet; this was about twice as many as those who found it very
hard to manage on their current income (25%).
For more details, see annex tables 10b through 13b.
2.2 Attitudes towards entrepreneurs vs. other professional classes
When asked to give approval ratings of different professional classes, 58% of EU citizens said they
had a rather favourable opinion about people working in the liberal professions (such as lawyers,
architects etc.); this group of professionals received the highest rating. Entrepreneurs followed in
second position with 49% of respondents who gave a “rather favourable” response. For both groups,
less than 10% of EU citizens had a rather unfavourable opinion (7% and 9%, respectively).
Slightly more than a third of EU citizens had a rather favourable opinion of civil servants (35%) and
about a quarter had such an attitude about senior managers in large production companies (25%) or
managers in banks or similar institutions (25%). For both groups of managers, however,
respondents with an unfavourable opinion outnumbered those with a favourable view: 32% of EU
citizens had a rather unfavourable opinion about senior managers in large production companies and
38% held such a negative attitude about managers in banks or similar institutions.
Finally, politicians received the lowest favourability ratings: a majority (55%) of EU citizens said that
they had a rather unfavourable opinion about politicians and just 12% had a rather favourable opinion
about this group.
Image of entrepreneurs compared to other groups – EU27
58
49
35
28
25
12
32
39
39
34
33
29
7
9
24
32
38
55
3
3
3
6
5
4
Liberal professions
Entrepreneurs
Civil servants
Top-managers in large production companies
Managers in a bank or similar institution
Politicians
Rather favourable Neutral Rather unfavourable DK/NA
Q15. What is your opinion about the following groups of persons? Is it ... Base: all respondents, EU27
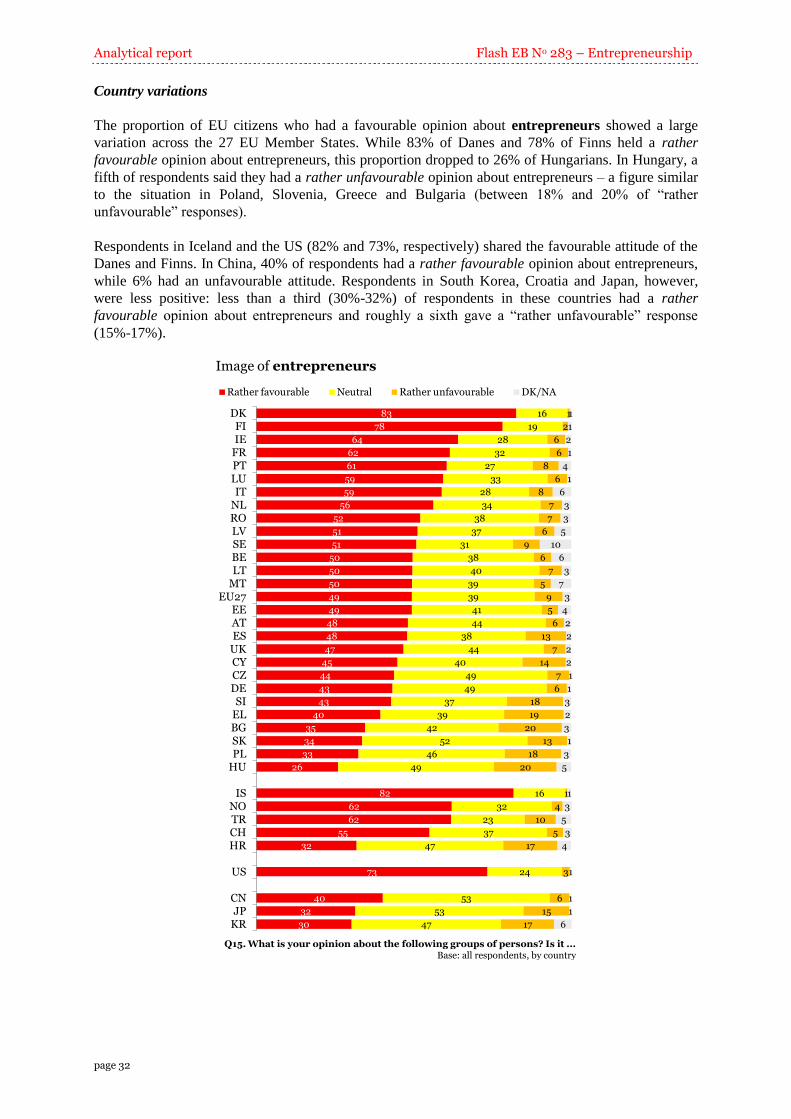
Analytical report Flash EB No 283 – Entrepreneurship
page 32
Country variations
The proportion of EU citizens who had a favourable opinion about entrepreneurs showed a large
variation across the 27 EU Member States. While 83% of Danes and 78% of Finns held a rather
favourable opinion about entrepreneurs, this proportion dropped to 26% of Hungarians. In Hungary, a
fifth of respondents said they had a rather unfavourable opinion about entrepreneurs – a figure similar
to the situation in Poland, Slovenia, Greece and Bulgaria (between 18% and 20% of “rather
unfavourable” responses).
Respondents in Iceland and the US (82% and 73%, respectively) shared the favourable attitude of the
Danes and Finns. In China, 40% of respondents had a rather favourable opinion about entrepreneurs,
while 6% had an unfavourable attitude. Respondents in South Korea, Croatia and Japan, however,
were less positive: less than a third (30%-32%) of respondents in these countries had a rather
favourable opinion about entrepreneurs and roughly a sixth gave a “rather unfavourable” response
(15%-17%).
Image of entrepreneurs
83
78
64
62
61
59
59
56
52
51
51
50
50
50
49
49
48
48
47
45
44
43
43
40
35
34
33
26
82
62
62
55
32
73
40
32
30
16
19
28
32
27
33
28
34
38
37
31
38
40
39
39
41
44
38
44
40
49
49
37
39
42
52
46
49
16
32
23
37
47
24
53
53
47
1
2
6
6
8
6
8
7
7
6
9
6
7
5
9
5
6
13
7
14
7
6
18
19
20
13
18
20
1
4
10
5
17
3
6
15
17
1
1
2
1
4
1
6
3
3
5
10
6
3
7
3
4
2
2
2
2
1
1
3
2
3
1
3
5
1
3
5
3
4
1
1
1
6
DKFIIE
FRPTLUIT
NLROLVSEBELT
MTEU27
EEATES
UKCYCZDESI
ELBGSKPL
HU
ISNOTRCHHR
US
CNJP
KR
Rather favourable Neutral Rather unfavourable DK/NA
Q15. What is your opinion about the following groups of persons? Is it ... Base: all respondents, by country

Flash EB No 283 – Entrepreneurship Analytical report
page 33
Comparing favourability ratings of entrepreneurs to other professional classes, such as civil servants or
senior managers, it was noted that there were seven countries where entrepreneurs were ranked above
everyone else: Denmark (83% “rather favourable” responses), Iceland (82%), Finland (78%), the US
(73%), Ireland (64%), Norway (62%) and Portugal (61%). In other words, respondents in these
countries were more likely to have a rather favourable opinion about entrepreneurs than they were to
express such an opinion about any other professional groups.
In most other countries, however, respondents were most likely to have a rather favourable opinion
about individuals working in the liberal professions, most frequently followed by entrepreneurs; for
example, 70% of French respondents had a favourable opinion about those working in the liberal
professions (first position) and 62% had such an opinion about entrepreneurs (second position).
The chart below, however, also illustrates the overall high favourability ratings received by
entrepreneurs in countries such as Denmark and Iceland and the overall low ratings in countries such
as Hungary and Slovakia. For example, more than 6 in 10 Danes held a rather favourable opinion
about entrepreneurs (83%), civil servants (71%) and individuals working in the liberal professions
(61%). In Hungary and Slovakia, on the other hand, the favourability ratings for all three of those
professional groups remained below 40%.
Favourability ratings of professional classes (three “most favoured” groups)
55
50
39
83
71
61
56
40
28
64
58
51
62
51
32
38
26
23
50
48
23
57
53
53
78
67
43
50
32
22
59
55
33
48
40
28
Liberal professions
Entrepreneurs
Civil servants
Entrepreneurs
Civil servants
Liberal professions
Liberal professions
Entrepreneurs
Civil servants
Entrepreneurs
Liberal professions
Civil servants
Liberal professions
Entrepreneurs
Top-managers
Liberal professions
Entrepreneurs
Civil servants
Liberal professions
Entrepreneurs
Civil servants
Liberal professions
Top-managers
Managers in banks
Entrepreneurs
Liberal professions
Managers in banks
Liberal professions
Entrepreneurs
Civil servants
Liberal professions
Entrepreneurs
Civil servants
Liberal professions
Entrepreneurs
Top-managers
DK
BE
IE
EL
HU
LV
RO
AT
HR
FI
CN
CH
Q15. What is your opinion about the following groups of persons? Is it ... % “Rather favourable” responses; Base: all respondents, by country
61
43
39
58
43
23
56
48
36
61
59
47
54
50
33
53
50
48
50
33
25
59
43
41
52
51
47
62
59
48
67
64
62
42
35
30
Liberal professions
Civil servants
Managers in banks
Liberal professions
Entrepreneurs
Civil servants
Liberal professions
Entrepreneurs
Civil servants
Liberal professions
Entrepreneurs
Civil servants
Liberal professions
Entrepreneurs
Civil servants
Managers in banks
Entrepreneurs
Liberal professions
Liberal professions
Entrepreneurs
Managers in banks
Liberal professions
Entrepreneurs
Civil servants
Liberal professions
Entrepreneurs
Top-managers
Entrepreneurs
Liberal professions
Civil servants
Civil servants
Liberal professions
Entrepreneurs
Liberal professions
Civil servants
Entrepreneurs
BG
DE
ES
IT
LT
MT
PL
SI
SE
NO
TR
KR
47
44
31
53
49
36
70
62
50
68
50
45
70
59
52
58
56
37
61
53
37
37
34
23
55
47
34
82
69
60
73
65
51
65
32
31
Liberal professions
Entrepreneurs
Civil servants
Liberal professions
Entrepreneurs
Top-managers
Liberal professions
Entrepreneurs
Civil servants
Liberal professions
Managers in banks
Top-managers
Liberal professions
Entrepreneurs
Civil servants
Liberal professions
Entrepreneurs
Civil servants
Entrepreneurs
Liberal professions
Civil servants
Liberal professions
Entrepreneurs
Managers in banks
Liberal professions
Entrepreneurs
Civil servants
Entrepreneurs
Liberal professions
Civil servants
Entrepreneurs
Civil servants
Liberal professions
Liberal professions
Entrepreneurs
Civil servants
CZ
EE
FR
CY
LU
NL
PT
SK
UK
IS
US
JP
Analytical report Flash EB No 283 – Entrepreneurship
page 34
Socio-demographic considerations
In the EU, across all socio-demographic segments, individuals working in the liberal professions
received the highest rating; in other words, respondents across all groups were most likely to answer
that they had a rather favourable opinion about this group. Respondents with the highest level of
education, full-time students, 15-24 year-olds and those living comfortably on their current income
most frequently gave such a positive rating (64%-67%), while the least educated respondents, manual
workers and those finding it very hard to manage on their current household income were the least
likely to do so (48%-51%).
Across all socio-demographic segments in the EU, politicians received the lowest support – less than a
sixth of respondents held a rather favourable opinion about politicians. For example, 11% of 25-39
year-olds, 14% of respondents living in metropolitan areas and 16% of full-time students regarded
politicians in a favourable light.
Focusing on favourability ratings for entrepreneurs, it should be noted that they received the second
highest ratings – behind people working in the liberal professions – across almost all socio-
demographic segments. As could be expected, this was not the case among self-employed respondents:
65% had a rather favourable opinion about entrepreneurs, compared to 60% who said the same about
people working in the liberal professions.
Other socio-demographic groups that appeared to have a more positive image about entrepreneurs
were the most educated respondents (55% “rather favourable” responses vs. 48% for respondents with
the lowest level of education), men (53% vs. 46% for women), employees (51% vs. 42% for manual
workers), respondents whose parents were both self-employed (57% vs. 48% for respondents whose
parents were employees) and those living comfortably on their current income (59% vs. 42%-44%
among respondents with financial difficulties).
The above results are to a large extent in accordance with those discussed in the previous section; the
results by age groups, however, present a different picture. The youngest respondents (under the age of
25) were more likely than their older counterparts to have a rather favourable opinion about each of
the professional groups listed in the survey – with the exception of their opinions about entrepreneurs.
For example, 41% of 15-24 year-olds held a rather favourable opinion about civil servants, compared
to about a third of older respondents. The 40-54 year-olds, however, were the most likely to hold a
positive opinion about entrepreneurs, while 15-24 year-olds were the least likely to hold that view
(52% vs. 46%).
For more details, see annex tables 27b through 32b.
Flash EB No 283 – Entrepreneurship Analytical report
page 35
3. Feasibility of becoming self-employed
Chapter 3 focuses on respondents who were not self-employed at the time of the survey and their
perceptions as to how feasible it would be for them to become self-employed in the next five years –
regardless of whether they preferred that status or not; those who considered that it was feasible were
asked to explain why they gave this response.
3.1 Feasibility of becoming self-employed in the next five years
The goal of becoming self-employed in the next five years was perceived as being unrealistic by two-
thirds of EU citizens who were not (yet) self-employed at the time of the survey: 46% said that it was
not feasible at all for them to become self-employed within that timeframe and 21% said it was rather
unfeasible. Just 3 in 10 non-self-employed EU citizens thought that it was feasible for them to become
self-employed in the next 5 years (8% “very feasible” and 21% “quite feasible”).
Throughout the EU, the proportion of respondents who considered it very or quite feasible to become
self-employed in the next five years ranged from less than one in six in Belgium, the Czech Republic
and the Netherlands (13%-15%) to about half of Swedish respondents (49%). Other EU countries
where at least a third of respondents saw self-employment as a possibility were Finland (45%), Cyprus
(37%), Poland and Denmark (both 36%). In surveyed European countries outside of the EU and in the
US, between 36% and 52% of respondents considered it very or quite feasible to become self-
employed in the next five years. In Croatia, however, just 21% of respondents saw self-employment as
a possibility.
In China, 12% of respondents said that it was very feasible for them to become self-employed within
the next five years and 37% thought this was rather feasible. North Korea and Japan, on the other
hand, showed similar results to EU countries: respondents were less likely to consider that it was very
or quite feasible to become self-employed in the near future. Just 12% of Japanese and 22% of South
Korean respondents saw self-employment as a possibility.
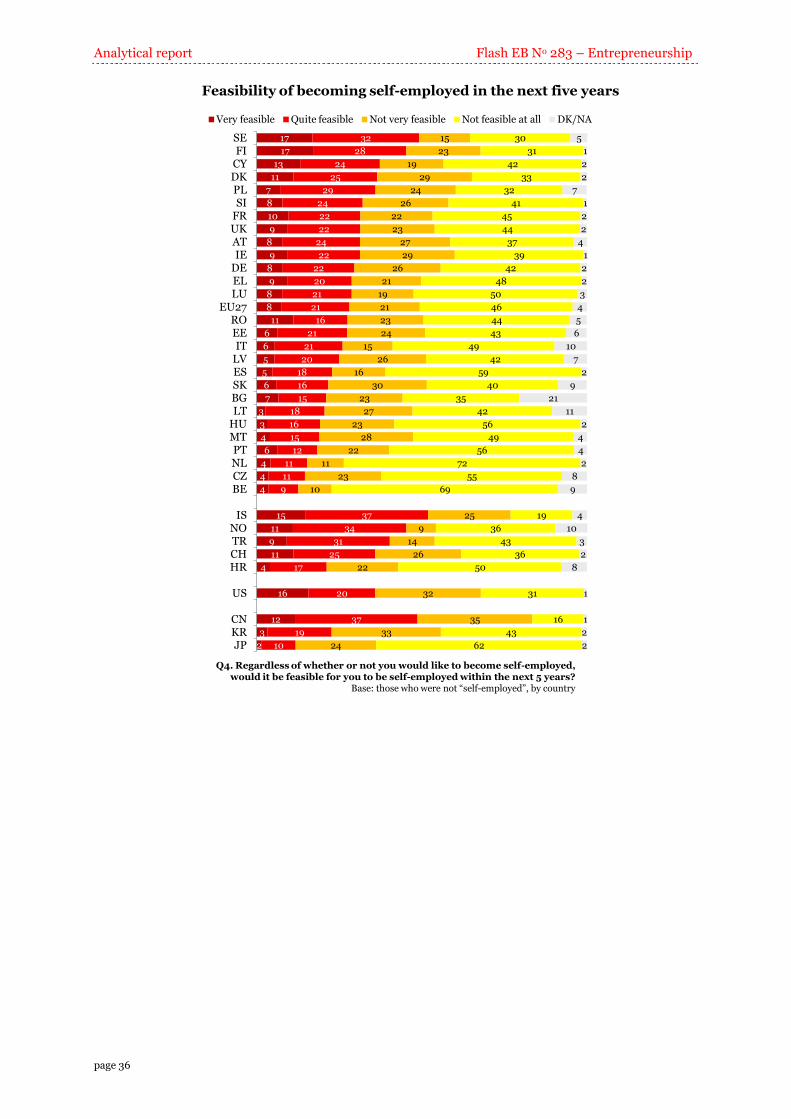
Analytical report Flash EB No 283 – Entrepreneurship
page 36
Feasibility of becoming self-employed in the next five years
17
17
13
11
7
8
10
9
8
9
8
9
8
8
11
6
6
5
5
6
7
3
3
4
6
4
4
4
15
11
9
11
4
16
12
3
2
32
28
24
25
29
24
22
22
24
22
22
20
21
21
16
21
21
20
18
16
15
18
16
15
12
11
11
9
37
34
31
25
17
20
37
19
10
15
23
19
29
24
26
22
23
27
29
26
21
19
21
23
24
15
26
16
30
23
27
23
28
22
11
23
10
25
9
14
26
22
32
35
33
24
30
31
42
33
32
41
45
44
37
39
42
48
50
46
44
43
49
42
59
40
35
42
56
49
56
72
55
69
19
36
43
36
50
31
16
43
62
5
1
2
2
7
1
2
2
4
1
2
2
3
4
5
6
10
7
2
9
21
11
2
4
4
2
8
9
4
10
3
2
8
1
1
2
2
SEFI
CYDKPLSI
FRUKATIE
DEELLU
EU27ROEEIT
LVESSKBGLT
HUMTPTNLCZBE
ISNOTRCHHR
US
CNKRJP
Very feasible Quite feasible Not very feasible Not feasible at all DK/NA
Q4. Regardless of whether or not you would like to become self-employed, would it be feasible for you to be self-employed within the next 5 years?
Base: those who were not “self-employed”, by country
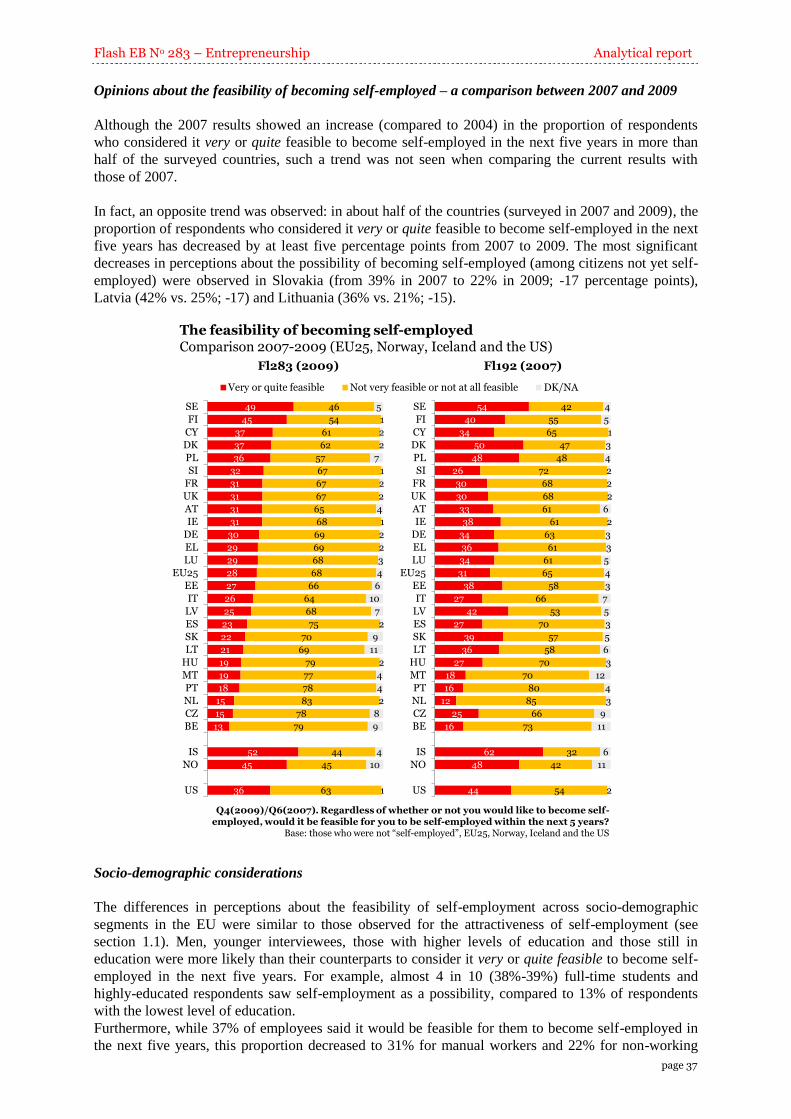
Flash EB No 283 – Entrepreneurship Analytical report
page 37
Opinions about the feasibility of becoming self-employed – a comparison between 2007 and 2009
Although the 2007 results showed an increase (compared to 2004) in the proportion of respondents
who considered it very or quite feasible to become self-employed in the next five years in more than
half of the surveyed countries, such a trend was not seen when comparing the current results with
those of 2007.
In fact, an opposite trend was observed: in about half of the countries (surveyed in 2007 and 2009), the
proportion of respondents who considered it very or quite feasible to become self-employed in the next
five years has decreased by at least five percentage points from 2007 to 2009. The most significant
decreases in perceptions about the possibility of becoming self-employed (among citizens not yet self-
employed) were observed in Slovakia (from 39% in 2007 to 22% in 2009; -17 percentage points),
Latvia (42% vs. 25%; -17) and Lithuania (36% vs. 21%; -15).
49
45
37
37
36
32
31
31
31
31
30
29
29
28
27
26
25
23
22
21
19
19
18
15
15
13
52
45
36
46
54
61
62
57
67
67
67
65
68
69
69
68
68
66
64
68
75
70
69
79
77
78
83
78
79
44
45
63
5
1
2
2
7
1
2
2
4
1
2
2
3
4
6
10
7
2
9
11
2
4
4
2
8
9
4
10
1
SE
FI
CY
DK
PL
SI
FR
UK
AT
IE
DE
EL
LU
EU25
EE
IT
LV
ES
SK
LT
HU
MT
PT
NL
CZ
BE
IS
NO
US
Very or quite feasible Not very feasible or not at all feasible DK/NA
54
40
34
50
48
26
30
30
33
38
34
36
34
31
38
27
42
27
39
36
27
18
16
12
25
16
62
48
44
42
55
65
47
48
72
68
68
61
61
63
61
61
65
58
66
53
70
57
58
70
70
80
85
66
73
32
42
54
4
5
1
3
4
2
2
2
6
2
3
3
5
4
3
7
5
3
5
6
3
12
4
3
9
11
6
11
2
SE
FI
CY
DK
PL
SI
FR
UK
AT
IE
DE
EL
LU
EU25
EE
IT
LV
ES
SK
LT
HU
MT
PT
NL
CZ
BE
IS
NO
US
The feasibility of becoming self-employed Comparison 2007-2009 (EU25, Norway, Iceland and the US)
Q4(2009)/Q6(2007). Regardless of whether or not you would like to become self-employed, would it be feasible for you to be self-employed within the next 5 years?
Base: those who were not “self-employed”, EU25, Norway, Iceland and the US
Fl283 (2009) Fl192 (2007)
Socio-demographic considerations
The differences in perceptions about the feasibility of self-employment across socio-demographic
segments in the EU were similar to those observed for the attractiveness of self-employment (see
section 1.1). Men, younger interviewees, those with higher levels of education and those still in
education were more likely than their counterparts to consider it very or quite feasible to become self-
employed in the next five years. For example, almost 4 in 10 (38%-39%) full-time students and
highly-educated respondents saw self-employment as a possibility, compared to 13% of respondents
with the lowest level of education.
Furthermore, while 37% of employees said it would be feasible for them to become self-employed in
the next five years, this proportion decreased to 31% for manual workers and 22% for non-working
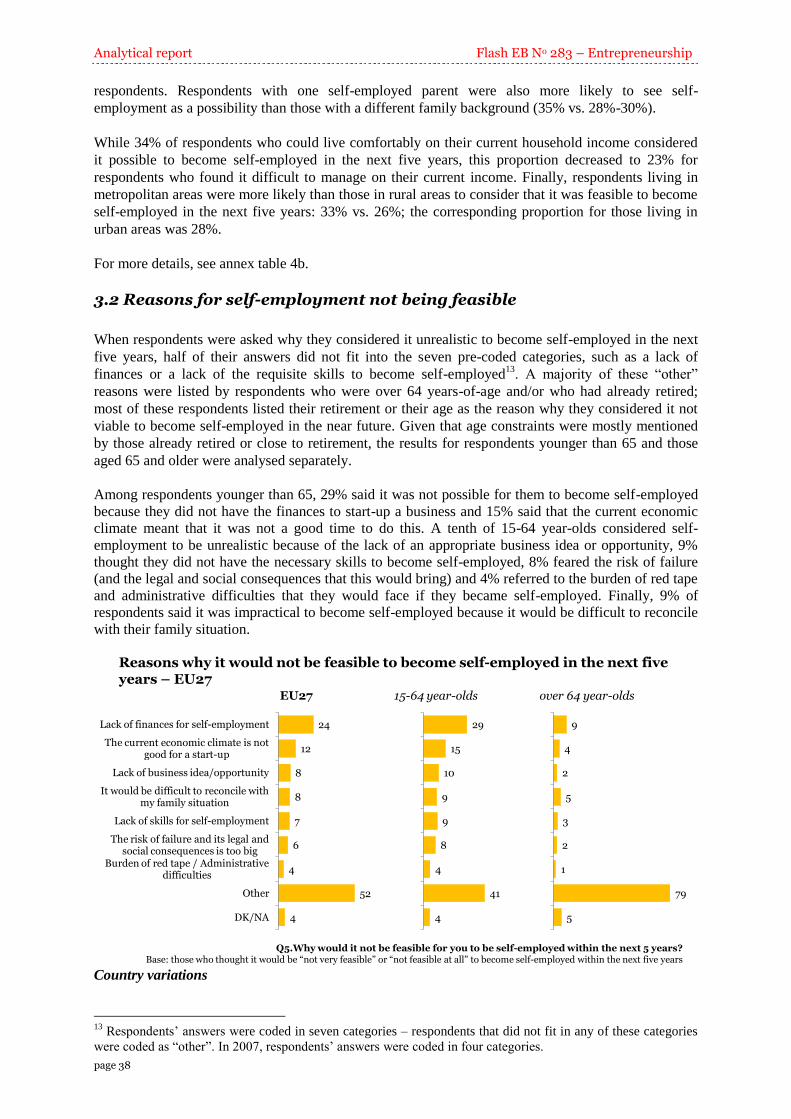
Analytical report Flash EB No 283 – Entrepreneurship
page 38
respondents. Respondents with one self-employed parent were also more likely to see self-
employment as a possibility than those with a different family background (35% vs. 28%-30%).
While 34% of respondents who could live comfortably on their current household income considered
it possible to become self-employed in the next five years, this proportion decreased to 23% for
respondents who found it difficult to manage on their current income. Finally, respondents living in
metropolitan areas were more likely than those in rural areas to consider that it was feasible to become
self-employed in the next five years: 33% vs. 26%; the corresponding proportion for those living in
urban areas was 28%.
For more details, see annex table 4b.
3.2 Reasons for self-employment not being feasible
When respondents were asked why they considered it unrealistic to become self-employed in the next
five years, half of their answers did not fit into the seven pre-coded categories, such as a lack of
finances or a lack of the requisite skills to become self-employed13
. A majority of these “other”
reasons were listed by respondents who were over 64 years-of-age and/or who had already retired;
most of these respondents listed their retirement or their age as the reason why they considered it not
viable to become self-employed in the near future. Given that age constraints were mostly mentioned
by those already retired or close to retirement, the results for respondents younger than 65 and those
aged 65 and older were analysed separately.
Among respondents younger than 65, 29% said it was not possible for them to become self-employed
because they did not have the finances to start-up a business and 15% said that the current economic
climate meant that it was not a good time to do this. A tenth of 15-64 year-olds considered self-
employment to be unrealistic because of the lack of an appropriate business idea or opportunity, 9%
thought they did not have the necessary skills to become self-employed, 8% feared the risk of failure
(and the legal and social consequences that this would bring) and 4% referred to the burden of red tape
and administrative difficulties that they would face if they became self-employed. Finally, 9% of
respondents said it was impractical to become self-employed because it would be difficult to reconcile
with their family situation.
24
12
8
8
7
6
4
52
4
Lack of finances for self-employment
The current economic climate is not good for a start-up
Lack of business idea/opportunity
It would be difficult to reconcile with my family situation
Lack of skills for self-employment
The risk of failure and its legal and social consequences is too big
Burden of red tape / Administrative difficulties
Other
DK/NA
29
15
10
9
9
8
4
41
4
9
4
2
5
3
2
1
79
5
Reasons why it would not be feasible to become self-employed in the next fiveyears – EU27
Q5.Why would it not be feasible for you to be self-employed within the next 5 years?Base: those who thought it would be “not very feasible” or “not feasible at all” to become self-employed within the next five years
EU27 15-64 year-olds over 64 year-olds
Country variations
13
Respondents’ answers were coded in seven categories – respondents that did not fit in any of these categories
were coded as “other”. In 2007, respondents’ answers were coded in four categories.
Flash EB No 283 – Entrepreneurship Analytical report
page 39
More than half of Croatian (55%), Bulgarian (61%), Hungarian (63%) and Romanian (68%) 15-64
year-olds, who considered it unrealistic to become self-employed in the next five years, said it was a
lack of finances that would prevent them from starting up a business (55%-68%)14
. In Finland, the
Netherlands, Iceland, Norway, Sweden and Belgium, however, not more than 10% of 15-64 year-olds
worried about access to finance (6%-10%).
The fact the current economic climate was not good for a start-up was named as a reason why it
would not be feasible to become self-employed by 44% of Hungarian and 33% of Cypriot respondents
aged between 15 and 64; however, this reason was mentioned by just 4%-5% of respondents in
Germany, the Netherlands, Sweden, Norway and Switzerland.
While more than a fifth of Luxembourgish (22%), Czech (23%), Estonian (25%) and Slovak (27%)
respondents aged between 15 and 64 said they saw no business opportunity or did not have an
appropriate idea for starting up a business (22%-27%), almost none of their counterparts in Greece,
Iceland and the US shared that concern (1%-3%).
Roughly 3 in 10 (29%) Latvian respondents, who thought that it would not be viable to become self-
employed, said they did not have the necessary skills for self-employment. In Bulgaria, Luxembourg
Estonia, Hungary and Slovakia, roughly a fifth of 15-64 year-olds had the same concerns (19%-22%).
A lack of skills was also a cause for concern for 15-64 year-olds in the Asian countries, especially in
South Korea (28%).
The proportion of 15-64 year-olds who named the risk of failure and its legal and social consequences
as the reason why they considered it impractical to become self-employed ranged from less than 5%
in, for example, France, Ireland and Norway to a sixth, or more, in Hungary (24%), Estonia and
Slovakia (both 18%).
In most countries, administrative difficulties and the burden of red tape were not seen as a reason
why a business start-up would not be feasible. The most notable exceptions were Lithuania and
Hungary where, respectively, 17% and 22% of 15-64 year-olds said it was unrealistic for them to
become self-employed because of the administrative difficulties that they would face.
The proportion of respondents who said that becoming self-employed was unachievable because it
would be difficult to reconcile with their family situation ranged between 5% and 10% in a majority
of the countries surveyed. In China, however, 30% of respondents were of this opinion.
Even among 15-64 year-olds, a considerable proportion of respondents in each of the countries in the
survey gave a reason other than the ones discussed above to explain why self-employment was not an
option. Respondents in Finland, the Netherlands, the UK and the US were the most likely to list
another reason (70%-71%). A closer look at the “other” answers provided by the respondents in these
four countries showed that, even among 15-64 year-olds, a large number of respondents gave an age-
related reason – they considered themselves either too young (e.g. still at college) or too old (e.g.
looking forward to retirement in a few years). Other respondents said their state of health would stop
them from starting up a business. Finally, a considerable number said that starting up a business was
unrealistic as they had no interest in doing this (e.g. they enjoyed being an employee).
14
Note that respondents in Bulgaria, Hungary and Romania were also among the most likely to name a lack of
finances with which to start up a business as their reason for opting for employee status (see section 1.2).
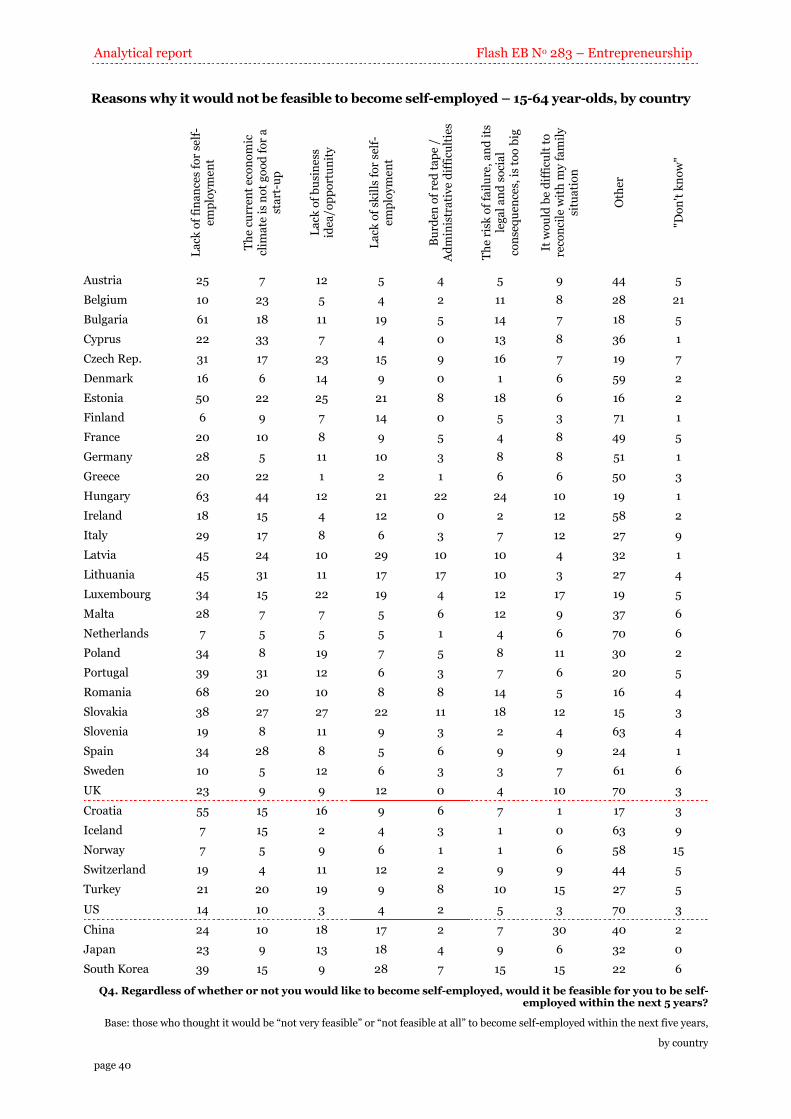
Analytical report Flash EB No 283 – Entrepreneurship
page 40
Reasons why it would not be feasible to become self-employed – 15-64 year-olds, by country
L
ack
of
fin
an
ces
for
self
-em
plo
ym
en
t
Th
e cu
rren
t ec
on
om
ic
clim
ate
is
no
t g
oo
d f
or
a
sta
rt-u
p
La
ck o
f b
usi
ne
ss
idea
/op
po
rtu
nit
y
La
ck o
f sk
ills
fo
r se
lf-
emp
loy
me
nt
Bu
rden
of
red
ta
pe
/ A
dm
inis
tra
tiv
e d
iffi
cult
ies
Th
e ri
sk o
f fa
ilu
re,
an
d i
ts
leg
al
an
d s
oci
al
con
seq
uen
ces,
is
too
big
It w
ou
ld b
e d
iffi
cult
to
re
con
cile
wit
h m
y f
am
ily
si
tua
tio
n
Oth
er
"Do
n't
kn
ow
"
Austria 25 7 12 5 4 5 9 44 5
Belgium 10 23 5 4 2 11 8 28 21
Bulgaria 61 18 11 19 5 14 7 18 5
Cyprus 22 33 7 4 0 13 8 36 1
Czech Rep. 31 17 23 15 9 16 7 19 7
Denmark 16 6 14 9 0 1 6 59 2
Estonia 50 22 25 21 8 18 6 16 2
Finland 6 9 7 14 0 5 3 71 1
France 20 10 8 9 5 4 8 49 5
Germany 28 5 11 10 3 8 8 51 1
Greece 20 22 1 2 1 6 6 50 3
Hungary 63 44 12 21 22 24 10 19 1
Ireland 18 15 4 12 0 2 12 58 2
Italy 29 17 8 6 3 7 12 27 9
Latvia 45 24 10 29 10 10 4 32 1
Lithuania 45 31 11 17 17 10 3 27 4
Luxembourg 34 15 22 19 4 12 17 19 5
Malta 28 7 7 5 6 12 9 37 6
Netherlands 7 5 5 5 1 4 6 70 6
Poland 34 8 19 7 5 8 11 30 2
Portugal 39 31 12 6 3 7 6 20 5
Romania 68 20 10 8 8 14 5 16 4
Slovakia 38 27 27 22 11 18 12 15 3
Slovenia 19 8 11 9 3 2 4 63 4
Spain 34 28 8 5 6 9 9 24 1
Sweden 10 5 12 6 3 3 7 61 6
UK 23 9 9 12 0 4 10 70 3
Croatia 55 15 16 9 6 7 1 17 3
Iceland 7 15 2 4 3 1 0 63 9
Norway 7 5 9 6 1 1 6 58 15
Switzerland 19 4 11 12 2 9 9 44 5
Turkey 21 20 19 9 8 10 15 27 5
US 14 10 3 4 2 5 3 70 3
China 24 10 18 17 2 7 30 40 2
Japan 23 9 13 18 4 9 6 32 0
South Korea 39 15 9 28 7 15 15 22 6
Q4. Regardless of whether or not you would like to become self-employed, would it be feasible for you to be self-employed within the next 5 years?
Base: those who thought it would be “not very feasible” or “not feasible at all” to become self-employed within the next five years,
by country
Flash EB No 283 – Entrepreneurship Analytical report
page 41
Socio-demographic considerations
Throughout the EU, a lack of finances was most often cited as a reason for not being able to become
self-employed by 25-39 year-olds, manual workers and respondents who found it very hard to manage
on their current household income (41%, 44% and 42%, respectively, compared to an EU average of
24%). These three groups were also more likely to refer to the fact that the current economic climate
was not good for a business start-up (between 16% and 19%, compared to 12% in the EU on average).
The youngest respondents, and those still in education, were more likely than their counterparts to say
that they did not have the requisite skills for self-employment (16% and 12%, respectively, compared
to an EU average of 7%) and they were the least likely to mention their family situation as an obstacle
(3%-4% vs. 8% on average).
Respondents aged 40-54 were somewhat more likely than others to say that the risk of failure and its
social and legal consequences would stop them from becoming self-employed (11% vs. an EU average
of 6%), while manual workers were somewhat more likely to worry about the lack of a business
opportunity (13% vs. an EU average of 8%).
Finally, the over 54 year-olds and non-working respondents were most likely to list another reason
than the ones discussed so far (73% and 61%, respectively) – this is in accordance with the finding
discussed at the beginning of section 3.2 that many older and retired respondents gave age-related
reasons for considering it unrealistic to become self-employed in the near future.
For more details, see annex table 5b.
3.3 Preference for being self-employed vs. its feasibility
In most countries, the proportion of respondents – not (yet) self-employed – who considered it very or
quite feasible to become self-employed in the next five years was lower than the proportion of non-self
employed respondents who would like to be self-employed. For example, 44% of Latvians who were
not self-employed would prefer to be self-employed; however, just 25% considered it feasible to
achieve this in the next five years.
The opposite trend – i.e. that the preference to be self-employed was lower than the perceived
feasibility of gaining such a status – was seen in the Nordic countries. For example, about half (49%)
of non-self-employed Swedish respondents said it would be feasible to become self-employed in the
next five years; just 28%, however, had an actual preference for changing their status.
A similar comparison across socio-demographic segments showed that the differences between the
preference for self-employment and the feasibility of becoming self-employed were the highest for
respondents with the lowest level of education, those aged over 54, non-working respondents and
respondents with some financial difficulties. For example, 36% of respondents with the lowest level of
education said they would prefer to be self-employed although this was currently not the case; just
13%, however, considered it possible to become self-employed in the next five years. No difference,
or only a small difference, however, was seen in the “preference” and “feasibility” proportions for 25-
39 year-olds and respondents with the highest level of education.
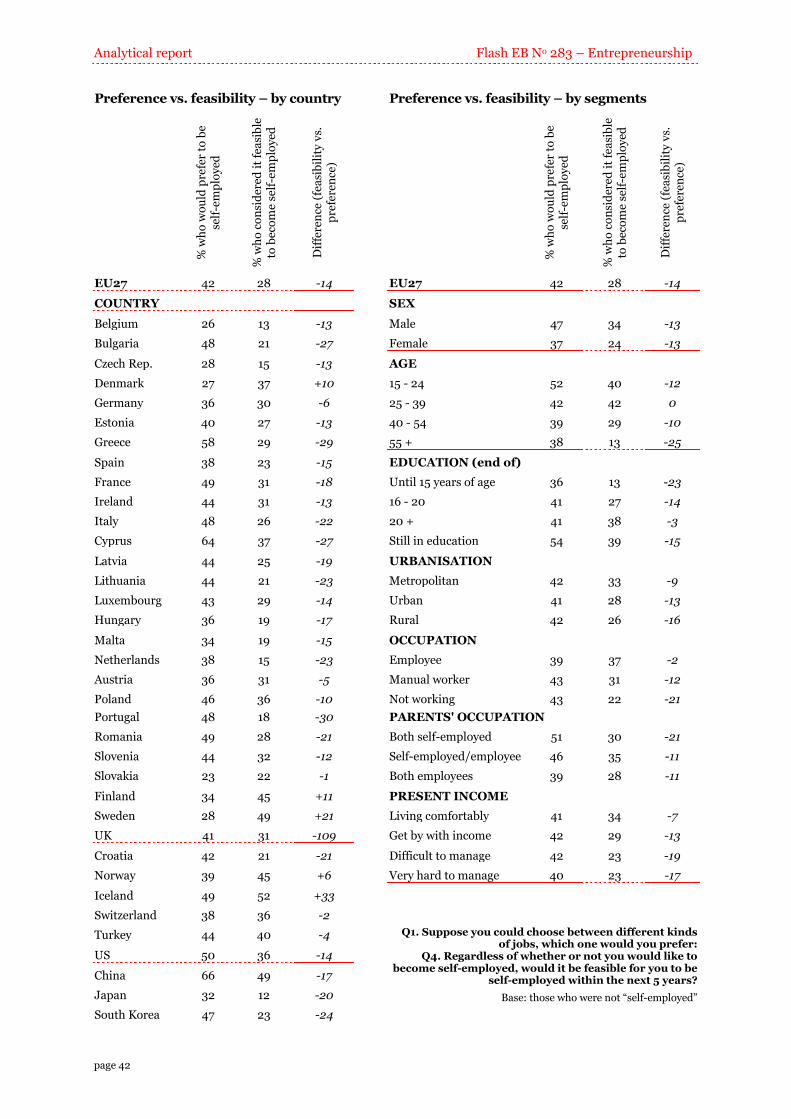
Analytical report Flash EB No 283 – Entrepreneurship
page 42
Preference vs. feasibility – by country Preference vs. feasibility – by segments
%
wh
o w
ou
ld p
refe
r to
be
self
-em
plo
yed
% w
ho
co
nsi
der
ed i
t fe
asi
ble
to
bec
om
e se
lf-e
mp
loy
ed
Dif
fere
nce
(fe
asi
bil
ity
vs.
p
refe
ren
ce)
% w
ho
wo
uld
pre
fer
to b
e se
lf-e
mp
loy
ed
% w
ho
co
nsi
der
ed i
t fe
asi
ble
to
bec
om
e se
lf-e
mp
loy
ed
Dif
fere
nce
(fe
asi
bil
ity
vs.
p
refe
ren
ce)
EU27 42 28 -14 EU27 42 28 -14
COUNTRY SEX
Belgium 26 13 -13 Male 47 34 -13
Bulgaria 48 21 -27 Female 37 24 -13
Czech Rep. 28 15 -13 AGE
Denmark 27 37 +10 15 - 24 52 40 -12
Germany 36 30 -6 25 - 39 42 42 0
Estonia 40 27 -13 40 - 54 39 29 -10
Greece 58 29 -29 55 + 38 13 -25
Spain 38 23 -15 EDUCATION (end of)
France 49 31 -18 Until 15 years of age 36 13 -23
Ireland 44 31 -13 16 - 20 41 27 -14
Italy 48 26 -22 20 + 41 38 -3
Cyprus 64 37 -27 Still in education 54 39 -15
Latvia 44 25 -19 URBANISATION
Lithuania 44 21 -23 Metropolitan 42 33 -9
Luxembourg 43 29 -14 Urban 41 28 -13
Hungary 36 19 -17 Rural 42 26 -16
Malta 34 19 -15 OCCUPATION
Netherlands 38 15 -23 Employee 39 37 -2
Austria 36 31 -5 Manual worker 43 31 -12
Poland 46 36 -10 Not working 43 22 -21
Portugal 48 18 -30 PARENTS' OCCUPATION
Romania 49 28 -21 Both self-employed 51 30 -21
Slovenia 44 32 -12 Self-employed/employee 46 35 -11
Slovakia 23 22 -1 Both employees 39 28 -11
Finland 34 45 +11 PRESENT INCOME
Sweden 28 49 +21 Living comfortably 41 34 -7
UK 41 31 -109 Get by with income 42 29 -13
Croatia 42 21 -21 Difficult to manage 42 23 -19
Norway 39 45 +6 Very hard to manage 40 23 -17
Iceland 49 52 +33
Q1. Suppose you could choose between different kinds of jobs, which one would you prefer:
Q4. Regardless of whether or not you would like to become self-employed, would it be feasible for you to be
self-employed within the next 5 years?
Base: those who were not “self-employed”
Switzerland 38 36 -2
Turkey 44 40 -4
US 50 36 -14
China 66 49 -17
Japan 32 12 -20
South Korea 47 23 -24
Flash EB No 283 – Entrepreneurship Analytical report
page 43
4. What would you do if you inherited a significant amount of money?
Respondents were also asked what they would do if they inherited a significant amount of money15
;
the aim of this question was to see how many respondents would choose to invest the money in
starting up a business instead of, for example, saving the money, using it to buy a house or to repay
their mortgage.
While about 4 in 10 Romanians (42%), Turkish and Chinese (both 41%) respondents and a third of
Bulgarians would start a business if they inherited a significant amount of money, there were more
than 10 countries where less than a tenth of respondents considered this option – for example, 5% in
Denmark and Japan and 6% in both Austria and Iceland.
In most countries, a relative majority of respondents would either save the money or use it to buy a
house or to repay their mortgage. Respondents in the UK, Estonia, Ireland and Norway most
frequently said they would use their inheritance to buy a house or to repay their mortgage (38%-41%).
The US (48%), South Korea (44%) and Japan (43%) were the countries where respondents were the
most likely to want to save any money that they inherited.
Finally, spending the money on things that one always wanted to buy (e.g. a holiday or a car) was the
preferred option for 26% of Japanese, 27% of Latvians and 28% of Maltese respondents. The
proportion of respondents who said they would work less or even stop working if they inherited a
considerable amount of money remained below 10% in all countries except for Sweden, where 10%
selected this response.
When the results for respondents’ preferences for being self-employed, rather than employed – see
section 1.1, were compared with the results of the current chapter, some similarities could be seen. For
example:
Romania and Greece were countries with a very high proportion of respondents who would prefer
to be self-employed (52% and 60%, respectively). Furthermore, Romanians were the most likely
in the EU to answer that they would start a business if they inherited a significant amount of
money (42%), while the corresponding proportion for Greece was almost twice as high as the EU
average (21% vs. 14%).
Respondents in Belgium and Denmark, on the contrary, were among the least likely to prefer self-
employment (30%-32%) and less than a tenth of Danes and Bulgarians thought they would start a
business with the money that they inherited (5%-7%).16
15
The size of this hypothetical inheritance varied between individual countries. For example, respondents in
Belgium were asked what they would do if they inherited €100,000, while the amounts in Malta and Poland were
€70,000 and 300,000zł, respectively. The exact amount used in each country is specified in the annex (see
questionnaire). 16
The correlation coefficient for the relationship between the proportion of respondents who would prefer to be-
self-employed and the proportion who would start a business if they inherited a significant amount of money, in
each EU country, was equal to .48 – this number signifies a moderately strong correlation between the two
variables at a country level.

Analytical report Flash EB No 283 – Entrepreneurship
page 44
What would you do if you inherited a significant amount of money?
42
33
25
24
21
19
18
18
17
15
15
15
14
14
13
13
12
11
11
10
9
8
8
7
7
7
6
5
41
23
8
7
6
14
41
16
5
20
17
22
25
32
23
32
27
31
23
36
39
31
39
24
32
21
30
27
38
36
29
28
22
28
34
29
28
32
22
26
41
34
24
13
16
19
17
21
15
27
27
33
29
19
36
36
25
15
30
28
40
31
30
31
35
29
26
38
26
37
36
33
37
37
14
28
37
30
33
48
23
44
43
12
16
24
16
12
16
15
27
7
15
14
19
16
13
14
17
28
18
22
14
22
15
22
24
20
19
17
21
8
20
22
14
12
9
19
15
26
45
6123
4126
264
3235
44
54
510
554
56
125
34
2
13
4
6
8
9
7
7
5
2
8
7
5
8
5
5
3
6
5
3
7
2
5
4
5
6
4
4
3
7
2
4
5
3
5
11
3
3
7
4
ROBGLTPLEL
HUESLVPTCYIT
EEEU27
IESI
CZMTSKLUUKFRDESENLBEFI
ATDK
TRHRCHNO
IS
US
CNKRJP
Start a business Buy a house or repay mortgage
Save the money Spend it on things you always wanted to buy
Work less/stop working DK/NA
Q16. Please imagine, that you suddenly inherited X Euro. What would you do with the money?
Base: all respondents, by country
Socio-demographic differences
The results by socio-demographic characteristics for EU respondents showed that men, younger
interviewees, those with higher levels of education or still in education, the self-employed and
respondents with an entrepreneurial family background were more likely than their counterparts to say
that they would start a business when they inherited a significant amount of money. For example, 9%
of respondents with the lowest level of education gave this response, compared to 16% of respondents
with the highest level of education and 20% of full-time students.
Interestingly, EU citizens who found it very hard to manage on their current household income were
more likely than the ones without financial stress to consider starting up a business with the money
they might inherit (19% vs. 12% of respondents who were “living comfortably”). Respondents who
answered that they lived comfortably on their current income were the most likely to save the
inheritance (35% vs. 25% of respondents who found it “very hard to manage”).
For more details, see annex table 33b.
Flash EB No 283 – Entrepreneurship Analytical report
page 45
5. Entrepreneurship and business activity
It has long been known that the level of entrepreneurship, expressed as the proportion of entrepreneurs
among the total population, differs between countries. Furthermore, the dynamics of entrepreneurship,
expressed as the rate of embryonic entrepreneurship or the business discontinuity rate, shows a wide-
ranging diversity across countries.
Chapter 5 presents an overview of current (2009) and past (2004 and 2007) levels of entrepreneurial
activity and dynamics across the EU. The results for EU Member States are once more compared to
those observed in the US, together with the other European and Asian countries in the survey.
5.1 Experience of starting up a business
The next chart distinguishes between three groups of respondents, i.e. those who:
(1) had never thought about starting up a business, or
(2) were currently thinking about starting up a business, and those who had thought about it or who
had already taken steps to do so, but had given up, or
(3) were currently taking steps to start up a business and those who had once started up a business
(which was still active or which was no longer active).
The EU-level results show that 50% of respondents belonged to the first group, i.e. they had never
thought about starting up a business. About a quarter of EU citizens answered that they were either
currently thinking about starting up a business or they had once tried to start one, but had given up.
Finally, roughly a fifth (21%) of EU citizens were currently taking steps to start up a business, were
currently running one or used to run a business which has now been sold or transferred.
In the EU, the proportion of respondents who had never thought about starting up a business ranged
from 32% in Greece to 65% in Luxembourg. The latter country was followed by Slovakia and
Belgium, where 62%-63% of interviewees had never thought about starting up a business. The
Japanese were the most likely to have never considered starting up a business, while the Chinese were
the least likely to say this (67% and 22%, respectively).
A minority of respondents in Finland, Italy and Portugal (all 4%) said they were considering starting
up a business; in Latvia, however, 24% of interviewees were attracted by this idea. In Romania,
Switzerland, Denmark and Hungary, about a fifth of respondents were thinking about starting up a
business (19%-21%).
Almost a fifth of respondents in Ireland, Austria and Malta said they had tried to start up a business but
had given up (18%-19%). In China, 25% of respondents had had the same experience; however, in
Japan, the corresponding proportion was 6%. In Europe, this proportion was the lowest in Latvia (1%),
Lithuania (4%), Hungary and Slovakia (both 5%).
Finally, at least a third of respondents in China (39%), the US (36%), Finland (35%), Greece and
Iceland (both 33%) were currently taking the necessary steps to start up, or had once started up, a
business. In Malta, however, just 6% of respondents were in this situation. Other countries with a low
proportion of respondents who were currently taking the necessary steps to start up, or who had once
started up, a business were Slovakia (12%), Luxembourg (13%), Slovenia (14%), Belgium and Croatia
(both 15%).
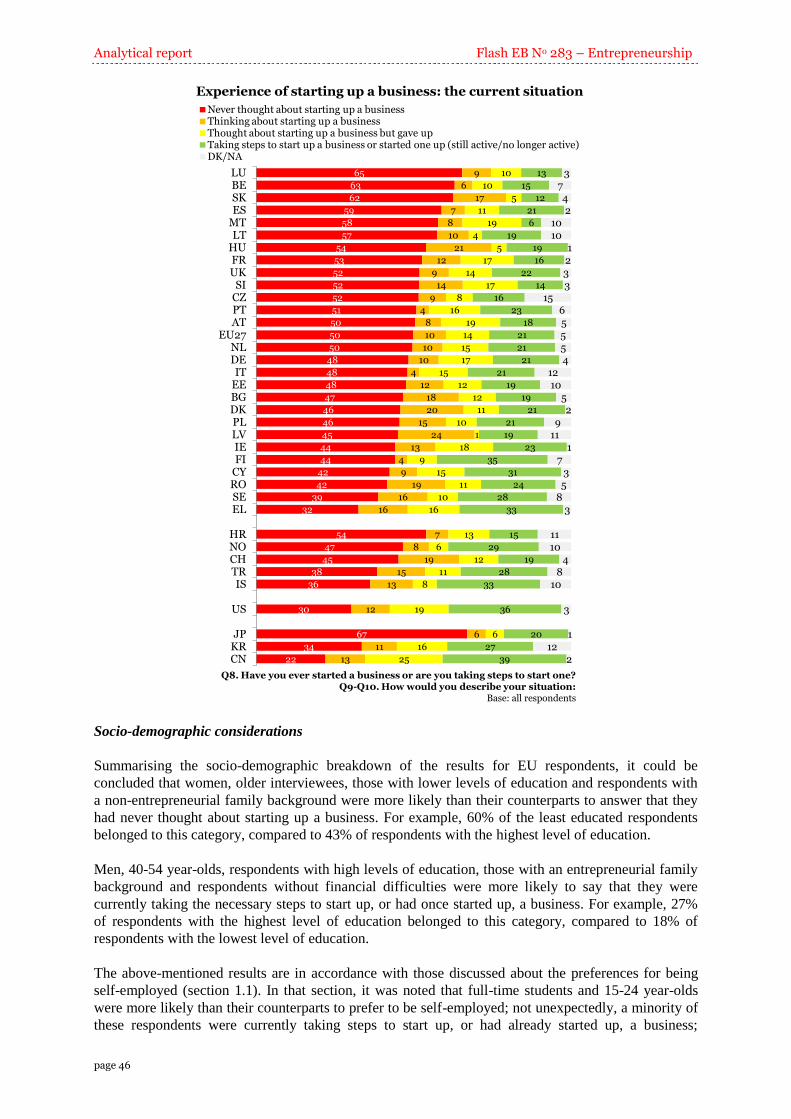
Analytical report Flash EB No 283 – Entrepreneurship
page 46
Experience of starting up a business: the current situation
65
63
62
59
58
57
54
53
52
52
52
51
50
50
50
48
48
48
47
46
46
45
44
44
42
42
39
32
54
47
45
38
36
30
67
34
22
9
6
17
7
8
10
21
12
9
14
9
4
8
10
10
10
4
12
18
20
15
24
13
4
9
19
16
16
7
8
19
15
13
12
6
11
13
10
10
5
11
19
4
5
17
14
17
8
16
19
14
15
17
15
12
12
11
10
1
18
9
15
11
10
16
13
6
12
11
8
19
6
16
25
13
15
12
21
6
19
19
16
22
14
16
23
18
21
21
21
21
19
19
21
21
19
23
35
31
24
28
33
15
29
19
28
33
36
20
27
39
3742
1010
1233
1565554
1210
52
911
17
35
83
1110
48
10
3
112
2
LUBESKES
MTLT
HUFRUK
SICZPTAT
EU27NLDEIT
EEBGDKPLLVIEFI
CYROSEEL
HRNOCHTRIS
US
JPKRCN
Never thought about starting up a businessThinking about starting up a business Thought about starting up a business but gave up Taking steps to start up a business or started one up (still active/no longer active)DK/NA
Q8. Have you ever started a business or are you taking steps to start one?Q9-Q10. How would you describe your situation:
Base: all respondents
Socio-demographic considerations
Summarising the socio-demographic breakdown of the results for EU respondents, it could be
concluded that women, older interviewees, those with lower levels of education and respondents with
a non-entrepreneurial family background were more likely than their counterparts to answer that they
had never thought about starting up a business. For example, 60% of the least educated respondents
belonged to this category, compared to 43% of respondents with the highest level of education.
Men, 40-54 year-olds, respondents with high levels of education, those with an entrepreneurial family
background and respondents without financial difficulties were more likely to say that they were
currently taking the necessary steps to start up, or had once started up, a business. For example, 27%
of respondents with the highest level of education belonged to this category, compared to 18% of
respondents with the lowest level of education.
The above-mentioned results are in accordance with those discussed about the preferences for being
self-employed (section 1.1). In that section, it was noted that full-time students and 15-24 year-olds
were more likely than their counterparts to prefer to be self-employed; not unexpectedly, a minority of
these respondents were currently taking steps to start up, or had already started up, a business;
Flash EB No 283 – Entrepreneurship Analytical report
page 47
however, they more frequently answered that they were considering starting up a business (24% and
26%, respectively, vs. an EU average of 10%).
For more details, see annex table 14c.
5.2 Entrepreneurial activity
The table below summarises the activities of those respondents who have been involved in any phase
of the process of setting-up a business – from first steps through to those respondents having an
established entrepreneurship. The three groups were defined as:
Embryonic: respondents who were taking the necessary steps to start up a business at the time of
the survey
New business: those who had started (or had taken over) a business in the last three years and
which was still active at the time of the survey
Established business: those who had started (or had taken over) a business more than three years
ago, and which was still active at the time of the survey.
Four percent of EU citizens were currently in the embryonic phase, i.e. taking the necessary steps to
start up a business, 3% were running a new business and 6% were running an established business. In
total, 12% of EU citizens were involved in entrepreneurial activity.
Within the EU, Finland and Cyprus had the highest rates of entrepreneurial activity (25% and 19%,
respectively). Belgium, Denmark, France, Luxembourg, Malta, Slovakia and Slovenia, on the other
hand, had entrepreneurship rates below 10%. Outside the EU, the level of entrepreneurial activity was
the highest in China (27%), followed by Turkey (23%), the US (21%) and Iceland (20%).
Respondents in China were the most likely to answer that they were currently starting up a business
(17%) – this was the only country were “embryonic entrepreneurship” was higher than the more
established types of entrepreneurship (5% “new business” and 5% “established business”). In Turkey
and the US, about a tenth of respondents were “nascent entrepreneurs” (9%-10%); in all other
countries included in this study, however, not more than 6% of respondents were in this embryonic
stage (ranging from 1% in Bulgaria and Denmark to 6% in Finland, Ireland, Poland, Romania and
Sweden).
The proportion of respondents who had recently started (or had taken over) a business was somewhat
higher in Cyprus, Iceland, Turkey, Romania and Finland (6%-8%, compared to an EU average of 3%).
Finnish respondents were also more likely than their counterparts in other EU Member States to run a
business that had been active for at least three years (11% compared to an EU average of 6%). In
Japan and Iceland, about a tenth (9%-10%) of respondents were running such an established business.
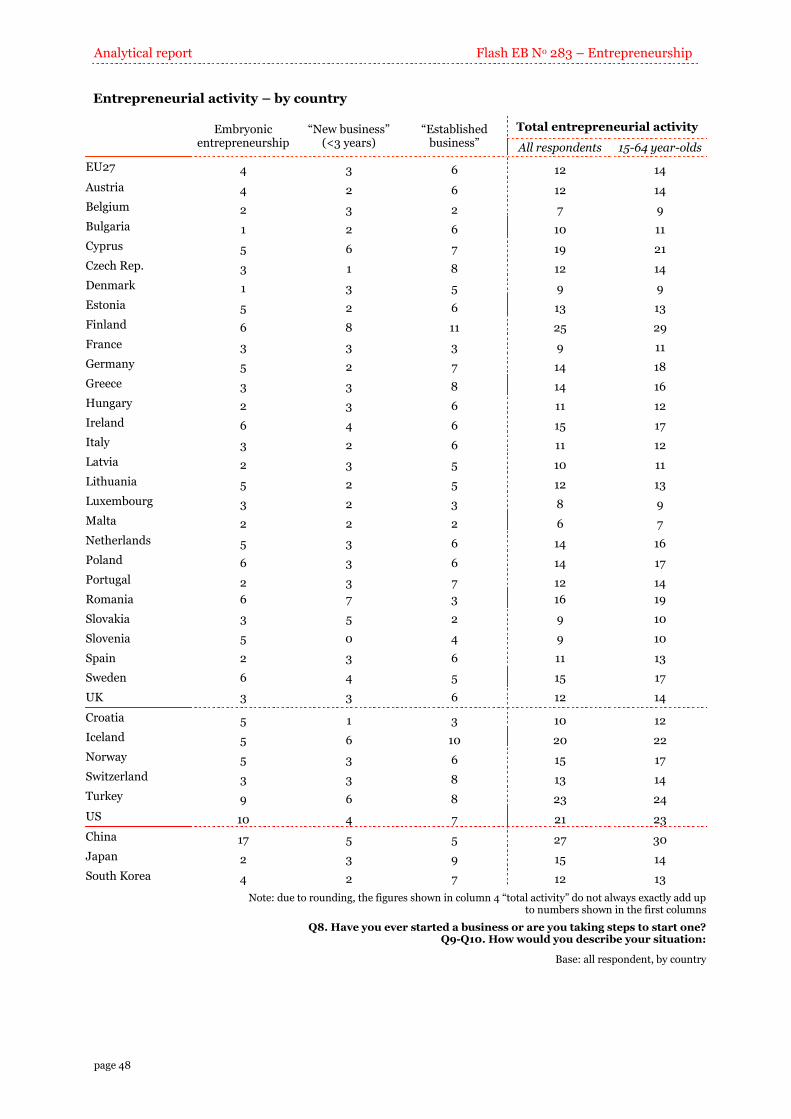
Analytical report Flash EB No 283 – Entrepreneurship
page 48
Entrepreneurial activity – by country
Embryonic
entrepreneurship “New business”
(<3 years) “Established
business”
Total entrepreneurial activity
All respondents 15-64 year-olds
EU27 4 3 6 12 14
Austria 4 2 6 12 14
Belgium 2 3 2 7 9
Bulgaria 1 2 6 10 11
Cyprus 5 6 7 19 21
Czech Rep. 3 1 8 12 14
Denmark 1 3 5 9 9
Estonia 5 2 6 13 13
Finland 6 8 11 25 29
France 3 3 3 9 11
Germany 5 2 7 14 18
Greece 3 3 8 14 16
Hungary 2 3 6 11 12
Ireland 6 4 6 15 17
Italy 3 2 6 11 12
Latvia 2 3 5 10 11
Lithuania 5 2 5 12 13
Luxembourg 3 2 3 8 9
Malta 2 2 2 6 7
Netherlands 5 3 6 14 16
Poland 6 3 6 14 17
Portugal 2 3 7 12 14
Romania 6 7 3 16 19
Slovakia 3 5 2 9 10
Slovenia 5 0 4 9 10
Spain 2 3 6 11 13
Sweden 6 4 5 15 17
UK 3 3 6 12 14
Croatia 5 1 3 10 12
Iceland 5 6 10 20 22
Norway 5 3 6 15 17
Switzerland 3 3 8 13 14
Turkey 9 6 8 23 24
US 10 4 7 21 23
China 17 5 5 27 30
Japan 2 3 9 15 14
South Korea 4 2 7 12 13
Note: due to rounding, the figures shown in column 4 “total activity” do not always exactly add up to numbers shown in the first columns
Q8. Have you ever started a business or are you taking steps to start one? Q9-Q10. How would you describe your situation:
Base: all respondent, by country
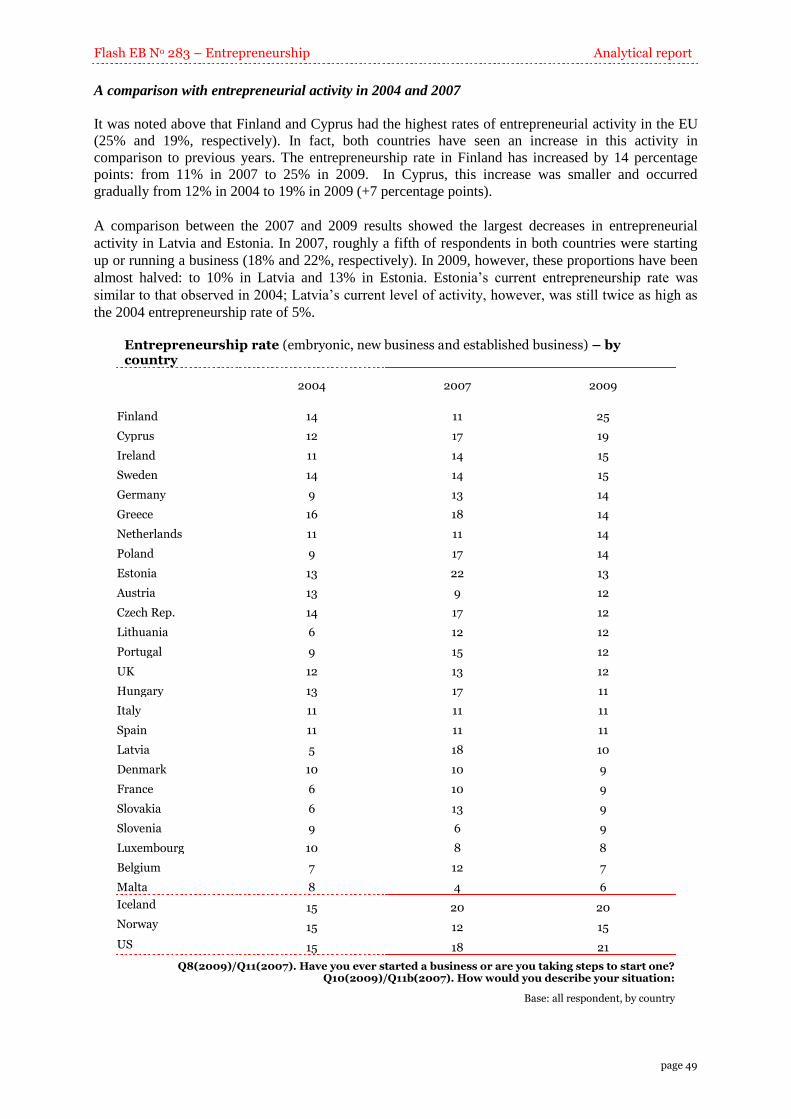
Flash EB No 283 – Entrepreneurship Analytical report
page 49
A comparison with entrepreneurial activity in 2004 and 2007
It was noted above that Finland and Cyprus had the highest rates of entrepreneurial activity in the EU
(25% and 19%, respectively). In fact, both countries have seen an increase in this activity in
comparison to previous years. The entrepreneurship rate in Finland has increased by 14 percentage
points: from 11% in 2007 to 25% in 2009. In Cyprus, this increase was smaller and occurred
gradually from 12% in 2004 to 19% in 2009 (+7 percentage points).
A comparison between the 2007 and 2009 results showed the largest decreases in entrepreneurial
activity in Latvia and Estonia. In 2007, roughly a fifth of respondents in both countries were starting
up or running a business (18% and 22%, respectively). In 2009, however, these proportions have been
almost halved: to 10% in Latvia and 13% in Estonia. Estonia’s current entrepreneurship rate was
similar to that observed in 2004; Latvia’s current level of activity, however, was still twice as high as
the 2004 entrepreneurship rate of 5%.
Entrepreneurship rate (embryonic, new business and established business) – by country
2004 2007 2009
Finland 14 11 25
Cyprus 12 17 19
Ireland 11 14 15
Sweden 14 14 15
Germany 9 13 14
Greece 16 18 14
Netherlands 11 11 14
Poland 9 17 14
Estonia 13 22 13
Austria 13 9 12
Czech Rep. 14 17 12
Lithuania 6 12 12
Portugal 9 15 12
UK 12 13 12
Hungary 13 17 11
Italy 11 11 11
Spain 11 11 11
Latvia 5 18 10
Denmark 10 10 9
France 6 10 9
Slovakia 6 13 9
Slovenia 9 6 9
Luxembourg 10 8 8
Belgium 7 12 7
Malta 8 4 6
Iceland 15 20 20
Norway 15 12 15
US 15 18 21
Q8(2009)/Q11(2007). Have you ever started a business or are you taking steps to start one? Q10(2009)/Q11b(2007). How would you describe your situation:
Base: all respondent, by country
Analytical report Flash EB No 283 – Entrepreneurship
page 50
Socio-demographic considerations
In accordance with the results discussed earlier, entrepreneurship rates in the EU were higher for men,
25-54 year-olds, respondents with a higher level of education, respondents without financial
difficulties and those with an entrepreneurial family background. For example, men were twice as
likely as women to be involved in entrepreneurial activity (17% vs. 8%). Similarly, while 18% of
respondents whose parents were (or had been) self-employed were themselves also starting up or
running a business, this proportion decreased to 10% of respondents where this was not the case.
As expected, 15-24 year-olds were more likely to be starting up a business (6% “embryonic”
entrepreneurship vs. 2% “new business”), while 40-54 year-olds were more likely to be running an
established business (10% vs. 4% “embryonic” and 4% “new business”). For 25-39 year-olds,
involvement in entrepreneurial activity was more equally distributed over the different phases of the
entrepreneurial process: 7% “embryonic”, 5% “new business” and 5% “established business”.
For more details, see annex table 14c.
5.3 Business discontinuity and failure
In this final section of the chapter, the focus is changed from all respondents to those with at least
some business experience; the chart below distinguishes between respondents who were:
(1) “embryonic”, “new” or “established”: taking steps to start up a business or currently running
one, and
(2) “no longer an entrepreneur”: their business had been sold, transferred, closed or had failed.
The proportions of respondents who answered that they were no longer an active entrepreneur were the
highest in Denmark and Greece: 58% and 54%, respectively (compared to 42% of “active”
entrepreneurs). In both countries, the largest group of no longer active entrepreneurs had transferred,
sold or closed their business (44% and 37%, respectively). Nonetheless, respondents in Greece were
somewhat more likely than Danes to say their business had failed (17% vs. 14%).
In fact, in most countries, respondents who said they had sold, transferred or closed their business
outnumbered those who said that their business had failed. For example, 34% of British respondents
having business experience said that they had sold, transferred or closed their business and 9%
reported a business failure.
In five EU Member States, however, the proportion of “failed businesses” was higher than the
corresponding proportion of “discontinued businesses (sold, transferred or closed)”: Slovakia (17%
“failed” vs. 9% “discontinued”), Romania (19% vs. 9%), Lithuania (18% vs. 12%), the Czech
Republic (13% vs. 11%) and Bulgaria (26% vs. 20%). A similar trend was seen in South Korea (27%
vs. 23%) and China (20% vs. 10%).
The proportion of no longer active entrepreneurs who answered that their business had failed was the
highest in two of the above-mentioned countries: Bulgaria (26%) and South Korea (27%). In Hungary,
Romania and China, about a fifth of interviewees belonged to this category (19%-20%). Malta, France,
Italy, Iceland and Turkey, on the other hand, had the lowest proportions of “failed businesses” (0%-
4%)17
.
17
Note: in some countries, less than 100 respondents had some business experience (e.g. Malta and Slovakia).
Some caution should therefore be exercised when interpreting the results discussed in this section.
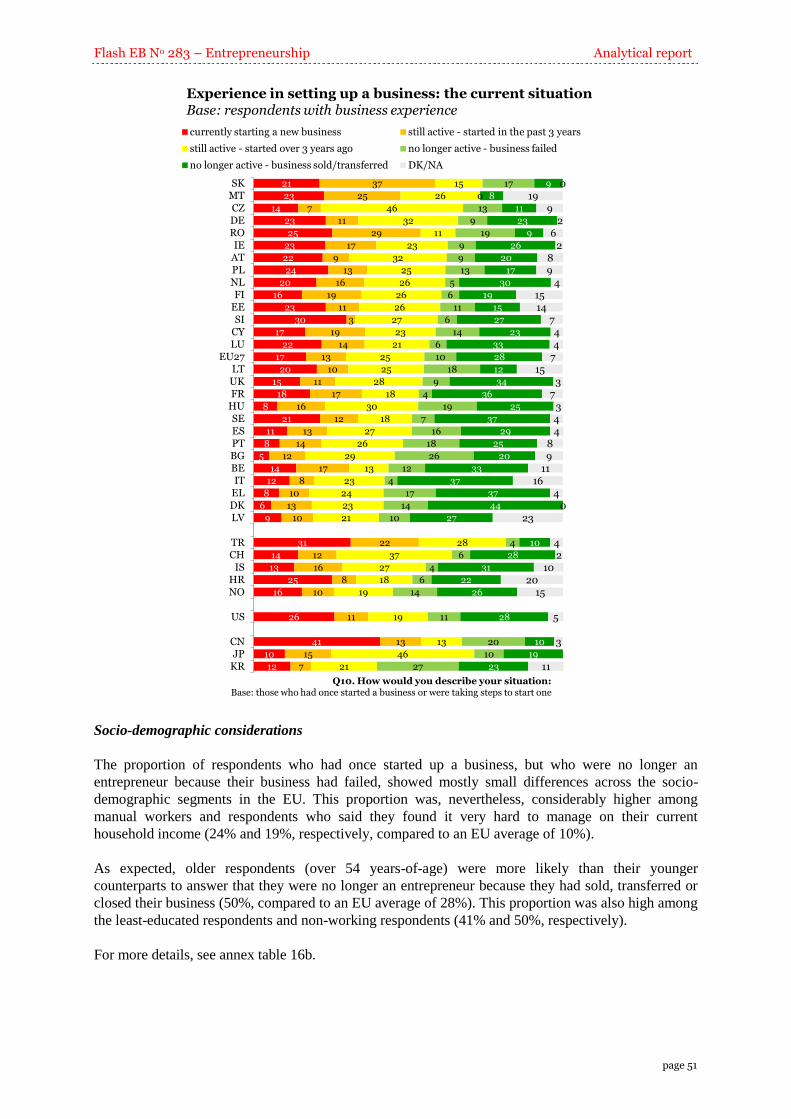
Flash EB No 283 – Entrepreneurship Analytical report
page 51
Experience in setting up a business: the current situation Base: respondents with business experience
Q10. How would you describe your situation:Base: those who had once started a business or were taking steps to start one
21
23
14
23
25
23
22
24
20
16
23
30
17
22
17
20
15
18
8
21
11
8
5
14
12
8
6
9
31
14
13
25
16
26
41
10
12
37
25
7
11
29
17
9
13
16
19
11
3
19
14
13
10
11
17
16
12
13
14
12
17
8
10
13
10
22
12
16
8
10
11
13
15
7
15
26
46
32
11
23
32
25
26
26
26
27
23
21
25
25
28
18
30
18
27
26
29
13
23
24
23
21
28
37
27
18
19
19
13
46
21
17
0
13
9
19
9
9
13
5
6
11
6
14
6
10
18
9
4
19
7
16
18
26
12
4
17
14
10
4
6
4
6
14
11
20
10
27
9
8
11
23
9
26
20
17
30
19
15
27
23
33
28
12
34
36
25
37
29
25
20
33
37
37
44
27
10
28
31
22
26
28
10
19
23
019
92
62
89
41514
744
715
37
344
89
1116
40
23
42
1020
15
5
3
11
SKMTCZDEROIE
ATPLNLFI
EESI
CYLU
EU27LTUKFR
HUSEESPTBGBEIT
ELDKLV
TRCH
ISHRNO
US
CNJP
KR
currently starting a new business still active - started in the past 3 years
still active - started over 3 years ago no longer active - business failed
no longer active - business sold/transferred DK/NA
Socio-demographic considerations
The proportion of respondents who had once started up a business, but who were no longer an
entrepreneur because their business had failed, showed mostly small differences across the socio-
demographic segments in the EU. This proportion was, nevertheless, considerably higher among
manual workers and respondents who said they found it very hard to manage on their current
household income (24% and 19%, respectively, compared to an EU average of 10%).
As expected, older respondents (over 54 years-of-age) were more likely than their younger
counterparts to answer that they were no longer an entrepreneur because they had sold, transferred or
closed their business (50%, compared to an EU average of 28%). This proportion was also high among
the least-educated respondents and non-working respondents (41% and 50%, respectively).
For more details, see annex table 16b.
Analytical report Flash EB No 283 – Entrepreneurship
page 52
6. Starting up a business – necessary factors
Chapter 6 looks at the results of a number of questions about starting up a business. Respondents with
at least some experience of starting up such a venture were asked to:
rate a number of factors – such as having an appropriate business idea or the existence of a role
model – in terms of how important such factors had been in their decision to take steps to start up
a business,
specify their preference for starting up a new business or taking over an existing one,
choose whether the best approach for a new business would be to grow it slowly (if at all) or
expand it as quickly as possible, and
state whether they had started their business out of necessity or because they saw an opportunity
(necessity-driven vs. opportunity-driven entrepreneurship).
This chapter looks specifically at those respondents with some business experience.
Depending on the topic, this group consists of:
(1) only those respondents who had started up a business or were currently taking steps to start one,
(2) this first sub-group together with respondents who were currently thinking about starting up a
business and those who had thought about it, or who had already taken steps to do so, but had
given up.
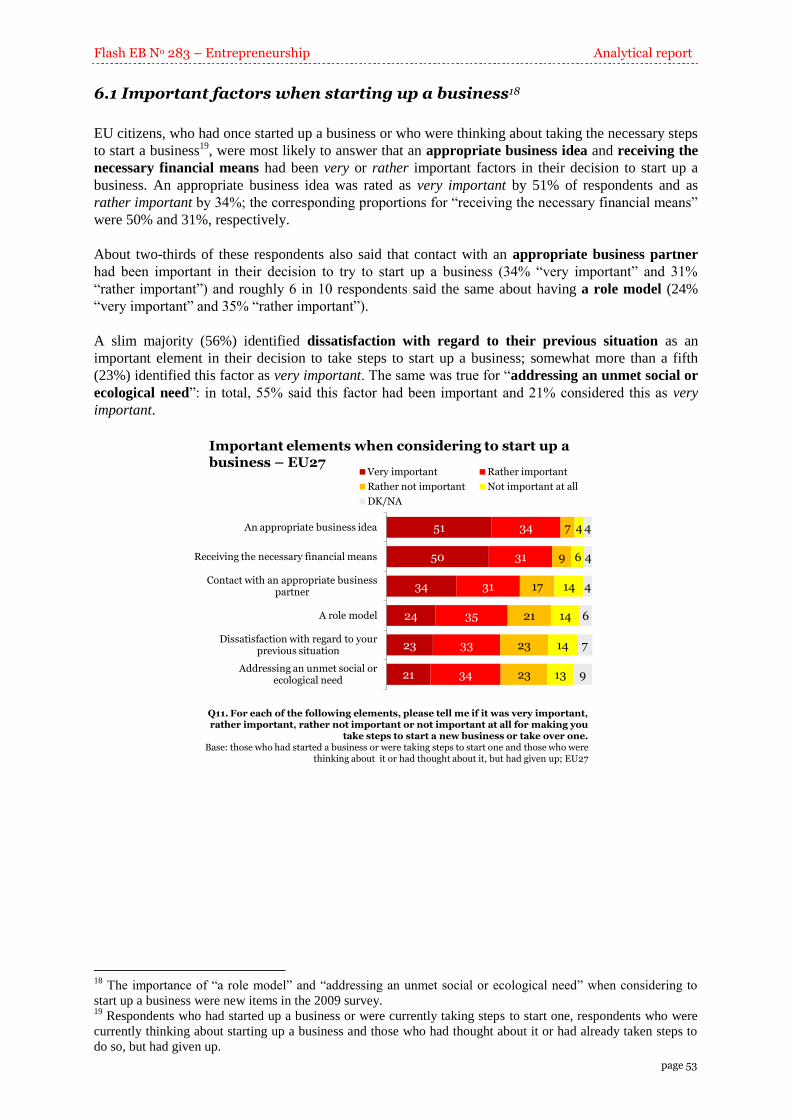
Flash EB No 283 – Entrepreneurship Analytical report
page 53
6.1 Important factors when starting up a business18
EU citizens, who had once started up a business or who were thinking about taking the necessary steps
to start a business19
, were most likely to answer that an appropriate business idea and receiving the
necessary financial means had been very or rather important factors in their decision to start up a
business. An appropriate business idea was rated as very important by 51% of respondents and as
rather important by 34%; the corresponding proportions for “receiving the necessary financial means”
were 50% and 31%, respectively.
About two-thirds of these respondents also said that contact with an appropriate business partner
had been important in their decision to try to start up a business (34% “very important” and 31%
“rather important”) and roughly 6 in 10 respondents said the same about having a role model (24%
“very important” and 35% “rather important”).
A slim majority (56%) identified dissatisfaction with regard to their previous situation as an
important element in their decision to take steps to start up a business; somewhat more than a fifth
(23%) identified this factor as very important. The same was true for “addressing an unmet social or
ecological need”: in total, 55% said this factor had been important and 21% considered this as very
important.
Important elements when considering to start up a business – EU27
51
50
34
24
23
21
34
31
31
35
33
34
7
9
17
21
23
23
4
6
14
14
14
13
4
4
4
6
7
9
An appropriate business idea
Receiving the necessary financial means
Contact with an appropriate business partner
A role model
Dissatisfaction with regard to your previous situation
Addressing an unmet social or ecological need
Very important Rather important
Rather not important Not important at all
DK/NA
Q11. For each of the following elements, please tell me if it was very important, rather important, rather not important or not important at all for making you
take steps to start a new business or take over one.Base: those who had started a business or were taking steps to start one and those who were
thinking about it or had thought about it, but had given up; EU27
18
The importance of “a role model” and “addressing an unmet social or ecological need” when considering to
start up a business were new items in the 2009 survey. 19
Respondents who had started up a business or were currently taking steps to start one, respondents who were
currently thinking about starting up a business and those who had thought about it or had already taken steps to
do so, but had given up.
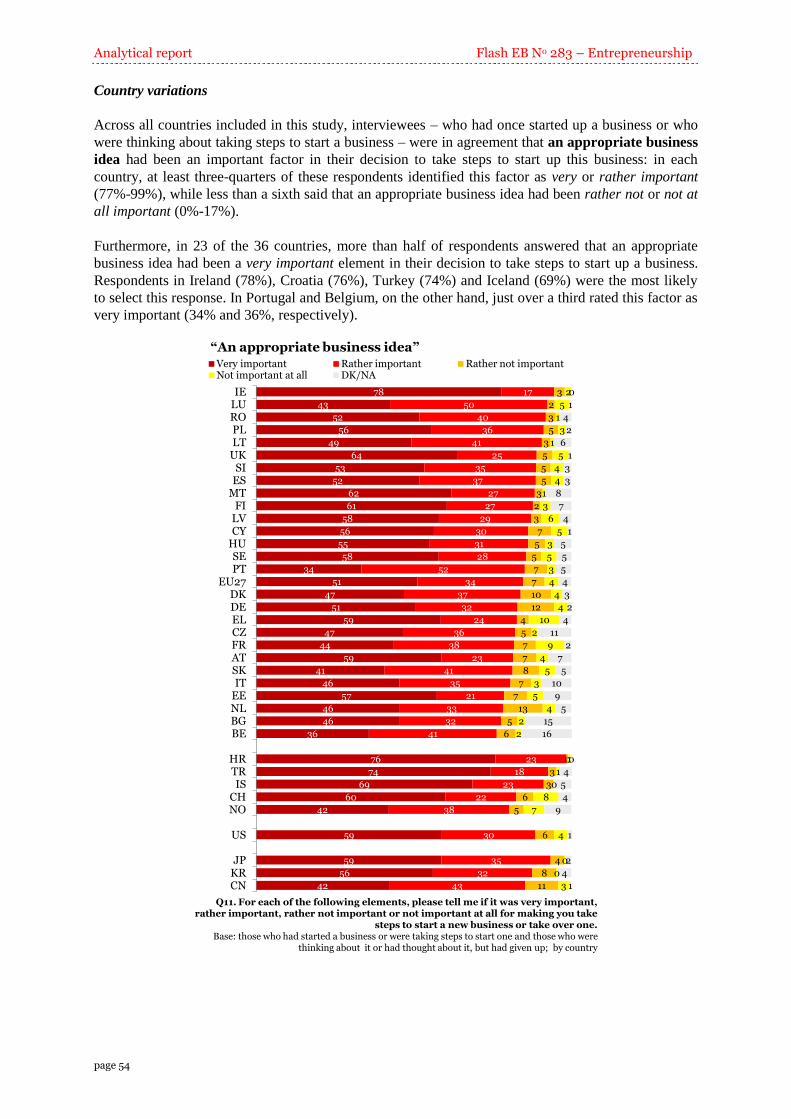
Analytical report Flash EB No 283 – Entrepreneurship
page 54
Country variations
Across all countries included in this study, interviewees – who had once started up a business or who
were thinking about taking steps to start a business – were in agreement that an appropriate business
idea had been an important factor in their decision to take steps to start up this business: in each
country, at least three-quarters of these respondents identified this factor as very or rather important
(77%-99%), while less than a sixth said that an appropriate business idea had been rather not or not at
all important (0%-17%).
Furthermore, in 23 of the 36 countries, more than half of respondents answered that an appropriate
business idea had been a very important element in their decision to take steps to start up a business.
Respondents in Ireland (78%), Croatia (76%), Turkey (74%) and Iceland (69%) were the most likely
to select this response. In Portugal and Belgium, on the other hand, just over a third rated this factor as
very important (34% and 36%, respectively).
“An appropriate business idea”
78
43
52
56
49
64
53
52
62
61
58
56
55
58
34
51
47
51
59
47
44
59
41
46
57
46
46
36
76
74
69
60
42
59
59
56
42
17
50
40
36
41
25
35
37
27
27
29
30
31
28
52
34
37
32
24
36
38
23
41
35
21
33
32
41
23
18
23
22
38
30
35
32
43
3
2
3
5
3
5
5
5
3
2
3
7
5
5
7
7
10
12
4
5
7
7
8
7
7
13
5
6
0
3
3
6
5
6
4
8
11
2
5
1
3
1
5
4
4
1
3
6
5
3
5
3
4
4
4
10
2
9
4
5
3
5
4
2
2
1
1
0
8
7
4
0
0
3
0
1
4
2
6
1
3
3
8
7
4
1
5
5
5
4
3
2
4
11
2
7
5
10
9
5
15
16
0
4
5
4
9
1
2
4
1
IELUROPLLT
UKSI
ESMT
FILVCY
HUSEPT
EU27DKDEELCZFRATSKIT
EENLBGBE
HRTRIS
CHNO
US
JPKRCN
Very important Rather important Rather not importantNot important at all DK/NA
Q11. For each of the following elements, please tell me if it was very important, rather important, rather not important or not important at all for making you take
steps to start a new business or take over one.Base: those who had started a business or were taking steps to start one and those who were
thinking about it or had thought about it, but had given up; by country
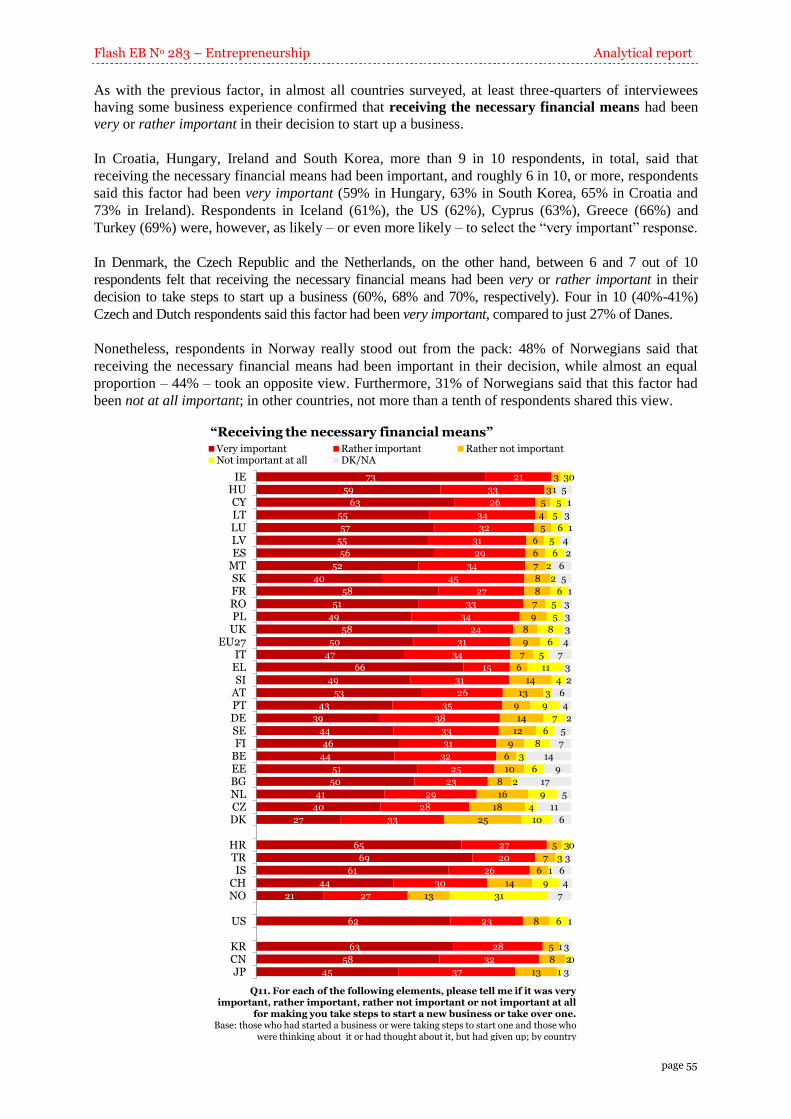
Flash EB No 283 – Entrepreneurship Analytical report
page 55
As with the previous factor, in almost all countries surveyed, at least three-quarters of interviewees
having some business experience confirmed that receiving the necessary financial means had been
very or rather important in their decision to start up a business.
In Croatia, Hungary, Ireland and South Korea, more than 9 in 10 respondents, in total, said that
receiving the necessary financial means had been important, and roughly 6 in 10, or more, respondents
said this factor had been very important (59% in Hungary, 63% in South Korea, 65% in Croatia and
73% in Ireland). Respondents in Iceland (61%), the US (62%), Cyprus (63%), Greece (66%) and
Turkey (69%) were, however, as likely – or even more likely – to select the “very important” response.
In Denmark, the Czech Republic and the Netherlands, on the other hand, between 6 and 7 out of 10
respondents felt that receiving the necessary financial means had been very or rather important in their
decision to take steps to start up a business (60%, 68% and 70%, respectively). Four in 10 (40%-41%)
Czech and Dutch respondents said this factor had been very important, compared to just 27% of Danes.
Nonetheless, respondents in Norway really stood out from the pack: 48% of Norwegians said that
receiving the necessary financial means had been important in their decision, while almost an equal
proportion – 44% – took an opposite view. Furthermore, 31% of Norwegians said that this factor had
been not at all important; in other countries, not more than a tenth of respondents shared this view.
“Receiving the necessary financial means”
73
59
63
55
57
55
56
52
40
58
51
49
58
50
47
66
49
53
43
39
44
46
44
51
50
41
40
27
65
69
61
44
21
62
63
58
45
21
33
26
34
32
31
29
34
45
27
33
34
24
31
34
15
31
26
35
38
33
31
32
25
23
29
28
33
27
20
26
30
27
23
28
32
37
3
3
5
4
5
6
6
7
8
8
7
9
8
9
7
6
14
13
9
14
12
9
6
10
8
16
18
25
5
7
6
14
13
8
5
8
13
3
1
5
5
6
5
6
2
2
6
5
5
8
6
5
11
4
3
9
7
6
8
3
6
2
9
4
10
3
3
1
9
31
6
1
2
1
0
5
1
3
1
4
2
6
5
1
3
3
3
4
7
3
2
6
4
2
5
7
14
9
17
5
11
6
0
3
6
4
7
1
3
0
3
IEHUCYLTLULVES
MTSKFRROPL
UKEU27
ITELSI
ATPTDESEFI
BEEEBGNLCZDK
HRTRIS
CHNO
US
KRCNJP
Very important Rather important Rather not importantNot important at all DK/NA
Q11. For each of the following elements, please tell me if it was very important, rather important, rather not important or not important at all
for making you take steps to start a new business or take over one.Base: those who had started a business or were taking steps to start one and those who
were thinking about it or had thought about it, but had given up; by country
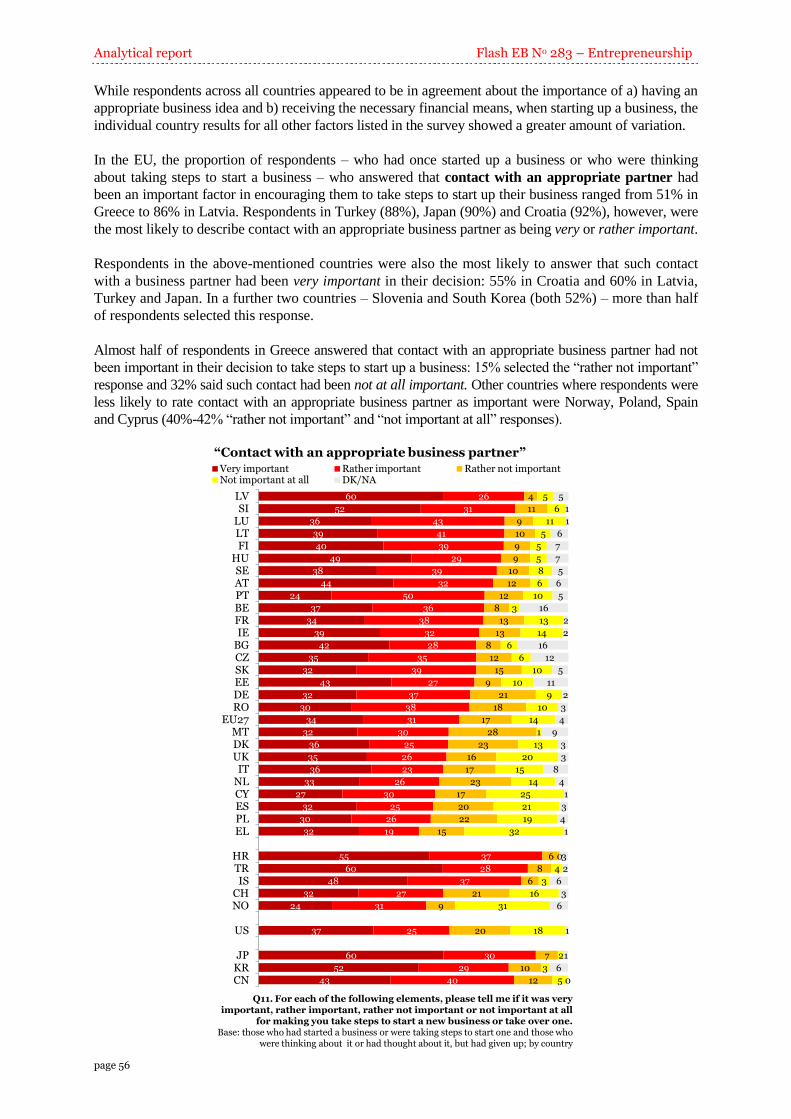
Analytical report Flash EB No 283 – Entrepreneurship
page 56
While respondents across all countries appeared to be in agreement about the importance of a) having an
appropriate business idea and b) receiving the necessary financial means, when starting up a business, the
individual country results for all other factors listed in the survey showed a greater amount of variation.
In the EU, the proportion of respondents – who had once started up a business or who were thinking
about taking steps to start a business – who answered that contact with an appropriate partner had
been an important factor in encouraging them to take steps to start up their business ranged from 51% in
Greece to 86% in Latvia. Respondents in Turkey (88%), Japan (90%) and Croatia (92%), however, were
the most likely to describe contact with an appropriate business partner as being very or rather important.
Respondents in the above-mentioned countries were also the most likely to answer that such contact
with a business partner had been very important in their decision: 55% in Croatia and 60% in Latvia,
Turkey and Japan. In a further two countries – Slovenia and South Korea (both 52%) – more than half
of respondents selected this response.
Almost half of respondents in Greece answered that contact with an appropriate business partner had not
been important in their decision to take steps to start up a business: 15% selected the “rather not important”
response and 32% said such contact had been not at all important. Other countries where respondents were
less likely to rate contact with an appropriate business partner as important were Norway, Poland, Spain
and Cyprus (40%-42% “rather not important” and “not important at all” responses).
“Contact with an appropriate business partner”
60
52
36
39
40
49
38
44
24
37
34
39
42
35
32
43
32
30
34
32
36
35
36
33
27
32
30
32
55
60
48
32
24
37
60
52
43
26
31
43
41
39
29
39
32
50
36
38
32
28
35
39
27
37
38
31
30
25
26
23
26
30
25
26
19
37
28
37
27
31
25
30
29
40
4
11
9
10
9
9
10
12
12
8
13
13
8
12
15
9
21
18
17
28
23
16
17
23
17
20
22
15
6
8
6
21
9
20
7
10
12
5
6
11
5
5
5
8
6
10
3
13
14
6
6
10
10
9
10
14
1
13
20
15
14
25
21
19
32
0
4
3
16
31
18
2
3
5
5
1
1
6
7
7
5
6
5
16
2
2
16
12
5
11
2
3
4
9
3
3
8
4
1
3
4
1
3
2
6
3
6
1
1
6
0
LVSI
LULTFI
HUSEATPTBEFRIE
BGCZSKEEDERO
EU27MTDKUKIT
NLCYESPLEL
HRTRIS
CHNO
US
JPKRCN
Very important Rather important Rather not importantNot important at all DK/NA
Q11. For each of the following elements, please tell me if it was very important, rather important, rather not important or not important at all
for making you take steps to start a new business or take over one.Base: those who had started a business or were taking steps to start one and those who
were thinking about it or had thought about it, but had given up; by country
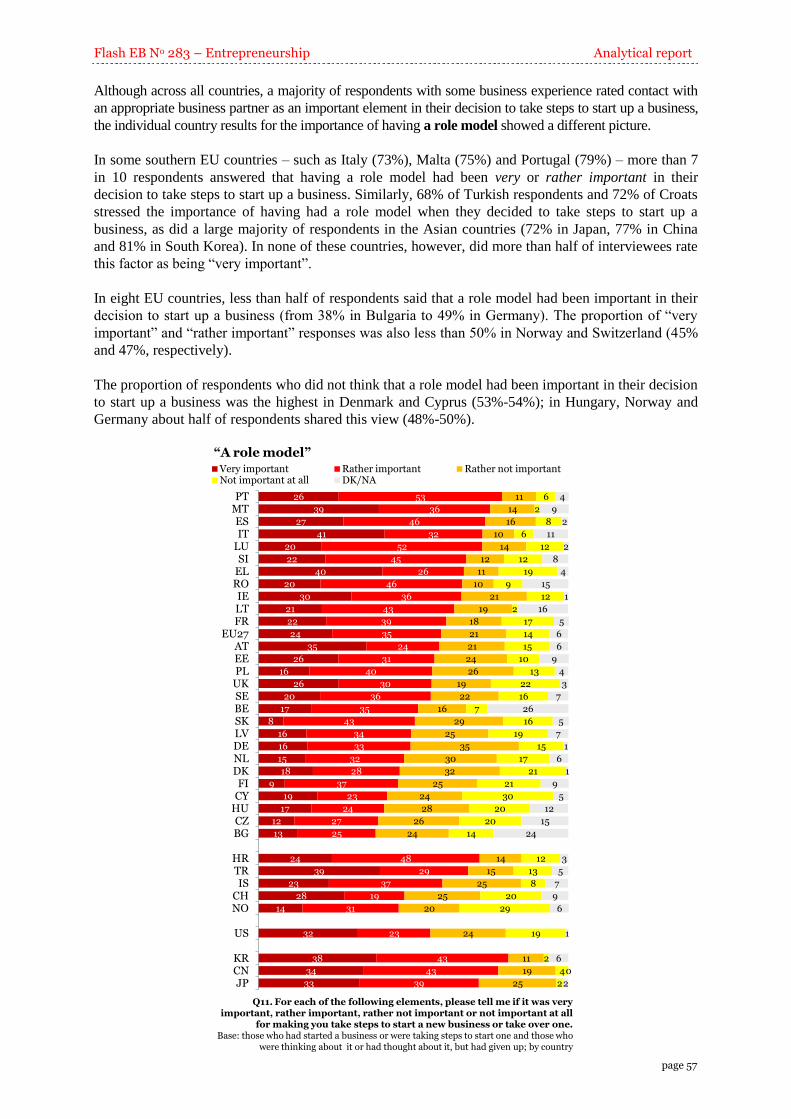
Flash EB No 283 – Entrepreneurship Analytical report
page 57
Although across all countries, a majority of respondents with some business experience rated contact with
an appropriate business partner as an important element in their decision to take steps to start up a business,
the individual country results for the importance of having a role model showed a different picture.
In some southern EU countries – such as Italy (73%), Malta (75%) and Portugal (79%) – more than 7
in 10 respondents answered that having a role model had been very or rather important in their
decision to take steps to start up a business. Similarly, 68% of Turkish respondents and 72% of Croats
stressed the importance of having had a role model when they decided to take steps to start up a
business, as did a large majority of respondents in the Asian countries (72% in Japan, 77% in China
and 81% in South Korea). In none of these countries, however, did more than half of interviewees rate
this factor as being “very important”.
In eight EU countries, less than half of respondents said that a role model had been important in their
decision to start up a business (from 38% in Bulgaria to 49% in Germany). The proportion of “very
important” and “rather important” responses was also less than 50% in Norway and Switzerland (45%
and 47%, respectively).
The proportion of respondents who did not think that a role model had been important in their decision
to start up a business was the highest in Denmark and Cyprus (53%-54%); in Hungary, Norway and
Germany about half of respondents shared this view (48%-50%).
“A role model”
26
39
27
41
20
22
40
20
30
21
22
24
35
26
16
26
20
17
8
16
16
15
18
9
19
17
12
13
24
39
23
28
14
32
38
34
33
53
36
46
32
52
45
26
46
36
43
39
35
24
31
40
30
36
35
43
34
33
32
28
37
23
24
27
25
48
29
37
19
31
23
43
43
39
11
14
16
10
14
12
11
10
21
19
18
21
21
24
26
19
22
16
29
25
35
30
32
25
24
28
26
24
14
15
25
25
20
24
11
19
25
6
2
8
6
12
12
19
9
12
2
17
14
15
10
13
22
16
7
16
19
15
17
21
21
30
20
20
14
12
13
8
20
29
19
2
4
2
4
9
2
11
2
8
4
15
1
16
5
6
6
9
4
3
7
26
5
7
1
6
1
9
5
12
15
24
3
5
7
9
6
1
6
0
2
PTMTESIT
LUSI
ELROIELTFR
EU27ATEEPL
UKSEBESKLVDENLDKFI
CYHUCZBG
HRTRIS
CHNO
US
KRCNJP
Very important Rather important Rather not importantNot important at all DK/NA
Q11. For each of the following elements, please tell me if it was very important, rather important, rather not important or not important at all
for making you take steps to start a new business or take over one.Base: those who had started a business or were taking steps to start one and those who
were thinking about it or had thought about it, but had given up; by country
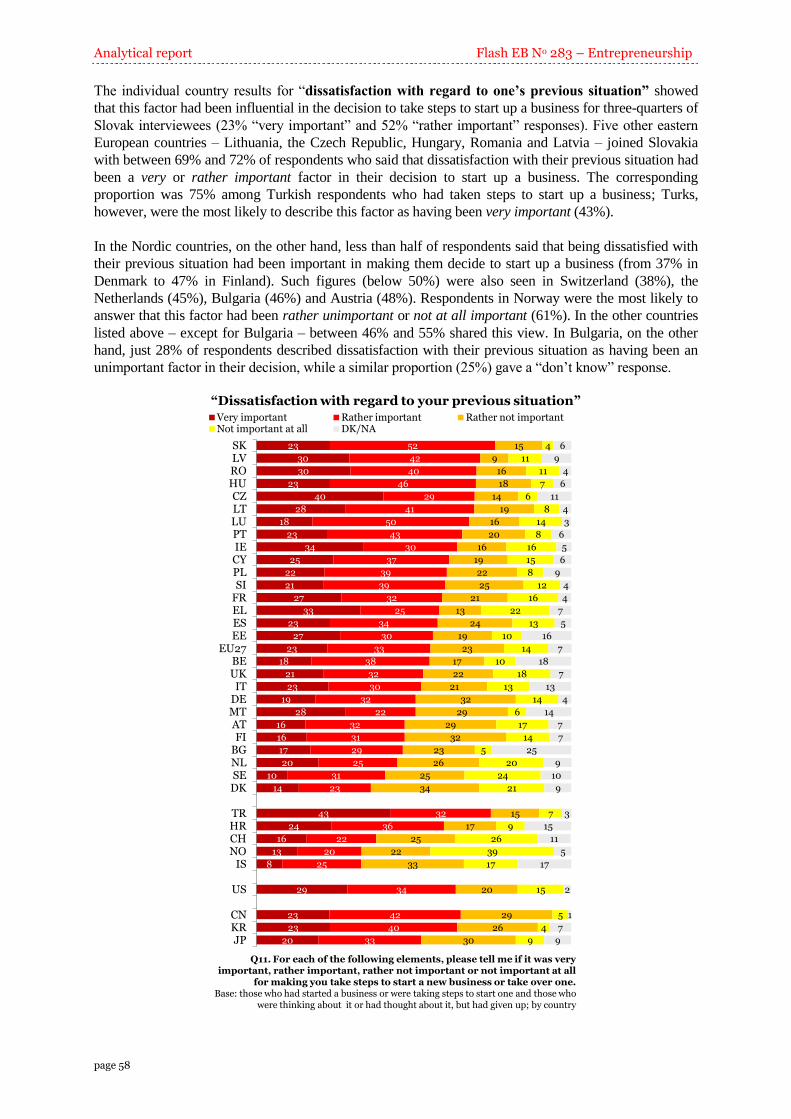
Analytical report Flash EB No 283 – Entrepreneurship
page 58
The individual country results for “dissatisfaction with regard to one’s previous situation” showed
that this factor had been influential in the decision to take steps to start up a business for three-quarters of
Slovak interviewees (23% “very important” and 52% “rather important” responses). Five other eastern
European countries – Lithuania, the Czech Republic, Hungary, Romania and Latvia – joined Slovakia
with between 69% and 72% of respondents who said that dissatisfaction with their previous situation had
been a very or rather important factor in their decision to start up a business. The corresponding
proportion was 75% among Turkish respondents who had taken steps to start up a business; Turks,
however, were the most likely to describe this factor as having been very important (43%).
In the Nordic countries, on the other hand, less than half of respondents said that being dissatisfied with
their previous situation had been important in making them decide to start up a business (from 37% in
Denmark to 47% in Finland). Such figures (below 50%) were also seen in Switzerland (38%), the
Netherlands (45%), Bulgaria (46%) and Austria (48%). Respondents in Norway were the most likely to
answer that this factor had been rather unimportant or not at all important (61%). In the other countries
listed above – except for Bulgaria – between 46% and 55% shared this view. In Bulgaria, on the other
hand, just 28% of respondents described dissatisfaction with their previous situation as having been an
unimportant factor in their decision, while a similar proportion (25%) gave a “don’t know” response.
“Dissatisfaction with regard to your previous situation”
23
30
30
23
40
28
18
23
34
25
22
21
27
33
23
27
23
18
21
23
19
28
16
16
17
20
10
14
43
24
16
13
8
29
23
23
20
52
42
40
46
29
41
50
43
30
37
39
39
32
25
34
30
33
38
32
30
32
22
32
31
29
25
31
23
32
36
22
20
25
34
42
40
33
15
9
16
18
14
19
16
20
16
19
22
25
21
13
24
19
23
17
22
21
32
29
29
32
23
26
25
34
15
17
25
22
33
20
29
26
30
4
11
11
7
6
8
14
8
16
15
8
12
16
22
13
10
14
10
18
13
14
6
17
14
5
20
24
21
7
9
26
39
17
15
5
4
9
6
9
4
6
11
4
3
6
5
6
9
4
4
7
5
16
7
18
7
13
4
14
7
7
25
9
10
9
3
15
11
5
17
2
1
7
9
SKLVROHUCZLTLUPTIECYPLSI
FRELESEE
EU27BEUKIT
DEMTATFI
BGNLSEDK
TRHRCHNO
IS
US
CNKRJP
Very important Rather important Rather not importantNot important at all DK/NA
Q11. For each of the following elements, please tell me if it was very important, rather important, rather not important or not important at all
for making you take steps to start a new business or take over one.Base: those who had started a business or were taking steps to start one and those who
were thinking about it or had thought about it, but had given up; by country
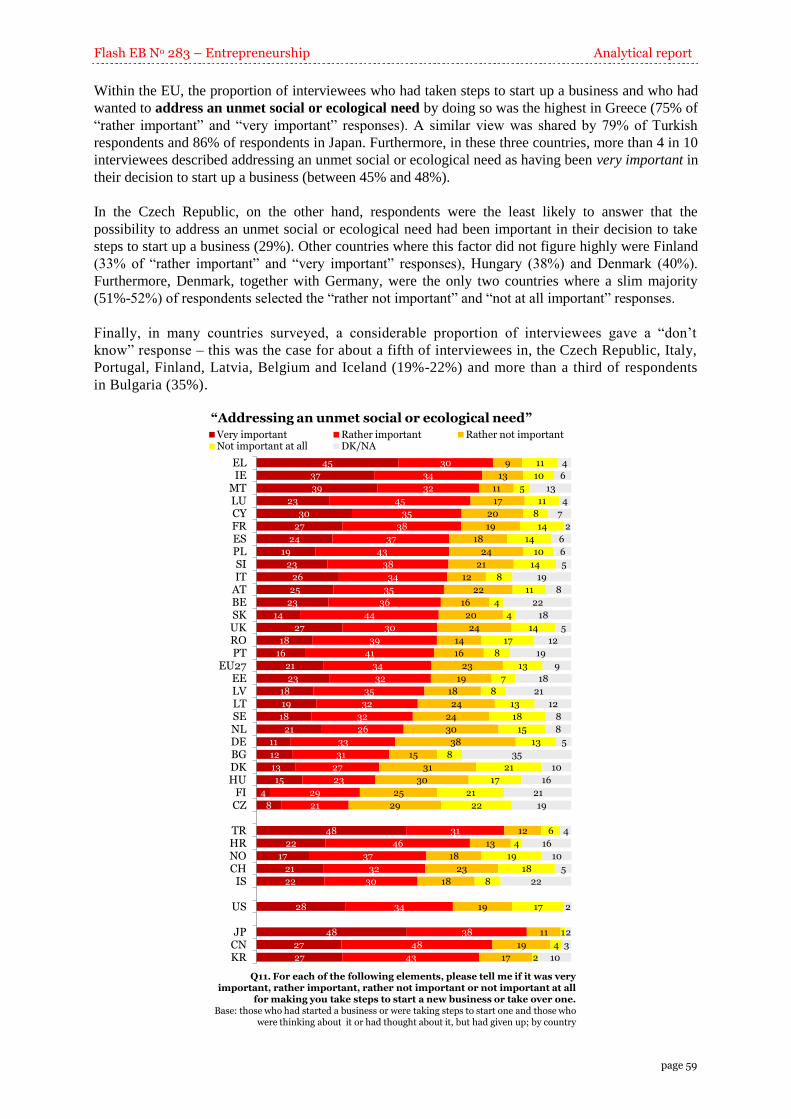
Flash EB No 283 – Entrepreneurship Analytical report
page 59
Within the EU, the proportion of interviewees who had taken steps to start up a business and who had
wanted to address an unmet social or ecological need by doing so was the highest in Greece (75% of
“rather important” and “very important” responses). A similar view was shared by 79% of Turkish
respondents and 86% of respondents in Japan. Furthermore, in these three countries, more than 4 in 10
interviewees described addressing an unmet social or ecological need as having been very important in
their decision to start up a business (between 45% and 48%).
In the Czech Republic, on the other hand, respondents were the least likely to answer that the
possibility to address an unmet social or ecological need had been important in their decision to take
steps to start up a business (29%). Other countries where this factor did not figure highly were Finland
(33% of “rather important” and “very important” responses), Hungary (38%) and Denmark (40%).
Furthermore, Denmark, together with Germany, were the only two countries where a slim majority
(51%-52%) of respondents selected the “rather not important” and “not at all important” responses.
Finally, in many countries surveyed, a considerable proportion of interviewees gave a “don’t
know” response – this was the case for about a fifth of interviewees in, the Czech Republic, Italy,
Portugal, Finland, Latvia, Belgium and Iceland (19%-22%) and more than a third of respondents
in Bulgaria (35%).
“Addressing an unmet social or ecological need”
45
37
39
23
30
27
24
19
23
26
25
23
14
27
18
16
21
23
18
19
18
21
11
12
13
15
4
8
48
22
17
21
22
28
48
27
27
30
34
32
45
35
38
37
43
38
34
35
36
44
30
39
41
34
32
35
32
32
26
33
31
27
23
29
21
31
46
37
32
30
34
38
48
43
9
13
11
17
20
19
18
24
21
12
22
16
20
24
14
16
23
19
18
24
24
30
38
15
31
30
25
29
12
13
18
23
18
19
11
19
17
11
10
5
11
8
14
14
10
14
8
11
4
4
14
17
8
13
7
8
13
18
15
13
8
21
17
21
22
6
4
19
18
8
17
1
4
2
4
6
13
4
7
2
6
6
5
19
8
22
18
5
12
19
9
18
21
12
8
8
5
35
10
16
21
19
4
16
10
5
22
2
2
3
10
ELIE
MTLUCYFRESPLSIIT
ATBESKUKROPT
EU27EELVLTSENLDEBGDKHU
FICZ
TRHRNOCH
IS
US
JPCNKR
Very important Rather important Rather not importantNot important at all DK/NA
Q11. For each of the following elements, please tell me if it was very important, rather important, rather not important or not important at all
for making you take steps to start a new business or take over one.Base: those who had started a business or were taking steps to start one and those who
were thinking about it or had thought about it, but had given up; by country
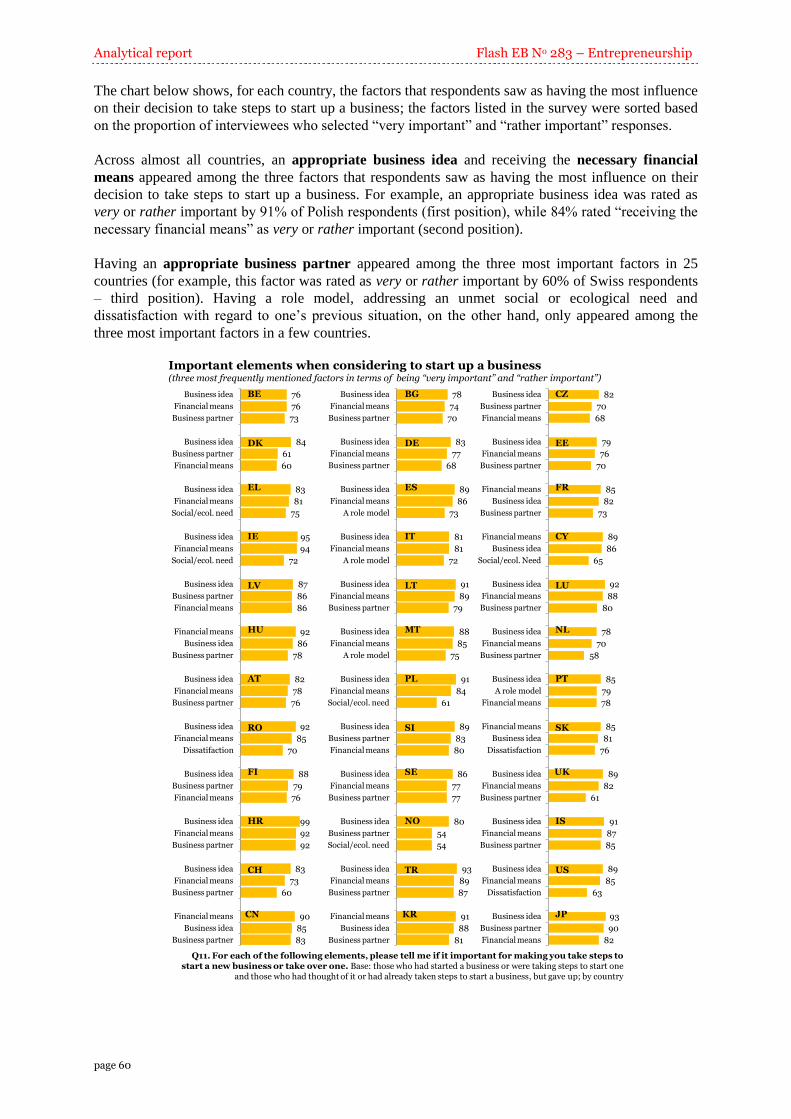
Analytical report Flash EB No 283 – Entrepreneurship
page 60
The chart below shows, for each country, the factors that respondents saw as having the most influence
on their decision to take steps to start up a business; the factors listed in the survey were sorted based
on the proportion of interviewees who selected “very important” and “rather important” responses.
Across almost all countries, an appropriate business idea and receiving the necessary financial
means appeared among the three factors that respondents saw as having the most influence on their
decision to take steps to start up a business. For example, an appropriate business idea was rated as
very or rather important by 91% of Polish respondents (first position), while 84% rated “receiving the
necessary financial means” as very or rather important (second position).
Having an appropriate business partner appeared among the three most important factors in 25
countries (for example, this factor was rated as very or rather important by 60% of Swiss respondents
– third position). Having a role model, addressing an unmet social or ecological need and
dissatisfaction with regard to one’s previous situation, on the other hand, only appeared among the
three most important factors in a few countries.
Important elements when considering to start up a business(three most frequently mentioned factors in terms of being “very important” and “rather important”)
76
76
73
84
61
60
83
81
75
95
94
72
87
86
86
92
86
78
82
78
76
92
85
70
88
79
76
99
92
92
83
73
60
90
85
83
Business idea
Financial means
Business partner
Business idea
Business partner
Financial means
Business idea
Financial means
Social/ecol. need
Business idea
Financial means
Social/ecol. need
Business idea
Business partner
Financial means
Financial means
Business idea
Business partner
Business idea
Financial means
Business partner
Business idea
Financial means
Dissatifaction
Business idea
Business partner
Financial means
Business idea
Financial means
Business partner
Business idea
Financial means
Business partner
Financial means
Business idea
Business partner
DK
BE
IE
EL
HU
LV
RO
AT
HR
FI
CN
CH
Q11. For each of the following elements, please tell me if it important for making you take steps to start a new business or take over one. Base: those who had started a business or were taking steps to start one
and those who had thought of it or had already taken steps to start a business, but gave up; by country
78
74
70
83
77
68
89
86
73
81
81
72
91
89
79
88
85
75
91
84
61
89
83
80
86
77
77
80
54
54
93
89
87
91
88
81
Business idea
Financial means
Business partner
Business idea
Financial means
Business partner
Business idea
Financial means
A role model
Business idea
Financial means
A role model
Business idea
Financial means
Business partner
Business idea
Financial means
A role model
Business idea
Financial means
Social/ecol. need
Business idea
Business partner
Financial means
Business idea
Financial means
Business partner
Business idea
Business partner
Social/ecol. need
Business idea
Financial means
Business partner
Financial means
Business idea
Business partner
BG
DE
ES
IT
LT
MT
PL
SI
SE
NO
TR
KR
82
70
68
79
76
70
85
82
73
89
86
65
92
88
80
78
70
58
85
79
78
85
81
76
89
82
61
91
87
85
89
85
63
93
90
82
Business idea
Business partner
Financial means
Business idea
Financial means
Business partner
Financial means
Business idea
Business partner
Financial means
Business idea
Social/ecol. Need
Business idea
Financial means
Business partner
Business idea
Financial means
Business partner
Business idea
A role model
Financial means
Financial means
Business idea
Dissatisfaction
Business idea
Financial means
Business partner
Business idea
Financial means
Business partner
Business idea
Financial means
Dissatisfaction
Business idea
Business partner
Financial means
CZ
EE
FR
CY
LU
NL
PT
SK
UK
IS
US
JP
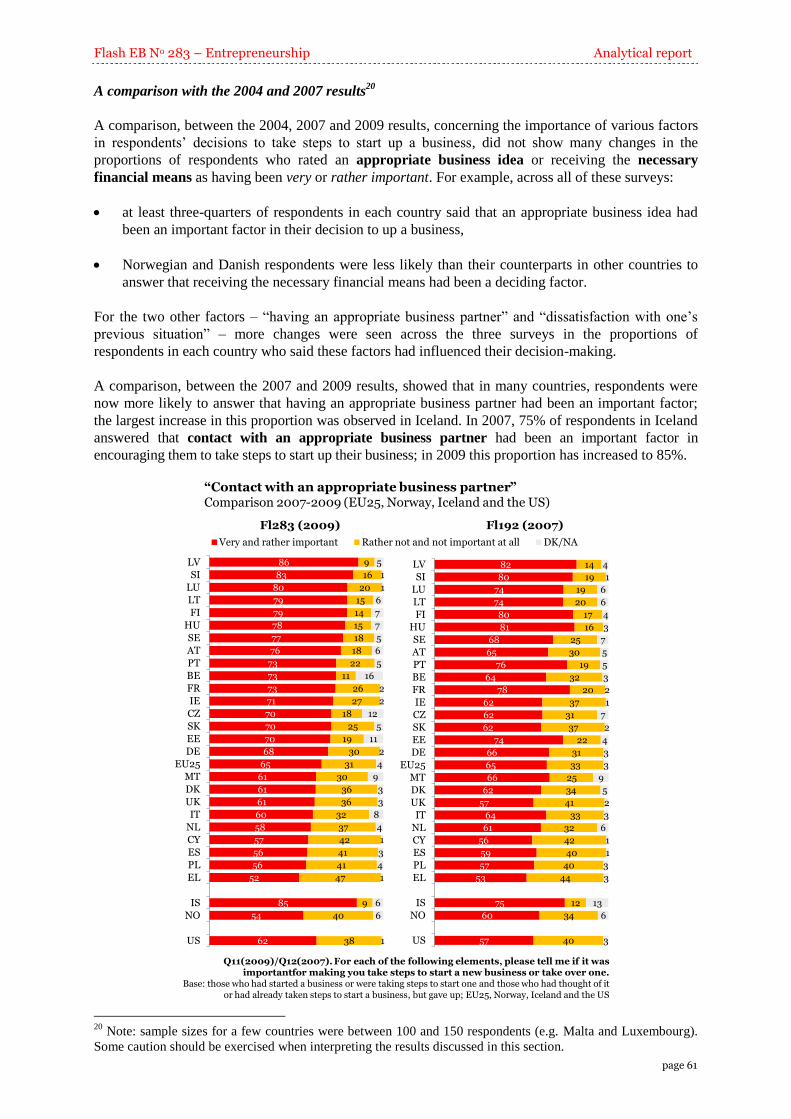
Flash EB No 283 – Entrepreneurship Analytical report
page 61
A comparison with the 2004 and 2007 results20
A comparison, between the 2004, 2007 and 2009 results, concerning the importance of various factors
in respondents’ decisions to take steps to start up a business, did not show many changes in the
proportions of respondents who rated an appropriate business idea or receiving the necessary
financial means as having been very or rather important. For example, across all of these surveys:
at least three-quarters of respondents in each country said that an appropriate business idea had
been an important factor in their decision to up a business,
Norwegian and Danish respondents were less likely than their counterparts in other countries to
answer that receiving the necessary financial means had been a deciding factor.
For the two other factors – “having an appropriate business partner” and “dissatisfaction with one’s
previous situation” – more changes were seen across the three surveys in the proportions of
respondents in each country who said these factors had influenced their decision-making.
A comparison, between the 2007 and 2009 results, showed that in many countries, respondents were
now more likely to answer that having an appropriate business partner had been an important factor;
the largest increase in this proportion was observed in Iceland. In 2007, 75% of respondents in Iceland
answered that contact with an appropriate business partner had been an important factor in
encouraging them to take steps to start up their business; in 2009 this proportion has increased to 85%.
86
83
80
79
79
78
77
76
73
73
73
71
70
70
70
68
65
61
61
61
60
58
57
56
56
52
85
54
62
9
16
20
15
14
15
18
18
22
11
26
27
18
25
19
30
31
30
36
36
32
37
42
41
41
47
9
40
38
5
1
1
6
7
7
5
6
5
16
2
2
12
5
11
2
4
9
3
3
8
4
1
3
4
1
6
6
1
LV
SI
LU
LT
FI
HU
SE
AT
PT
BE
FR
IE
CZ
SK
EE
DE
EU25
MT
DK
UK
IT
NL
CY
ES
PL
EL
IS
NO
US
Very and rather important Rather not and not important at all DK/NA
“Contact with an appropriate business partner”Comparison 2007-2009 (EU25, Norway, Iceland and the US)
Q11(2009)/Q12(2007). For each of the following elements, please tell me if it wasimportantfor making you take steps to start a new business or take over one.
Base: those who had started a business or were taking steps to start one and those who had thought of it or had already taken steps to start a business, but gave up; EU25, Norway, Iceland and the US
Fl283 (2009) Fl192 (2007)
82
80
74
74
80
81
68
65
76
64
78
62
62
62
74
66
65
66
62
57
64
61
56
59
57
53
75
60
57
14
19
19
20
17
16
25
30
19
32
20
37
31
37
22
31
33
25
34
41
33
32
42
40
40
44
12
34
40
4
1
6
6
4
3
7
5
5
3
2
1
7
2
4
3
3
9
5
2
3
6
1
1
3
3
13
6
3
LV
SI
LU
LT
FI
HU
SE
AT
PT
BE
FR
IE
CZ
SK
EE
DE
EU25
MT
DK
UK
IT
NL
CY
ES
PL
EL
IS
NO
US
20
Note: sample sizes for a few countries were between 100 and 150 respondents (e.g. Malta and Luxembourg).
Some caution should be exercised when interpreting the results discussed in this section.
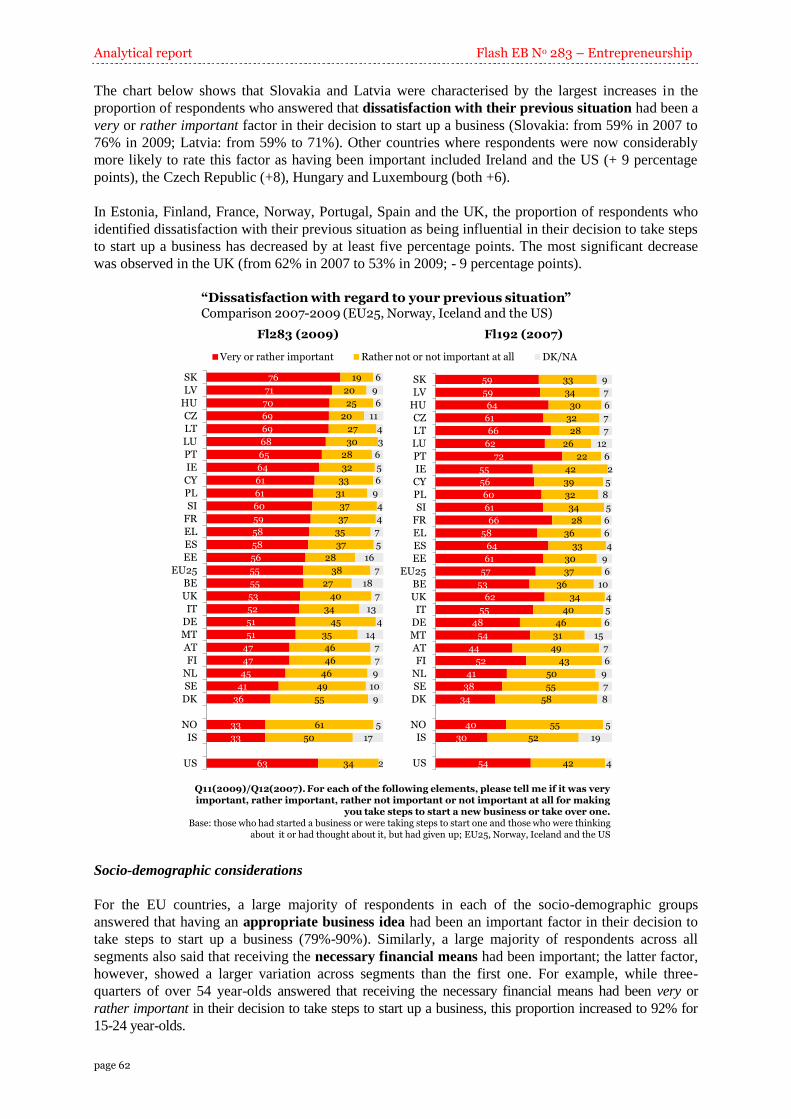
Analytical report Flash EB No 283 – Entrepreneurship
page 62
The chart below shows that Slovakia and Latvia were characterised by the largest increases in the
proportion of respondents who answered that dissatisfaction with their previous situation had been a
very or rather important factor in their decision to start up a business (Slovakia: from 59% in 2007 to
76% in 2009; Latvia: from 59% to 71%). Other countries where respondents were now considerably
more likely to rate this factor as having been important included Ireland and the US (+ 9 percentage
points), the Czech Republic (+8), Hungary and Luxembourg (both +6).
In Estonia, Finland, France, Norway, Portugal, Spain and the UK, the proportion of respondents who
identified dissatisfaction with their previous situation as being influential in their decision to take steps
to start up a business has decreased by at least five percentage points. The most significant decrease
was observed in the UK (from 62% in 2007 to 53% in 2009; - 9 percentage points).
76
71
70
69
69
68
65
64
61
61
60
59
58
58
56
55
55
53
52
51
51
47
47
45
41
36
33
33
63
19
20
25
20
27
30
28
32
33
31
37
37
35
37
28
38
27
40
34
45
35
46
46
46
49
55
61
50
34
6
9
6
11
4
3
6
5
6
9
4
4
7
5
16
7
18
7
13
4
14
7
7
9
10
9
5
17
2
SK
LV
HU
CZ
LT
LU
PT
IE
CY
PL
SI
FR
EL
ES
EE
EU25
BE
UK
IT
DE
MT
AT
FI
NL
SE
DK
NO
IS
US
Very or rather important Rather not or not important at all DK/NA
“Dissatisfaction with regard to your previous situation”Comparison 2007-2009 (EU25, Norway, Iceland and the US)
Q11(2009)/Q12(2007). For each of the following elements, please tell me if it was very important, rather important, rather not important or not important at all for making
you take steps to start a new business or take over one.Base: those who had started a business or were taking steps to start one and those who were thinking
about it or had thought about it, but had given up; EU25, Norway, Iceland and the US
Fl283 (2009) Fl192 (2007)
59
59
64
61
66
62
72
55
56
60
61
66
58
64
61
57
53
62
55
48
54
44
52
41
38
34
40
30
54
33
34
30
32
28
26
22
42
39
32
34
28
36
33
30
37
36
34
40
46
31
49
43
50
55
58
55
52
42
9
7
6
7
7
12
6
2
5
8
5
6
6
4
9
6
10
4
5
6
15
7
6
9
7
8
5
19
4
SK
LV
HU
CZ
LT
LU
PT
IE
CY
PL
SI
FR
EL
ES
EE
EU25
BE
UK
IT
DE
MT
AT
FI
NL
SE
DK
NO
IS
US
Socio-demographic considerations
For the EU countries, a large majority of respondents in each of the socio-demographic groups
answered that having an appropriate business idea had been an important factor in their decision to
take steps to start up a business (79%-90%). Similarly, a large majority of respondents across all
segments also said that receiving the necessary financial means had been important; the latter factor,
however, showed a larger variation across segments than the first one. For example, while three-
quarters of over 54 year-olds answered that receiving the necessary financial means had been very or
rather important in their decision to take steps to start up a business, this proportion increased to 92% for
15-24 year-olds.
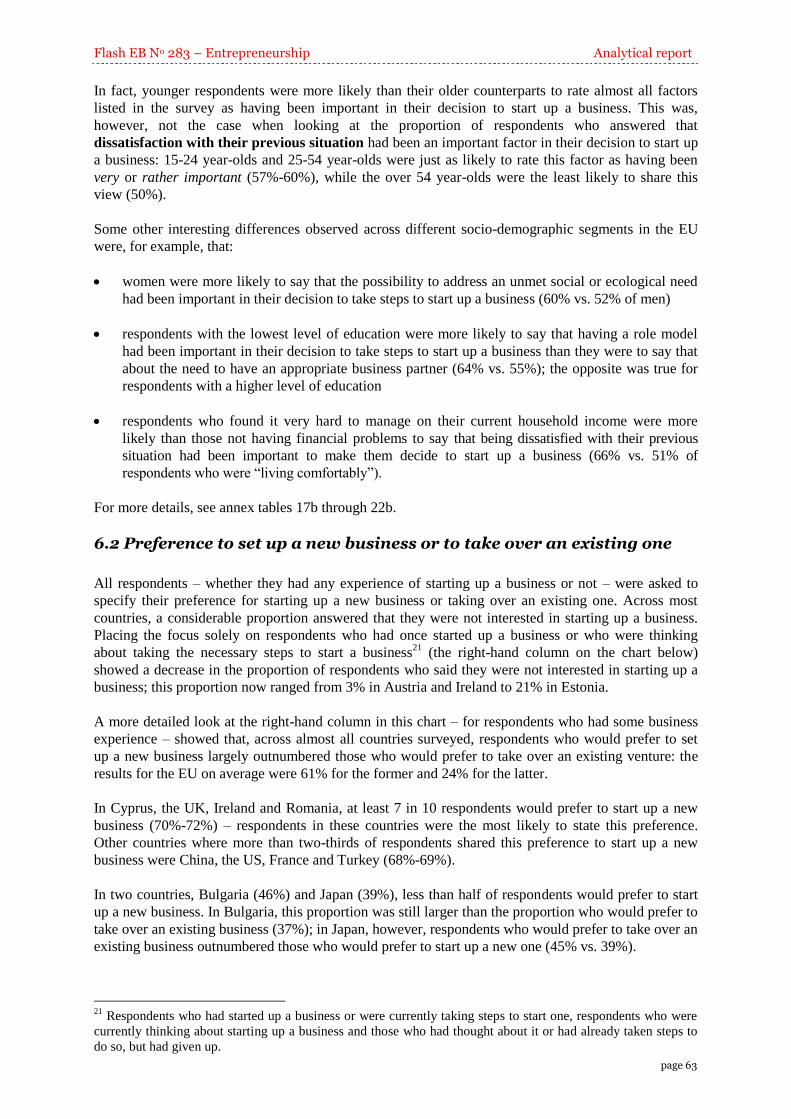
Flash EB No 283 – Entrepreneurship Analytical report
page 63
In fact, younger respondents were more likely than their older counterparts to rate almost all factors
listed in the survey as having been important in their decision to start up a business. This was,
however, not the case when looking at the proportion of respondents who answered that
dissatisfaction with their previous situation had been an important factor in their decision to start up
a business: 15-24 year-olds and 25-54 year-olds were just as likely to rate this factor as having been
very or rather important (57%-60%), while the over 54 year-olds were the least likely to share this
view (50%).
Some other interesting differences observed across different socio-demographic segments in the EU
were, for example, that:
women were more likely to say that the possibility to address an unmet social or ecological need
had been important in their decision to take steps to start up a business (60% vs. 52% of men)
respondents with the lowest level of education were more likely to say that having a role model
had been important in their decision to take steps to start up a business than they were to say that
about the need to have an appropriate business partner (64% vs. 55%); the opposite was true for
respondents with a higher level of education
respondents who found it very hard to manage on their current household income were more
likely than those not having financial problems to say that being dissatisfied with their previous
situation had been important to make them decide to start up a business (66% vs. 51% of
respondents who were “living comfortably”).
For more details, see annex tables 17b through 22b.
6.2 Preference to set up a new business or to take over an existing one
All respondents – whether they had any experience of starting up a business or not – were asked to
specify their preference for starting up a new business or taking over an existing one. Across most
countries, a considerable proportion answered that they were not interested in starting up a business.
Placing the focus solely on respondents who had once started up a business or who were thinking
about taking the necessary steps to start a business21
(the right-hand column on the chart below)
showed a decrease in the proportion of respondents who said they were not interested in starting up a
business; this proportion now ranged from 3% in Austria and Ireland to 21% in Estonia.
A more detailed look at the right-hand column in this chart – for respondents who had some business
experience – showed that, across almost all countries surveyed, respondents who would prefer to set
up a new business largely outnumbered those who would prefer to take over an existing venture: the
results for the EU on average were 61% for the former and 24% for the latter.
In Cyprus, the UK, Ireland and Romania, at least 7 in 10 respondents would prefer to start up a new
business (70%-72%) – respondents in these countries were the most likely to state this preference.
Other countries where more than two-thirds of respondents shared this preference to start up a new
business were China, the US, France and Turkey (68%-69%).
In two countries, Bulgaria (46%) and Japan (39%), less than half of respondents would prefer to start
up a new business. In Bulgaria, this proportion was still larger than the proportion who would prefer to
take over an existing business (37%); in Japan, however, respondents who would prefer to take over an
existing business outnumbered those who would prefer to start up a new one (45% vs. 39%).
21
Respondents who had started up a business or were currently taking steps to start one, respondents who were
currently thinking about starting up a business and those who had thought about it or had already taken steps to
do so, but had given up.

Analytical report Flash EB No 283 – Entrepreneurship
page 64
62
62
59
58
58
58
57
55
54
53
52
51
50
49
46
45
45
45
45
44
43
42
42
41
40
40
38
37
68
52
49
48
46
61
67
43
29
19
28
28
26
26
29
16
21
17
32
15
27
25
29
19
25
19
14
29
24
39
17
38
20
21
26
25
28
26
20
31
31
20
30
27
34
45
15
7
10
12
12
9
20
21
21
12
27
20
19
19
27
22
29
36
22
26
15
30
14
36
31
29
30
27
5
21
14
15
17
6
5
16
25
4
3
3
4
4
5
7
3
9
3
7
2
6
4
9
8
6
5
4
7
3
11
6
4
8
6
8
8
1
8
6
6
17
3
2
7
1
CYIEELFRUK
SIROESPLFI
PTLU
EU27NLCZSESK
HUMTBEDEIT
ATDKEELVLTBG
TRHRCHNO
IS
US
CNKRJP
Set up a new one Take over an existing business None of these, not interested DK/NA
70
71
63
68
70
64
72
66
67
59
61
64
61
60
56
53
62
59
63
54
52
52
52
58
54
56
56
46
69
64
55
59
52
68
68
50
39
16
22
27
23
21
29
19
19
18
30
17
24
24
26
22
25
18
30
16
23
37
20
36
17
19
32
33
37
26
23
30
27
20
26
27
33
45
10
3
7
5
7
4
5
13
8
7
15
8
10
10
16
12
11
7
15
16
8
19
3
20
21
6
6
14
5
9
9
8
12
3
3
12
14
5
4
3
4
3
3
4
2
6
4
8
4
5
4
6
10
9
4
5
6
3
8
8
5
6
5
5
3
0
4
6
6
16
2
2
6
1
CYIEELFRUK
SIROESPLFIPTLU
EU27NLCZSESK
MTHUBEDEIT
ATDKEELVLTBG
TRHRCHNO
IS
US
CNKRJP
Setting up a new business or taking over an existing one
Q13. If you currently had the means to start your own business, including sufficient funding, would you rather set up a new one or take over an existing one?
Base: all respondents (right); those who had started a business or were taking steps to start one and those who were thinking about it or had thought about it, but had given up (left); by country
All respondentsRespondents with some
business experience
Starting up a new business or taking over an existing one – a comparison between 2007 and 200922
The next chart compares respondents’ preferences, in 2007 and 2009, for starting up a new business or
taking over an existing one; the focus remains on respondents who had once started up a business or
who were thinking about taking the necessary steps to start such a venture.
A preference for starting up a new company has slightly increased in France, Latvia, Luxembourg and
Iceland. For example, in 2007, 51% of respondents in Latvia said they would prefer to start up a new
business; in 2009, however, this proportion has increased to 56% (+5 percentage points).
The opposite trend was seen in Belgium, Estonia and Slovakia. For example, in 2007, 73% of
respondents in Slovakia said they would prefer to start up a new business, while 15% preferred to take
over an existing company; in 2009, the corresponding proportions were 62% and 19%. It should,
however, also be noted that the proportion of “not interested” Slovak respondents has also increased
from 4% in 2007 to 11% in 2009.
22
Note: sample sizes for a few countries were between 100 and 150 (e.g. Malta and Luxembourg). Some caution
should be exercised when interpreting the results discussed in this section.
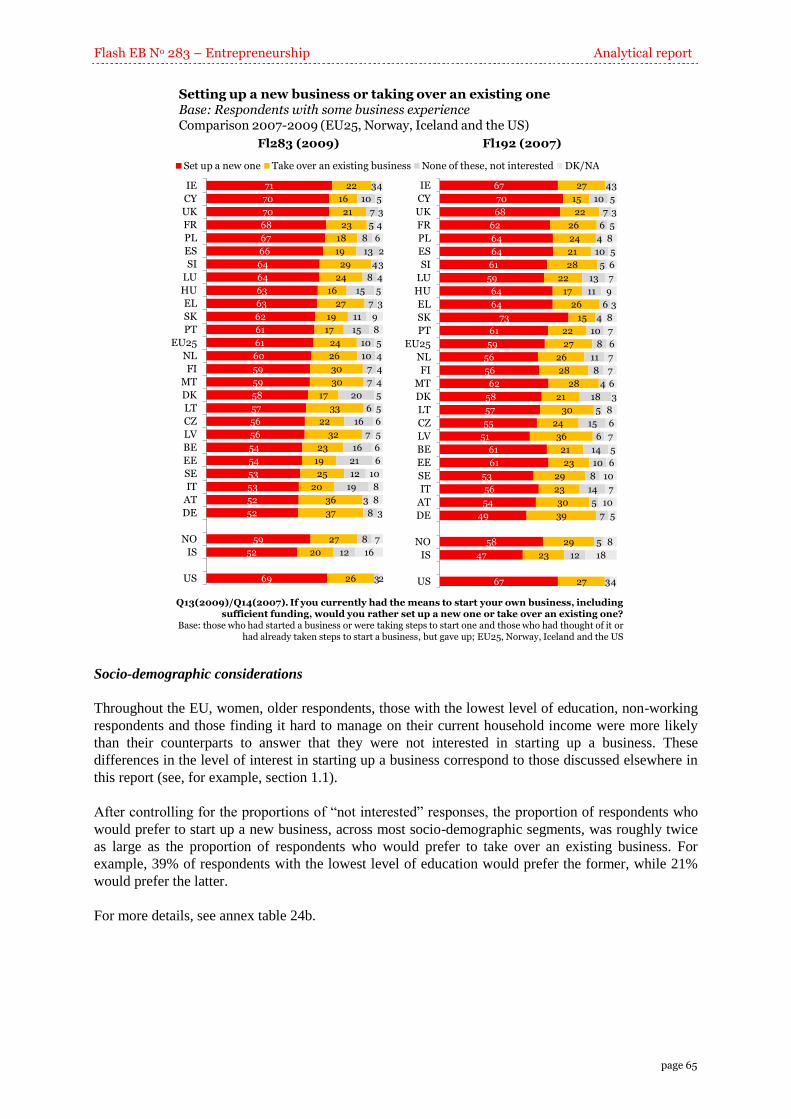
Flash EB No 283 – Entrepreneurship Analytical report
page 65
71
70
70
68
67
66
64
64
63
63
62
61
61
60
59
59
58
57
56
56
54
54
53
53
52
52
59
52
69
22
16
21
23
18
19
29
24
16
27
19
17
24
26
30
30
17
33
22
32
23
19
25
20
36
37
27
20
26
3
10
7
5
8
13
4
8
15
7
11
15
10
10
7
7
20
6
16
7
16
21
12
19
3
8
8
12
3
4
5
3
4
6
2
3
4
5
3
9
8
5
4
4
4
5
5
6
5
6
6
10
8
8
3
7
16
2
IE
CY
UK
FR
PL
ES
SI
LU
HU
EL
SK
PT
EU25
NL
FI
MT
DK
LT
CZ
LV
BE
EE
SE
IT
AT
DE
NO
IS
US
Set up a new one Take over an existing business None of these, not interested DK/NA
67
70
68
62
64
64
61
59
64
64
73
61
59
56
56
62
58
57
55
51
61
61
53
56
54
49
58
47
67
27
15
22
26
24
21
28
22
17
26
15
22
27
26
28
28
21
30
24
36
21
23
29
23
30
39
29
23
27
4
10
7
6
4
10
5
13
11
6
4
10
8
11
8
4
18
5
15
6
14
10
8
14
5
7
5
12
3
3
5
3
5
8
5
6
7
9
3
8
7
6
7
7
6
3
8
6
7
5
6
10
7
10
5
8
18
4
IE
CY
UK
FR
PL
ES
SI
LU
HU
EL
SK
PT
EU25
NL
FI
MT
DK
LT
CZ
LV
BE
EE
SE
IT
AT
DE
NO
IS
US
Setting up a new business or taking over an existing oneBase: Respondents with some business experienceComparison 2007-2009 (EU25, Norway, Iceland and the US)
Q13(2009)/Q14(2007). If you currently had the means to start your own business, including sufficient funding, would you rather set up a new one or take over an existing one?
Base: those who had started a business or were taking steps to start one and those who had thought of it or had already taken steps to start a business, but gave up; EU25, Norway, Iceland and the US
Fl283 (2009) Fl192 (2007)
Socio-demographic considerations
Throughout the EU, women, older respondents, those with the lowest level of education, non-working
respondents and those finding it hard to manage on their current household income were more likely
than their counterparts to answer that they were not interested in starting up a business. These
differences in the level of interest in starting up a business correspond to those discussed elsewhere in
this report (see, for example, section 1.1).
After controlling for the proportions of “not interested” responses, the proportion of respondents who
would prefer to start up a new business, across most socio-demographic segments, was roughly twice
as large as the proportion of respondents who would prefer to take over an existing business. For
example, 39% of respondents with the lowest level of education would prefer the former, while 21%
would prefer the latter.
For more details, see annex table 24b.
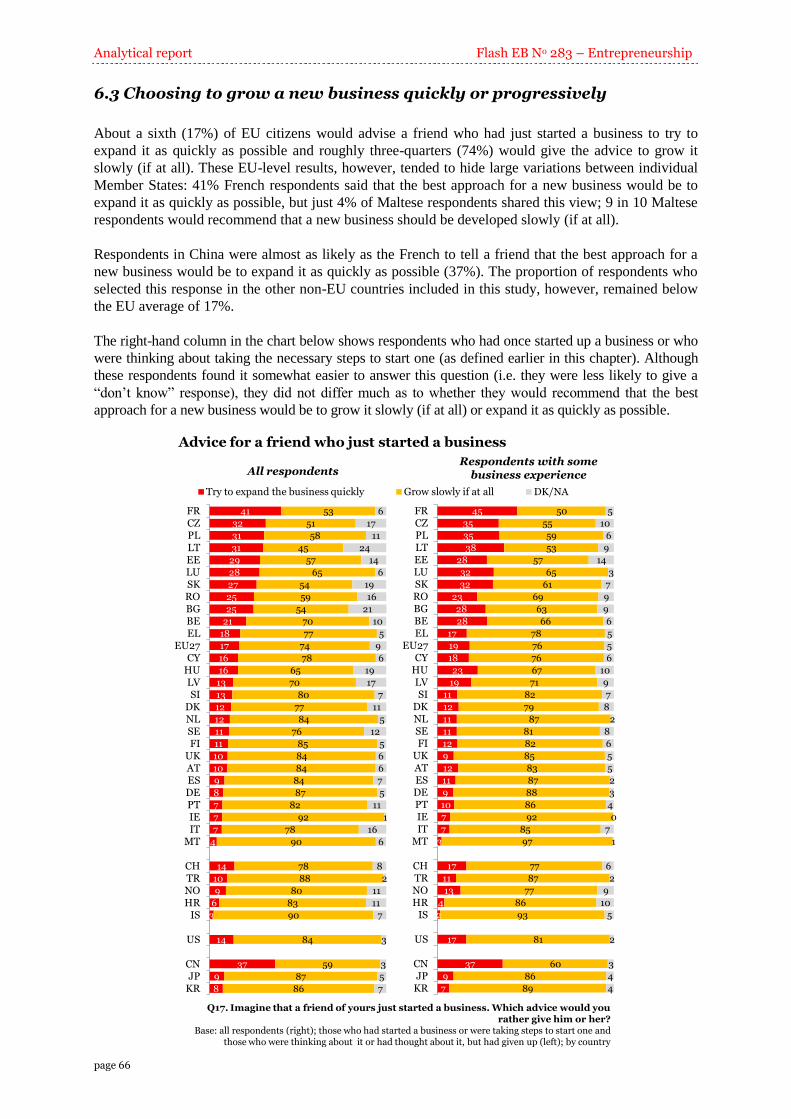
Analytical report Flash EB No 283 – Entrepreneurship
page 66
6.3 Choosing to grow a new business quickly or progressively
About a sixth (17%) of EU citizens would advise a friend who had just started a business to try to
expand it as quickly as possible and roughly three-quarters (74%) would give the advice to grow it
slowly (if at all). These EU-level results, however, tended to hide large variations between individual
Member States: 41% French respondents said that the best approach for a new business would be to
expand it as quickly as possible, but just 4% of Maltese respondents shared this view; 9 in 10 Maltese
respondents would recommend that a new business should be developed slowly (if at all).
Respondents in China were almost as likely as the French to tell a friend that the best approach for a
new business would be to expand it as quickly as possible (37%). The proportion of respondents who
selected this response in the other non-EU countries included in this study, however, remained below
the EU average of 17%.
The right-hand column in the chart below shows respondents who had once started up a business or who
were thinking about taking the necessary steps to start one (as defined earlier in this chapter). Although
these respondents found it somewhat easier to answer this question (i.e. they were less likely to give a
“don’t know” response), they did not differ much as to whether they would recommend that the best
approach for a new business would be to grow it slowly (if at all) or expand it as quickly as possible.
41
32
31
31
29
28
27
25
25
21
18
17
16
16
13
13
12
12
11
11
10
10
9
8
7
7
7
4
14
10
9
6
3
14
37
9
8
53
51
58
45
57
65
54
59
54
70
77
74
78
65
70
80
77
84
76
85
84
84
84
87
82
92
78
90
78
88
80
83
90
84
59
87
86
6
17
11
24
14
6
19
16
21
10
5
9
6
19
17
7
11
5
12
5
6
6
7
5
11
1
16
6
8
2
11
11
7
3
3
5
7
FRCZPLLTEELUSKROBGBEEL
EU27CY
HULVSI
DKNLSEFI
UKATESDEPTIEIT
MT
CHTRNOHR
IS
US
CNJP
KR
Try to expand the business quickly Grow slowly if at all DK/NA
45
35
35
38
28
32
32
23
28
28
17
19
18
23
19
11
12
11
11
12
9
12
11
9
10
7
7
3
17
11
13
4
2
17
37
9
7
50
55
59
53
57
65
61
69
63
66
78
76
76
67
71
82
79
87
81
82
85
83
87
88
86
92
85
97
77
87
77
86
93
81
60
86
89
5
10
6
9
14
3
7
9
9
6
5
5
6
10
9
7
8
2
8
6
5
5
2
3
4
0
7
1
6
2
9
10
5
2
3
4
4
FRCZPLLTEELUSKROBGBEEL
EU27CY
HULVSI
DKNLSEFI
UKATESDEPTIEIT
MT
CHTRNOHR
IS
US
CNJP
KR
Advice for a friend who just started a business
Q17. Imagine that a friend of yours just started a business. Which advice would you rather give him or her?
Base: all respondents (right); those who had started a business or were taking steps to start one and those who were thinking about it or had thought about it, but had given up (left); by country
All respondentsRespondents with some
business experience
Flash EB No 283 – Entrepreneurship Analytical report
page 67
Socio-demographic differences
Throughout the EU, younger respondents, full-time students and those with a high level of education
were more likely than their counterparts to feel that the best approach for a new business would be to
expand it as quickly as possible. For example, 15-24 year-olds were twice as likely as the over 54
year-olds to select this response (27% vs. 14%).
Among the self-employed, 15% would advise a friend who had just started a business to try to expand
it as quickly as possible and 77% would advise them to grow it slowly (if at all). Employees and
manual workers, on the other hand, appeared to be somewhat more attracted by the idea of trying to
expand a new business as quickly as possible (18%-19%).
For more details, see annex table 34b.
6.4 Opportunity-driven vs. necessity-driven entrepreneurship
The question as to whether respondents had started their business out of necessity or because they saw
an opportunity was only presented to respondents who had started up a business or were currently
taking steps to start one23
; as a result, the sample size per country was relatively small in many
countries and caution should be exercised when interpreting the results at an individual country level.
In the EU, among respondents who had started up a business or were currently taking steps to start
one, 55% answered that they had started/were starting this business because they saw an opportunity
and 28% did so out of necessity. Eleven percent answered that both factors had played a part: i.e. they
came across an opportunity, but it had also been a necessity to start up a business.
Respondents in Denmark and the Netherlands were the most likely to answer that they had
started/were starting a business because they saw an opportunity (81% and 78%, respectively). Other
EU countries with high proportions of opportunity-driven entrepreneurship were Belgium (72%),
Finland (71%) and Sweden (69%). In Estonia, Bulgaria and Greece, on the other hand, less than 4 in
10 respondents had come across an opportunity to set up a business (36%-39%). Half of Greek
respondents answered that they had started/were starting a business out of necessity. The
corresponding proportions for Bulgaria and Estonia were lower (38%-41%); more than a tenth of
Bulgarians and Estonians considered that their decision to start a business had been both a necessity
and an opportunity (12% and 18%, respectively).
The US and Switzerland scored higher than the EU average in terms of the proportion of opportunity-
driven entrepreneurship (62% and 65%, respectively). In Croatia, Turkey, Norway and Iceland,
between 51% and 58% of respondents had come across an opportunity to set up a business.
The highest proportion of necessity-driven entrepreneurship was measured in South Korea (64% –
compared to 18% “opportunity-driven”). In China and Japan, 50% of respondents answered that they
had starting/were starting a business out of necessity.
23
Respondents who were currently starting up a business and those who were currently running a business or
who had had previously run a business. This group does not include respondents who were only thinking about
starting up a business and those who had thought about it, but had given up.
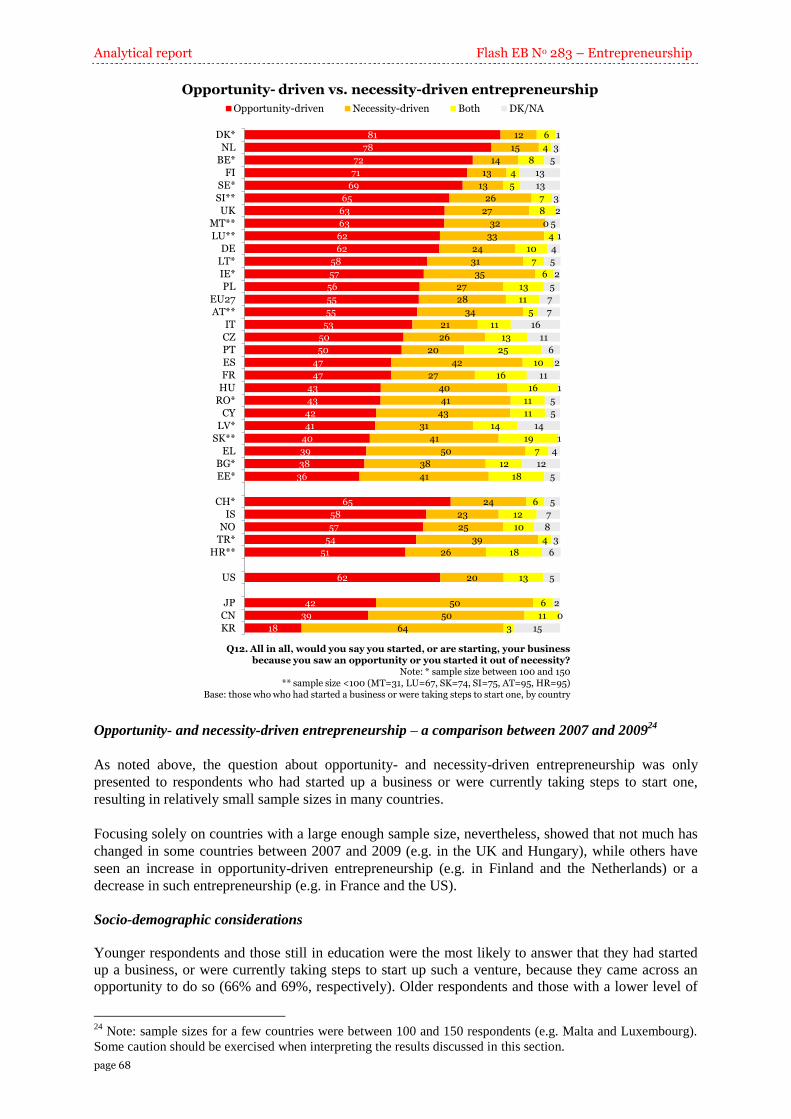
Analytical report Flash EB No 283 – Entrepreneurship
page 68
81
78
72
71
69
65
63
63
62
62
58
57
56
55
55
53
50
50
47
47
43
43
42
41
40
39
38
36
65
58
57
54
51
62
42
39
18
12
15
14
13
13
26
27
32
33
24
31
35
27
28
34
21
26
20
42
27
40
41
43
31
41
50
38
41
24
23
25
39
26
20
50
50
64
6
4
8
4
5
7
8
0
4
10
7
6
13
11
5
11
13
25
10
16
16
11
11
14
19
7
12
18
6
12
10
4
18
13
6
11
3
1
3
5
13
13
3
2
5
1
4
5
2
5
7
7
16
11
6
2
11
1
5
5
14
1
4
12
5
5
7
8
3
6
5
2
0
15
DK*
NL
BE*
FI
SE*
SI**
UK
MT**
LU**
DE
LT*
IE*
PL
EU27
AT**
IT
CZ
PT
ES
FR
HU
RO*
CY
LV*
SK**
EL
BG*
EE*
CH*
IS
NO
TR*
HR**
US
JP
CN
KR
Opportunity-driven Necessity-driven Both DK/NA
Opportunity- driven vs. necessity-driven entrepreneurship
Q12. All in all, would you say you started, or are starting, your business because you saw an opportunity or you started it out of necessity?
Note: * sample size between 100 and 150** sample size <100 (MT=31, LU=67, SK=74, SI=75, AT=95, HR=95)
Base: those who who had started a business or were taking steps to start one, by country
Opportunity- and necessity-driven entrepreneurship – a comparison between 2007 and 200924
As noted above, the question about opportunity- and necessity-driven entrepreneurship was only
presented to respondents who had started up a business or were currently taking steps to start one,
resulting in relatively small sample sizes in many countries.
Focusing solely on countries with a large enough sample size, nevertheless, showed that not much has
changed in some countries between 2007 and 2009 (e.g. in the UK and Hungary), while others have
seen an increase in opportunity-driven entrepreneurship (e.g. in Finland and the Netherlands) or a
decrease in such entrepreneurship (e.g. in France and the US).
Socio-demographic considerations
Younger respondents and those still in education were the most likely to answer that they had started
up a business, or were currently taking steps to start up such a venture, because they came across an
opportunity to do so (66% and 69%, respectively). Older respondents and those with a lower level of
24
Note: sample sizes for a few countries were between 100 and 150 respondents (e.g. Malta and Luxembourg).
Some caution should be exercised when interpreting the results discussed in this section.
Flash EB No 283 – Entrepreneurship Analytical report
page 69
education, however, were considerably less likely to say the same (49% and 45%, respectively); more
than a third of the latter group of respondents said they had started a business out of necessity (35%
and 38%, respectively).
While 62% of employees said they had started/were starting a business because they saw an
opportunity, this proportion was lower among other occupational groups (52%-55%). It is, however,
also worth noting that 16% of the self-employed would consider that their business start-up had been
both a necessity and an opportunity (compared to 7%-8% across other occupational groups).
Finally, respondents’ household income also had an impact on their likelihood of having started up a
business because they came across an opportunity or out of necessity. More than 6 in 10 who said they
could live comfortably on their current household income answered that they had come across an
opportunity, compared to 44% of those who found it very hard to manage on their current income. The
corresponding proportions relating to necessity-driven entrepreneurship were 21% and 36%,
respectively.
For more details, see annex table 23b.
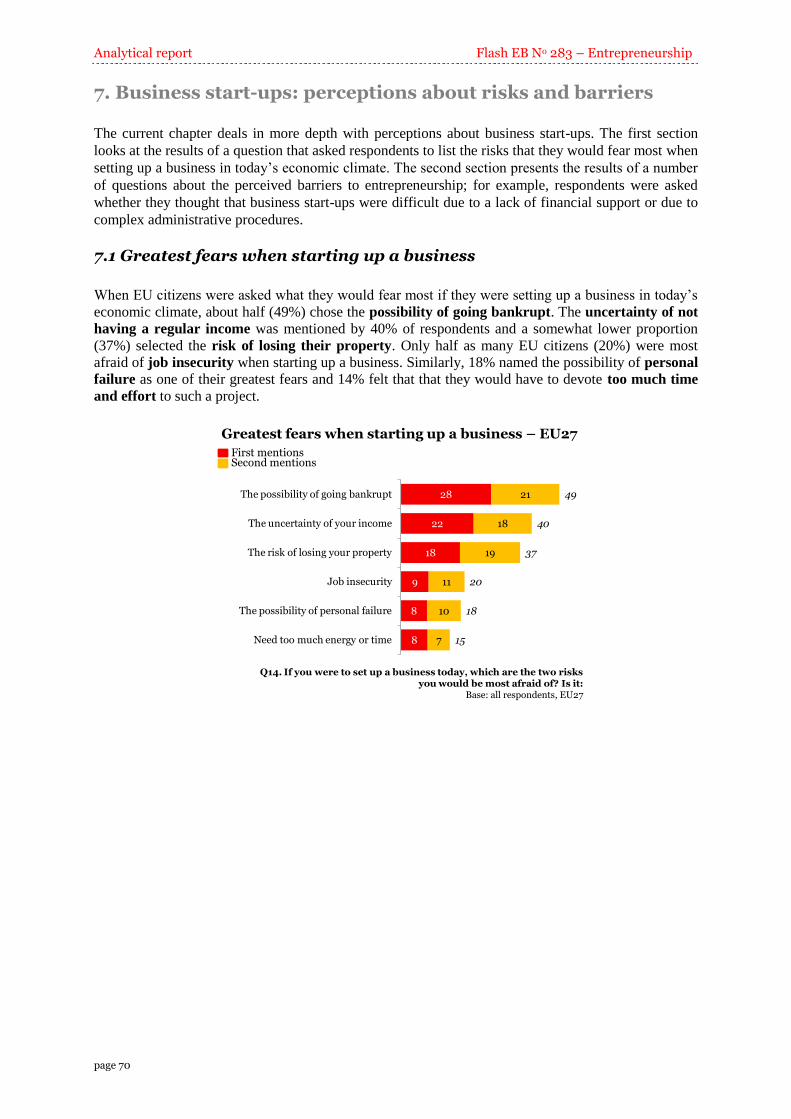
Analytical report Flash EB No 283 – Entrepreneurship
page 70
7. Business start-ups: perceptions about risks and barriers
The current chapter deals in more depth with perceptions about business start-ups. The first section
looks at the results of a question that asked respondents to list the risks that they would fear most when
setting up a business in today’s economic climate. The second section presents the results of a number
of questions about the perceived barriers to entrepreneurship; for example, respondents were asked
whether they thought that business start-ups were difficult due to a lack of financial support or due to
complex administrative procedures.
7.1 Greatest fears when starting up a business
When EU citizens were asked what they would fear most if they were setting up a business in today’s
economic climate, about half (49%) chose the possibility of going bankrupt. The uncertainty of not
having a regular income was mentioned by 40% of respondents and a somewhat lower proportion
(37%) selected the risk of losing their property. Only half as many EU citizens (20%) were most
afraid of job insecurity when starting up a business. Similarly, 18% named the possibility of personal
failure as one of their greatest fears and 14% felt that that they would have to devote too much time
and effort to such a project.
Greatest fears when starting up a business – EU27
Q14. If you were to set up a business today, which are the two risks you would be most afraid of? Is it:
Base: all respondents, EU27
28
22
18
9
8
8
21
18
19
11
10
7
49
40
37
20
18
15
The possibility of going bankrupt
The uncertainty of your income
The risk of losing your property
Job insecurity
The possibility of personal failure
Need too much energy or time
Second mentionsFirst mentions
Flash EB No 283 – Entrepreneurship Analytical report
page 71
Country variations
Respondents in Croatia, Turkey and Lithuania were the most likely to answer that they would fear the
possibility of going bankrupt if they were setting up a business (57%-59%). In six additional
countries, more than half of respondents selected this response: Denmark (51%), Luxembourg (52%),
Portugal (53%), France (54%), Romania (55%) and China (56%). Respondents in South Korea, on the
other hand, were the least likely to be afraid of the possibility of going bankrupt (19%).
Six in 10 Hungarians and about half of Greek, Swedish and Polish respondents (51%-52%) were most
afraid of the uncertainty of not having a regular income when starting up a business. In Lithuania,
Switzerland and China, however, only half as many respondents selected this response (25%-26%).
While Polish respondents were among the most likely to fear the uncertainty of not having a regular
income, they were the least liable to be afraid of job insecurity when starting up a business (10%).
Low proportions selecting this response were also recorded in Austria, Bulgaria and South Korea
(12%-13%); respondents in Slovakia and Turkey most frequently mentioned this fear of job insecurity
(35%-37%).
The proportion selecting the risk of losing their property when starting up a business ranged from
less than a fifth in Malta (11%), Norway (14%), Italy (18%) and Cyprus (19%) to about half of
respondents in Germany, Ireland and Spain (50%-51%).
Almost 4 in 10 (38%) Maltese respondents named the possibility of personal failure as one of their
greatest fears if they were to start up a business. The fear of personal failure was also mentioned by
more than 3 in 10 respondents in South Korea and China (31%-33%), compared to only half as many
Japanese (17%). Interviewees in Sweden and Iceland were the least likely to fear the possibility of
personal failure (8%-9%).
Less than a tenth of interviewees in Portugal (5%), Croatia and Turkey (both 7%), and Lithuania (8%),
felt that that they would have to devote too much time and effort if they were to set up a business. In
sharp contrast, in Finland and Sweden, slightly more than 3 in 10 (31%-32%) of respondents selected
this response.
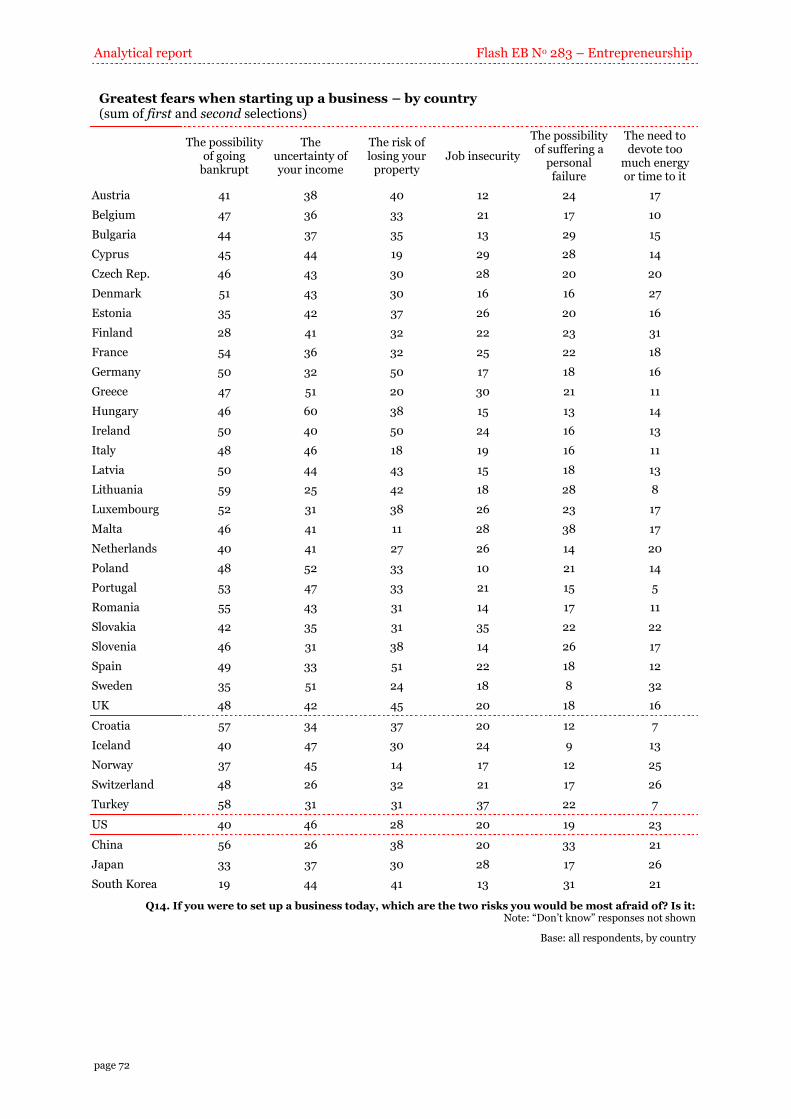
Analytical report Flash EB No 283 – Entrepreneurship
page 72
Greatest fears when starting up a business – by country (sum of first and second selections)
The possibility
of going bankrupt
The uncertainty of your income
The risk of losing your
property Job insecurity
The possibility of suffering a
personal failure
The need to devote too
much energy or time to it
Austria 41 38 40 12 24 17
Belgium 47 36 33 21 17 10
Bulgaria 44 37 35 13 29 15
Cyprus 45 44 19 29 28 14
Czech Rep. 46 43 30 28 20 20
Denmark 51 43 30 16 16 27
Estonia 35 42 37 26 20 16
Finland 28 41 32 22 23 31
France 54 36 32 25 22 18
Germany 50 32 50 17 18 16
Greece 47 51 20 30 21 11
Hungary 46 60 38 15 13 14
Ireland 50 40 50 24 16 13
Italy 48 46 18 19 16 11
Latvia 50 44 43 15 18 13
Lithuania 59 25 42 18 28 8
Luxembourg 52 31 38 26 23 17
Malta 46 41 11 28 38 17
Netherlands 40 41 27 26 14 20
Poland 48 52 33 10 21 14
Portugal 53 47 33 21 15 5
Romania 55 43 31 14 17 11
Slovakia 42 35 31 35 22 22
Slovenia 46 31 38 14 26 17
Spain 49 33 51 22 18 12
Sweden 35 51 24 18 8 32
UK 48 42 45 20 18 16
Croatia 57 34 37 20 12 7
Iceland 40 47 30 24 9 13
Norway 37 45 14 17 12 25
Switzerland 48 26 32 21 17 26
Turkey 58 31 31 37 22 7
US 40 46 28 20 19 23
China 56 26 38 20 33 21
Japan 33 37 30 28 17 26
South Korea 19 44 41 13 31 21
Q14. If you were to set up a business today, which are the two risks you would be most afraid of? Is it: Note: “Don’t know” responses not shown
Base: all respondents, by country
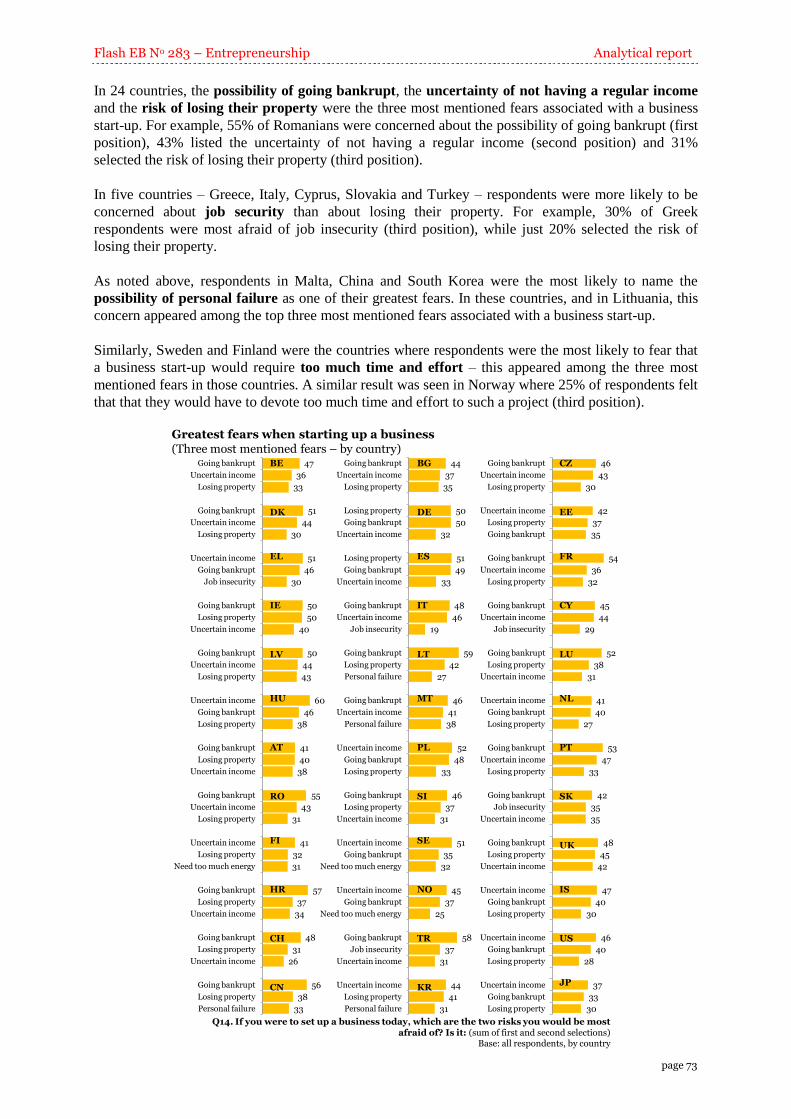
Flash EB No 283 – Entrepreneurship Analytical report
page 73
In 24 countries, the possibility of going bankrupt, the uncertainty of not having a regular income
and the risk of losing their property were the three most mentioned fears associated with a business
start-up. For example, 55% of Romanians were concerned about the possibility of going bankrupt (first
position), 43% listed the uncertainty of not having a regular income (second position) and 31%
selected the risk of losing their property (third position).
In five countries – Greece, Italy, Cyprus, Slovakia and Turkey – respondents were more likely to be
concerned about job security than about losing their property. For example, 30% of Greek
respondents were most afraid of job insecurity (third position), while just 20% selected the risk of
losing their property.
As noted above, respondents in Malta, China and South Korea were the most likely to name the
possibility of personal failure as one of their greatest fears. In these countries, and in Lithuania, this
concern appeared among the top three most mentioned fears associated with a business start-up.
Similarly, Sweden and Finland were the countries where respondents were the most likely to fear that
a business start-up would require too much time and effort – this appeared among the three most
mentioned fears in those countries. A similar result was seen in Norway where 25% of respondents felt
that that they would have to devote too much time and effort to such a project (third position).
Greatest fears when starting up a business (Three most mentioned fears – by country)
47
36
33
51
44
30
51
46
30
50
50
40
50
44
43
60
46
38
41
40
38
55
43
31
41
32
31
57
37
34
48
31
26
56
38
33
Going bankrupt
Uncertain income
Losing property
Going bankrupt
Uncertain income
Losing property
Uncertain income
Going bankrupt
Job insecurity
Going bankrupt
Losing property
Uncertain income
Going bankrupt
Uncertain income
Losing property
Uncertain income
Going bankrupt
Losing property
Going bankrupt
Losing property
Uncertain income
Going bankrupt
Uncertain income
Losing property
Uncertain income
Losing property
Need too much energy
Going bankrupt
Losing property
Uncertain income
Going bankrupt
Losing property
Uncertain income
Going bankrupt
Losing property
Personal failure
DK
BE
IE
EL
HU
LV
RO
AT
HR
FI
CN
CH
Q14. If you were to set up a business today, which are the two risks you would be most afraid of? Is it: (sum of first and second selections)
Base: all respondents, by country
44
37
35
50
50
32
51
49
33
48
46
19
59
42
27
46
41
38
52
48
33
46
37
31
51
35
32
45
37
25
58
37
31
44
41
31
Going bankrupt
Uncertain income
Losing property
Losing property
Going bankrupt
Uncertain income
Losing property
Going bankrupt
Uncertain income
Going bankrupt
Uncertain income
Job insecurity
Going bankrupt
Losing property
Personal failure
Going bankrupt
Uncertain income
Personal failure
Uncertain income
Going bankrupt
Losing property
Going bankrupt
Losing property
Uncertain income
Uncertain income
Going bankrupt
Need too much energy
Uncertain income
Going bankrupt
Need too much energy
Going bankrupt
Job insecurity
Uncertain income
Uncertain income
Losing property
Personal failure
BG
DE
ES
IT
LT
MT
PL
SI
SE
NO
TR
KR
46
43
30
42
37
35
54
36
32
45
44
29
52
38
31
41
40
27
53
47
33
42
35
35
48
45
42
47
40
30
46
40
28
37
33
30
Going bankrupt
Uncertain income
Losing property
Uncertain income
Losing property
Going bankrupt
Going bankrupt
Uncertain income
Losing property
Going bankrupt
Uncertain income
Job insecurity
Going bankrupt
Losing property
Uncertain income
Uncertain income
Going bankrupt
Losing property
Going bankrupt
Uncertain income
Losing property
Going bankrupt
Job insecurity
Uncertain income
Going bankrupt
Losing property
Uncertain income
Uncertain income
Going bankrupt
Losing property
Uncertain income
Going bankrupt
Losing property
Uncertain income
Going bankrupt
Losing property
CZ
EE
FR
CY
LU
NL
PT
SK
UK
IS
US
JP
Analytical report Flash EB No 283 – Entrepreneurship
page 74
Greatest fears when starting up a business – a comparison with the 2007 results
A comparison, between the 2007 and 2009 results, concerning respondents’ greatest fears when setting
up a business in the existing economic climate, did not show many changes in each country’s three
most mentioned fears (see chart above). For example, in the current survey, 48% of British
respondents mentioned the possibility of going bankrupt (first position), 45% listed the risk of losing
their property (second position) and 42% selected the uncertainty of not having a regular income (third
position). In 2007, the corresponding proportions were 50%, 43% and 41%, respectively.
Although the uncertainty of one’s income appeared in the top three of the most mentioned fears
associated with a business start-up in almost all countries – both in 2007 and 2009, a more detailed
look at the results showed that the actual proportion of respondents who selected this fear has
increased in a majority of the countries surveyed. Latvia, Hungary, Malta and Estonia have seen the
largest increases in this proportion (for example, Latvia: from 28% in 2007 to 44% in 2009; +16
percentage points).
Socio-demographic considerations25
The youngest respondents (under 25) were more likely than their older counterparts to mention the
possibility of going bankrupt (64% vs. 44% of over 54 year-olds) or the possibility of personal failure
(23% vs. 16%-17% of over 39 year-olds) as one of their greatest fears; they were, however; less likely
to select the risk of losing their property (31% vs. 36%-41%). The over 54 year-olds, however, were
the least likely to mention the uncertainty of not having a regular income (35% vs. 43%-45% of 25-54
year-olds).
Respondents with the highest level of education were less likely to name the possibility of going
bankrupt as their greatest fear (42% vs. 49%-50% of respondents with a lower level of education and
61% of full-time students); however, they more frequently thought that they would have to devote too
much time and effort to such a project (21% vs. 9% of respondents with the lowest level of education).
A similar pattern of differences was seen when looking at respondents’ perceptions about their
household income: respondents without financial difficulties worried more about the time and effort
they would need to devote to a business start-up, while those with financial difficulties were more
afraid of the possibility of going bankrupt.
Non-working respondents and manual workers were more likely than self-employed respondents and
employees to name the possibility of going bankrupt as their greatest fear when starting up a business
(50%-53%, compared to 45%-47%). The latter, on the other hand, were more likely to fear that they
would have to devote too much time and effort to such a project (18%-19% vs. 13%). Self-employed
respondents and employees, however, differed in their fear of job insecurity; while 21% of employees
said they were most afraid of job insecurity, this view was shared by 16% of self-employed
respondents.
Finally, an analysis by the respondent’s place or residence showed the largest differences in terms of
the risk of losing one’s property: this fear was mentioned by 39% of respondents living in rural zones,
compared to 33% of respondents in metropolitan areas.
For more details, see annex table 25b and 26b.
25
Note: sum of first and second selections.
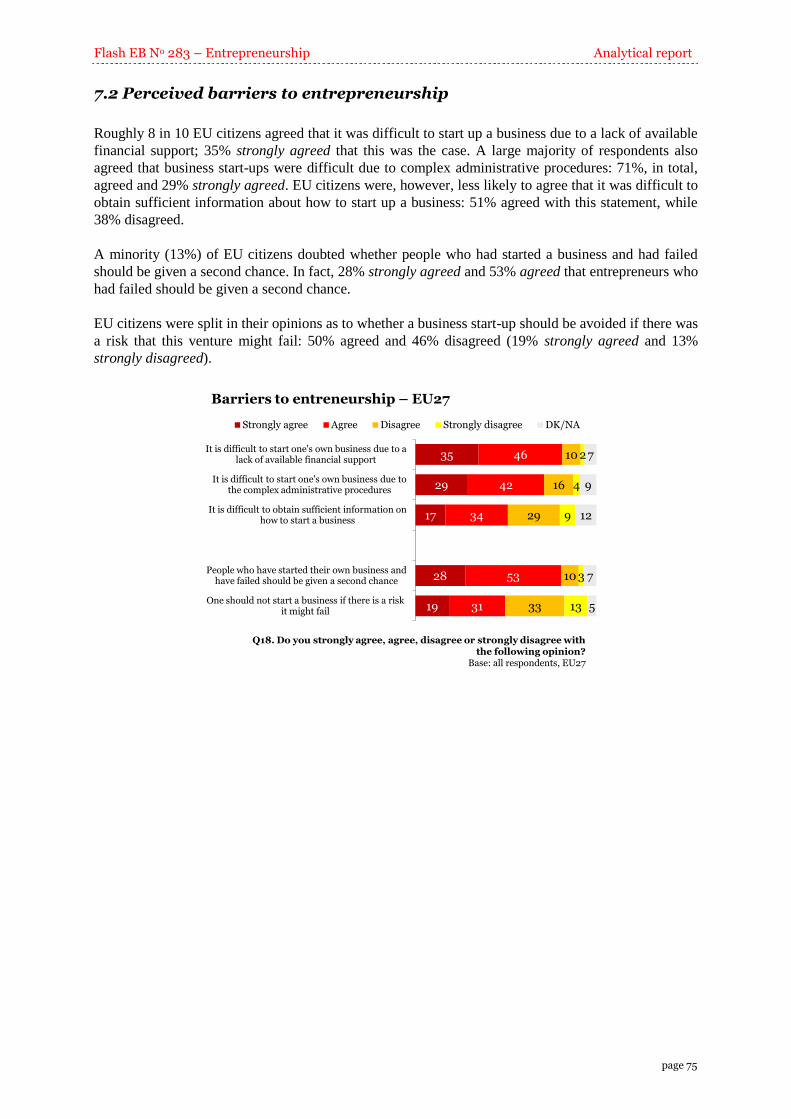
Flash EB No 283 – Entrepreneurship Analytical report
page 75
7.2 Perceived barriers to entrepreneurship
Roughly 8 in 10 EU citizens agreed that it was difficult to start up a business due to a lack of available
financial support; 35% strongly agreed that this was the case. A large majority of respondents also
agreed that business start-ups were difficult due to complex administrative procedures: 71%, in total,
agreed and 29% strongly agreed. EU citizens were, however, less likely to agree that it was difficult to
obtain sufficient information about how to start up a business: 51% agreed with this statement, while
38% disagreed.
A minority (13%) of EU citizens doubted whether people who had started a business and had failed
should be given a second chance. In fact, 28% strongly agreed and 53% agreed that entrepreneurs who
had failed should be given a second chance.
EU citizens were split in their opinions as to whether a business start-up should be avoided if there was
a risk that this venture might fail: 50% agreed and 46% disagreed (19% strongly agreed and 13%
strongly disagreed).
Barriers to entreneurship – EU27
35
29
17
28
19
46
42
34
53
31
10
16
29
10
33
2
4
9
3
13
7
9
12
7
5
It is difficult to start one's own business due to a lack of available financial support
It is difficult to start one's own business due to the complex administrative procedures
It is difficult to obtain sufficient information on how to start a business
People who have started their own business and have failed should be given a second chance
One should not start a business if there is a risk it might fail
Strongly agree Agree Disagree Strongly disagree DK/NA
Q18. Do you strongly agree, agree, disagree or strongly disagree with the following opinion?
Base: all respondents, EU27
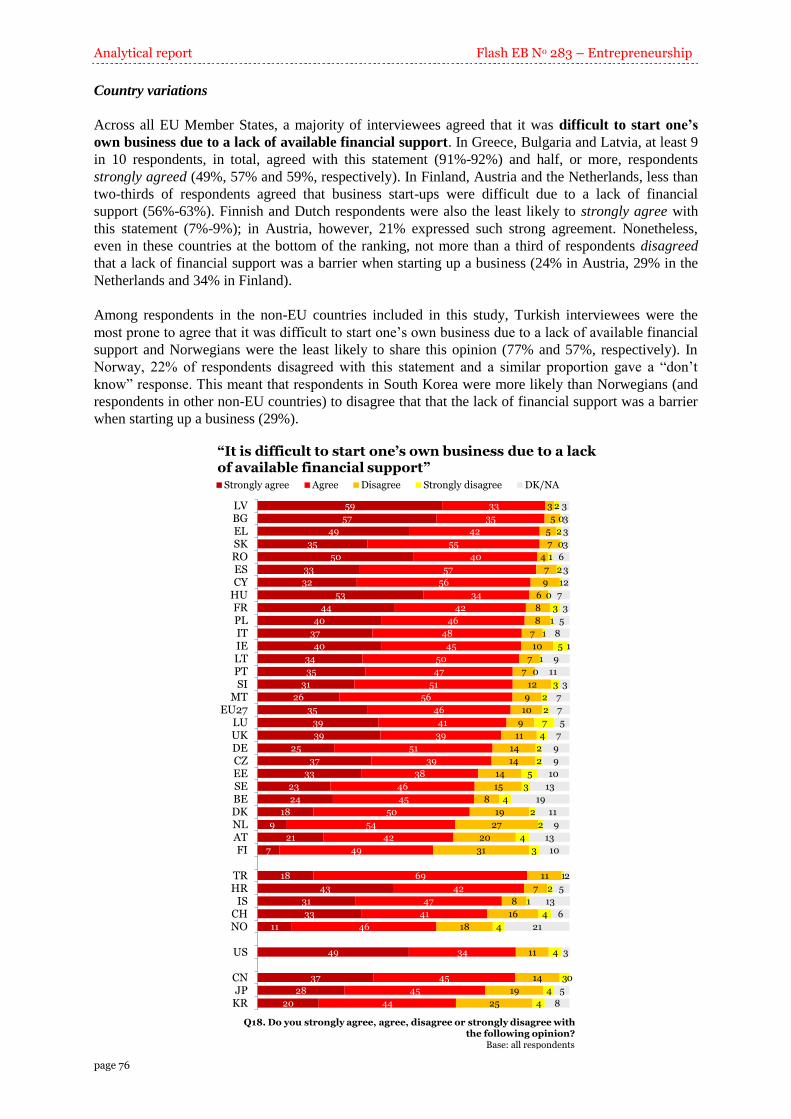
Analytical report Flash EB No 283 – Entrepreneurship
page 76
Country variations
Across all EU Member States, a majority of interviewees agreed that it was difficult to start one’s
own business due to a lack of available financial support. In Greece, Bulgaria and Latvia, at least 9
in 10 respondents, in total, agreed with this statement (91%-92%) and half, or more, respondents
strongly agreed (49%, 57% and 59%, respectively). In Finland, Austria and the Netherlands, less than
two-thirds of respondents agreed that business start-ups were difficult due to a lack of financial
support (56%-63%). Finnish and Dutch respondents were also the least likely to strongly agree with
this statement (7%-9%); in Austria, however, 21% expressed such strong agreement. Nonetheless,
even in these countries at the bottom of the ranking, not more than a third of respondents disagreed
that a lack of financial support was a barrier when starting up a business (24% in Austria, 29% in the
Netherlands and 34% in Finland).
Among respondents in the non-EU countries included in this study, Turkish interviewees were the
most prone to agree that it was difficult to start one’s own business due to a lack of available financial
support and Norwegians were the least likely to share this opinion (77% and 57%, respectively). In
Norway, 22% of respondents disagreed with this statement and a similar proportion gave a “don’t
know” response. This meant that respondents in South Korea were more likely than Norwegians (and
respondents in other non-EU countries) to disagree that that the lack of financial support was a barrier
when starting up a business (29%).
“It is difficult to start one’s own business due to a lack of available financial support”
59
57
49
35
50
33
32
53
44
40
37
40
34
35
31
26
35
39
39
25
37
33
23
24
18
9
21
7
18
43
31
33
11
49
37
28
20
33
35
42
55
40
57
56
34
42
46
48
45
50
47
51
56
46
41
39
51
39
38
46
45
50
54
42
49
69
42
47
41
46
34
45
45
44
3
5
5
7
4
7
9
6
8
8
7
10
7
7
12
9
10
9
11
14
14
14
15
8
19
27
20
31
11
7
8
16
18
11
14
19
25
2
0
2
0
1
2
1
0
3
1
1
5
1
0
3
2
2
7
4
2
2
5
3
4
2
2
4
3
1
2
1
4
4
4
3
4
4
3
3
3
3
6
3
2
7
3
5
8
1
9
11
3
7
7
5
7
9
9
10
13
19
11
9
13
10
2
5
13
6
21
3
0
5
8
LVBGELSKROESCY
HUFRPLITIELTPTSI
MTEU27
LUUKDECZEESEBEDKNLATFI
TRHR
ISCHNO
US
CNJP
KR
Strongly agree Agree Disagree Strongly disagree DK/NA
Q18. Do you strongly agree, agree, disagree or strongly disagree with the following opinion?
Base: all respondents
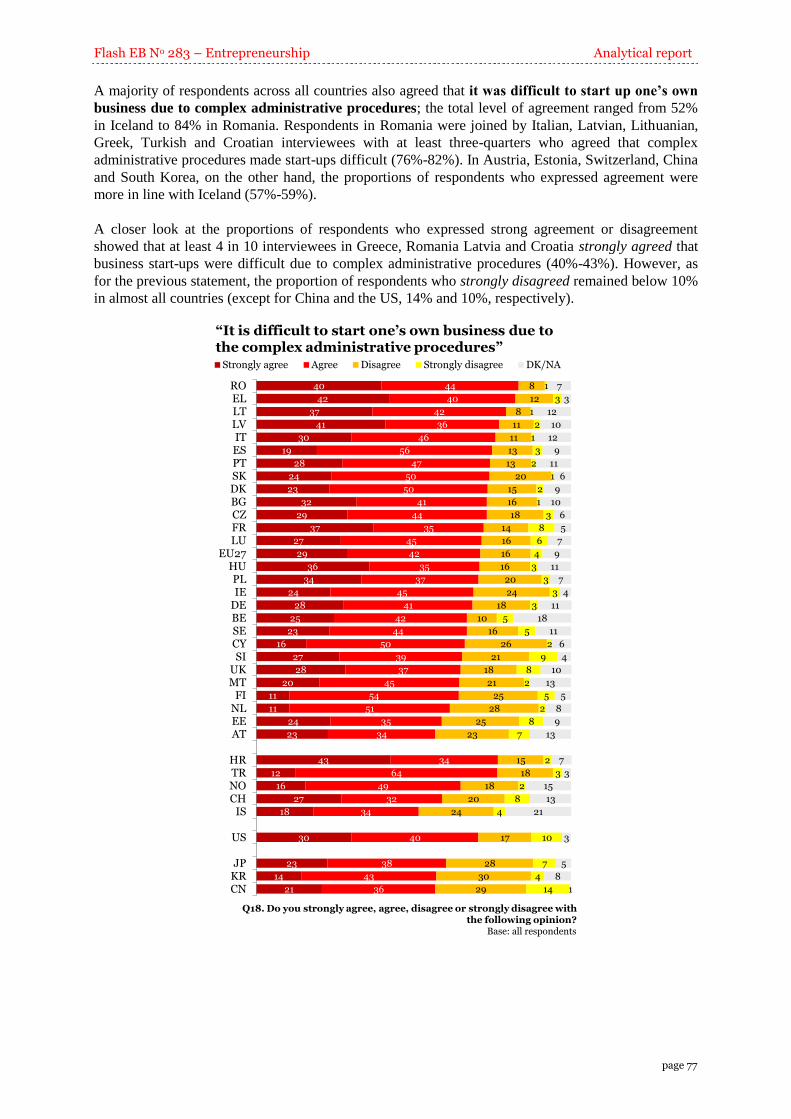
Flash EB No 283 – Entrepreneurship Analytical report
page 77
A majority of respondents across all countries also agreed that it was difficult to start up one’s own
business due to complex administrative procedures; the total level of agreement ranged from 52%
in Iceland to 84% in Romania. Respondents in Romania were joined by Italian, Latvian, Lithuanian,
Greek, Turkish and Croatian interviewees with at least three-quarters who agreed that complex
administrative procedures made start-ups difficult (76%-82%). In Austria, Estonia, Switzerland, China
and South Korea, on the other hand, the proportions of respondents who expressed agreement were
more in line with Iceland (57%-59%).
A closer look at the proportions of respondents who expressed strong agreement or disagreement
showed that at least 4 in 10 interviewees in Greece, Romania Latvia and Croatia strongly agreed that
business start-ups were difficult due to complex administrative procedures (40%-43%). However, as
for the previous statement, the proportion of respondents who strongly disagreed remained below 10%
in almost all countries (except for China and the US, 14% and 10%, respectively).
“It is difficult to start one’s own business due to the complex administrative procedures”
40
42
37
41
30
19
28
24
23
32
29
37
27
29
36
34
24
28
25
23
16
27
28
20
11
11
24
23
43
12
16
27
18
30
23
14
21
44
40
42
36
46
56
47
50
50
41
44
35
45
42
35
37
45
41
42
44
50
39
37
45
54
51
35
34
34
64
49
32
34
40
38
43
36
8
12
8
11
11
13
13
20
15
16
18
14
16
16
16
20
24
18
10
16
26
21
18
21
25
28
25
23
15
18
18
20
24
17
28
30
29
1
3
1
2
1
3
2
1
2
1
3
8
6
4
3
3
3
3
5
5
2
9
8
2
5
2
8
7
2
3
2
8
4
10
7
4
14
7
3
12
10
12
9
11
6
9
10
6
5
7
9
11
7
4
11
18
11
6
4
10
13
5
8
9
13
7
3
15
13
21
3
5
8
1
ROELLTLVITESPTSKDKBGCZFRLU
EU27HUPLIE
DEBESECYSI
UKMT
FINLEEAT
HRTRNOCH
IS
US
JPKRCN
Strongly agree Agree Disagree Strongly disagree DK/NA
Q18. Do you strongly agree, agree, disagree or strongly disagree with the following opinion?
Base: all respondents
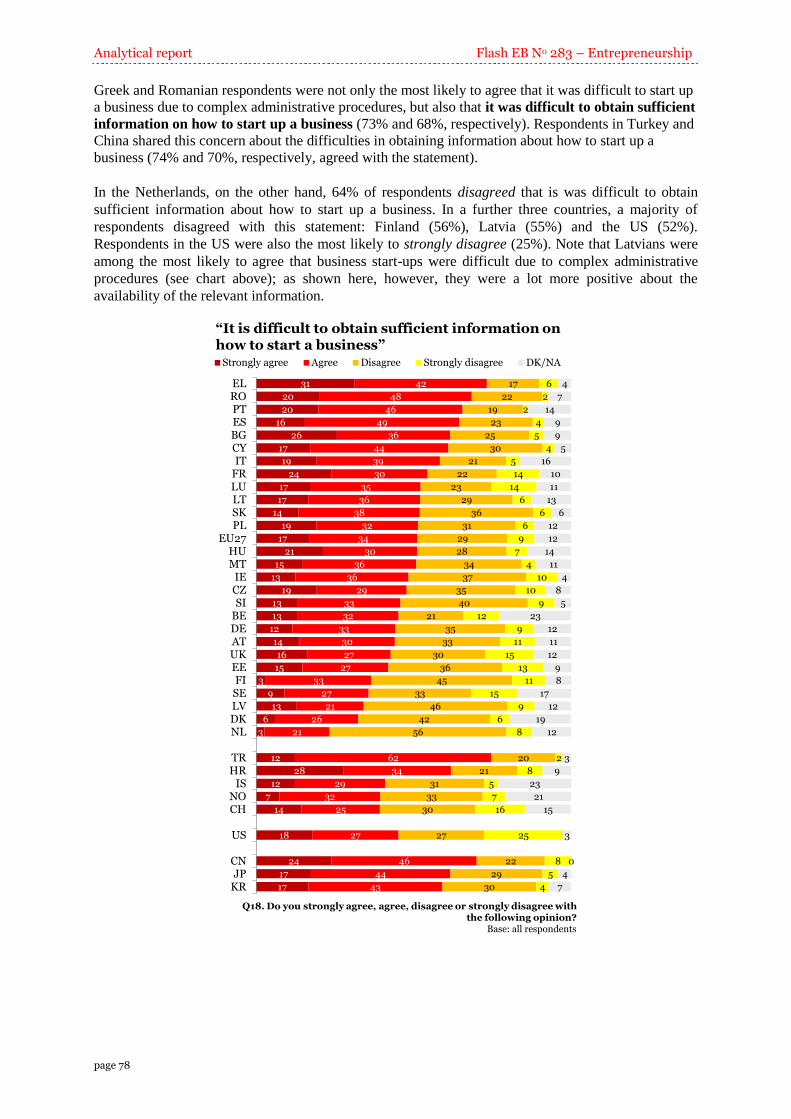
Analytical report Flash EB No 283 – Entrepreneurship
page 78
Greek and Romanian respondents were not only the most likely to agree that it was difficult to start up
a business due to complex administrative procedures, but also that it was difficult to obtain sufficient
information on how to start up a business (73% and 68%, respectively). Respondents in Turkey and
China shared this concern about the difficulties in obtaining information about how to start up a
business (74% and 70%, respectively, agreed with the statement).
In the Netherlands, on the other hand, 64% of respondents disagreed that is was difficult to obtain
sufficient information about how to start up a business. In a further three countries, a majority of
respondents disagreed with this statement: Finland (56%), Latvia (55%) and the US (52%).
Respondents in the US were also the most likely to strongly disagree (25%). Note that Latvians were
among the most likely to agree that business start-ups were difficult due to complex administrative
procedures (see chart above); as shown here, however, they were a lot more positive about the
availability of the relevant information.
“It is difficult to obtain sufficient information on how to start a business”
31
20
20
16
26
17
19
24
17
17
14
19
17
21
15
13
19
13
13
12
14
16
15
3
9
13
6
3
12
28
12
7
14
18
24
17
17
42
48
46
49
36
44
39
30
35
36
38
32
34
30
36
36
29
33
32
33
30
27
27
33
27
21
26
21
62
34
29
32
25
27
46
44
43
17
22
19
23
25
30
21
22
23
29
36
31
29
28
34
37
35
40
21
35
33
30
36
45
33
46
42
56
20
21
31
33
30
27
22
29
30
6
2
2
4
5
4
5
14
14
6
6
6
9
7
4
10
10
9
12
9
11
15
13
11
15
9
6
8
2
8
5
7
16
25
8
5
4
4
7
14
9
9
5
16
10
11
13
6
12
12
14
11
4
8
5
23
12
11
12
9
8
17
12
19
12
3
9
23
21
15
3
0
4
7
ELROPTESBGCYIT
FRLULTSKPL
EU27HUMT
IECZSI
BEDEATUKEEFISELVDKNL
TRHR
ISNOCH
US
CNJP
KR
Strongly agree Agree Disagree Strongly disagree DK/NA
Q18. Do you strongly agree, agree, disagree or strongly disagree with the following opinion?
Base: all respondents
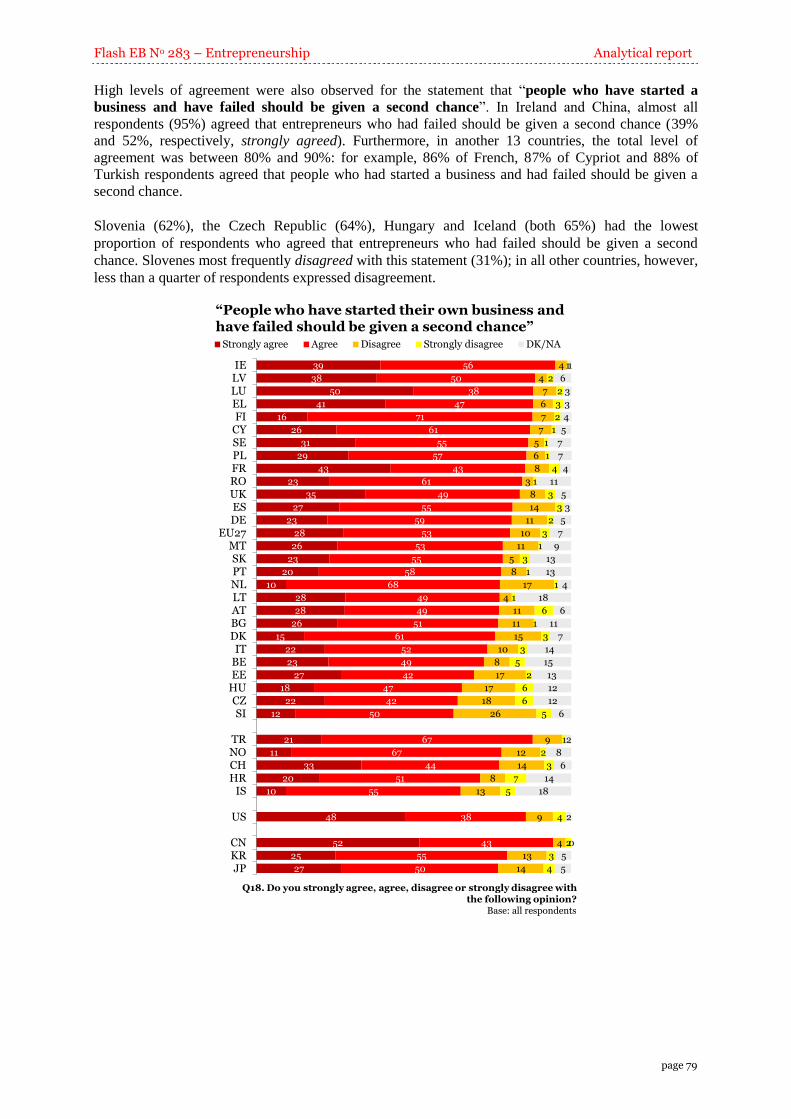
Flash EB No 283 – Entrepreneurship Analytical report
page 79
High levels of agreement were also observed for the statement that “people who have started a
business and have failed should be given a second chance”. In Ireland and China, almost all
respondents (95%) agreed that entrepreneurs who had failed should be given a second chance (39%
and 52%, respectively, strongly agreed). Furthermore, in another 13 countries, the total level of
agreement was between 80% and 90%: for example, 86% of French, 87% of Cypriot and 88% of
Turkish respondents agreed that people who had started a business and had failed should be given a
second chance.
Slovenia (62%), the Czech Republic (64%), Hungary and Iceland (both 65%) had the lowest
proportion of respondents who agreed that entrepreneurs who had failed should be given a second
chance. Slovenes most frequently disagreed with this statement (31%); in all other countries, however,
less than a quarter of respondents expressed disagreement.
“People who have started their own business and have failed should be given a second chance”
39
38
50
41
16
26
31
29
43
23
35
27
23
28
26
23
20
10
28
28
26
15
22
23
27
18
22
12
21
11
33
20
10
48
52
25
27
56
50
38
47
71
61
55
57
43
61
49
55
59
53
53
55
58
68
49
49
51
61
52
49
42
47
42
50
67
67
44
51
55
38
43
55
50
4
4
7
6
7
7
5
6
8
3
8
14
11
10
11
5
8
17
4
11
11
15
10
8
17
17
18
26
9
12
14
8
13
9
4
13
14
1
2
2
3
2
1
1
1
4
1
3
3
2
3
1
3
1
1
1
6
1
3
3
5
2
6
6
5
1
2
3
7
5
4
2
3
4
1
6
3
3
4
5
7
7
4
11
5
3
5
7
9
13
13
4
18
6
11
7
14
15
13
12
12
6
2
8
6
14
18
2
0
5
5
IELVLUELFI
CYSEPLFRROUKESDE
EU27MTSKPTNLLTATBGDKIT
BEEE
HUCZSI
TRNOCHHR
IS
US
CNKRJP
Strongly agree Agree Disagree Strongly disagree DK/NA
Q18. Do you strongly agree, agree, disagree or strongly disagree with the following opinion?
Base: all respondents
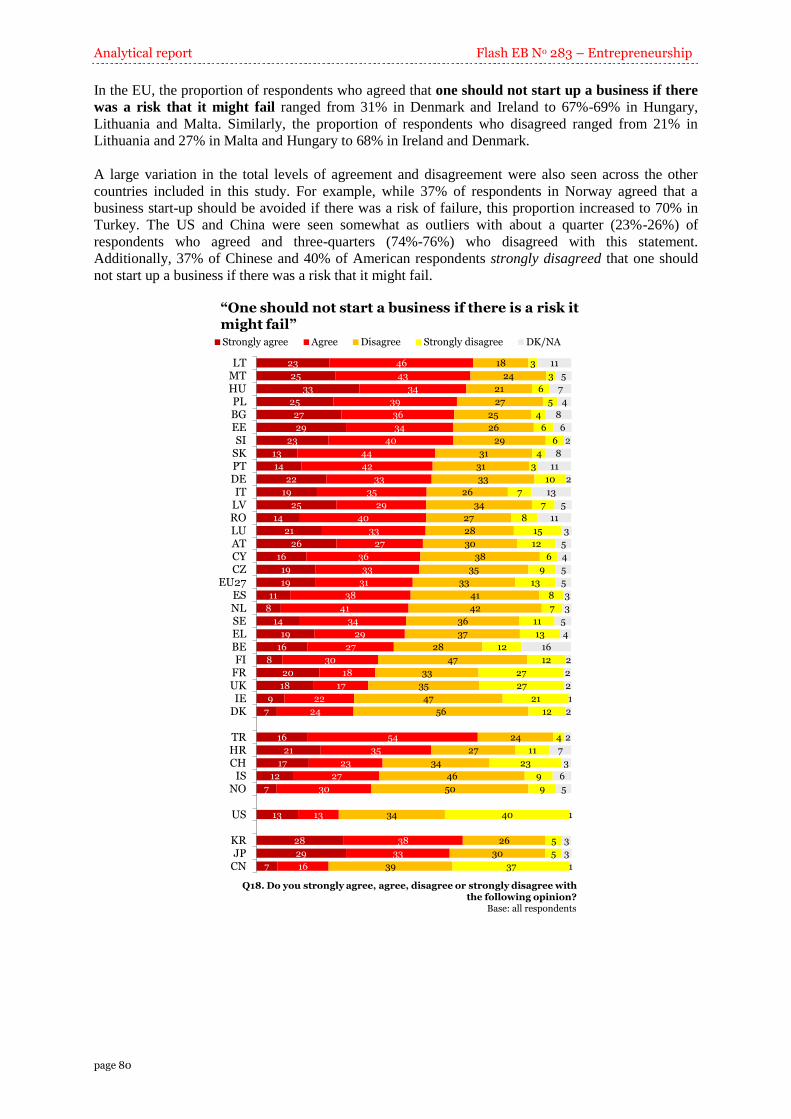
Analytical report Flash EB No 283 – Entrepreneurship
page 80
In the EU, the proportion of respondents who agreed that one should not start up a business if there
was a risk that it might fail ranged from 31% in Denmark and Ireland to 67%-69% in Hungary,
Lithuania and Malta. Similarly, the proportion of respondents who disagreed ranged from 21% in
Lithuania and 27% in Malta and Hungary to 68% in Ireland and Denmark.
A large variation in the total levels of agreement and disagreement were also seen across the other
countries included in this study. For example, while 37% of respondents in Norway agreed that a
business start-up should be avoided if there was a risk of failure, this proportion increased to 70% in
Turkey. The US and China were seen somewhat as outliers with about a quarter (23%-26%) of
respondents who agreed and three-quarters (74%-76%) who disagreed with this statement.
Additionally, 37% of Chinese and 40% of American respondents strongly disagreed that one should
not start up a business if there was a risk that it might fail.
“One should not start a business if there is a risk it might fail”
23
25
33
25
27
29
23
13
14
22
19
25
14
21
26
16
19
19
11
8
14
19
16
8
20
18
9
7
16
21
17
12
7
13
28
29
7
46
43
34
39
36
34
40
44
42
33
35
29
40
33
27
36
33
31
38
41
34
29
27
30
18
17
22
24
54
35
23
27
30
13
38
33
16
18
24
21
27
25
26
29
31
31
33
26
34
27
28
30
38
35
33
41
42
36
37
28
47
33
35
47
56
24
27
34
46
50
34
26
30
39
3
3
6
5
4
6
6
4
3
10
7
7
8
15
12
6
9
13
8
7
11
13
12
12
27
27
21
12
4
11
23
9
9
40
5
5
37
11
5
7
4
8
6
2
8
11
2
13
5
11
3
5
4
5
5
3
3
5
4
16
2
2
2
1
2
2
7
3
6
5
1
3
3
1
LTMTHUPLBGEESI
SKPTDEIT
LVROLUATCYCZ
EU27ESNLSEELBEFI
FRUKIE
DK
TRHRCH
ISNO
US
KRJP
CN
Strongly agree Agree Disagree Strongly disagree DK/NA
Q18. Do you strongly agree, agree, disagree or strongly disagree with the following opinion?
Base: all respondents
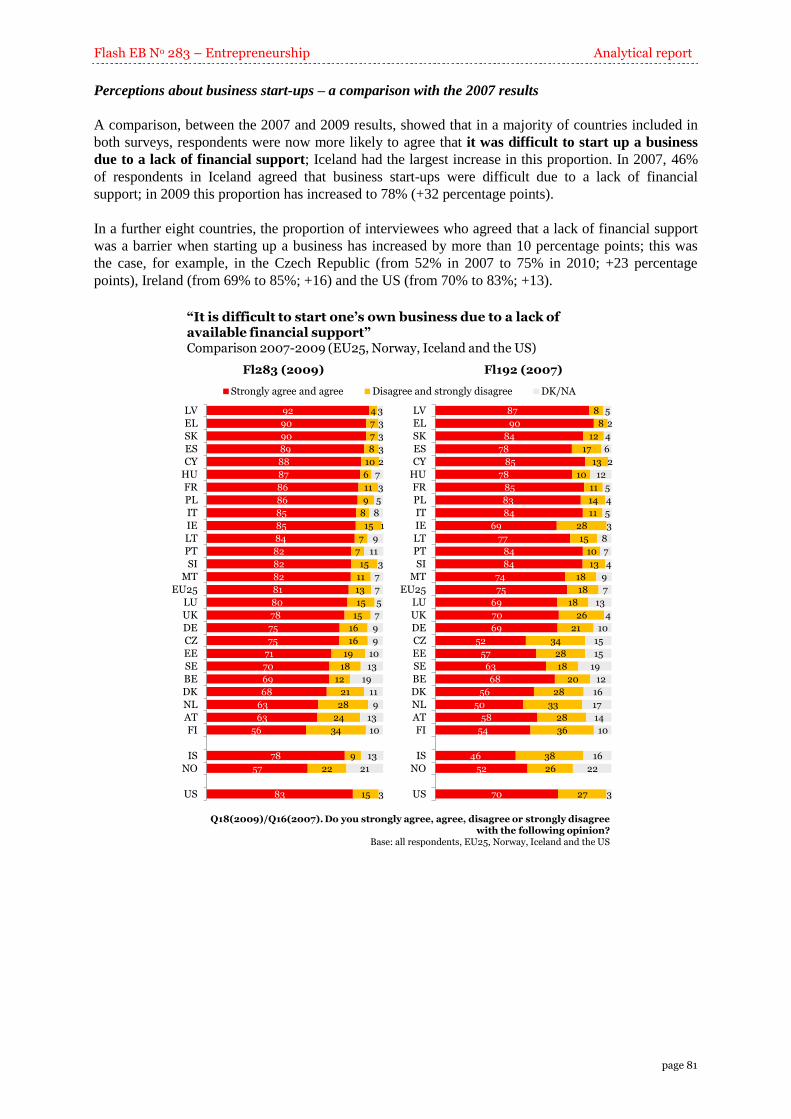
Flash EB No 283 – Entrepreneurship Analytical report
page 81
Perceptions about business start-ups – a comparison with the 2007 results
A comparison, between the 2007 and 2009 results, showed that in a majority of countries included in
both surveys, respondents were now more likely to agree that it was difficult to start up a business
due to a lack of financial support; Iceland had the largest increase in this proportion. In 2007, 46%
of respondents in Iceland agreed that business start-ups were difficult due to a lack of financial
support; in 2009 this proportion has increased to 78% (+32 percentage points).
In a further eight countries, the proportion of interviewees who agreed that a lack of financial support
was a barrier when starting up a business has increased by more than 10 percentage points; this was
the case, for example, in the Czech Republic (from 52% in 2007 to 75% in 2010; +23 percentage
points), Ireland (from 69% to 85%; +16) and the US (from 70% to 83%; +13).
92
90
90
89
88
87
86
86
85
85
84
82
82
82
81
80
78
75
75
71
70
69
68
63
63
56
78
57
83
4
7
7
8
10
6
11
9
8
15
7
7
15
11
13
15
15
16
16
19
18
12
21
28
24
34
9
22
15
3
3
3
3
2
7
3
5
8
1
9
11
3
7
7
5
7
9
9
10
13
19
11
9
13
10
13
21
3
LV
EL
SK
ES
CY
HU
FR
PL
IT
IE
LT
PT
SI
MT
EU25
LU
UK
DE
CZ
EE
SE
BE
DK
NL
AT
FI
IS
NO
US
Strongly agree and agree Disagree and strongly disagree DK/NA
87
90
84
78
85
78
85
83
84
69
77
84
84
74
75
69
70
69
52
57
63
68
56
50
58
54
46
52
70
8
8
12
17
13
10
11
14
11
28
15
10
13
18
18
18
26
21
34
28
18
20
28
33
28
36
38
26
27
5
2
4
6
2
12
5
4
5
3
8
7
4
9
7
13
4
10
15
15
19
12
16
17
14
10
16
22
3
LV
EL
SK
ES
CY
HU
FR
PL
IT
IE
LT
PT
SI
MT
EU25
LU
UK
DE
CZ
EE
SE
BE
DK
NL
AT
FI
IS
NO
US
“It is difficult to start one’s own business due to a lack of available financial support”Comparison 2007-2009 (EU25, Norway, Iceland and the US)
Q18(2009)/Q16(2007). Do you strongly agree, agree, disagree or strongly disagree with the following opinion?
Base: all respondents, EU25, Norway, Iceland and the US
Fl283 (2009) Fl192 (2007)
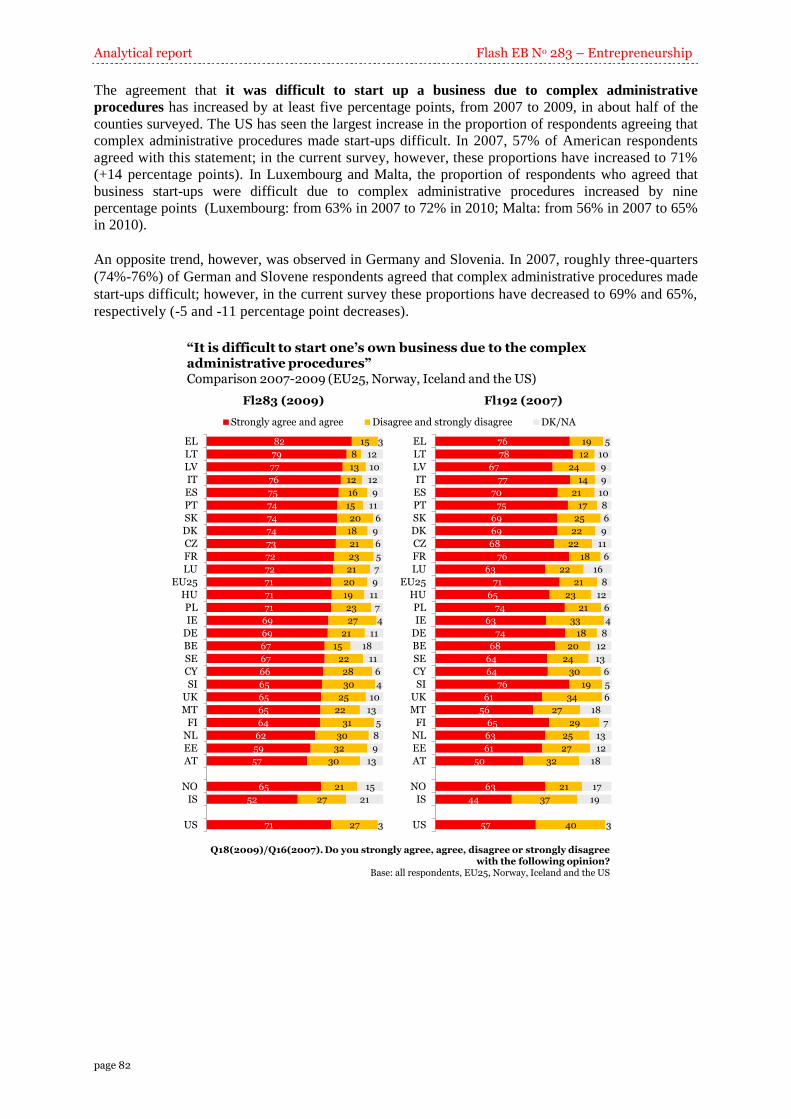
Analytical report Flash EB No 283 – Entrepreneurship
page 82
The agreement that it was difficult to start up a business due to complex administrative
procedures has increased by at least five percentage points, from 2007 to 2009, in about half of the
counties surveyed. The US has seen the largest increase in the proportion of respondents agreeing that
complex administrative procedures made start-ups difficult. In 2007, 57% of American respondents
agreed with this statement; in the current survey, however, these proportions have increased to 71%
(+14 percentage points). In Luxembourg and Malta, the proportion of respondents who agreed that
business start-ups were difficult due to complex administrative procedures increased by nine
percentage points (Luxembourg: from 63% in 2007 to 72% in 2010; Malta: from 56% in 2007 to 65%
in 2010).
An opposite trend, however, was observed in Germany and Slovenia. In 2007, roughly three-quarters
(74%-76%) of German and Slovene respondents agreed that complex administrative procedures made
start-ups difficult; however, in the current survey these proportions have decreased to 69% and 65%,
respectively (-5 and -11 percentage point decreases).
82
79
77
76
75
74
74
74
73
72
72
71
71
71
69
69
67
67
66
65
65
65
64
62
59
57
65
52
71
15
8
13
12
16
15
20
18
21
23
21
20
19
23
27
21
15
22
28
30
25
22
31
30
32
30
21
27
27
3
12
10
12
9
11
6
9
6
5
7
9
11
7
4
11
18
11
6
4
10
13
5
8
9
13
15
21
3
EL
LT
LV
IT
ES
PT
SK
DK
CZ
FR
LU
EU25
HU
PL
IE
DE
BE
SE
CY
SI
UK
MT
FI
NL
EE
AT
NO
IS
US
Strongly agree and agree Disagree and strongly disagree DK/NA
76
78
67
77
70
75
69
69
68
76
63
71
65
74
63
74
68
64
64
76
61
56
65
63
61
50
63
44
57
19
12
24
14
21
17
25
22
22
18
22
21
23
21
33
18
20
24
30
19
34
27
29
25
27
32
21
37
40
5
10
9
9
10
8
6
9
11
6
16
8
12
6
4
8
12
13
6
5
6
18
7
13
12
18
17
19
3
EL
LT
LV
IT
ES
PT
SK
DK
CZ
FR
LU
EU25
HU
PL
IE
DE
BE
SE
CY
SI
UK
MT
FI
NL
EE
AT
NO
IS
US
“It is difficult to start one’s own business due to the complex administrative procedures”Comparison 2007-2009 (EU25, Norway, Iceland and the US)
Q18(2009)/Q16(2007). Do you strongly agree, agree, disagree or strongly disagree with the following opinion?
Base: all respondents, EU25, Norway, Iceland and the US
Fl283 (2009) Fl192 (2007)
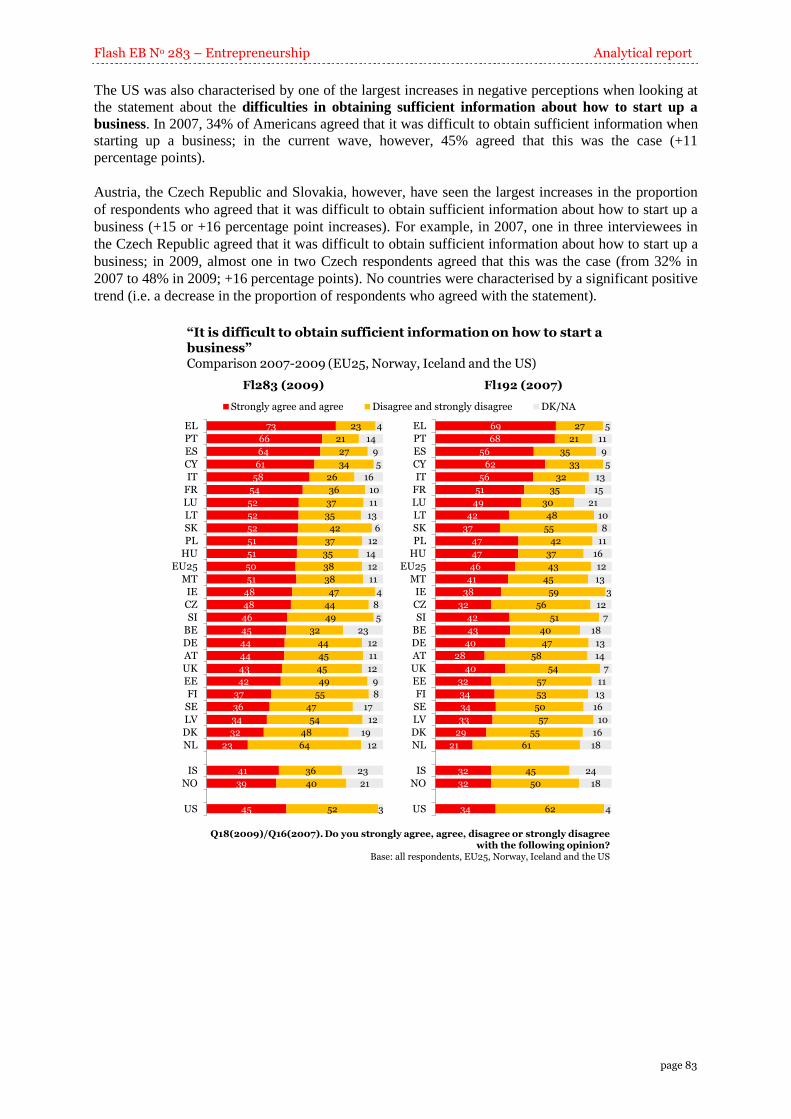
Flash EB No 283 – Entrepreneurship Analytical report
page 83
The US was also characterised by one of the largest increases in negative perceptions when looking at
the statement about the difficulties in obtaining sufficient information about how to start up a
business. In 2007, 34% of Americans agreed that it was difficult to obtain sufficient information when
starting up a business; in the current wave, however, 45% agreed that this was the case (+11
percentage points).
Austria, the Czech Republic and Slovakia, however, have seen the largest increases in the proportion
of respondents who agreed that it was difficult to obtain sufficient information about how to start up a
business (+15 or +16 percentage point increases). For example, in 2007, one in three interviewees in
the Czech Republic agreed that it was difficult to obtain sufficient information about how to start up a
business; in 2009, almost one in two Czech respondents agreed that this was the case (from 32% in
2007 to 48% in 2009; +16 percentage points). No countries were characterised by a significant positive
trend (i.e. a decrease in the proportion of respondents who agreed with the statement).
73
66
64
61
58
54
52
52
52
51
51
50
51
48
48
46
45
44
44
43
42
37
36
34
32
23
41
39
45
23
21
27
34
26
36
37
35
42
37
35
38
38
47
44
49
32
44
45
45
49
55
47
54
48
64
36
40
52
4
14
9
5
16
10
11
13
6
12
14
12
11
4
8
5
23
12
11
12
9
8
17
12
19
12
23
21
3
EL
PT
ES
CY
IT
FR
LU
LT
SK
PL
HU
EU25
MT
IE
CZ
SI
BE
DE
AT
UK
EE
FI
SE
LV
DK
NL
IS
NO
US
Strongly agree and agree Disagree and strongly disagree DK/NA
69
68
56
62
56
51
49
42
37
47
47
46
41
38
32
42
43
40
28
40
32
34
34
33
29
21
32
32
34
27
21
35
33
32
35
30
48
55
42
37
43
45
59
56
51
40
47
58
54
57
53
50
57
55
61
45
50
62
5
11
9
5
13
15
21
10
8
11
16
12
13
3
12
7
18
13
14
7
11
13
16
10
16
18
24
18
4
EL
PT
ES
CY
IT
FR
LU
LT
SK
PL
HU
EU25
MT
IE
CZ
SI
BE
DE
AT
UK
EE
FI
SE
LV
DK
NL
IS
NO
US
“It is difficult to obtain sufficient information on how to start a business”Comparison 2007-2009 (EU25, Norway, Iceland and the US)
Q18(2009)/Q16(2007). Do you strongly agree, agree, disagree or strongly disagree with the following opinion?
Base: all respondents, EU25, Norway, Iceland and the US
Fl283 (2009) Fl192 (2007)
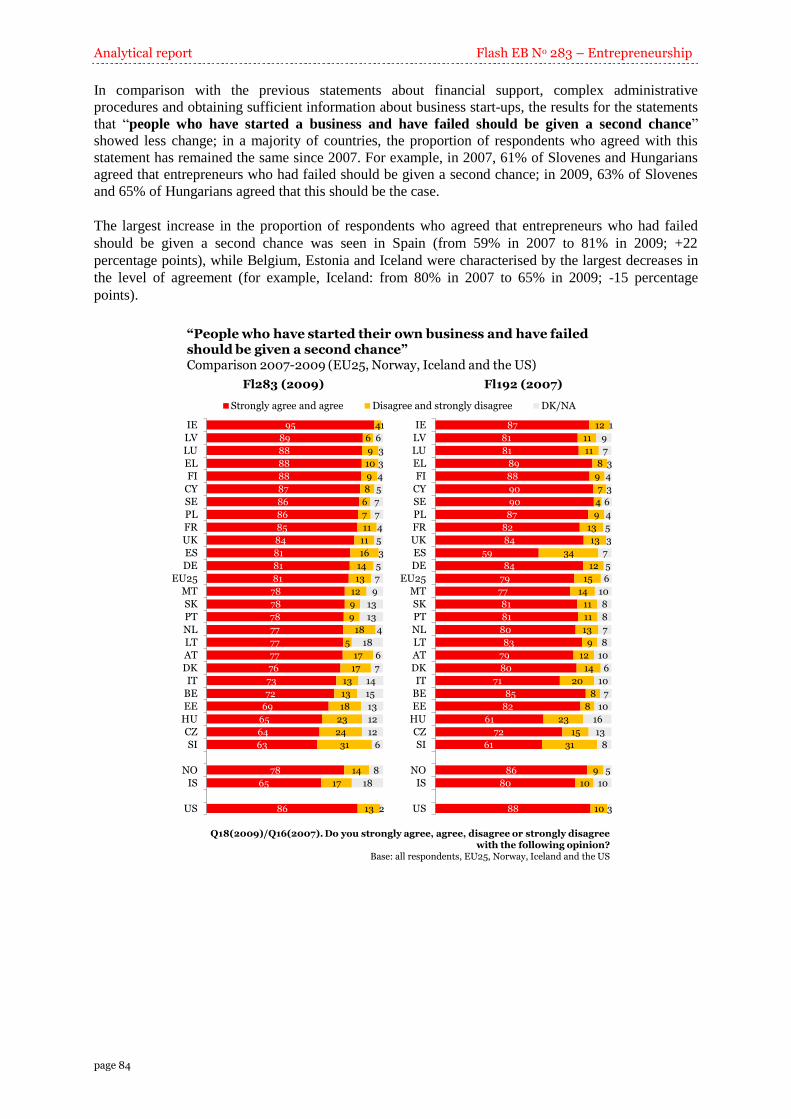
Analytical report Flash EB No 283 – Entrepreneurship
page 84
In comparison with the previous statements about financial support, complex administrative
procedures and obtaining sufficient information about business start-ups, the results for the statements
that “people who have started a business and have failed should be given a second chance”
showed less change; in a majority of countries, the proportion of respondents who agreed with this
statement has remained the same since 2007. For example, in 2007, 61% of Slovenes and Hungarians
agreed that entrepreneurs who had failed should be given a second chance; in 2009, 63% of Slovenes
and 65% of Hungarians agreed that this should be the case.
The largest increase in the proportion of respondents who agreed that entrepreneurs who had failed
should be given a second chance was seen in Spain (from 59% in 2007 to 81% in 2009; +22
percentage points), while Belgium, Estonia and Iceland were characterised by the largest decreases in
the level of agreement (for example, Iceland: from 80% in 2007 to 65% in 2009; -15 percentage
points).
95
89
88
88
88
87
86
86
85
84
81
81
81
78
78
78
77
77
77
76
73
72
69
65
64
63
78
65
86
4
6
9
10
9
8
6
7
11
11
16
14
13
12
9
9
18
5
17
17
13
13
18
23
24
31
14
17
13
1
6
3
3
4
5
7
7
4
5
3
5
7
9
13
13
4
18
6
7
14
15
13
12
12
6
8
18
2
IE
LV
LU
EL
FI
CY
SE
PL
FR
UK
ES
DE
EU25
MT
SK
PT
NL
LT
AT
DK
IT
BE
EE
HU
CZ
SI
NO
IS
US
Strongly agree and agree Disagree and strongly disagree DK/NA
87
81
81
89
88
90
90
87
82
84
59
84
79
77
81
81
80
83
79
80
71
85
82
61
72
61
86
80
88
12
11
11
8
9
7
4
9
13
13
34
12
15
14
11
11
13
9
12
14
20
8
8
23
15
31
9
10
10
1
9
7
3
4
3
6
4
5
3
7
5
6
10
8
8
7
8
10
6
10
7
10
16
13
8
5
10
3
IE
LV
LU
EL
FI
CY
SE
PL
FR
UK
ES
DE
EU25
MT
SK
PT
NL
LT
AT
DK
IT
BE
EE
HU
CZ
SI
NO
IS
US
“People who have started their own business and have failed should be given a second chance”Comparison 2007-2009 (EU25, Norway, Iceland and the US)
Q18(2009)/Q16(2007). Do you strongly agree, agree, disagree or strongly disagree with the following opinion?
Base: all respondents, EU25, Norway, Iceland and the US
Fl283 (2009) Fl192 (2007)
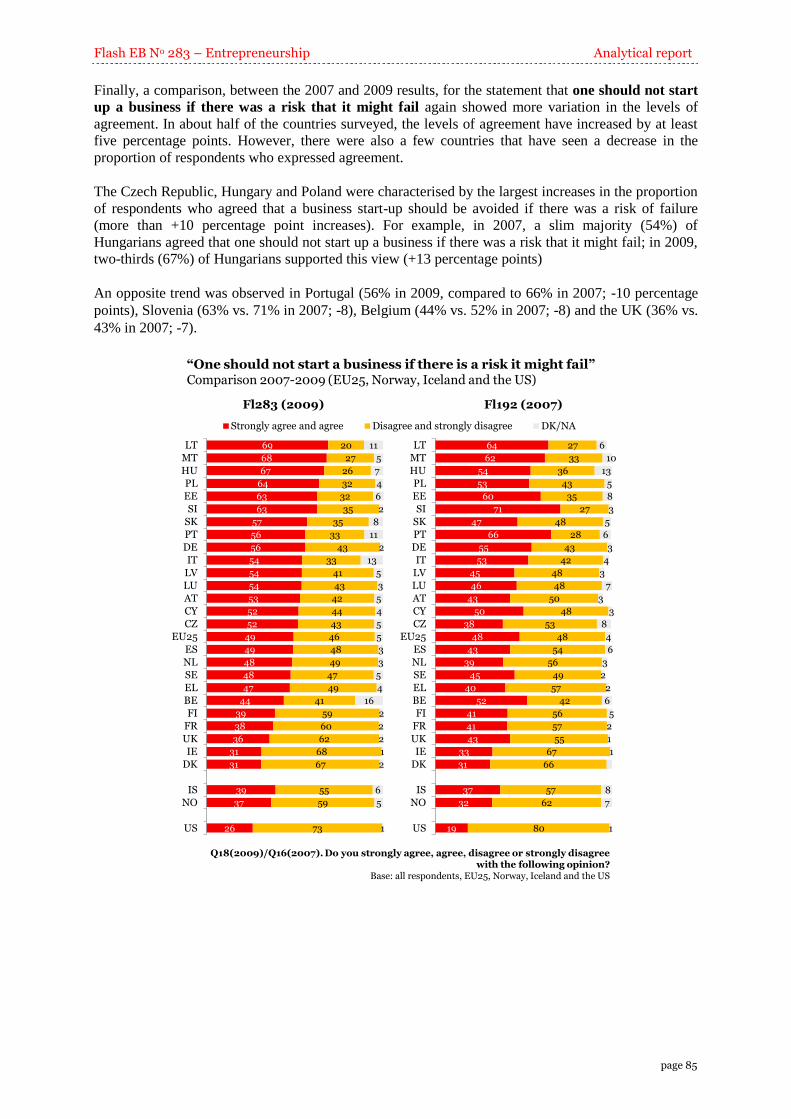
Flash EB No 283 – Entrepreneurship Analytical report
page 85
Finally, a comparison, between the 2007 and 2009 results, for the statement that one should not start
up a business if there was a risk that it might fail again showed more variation in the levels of
agreement. In about half of the countries surveyed, the levels of agreement have increased by at least
five percentage points. However, there were also a few countries that have seen a decrease in the
proportion of respondents who expressed agreement.
The Czech Republic, Hungary and Poland were characterised by the largest increases in the proportion
of respondents who agreed that a business start-up should be avoided if there was a risk of failure
(more than +10 percentage point increases). For example, in 2007, a slim majority (54%) of
Hungarians agreed that one should not start up a business if there was a risk that it might fail; in 2009,
two-thirds (67%) of Hungarians supported this view (+13 percentage points)
An opposite trend was observed in Portugal (56% in 2009, compared to 66% in 2007; -10 percentage
points), Slovenia (63% vs. 71% in 2007; -8), Belgium (44% vs. 52% in 2007; -8) and the UK (36% vs.
43% in 2007; -7).
69
68
67
64
63
63
57
56
56
54
54
54
53
52
52
49
49
48
48
47
44
39
38
36
31
31
39
37
26
20
27
26
32
32
35
35
33
43
33
41
43
42
44
43
46
48
49
47
49
41
59
60
62
68
67
55
59
73
11
5
7
4
6
2
8
11
2
13
5
3
5
4
5
5
3
3
5
4
16
2
2
2
1
2
6
5
1
LT
MT
HU
PL
EE
SI
SK
PT
DE
IT
LV
LU
AT
CY
CZ
EU25
ES
NL
SE
EL
BE
FI
FR
UK
IE
DK
IS
NO
US
Strongly agree and agree Disagree and strongly disagree DK/NA
64
62
54
53
60
71
47
66
55
53
45
46
43
50
38
48
43
39
45
40
52
41
41
43
33
31
37
32
19
27
33
36
43
35
27
48
28
43
42
48
48
50
48
53
48
54
56
49
57
42
56
57
55
67
66
57
62
80
6
10
13
5
8
3
5
6
3
4
3
7
3
3
8
4
6
3
2
2
6
5
2
1
1
8
7
1
LT
MT
HU
PL
EE
SI
SK
PT
DE
IT
LV
LU
AT
CY
CZ
EU25
ES
NL
SE
EL
BE
FI
FR
UK
IE
DK
IS
NO
US
“One should not start a business if there is a risk it might fail”Comparison 2007-2009 (EU25, Norway, Iceland and the US)
Q18(2009)/Q16(2007). Do you strongly agree, agree, disagree or strongly disagree with the following opinion?
Base: all respondents, EU25, Norway, Iceland and the US
Fl283 (2009) Fl192 (2007)
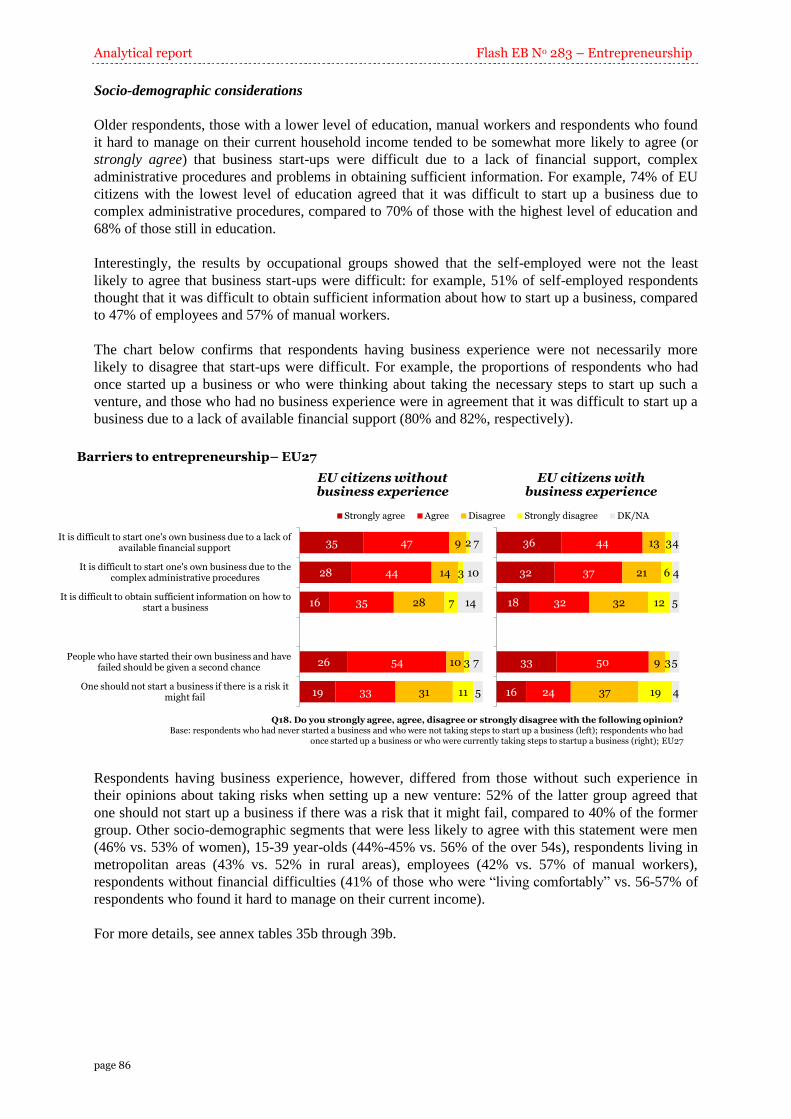
Analytical report Flash EB No 283 – Entrepreneurship
page 86
Socio-demographic considerations
Older respondents, those with a lower level of education, manual workers and respondents who found
it hard to manage on their current household income tended to be somewhat more likely to agree (or
strongly agree) that business start-ups were difficult due to a lack of financial support, complex
administrative procedures and problems in obtaining sufficient information. For example, 74% of EU
citizens with the lowest level of education agreed that it was difficult to start up a business due to
complex administrative procedures, compared to 70% of those with the highest level of education and
68% of those still in education.
Interestingly, the results by occupational groups showed that the self-employed were not the least
likely to agree that business start-ups were difficult: for example, 51% of self-employed respondents
thought that it was difficult to obtain sufficient information about how to start up a business, compared
to 47% of employees and 57% of manual workers.
The chart below confirms that respondents having business experience were not necessarily more
likely to disagree that start-ups were difficult. For example, the proportions of respondents who had
once started up a business or who were thinking about taking the necessary steps to start up such a
venture, and those who had no business experience were in agreement that it was difficult to start up a
business due to a lack of available financial support (80% and 82%, respectively).
Barriers to entrepreneurship– EU27
35
28
16
26
19
47
44
35
54
33
9
14
28
10
31
2
3
7
3
11
7
10
14
7
5
It is difficult to start one's own business due to a lack of available financial support
It is difficult to start one's own business due to the complex administrative procedures
It is difficult to obtain sufficient information on how to start a business
People who have started their own business and have failed should be given a second chance
One should not start a business if there is a risk it might fail
Strongly agree Agree Disagree Strongly disagree DK/NA
Q18. Do you strongly agree, agree, disagree or strongly disagree with the following opinion?Base: respondents who had never started a business and who were not taking steps to start up a business (left); respondents who had
once started up a business or who were currently taking steps to startup a business (right); EU27
36
32
18
33
16
44
37
32
50
24
13
21
32
9
37
3
6
12
3
19
4
4
5
5
4
EU citizens without business experience
EU citizens with business experience
Respondents having business experience, however, differed from those without such experience in
their opinions about taking risks when setting up a new venture: 52% of the latter group agreed that
one should not start up a business if there was a risk that it might fail, compared to 40% of the former
group. Other socio-demographic segments that were less likely to agree with this statement were men
(46% vs. 53% of women), 15-39 year-olds (44%-45% vs. 56% of the over 54s), respondents living in
metropolitan areas (43% vs. 52% in rural areas), employees (42% vs. 57% of manual workers),
respondents without financial difficulties (41% of those who were “living comfortably” vs. 56-57% of
respondents who found it hard to manage on their current income).
For more details, see annex tables 35b through 39b.
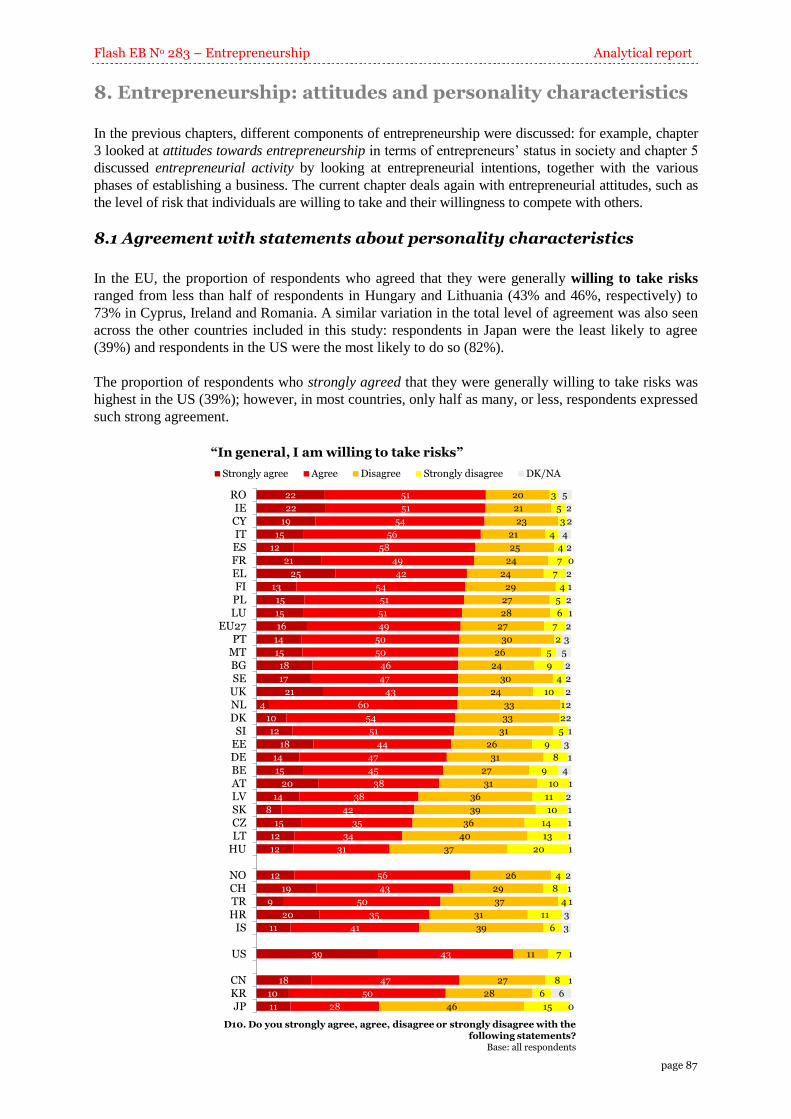
Flash EB No 283 – Entrepreneurship Analytical report
page 87
8. Entrepreneurship: attitudes and personality characteristics
In the previous chapters, different components of entrepreneurship were discussed: for example, chapter
3 looked at attitudes towards entrepreneurship in terms of entrepreneurs’ status in society and chapter 5
discussed entrepreneurial activity by looking at entrepreneurial intentions, together with the various
phases of establishing a business. The current chapter deals again with entrepreneurial attitudes, such as
the level of risk that individuals are willing to take and their willingness to compete with others.
8.1 Agreement with statements about personality characteristics
In the EU, the proportion of respondents who agreed that they were generally willing to take risks
ranged from less than half of respondents in Hungary and Lithuania (43% and 46%, respectively) to
73% in Cyprus, Ireland and Romania. A similar variation in the total level of agreement was also seen
across the other countries included in this study: respondents in Japan were the least likely to agree
(39%) and respondents in the US were the most likely to do so (82%).
The proportion of respondents who strongly agreed that they were generally willing to take risks was
highest in the US (39%); however, in most countries, only half as many, or less, respondents expressed
such strong agreement.
“In general, I am willing to take risks”
22
22
19
15
12
21
25
13
15
15
16
14
15
18
17
21
4
10
12
18
14
15
20
14
8
15
12
12
12
19
9
20
11
39
18
10
11
51
51
54
56
58
49
42
54
51
51
49
50
50
46
47
43
60
54
51
44
47
45
38
38
42
35
34
31
56
43
50
35
41
43
47
50
28
20
21
23
21
25
24
24
29
27
28
27
30
26
24
30
24
33
33
31
26
31
27
31
36
39
36
40
37
26
29
37
31
39
11
27
28
46
3
5
3
4
4
7
7
4
5
6
7
2
5
9
4
10
1
2
5
9
8
9
10
11
10
14
13
20
4
8
4
11
6
7
8
6
15
5
2
2
4
2
0
2
1
2
1
2
3
5
2
2
2
2
2
1
3
1
4
1
2
1
1
1
1
2
1
1
3
3
1
1
6
0
ROIECYITESFRELFIPLLU
EU27PT
MTBGSE
UKNLDK
SIEEDEBEATLVSKCZLT
HU
NOCHTRHR
IS
US
CNKRJP
Strongly agree Agree Disagree Strongly disagree DK/NA
D10. Do you strongly agree, agree, disagree or strongly disagree with the following statements?
Base: all respondents
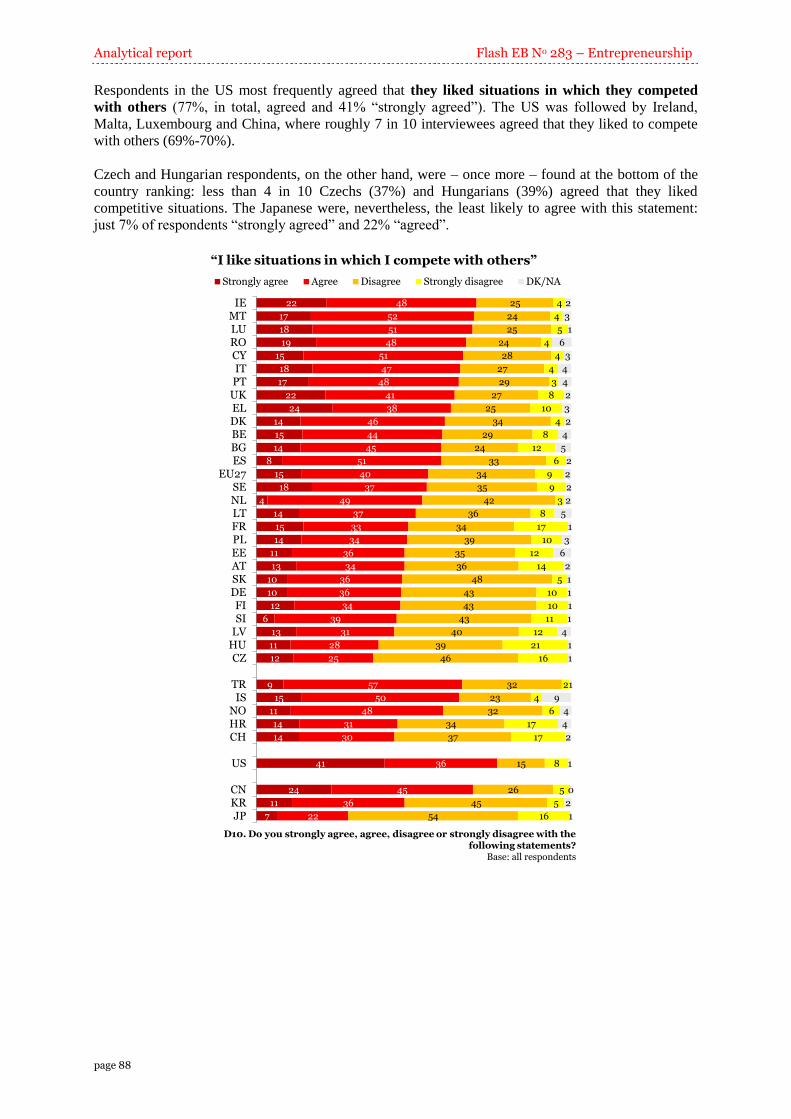
Analytical report Flash EB No 283 – Entrepreneurship
page 88
Respondents in the US most frequently agreed that they liked situations in which they competed
with others (77%, in total, agreed and 41% “strongly agreed”). The US was followed by Ireland,
Malta, Luxembourg and China, where roughly 7 in 10 interviewees agreed that they liked to compete
with others (69%-70%).
Czech and Hungarian respondents, on the other hand, were – once more – found at the bottom of the
country ranking: less than 4 in 10 Czechs (37%) and Hungarians (39%) agreed that they liked
competitive situations. The Japanese were, nevertheless, the least likely to agree with this statement:
just 7% of respondents “strongly agreed” and 22% “agreed”.
“I like situations in which I compete with others”
22
17
18
19
15
18
17
22
24
14
15
14
8
15
18
4
14
15
14
11
13
10
10
12
6
13
11
12
9
15
11
14
14
41
24
11
7
48
52
51
48
51
47
48
41
38
46
44
45
51
40
37
49
37
33
34
36
34
36
36
34
39
31
28
25
57
50
48
31
30
36
45
36
22
25
24
25
24
28
27
29
27
25
34
29
24
33
34
35
42
36
34
39
35
36
48
43
43
43
40
39
46
32
23
32
34
37
15
26
45
54
4
4
5
4
4
4
3
8
10
4
8
12
6
9
9
3
8
17
10
12
14
5
10
10
11
12
21
16
2
4
6
17
17
8
5
5
16
2
3
1
6
3
4
4
2
3
2
4
5
2
2
2
2
5
1
3
6
2
1
1
1
1
4
1
1
1
9
4
4
2
1
0
2
1
IEMTLUROCYITPTUKELDKBEBGES
EU27SENLLTFRPLEEATSKDEFISI
LVHUCZ
TRIS
NOHRCH
US
CNKRJP
Strongly agree Agree Disagree Strongly disagree DK/NA
D10. Do you strongly agree, agree, disagree or strongly disagree with the following statements?
Base: all respondents
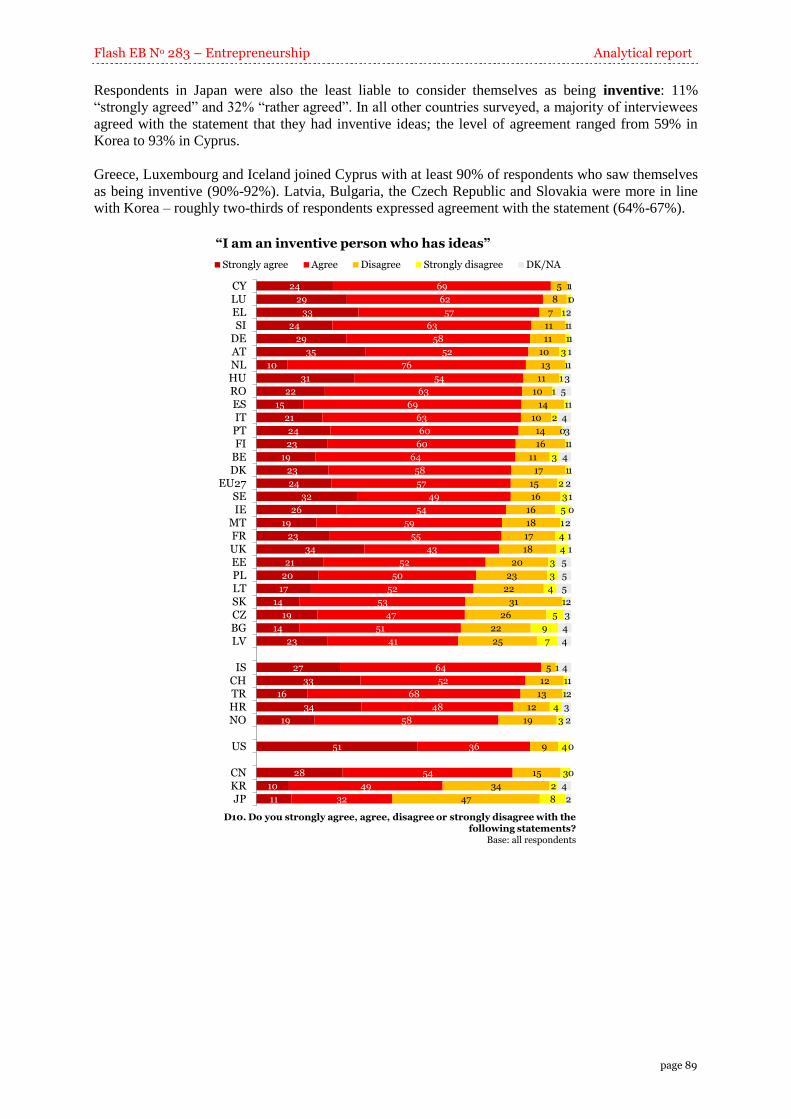
Flash EB No 283 – Entrepreneurship Analytical report
page 89
Respondents in Japan were also the least liable to consider themselves as being inventive: 11%
“strongly agreed” and 32% “rather agreed”. In all other countries surveyed, a majority of interviewees
agreed with the statement that they had inventive ideas; the level of agreement ranged from 59% in
Korea to 93% in Cyprus.
Greece, Luxembourg and Iceland joined Cyprus with at least 90% of respondents who saw themselves
as being inventive (90%-92%). Latvia, Bulgaria, the Czech Republic and Slovakia were more in line
with Korea – roughly two-thirds of respondents expressed agreement with the statement (64%-67%).
“I am an inventive person who has ideas”
24
29
33
24
29
35
10
31
22
15
21
24
23
19
23
24
32
26
19
23
34
21
20
17
14
19
14
23
27
33
16
34
19
51
28
10
11
69
62
57
63
58
52
76
54
63
69
63
60
60
64
58
57
49
54
59
55
43
52
50
52
53
47
51
41
64
52
68
48
58
36
54
49
32
5
8
7
11
11
10
13
11
10
14
10
14
16
11
17
15
16
16
18
17
18
20
23
22
31
26
22
25
5
12
13
12
19
9
15
34
47
1
1
1
1
1
3
1
1
1
1
2
0
1
3
1
2
3
5
1
4
4
3
3
4
1
5
9
7
1
1
1
4
3
4
3
2
8
1
0
2
1
1
1
1
3
5
1
4
3
1
4
1
2
1
0
2
1
1
5
5
5
2
3
4
4
4
1
2
3
2
0
0
4
2
CYLUELSI
DEATNLHUROESITPTFI
BEDK
EU27SEIE
MTFRUKEEPLLTSKCZBGLV
ISCHTRHRNO
US
CNKRJP
Strongly agree Agree Disagree Strongly disagree DK/NA
D10. Do you strongly agree, agree, disagree or strongly disagree with the following statements?
Base: all respondents
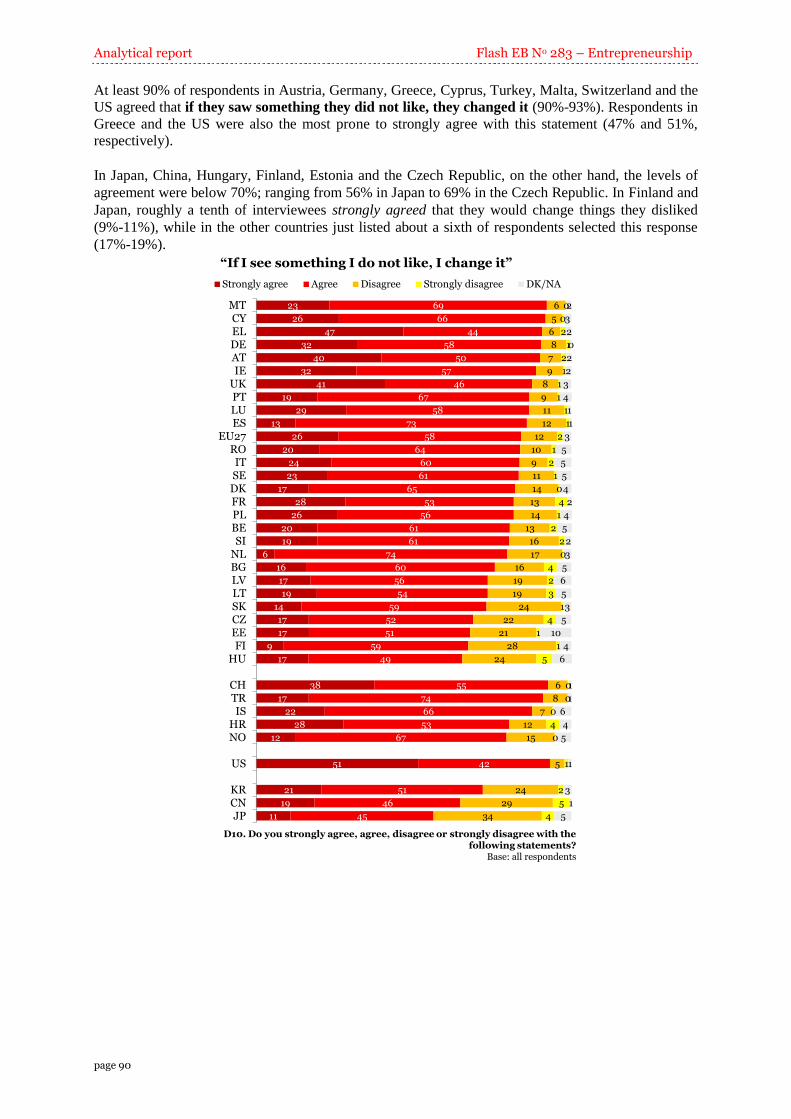
Analytical report Flash EB No 283 – Entrepreneurship
page 90
At least 90% of respondents in Austria, Germany, Greece, Cyprus, Turkey, Malta, Switzerland and the
US agreed that if they saw something they did not like, they changed it (90%-93%). Respondents in
Greece and the US were also the most prone to strongly agree with this statement (47% and 51%,
respectively).
In Japan, China, Hungary, Finland, Estonia and the Czech Republic, on the other hand, the levels of
agreement were below 70%; ranging from 56% in Japan to 69% in the Czech Republic. In Finland and
Japan, roughly a tenth of interviewees strongly agreed that they would change things they disliked
(9%-11%), while in the other countries just listed about a sixth of respondents selected this response
(17%-19%).
“If I see something I do not like, I change it”
23
26
47
32
40
32
41
19
29
13
26
20
24
23
17
28
26
20
19
6
16
17
19
14
17
17
9
17
38
17
22
28
12
51
21
19
11
69
66
44
58
50
57
46
67
58
73
58
64
60
61
65
53
56
61
61
74
60
56
54
59
52
51
59
49
55
74
66
53
67
42
51
46
45
6
5
6
8
7
9
8
9
11
12
12
10
9
11
14
13
14
13
16
17
16
19
19
24
22
21
28
24
6
8
7
12
15
5
24
29
34
0
0
2
1
2
1
1
1
1
1
2
1
2
1
0
4
1
2
2
0
4
2
3
1
4
1
1
5
0
0
0
4
0
1
2
5
4
2
3
2
0
2
2
3
4
1
1
3
5
5
5
4
2
4
5
2
3
5
6
5
3
5
10
4
6
1
1
6
4
5
1
3
1
5
MTCYELDEATIE
UKPTLUES
EU27ROITSEDKFRPLBESI
NLBGLVLTSKCZEEFI
HU
CHTRIS
HRNO
US
KRCNJP
Strongly agree Agree Disagree Strongly disagree DK/NA
D10. Do you strongly agree, agree, disagree or strongly disagree with the following statements?
Base: all respondents
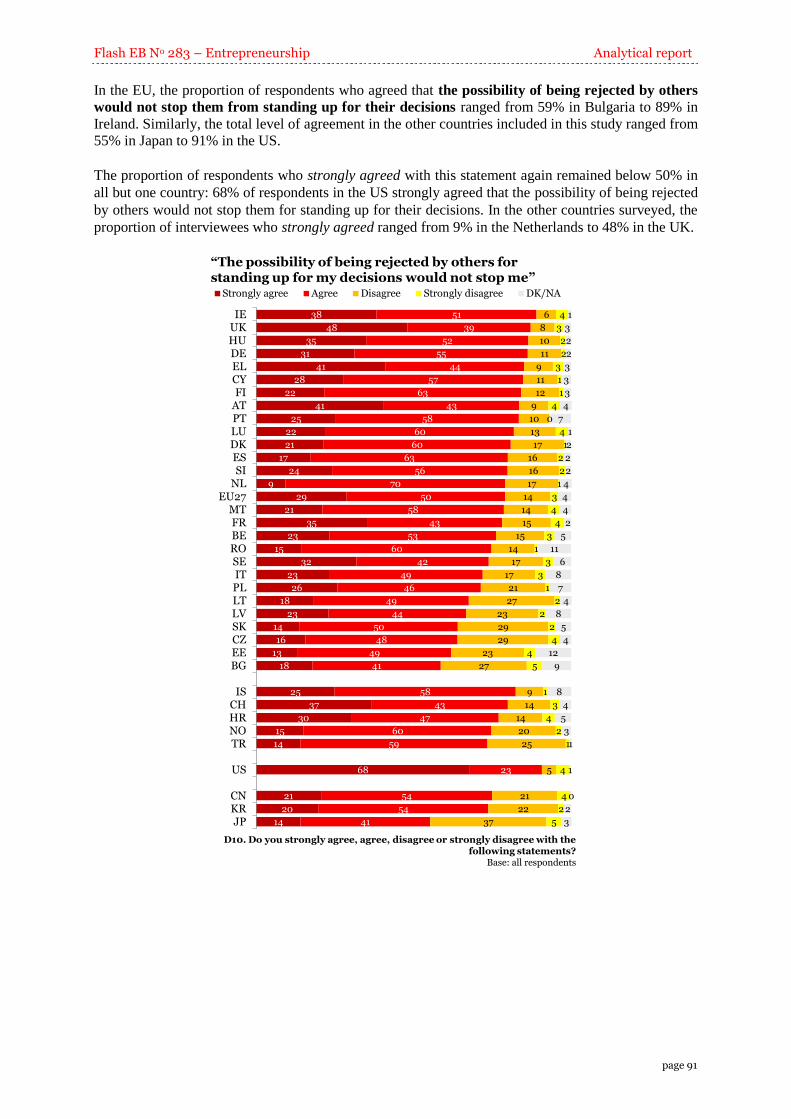
Flash EB No 283 – Entrepreneurship Analytical report
page 91
In the EU, the proportion of respondents who agreed that the possibility of being rejected by others
would not stop them from standing up for their decisions ranged from 59% in Bulgaria to 89% in
Ireland. Similarly, the total level of agreement in the other countries included in this study ranged from
55% in Japan to 91% in the US.
The proportion of respondents who strongly agreed with this statement again remained below 50% in
all but one country: 68% of respondents in the US strongly agreed that the possibility of being rejected
by others would not stop them for standing up for their decisions. In the other countries surveyed, the
proportion of interviewees who strongly agreed ranged from 9% in the Netherlands to 48% in the UK.
“The possibility of being rejected by others for standing up for my decisions would not stop me”
38
48
35
31
41
28
22
41
25
22
21
17
24
9
29
21
35
23
15
32
23
26
18
23
14
16
13
18
25
37
30
15
14
68
21
20
14
51
39
52
55
44
57
63
43
58
60
60
63
56
70
50
58
43
53
60
42
49
46
49
44
50
48
49
41
58
43
47
60
59
23
54
54
41
6
8
10
11
9
11
12
9
10
13
17
16
16
17
14
14
15
15
14
17
17
21
27
23
29
29
23
27
9
14
14
20
25
5
21
22
37
4
3
2
2
3
1
1
4
0
4
1
2
2
1
3
4
4
3
1
3
3
1
2
2
2
4
4
5
1
3
4
2
1
4
4
2
5
1
3
2
2
3
3
3
4
7
1
2
2
2
4
4
4
2
5
11
6
8
7
4
8
5
4
12
9
8
4
5
3
1
1
0
2
3
IEUKHUDEELCYFI
ATPTLUDKESSI
NLEU27
MTFRBEROSEITPLLTLVSKCZEEBG
ISCHHRNOTR
US
CNKRJP
Strongly agree Agree Disagree Strongly disagree DK/NA
D10. Do you strongly agree, agree, disagree or strongly disagree with the following statements?
Base: all respondents

Analytical report Flash EB No 283 – Entrepreneurship
page 92
Across all countries surveyed, a majority of respondents also agreed that when faced with difficult
tasks, they generally felt certain that they would accomplish them. Respondents in Denmark and the
US were the most likely to agree with this statement (95%-96%), while those in Slovakia were the least
likely to do so (60%). Furthermore, in Slovakia, a third of respondents did not feel confident that they
would always be able to accomplish difficult tasks – a figure similar to that recorded in Japan (34%).
Almost two-thirds (64%) of respondents in the US strongly agreed that when faced with difficult
tasks, they generally felt certain that they would complete them. Next in line were Austria, China and
the UK, with between 37% and 40% of respondents selecting the “strongly agree” response.
“Generally, when facing difficult tasks, I am certain that I will accomplish them”
27
28
22
31
40
23
26
37
30
17
20
29
9
26
14
16
22
17
18
15
20
21
14
16
15
15
16
11
22
25
30
17
23
64
39
19
12
68
61
67
57
48
65
62
49
56
69
65
54
74
57
68
66
59
61
60
60
55
52
57
54
55
54
52
49
67
63
55
66
52
32
52
58
52
4
10
8
9
8
8
11
10
10
13
13
12
15
12
14
12
15
16
15
20
15
21
24
25
23
25
22
32
11
7
12
14
15
3
6
18
31
0
0
1
1
2
0
0
1
2
0
2
2
0
2
1
0
2
1
2
2
6
3
3
1
6
3
2
1
0
1
1
1
4
1
4
3
3
1
1
2
1
2
4
1
3
3
1
1
2
2
4
2
6
3
4
4
4
4
4
1
4
2
3
8
6
1
4
2
2
5
1
0
2
2
DKSI
CYIE
UKPTDEATSEFI
LUELNLEEESRO
EU27IT
BELVBGHUFRLTCZ
MTPLSK
TRIS
CHNOHR
US
CNKRJP
Strongly agree Agree Disagree Strongly disagree DK/NA
D10. Do you strongly agree, agree, disagree or strongly disagree with the following statements?
Base: all respondents
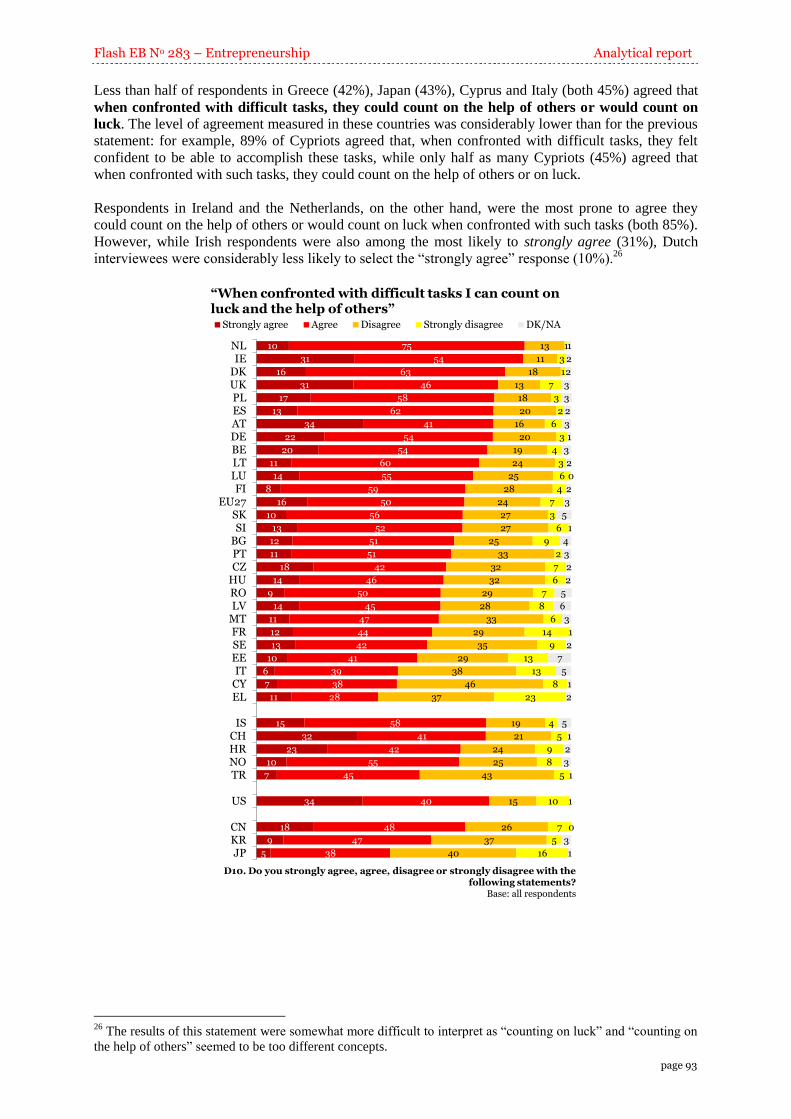
Flash EB No 283 – Entrepreneurship Analytical report
page 93
Less than half of respondents in Greece (42%), Japan (43%), Cyprus and Italy (both 45%) agreed that
when confronted with difficult tasks, they could count on the help of others or would count on
luck. The level of agreement measured in these countries was considerably lower than for the previous
statement: for example, 89% of Cypriots agreed that, when confronted with difficult tasks, they felt
confident to be able to accomplish these tasks, while only half as many Cypriots (45%) agreed that
when confronted with such tasks, they could count on the help of others or on luck.
Respondents in Ireland and the Netherlands, on the other hand, were the most prone to agree they
could count on the help of others or would count on luck when confronted with such tasks (both 85%).
However, while Irish respondents were also among the most likely to strongly agree (31%), Dutch
interviewees were considerably less likely to select the “strongly agree” response (10%).26
“When confronted with difficult tasks I can count on luck and the help of others”
10
31
16
31
17
13
34
22
20
11
14
8
16
10
13
12
11
18
14
9
14
11
12
13
10
6
7
11
15
32
23
10
7
34
18
9
5
75
54
63
46
58
62
41
54
54
60
55
59
50
56
52
51
51
42
46
50
45
47
44
42
41
39
38
28
58
41
42
55
45
40
48
47
38
13
11
18
13
18
20
16
20
19
24
25
28
24
27
27
25
33
32
32
29
28
33
29
35
29
38
46
37
19
21
24
25
43
15
26
37
40
1
3
1
7
3
2
6
3
4
3
6
4
7
3
6
9
2
7
6
7
8
6
14
9
13
13
8
23
4
5
9
8
5
10
7
5
16
1
2
2
3
3
2
3
1
3
2
0
2
3
5
1
4
3
2
2
5
6
3
1
2
7
5
1
2
5
1
2
3
1
1
0
3
1
NLIE
DKUKPLESATDEBELTLUFI
EU27SKSI
BGPTCZ
HUROLV
MTFRSEEEIT
CYEL
ISCHHRNOTR
US
CNKRJP
Strongly agree Agree Disagree Strongly disagree DK/NA
D10. Do you strongly agree, agree, disagree or strongly disagree with the following statements?
Base: all respondents
26
The results of this statement were somewhat more difficult to interpret as “counting on luck” and “counting on
the help of others” seemed to be too different concepts.
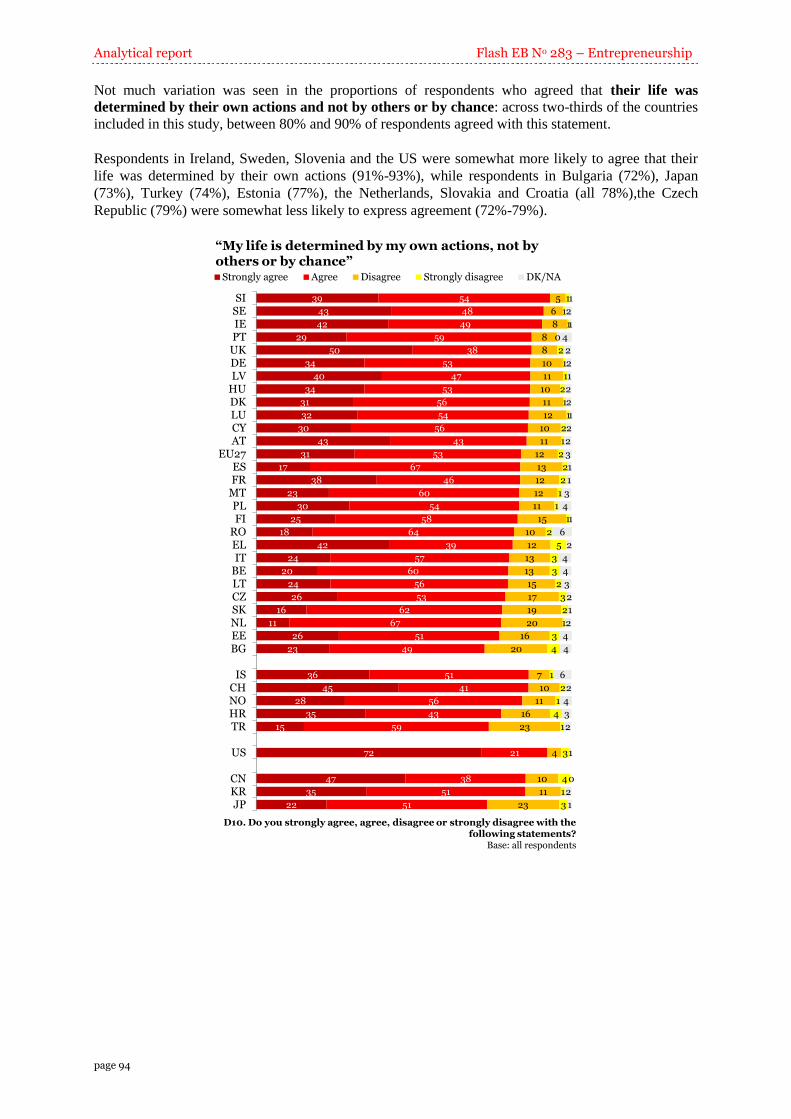
Analytical report Flash EB No 283 – Entrepreneurship
page 94
Not much variation was seen in the proportions of respondents who agreed that their life was
determined by their own actions and not by others or by chance: across two-thirds of the countries
included in this study, between 80% and 90% of respondents agreed with this statement.
Respondents in Ireland, Sweden, Slovenia and the US were somewhat more likely to agree that their
life was determined by their own actions (91%-93%), while respondents in Bulgaria (72%), Japan
(73%), Turkey (74%), Estonia (77%), the Netherlands, Slovakia and Croatia (all 78%),the Czech
Republic (79%) were somewhat less likely to express agreement (72%-79%).
“My life is determined by my own actions, not by others or by chance”
39
43
42
29
50
34
40
34
31
32
30
43
31
17
38
23
30
25
18
42
24
20
24
26
16
11
26
23
36
45
28
35
15
72
47
35
22
54
48
49
59
38
53
47
53
56
54
56
43
53
67
46
60
54
58
64
39
57
60
56
53
62
67
51
49
51
41
56
43
59
21
38
51
51
5
6
8
8
8
10
11
10
11
12
10
11
12
13
12
12
11
15
10
12
13
13
15
17
19
20
16
20
7
10
11
16
23
4
10
11
23
1
1
1
0
2
1
1
2
1
1
2
1
2
2
2
1
1
1
2
5
3
3
2
3
2
1
3
4
1
2
1
4
1
3
4
1
3
1
2
1
4
2
2
1
2
2
1
2
2
3
1
1
3
4
1
6
2
4
4
3
2
1
2
4
4
6
2
4
3
2
1
0
2
1
SISEIEPTUKDELV
HUDKLUCYAT
EU27ESFR
MTPLFI
ROELIT
BELTCZSKNLEEBG
ISCHNOHRTR
US
CNKRJP
Strongly agree Agree Disagree Strongly disagree DK/NA
D10. Do you strongly agree, agree, disagree or strongly disagree with the following statements?
Base: all respondents
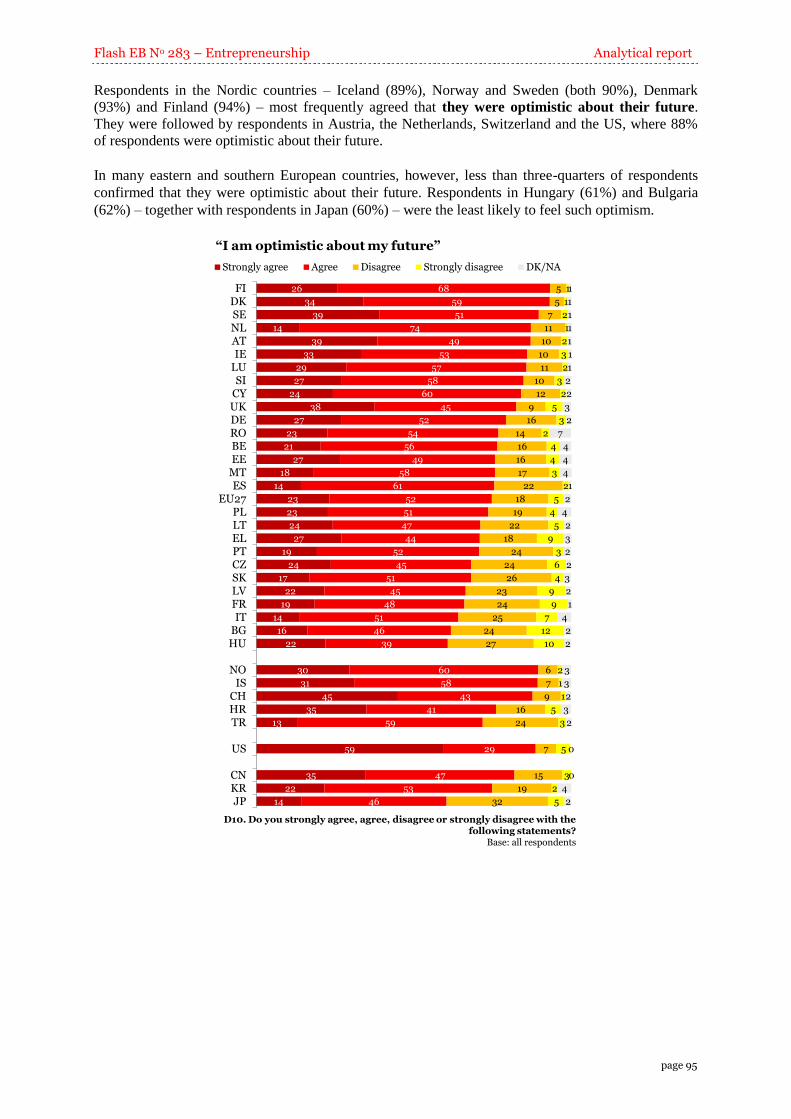
Flash EB No 283 – Entrepreneurship Analytical report
page 95
Respondents in the Nordic countries – Iceland (89%), Norway and Sweden (both 90%), Denmark
(93%) and Finland (94%) – most frequently agreed that they were optimistic about their future.
They were followed by respondents in Austria, the Netherlands, Switzerland and the US, where 88%
of respondents were optimistic about their future.
In many eastern and southern European countries, however, less than three-quarters of respondents
confirmed that they were optimistic about their future. Respondents in Hungary (61%) and Bulgaria
(62%) – together with respondents in Japan (60%) – were the least likely to feel such optimism.
“I am optimistic about my future”
26
34
39
14
39
33
29
27
24
38
27
23
21
27
18
14
23
23
24
27
19
24
17
22
19
14
16
22
30
31
45
35
13
59
35
22
14
68
59
51
74
49
53
57
58
60
45
52
54
56
49
58
61
52
51
47
44
52
45
51
45
48
51
46
39
60
58
43
41
59
29
47
53
46
5
5
7
11
10
10
11
10
12
9
16
14
16
16
17
22
18
19
22
18
24
24
26
23
24
25
24
27
6
7
9
16
24
7
15
19
32
1
1
2
1
2
3
2
3
2
5
3
2
4
4
3
2
5
4
5
9
3
6
4
9
9
7
12
10
2
1
1
5
3
5
3
2
5
1
1
1
1
1
1
1
2
2
3
2
7
4
4
4
1
2
4
2
3
2
2
3
2
1
4
2
2
3
3
2
3
2
0
0
4
2
FIDKSENLATIE
LUSI
CYUKDEROBEEE
MTES
EU27PLLTELPTCZSKLVFRIT
BGHU
NOIS
CHHRTR
US
CNKRJP
Strongly agree Agree Disagree Strongly disagree DK/NA
D10. Do you strongly agree, agree, disagree or strongly disagree with the following statements?
Base: all respondents
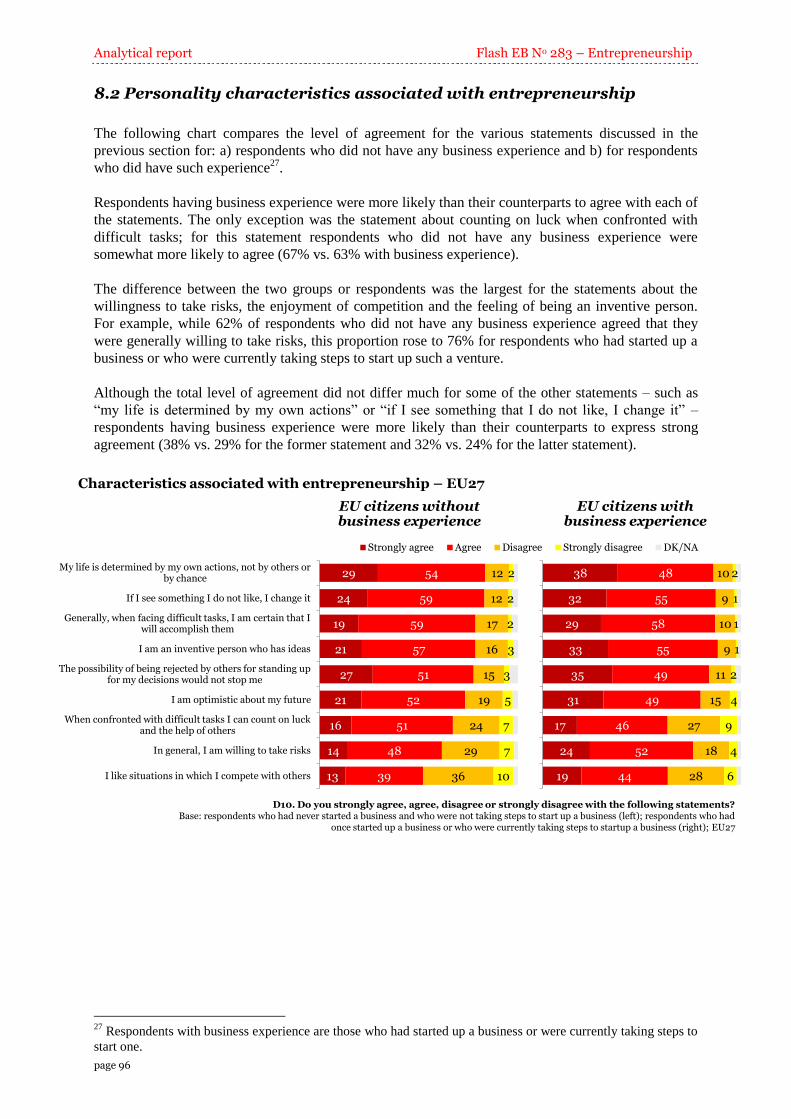
Analytical report Flash EB No 283 – Entrepreneurship
page 96
8.2 Personality characteristics associated with entrepreneurship
The following chart compares the level of agreement for the various statements discussed in the
previous section for: a) respondents who did not have any business experience and b) for respondents
who did have such experience27
.
Respondents having business experience were more likely than their counterparts to agree with each of
the statements. The only exception was the statement about counting on luck when confronted with
difficult tasks; for this statement respondents who did not have any business experience were
somewhat more likely to agree (67% vs. 63% with business experience).
The difference between the two groups or respondents was the largest for the statements about the
willingness to take risks, the enjoyment of competition and the feeling of being an inventive person.
For example, while 62% of respondents who did not have any business experience agreed that they
were generally willing to take risks, this proportion rose to 76% for respondents who had started up a
business or who were currently taking steps to start up such a venture.
Although the total level of agreement did not differ much for some of the other statements – such as
“my life is determined by my own actions” or “if I see something that I do not like, I change it” –
respondents having business experience were more likely than their counterparts to express strong
agreement (38% vs. 29% for the former statement and 32% vs. 24% for the latter statement).
Characteristics associated with entrepreneurship – EU27
29
24
19
21
27
21
16
14
13
54
59
59
57
51
52
51
48
39
12
12
17
16
15
19
24
29
36
2
2
2
3
3
5
7
7
10
My life is determined by my own actions, not by others or by chance
If I see something I do not like, I change it
Generally, when facing difficult tasks, I am certain that I will accomplish them
I am an inventive person who has ideas
The possibility of being rejected by others for standing up for my decisions would not stop me
I am optimistic about my future
When confronted with difficult tasks I can count on luck and the help of others
In general, I am willing to take risks
I like situations in which I compete with others
Strongly agree Agree Disagree Strongly disagree DK/NA
D10. Do you strongly agree, agree, disagree or strongly disagree with the following statements?Base: respondents who had never started a business and who were not taking steps to start up a business (left); respondents who had
once started up a business or who were currently taking steps to startup a business (right); EU27
38
32
29
33
35
31
17
24
19
48
55
58
55
49
49
46
52
44
10
9
10
9
11
15
27
18
28
2
1
1
1
2
4
9
4
6
EU citizens without business experience
EU citizens with business experience
27
Respondents with business experience are those who had started up a business or were currently taking steps to
start one.
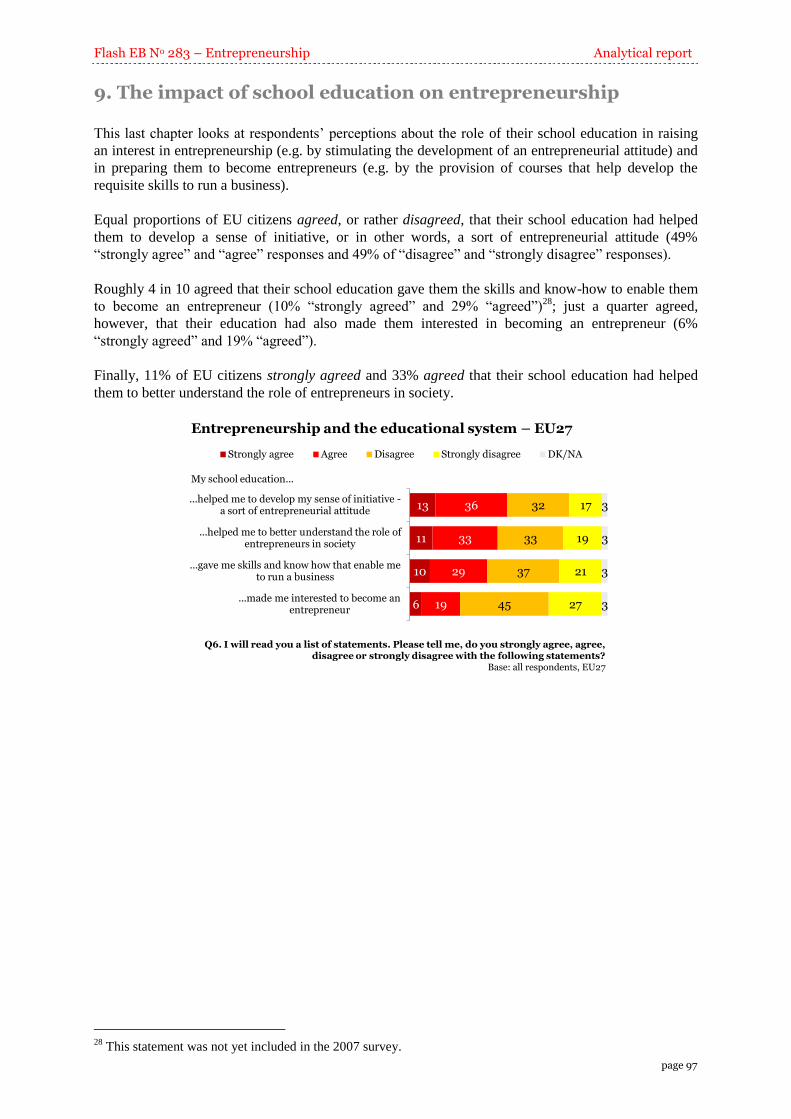
Flash EB No 283 – Entrepreneurship Analytical report
page 97
9. The impact of school education on entrepreneurship
This last chapter looks at respondents’ perceptions about the role of their school education in raising
an interest in entrepreneurship (e.g. by stimulating the development of an entrepreneurial attitude) and
in preparing them to become entrepreneurs (e.g. by the provision of courses that help develop the
requisite skills to run a business).
Equal proportions of EU citizens agreed, or rather disagreed, that their school education had helped
them to develop a sense of initiative, or in other words, a sort of entrepreneurial attitude (49%
“strongly agree” and “agree” responses and 49% of “disagree” and “strongly disagree” responses).
Roughly 4 in 10 agreed that their school education gave them the skills and know-how to enable them
to become an entrepreneur (10% “strongly agreed” and 29% “agreed”)28
; just a quarter agreed,
however, that their education had also made them interested in becoming an entrepreneur (6%
“strongly agreed” and 19% “agreed”).
Finally, 11% of EU citizens strongly agreed and 33% agreed that their school education had helped
them to better understand the role of entrepreneurs in society.
Entrepreneurship and the educational system – EU27
13
11
10
6
36
33
29
19
32
33
37
45
17
19
21
27
3
3
3
3
...helped me to develop my sense of initiative -a sort of entrepreneurial attitude
...helped me to better understand the role of entrepreneurs in society
...gave me skills and know how that enable me to run a business
...made me interested to become an entrepreneur
Strongly agree Agree Disagree Strongly disagree DK/NA
My school education...
Q6. I will read you a list of statements. Please tell me, do you strongly agree, agree, disagree or strongly disagree with the following statements?
Base: all respondents, EU27
28
This statement was not yet included in the 2007 survey.
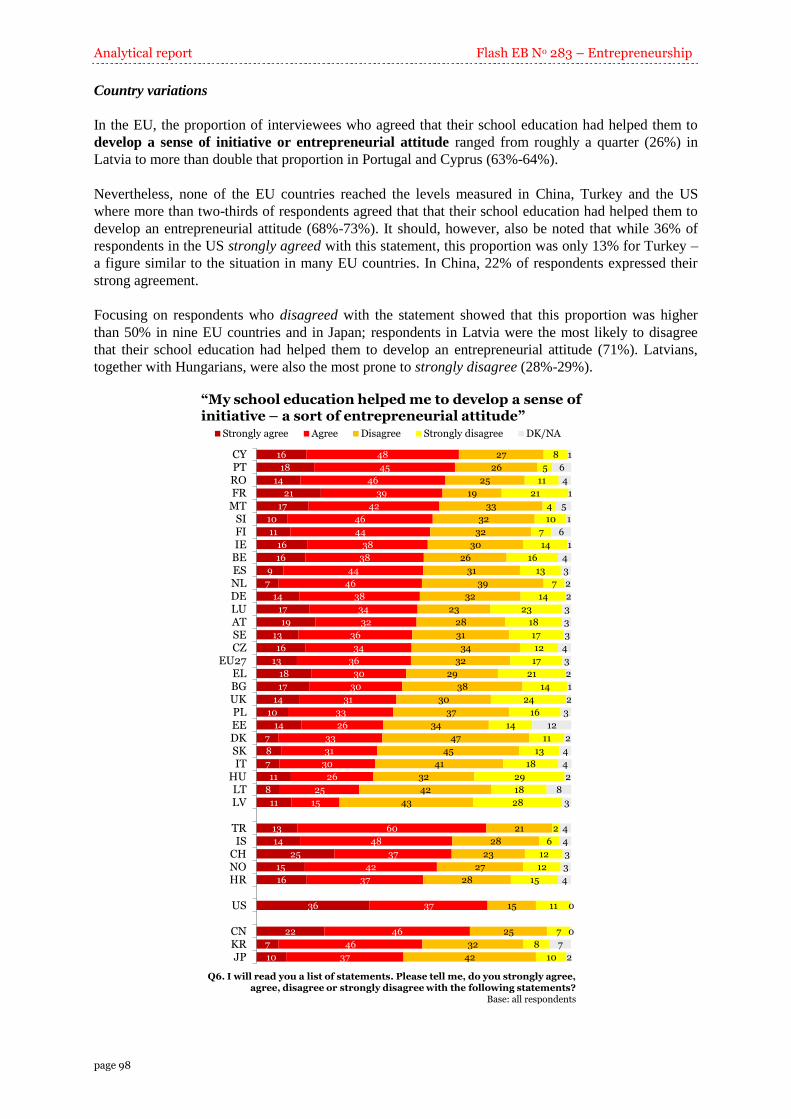
Analytical report Flash EB No 283 – Entrepreneurship
page 98
Country variations
In the EU, the proportion of interviewees who agreed that their school education had helped them to
develop a sense of initiative or entrepreneurial attitude ranged from roughly a quarter (26%) in
Latvia to more than double that proportion in Portugal and Cyprus (63%-64%).
Nevertheless, none of the EU countries reached the levels measured in China, Turkey and the US
where more than two-thirds of respondents agreed that that their school education had helped them to
develop an entrepreneurial attitude (68%-73%). It should, however, also be noted that while 36% of
respondents in the US strongly agreed with this statement, this proportion was only 13% for Turkey –
a figure similar to the situation in many EU countries. In China, 22% of respondents expressed their
strong agreement.
Focusing on respondents who disagreed with the statement showed that this proportion was higher
than 50% in nine EU countries and in Japan; respondents in Latvia were the most likely to disagree
that their school education had helped them to develop an entrepreneurial attitude (71%). Latvians,
together with Hungarians, were also the most prone to strongly disagree (28%-29%).
“My school education helped me to develop a sense of initiative – a sort of entrepreneurial attitude”
16
18
14
21
17
10
11
16
16
9
7
14
17
19
13
16
13
18
17
14
10
14
7
8
7
11
8
11
13
14
25
15
16
36
22
7
10
48
45
46
39
42
46
44
38
38
44
46
38
34
32
36
34
36
30
30
31
33
26
33
31
30
26
25
15
60
48
37
42
37
37
46
46
37
27
26
25
19
33
32
32
30
26
31
39
32
23
28
31
34
32
29
38
30
37
34
47
45
41
32
42
43
21
28
23
27
28
15
25
32
42
8
5
11
21
4
10
7
14
16
13
7
14
23
18
17
12
17
21
14
24
16
14
11
13
18
29
18
28
2
6
12
12
15
11
7
8
10
1
6
4
1
5
1
6
1
4
3
2
2
3
3
3
4
3
2
1
2
3
12
2
4
4
2
8
3
4
4
3
3
4
0
0
7
2
CYPTROFR
MTSIFIIE
BEESNLDELUATSECZ
EU27ELBGUKPLEEDKSKIT
HULTLV
TRIS
CHNOHR
US
CNKRJP
Strongly agree Agree Disagree Strongly disagree DK/NA
Q6. I will read you a list of statements. Please tell me, do you strongly agree, agree, disagree or strongly disagree with the following statements?
Base: all respondents
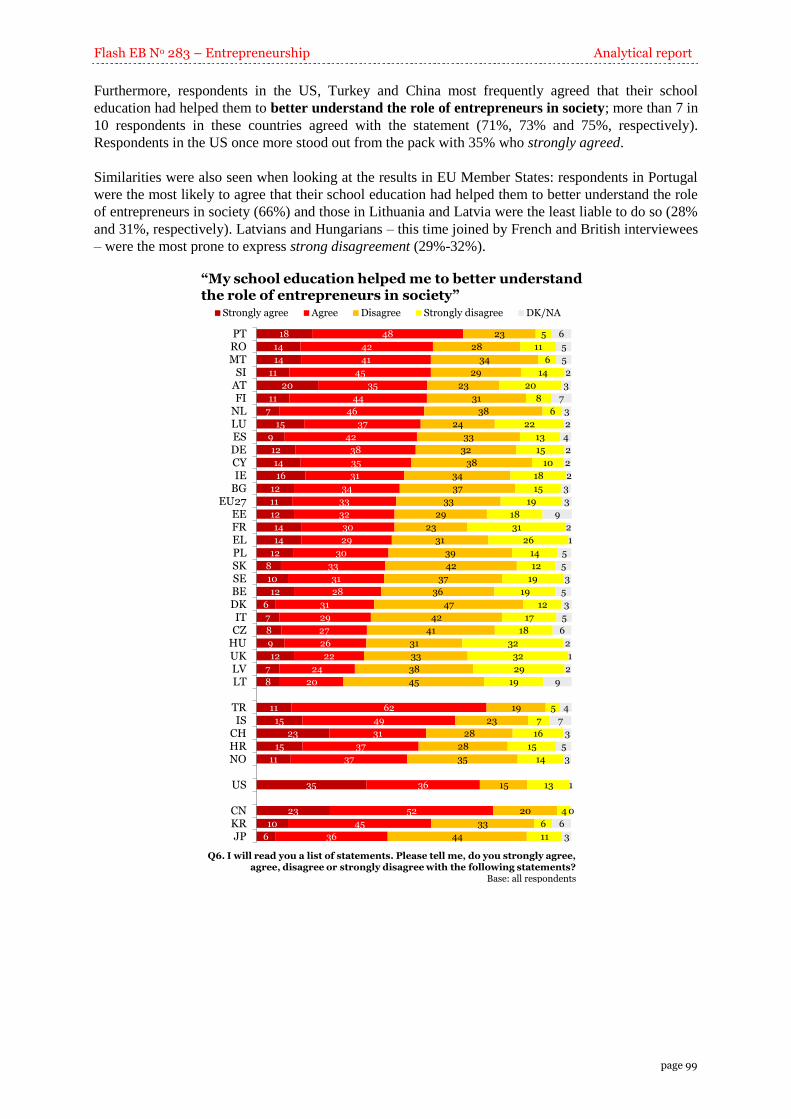
Flash EB No 283 – Entrepreneurship Analytical report
page 99
Furthermore, respondents in the US, Turkey and China most frequently agreed that their school
education had helped them to better understand the role of entrepreneurs in society; more than 7 in
10 respondents in these countries agreed with the statement (71%, 73% and 75%, respectively).
Respondents in the US once more stood out from the pack with 35% who strongly agreed.
Similarities were also seen when looking at the results in EU Member States: respondents in Portugal
were the most likely to agree that their school education had helped them to better understand the role
of entrepreneurs in society (66%) and those in Lithuania and Latvia were the least liable to do so (28%
and 31%, respectively). Latvians and Hungarians – this time joined by French and British interviewees
– were the most prone to express strong disagreement (29%-32%).
“My school education helped me to better understand the role of entrepreneurs in society”
18
14
14
11
20
11
7
15
9
12
14
16
12
11
12
14
14
12
8
10
12
6
7
8
9
12
7
8
11
15
23
15
11
35
23
10
6
48
42
41
45
35
44
46
37
42
38
35
31
34
33
32
30
29
30
33
31
28
31
29
27
26
22
24
20
62
49
31
37
37
36
52
45
36
23
28
34
29
23
31
38
24
33
32
38
34
37
33
29
23
31
39
42
37
36
47
42
41
31
33
38
45
19
23
28
28
35
15
20
33
44
5
11
6
14
20
8
6
22
13
15
10
18
15
19
18
31
26
14
12
19
19
12
17
18
32
32
29
19
5
7
16
15
14
13
4
6
11
6
5
5
2
3
7
3
2
4
2
2
2
3
3
9
2
1
5
5
3
5
3
5
6
2
1
2
9
4
7
3
5
3
1
0
6
3
PTROMT
SIATFI
NLLUESDECYIE
BGEU27
EEFRELPLSKSEBEDKIT
CZHUUKLVLT
TRIS
CHHRNO
US
CNKRJP
Strongly agree Agree Disagree Strongly disagree DK/NA
Q6. I will read you a list of statements. Please tell me, do you strongly agree, agree, disagree or strongly disagree with the following statements?
Base: all respondents
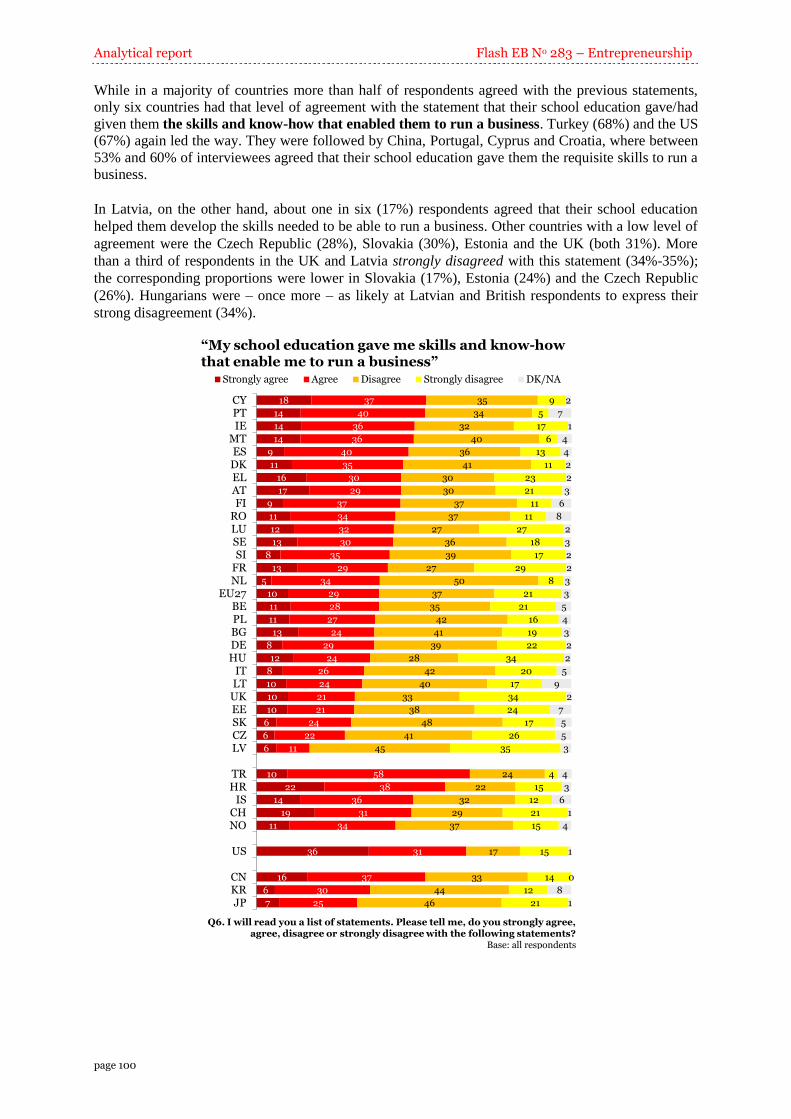
Analytical report Flash EB No 283 – Entrepreneurship
page 100
While in a majority of countries more than half of respondents agreed with the previous statements,
only six countries had that level of agreement with the statement that their school education gave/had
given them the skills and know-how that enabled them to run a business. Turkey (68%) and the US
(67%) again led the way. They were followed by China, Portugal, Cyprus and Croatia, where between
53% and 60% of interviewees agreed that their school education gave them the requisite skills to run a
business.
In Latvia, on the other hand, about one in six (17%) respondents agreed that their school education
helped them develop the skills needed to be able to run a business. Other countries with a low level of
agreement were the Czech Republic (28%), Slovakia (30%), Estonia and the UK (both 31%). More
than a third of respondents in the UK and Latvia strongly disagreed with this statement (34%-35%);
the corresponding proportions were lower in Slovakia (17%), Estonia (24%) and the Czech Republic
(26%). Hungarians were – once more – as likely at Latvian and British respondents to express their
strong disagreement (34%).
“My school education gave me skills and know-how that enable me to run a business”
18
14
14
14
9
11
16
17
9
11
12
13
8
13
5
10
11
11
13
8
12
8
10
10
10
6
6
6
10
22
14
19
11
36
16
6
7
37
40
36
36
40
35
30
29
37
34
32
30
35
29
34
29
28
27
24
29
24
26
24
21
21
24
22
11
58
38
36
31
34
31
37
30
25
35
34
32
40
36
41
30
30
37
37
27
36
39
27
50
37
35
42
41
39
28
42
40
33
38
48
41
45
24
22
32
29
37
17
33
44
46
9
5
17
6
13
11
23
21
11
11
27
18
17
29
8
21
21
16
19
22
34
20
17
34
24
17
26
35
4
15
12
21
15
15
14
12
21
2
7
1
4
4
2
2
3
6
8
2
3
2
2
3
3
5
4
3
2
2
5
9
2
7
5
5
3
4
3
6
1
4
1
0
8
1
CYPTIE
MTESDKELATFI
ROLUSESI
FRNL
EU27BEPLBGDEHU
ITLT
UKEESKCZLV
TRHR
ISCHNO
US
CNKRJP
Strongly agree Agree Disagree Strongly disagree DK/NA
Q6. I will read you a list of statements. Please tell me, do you strongly agree, agree, disagree or strongly disagree with the following statements?
Base: all respondents
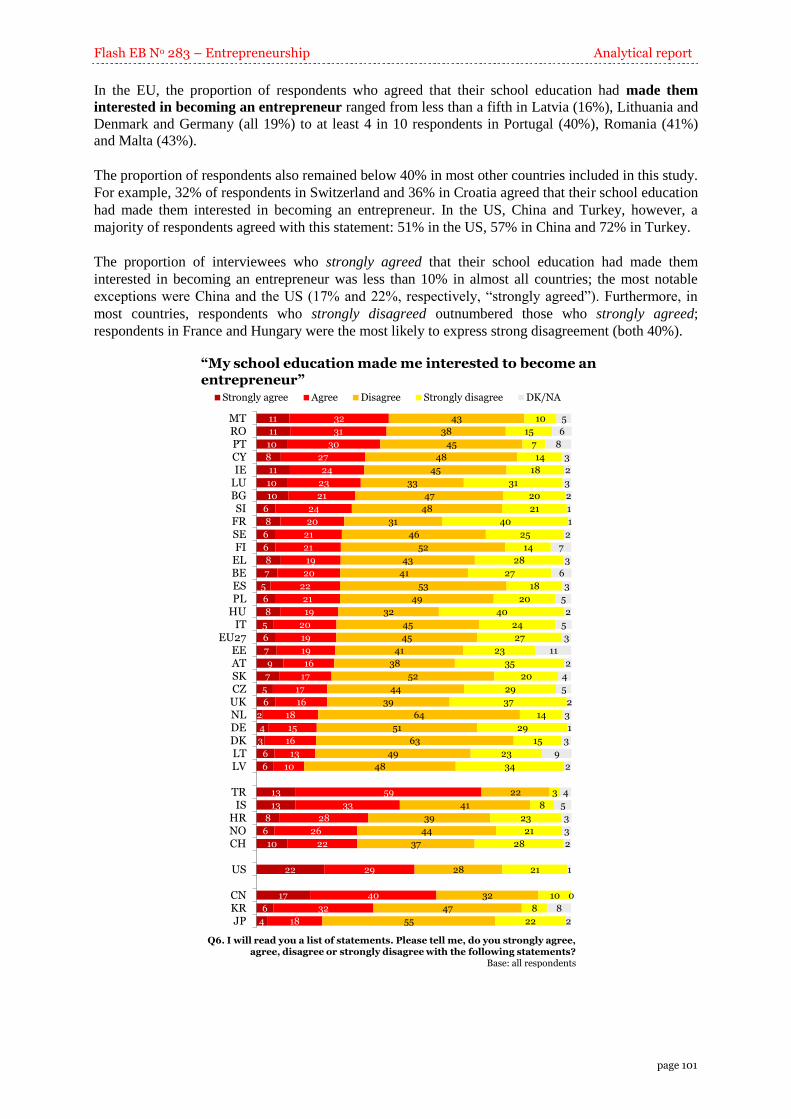
Flash EB No 283 – Entrepreneurship Analytical report
page 101
In the EU, the proportion of respondents who agreed that their school education had made them
interested in becoming an entrepreneur ranged from less than a fifth in Latvia (16%), Lithuania and
Denmark and Germany (all 19%) to at least 4 in 10 respondents in Portugal (40%), Romania (41%)
and Malta (43%).
The proportion of respondents also remained below 40% in most other countries included in this study.
For example, 32% of respondents in Switzerland and 36% in Croatia agreed that their school education
had made them interested in becoming an entrepreneur. In the US, China and Turkey, however, a
majority of respondents agreed with this statement: 51% in the US, 57% in China and 72% in Turkey.
The proportion of interviewees who strongly agreed that their school education had made them
interested in becoming an entrepreneur was less than 10% in almost all countries; the most notable
exceptions were China and the US (17% and 22%, respectively, “strongly agreed”). Furthermore, in
most countries, respondents who strongly disagreed outnumbered those who strongly agreed;
respondents in France and Hungary were the most likely to express strong disagreement (both 40%).
“My school education made me interested to become an entrepreneur”
11
11
10
8
11
10
10
6
8
6
6
8
7
5
6
8
5
6
7
9
7
5
6
2
4
3
6
6
13
13
8
6
10
22
17
6
4
32
31
30
27
24
23
21
24
20
21
21
19
20
22
21
19
20
19
19
16
17
17
16
18
15
16
13
10
59
33
28
26
22
29
40
32
18
43
38
45
48
45
33
47
48
31
46
52
43
41
53
49
32
45
45
41
38
52
44
39
64
51
63
49
48
22
41
39
44
37
28
32
47
55
10
15
7
14
18
31
20
21
40
25
14
28
27
18
20
40
24
27
23
35
20
29
37
14
29
15
23
34
3
8
23
21
28
21
10
8
22
5
6
8
3
2
3
2
1
1
2
7
3
6
3
5
2
5
3
11
2
4
5
2
3
1
3
9
2
4
5
3
3
2
1
0
8
2
MTROPTCYIE
LUBGSI
FRSEFI
ELBEESPL
HUIT
EU27EEATSKCZUKNLDEDKLTLV
TRIS
HRNOCH
US
CNKRJP
Strongly agree Agree Disagree Strongly disagree DK/NA
Q6. I will read you a list of statements. Please tell me, do you strongly agree, agree, disagree or strongly disagree with the following statements?
Base: all respondents
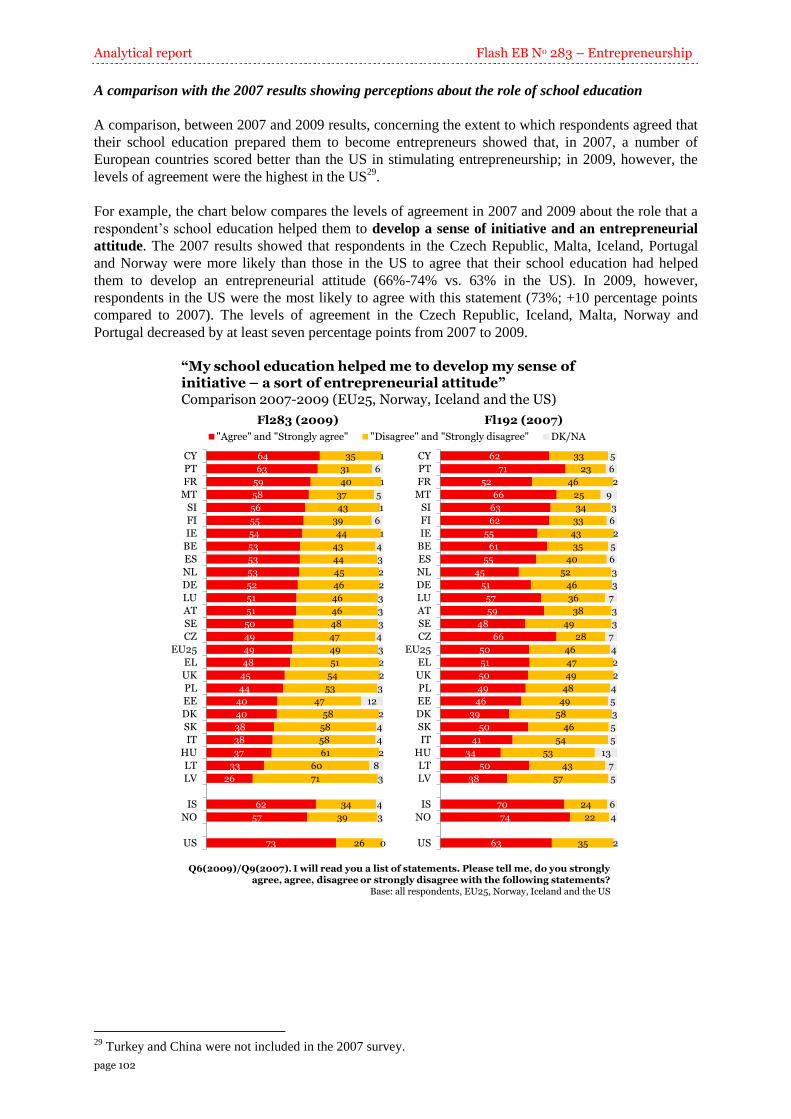
Analytical report Flash EB No 283 – Entrepreneurship
page 102
A comparison with the 2007 results showing perceptions about the role of school education
A comparison, between 2007 and 2009 results, concerning the extent to which respondents agreed that
their school education prepared them to become entrepreneurs showed that, in 2007, a number of
European countries scored better than the US in stimulating entrepreneurship; in 2009, however, the
levels of agreement were the highest in the US29
.
For example, the chart below compares the levels of agreement in 2007 and 2009 about the role that a
respondent’s school education helped them to develop a sense of initiative and an entrepreneurial
attitude. The 2007 results showed that respondents in the Czech Republic, Malta, Iceland, Portugal
and Norway were more likely than those in the US to agree that their school education had helped
them to develop an entrepreneurial attitude (66%-74% vs. 63% in the US). In 2009, however,
respondents in the US were the most likely to agree with this statement (73%; +10 percentage points
compared to 2007). The levels of agreement in the Czech Republic, Iceland, Malta, Norway and
Portugal decreased by at least seven percentage points from 2007 to 2009.
64
63
59
58
56
55
54
53
53
53
52
51
51
50
49
49
48
45
44
40
40
38
38
37
33
26
62
57
73
35
31
40
37
43
39
44
43
44
45
46
46
46
48
47
49
51
54
53
47
58
58
58
61
60
71
34
39
26
1
6
1
5
1
6
1
4
3
2
2
3
3
3
4
3
2
2
3
12
2
4
4
2
8
3
4
3
0
CY
PT
FR
MT
SI
FI
IE
BE
ES
NL
DE
LU
AT
SE
CZ
EU25
EL
UK
PL
EE
DK
SK
IT
HU
LT
LV
IS
NO
US
"Agree" and "Strongly agree" "Disagree" and "Strongly disagree" DK/NA
62
71
52
66
63
62
55
61
55
45
51
57
59
48
66
50
51
50
49
46
39
50
41
34
50
38
70
74
63
33
23
46
25
34
33
43
35
40
52
46
36
38
49
28
46
47
49
48
49
58
46
54
53
43
57
24
22
35
5
6
2
9
3
6
2
5
6
3
3
7
3
3
7
4
2
2
4
5
3
5
5
13
7
5
6
4
2
CY
PT
FR
MT
SI
FI
IE
BE
ES
NL
DE
LU
AT
SE
CZ
EU25
EL
UK
PL
EE
DK
SK
IT
HU
LT
LV
IS
NO
US
“My school education helped me to develop my sense of initiative – a sort of entrepreneurial attitude”Comparison 2007-2009 (EU25, Norway, Iceland and the US)
Q6(2009)/Q9(2007). I will read you a list of statements. Please tell me, do you strongly agree, agree, disagree or strongly disagree with the following statements?
Base: all respondents, EU25, Norway, Iceland and the US
Fl283 (2009) Fl192 (2007)
29
Turkey and China were not included in the 2007 survey.
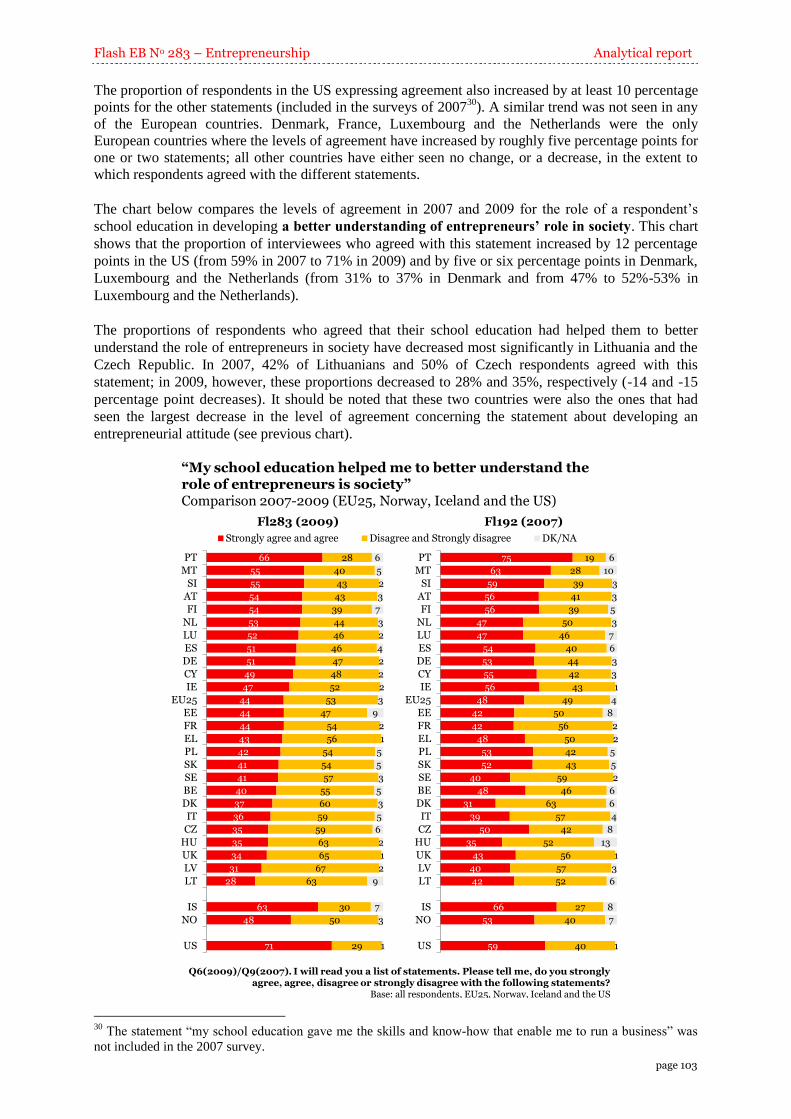
Flash EB No 283 – Entrepreneurship Analytical report
page 103
The proportion of respondents in the US expressing agreement also increased by at least 10 percentage
points for the other statements (included in the surveys of 200730
). A similar trend was not seen in any
of the European countries. Denmark, France, Luxembourg and the Netherlands were the only
European countries where the levels of agreement have increased by roughly five percentage points for
one or two statements; all other countries have either seen no change, or a decrease, in the extent to
which respondents agreed with the different statements.
The chart below compares the levels of agreement in 2007 and 2009 for the role of a respondent’s
school education in developing a better understanding of entrepreneurs’ role in society. This chart
shows that the proportion of interviewees who agreed with this statement increased by 12 percentage
points in the US (from 59% in 2007 to 71% in 2009) and by five or six percentage points in Denmark,
Luxembourg and the Netherlands (from 31% to 37% in Denmark and from 47% to 52%-53% in
Luxembourg and the Netherlands).
The proportions of respondents who agreed that their school education had helped them to better
understand the role of entrepreneurs in society have decreased most significantly in Lithuania and the
Czech Republic. In 2007, 42% of Lithuanians and 50% of Czech respondents agreed with this
statement; in 2009, however, these proportions decreased to 28% and 35%, respectively (-14 and -15
percentage point decreases). It should be noted that these two countries were also the ones that had
seen the largest decrease in the level of agreement concerning the statement about developing an
entrepreneurial attitude (see previous chart).
66
55
55
54
54
53
52
51
51
49
47
44
44
44
43
42
41
41
40
37
36
35
35
34
31
28
63
48
71
28
40
43
43
39
44
46
46
47
48
52
53
47
54
56
54
54
57
55
60
59
59
63
65
67
63
30
50
29
6
5
2
3
7
3
2
4
2
2
2
3
9
2
1
5
5
3
5
3
5
6
2
1
2
9
7
3
1
PT
MT
SI
AT
FI
NL
LU
ES
DE
CY
IE
EU25
EE
FR
EL
PL
SK
SE
BE
DK
IT
CZ
HU
UK
LV
LT
IS
NO
US
Strongly agree and agree Disagree and Strongly disagree DK/NA
75
63
59
56
56
47
47
54
53
55
56
48
42
42
48
53
52
40
48
31
39
50
35
43
40
42
66
53
59
19
28
39
41
39
50
46
40
44
42
43
49
50
56
50
42
43
59
46
63
57
42
52
56
57
52
27
40
40
6
10
3
3
5
3
7
6
3
3
1
4
8
2
2
5
5
2
6
6
4
8
13
1
3
6
8
7
1
PT
MT
SI
AT
FI
NL
LU
ES
DE
CY
IE
EU25
EE
FR
EL
PL
SK
SE
BE
DK
IT
CZ
HU
UK
LV
LT
IS
NO
US
“My school education helped me to better understand the role of entrepreneurs is society” Comparison 2007-2009 (EU25, Norway, Iceland and the US)
Q6(2009)/Q9(2007). I will read you a list of statements. Please tell me, do you strongly agree, agree, disagree or strongly disagree with the following statements?
Base: all respondents, EU25, Norway, Iceland and the US
Fl283 (2009) Fl192 (2007)
30
The statement “my school education gave me the skills and know-how that enable me to run a business” was
not included in the 2007 survey.
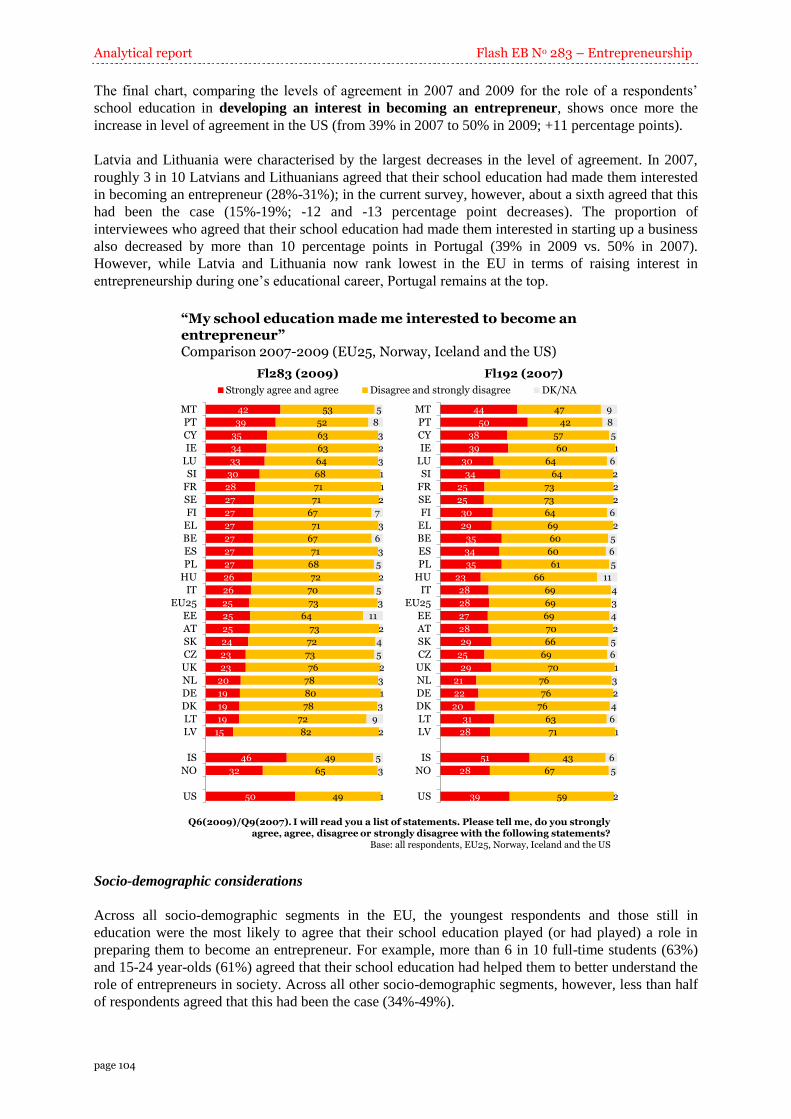
Analytical report Flash EB No 283 – Entrepreneurship
page 104
The final chart, comparing the levels of agreement in 2007 and 2009 for the role of a respondents’
school education in developing an interest in becoming an entrepreneur, shows once more the
increase in level of agreement in the US (from 39% in 2007 to 50% in 2009; +11 percentage points).
Latvia and Lithuania were characterised by the largest decreases in the level of agreement. In 2007,
roughly 3 in 10 Latvians and Lithuanians agreed that their school education had made them interested
in becoming an entrepreneur (28%-31%); in the current survey, however, about a sixth agreed that this
had been the case (15%-19%; -12 and -13 percentage point decreases). The proportion of
interviewees who agreed that their school education had made them interested in starting up a business
also decreased by more than 10 percentage points in Portugal (39% in 2009 vs. 50% in 2007).
However, while Latvia and Lithuania now rank lowest in the EU in terms of raising interest in
entrepreneurship during one’s educational career, Portugal remains at the top.
42
39
35
34
33
30
28
27
27
27
27
27
27
26
26
25
25
25
24
23
23
20
19
19
19
15
46
32
50
53
52
63
63
64
68
71
71
67
71
67
71
68
72
70
73
64
73
72
73
76
78
80
78
72
82
49
65
49
5
8
3
2
3
1
1
2
7
3
6
3
5
2
5
3
11
2
4
5
2
3
1
3
9
2
5
3
1
MT
PT
CY
IE
LU
SI
FR
SE
FI
EL
BE
ES
PL
HU
IT
EU25
EE
AT
SK
CZ
UK
NL
DE
DK
LT
LV
IS
NO
US
Strongly agree and agree Disagree and strongly disagree DK/NA
44
50
38
39
30
34
25
25
30
29
35
34
35
23
28
28
27
28
29
25
29
21
22
20
31
28
51
28
39
47
42
57
60
64
64
73
73
64
69
60
60
61
66
69
69
69
70
66
69
70
76
76
76
63
71
43
67
59
9
8
5
1
6
2
2
2
6
2
5
6
5
11
4
3
4
2
5
6
1
3
2
4
6
1
6
5
2
MT
PT
CY
IE
LU
SI
FR
SE
FI
EL
BE
ES
PL
HU
IT
EU25
EE
AT
SK
CZ
UK
NL
DE
DK
LT
LV
IS
NO
US
“My school education made me interested to become an entrepreneur”Comparison 2007-2009 (EU25, Norway, Iceland and the US)
Q6(2009)/Q9(2007). I will read you a list of statements. Please tell me, do you strongly agree, agree, disagree or strongly disagree with the following statements?
Base: all respondents, EU25, Norway, Iceland and the US
Fl283 (2009) Fl192 (2007)
Socio-demographic considerations
Across all socio-demographic segments in the EU, the youngest respondents and those still in
education were the most likely to agree that their school education played (or had played) a role in
preparing them to become an entrepreneur. For example, more than 6 in 10 full-time students (63%)
and 15-24 year-olds (61%) agreed that their school education had helped them to better understand the
role of entrepreneurs in society. Across all other socio-demographic segments, however, less than half
of respondents agreed that this had been the case (34%-49%).
Flash EB No 283 – Entrepreneurship Analytical report
page 105
Respondents with a lower socio-demographic profile, those with a low level of education and
respondents who found it difficult to manage on their current household income, were the least likely
to agree with each of the statements about the role of education in stimulating entrepreneurship. For
example, while 26% of respondents with the lowest level of education agreed that their school
education had given them the skills and know-how to run a business, the level of agreement was
almost twice as high among respondents with the highest level of education (49%). Similarly, while
43% of interviewees who found it very hard to manage on their current household income agreed that
their school education had helped them to develop a sense of initiative and an entrepreneurial attitude,
this proportion was 55% for respondents who could live comfortably on their current income.
Employees and self-employed respondents were as likely to agree that their school education had
helped them to develop an entrepreneurial attitude (both 51%) or had taught them to understand the
role of entrepreneurs in society (both 43%). The latter were, nevertheless, more likely to agree that
their school education had encouraged them to become interested in being an entrepreneur (36% vs.
22% for employees) and had helped them to develop the requisite skills to run a business (47% vs.
41%).
For more details, see annex tables 6b through 9b.
Flash EB Series #283
Entrepreneurship in
the EU and beyond
Annex
tables and survey details
THE GALLUP ORGANIZATION
Flash EB No 283 – Entrepreneurship Annex
page 107
I. Annex tables
Table 1a. The choice of status: self-employed or employee – by country.......................................... 110
Table 1b. The choice of status: self-employed or employee – by segment ........................................ 111
Table 2a. Preference for employee status – by country ...................................................................... 112
Table 2b. Preference for employee status – by segment ..................................................................... 113
Table 3a. Preference for self-employment– by country...................................................................... 114
Table 3b. Preference for self-employment – by segment ................................................................... 115
Table 4a. The feasibility of becoming self-employed – by country ................................................... 116
Table 4b. The feasibility of becoming self-employed – by segment .................................................. 117
Table 5a. Reasons why it is not feasible to become self-employed within the next five years – by
country ............................................................................................................................... 118
Table 5b. Reasons why it is not feasible to become self-employed within the next five years – by
segment ............................................................................................................................... 119
Table 6a. My school education helped me to develop a sense of initiative – a sort of
entrepreneurial attitude – by country .................................................................................. 120
Table 6b. My school education helped me to develop a sense of initiative – a sort of
entrepreneurial attitude – by segment ................................................................................. 121
Table 7a. My school education helped me to better understand the role of entrepreneurs in
society – by country ........................................................................................................... 122
Table 7b. My school education helped me to better understand the role of entrepreneurs in
society – by segment ........................................................................................................... 123
Table 8a. My school education made me interested to become an entrepreneur – by country .......... 124
Table 8b. My school education made me interested to become an entrepreneur – by segment ......... 125
Table 9a. My school education gave me skills and know-how that enable me to run a business –
by country ........................................................................................................................... 126
Table 9b. My school education gave me skills and know-how that enable me to run a business –
by segment .......................................................................................................................... 127
Table 10a. Entrepreneurs create new products and services and benefit us all – by country ............. 128
Table 10b. Entrepreneurs create new products and services and benefit us all – by segment ............ 129
Table 11a. Entrepreneurs think only about their own wallet – by country ......................................... 130
Table 11b. Entrepreneurs think only about their own wallet – by segment ........................................ 131
Table 12a. Entrepreneurs are job creators – by country ..................................................................... 132
Table 12b. Entrepreneurs are job creators – by segment .................................................................... 133
Table 13a. Entrepreneurs exploit other people's work – by country................................................... 134
Table 13b. Entrepreneurs exploit other people's work – by segment ................................................. 135
Table 14a. Experience of starting up a business – by country ............................................................ 136
Table 14b. Experience of starting up a business – by segment ........................................................... 137
Table 14c. Experience in setting up a business (all respondents) – by segment ................................. 138
Table 15a. Experience of starting up a business: the current situation (part a) – by country ............. 139
Table 15b. Experience of starting up a business: the current situation (part a) – by segment ............ 140
Table 16a. Experience of starting up a business: the current situation (part b) – by country ............. 141
Annex Flash EB No 283 – Entrepreneurship
page 108
Table 16b. Experience in setting up a business: the current situation (part b) – by segment ............. 142
Table 17a. Dissatisfaction with regard to your previous situation – by country ................................ 143
Table 17b. Dissatisfaction with regard to your previous situation – by segment ............................... 144
Table 18a. An appropriate business idea – by country ....................................................................... 145
Table 18b. An appropriate business idea – by segment ...................................................................... 146
Table 19a. Contact with an appropriate business partner – by country .............................................. 147
Table 19b. Contact with an appropriate business partner – by segment ............................................. 148
Table 20a. Receiving the necessary financial means – by country ..................................................... 149
Table 20b. Receiving the necessary financial means – by segment ................................................... 150
Table 21a. A role model – by country ................................................................................................ 151
Table 21b. A role model – by segment ............................................................................................... 152
Table 22a. Addressing an unmet social or ecological need – by country ........................................... 153
Table 22b. Addressing an unmet social or ecological need – by segment .......................................... 154
Table 23a. Opportunity or necessity – by country .............................................................................. 155
Table 23b. Opportunity or necessity – by segment ............................................................................. 156
Table 24a. Setting up a new business or taking over an existing one – by country ............................ 157
Table 24b. Setting up a new business or taking over an existing one – by segment .......................... 158
Table 25a. Greatest fears when starting up a business – first selection – by country ......................... 159
Table 25b. Greatest fears when starting up a business – first selection – by segment ........................ 160
Table 26a. Greatest fears when starting up a business – second selection – by country .................... 161
Table 26b. Greatest fears when starting up a business – second selection – by segment ................... 162
Table 27a. Image of entrepreneurs – by country ................................................................................ 163
Table 27b. Image of entrepreneurs – by segment ............................................................................... 164
Table 28a. Image of civil servants – by country ................................................................................. 165
Table 28b. Image of civil servants – by segment ................................................................................ 166
Table 29a. Image of top-managers in large production companies – by country ............................... 167
Table 29b. Image of top-managers in large production companies – by segment .............................. 168
Table 30a. Image of managers in a bank or a similar institution – by country ................................... 169
Table 30b. Image of managers in a bank or a similar institution – by segment .................................. 170
Table 31a. Image of politicians – by country ..................................................................................... 171
Table 31b. Image of politicians – by segment .................................................................................... 172
Table 32a. Image of liberal professions (architects, lawyers, artists etc.) – by country ..................... 173
Table 32b. Image of liberal professions (architects, lawyers, artists etc.) – by segment .................... 174
Table 33a. What would people do if they inherited a significant amount of money? – by country ... 175
Table 33b. What would people do if they inherited a significant amount of money? – by segment .. 176
Table 34a. Advice for a friend who just started a business – by country ........................................... 177
Table 34b. Advice for a friend who just started a business – by segment .......................................... 178
Table 35a. It is difficult to start one's own business due to a lack of available financial support –
by country ........................................................................................................................... 179
Flash EB No 283 – Entrepreneurship Annex
page 109
Table 35b. It is difficult to start one's own business due to a lack of available financial support –
by segment .......................................................................................................................... 180
Table 36a. It is difficult to start one's own business due to the complex administrative
procedures – by country ..................................................................................................... 181
Table 36b. It is difficult to start one's own business due to the complex administrative
procedures – by segment .................................................................................................... 182
Table 37a. It is difficult to obtain sufficient information on how to start a business – by country .... 183
Table 37b. It is difficult to obtain sufficient information on how to start a business – by segment ... 184
Table 38a. One should not start a business if there is a risk it might fail – by country ...................... 185
Table 39b. People who have started their own business and have failed should be given a second
chance – by segment ........................................................................................................... 186
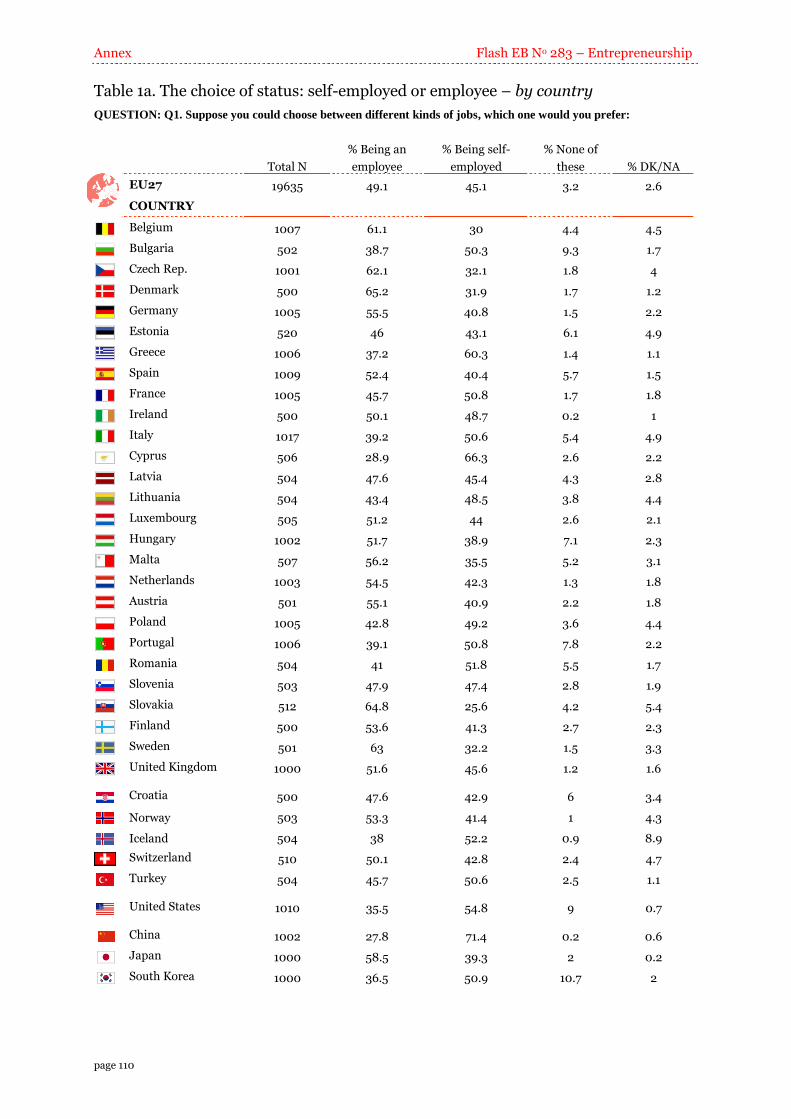
Annex Flash EB No 283 – Entrepreneurship
page 110
Table 1a. The choice of status: self-employed or employee – by country
QUESTION: Q1. Suppose you could choose between different kinds of jobs, which one would you prefer:
Total N
% Being an
employee
% Being self-
employed
% None of
these % DK/NA
EU27 19635 49.1 45.1 3.2 2.6
COUNTRY
Belgium 1007 61.1 30 4.4 4.5
Bulgaria 502 38.7 50.3 9.3 1.7
Czech Rep. 1001 62.1 32.1 1.8 4
Denmark 500 65.2 31.9 1.7 1.2
Germany 1005 55.5 40.8 1.5 2.2
Estonia 520 46 43.1 6.1 4.9
Greece 1006 37.2 60.3 1.4 1.1
Spain 1009 52.4 40.4 5.7 1.5
France 1005 45.7 50.8 1.7 1.8
Ireland 500 50.1 48.7 0.2 1
Italy 1017 39.2 50.6 5.4 4.9
Cyprus 506 28.9 66.3 2.6 2.2
Latvia 504 47.6 45.4 4.3 2.8
Lithuania 504 43.4 48.5 3.8 4.4
Luxembourg 505 51.2 44 2.6 2.1
Hungary 1002 51.7 38.9 7.1 2.3
Malta 507 56.2 35.5 5.2 3.1
Netherlands 1003 54.5 42.3 1.3 1.8
Austria 501 55.1 40.9 2.2 1.8
Poland 1005 42.8 49.2 3.6 4.4
Portugal 1006 39.1 50.8 7.8 2.2
Romania 504 41 51.8 5.5 1.7
Slovenia 503 47.9 47.4 2.8 1.9
Slovakia 512 64.8 25.6 4.2 5.4
Finland 500 53.6 41.3 2.7 2.3
Sweden 501 63 32.2 1.5 3.3
United Kingdom 1000 51.6 45.6 1.2 1.6
Croatia 500 47.6 42.9 6 3.4
Norway 503 53.3 41.4 1 4.3
Iceland 504 38 52.2 0.9 8.9
Switzerland 510 50.1 42.8 2.4 4.7
Turkey 504 45.7 50.6 2.5 1.1
United States 1010 35.5 54.8 9 0.7
China 1002 27.8 71.4 0.2 0.6
Japan 1000 58.5 39.3 2 0.2
South Korea 1000 36.5 50.9 10.7 2
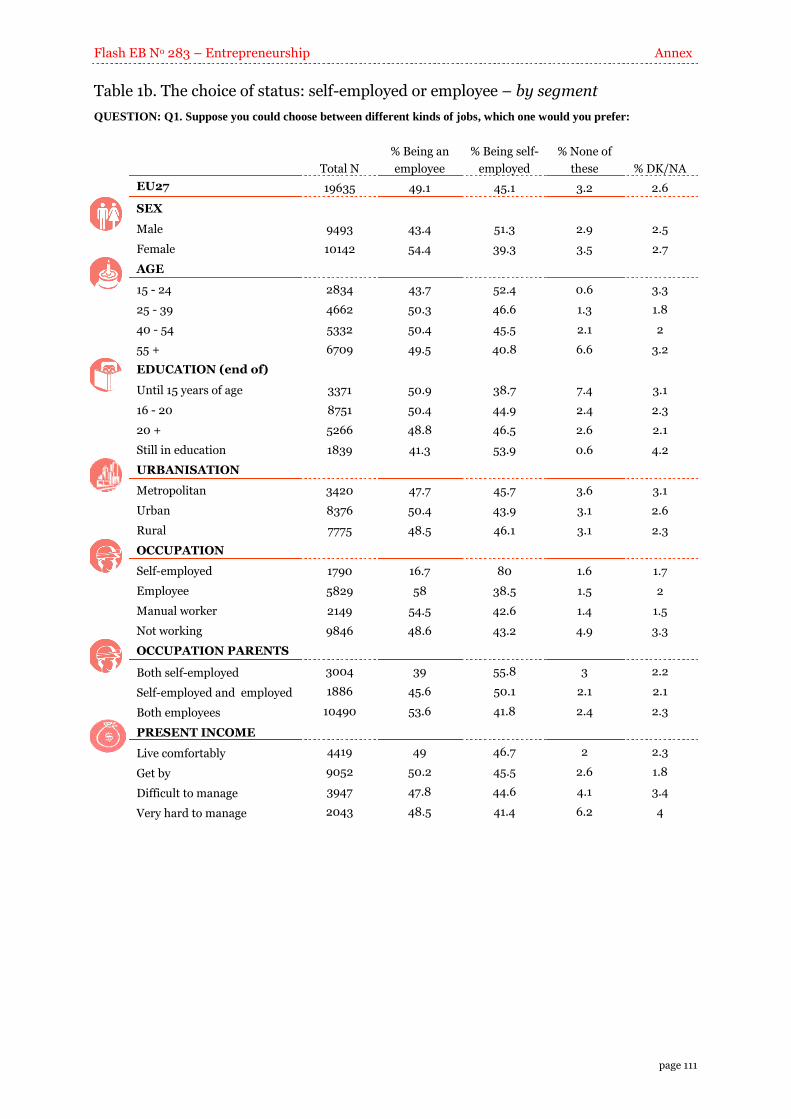
Flash EB No 283 – Entrepreneurship Annex
page 111
Table 1b. The choice of status: self-employed or employee – by segment
QUESTION: Q1. Suppose you could choose between different kinds of jobs, which one would you prefer:
Total N
% Being an
employee
% Being self-
employed
% None of
these % DK/NA
EU27 19635 49.1 45.1 3.2 2.6
SEX
Male 9493 43.4 51.3 2.9 2.5
Female 10142 54.4 39.3 3.5 2.7
AGE
15 - 24 2834 43.7 52.4 0.6 3.3
25 - 39 4662 50.3 46.6 1.3 1.8
40 - 54 5332 50.4 45.5 2.1 2
55 + 6709 49.5 40.8 6.6 3.2
EDUCATION (end of)
Until 15 years of age 3371 50.9 38.7 7.4 3.1
16 - 20 8751 50.4 44.9 2.4 2.3
20 + 5266 48.8 46.5 2.6 2.1
Still in education 1839 41.3 53.9 0.6 4.2
URBANISATION
Metropolitan 3420 47.7 45.7 3.6 3.1
Urban 8376 50.4 43.9 3.1 2.6
Rural 7775 48.5 46.1 3.1 2.3
OCCUPATION
Self-employed 1790 16.7 80 1.6 1.7
Employee 5829 58 38.5 1.5 2
Manual worker 2149 54.5 42.6 1.4 1.5
Not working 9846 48.6 43.2 4.9 3.3
OCCUPATION PARENTS
Both self-employed 3004 39 55.8 3 2.2
Self-employed and employed 1886 45.6 50.1 2.1 2.1
Both employees 10490 53.6 41.8 2.4 2.3
PRESENT INCOME
Live comfortably 4419 49 46.7 2 2.3
Get by 9052 50.2 45.5 2.6 1.8
Difficult to manage 3947 47.8 44.6 4.1 3.4
Very hard to manage 2043 48.5 41.4 6.2 4
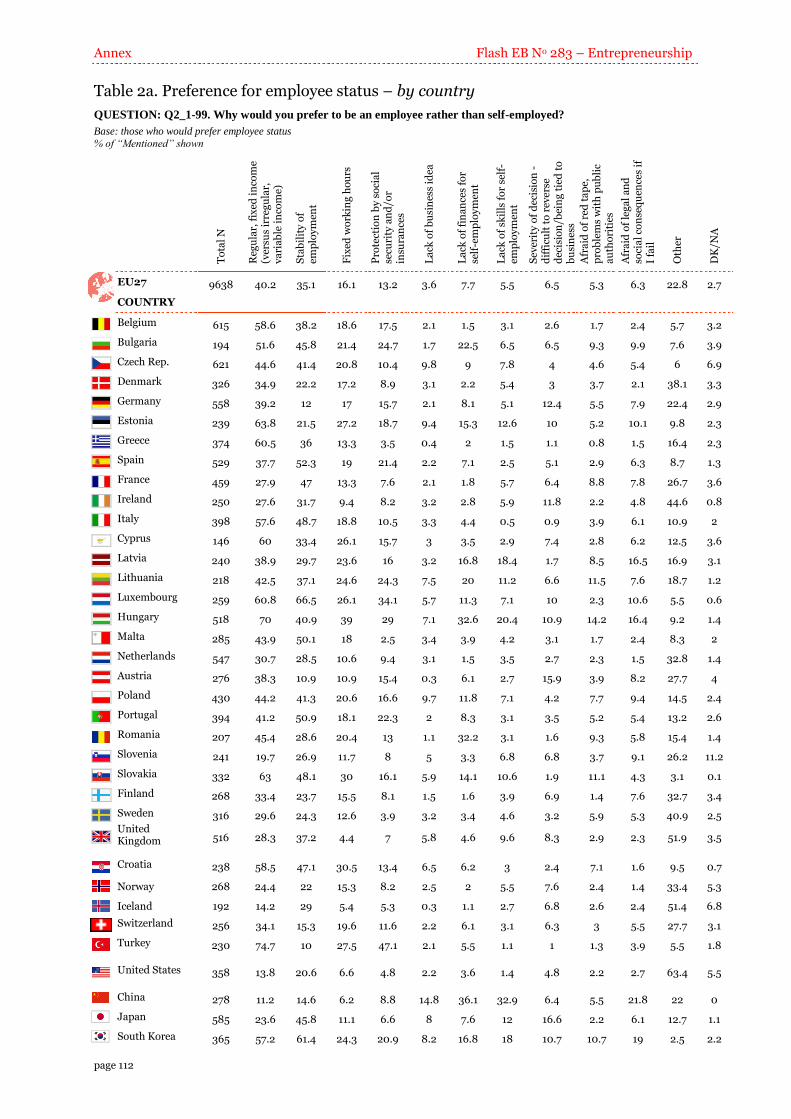
Annex Flash EB No 283 – Entrepreneurship
page 112
Table 2a. Preference for employee status – by country
QUESTION: Q2_1-99. Why would you prefer to be an employee rather than self-employed?
Base: those who would prefer employee status
% of “Mentioned” shown
T
ota
l N
Reg
ula
r, f
ixed
in
com
e (v
ersu
s ir
reg
ula
r,
va
ria
ble
in
com
e)
Sta
bil
ity
of
emp
loy
men
t
Fix
ed w
ork
ing
ho
urs
Pro
tect
ion
by
so
cia
l se
curi
ty a
nd
/or
insu
ran
ces
La
ck o
f b
usi
nes
s id
ea
La
ck o
f fi
na
nce
s fo
r se
lf-e
mp
loy
men
t
La
ck o
f sk
ills
fo
r se
lf-
emp
loy
men
t
Sev
erit
y o
f d
ecis
ion
-
dif
ficu
lt t
o r
ever
se
dec
isio
n/b
ein
g t
ied
to
b
usi
nes
s
Afr
aid
of
red
ta
pe,
p
rob
lem
s w
ith
pu
bli
c a
uth
ori
ties
Afr
aid
of
leg
al
an
d
soci
al
con
seq
uen
ces
if
I fa
il
Oth
er
DK
/NA
EU27 9638 40.2 35.1 16.1 13.2 3.6 7.7 5.5 6.5 5.3 6.3 22.8 2.7
COUNTRY
Belgium 615 58.6 38.2 18.6 17.5 2.1 1.5 3.1 2.6 1.7 2.4 5.7 3.2
Bulgaria 194 51.6 45.8 21.4 24.7 1.7 22.5 6.5 6.5 9.3 9.9 7.6 3.9
Czech Rep. 621 44.6 41.4 20.8 10.4 9.8 9 7.8 4 4.6 5.4 6 6.9
Denmark 326 34.9 22.2 17.2 8.9 3.1 2.2 5.4 3 3.7 2.1 38.1 3.3
Germany 558 39.2 12 17 15.7 2.1 8.1 5.1 12.4 5.5 7.9 22.4 2.9
Estonia 239 63.8 21.5 27.2 18.7 9.4 15.3 12.6 10 5.2 10.1 9.8 2.3
Greece 374 60.5 36 13.3 3.5 0.4 2 1.5 1.1 0.8 1.5 16.4 2.3
Spain 529 37.7 52.3 19 21.4 2.2 7.1 2.5 5.1 2.9 6.3 8.7 1.3
France 459 27.9 47 13.3 7.6 2.1 1.8 5.7 6.4 8.8 7.8 26.7 3.6
Ireland 250 27.6 31.7 9.4 8.2 3.2 2.8 5.9 11.8 2.2 4.8 44.6 0.8
Italy 398 57.6 48.7 18.8 10.5 3.3 4.4 0.5 0.9 3.9 6.1 10.9 2
Cyprus 146 60 33.4 26.1 15.7 3 3.5 2.9 7.4 2.8 6.2 12.5 3.6
Latvia 240 38.9 29.7 23.6 16 3.2 16.8 18.4 1.7 8.5 16.5 16.9 3.1
Lithuania 218 42.5 37.1 24.6 24.3 7.5 20 11.2 6.6 11.5 7.6 18.7 1.2
Luxembourg 259 60.8 66.5 26.1 34.1 5.7 11.3 7.1 10 2.3 10.6 5.5 0.6
Hungary 518 70 40.9 39 29 7.1 32.6 20.4 10.9 14.2 16.4 9.2 1.4
Malta 285 43.9 50.1 18 2.5 3.4 3.9 4.2 3.1 1.7 2.4 8.3 2
Netherlands 547 30.7 28.5 10.6 9.4 3.1 1.5 3.5 2.7 2.3 1.5 32.8 1.4
Austria 276 38.3 10.9 10.9 15.4 0.3 6.1 2.7 15.9 3.9 8.2 27.7 4
Poland 430 44.2 41.3 20.6 16.6 9.7 11.8 7.1 4.2 7.7 9.4 14.5 2.4
Portugal 394 41.2 50.9 18.1 22.3 2 8.3 3.1 3.5 5.2 5.4 13.2 2.6
Romania 207 45.4 28.6 20.4 13 1.1 32.2 3.1 1.6 9.3 5.8 15.4 1.4
Slovenia 241 19.7 26.9 11.7 8 5 3.3 6.8 6.8 3.7 9.1 26.2 11.2
Slovakia 332 63 48.1 30 16.1 5.9 14.1 10.6 1.9 11.1 4.3 3.1 0.1
Finland 268 33.4 23.7 15.5 8.1 1.5 1.6 3.9 6.9 1.4 7.6 32.7 3.4
Sweden 316 29.6 24.3 12.6 3.9 3.2 3.4 4.6 3.2 5.9 5.3 40.9 2.5
United Kingdom 516 28.3 37.2 4.4 7 5.8 4.6 9.6 8.3 2.9 2.3 51.9 3.5
Croatia 238 58.5 47.1 30.5 13.4 6.5 6.2 3 2.4 7.1 1.6 9.5 0.7
Norway 268 24.4 22 15.3 8.2 2.5 2 5.5 7.6 2.4 1.4 33.4 5.3
Iceland 192 14.2 29 5.4 5.3 0.3 1.1 2.7 6.8 2.6 2.4 51.4 6.8
Switzerland 256 34.1 15.3 19.6 11.6 2.2 6.1 3.1 6.3 3 5.5 27.7 3.1
Turkey 230 74.7 10 27.5 47.1 2.1 5.5 1.1 1 1.3 3.9 5.5 1.8
United States 358 13.8 20.6 6.6 4.8 2.2 3.6 1.4 4.8 2.2 2.7 63.4 5.5
China 278 11.2 14.6 6.2 8.8 14.8 36.1 32.9 6.4 5.5 21.8 22 0
Japan 585 23.6 45.8 11.1 6.6 8 7.6 12 16.6 2.2 6.1 12.7 1.1
South Korea 365 57.2 61.4 24.3 20.9 8.2 16.8 18 10.7 10.7 19 2.5 2.2
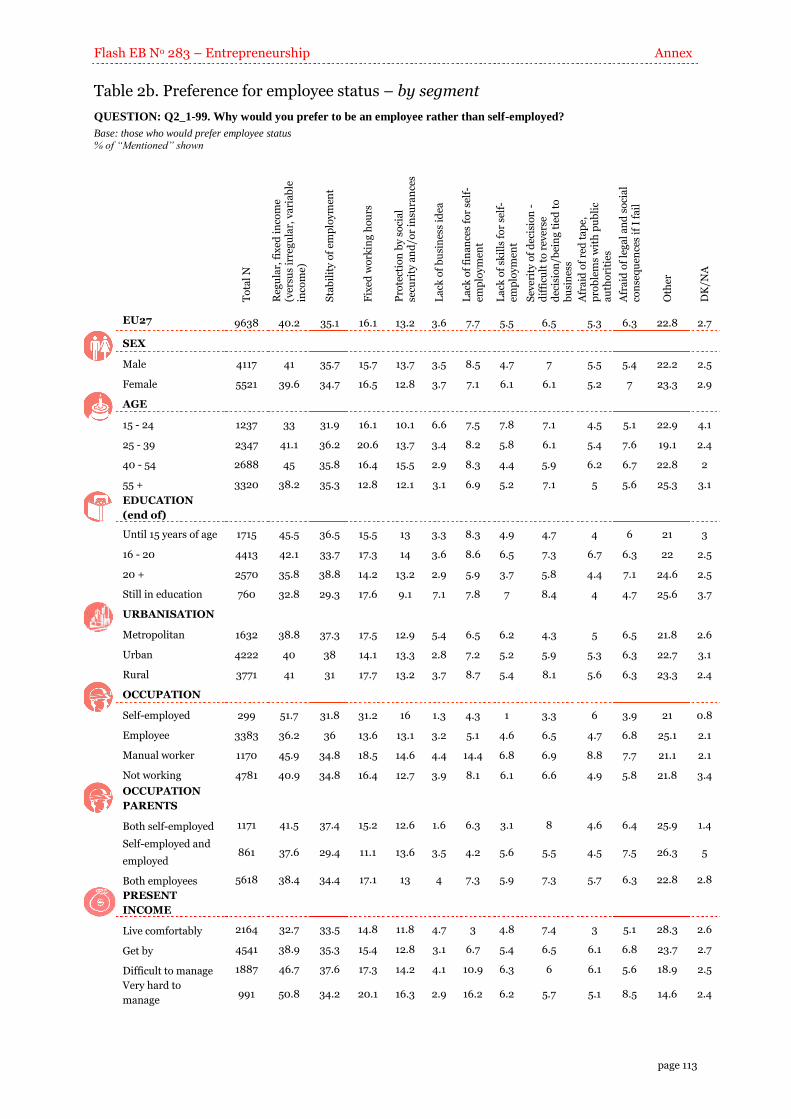
Flash EB No 283 – Entrepreneurship Annex
page 113
Table 2b. Preference for employee status – by segment
QUESTION: Q2_1-99. Why would you prefer to be an employee rather than self-employed?
Base: those who would prefer employee status % of “Mentioned” shown
To
tal
N
Reg
ula
r, f
ixed
in
com
e (v
ersu
s ir
reg
ula
r, v
ari
ab
le
inco
me)
Sta
bil
ity
of
emp
loy
men
t
Fix
ed w
ork
ing
ho
urs
Pro
tect
ion
by
so
cia
l se
curi
ty a
nd
/or
insu
ran
ces
La
ck o
f b
usi
nes
s id
ea
La
ck o
f fi
na
nce
s fo
r se
lf-
emp
loy
men
t
La
ck o
f sk
ills
fo
r se
lf-
emp
loy
men
t
Sev
erit
y o
f d
ecis
ion
-
dif
ficu
lt t
o r
ever
se
dec
isio
n/b
ein
g t
ied
to
b
usi
nes
s
Afr
aid
of
red
ta
pe,
p
rob
lem
s w
ith
pu
bli
c a
uth
ori
ties
Afr
aid
of
leg
al
an
d s
oci
al
con
seq
uen
ces
if I
fa
il
Oth
er
DK
/NA
EU27 9638 40.2 35.1 16.1 13.2 3.6 7.7 5.5 6.5 5.3 6.3 22.8 2.7
SEX
Male 4117 41 35.7 15.7 13.7 3.5 8.5 4.7 7 5.5 5.4 22.2 2.5
Female 5521 39.6 34.7 16.5 12.8 3.7 7.1 6.1 6.1 5.2 7 23.3 2.9
AGE
15 - 24 1237 33 31.9 16.1 10.1 6.6 7.5 7.8 7.1 4.5 5.1 22.9 4.1
25 - 39 2347 41.1 36.2 20.6 13.7 3.4 8.2 5.8 6.1 5.4 7.6 19.1 2.4
40 - 54 2688 45 35.8 16.4 15.5 2.9 8.3 4.4 5.9 6.2 6.7 22.8 2
55 + 3320 38.2 35.3 12.8 12.1 3.1 6.9 5.2 7.1 5 5.6 25.3 3.1
EDUCATION
(end of)
Until 15 years of age 1715 45.5 36.5 15.5 13 3.3 8.3 4.9 4.7 4 6 21 3
16 - 20 4413 42.1 33.7 17.3 14 3.6 8.6 6.5 7.3 6.7 6.3 22 2.5
20 + 2570 35.8 38.8 14.2 13.2 2.9 5.9 3.7 5.8 4.4 7.1 24.6 2.5
Still in education 760 32.8 29.3 17.6 9.1 7.1 7.8 7 8.4 4 4.7 25.6 3.7
URBANISATION
Metropolitan 1632 38.8 37.3 17.5 12.9 5.4 6.5 6.2 4.3 5 6.5 21.8 2.6
Urban 4222 40 38 14.1 13.3 2.8 7.2 5.2 5.9 5.3 6.3 22.7 3.1
Rural 3771 41 31 17.7 13.2 3.7 8.7 5.4 8.1 5.6 6.3 23.3 2.4
OCCUPATION
Self-employed 299 51.7 31.8 31.2 16 1.3 4.3 1 3.3 6 3.9 21 0.8
Employee 3383 36.2 36 13.6 13.1 3.2 5.1 4.6 6.5 4.7 6.8 25.1 2.1
Manual worker 1170 45.9 34.8 18.5 14.6 4.4 14.4 6.8 6.9 8.8 7.7 21.1 2.1
Not working 4781 40.9 34.8 16.4 12.7 3.9 8.1 6.1 6.6 4.9 5.8 21.8 3.4
OCCUPATION
PARENTS
Both self-employed 1171 41.5 37.4 15.2 12.6 1.6 6.3 3.1 8 4.6 6.4 25.9 1.4
Self-employed and
employed 861 37.6 29.4 11.1 13.6 3.5 4.2 5.6 5.5 4.5 7.5 26.3 5
Both employees 5618 38.4 34.4 17.1 13 4 7.3 5.9 7.3 5.7 6.3 22.8 2.8
PRESENT
INCOME
Live comfortably 2164 32.7 33.5 14.8 11.8 4.7 3 4.8 7.4 3 5.1 28.3 2.6
Get by 4541 38.9 35.3 15.4 12.8 3.1 6.7 5.4 6.5 6.1 6.8 23.7 2.7
Difficult to manage 1887 46.7 37.6 17.3 14.2 4.1 10.9 6.3 6 6.1 5.6 18.9 2.5
Very hard to
manage 991 50.8 34.2 20.1 16.3 2.9 16.2 6.2 5.7 5.1 8.5 14.6 2.4
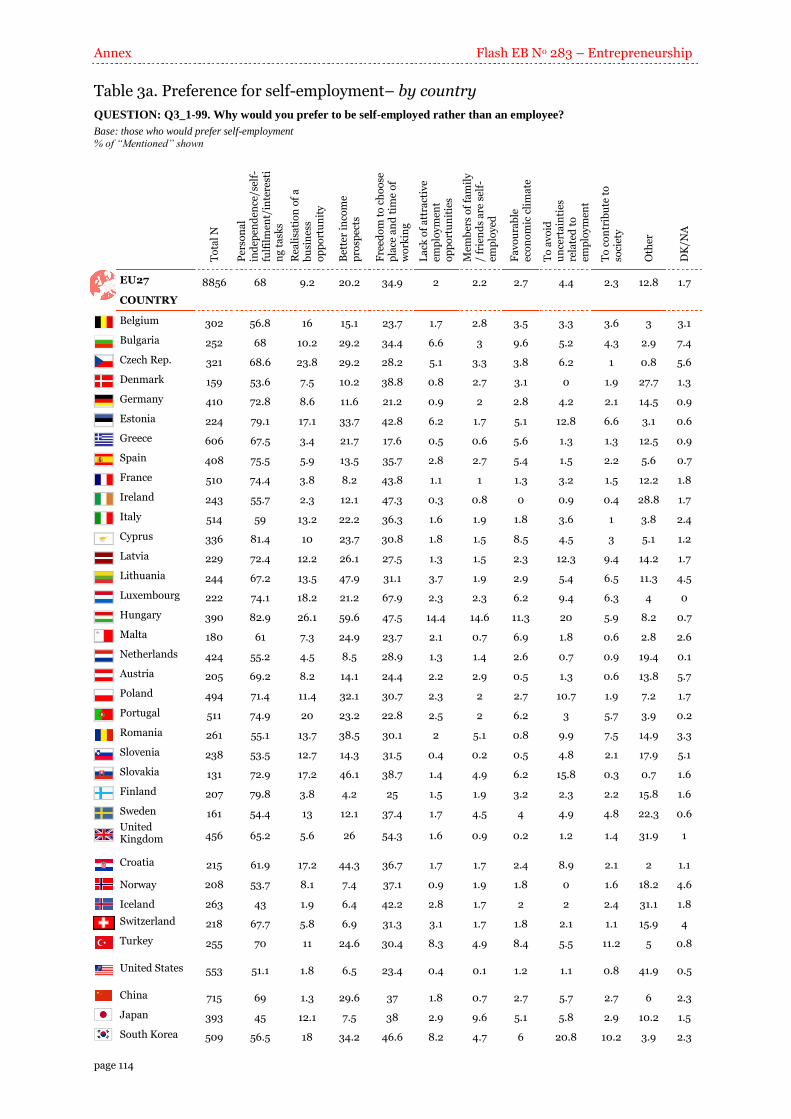
Annex Flash EB No 283 – Entrepreneurship
page 114
Table 3a. Preference for self-employment– by country
QUESTION: Q3_1-99. Why would you prefer to be self-employed rather than an employee?
Base: those who would prefer self-employment
% of “Mentioned” shown
To
tal
N
Per
son
al
ind
epen
den
ce/s
elf-
fulf
ilm
ent/
inte
rest
in
g t
ask
s
Rea
lisa
tio
n o
f a
b
usi
nes
s o
pp
ort
un
ity
Bet
ter
inco
me
pro
spec
ts
Fre
edo
m t
o c
ho
ose
p
lace
an
d t
ime
of
wo
rkin
g
La
ck o
f a
ttra
ctiv
e em
plo
ym
ent
op
po
rtu
nit
ies
Mem
ber
s o
f fa
mil
y
/ fr
ien
ds
are
sel
f-em
plo
yed
Fa
vo
ura
ble
ec
on
om
ic c
lim
ate
To
av
oid
u
nce
rta
inti
es
rela
ted
to
em
plo
ym
ent
To
co
ntr
ibu
te t
o
soci
ety
Oth
er
DK
/NA
EU27 8856 68 9.2 20.2 34.9 2 2.2 2.7 4.4 2.3 12.8 1.7
COUNTRY
Belgium 302 56.8 16 15.1 23.7 1.7 2.8 3.5 3.3 3.6 3 3.1
Bulgaria 252 68 10.2 29.2 34.4 6.6 3 9.6 5.2 4.3 2.9 7.4
Czech Rep. 321 68.6 23.8 29.2 28.2 5.1 3.3 3.8 6.2 1 0.8 5.6
Denmark 159 53.6 7.5 10.2 38.8 0.8 2.7 3.1 0 1.9 27.7 1.3
Germany 410 72.8 8.6 11.6 21.2 0.9 2 2.8 4.2 2.1 14.5 0.9
Estonia 224 79.1 17.1 33.7 42.8 6.2 1.7 5.1 12.8 6.6 3.1 0.6
Greece 606 67.5 3.4 21.7 17.6 0.5 0.6 5.6 1.3 1.3 12.5 0.9
Spain 408 75.5 5.9 13.5 35.7 2.8 2.7 5.4 1.5 2.2 5.6 0.7
France 510 74.4 3.8 8.2 43.8 1.1 1 1.3 3.2 1.5 12.2 1.8
Ireland 243 55.7 2.3 12.1 47.3 0.3 0.8 0 0.9 0.4 28.8 1.7
Italy 514 59 13.2 22.2 36.3 1.6 1.9 1.8 3.6 1 3.8 2.4
Cyprus 336 81.4 10 23.7 30.8 1.8 1.5 8.5 4.5 3 5.1 1.2
Latvia 229 72.4 12.2 26.1 27.5 1.3 1.5 2.3 12.3 9.4 14.2 1.7
Lithuania 244 67.2 13.5 47.9 31.1 3.7 1.9 2.9 5.4 6.5 11.3 4.5
Luxembourg 222 74.1 18.2 21.2 67.9 2.3 2.3 6.2 9.4 6.3 4 0
Hungary 390 82.9 26.1 59.6 47.5 14.4 14.6 11.3 20 5.9 8.2 0.7
Malta 180 61 7.3 24.9 23.7 2.1 0.7 6.9 1.8 0.6 2.8 2.6
Netherlands 424 55.2 4.5 8.5 28.9 1.3 1.4 2.6 0.7 0.9 19.4 0.1
Austria 205 69.2 8.2 14.1 24.4 2.2 2.9 0.5 1.3 0.6 13.8 5.7
Poland 494 71.4 11.4 32.1 30.7 2.3 2 2.7 10.7 1.9 7.2 1.7
Portugal 511 74.9 20 23.2 22.8 2.5 2 6.2 3 5.7 3.9 0.2
Romania 261 55.1 13.7 38.5 30.1 2 5.1 0.8 9.9 7.5 14.9 3.3
Slovenia 238 53.5 12.7 14.3 31.5 0.4 0.2 0.5 4.8 2.1 17.9 5.1
Slovakia 131 72.9 17.2 46.1 38.7 1.4 4.9 6.2 15.8 0.3 0.7 1.6
Finland 207 79.8 3.8 4.2 25 1.5 1.9 3.2 2.3 2.2 15.8 1.6
Sweden 161 54.4 13 12.1 37.4 1.7 4.5 4 4.9 4.8 22.3 0.6
United Kingdom 456 65.2 5.6 26 54.3 1.6 0.9 0.2 1.2 1.4 31.9 1
Croatia 215 61.9 17.2 44.3 36.7 1.7 1.7 2.4 8.9 2.1 2 1.1
Norway 208 53.7 8.1 7.4 37.1 0.9 1.9 1.8 0 1.6 18.2 4.6
Iceland 263 43 1.9 6.4 42.2 2.8 1.7 2 2 2.4 31.1 1.8
Switzerland 218 67.7 5.8 6.9 31.3 3.1 1.7 1.8 2.1 1.1 15.9 4
Turkey 255 70 11 24.6 30.4 8.3 4.9 8.4 5.5 11.2 5 0.8
United States 553 51.1 1.8 6.5 23.4 0.4 0.1 1.2 1.1 0.8 41.9 0.5
China 715 69 1.3 29.6 37 1.8 0.7 2.7 5.7 2.7 6 2.3
Japan 393 45 12.1 7.5 38 2.9 9.6 5.1 5.8 2.9 10.2 1.5
South Korea 509 56.5 18 34.2 46.6 8.2 4.7 6 20.8 10.2 3.9 2.3
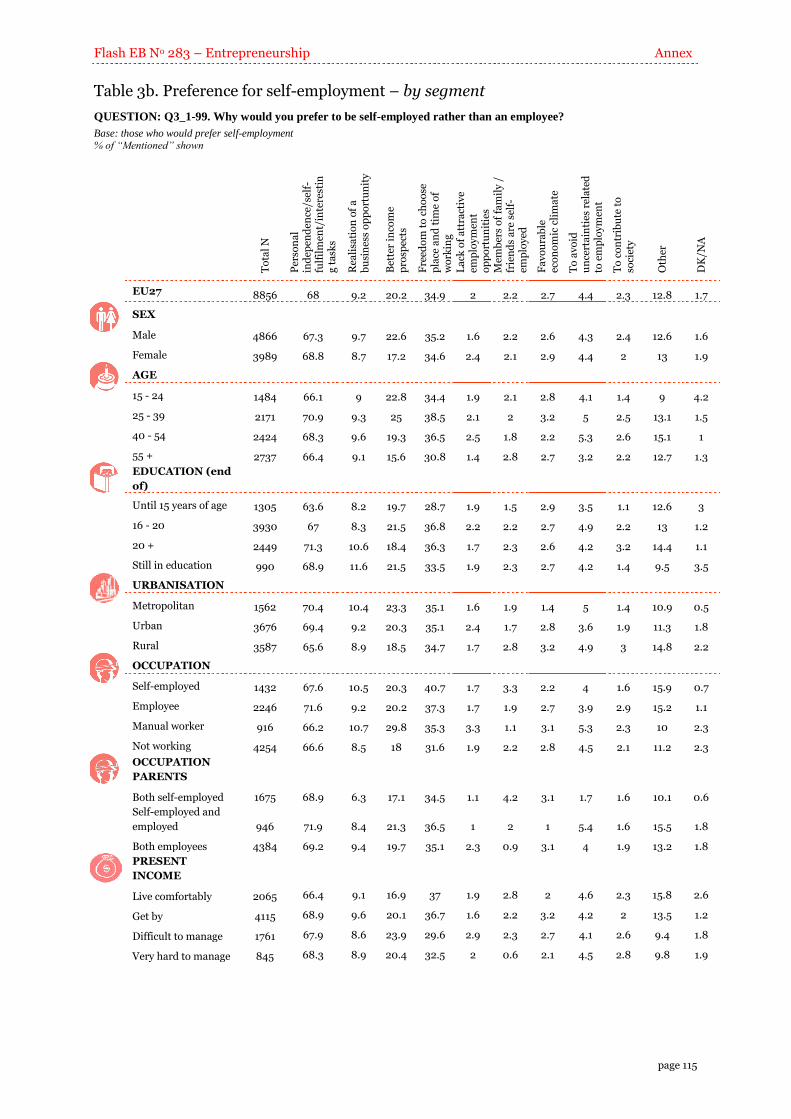
Flash EB No 283 – Entrepreneurship Annex
page 115
Table 3b. Preference for self-employment – by segment
QUESTION: Q3_1-99. Why would you prefer to be self-employed rather than an employee?
Base: those who would prefer self-employment % of “Mentioned” shown
To
tal
N
Per
son
al
ind
epen
den
ce/s
elf-
fulf
ilm
ent/
inte
rest
ing
ta
sks
Rea
lisa
tio
n o
f a
b
usi
nes
s o
pp
ort
un
ity
Bet
ter
inco
me
pro
spec
ts
Fre
edo
m t
o c
ho
ose
p
lace
an
d t
ime
of
wo
rkin
g
La
ck o
f a
ttra
ctiv
e em
plo
ym
ent
op
po
rtu
nit
ies
Mem
ber
s o
f fa
mil
y /
fr
ien
ds
are
sel
f-em
plo
yed
Fa
vo
ura
ble
ec
on
om
ic c
lim
ate
To
av
oid
u
nce
rta
inti
es r
ela
ted
to
em
plo
ym
ent
To
co
ntr
ibu
te t
o
soci
ety
Oth
er
DK
/NA
EU27 8856 68 9.2 20.2 34.9 2 2.2 2.7 4.4 2.3 12.8 1.7
SEX
Male 4866 67.3 9.7 22.6 35.2 1.6 2.2 2.6 4.3 2.4 12.6 1.6
Female 3989 68.8 8.7 17.2 34.6 2.4 2.1 2.9 4.4 2 13 1.9
AGE
15 - 24 1484 66.1 9 22.8 34.4 1.9 2.1 2.8 4.1 1.4 9 4.2
25 - 39 2171 70.9 9.3 25 38.5 2.1 2 3.2 5 2.5 13.1 1.5
40 - 54 2424 68.3 9.6 19.3 36.5 2.5 1.8 2.2 5.3 2.6 15.1 1
55 + 2737 66.4 9.1 15.6 30.8 1.4 2.8 2.7 3.2 2.2 12.7 1.3
EDUCATION (end
of)
Until 15 years of age 1305 63.6 8.2 19.7 28.7 1.9 1.5 2.9 3.5 1.1 12.6 3
16 - 20 3930 67 8.3 21.5 36.8 2.2 2.2 2.7 4.9 2.2 13 1.2
20 + 2449 71.3 10.6 18.4 36.3 1.7 2.3 2.6 4.2 3.2 14.4 1.1
Still in education 990 68.9 11.6 21.5 33.5 1.9 2.3 2.7 4.2 1.4 9.5 3.5
URBANISATION
Metropolitan 1562 70.4 10.4 23.3 35.1 1.6 1.9 1.4 5 1.4 10.9 0.5
Urban 3676 69.4 9.2 20.3 35.1 2.4 1.7 2.8 3.6 1.9 11.3 1.8
Rural 3587 65.6 8.9 18.5 34.7 1.7 2.8 3.2 4.9 3 14.8 2.2
OCCUPATION
Self-employed 1432 67.6 10.5 20.3 40.7 1.7 3.3 2.2 4 1.6 15.9 0.7
Employee 2246 71.6 9.2 20.2 37.3 1.7 1.9 2.7 3.9 2.9 15.2 1.1
Manual worker 916 66.2 10.7 29.8 35.3 3.3 1.1 3.1 5.3 2.3 10 2.3
Not working 4254 66.6 8.5 18 31.6 1.9 2.2 2.8 4.5 2.1 11.2 2.3
OCCUPATION
PARENTS
Both self-employed 1675 68.9 6.3 17.1 34.5 1.1 4.2 3.1 1.7 1.6 10.1 0.6
Self-employed and
employed 946 71.9 8.4 21.3 36.5 1 2 1 5.4 1.6 15.5 1.8
Both employees 4384 69.2 9.4 19.7 35.1 2.3 0.9 3.1 4 1.9 13.2 1.8
PRESENT
INCOME
Live comfortably 2065 66.4 9.1 16.9 37 1.9 2.8 2 4.6 2.3 15.8 2.6
Get by 4115 68.9 9.6 20.1 36.7 1.6 2.2 3.2 4.2 2 13.5 1.2
Difficult to manage 1761 67.9 8.6 23.9 29.6 2.9 2.3 2.7 4.1 2.6 9.4 1.8
Very hard to manage 845 68.3 8.9 20.4 32.5 2 0.6 2.1 4.5 2.8 9.8 1.9
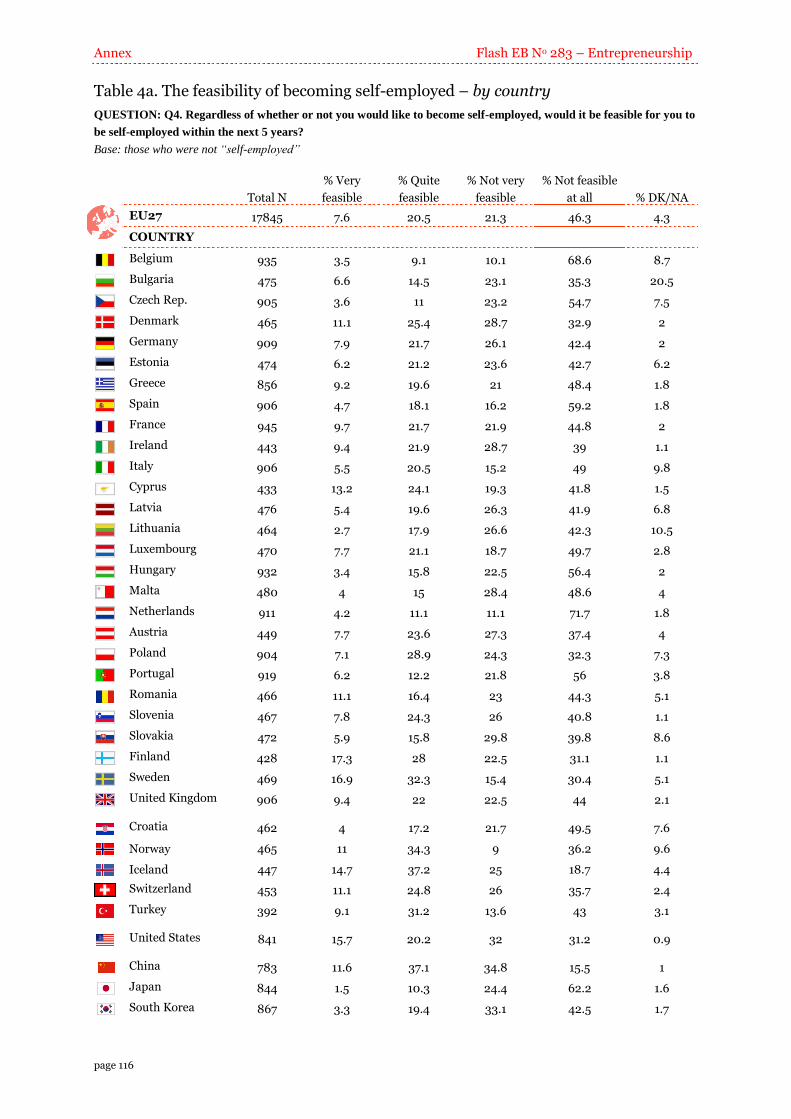
Annex Flash EB No 283 – Entrepreneurship
page 116
Table 4a. The feasibility of becoming self-employed – by country
QUESTION: Q4. Regardless of whether or not you would like to become self-employed, would it be feasible for you to
be self-employed within the next 5 years?
Base: those who were not “self-employed”
Total N
% Very
feasible
% Quite
feasible
% Not very
feasible
% Not feasible
at all % DK/NA
EU27 17845 7.6 20.5 21.3 46.3 4.3
COUNTRY
Belgium 935 3.5 9.1 10.1 68.6 8.7
Bulgaria 475 6.6 14.5 23.1 35.3 20.5
Czech Rep. 905 3.6 11 23.2 54.7 7.5
Denmark 465 11.1 25.4 28.7 32.9 2
Germany 909 7.9 21.7 26.1 42.4 2
Estonia 474 6.2 21.2 23.6 42.7 6.2
Greece 856 9.2 19.6 21 48.4 1.8
Spain 906 4.7 18.1 16.2 59.2 1.8
France 945 9.7 21.7 21.9 44.8 2
Ireland 443 9.4 21.9 28.7 39 1.1
Italy 906 5.5 20.5 15.2 49 9.8
Cyprus 433 13.2 24.1 19.3 41.8 1.5
Latvia 476 5.4 19.6 26.3 41.9 6.8
Lithuania 464 2.7 17.9 26.6 42.3 10.5
Luxembourg 470 7.7 21.1 18.7 49.7 2.8
Hungary 932 3.4 15.8 22.5 56.4 2
Malta 480 4 15 28.4 48.6 4
Netherlands 911 4.2 11.1 11.1 71.7 1.8
Austria 449 7.7 23.6 27.3 37.4 4
Poland 904 7.1 28.9 24.3 32.3 7.3
Portugal 919 6.2 12.2 21.8 56 3.8
Romania 466 11.1 16.4 23 44.3 5.1
Slovenia 467 7.8 24.3 26 40.8 1.1
Slovakia 472 5.9 15.8 29.8 39.8 8.6
Finland 428 17.3 28 22.5 31.1 1.1
Sweden 469 16.9 32.3 15.4 30.4 5.1
United Kingdom 906 9.4 22 22.5 44 2.1
Croatia 462 4 17.2 21.7 49.5 7.6
Norway 465 11 34.3 9 36.2 9.6
Iceland 447 14.7 37.2 25 18.7 4.4
Switzerland 453 11.1 24.8 26 35.7 2.4
Turkey 392 9.1 31.2 13.6 43 3.1
United States 841 15.7 20.2 32 31.2 0.9
China 783 11.6 37.1 34.8 15.5 1
Japan 844 1.5 10.3 24.4 62.2 1.6
South Korea 867 3.3 19.4 33.1 42.5 1.7
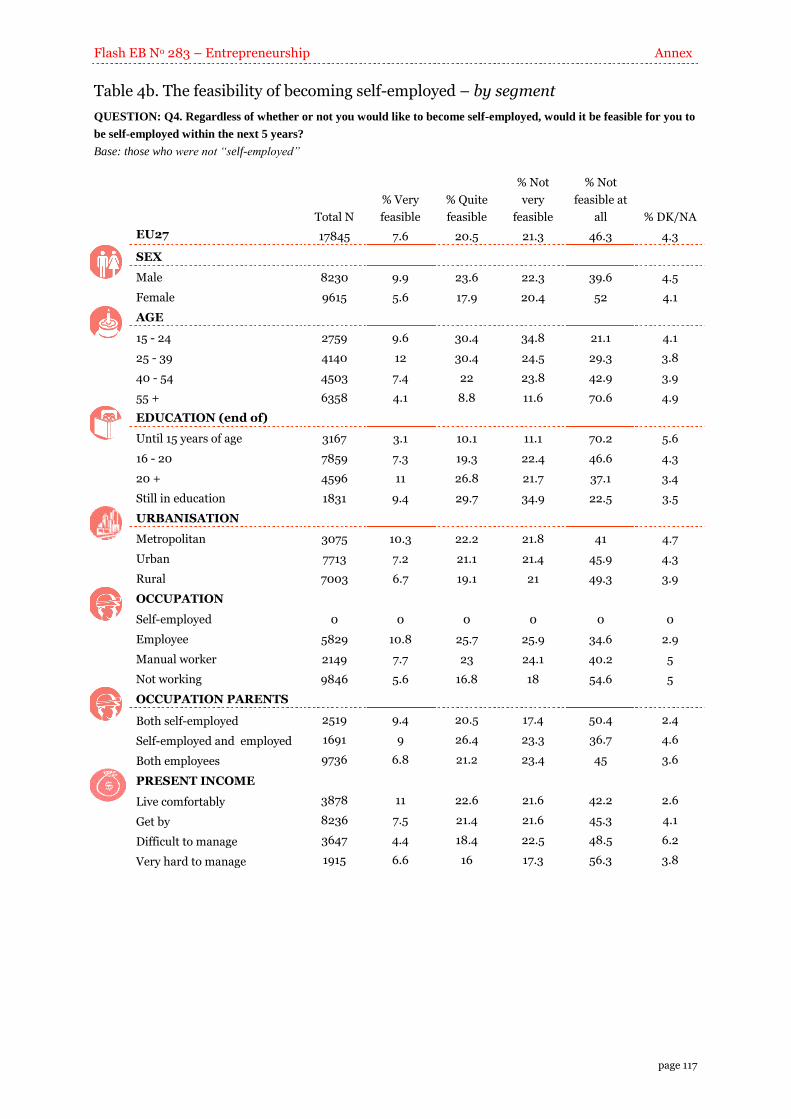
Flash EB No 283 – Entrepreneurship Annex
page 117
Table 4b. The feasibility of becoming self-employed – by segment
QUESTION: Q4. Regardless of whether or not you would like to become self-employed, would it be feasible for you to
be self-employed within the next 5 years?
Base: those who were not “self-employed”
Total N
% Very
feasible
% Quite
feasible
% Not
very
feasible
% Not
feasible at
all % DK/NA
EU27 17845 7.6 20.5 21.3 46.3 4.3
SEX
Male 8230 9.9 23.6 22.3 39.6 4.5
Female 9615 5.6 17.9 20.4 52 4.1
AGE
15 - 24 2759 9.6 30.4 34.8 21.1 4.1
25 - 39 4140 12 30.4 24.5 29.3 3.8
40 - 54 4503 7.4 22 23.8 42.9 3.9
55 + 6358 4.1 8.8 11.6 70.6 4.9
EDUCATION (end of)
Until 15 years of age 3167 3.1 10.1 11.1 70.2 5.6
16 - 20 7859 7.3 19.3 22.4 46.6 4.3
20 + 4596 11 26.8 21.7 37.1 3.4
Still in education 1831 9.4 29.7 34.9 22.5 3.5
URBANISATION
Metropolitan 3075 10.3 22.2 21.8 41 4.7
Urban 7713 7.2 21.1 21.4 45.9 4.3
Rural 7003 6.7 19.1 21 49.3 3.9
OCCUPATION
Self-employed 0 0 0 0 0 0
Employee 5829 10.8 25.7 25.9 34.6 2.9
Manual worker 2149 7.7 23 24.1 40.2 5
Not working 9846 5.6 16.8 18 54.6 5
OCCUPATION PARENTS
Both self-employed 2519 9.4 20.5 17.4 50.4 2.4
Self-employed and employed 1691 9 26.4 23.3 36.7 4.6
Both employees 9736 6.8 21.2 23.4 45 3.6
PRESENT INCOME
Live comfortably 3878 11 22.6 21.6 42.2 2.6
Get by 8236 7.5 21.4 21.6 45.3 4.1
Difficult to manage 3647 4.4 18.4 22.5 48.5 6.2
Very hard to manage 1915 6.6 16 17.3 56.3 3.8
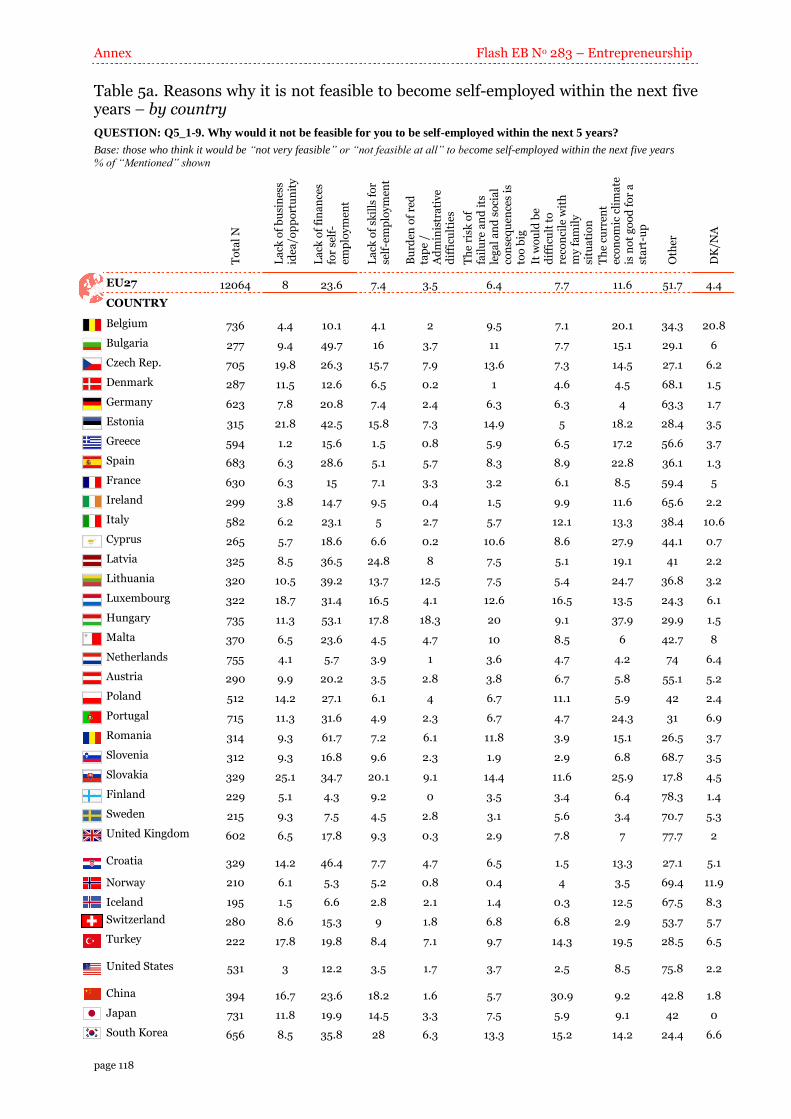
Annex Flash EB No 283 – Entrepreneurship
page 118
Table 5a. Reasons why it is not feasible to become self-employed within the next five years – by country
QUESTION: Q5_1-9. Why would it not be feasible for you to be self-employed within the next 5 years?
Base: those who think it would be “not very feasible” or “not feasible at all” to become self-employed within the next five years
% of “Mentioned” shown
T
ota
l N
La
ck o
f b
usi
nes
s id
ea/o
pp
ort
un
ity
La
ck o
f fi
na
nce
s fo
r se
lf-
emp
loy
men
t
La
ck o
f sk
ills
fo
r se
lf-e
mp
loym
ent
Bu
rden
of
red
ta
pe
/ A
dm
inis
tra
tiv
e d
iffi
cult
ies
Th
e ri
sk o
f fa
ilu
re a
nd
its
le
ga
l a
nd
so
cia
l co
nse
qu
ence
s is
to
o b
ig
It w
ou
ld b
e d
iffi
cult
to
re
con
cile
wit
h
my
fa
mil
y
situ
ati
on
Th
e cu
rren
t ec
on
om
ic c
lim
ate
is
no
t g
oo
d f
or
a
sta
rt-u
p
Oth
er
DK
/NA
EU27 12064 8 23.6 7.4 3.5 6.4 7.7 11.6 51.7 4.4
COUNTRY
Belgium 736 4.4 10.1 4.1 2 9.5 7.1 20.1 34.3 20.8
Bulgaria 277 9.4 49.7 16 3.7 11 7.7 15.1 29.1 6
Czech Rep. 705 19.8 26.3 15.7 7.9 13.6 7.3 14.5 27.1 6.2
Denmark 287 11.5 12.6 6.5 0.2 1 4.6 4.5 68.1 1.5
Germany 623 7.8 20.8 7.4 2.4 6.3 6.3 4 63.3 1.7
Estonia 315 21.8 42.5 15.8 7.3 14.9 5 18.2 28.4 3.5
Greece 594 1.2 15.6 1.5 0.8 5.9 6.5 17.2 56.6 3.7
Spain 683 6.3 28.6 5.1 5.7 8.3 8.9 22.8 36.1 1.3
France 630 6.3 15 7.1 3.3 3.2 6.1 8.5 59.4 5
Ireland 299 3.8 14.7 9.5 0.4 1.5 9.9 11.6 65.6 2.2
Italy 582 6.2 23.1 5 2.7 5.7 12.1 13.3 38.4 10.6
Cyprus 265 5.7 18.6 6.6 0.2 10.6 8.6 27.9 44.1 0.7
Latvia 325 8.5 36.5 24.8 8 7.5 5.1 19.1 41 2.2
Lithuania 320 10.5 39.2 13.7 12.5 7.5 5.4 24.7 36.8 3.2
Luxembourg 322 18.7 31.4 16.5 4.1 12.6 16.5 13.5 24.3 6.1
Hungary 735 11.3 53.1 17.8 18.3 20 9.1 37.9 29.9 1.5
Malta 370 6.5 23.6 4.5 4.7 10 8.5 6 42.7 8
Netherlands 755 4.1 5.7 3.9 1 3.6 4.7 4.2 74 6.4
Austria 290 9.9 20.2 3.5 2.8 3.8 6.7 5.8 55.1 5.2
Poland 512 14.2 27.1 6.1 4 6.7 11.1 5.9 42 2.4
Portugal 715 11.3 31.6 4.9 2.3 6.7 4.7 24.3 31 6.9
Romania 314 9.3 61.7 7.2 6.1 11.8 3.9 15.1 26.5 3.7
Slovenia 312 9.3 16.8 9.6 2.3 1.9 2.9 6.8 68.7 3.5
Slovakia 329 25.1 34.7 20.1 9.1 14.4 11.6 25.9 17.8 4.5
Finland 229 5.1 4.3 9.2 0 3.5 3.4 6.4 78.3 1.4
Sweden 215 9.3 7.5 4.5 2.8 3.1 5.6 3.4 70.7 5.3
United Kingdom 602 6.5 17.8 9.3 0.3 2.9 7.8 7 77.7 2
Croatia 329 14.2 46.4 7.7 4.7 6.5 1.5 13.3 27.1 5.1
Norway 210 6.1 5.3 5.2 0.8 0.4 4 3.5 69.4 11.9
Iceland 195 1.5 6.6 2.8 2.1 1.4 0.3 12.5 67.5 8.3
Switzerland 280 8.6 15.3 9 1.8 6.8 6.8 2.9 53.7 5.7
Turkey 222 17.8 19.8 8.4 7.1 9.7 14.3 19.5 28.5 6.5
United States 531 3 12.2 3.5 1.7 3.7 2.5 8.5 75.8 2.2
China 394 16.7 23.6 18.2 1.6 5.7 30.9 9.2 42.8 1.8
Japan 731 11.8 19.9 14.5 3.3 7.5 5.9 9.1 42 0
South Korea 656 8.5 35.8 28 6.3 13.3 15.2 14.2 24.4 6.6
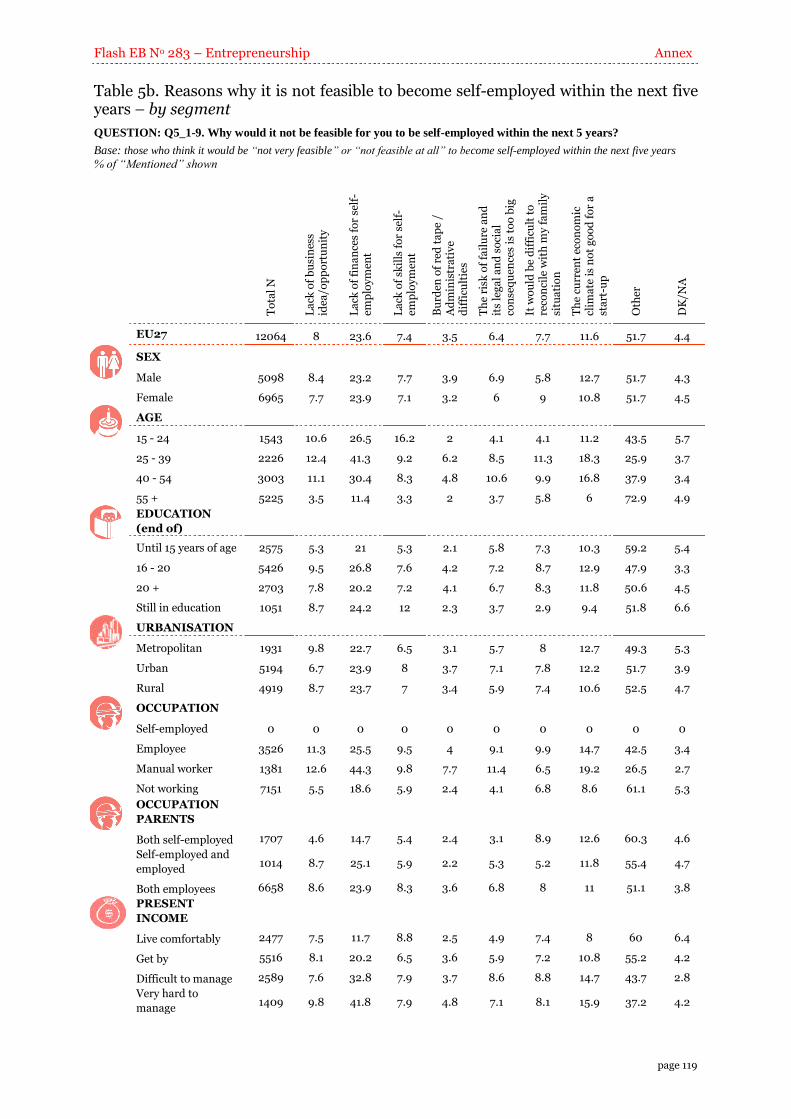
Flash EB No 283 – Entrepreneurship Annex
page 119
Table 5b. Reasons why it is not feasible to become self-employed within the next five years – by segment
QUESTION: Q5_1-9. Why would it not be feasible for you to be self-employed within the next 5 years?
Base: those who think it would be “not very feasible” or “not feasible at all” to become self-employed within the next five years
% of “Mentioned” shown
To
tal
N
La
ck o
f b
usi
nes
s id
ea/o
pp
ort
un
ity
La
ck o
f fi
na
nce
s fo
r se
lf-
emp
loy
men
t
La
ck o
f sk
ills
fo
r se
lf-
emp
loy
men
t
Bu
rden
of
red
ta
pe
/ A
dm
inis
tra
tiv
e d
iffi
cult
ies
Th
e ri
sk o
f fa
ilu
re a
nd
it
s le
ga
l a
nd
so
cia
l co
nse
qu
ence
s is
to
o b
ig
It w
ou
ld b
e d
iffi
cult
to
re
con
cile
wit
h m
y f
am
ily
si
tua
tio
n
Th
e cu
rren
t ec
on
om
ic
clim
ate
is
no
t g
oo
d f
or
a
sta
rt-u
p
Oth
er
DK
/NA
EU27 12064 8 23.6 7.4 3.5 6.4 7.7 11.6 51.7 4.4
SEX
Male 5098 8.4 23.2 7.7 3.9 6.9 5.8 12.7 51.7 4.3
Female 6965 7.7 23.9 7.1 3.2 6 9 10.8 51.7 4.5
AGE
15 - 24 1543 10.6 26.5 16.2 2 4.1 4.1 11.2 43.5 5.7
25 - 39 2226 12.4 41.3 9.2 6.2 8.5 11.3 18.3 25.9 3.7
40 - 54 3003 11.1 30.4 8.3 4.8 10.6 9.9 16.8 37.9 3.4
55 + 5225 3.5 11.4 3.3 2 3.7 5.8 6 72.9 4.9
EDUCATION
(end of)
Until 15 years of age 2575 5.3 21 5.3 2.1 5.8 7.3 10.3 59.2 5.4
16 - 20 5426 9.5 26.8 7.6 4.2 7.2 8.7 12.9 47.9 3.3
20 + 2703 7.8 20.2 7.2 4.1 6.7 8.3 11.8 50.6 4.5
Still in education 1051 8.7 24.2 12 2.3 3.7 2.9 9.4 51.8 6.6
URBANISATION
Metropolitan 1931 9.8 22.7 6.5 3.1 5.7 8 12.7 49.3 5.3
Urban 5194 6.7 23.9 8 3.7 7.1 7.8 12.2 51.7 3.9
Rural 4919 8.7 23.7 7 3.4 5.9 7.4 10.6 52.5 4.7
OCCUPATION
Self-employed 0 0 0 0 0 0 0 0 0 0
Employee 3526 11.3 25.5 9.5 4 9.1 9.9 14.7 42.5 3.4
Manual worker 1381 12.6 44.3 9.8 7.7 11.4 6.5 19.2 26.5 2.7
Not working 7151 5.5 18.6 5.9 2.4 4.1 6.8 8.6 61.1 5.3
OCCUPATION
PARENTS
Both self-employed 1707 4.6 14.7 5.4 2.4 3.1 8.9 12.6 60.3 4.6
Self-employed and
employed 1014 8.7 25.1 5.9 2.2 5.3 5.2 11.8 55.4 4.7
Both employees 6658 8.6 23.9 8.3 3.6 6.8 8 11 51.1 3.8
PRESENT
INCOME
Live comfortably 2477 7.5 11.7 8.8 2.5 4.9 7.4 8 60 6.4
Get by 5516 8.1 20.2 6.5 3.6 5.9 7.2 10.8 55.2 4.2
Difficult to manage 2589 7.6 32.8 7.9 3.7 8.6 8.8 14.7 43.7 2.8
Very hard to
manage 1409 9.8 41.8 7.9 4.8 7.1 8.1 15.9 37.2 4.2

Annex Flash EB No 283 – Entrepreneurship
page 120
Table 6a. My school education helped me to develop a sense of initiative – a sort of entrepreneurial attitude – by country
QUESTION: Q6_A. I will read you a list of statements. Please tell me, do you strongly agree, agree, disagree or
strongly disagree with the following statements? - My school education helped me to develop my sense of initiative – a
sort of entrepreneurial attitude
Total N
% Strongly
agree % Agree % Disagree
% Strongly
disagree % DK/NA
EU27 19635 12.9 36.2 31.5 16.6 2.7
COUNTRY
Belgium 1007 15.6 37.6 26.3 16.3 4.2
Bulgaria 502 16.8 29.5 38.2 14.3 1.3
Czech Rep. 1001 15.7 33.6 34.4 12.1 4.1
Denmark 500 7 33 46.6 11.2 2.2
Germany 1005 13.6 38.3 32 14.3 1.8
Estonia 520 14.3 26 33.5 13.8 12.4
Greece 1006 17.6 30 29.1 21.4 1.9
Spain 1009 8.6 44.4 30.7 13 3.2
France 1005 20.5 38.6 18.8 21.2 0.9
Ireland 500 16.3 38.1 30.4 14 1.2
Italy 1017 7.3 30.4 40.7 17.5 4.2
Cyprus 506 15.9 48.4 26.9 7.7 1.1
Latvia 504 11.2 15.2 42.5 28.2 2.9
Lithuania 504 7.5 25.2 42 17.5 7.8
Luxembourg 505 16.8 34.4 23.1 22.9 2.8
Hungary 1002 11 26.1 32.1 28.7 2.1
Malta 507 16.6 41.5 32.8 4.2 4.9
Netherlands 1003 7.1 45.5 38.6 6.7 2
Austria 501 18.8 32.1 28.1 18 3
Poland 1005 10.1 33.4 36.7 16.4 3.4
Portugal 1006 18.4 44.7 26.2 4.6 6.1
Romania 504 14 45.9 25.3 10.8 3.9
Slovenia 503 9.8 46.2 32.4 10.1 1.4
Slovakia 512 7.9 30.5 45.1 12.7 3.8
Finland 500 10.8 44.4 32 6.5 6.2
Sweden 501 13.4 36.1 30.7 17.2 2.6
United Kingdom 1000 13.8 30.7 30 23.9 1.6
Croatia 500 16 37 27.8 15 4.1
Norway 503 15.4 41.9 27.4 11.9 3.3
Iceland 504 13.9 48.3 27.6 6.3 3.9
Switzerland 510 24.8 37.2 23.3 12 2.7
Turkey 504 13.1 59.9 20.9 2.2 3.8
United States 1010 36 37.4 15.4 11 0.3
China 1002 21.6 46.2 24.5 7.4 0.4
Japan 1000 9.5 37.2 42.1 9.7 1.6
South Korea 1000 7.1 45.6 32.1 8.3 6.8
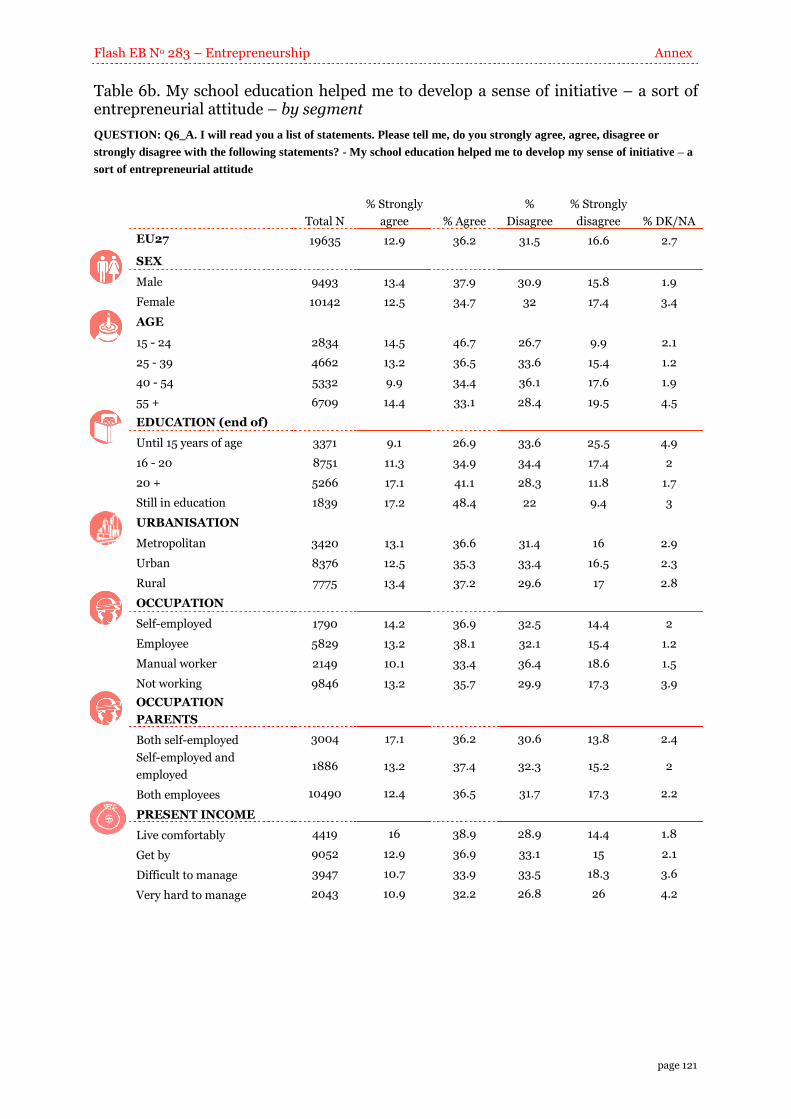
Flash EB No 283 – Entrepreneurship Annex
page 121
Table 6b. My school education helped me to develop a sense of initiative – a sort of entrepreneurial attitude – by segment
QUESTION: Q6_A. I will read you a list of statements. Please tell me, do you strongly agree, agree, disagree or
strongly disagree with the following statements? - My school education helped me to develop my sense of initiative – a
sort of entrepreneurial attitude
Total N
% Strongly
agree % Agree
%
Disagree
% Strongly
disagree % DK/NA
EU27 19635 12.9 36.2 31.5 16.6 2.7
SEX
Male 9493 13.4 37.9 30.9 15.8 1.9
Female 10142 12.5 34.7 32 17.4 3.4
AGE
15 - 24 2834 14.5 46.7 26.7 9.9 2.1
25 - 39 4662 13.2 36.5 33.6 15.4 1.2
40 - 54 5332 9.9 34.4 36.1 17.6 1.9
55 + 6709 14.4 33.1 28.4 19.5 4.5
EDUCATION (end of)
Until 15 years of age 3371 9.1 26.9 33.6 25.5 4.9
16 - 20 8751 11.3 34.9 34.4 17.4 2
20 + 5266 17.1 41.1 28.3 11.8 1.7
Still in education 1839 17.2 48.4 22 9.4 3
URBANISATION
Metropolitan 3420 13.1 36.6 31.4 16 2.9
Urban 8376 12.5 35.3 33.4 16.5 2.3
Rural 7775 13.4 37.2 29.6 17 2.8
OCCUPATION
Self-employed 1790 14.2 36.9 32.5 14.4 2
Employee 5829 13.2 38.1 32.1 15.4 1.2
Manual worker 2149 10.1 33.4 36.4 18.6 1.5
Not working 9846 13.2 35.7 29.9 17.3 3.9
OCCUPATION
PARENTS
Both self-employed 3004 17.1 36.2 30.6 13.8 2.4
Self-employed and
employed 1886 13.2 37.4 32.3 15.2 2
Both employees 10490 12.4 36.5 31.7 17.3 2.2
PRESENT INCOME
Live comfortably 4419 16 38.9 28.9 14.4 1.8
Get by 9052 12.9 36.9 33.1 15 2.1
Difficult to manage 3947 10.7 33.9 33.5 18.3 3.6
Very hard to manage 2043 10.9 32.2 26.8 26 4.2
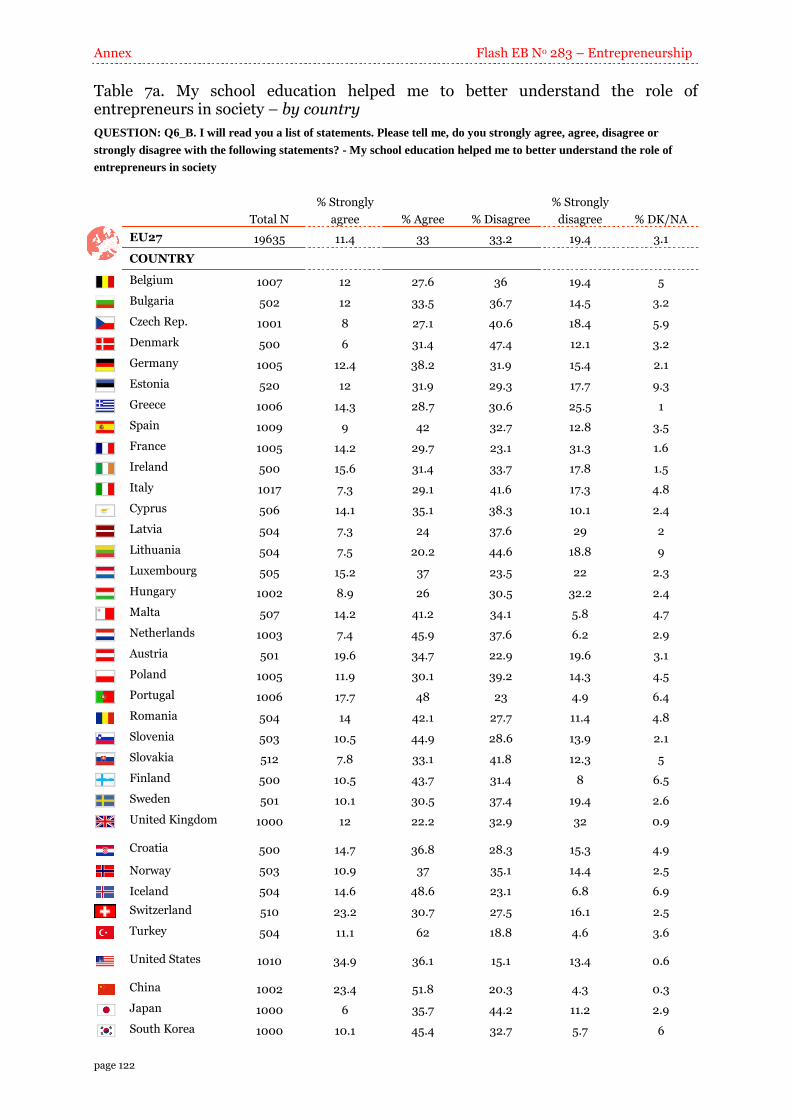
Annex Flash EB No 283 – Entrepreneurship
page 122
Table 7a. My school education helped me to better understand the role of entrepreneurs in society – by country
QUESTION: Q6_B. I will read you a list of statements. Please tell me, do you strongly agree, agree, disagree or
strongly disagree with the following statements? - My school education helped me to better understand the role of
entrepreneurs in society
Total N
% Strongly
agree % Agree % Disagree
% Strongly
disagree % DK/NA
EU27 19635 11.4 33 33.2 19.4 3.1
COUNTRY
Belgium 1007 12 27.6 36 19.4 5
Bulgaria 502 12 33.5 36.7 14.5 3.2
Czech Rep. 1001 8 27.1 40.6 18.4 5.9
Denmark 500 6 31.4 47.4 12.1 3.2
Germany 1005 12.4 38.2 31.9 15.4 2.1
Estonia 520 12 31.9 29.3 17.7 9.3
Greece 1006 14.3 28.7 30.6 25.5 1
Spain 1009 9 42 32.7 12.8 3.5
France 1005 14.2 29.7 23.1 31.3 1.6
Ireland 500 15.6 31.4 33.7 17.8 1.5
Italy 1017 7.3 29.1 41.6 17.3 4.8
Cyprus 506 14.1 35.1 38.3 10.1 2.4
Latvia 504 7.3 24 37.6 29 2
Lithuania 504 7.5 20.2 44.6 18.8 9
Luxembourg 505 15.2 37 23.5 22 2.3
Hungary 1002 8.9 26 30.5 32.2 2.4
Malta 507 14.2 41.2 34.1 5.8 4.7
Netherlands 1003 7.4 45.9 37.6 6.2 2.9
Austria 501 19.6 34.7 22.9 19.6 3.1
Poland 1005 11.9 30.1 39.2 14.3 4.5
Portugal 1006 17.7 48 23 4.9 6.4
Romania 504 14 42.1 27.7 11.4 4.8
Slovenia 503 10.5 44.9 28.6 13.9 2.1
Slovakia 512 7.8 33.1 41.8 12.3 5
Finland 500 10.5 43.7 31.4 8 6.5
Sweden 501 10.1 30.5 37.4 19.4 2.6
United Kingdom 1000 12 22.2 32.9 32 0.9
Croatia 500 14.7 36.8 28.3 15.3 4.9
Norway 503 10.9 37 35.1 14.4 2.5
Iceland 504 14.6 48.6 23.1 6.8 6.9
Switzerland 510 23.2 30.7 27.5 16.1 2.5
Turkey 504 11.1 62 18.8 4.6 3.6
United States 1010 34.9 36.1 15.1 13.4 0.6
China 1002 23.4 51.8 20.3 4.3 0.3
Japan 1000 6 35.7 44.2 11.2 2.9
South Korea 1000 10.1 45.4 32.7 5.7 6
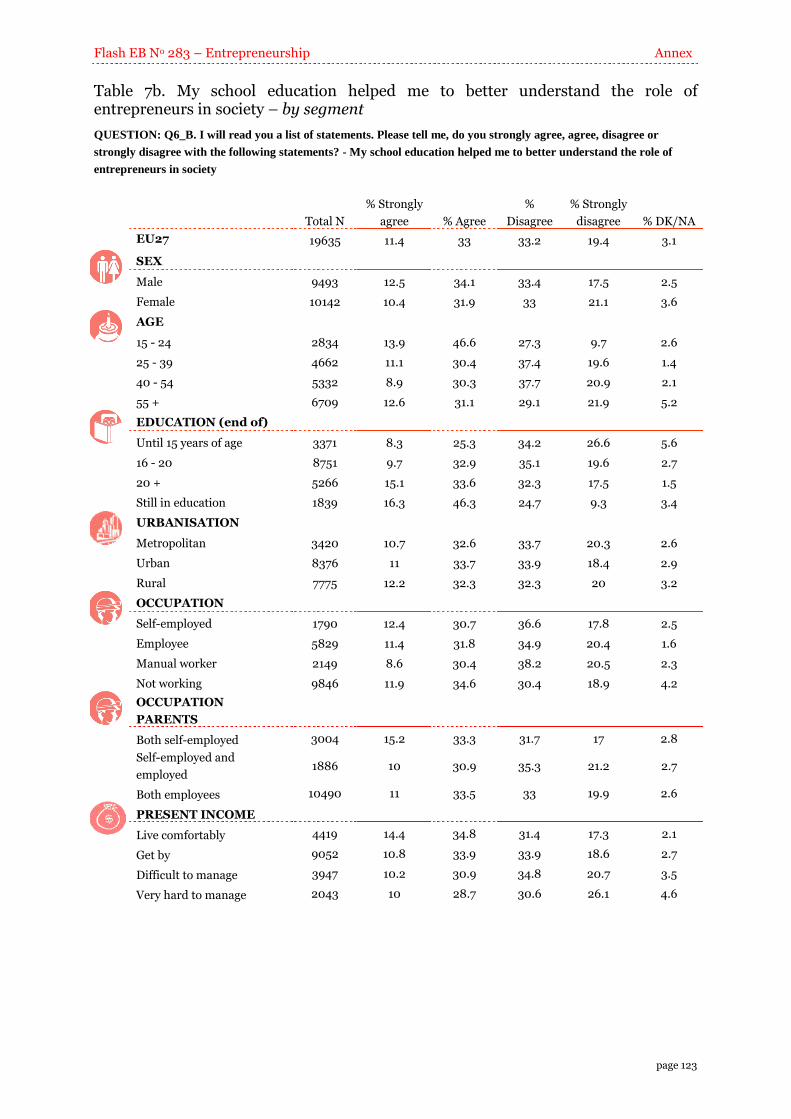
Flash EB No 283 – Entrepreneurship Annex
page 123
Table 7b. My school education helped me to better understand the role of entrepreneurs in society – by segment
QUESTION: Q6_B. I will read you a list of statements. Please tell me, do you strongly agree, agree, disagree or
strongly disagree with the following statements? - My school education helped me to better understand the role of
entrepreneurs in society
Total N
% Strongly
agree % Agree
%
Disagree
% Strongly
disagree % DK/NA
EU27 19635 11.4 33 33.2 19.4 3.1
SEX
Male 9493 12.5 34.1 33.4 17.5 2.5
Female 10142 10.4 31.9 33 21.1 3.6
AGE
15 - 24 2834 13.9 46.6 27.3 9.7 2.6
25 - 39 4662 11.1 30.4 37.4 19.6 1.4
40 - 54 5332 8.9 30.3 37.7 20.9 2.1
55 + 6709 12.6 31.1 29.1 21.9 5.2
EDUCATION (end of)
Until 15 years of age 3371 8.3 25.3 34.2 26.6 5.6
16 - 20 8751 9.7 32.9 35.1 19.6 2.7
20 + 5266 15.1 33.6 32.3 17.5 1.5
Still in education 1839 16.3 46.3 24.7 9.3 3.4
URBANISATION
Metropolitan 3420 10.7 32.6 33.7 20.3 2.6
Urban 8376 11 33.7 33.9 18.4 2.9
Rural 7775 12.2 32.3 32.3 20 3.2
OCCUPATION
Self-employed 1790 12.4 30.7 36.6 17.8 2.5
Employee 5829 11.4 31.8 34.9 20.4 1.6
Manual worker 2149 8.6 30.4 38.2 20.5 2.3
Not working 9846 11.9 34.6 30.4 18.9 4.2
OCCUPATION
PARENTS
Both self-employed 3004 15.2 33.3 31.7 17 2.8
Self-employed and
employed 1886 10 30.9 35.3 21.2 2.7
Both employees 10490 11 33.5 33 19.9 2.6
PRESENT INCOME
Live comfortably 4419 14.4 34.8 31.4 17.3 2.1
Get by 9052 10.8 33.9 33.9 18.6 2.7
Difficult to manage 3947 10.2 30.9 34.8 20.7 3.5
Very hard to manage 2043 10 28.7 30.6 26.1 4.6
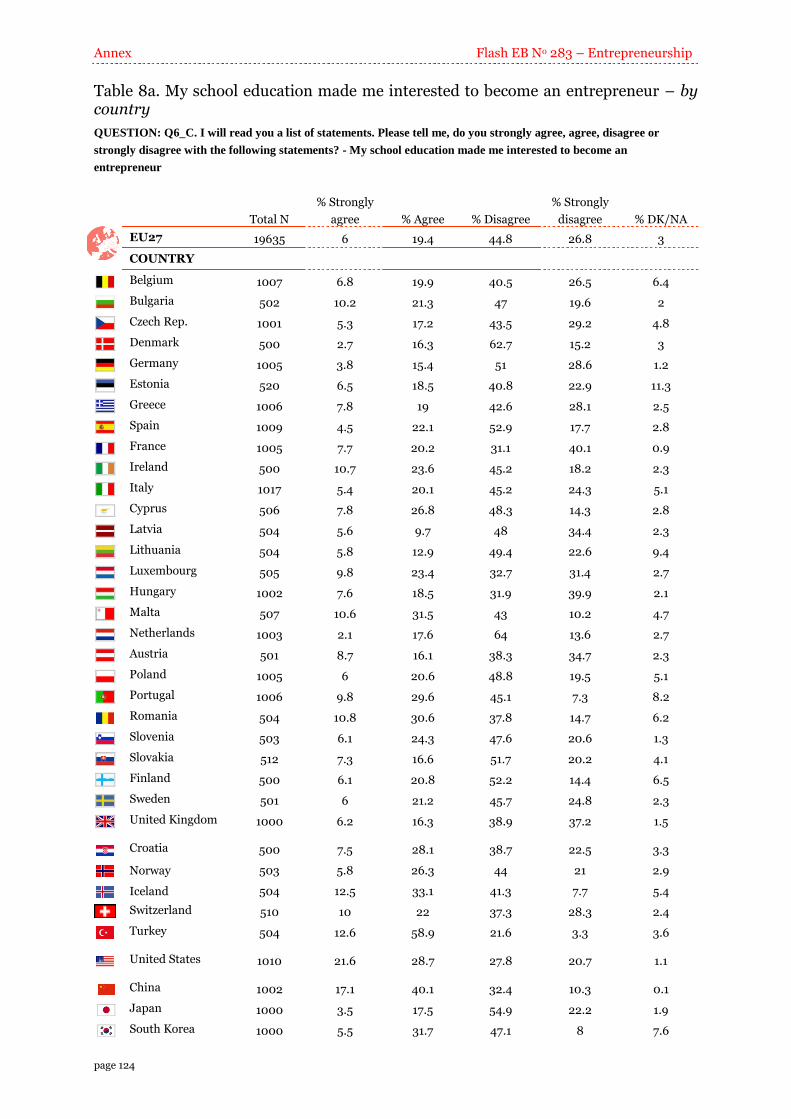
Annex Flash EB No 283 – Entrepreneurship
page 124
Table 8a. My school education made me interested to become an entrepreneur – by country
QUESTION: Q6_C. I will read you a list of statements. Please tell me, do you strongly agree, agree, disagree or
strongly disagree with the following statements? - My school education made me interested to become an
entrepreneur
Total N
% Strongly
agree % Agree % Disagree
% Strongly
disagree % DK/NA
EU27 19635 6 19.4 44.8 26.8 3
COUNTRY
Belgium 1007 6.8 19.9 40.5 26.5 6.4
Bulgaria 502 10.2 21.3 47 19.6 2
Czech Rep. 1001 5.3 17.2 43.5 29.2 4.8
Denmark 500 2.7 16.3 62.7 15.2 3
Germany 1005 3.8 15.4 51 28.6 1.2
Estonia 520 6.5 18.5 40.8 22.9 11.3
Greece 1006 7.8 19 42.6 28.1 2.5
Spain 1009 4.5 22.1 52.9 17.7 2.8
France 1005 7.7 20.2 31.1 40.1 0.9
Ireland 500 10.7 23.6 45.2 18.2 2.3
Italy 1017 5.4 20.1 45.2 24.3 5.1
Cyprus 506 7.8 26.8 48.3 14.3 2.8
Latvia 504 5.6 9.7 48 34.4 2.3
Lithuania 504 5.8 12.9 49.4 22.6 9.4
Luxembourg 505 9.8 23.4 32.7 31.4 2.7
Hungary 1002 7.6 18.5 31.9 39.9 2.1
Malta 507 10.6 31.5 43 10.2 4.7
Netherlands 1003 2.1 17.6 64 13.6 2.7
Austria 501 8.7 16.1 38.3 34.7 2.3
Poland 1005 6 20.6 48.8 19.5 5.1
Portugal 1006 9.8 29.6 45.1 7.3 8.2
Romania 504 10.8 30.6 37.8 14.7 6.2
Slovenia 503 6.1 24.3 47.6 20.6 1.3
Slovakia 512 7.3 16.6 51.7 20.2 4.1
Finland 500 6.1 20.8 52.2 14.4 6.5
Sweden 501 6 21.2 45.7 24.8 2.3
United Kingdom 1000 6.2 16.3 38.9 37.2 1.5
Croatia 500 7.5 28.1 38.7 22.5 3.3
Norway 503 5.8 26.3 44 21 2.9
Iceland 504 12.5 33.1 41.3 7.7 5.4
Switzerland 510 10 22 37.3 28.3 2.4
Turkey 504 12.6 58.9 21.6 3.3 3.6
United States 1010 21.6 28.7 27.8 20.7 1.1
China 1002 17.1 40.1 32.4 10.3 0.1
Japan 1000 3.5 17.5 54.9 22.2 1.9
South Korea 1000 5.5 31.7 47.1 8 7.6

Flash EB No 283 – Entrepreneurship Annex
page 125
Table 8b. My school education made me interested to become an entrepreneur – by segment
QUESTION: Q6_C. I will read you a list of statements. Please tell me, do you strongly agree, agree, disagree or
strongly disagree with the following statements? - My school education made me interested to become an
entrepreneur
Total N
% Strongly
agree % Agree
%
Disagree
% Strongly
disagree % DK/NA
EU27 19635 6 19.4 44.8 26.8 3
SEX
Male 9493 7 21.2 44.5 24.5 2.8
Female 10142 5.1 17.7 45 28.9 3.3
AGE
15 - 24 2834 9.8 29.4 41.4 16.8 2.7
25 - 39 4662 5.5 20.7 48.1 24.2 1.6
40 - 54 5332 4.6 16.2 48.5 28.3 2.4
55 + 6709 5.9 16.9 40.9 31.7 4.7
EDUCATION (end of)
Until 15 years of age 3371 4.9 13.7 40.5 36 5
16 - 20 8751 4.9 18 46.3 28.2 2.6
20 + 5266 7.2 21.8 46.9 22.3 1.9
Still in education 1839 11.1 31.2 38.7 15.4 3.6
URBANISATION
Metropolitan 3420 6.4 19.7 45.7 25.5 2.8
Urban 8376 5.7 19.1 46.6 25.5 3.1
Rural 7775 6.2 19.6 42.5 28.9 2.8
OCCUPATION
Self-employed 1790 10.2 25.7 41.5 19.9 2.7
Employee 5829 4.6 16.9 49.7 27.1 1.7
Manual worker 2149 3.8 18.3 46.2 29.9 1.9
Not working 9846 6.6 20 42.1 27.2 4.1
OCCUPATION
PARENTS
Both self-employed 3004 8.2 20.9 45.3 23 2.6
Self-employed and
employed 1886 5.9 20.4 45.9 25.3 2.5
Both employees 10490 5.5 18 45.6 28.6 2.4
PRESENT INCOME
Live comfortably 4419 6.8 21.3 45.6 24.5 1.8
Get by 9052 5.7 19.3 46.7 25.9 2.5
Difficult to manage 3947 5.6 17.9 45.5 27.2 3.9
Very hard to manage 2043 6.5 18.3 34.3 36.1 4.9
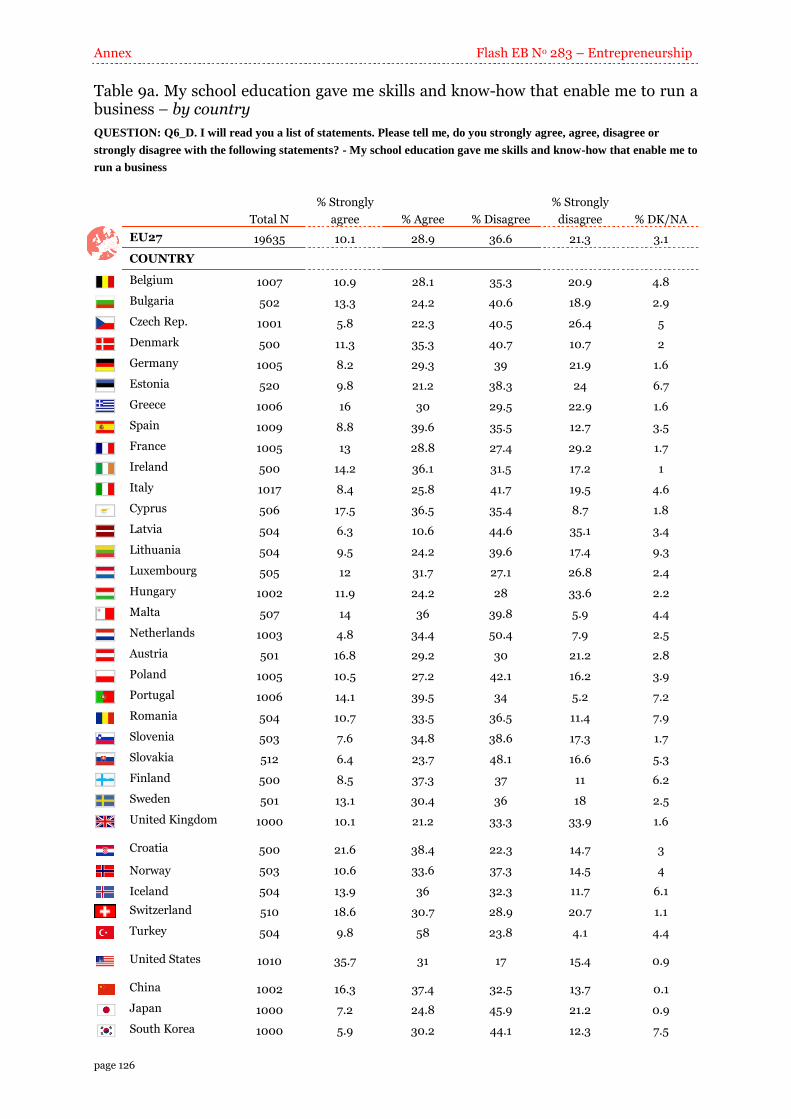
Annex Flash EB No 283 – Entrepreneurship
page 126
Table 9a. My school education gave me skills and know-how that enable me to run a business – by country
QUESTION: Q6_D. I will read you a list of statements. Please tell me, do you strongly agree, agree, disagree or
strongly disagree with the following statements? - My school education gave me skills and know-how that enable me to
run a business
Total N
% Strongly
agree % Agree % Disagree
% Strongly
disagree % DK/NA
EU27 19635 10.1 28.9 36.6 21.3 3.1
COUNTRY
Belgium 1007 10.9 28.1 35.3 20.9 4.8
Bulgaria 502 13.3 24.2 40.6 18.9 2.9
Czech Rep. 1001 5.8 22.3 40.5 26.4 5
Denmark 500 11.3 35.3 40.7 10.7 2
Germany 1005 8.2 29.3 39 21.9 1.6
Estonia 520 9.8 21.2 38.3 24 6.7
Greece 1006 16 30 29.5 22.9 1.6
Spain 1009 8.8 39.6 35.5 12.7 3.5
France 1005 13 28.8 27.4 29.2 1.7
Ireland 500 14.2 36.1 31.5 17.2 1
Italy 1017 8.4 25.8 41.7 19.5 4.6
Cyprus 506 17.5 36.5 35.4 8.7 1.8
Latvia 504 6.3 10.6 44.6 35.1 3.4
Lithuania 504 9.5 24.2 39.6 17.4 9.3
Luxembourg 505 12 31.7 27.1 26.8 2.4
Hungary 1002 11.9 24.2 28 33.6 2.2
Malta 507 14 36 39.8 5.9 4.4
Netherlands 1003 4.8 34.4 50.4 7.9 2.5
Austria 501 16.8 29.2 30 21.2 2.8
Poland 1005 10.5 27.2 42.1 16.2 3.9
Portugal 1006 14.1 39.5 34 5.2 7.2
Romania 504 10.7 33.5 36.5 11.4 7.9
Slovenia 503 7.6 34.8 38.6 17.3 1.7
Slovakia 512 6.4 23.7 48.1 16.6 5.3
Finland 500 8.5 37.3 37 11 6.2
Sweden 501 13.1 30.4 36 18 2.5
United Kingdom 1000 10.1 21.2 33.3 33.9 1.6
Croatia 500 21.6 38.4 22.3 14.7 3
Norway 503 10.6 33.6 37.3 14.5 4
Iceland 504 13.9 36 32.3 11.7 6.1
Switzerland 510 18.6 30.7 28.9 20.7 1.1
Turkey 504 9.8 58 23.8 4.1 4.4
United States 1010 35.7 31 17 15.4 0.9
China 1002 16.3 37.4 32.5 13.7 0.1
Japan 1000 7.2 24.8 45.9 21.2 0.9
South Korea 1000 5.9 30.2 44.1 12.3 7.5
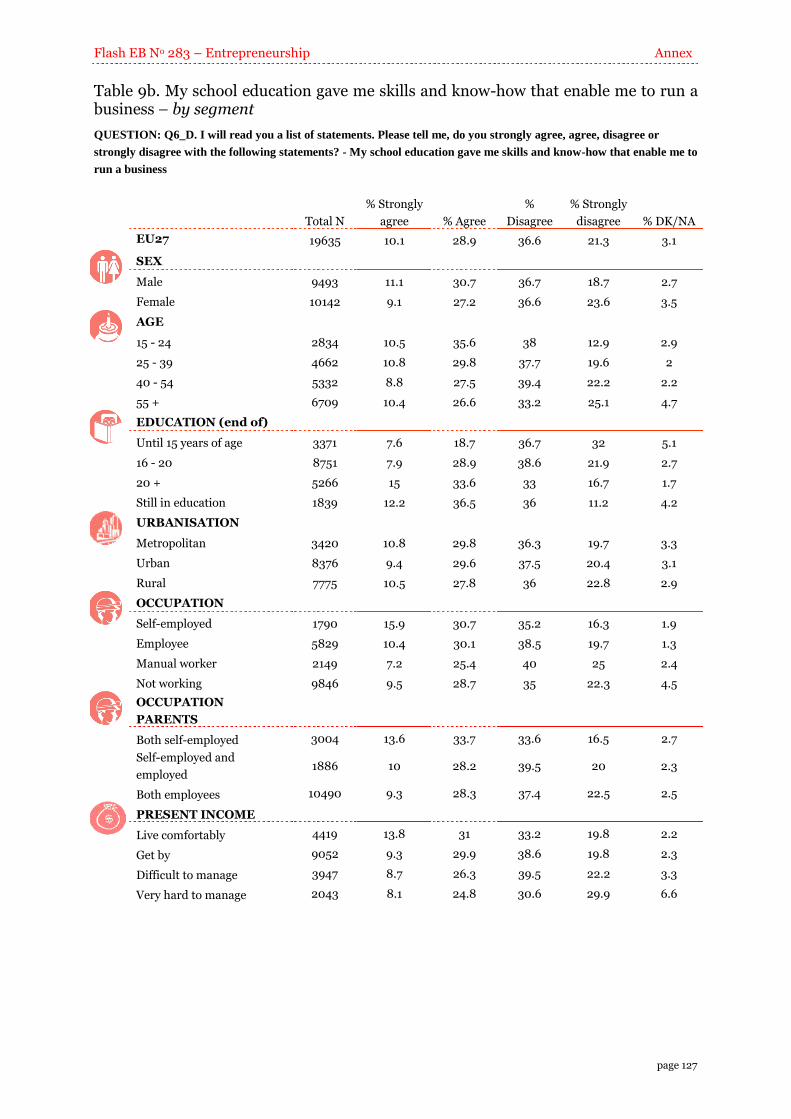
Flash EB No 283 – Entrepreneurship Annex
page 127
Table 9b. My school education gave me skills and know-how that enable me to run a business – by segment
QUESTION: Q6_D. I will read you a list of statements. Please tell me, do you strongly agree, agree, disagree or
strongly disagree with the following statements? - My school education gave me skills and know-how that enable me to
run a business
Total N
% Strongly
agree % Agree
%
Disagree
% Strongly
disagree % DK/NA
EU27 19635 10.1 28.9 36.6 21.3 3.1
SEX
Male 9493 11.1 30.7 36.7 18.7 2.7
Female 10142 9.1 27.2 36.6 23.6 3.5
AGE
15 - 24 2834 10.5 35.6 38 12.9 2.9
25 - 39 4662 10.8 29.8 37.7 19.6 2
40 - 54 5332 8.8 27.5 39.4 22.2 2.2
55 + 6709 10.4 26.6 33.2 25.1 4.7
EDUCATION (end of)
Until 15 years of age 3371 7.6 18.7 36.7 32 5.1
16 - 20 8751 7.9 28.9 38.6 21.9 2.7
20 + 5266 15 33.6 33 16.7 1.7
Still in education 1839 12.2 36.5 36 11.2 4.2
URBANISATION
Metropolitan 3420 10.8 29.8 36.3 19.7 3.3
Urban 8376 9.4 29.6 37.5 20.4 3.1
Rural 7775 10.5 27.8 36 22.8 2.9
OCCUPATION
Self-employed 1790 15.9 30.7 35.2 16.3 1.9
Employee 5829 10.4 30.1 38.5 19.7 1.3
Manual worker 2149 7.2 25.4 40 25 2.4
Not working 9846 9.5 28.7 35 22.3 4.5
OCCUPATION
PARENTS
Both self-employed 3004 13.6 33.7 33.6 16.5 2.7
Self-employed and
employed 1886 10 28.2 39.5 20 2.3
Both employees 10490 9.3 28.3 37.4 22.5 2.5
PRESENT INCOME
Live comfortably 4419 13.8 31 33.2 19.8 2.2
Get by 9052 9.3 29.9 38.6 19.8 2.3
Difficult to manage 3947 8.7 26.3 39.5 22.2 3.3
Very hard to manage 2043 8.1 24.8 30.6 29.9 6.6
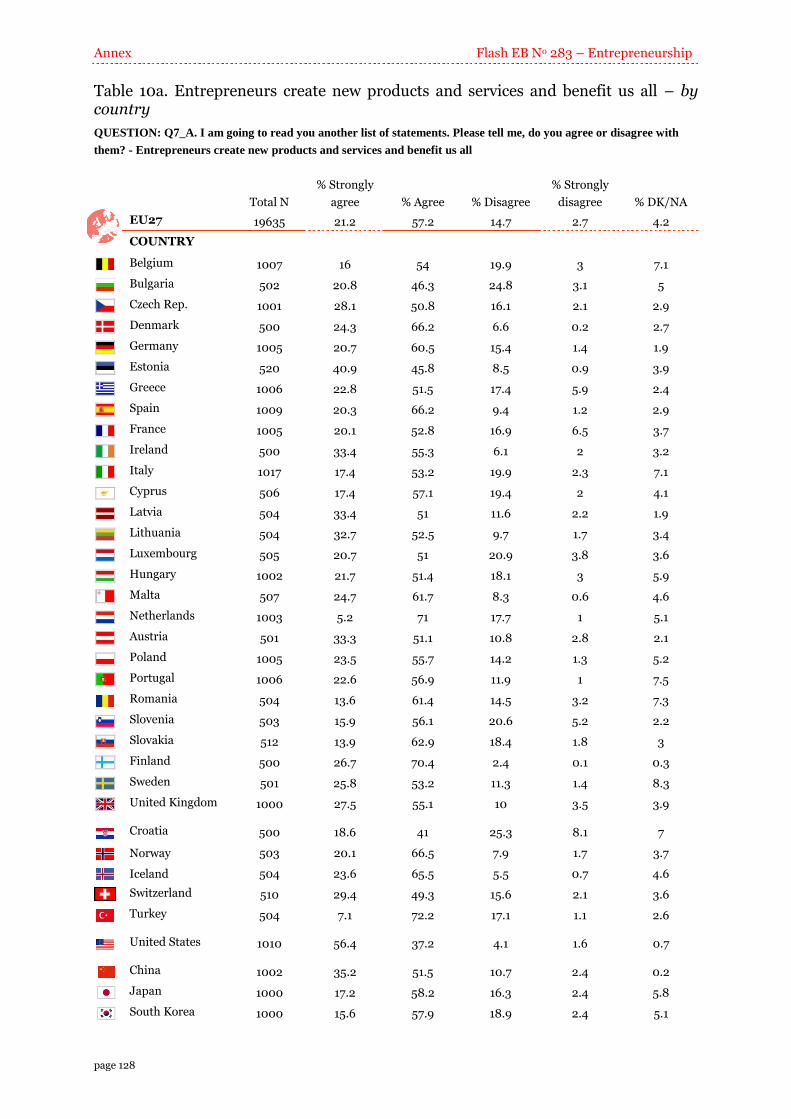
Annex Flash EB No 283 – Entrepreneurship
page 128
Table 10a. Entrepreneurs create new products and services and benefit us all – by country
QUESTION: Q7_A. I am going to read you another list of statements. Please tell me, do you agree or disagree with
them? - Entrepreneurs create new products and services and benefit us all
Total N
% Strongly
agree % Agree % Disagree
% Strongly
disagree % DK/NA
EU27 19635 21.2 57.2 14.7 2.7 4.2
COUNTRY
Belgium 1007 16 54 19.9 3 7.1
Bulgaria 502 20.8 46.3 24.8 3.1 5
Czech Rep. 1001 28.1 50.8 16.1 2.1 2.9
Denmark 500 24.3 66.2 6.6 0.2 2.7
Germany 1005 20.7 60.5 15.4 1.4 1.9
Estonia 520 40.9 45.8 8.5 0.9 3.9
Greece 1006 22.8 51.5 17.4 5.9 2.4
Spain 1009 20.3 66.2 9.4 1.2 2.9
France 1005 20.1 52.8 16.9 6.5 3.7
Ireland 500 33.4 55.3 6.1 2 3.2
Italy 1017 17.4 53.2 19.9 2.3 7.1
Cyprus 506 17.4 57.1 19.4 2 4.1
Latvia 504 33.4 51 11.6 2.2 1.9
Lithuania 504 32.7 52.5 9.7 1.7 3.4
Luxembourg 505 20.7 51 20.9 3.8 3.6
Hungary 1002 21.7 51.4 18.1 3 5.9
Malta 507 24.7 61.7 8.3 0.6 4.6
Netherlands 1003 5.2 71 17.7 1 5.1
Austria 501 33.3 51.1 10.8 2.8 2.1
Poland 1005 23.5 55.7 14.2 1.3 5.2
Portugal 1006 22.6 56.9 11.9 1 7.5
Romania 504 13.6 61.4 14.5 3.2 7.3
Slovenia 503 15.9 56.1 20.6 5.2 2.2
Slovakia 512 13.9 62.9 18.4 1.8 3
Finland 500 26.7 70.4 2.4 0.1 0.3
Sweden 501 25.8 53.2 11.3 1.4 8.3
United Kingdom 1000 27.5 55.1 10 3.5 3.9
Croatia 500 18.6 41 25.3 8.1 7
Norway 503 20.1 66.5 7.9 1.7 3.7
Iceland 504 23.6 65.5 5.5 0.7 4.6
Switzerland 510 29.4 49.3 15.6 2.1 3.6
Turkey 504 7.1 72.2 17.1 1.1 2.6
United States 1010 56.4 37.2 4.1 1.6 0.7
China 1002 35.2 51.5 10.7 2.4 0.2
Japan 1000 17.2 58.2 16.3 2.4 5.8
South Korea 1000 15.6 57.9 18.9 2.4 5.1
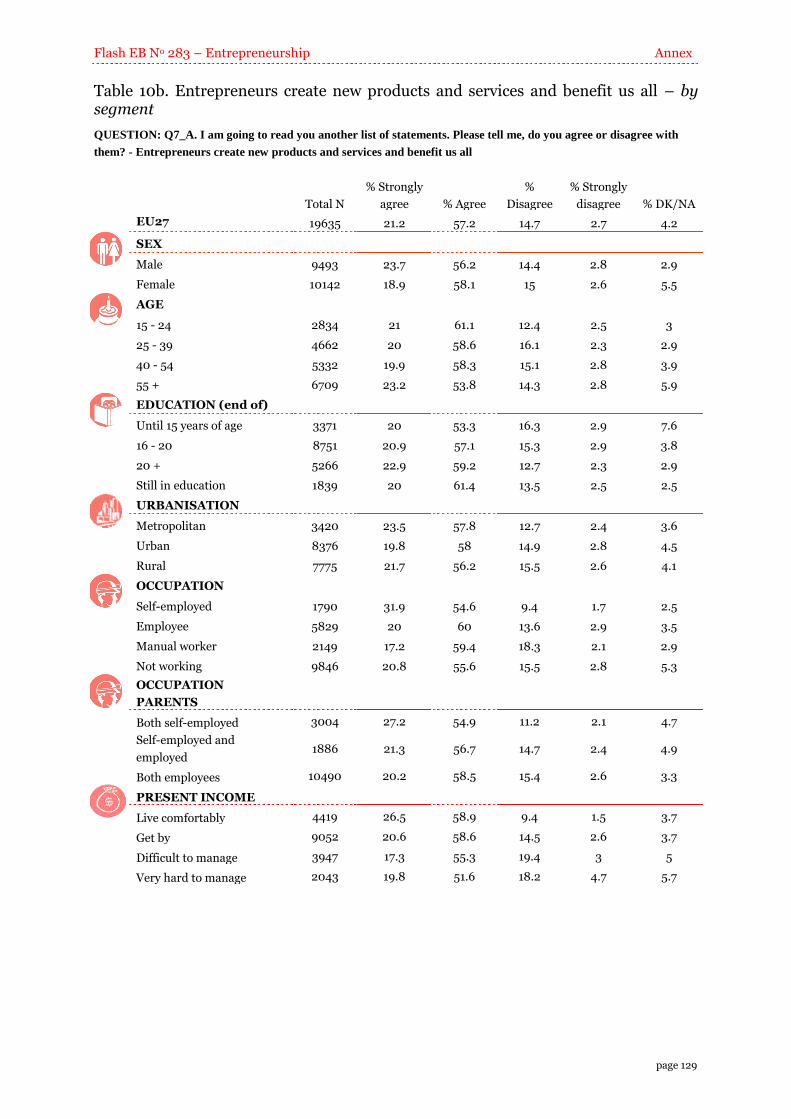
Flash EB No 283 – Entrepreneurship Annex
page 129
Table 10b. Entrepreneurs create new products and services and benefit us all – by segment
QUESTION: Q7_A. I am going to read you another list of statements. Please tell me, do you agree or disagree with
them? - Entrepreneurs create new products and services and benefit us all
Total N
% Strongly
agree % Agree
%
Disagree
% Strongly
disagree % DK/NA
EU27 19635 21.2 57.2 14.7 2.7 4.2
SEX
Male 9493 23.7 56.2 14.4 2.8 2.9
Female 10142 18.9 58.1 15 2.6 5.5
AGE
15 - 24 2834 21 61.1 12.4 2.5 3
25 - 39 4662 20 58.6 16.1 2.3 2.9
40 - 54 5332 19.9 58.3 15.1 2.8 3.9
55 + 6709 23.2 53.8 14.3 2.8 5.9
EDUCATION (end of)
Until 15 years of age 3371 20 53.3 16.3 2.9 7.6
16 - 20 8751 20.9 57.1 15.3 2.9 3.8
20 + 5266 22.9 59.2 12.7 2.3 2.9
Still in education 1839 20 61.4 13.5 2.5 2.5
URBANISATION
Metropolitan 3420 23.5 57.8 12.7 2.4 3.6
Urban 8376 19.8 58 14.9 2.8 4.5
Rural 7775 21.7 56.2 15.5 2.6 4.1
OCCUPATION
Self-employed 1790 31.9 54.6 9.4 1.7 2.5
Employee 5829 20 60 13.6 2.9 3.5
Manual worker 2149 17.2 59.4 18.3 2.1 2.9
Not working 9846 20.8 55.6 15.5 2.8 5.3
OCCUPATION
PARENTS
Both self-employed 3004 27.2 54.9 11.2 2.1 4.7
Self-employed and
employed 1886 21.3 56.7 14.7 2.4 4.9
Both employees 10490 20.2 58.5 15.4 2.6 3.3
PRESENT INCOME
Live comfortably 4419 26.5 58.9 9.4 1.5 3.7
Get by 9052 20.6 58.6 14.5 2.6 3.7
Difficult to manage 3947 17.3 55.3 19.4 3 5
Very hard to manage 2043 19.8 51.6 18.2 4.7 5.7
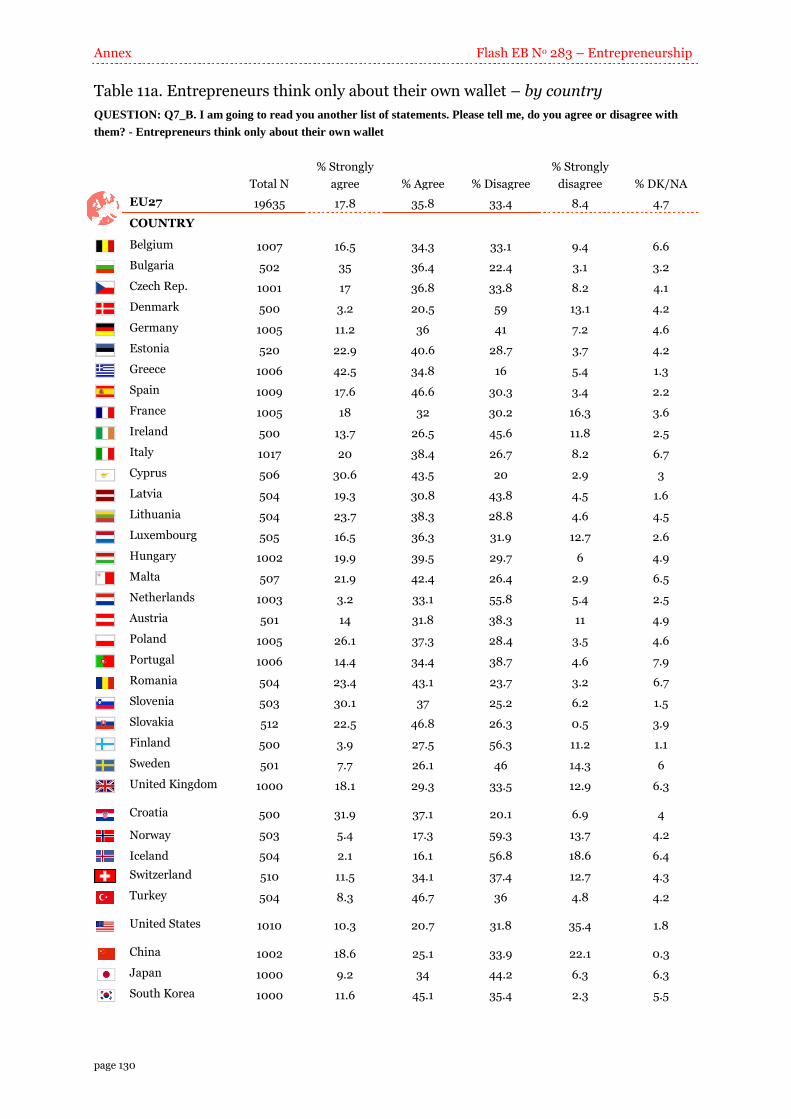
Annex Flash EB No 283 – Entrepreneurship
page 130
Table 11a. Entrepreneurs think only about their own wallet – by country
QUESTION: Q7_B. I am going to read you another list of statements. Please tell me, do you agree or disagree with
them? - Entrepreneurs think only about their own wallet
Total N
% Strongly
agree % Agree % Disagree
% Strongly
disagree % DK/NA
EU27 19635 17.8 35.8 33.4 8.4 4.7
COUNTRY
Belgium 1007 16.5 34.3 33.1 9.4 6.6
Bulgaria 502 35 36.4 22.4 3.1 3.2
Czech Rep. 1001 17 36.8 33.8 8.2 4.1
Denmark 500 3.2 20.5 59 13.1 4.2
Germany 1005 11.2 36 41 7.2 4.6
Estonia 520 22.9 40.6 28.7 3.7 4.2
Greece 1006 42.5 34.8 16 5.4 1.3
Spain 1009 17.6 46.6 30.3 3.4 2.2
France 1005 18 32 30.2 16.3 3.6
Ireland 500 13.7 26.5 45.6 11.8 2.5
Italy 1017 20 38.4 26.7 8.2 6.7
Cyprus 506 30.6 43.5 20 2.9 3
Latvia 504 19.3 30.8 43.8 4.5 1.6
Lithuania 504 23.7 38.3 28.8 4.6 4.5
Luxembourg 505 16.5 36.3 31.9 12.7 2.6
Hungary 1002 19.9 39.5 29.7 6 4.9
Malta 507 21.9 42.4 26.4 2.9 6.5
Netherlands 1003 3.2 33.1 55.8 5.4 2.5
Austria 501 14 31.8 38.3 11 4.9
Poland 1005 26.1 37.3 28.4 3.5 4.6
Portugal 1006 14.4 34.4 38.7 4.6 7.9
Romania 504 23.4 43.1 23.7 3.2 6.7
Slovenia 503 30.1 37 25.2 6.2 1.5
Slovakia 512 22.5 46.8 26.3 0.5 3.9
Finland 500 3.9 27.5 56.3 11.2 1.1
Sweden 501 7.7 26.1 46 14.3 6
United Kingdom 1000 18.1 29.3 33.5 12.9 6.3
Croatia 500 31.9 37.1 20.1 6.9 4
Norway 503 5.4 17.3 59.3 13.7 4.2
Iceland 504 2.1 16.1 56.8 18.6 6.4
Switzerland 510 11.5 34.1 37.4 12.7 4.3
Turkey 504 8.3 46.7 36 4.8 4.2
United States 1010 10.3 20.7 31.8 35.4 1.8
China 1002 18.6 25.1 33.9 22.1 0.3
Japan 1000 9.2 34 44.2 6.3 6.3
South Korea 1000 11.6 45.1 35.4 2.3 5.5

Flash EB No 283 – Entrepreneurship Annex
page 131
Table 11b. Entrepreneurs think only about their own wallet – by segment
QUESTION: Q7_B. I am going to read you another list of statements. Please tell me, do you agree or disagree with
them? - Entrepreneurs think only about their own wallet
Total N
% Strongly
agree % Agree
%
Disagree
% Strongly
disagree % DK/NA
EU27 19635 17.8 35.8 33.4 8.4 4.7
SEX
Male 9493 17.1 36.2 33.8 8.9 4
Female 10142 18.4 35.4 32.9 7.9 5.3
AGE
15 - 24 2834 14.4 35.3 36.7 9.6 4
25 - 39 4662 16.9 39.8 32.7 7 3.7
40 - 54 5332 17.7 34.4 34.8 8.9 4.2
55 + 6709 19.8 34.6 31.2 8.5 6
EDUCATION (end of)
Until 15 years of age 3371 24.9 36.1 26 6.2 6.8
16 - 20 8751 19.3 37.2 31 8 4.5
20 + 5266 12.1 33.1 40.5 10.5 3.9
Still in education 1839 13 35 38.9 9.3 3.7
URBANISATION
Metropolitan 3420 17.3 35 33.9 9.3 4.6
Urban 8376 17.9 37.2 32.7 7.8 4.5
Rural 7775 18 34.7 33.8 8.7 4.8
OCCUPATION
Self-employed 1790 10.9 26.9 41.3 18.4 2.5
Employee 5829 14.1 35.5 37.6 8.9 3.9
Manual worker 2149 23 41.2 28.1 3.1 4.6
Not working 9846 20.1 36.4 30.7 7.4 5.5
OCCUPATION
PARENTS
Both self-employed 3004 15.3 32.9 36.6 11.4 3.8
Self-employed and
employed 1886 15.6 34.9 35.1 9.8 4.6
Both employees 10490 17.9 36.9 33.2 8.1 3.9
PRESENT INCOME
Live comfortably 4419 9.8 34.1 40.4 11.5 4.2
Get by 9052 16.2 34.5 36 8.6 4.7
Difficult to manage 3947 22.9 40 27.3 5.5 4.3
Very hard to manage 2043 32.2 37 18.8 6.2 5.8
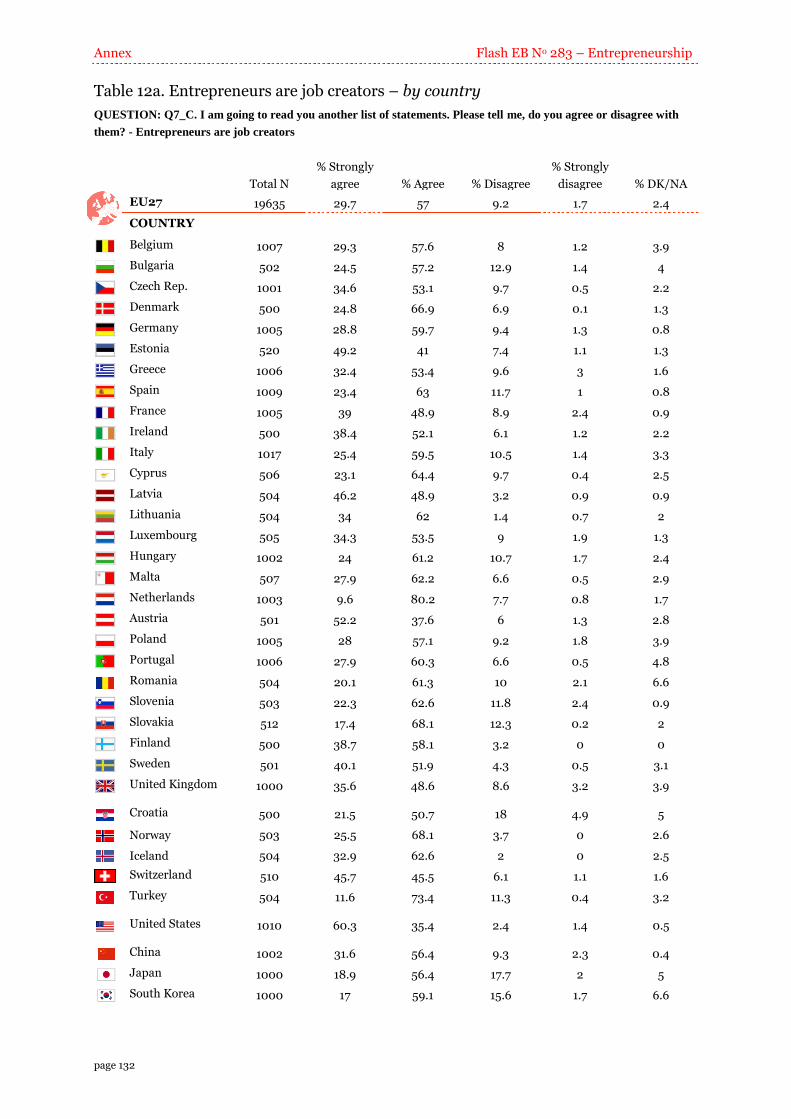
Annex Flash EB No 283 – Entrepreneurship
page 132
Table 12a. Entrepreneurs are job creators – by country
QUESTION: Q7_C. I am going to read you another list of statements. Please tell me, do you agree or disagree with
them? - Entrepreneurs are job creators
Total N
% Strongly
agree % Agree % Disagree
% Strongly
disagree % DK/NA
EU27 19635 29.7 57 9.2 1.7 2.4
COUNTRY
Belgium 1007 29.3 57.6 8 1.2 3.9
Bulgaria 502 24.5 57.2 12.9 1.4 4
Czech Rep. 1001 34.6 53.1 9.7 0.5 2.2
Denmark 500 24.8 66.9 6.9 0.1 1.3
Germany 1005 28.8 59.7 9.4 1.3 0.8
Estonia 520 49.2 41 7.4 1.1 1.3
Greece 1006 32.4 53.4 9.6 3 1.6
Spain 1009 23.4 63 11.7 1 0.8
France 1005 39 48.9 8.9 2.4 0.9
Ireland 500 38.4 52.1 6.1 1.2 2.2
Italy 1017 25.4 59.5 10.5 1.4 3.3
Cyprus 506 23.1 64.4 9.7 0.4 2.5
Latvia 504 46.2 48.9 3.2 0.9 0.9
Lithuania 504 34 62 1.4 0.7 2
Luxembourg 505 34.3 53.5 9 1.9 1.3
Hungary 1002 24 61.2 10.7 1.7 2.4
Malta 507 27.9 62.2 6.6 0.5 2.9
Netherlands 1003 9.6 80.2 7.7 0.8 1.7
Austria 501 52.2 37.6 6 1.3 2.8
Poland 1005 28 57.1 9.2 1.8 3.9
Portugal 1006 27.9 60.3 6.6 0.5 4.8
Romania 504 20.1 61.3 10 2.1 6.6
Slovenia 503 22.3 62.6 11.8 2.4 0.9
Slovakia 512 17.4 68.1 12.3 0.2 2
Finland 500 38.7 58.1 3.2 0 0
Sweden 501 40.1 51.9 4.3 0.5 3.1
United Kingdom 1000 35.6 48.6 8.6 3.2 3.9
Croatia 500 21.5 50.7 18 4.9 5
Norway 503 25.5 68.1 3.7 0 2.6
Iceland 504 32.9 62.6 2 0 2.5
Switzerland 510 45.7 45.5 6.1 1.1 1.6
Turkey 504 11.6 73.4 11.3 0.4 3.2
United States 1010 60.3 35.4 2.4 1.4 0.5
China 1002 31.6 56.4 9.3 2.3 0.4
Japan 1000 18.9 56.4 17.7 2 5
South Korea 1000 17 59.1 15.6 1.7 6.6
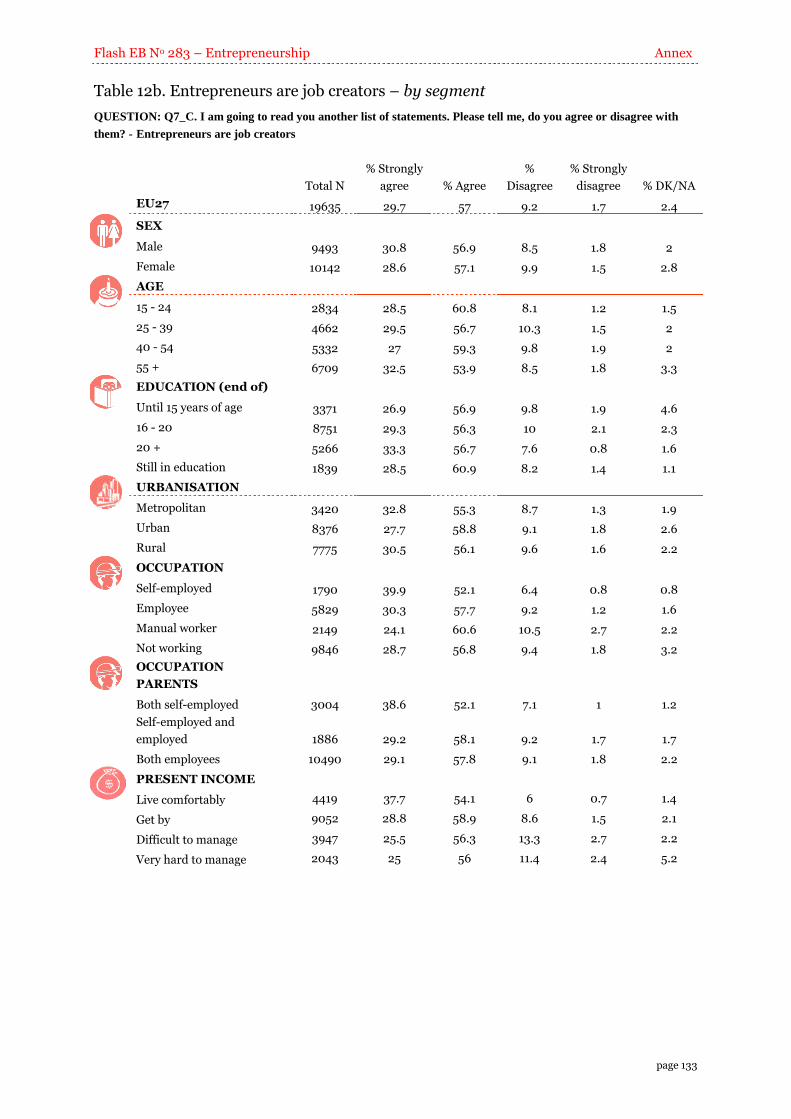
Flash EB No 283 – Entrepreneurship Annex
page 133
Table 12b. Entrepreneurs are job creators – by segment
QUESTION: Q7_C. I am going to read you another list of statements. Please tell me, do you agree or disagree with
them? - Entrepreneurs are job creators
Total N
% Strongly
agree % Agree
%
Disagree
% Strongly
disagree % DK/NA
EU27 19635 29.7 57 9.2 1.7 2.4
SEX
Male 9493 30.8 56.9 8.5 1.8 2
Female 10142 28.6 57.1 9.9 1.5 2.8
AGE
15 - 24 2834 28.5 60.8 8.1 1.2 1.5
25 - 39 4662 29.5 56.7 10.3 1.5 2
40 - 54 5332 27 59.3 9.8 1.9 2
55 + 6709 32.5 53.9 8.5 1.8 3.3
EDUCATION (end of)
Until 15 years of age 3371 26.9 56.9 9.8 1.9 4.6
16 - 20 8751 29.3 56.3 10 2.1 2.3
20 + 5266 33.3 56.7 7.6 0.8 1.6
Still in education 1839 28.5 60.9 8.2 1.4 1.1
URBANISATION
Metropolitan 3420 32.8 55.3 8.7 1.3 1.9
Urban 8376 27.7 58.8 9.1 1.8 2.6
Rural 7775 30.5 56.1 9.6 1.6 2.2
OCCUPATION
Self-employed 1790 39.9 52.1 6.4 0.8 0.8
Employee 5829 30.3 57.7 9.2 1.2 1.6
Manual worker 2149 24.1 60.6 10.5 2.7 2.2
Not working 9846 28.7 56.8 9.4 1.8 3.2
OCCUPATION
PARENTS
Both self-employed 3004 38.6 52.1 7.1 1 1.2
Self-employed and
employed 1886 29.2 58.1 9.2 1.7 1.7
Both employees 10490 29.1 57.8 9.1 1.8 2.2
PRESENT INCOME
Live comfortably 4419 37.7 54.1 6 0.7 1.4
Get by 9052 28.8 58.9 8.6 1.5 2.1
Difficult to manage 3947 25.5 56.3 13.3 2.7 2.2
Very hard to manage 2043 25 56 11.4 2.4 5.2
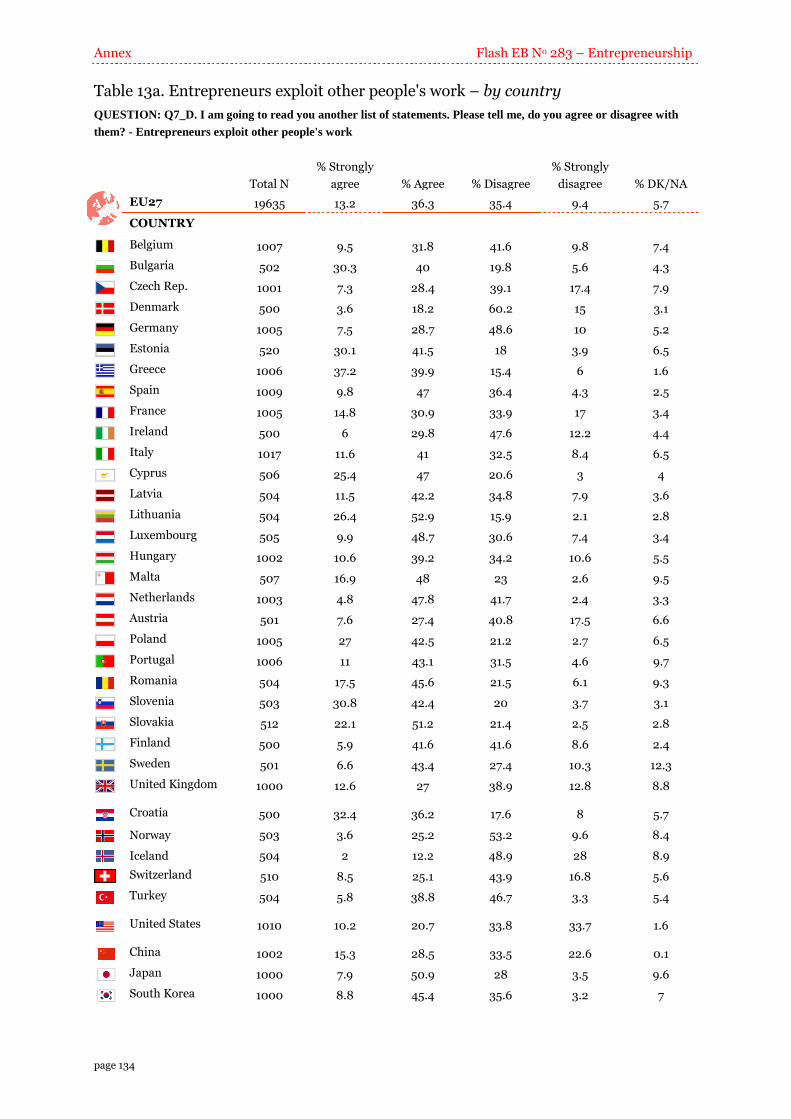
Annex Flash EB No 283 – Entrepreneurship
page 134
Table 13a. Entrepreneurs exploit other people's work – by country
QUESTION: Q7_D. I am going to read you another list of statements. Please tell me, do you agree or disagree with
them? - Entrepreneurs exploit other people's work
Total N
% Strongly
agree % Agree % Disagree
% Strongly
disagree % DK/NA
EU27 19635 13.2 36.3 35.4 9.4 5.7
COUNTRY
Belgium 1007 9.5 31.8 41.6 9.8 7.4
Bulgaria 502 30.3 40 19.8 5.6 4.3
Czech Rep. 1001 7.3 28.4 39.1 17.4 7.9
Denmark 500 3.6 18.2 60.2 15 3.1
Germany 1005 7.5 28.7 48.6 10 5.2
Estonia 520 30.1 41.5 18 3.9 6.5
Greece 1006 37.2 39.9 15.4 6 1.6
Spain 1009 9.8 47 36.4 4.3 2.5
France 1005 14.8 30.9 33.9 17 3.4
Ireland 500 6 29.8 47.6 12.2 4.4
Italy 1017 11.6 41 32.5 8.4 6.5
Cyprus 506 25.4 47 20.6 3 4
Latvia 504 11.5 42.2 34.8 7.9 3.6
Lithuania 504 26.4 52.9 15.9 2.1 2.8
Luxembourg 505 9.9 48.7 30.6 7.4 3.4
Hungary 1002 10.6 39.2 34.2 10.6 5.5
Malta 507 16.9 48 23 2.6 9.5
Netherlands 1003 4.8 47.8 41.7 2.4 3.3
Austria 501 7.6 27.4 40.8 17.5 6.6
Poland 1005 27 42.5 21.2 2.7 6.5
Portugal 1006 11 43.1 31.5 4.6 9.7
Romania 504 17.5 45.6 21.5 6.1 9.3
Slovenia 503 30.8 42.4 20 3.7 3.1
Slovakia 512 22.1 51.2 21.4 2.5 2.8
Finland 500 5.9 41.6 41.6 8.6 2.4
Sweden 501 6.6 43.4 27.4 10.3 12.3
United Kingdom 1000 12.6 27 38.9 12.8 8.8
Croatia 500 32.4 36.2 17.6 8 5.7
Norway 503 3.6 25.2 53.2 9.6 8.4
Iceland 504 2 12.2 48.9 28 8.9
Switzerland 510 8.5 25.1 43.9 16.8 5.6
Turkey 504 5.8 38.8 46.7 3.3 5.4
United States 1010 10.2 20.7 33.8 33.7 1.6
China 1002 15.3 28.5 33.5 22.6 0.1
Japan 1000 7.9 50.9 28 3.5 9.6
South Korea 1000 8.8 45.4 35.6 3.2 7
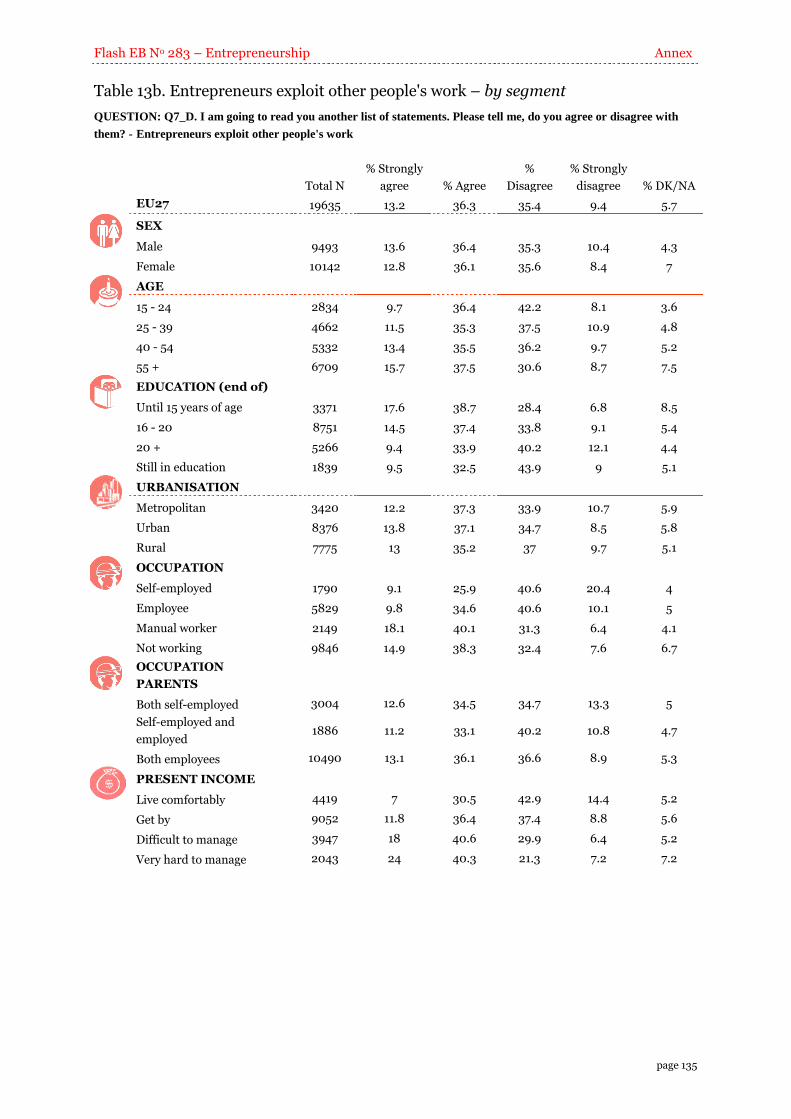
Flash EB No 283 – Entrepreneurship Annex
page 135
Table 13b. Entrepreneurs exploit other people's work – by segment
QUESTION: Q7_D. I am going to read you another list of statements. Please tell me, do you agree or disagree with
them? - Entrepreneurs exploit other people's work
Total N
% Strongly
agree % Agree
%
Disagree
% Strongly
disagree % DK/NA
EU27 19635 13.2 36.3 35.4 9.4 5.7
SEX
Male 9493 13.6 36.4 35.3 10.4 4.3
Female 10142 12.8 36.1 35.6 8.4 7
AGE
15 - 24 2834 9.7 36.4 42.2 8.1 3.6
25 - 39 4662 11.5 35.3 37.5 10.9 4.8
40 - 54 5332 13.4 35.5 36.2 9.7 5.2
55 + 6709 15.7 37.5 30.6 8.7 7.5
EDUCATION (end of)
Until 15 years of age 3371 17.6 38.7 28.4 6.8 8.5
16 - 20 8751 14.5 37.4 33.8 9.1 5.4
20 + 5266 9.4 33.9 40.2 12.1 4.4
Still in education 1839 9.5 32.5 43.9 9 5.1
URBANISATION
Metropolitan 3420 12.2 37.3 33.9 10.7 5.9
Urban 8376 13.8 37.1 34.7 8.5 5.8
Rural 7775 13 35.2 37 9.7 5.1
OCCUPATION
Self-employed 1790 9.1 25.9 40.6 20.4 4
Employee 5829 9.8 34.6 40.6 10.1 5
Manual worker 2149 18.1 40.1 31.3 6.4 4.1
Not working 9846 14.9 38.3 32.4 7.6 6.7
OCCUPATION
PARENTS
Both self-employed 3004 12.6 34.5 34.7 13.3 5
Self-employed and
employed 1886 11.2 33.1 40.2 10.8 4.7
Both employees 10490 13.1 36.1 36.6 8.9 5.3
PRESENT INCOME
Live comfortably 4419 7 30.5 42.9 14.4 5.2
Get by 9052 11.8 36.4 37.4 8.8 5.6
Difficult to manage 3947 18 40.6 29.9 6.4 5.2
Very hard to manage 2043 24 40.3 21.3 7.2 7.2
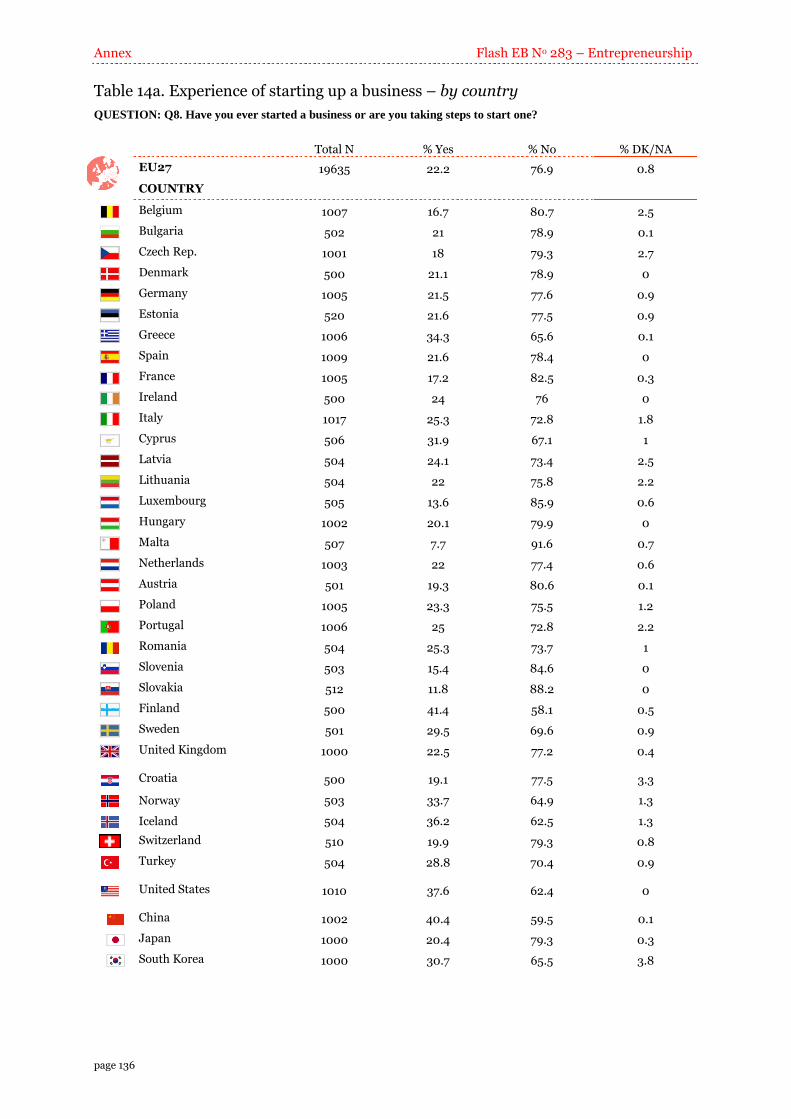
Annex Flash EB No 283 – Entrepreneurship
page 136
Table 14a. Experience of starting up a business – by country
QUESTION: Q8. Have you ever started a business or are you taking steps to start one?
Total N % Yes % No % DK/NA
EU27 19635 22.2 76.9 0.8
COUNTRY
Belgium 1007 16.7 80.7 2.5
Bulgaria 502 21 78.9 0.1
Czech Rep. 1001 18 79.3 2.7
Denmark 500 21.1 78.9 0
Germany 1005 21.5 77.6 0.9
Estonia 520 21.6 77.5 0.9
Greece 1006 34.3 65.6 0.1
Spain 1009 21.6 78.4 0
France 1005 17.2 82.5 0.3
Ireland 500 24 76 0
Italy 1017 25.3 72.8 1.8
Cyprus 506 31.9 67.1 1
Latvia 504 24.1 73.4 2.5
Lithuania 504 22 75.8 2.2
Luxembourg 505 13.6 85.9 0.6
Hungary 1002 20.1 79.9 0
Malta 507 7.7 91.6 0.7
Netherlands 1003 22 77.4 0.6
Austria 501 19.3 80.6 0.1
Poland 1005 23.3 75.5 1.2
Portugal 1006 25 72.8 2.2
Romania 504 25.3 73.7 1
Slovenia 503 15.4 84.6 0
Slovakia 512 11.8 88.2 0
Finland 500 41.4 58.1 0.5
Sweden 501 29.5 69.6 0.9
United Kingdom 1000 22.5 77.2 0.4
Croatia 500 19.1 77.5 3.3
Norway 503 33.7 64.9 1.3
Iceland 504 36.2 62.5 1.3
Switzerland 510 19.9 79.3 0.8
Turkey 504 28.8 70.4 0.9
United States 1010 37.6 62.4 0
China 1002 40.4 59.5 0.1
Japan 1000 20.4 79.3 0.3
South Korea 1000 30.7 65.5 3.8
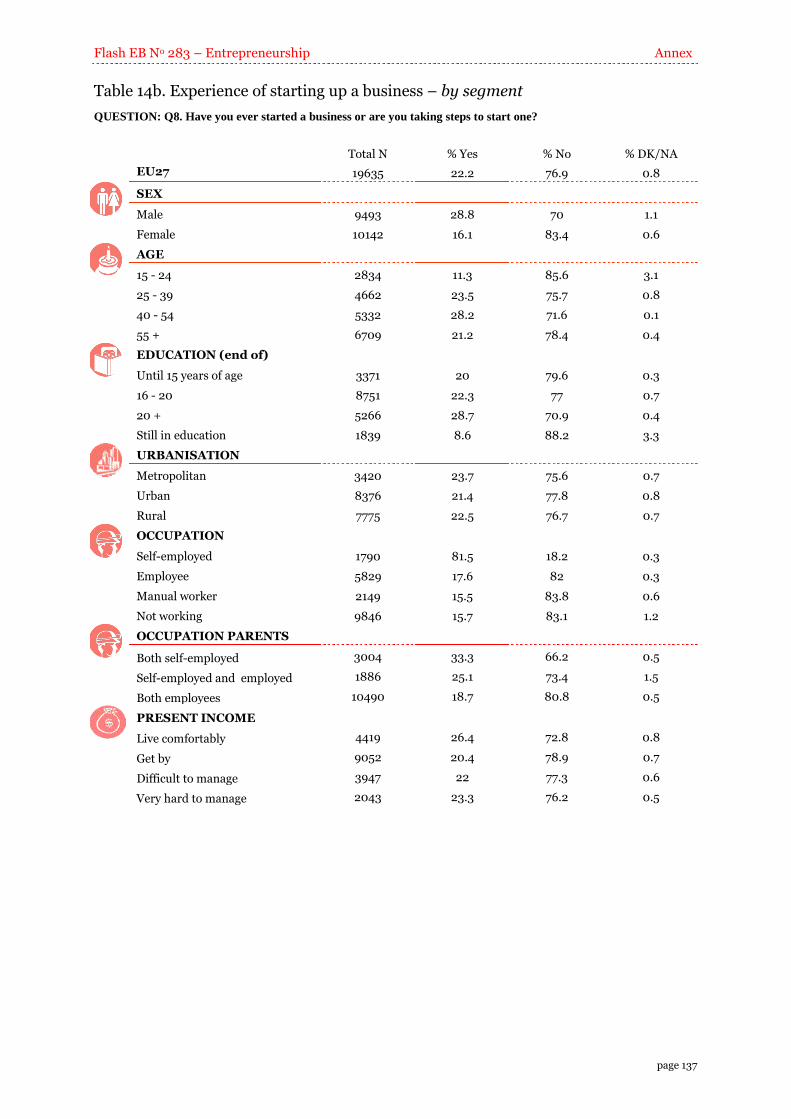
Flash EB No 283 – Entrepreneurship Annex
page 137
Table 14b. Experience of starting up a business – by segment
QUESTION: Q8. Have you ever started a business or are you taking steps to start one?
Total N % Yes % No % DK/NA
EU27 19635 22.2 76.9 0.8
SEX
Male 9493 28.8 70 1.1
Female 10142 16.1 83.4 0.6
AGE
15 - 24 2834 11.3 85.6 3.1
25 - 39 4662 23.5 75.7 0.8
40 - 54 5332 28.2 71.6 0.1
55 + 6709 21.2 78.4 0.4
EDUCATION (end of)
Until 15 years of age 3371 20 79.6 0.3
16 - 20 8751 22.3 77 0.7
20 + 5266 28.7 70.9 0.4
Still in education 1839 8.6 88.2 3.3
URBANISATION
Metropolitan 3420 23.7 75.6 0.7
Urban 8376 21.4 77.8 0.8
Rural 7775 22.5 76.7 0.7
OCCUPATION
Self-employed 1790 81.5 18.2 0.3
Employee 5829 17.6 82 0.3
Manual worker 2149 15.5 83.8 0.6
Not working 9846 15.7 83.1 1.2
OCCUPATION PARENTS
Both self-employed 3004 33.3 66.2 0.5
Self-employed and employed 1886 25.1 73.4 1.5
Both employees 10490 18.7 80.8 0.5
PRESENT INCOME
Live comfortably 4419 26.4 72.8 0.8
Get by 9052 20.4 78.9 0.7
Difficult to manage 3947 22 77.3 0.6
Very hard to manage 2043 23.3 76.2 0.5
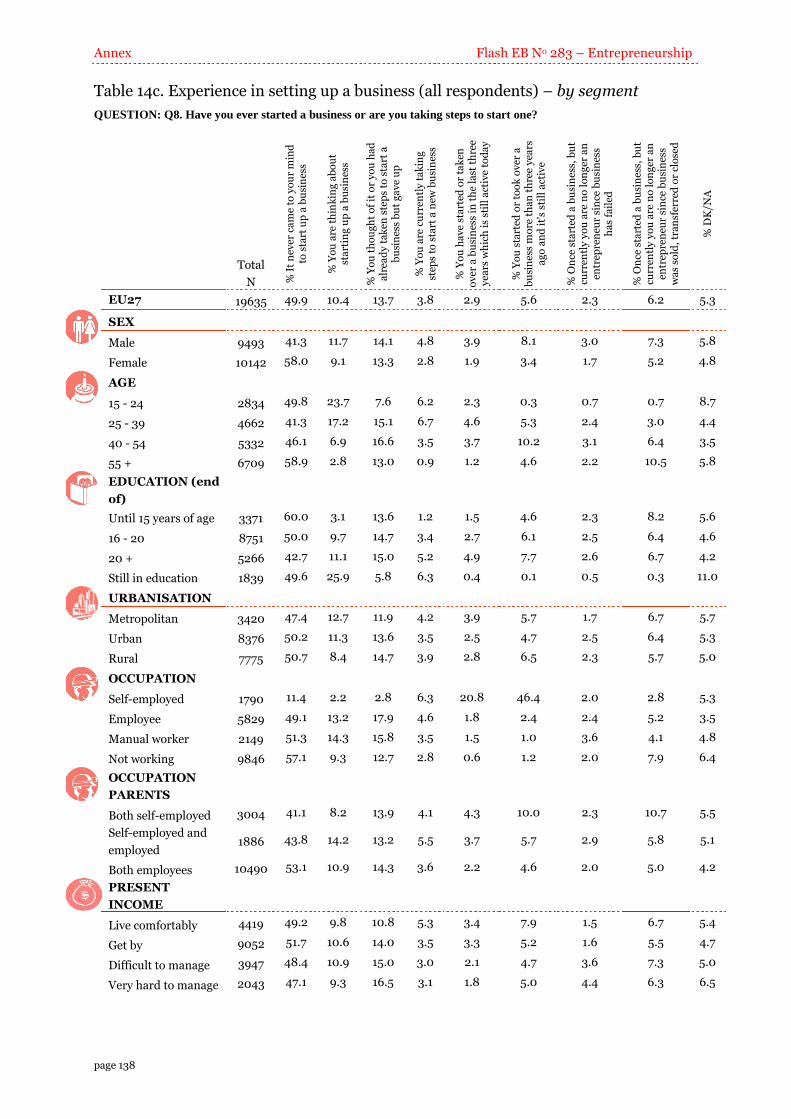
Annex Flash EB No 283 – Entrepreneurship
page 138
Table 14c. Experience in setting up a business (all respondents) – by segment
QUESTION: Q8. Have you ever started a business or are you taking steps to start one?
Total
N % I
t n
ever
ca
me
to y
ou
r m
ind
to
sta
rt u
p a
bu
sin
ess
% Y
ou
are
th
ink
ing
ab
ou
t st
art
ing
up
a b
usi
nes
s
% Y
ou
th
ou
gh
t o
f it
or
yo
u h
ad
a
lrea
dy
ta
ken
ste
ps
to s
tart
a
bu
sin
ess
bu
t g
av
e u
p
% Y
ou
are
cu
rren
tly
ta
kin
g
step
s to
sta
rt a
new
bu
sin
ess
% Y
ou
ha
ve
sta
rted
or
tak
en
ov
er a
bu
sin
ess
in t
he
last
th
ree
yea
rs w
hic
h i
s st
ill
act
ive
tod
ay
% Y
ou
sta
rted
or
too
k o
ver
a
bu
sin
ess
mo
re t
ha
n t
hre
e y
ears
a
go
an
d i
t's
stil
l a
ctiv
e
% O
nce
sta
rted
a b
usi
nes
s, b
ut
curr
entl
y y
ou
are
no
lo
ng
er a
n
entr
epre
neu
r si
nce
bu
sin
ess
ha
s fa
iled
% O
nce
sta
rted
a b
usi
nes
s, b
ut
curr
entl
y y
ou
are
no
lo
ng
er a
n
entr
epre
neu
r si
nce
bu
sin
ess
wa
s so
ld,
tra
nsf
erre
d o
r cl
ose
d
% D
K/N
A
EU27 19635 49.9 10.4 13.7 3.8 2.9 5.6 2.3 6.2 5.3
SEX
Male 9493 41.3 11.7 14.1 4.8 3.9 8.1 3.0 7.3 5.8
Female 10142 58.0 9.1 13.3 2.8 1.9 3.4 1.7 5.2 4.8
AGE
15 - 24 2834 49.8 23.7 7.6 6.2 2.3 0.3 0.7 0.7 8.7
25 - 39 4662 41.3 17.2 15.1 6.7 4.6 5.3 2.4 3.0 4.4
40 - 54 5332 46.1 6.9 16.6 3.5 3.7 10.2 3.1 6.4 3.5
55 + 6709 58.9 2.8 13.0 0.9 1.2 4.6 2.2 10.5 5.8
EDUCATION (end
of)
Until 15 years of age 3371 60.0 3.1 13.6 1.2 1.5 4.6 2.3 8.2 5.6
16 - 20 8751 50.0 9.7 14.7 3.4 2.7 6.1 2.5 6.4 4.6
20 + 5266 42.7 11.1 15.0 5.2 4.9 7.7 2.6 6.7 4.2
Still in education 1839 49.6 25.9 5.8 6.3 0.4 0.1 0.5 0.3 11.0
URBANISATION
Metropolitan 3420 47.4 12.7 11.9 4.2 3.9 5.7 1.7 6.7 5.7
Urban 8376 50.2 11.3 13.6 3.5 2.5 4.7 2.5 6.4 5.3
Rural 7775 50.7 8.4 14.7 3.9 2.8 6.5 2.3 5.7 5.0
OCCUPATION
Self-employed 1790 11.4 2.2 2.8 6.3 20.8 46.4 2.0 2.8 5.3
Employee 5829 49.1 13.2 17.9 4.6 1.8 2.4 2.4 5.2 3.5
Manual worker 2149 51.3 14.3 15.8 3.5 1.5 1.0 3.6 4.1 4.8
Not working 9846 57.1 9.3 12.7 2.8 0.6 1.2 2.0 7.9 6.4
OCCUPATION
PARENTS
Both self-employed 3004 41.1 8.2 13.9 4.1 4.3 10.0 2.3 10.7 5.5
Self-employed and
employed 1886 43.8 14.2 13.2 5.5 3.7 5.7 2.9 5.8 5.1
Both employees 10490 53.1 10.9 14.3 3.6 2.2 4.6 2.0 5.0 4.2
PRESENT
INCOME
Live comfortably 4419 49.2 9.8 10.8 5.3 3.4 7.9 1.5 6.7 5.4
Get by 9052 51.7 10.6 14.0 3.5 3.3 5.2 1.6 5.5 4.7
Difficult to manage 3947 48.4 10.9 15.0 3.0 2.1 4.7 3.6 7.3 5.0
Very hard to manage 2043 47.1 9.3 16.5 3.1 1.8 5.0 4.4 6.3 6.5
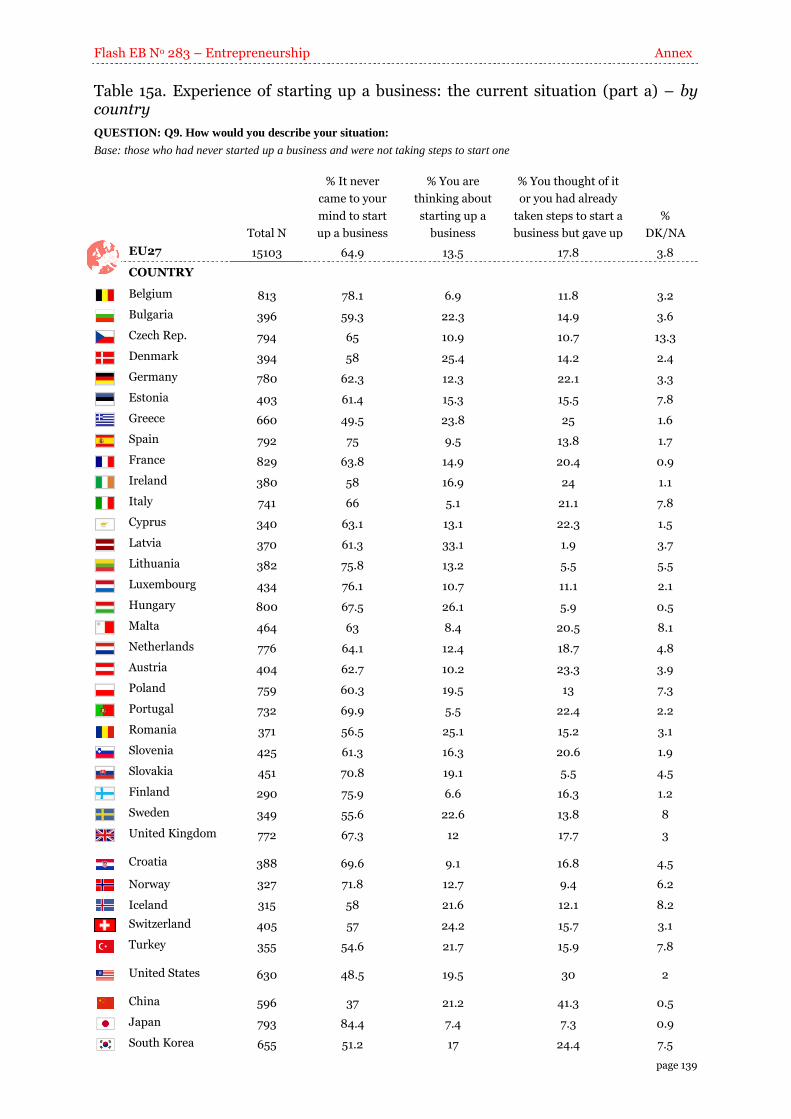
Flash EB No 283 – Entrepreneurship Annex
page 139
Table 15a. Experience of starting up a business: the current situation (part a) – by country
QUESTION: Q9. How would you describe your situation:
Base: those who had never started up a business and were not taking steps to start one
Total N
% It never
came to your
mind to start
up a business
% You are
thinking about
starting up a
business
% You thought of it
or you had already
taken steps to start a
business but gave up
%
DK/NA
EU27 15103 64.9 13.5 17.8 3.8
COUNTRY
Belgium 813 78.1 6.9 11.8 3.2
Bulgaria 396 59.3 22.3 14.9 3.6
Czech Rep. 794 65 10.9 10.7 13.3
Denmark 394 58 25.4 14.2 2.4
Germany 780 62.3 12.3 22.1 3.3
Estonia 403 61.4 15.3 15.5 7.8
Greece 660 49.5 23.8 25 1.6
Spain 792 75 9.5 13.8 1.7
France 829 63.8 14.9 20.4 0.9
Ireland 380 58 16.9 24 1.1
Italy 741 66 5.1 21.1 7.8
Cyprus 340 63.1 13.1 22.3 1.5
Latvia 370 61.3 33.1 1.9 3.7
Lithuania 382 75.8 13.2 5.5 5.5
Luxembourg 434 76.1 10.7 11.1 2.1
Hungary 800 67.5 26.1 5.9 0.5
Malta 464 63 8.4 20.5 8.1
Netherlands 776 64.1 12.4 18.7 4.8
Austria 404 62.7 10.2 23.3 3.9
Poland 759 60.3 19.5 13 7.3
Portugal 732 69.9 5.5 22.4 2.2
Romania 371 56.5 25.1 15.2 3.1
Slovenia 425 61.3 16.3 20.6 1.9
Slovakia 451 70.8 19.1 5.5 4.5
Finland 290 75.9 6.6 16.3 1.2
Sweden 349 55.6 22.6 13.8 8
United Kingdom 772 67.3 12 17.7 3
Croatia 388 69.6 9.1 16.8 4.5
Norway 327 71.8 12.7 9.4 6.2
Iceland 315 58 21.6 12.1 8.2
Switzerland 405 57 24.2 15.7 3.1
Turkey 355 54.6 21.7 15.9 7.8
United States 630 48.5 19.5 30 2
China 596 37 21.2 41.3 0.5
Japan 793 84.4 7.4 7.3 0.9
South Korea 655 51.2 17 24.4 7.5
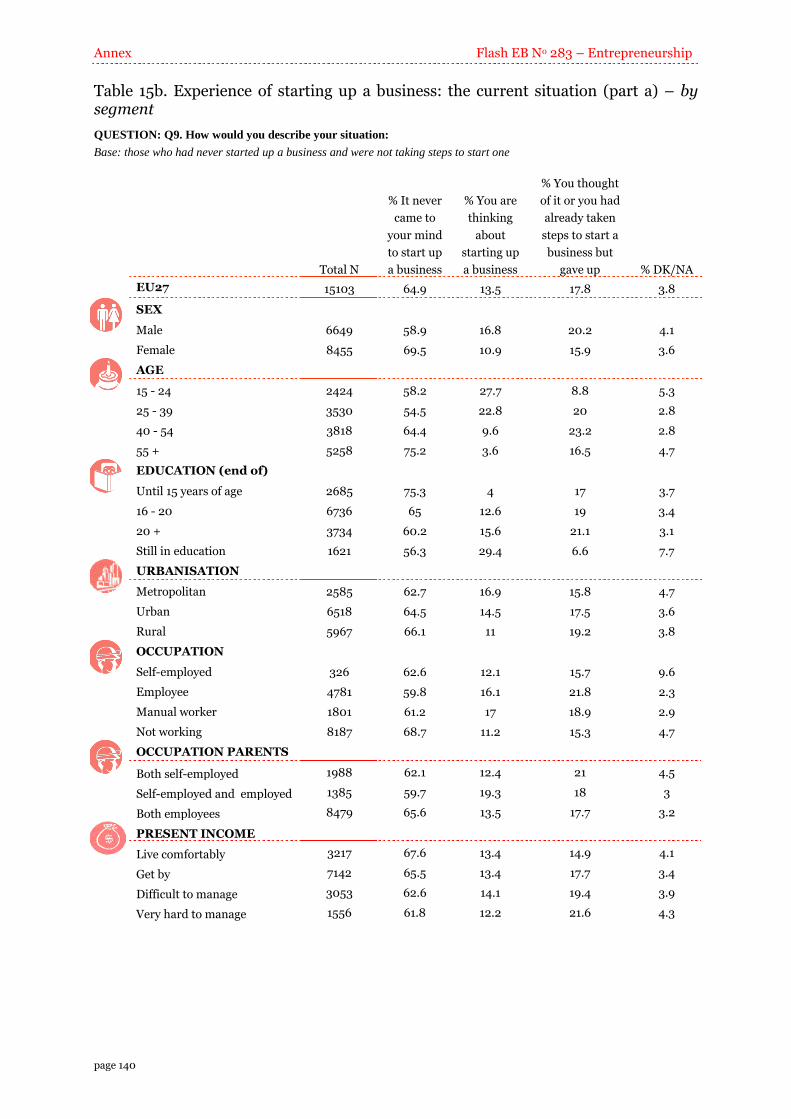
Annex Flash EB No 283 – Entrepreneurship
page 140
Table 15b. Experience of starting up a business: the current situation (part a) – by segment
QUESTION: Q9. How would you describe your situation:
Base: those who had never started up a business and were not taking steps to start one
Total N
% It never
came to
your mind
to start up
a business
% You are
thinking
about
starting up
a business
% You thought
of it or you had
already taken
steps to start a
business but
gave up % DK/NA
EU27 15103 64.9 13.5 17.8 3.8
SEX
Male 6649 58.9 16.8 20.2 4.1
Female 8455 69.5 10.9 15.9 3.6
AGE
15 - 24 2424 58.2 27.7 8.8 5.3
25 - 39 3530 54.5 22.8 20 2.8
40 - 54 3818 64.4 9.6 23.2 2.8
55 + 5258 75.2 3.6 16.5 4.7
EDUCATION (end of)
Until 15 years of age 2685 75.3 4 17 3.7
16 - 20 6736 65 12.6 19 3.4
20 + 3734 60.2 15.6 21.1 3.1
Still in education 1621 56.3 29.4 6.6 7.7
URBANISATION
Metropolitan 2585 62.7 16.9 15.8 4.7
Urban 6518 64.5 14.5 17.5 3.6
Rural 5967 66.1 11 19.2 3.8
OCCUPATION
Self-employed 326 62.6 12.1 15.7 9.6
Employee 4781 59.8 16.1 21.8 2.3
Manual worker 1801 61.2 17 18.9 2.9
Not working 8187 68.7 11.2 15.3 4.7
OCCUPATION PARENTS
Both self-employed 1988 62.1 12.4 21 4.5
Self-employed and employed 1385 59.7 19.3 18 3
Both employees 8479 65.6 13.5 17.7 3.2
PRESENT INCOME
Live comfortably 3217 67.6 13.4 14.9 4.1
Get by 7142 65.5 13.4 17.7 3.4
Difficult to manage 3053 62.6 14.1 19.4 3.9
Very hard to manage 1556 61.8 12.2 21.6 4.3
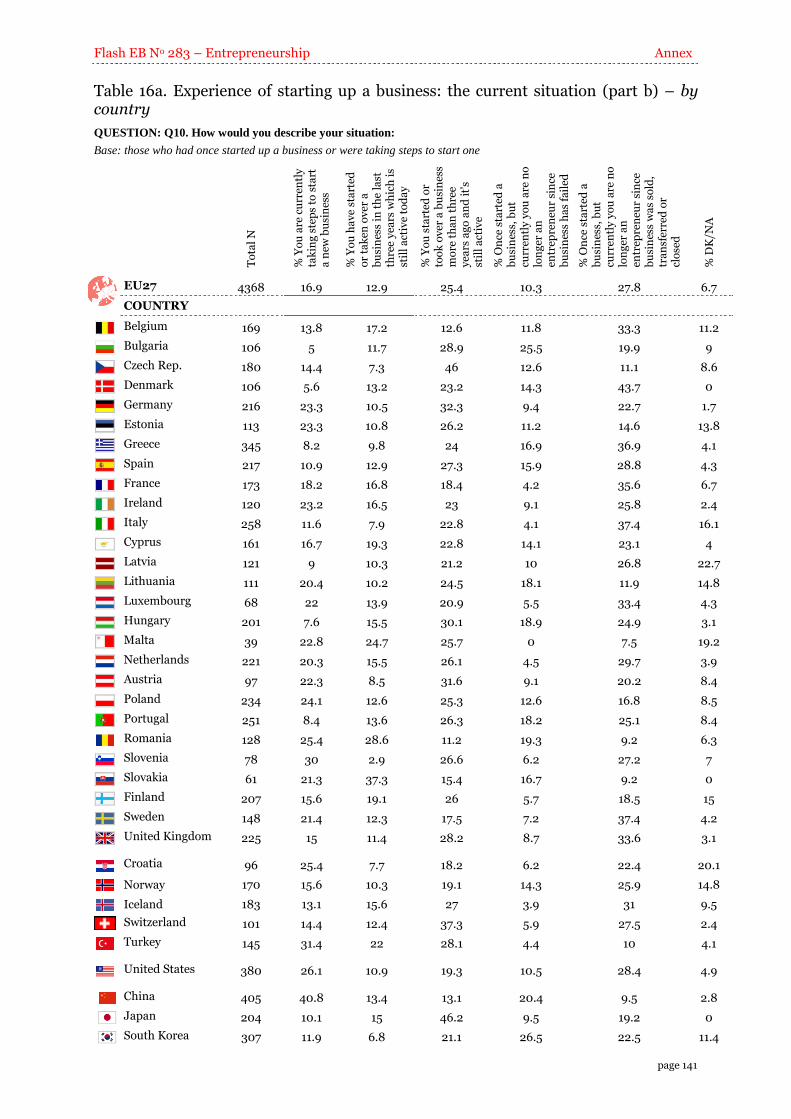
Flash EB No 283 – Entrepreneurship Annex
page 141
Table 16a. Experience of starting up a business: the current situation (part b) – by country
QUESTION: Q10. How would you describe your situation:
Base: those who had once started up a business or were taking steps to start one
To
tal
N
% Y
ou
are
cu
rren
tly
ta
kin
g s
tep
s to
sta
rt
a n
ew b
usi
nes
s
% Y
ou
ha
ve
sta
rted
o
r ta
ken
ov
er a
b
usi
nes
s in
th
e la
st
thre
e y
ears
wh
ich
is
stil
l a
ctiv
e to
da
y
% Y
ou
sta
rted
or
too
k o
ver
a b
usi
nes
s m
ore
th
an
th
ree
yea
rs a
go
an
d i
t's
stil
l a
ctiv
e
% O
nce
sta
rted
a
bu
sin
ess,
bu
t cu
rren
tly
yo
u a
re n
o
lon
ger
an
en
trep
ren
eur
sin
ce
bu
sin
ess
ha
s fa
iled
% O
nce
sta
rted
a
bu
sin
ess,
bu
t cu
rren
tly
yo
u a
re n
o
lon
ger
an
en
trep
ren
eur
sin
ce
bu
sin
ess
wa
s so
ld,
tra
nsf
erre
d o
r cl
ose
d
% D
K/N
A
EU27 4368 16.9 12.9 25.4 10.3 27.8 6.7
COUNTRY
Belgium 169 13.8 17.2 12.6 11.8 33.3 11.2
Bulgaria 106 5 11.7 28.9 25.5 19.9 9
Czech Rep. 180 14.4 7.3 46 12.6 11.1 8.6
Denmark 106 5.6 13.2 23.2 14.3 43.7 0
Germany 216 23.3 10.5 32.3 9.4 22.7 1.7
Estonia 113 23.3 10.8 26.2 11.2 14.6 13.8
Greece 345 8.2 9.8 24 16.9 36.9 4.1
Spain 217 10.9 12.9 27.3 15.9 28.8 4.3
France 173 18.2 16.8 18.4 4.2 35.6 6.7
Ireland 120 23.2 16.5 23 9.1 25.8 2.4
Italy 258 11.6 7.9 22.8 4.1 37.4 16.1
Cyprus 161 16.7 19.3 22.8 14.1 23.1 4
Latvia 121 9 10.3 21.2 10 26.8 22.7
Lithuania 111 20.4 10.2 24.5 18.1 11.9 14.8
Luxembourg 68 22 13.9 20.9 5.5 33.4 4.3
Hungary 201 7.6 15.5 30.1 18.9 24.9 3.1
Malta 39 22.8 24.7 25.7 0 7.5 19.2
Netherlands 221 20.3 15.5 26.1 4.5 29.7 3.9
Austria 97 22.3 8.5 31.6 9.1 20.2 8.4
Poland 234 24.1 12.6 25.3 12.6 16.8 8.5
Portugal 251 8.4 13.6 26.3 18.2 25.1 8.4
Romania 128 25.4 28.6 11.2 19.3 9.2 6.3
Slovenia 78 30 2.9 26.6 6.2 27.2 7
Slovakia 61 21.3 37.3 15.4 16.7 9.2 0
Finland 207 15.6 19.1 26 5.7 18.5 15
Sweden 148 21.4 12.3 17.5 7.2 37.4 4.2
United Kingdom 225 15 11.4 28.2 8.7 33.6 3.1
Croatia 96 25.4 7.7 18.2 6.2 22.4 20.1
Norway 170 15.6 10.3 19.1 14.3 25.9 14.8
Iceland 183 13.1 15.6 27 3.9 31 9.5
Switzerland 101 14.4 12.4 37.3 5.9 27.5 2.4
Turkey 145 31.4 22 28.1 4.4 10 4.1
United States 380 26.1 10.9 19.3 10.5 28.4 4.9
China 405 40.8 13.4 13.1 20.4 9.5 2.8
Japan 204 10.1 15 46.2 9.5 19.2 0
South Korea 307 11.9 6.8 21.1 26.5 22.5 11.4

Annex Flash EB No 283 – Entrepreneurship
page 142
Table 16b. Experience in setting up a business: the current situation (part b) – by segment
QUESTION: Q10. How would you describe your situation:
Base: those who had once started up a business or were taking steps to start one
To
tal
N
% Y
ou
are
cu
rren
tly
ta
kin
g s
tep
s to
sta
rt a
n
ew b
usi
nes
s
% Y
ou
ha
ve
sta
rted
or
tak
en o
ver
a b
usi
nes
s in
th
e la
st t
hre
e y
ears
w
hic
h i
s st
ill
act
ive
tod
ay
% Y
ou
sta
rted
or
too
k
ov
er a
bu
sin
ess
mo
re
tha
n t
hre
e y
ears
ag
o
an
d i
t's
stil
l a
ctiv
e
% O
nce
sta
rted
a
bu
sin
ess,
bu
t cu
rren
tly
y
ou
are
no
lo
ng
er a
n
entr
epre
neu
r si
nce
b
usi
nes
s h
as
fail
ed
% O
nce
sta
rted
a
bu
sin
ess,
bu
t cu
rren
tly
y
ou
are
no
lo
ng
er a
n
entr
epre
neu
r si
nce
b
usi
nes
s w
as
sold
, tr
an
sfer
red
or
clo
sed
% D
K/N
A
EU27 4368 16.9 12.9 25.4 10.3 27.8 6.7
SEX
Male 2739 16.7 13.5 28 10.3 25.2 6.3
Female 1630 17.2 12 20.9 10.3 32.1 7.5
AGE
15 - 24 321 55 20.5 2.7 6.2 6.7 8.9
25 - 39 1095 28.5 19.6 22.4 10.2 13 6.3
40 - 54 1506 12.4 13 36.1 11 22.6 4.9
55 + 1423 4.4 5.8 21.6 10.4 49.5 8.4
EDUCATION (end
of)
Until 15 years of age 675 5.7 7.5 23 11.2 40.9 11.7
16 - 20 1954 15.1 12.2 27.4 11.1 28.5 5.7
20 + 1513 18.1 17.2 26.8 9 23.4 5.5
Still in education 158 73.2 5.4 1 6.1 3.1 11.2
URBANISATION
Metropolitan 810 17.8 16.5 24.1 7.2 28.4 6
Urban 1792 16.4 11.9 22.1 11.7 30 8
Rural 1751 17.2 12.4 28.9 10.2 25.5 5.8
OCCUPATION
Self-employed 1459 7.8 25.5 56.9 2.5 3.4 3.9
Employee 1028 26.4 10.1 13.3 13.6 29.3 7.3
Manual worker 334 22.5 9.6 6.6 23.5 26.6 11.2
Not working 1545 18.1 3.7 7.5 12.6 50.1 8.1
OCCUPATION
PARENTS
Both self-employed 1000 12.3 12.8 29.9 6.8 32.1 6.2
Self-employed and
employed 474 22 14.7 22.8 11.6 23 5.8
Both employees 1958 19.4 12 24.9 10.9 26.9 6
PRESENT
INCOME
Live comfortably 1165 20.2 12.8 29.8 5.8 25.6 5.9
Get by 1842 17.3 16.2 25.6 7.9 26.8 6.3
Difficult to manage 869 13.8 9.3 21.3 16.6 33.1 5.9
Very hard to manage 477 13.4 7.6 21.4 18.9 27.1 11.7
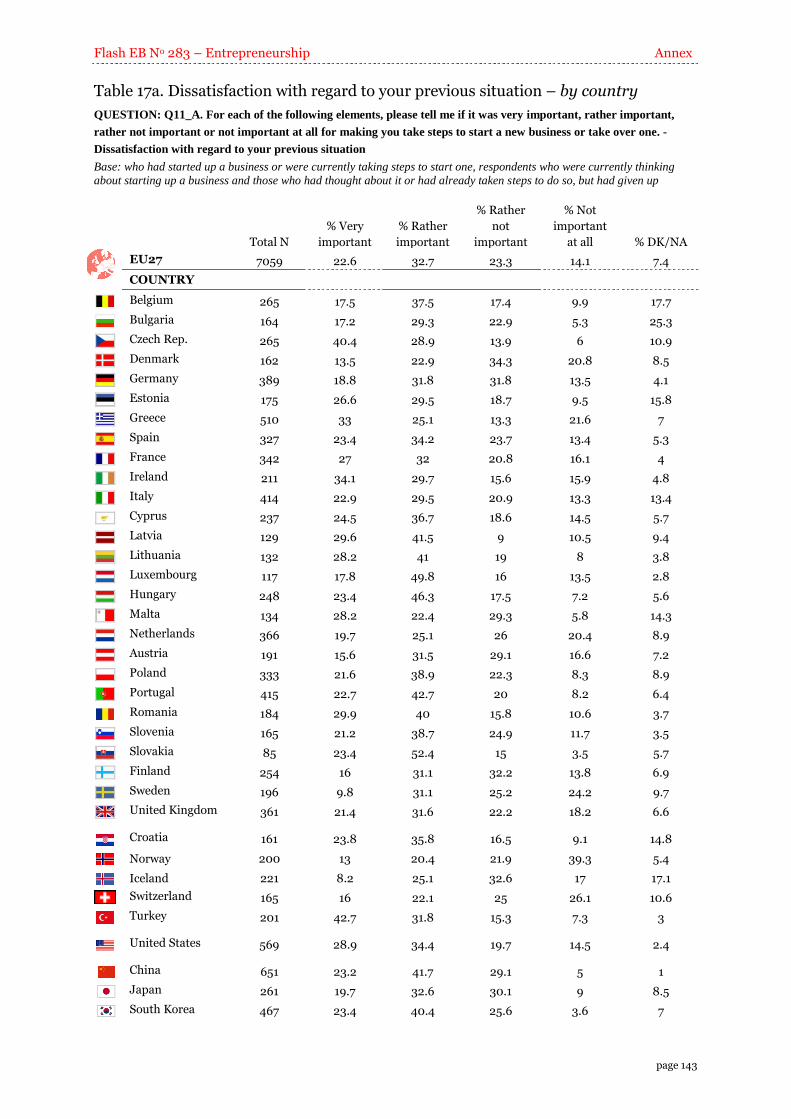
Flash EB No 283 – Entrepreneurship Annex
page 143
Table 17a. Dissatisfaction with regard to your previous situation – by country
QUESTION: Q11_A. For each of the following elements, please tell me if it was very important, rather important,
rather not important or not important at all for making you take steps to start a new business or take over one. -
Dissatisfaction with regard to your previous situation
Base: who had started up a business or were currently taking steps to start one, respondents who were currently thinking
about starting up a business and those who had thought about it or had already taken steps to do so, but had given up
Total N
% Very
important
% Rather
important
% Rather
not
important
% Not
important
at all % DK/NA
EU27 7059 22.6 32.7 23.3 14.1 7.4
COUNTRY
Belgium 265 17.5 37.5 17.4 9.9 17.7
Bulgaria 164 17.2 29.3 22.9 5.3 25.3
Czech Rep. 265 40.4 28.9 13.9 6 10.9
Denmark 162 13.5 22.9 34.3 20.8 8.5
Germany 389 18.8 31.8 31.8 13.5 4.1
Estonia 175 26.6 29.5 18.7 9.5 15.8
Greece 510 33 25.1 13.3 21.6 7
Spain 327 23.4 34.2 23.7 13.4 5.3
France 342 27 32 20.8 16.1 4
Ireland 211 34.1 29.7 15.6 15.9 4.8
Italy 414 22.9 29.5 20.9 13.3 13.4
Cyprus 237 24.5 36.7 18.6 14.5 5.7
Latvia 129 29.6 41.5 9 10.5 9.4
Lithuania 132 28.2 41 19 8 3.8
Luxembourg 117 17.8 49.8 16 13.5 2.8
Hungary 248 23.4 46.3 17.5 7.2 5.6
Malta 134 28.2 22.4 29.3 5.8 14.3
Netherlands 366 19.7 25.1 26 20.4 8.9
Austria 191 15.6 31.5 29.1 16.6 7.2
Poland 333 21.6 38.9 22.3 8.3 8.9
Portugal 415 22.7 42.7 20 8.2 6.4
Romania 184 29.9 40 15.8 10.6 3.7
Slovenia 165 21.2 38.7 24.9 11.7 3.5
Slovakia 85 23.4 52.4 15 3.5 5.7
Finland 254 16 31.1 32.2 13.8 6.9
Sweden 196 9.8 31.1 25.2 24.2 9.7
United Kingdom 361 21.4 31.6 22.2 18.2 6.6
Croatia 161 23.8 35.8 16.5 9.1 14.8
Norway 200 13 20.4 21.9 39.3 5.4
Iceland 221 8.2 25.1 32.6 17 17.1
Switzerland 165 16 22.1 25 26.1 10.6
Turkey 201 42.7 31.8 15.3 7.3 3
United States 569 28.9 34.4 19.7 14.5 2.4
China 651 23.2 41.7 29.1 5 1
Japan 261 19.7 32.6 30.1 9 8.5
South Korea 467 23.4 40.4 25.6 3.6 7
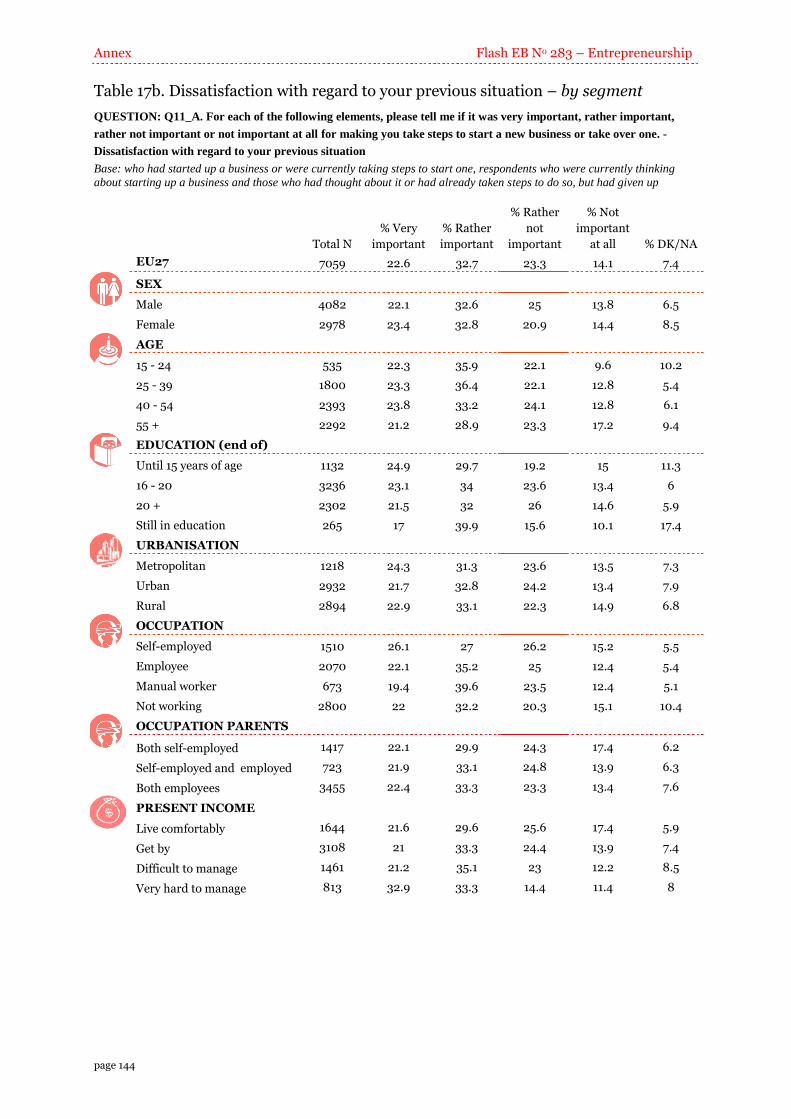
Annex Flash EB No 283 – Entrepreneurship
page 144
Table 17b. Dissatisfaction with regard to your previous situation – by segment
QUESTION: Q11_A. For each of the following elements, please tell me if it was very important, rather important,
rather not important or not important at all for making you take steps to start a new business or take over one. -
Dissatisfaction with regard to your previous situation
Base: who had started up a business or were currently taking steps to start one, respondents who were currently thinking
about starting up a business and those who had thought about it or had already taken steps to do so, but had given up
Total N
% Very
important
% Rather
important
% Rather
not
important
% Not
important
at all % DK/NA
EU27 7059 22.6 32.7 23.3 14.1 7.4
SEX
Male 4082 22.1 32.6 25 13.8 6.5
Female 2978 23.4 32.8 20.9 14.4 8.5
AGE
15 - 24 535 22.3 35.9 22.1 9.6 10.2
25 - 39 1800 23.3 36.4 22.1 12.8 5.4
40 - 54 2393 23.8 33.2 24.1 12.8 6.1
55 + 2292 21.2 28.9 23.3 17.2 9.4
EDUCATION (end of)
Until 15 years of age 1132 24.9 29.7 19.2 15 11.3
16 - 20 3236 23.1 34 23.6 13.4 6
20 + 2302 21.5 32 26 14.6 5.9
Still in education 265 17 39.9 15.6 10.1 17.4
URBANISATION
Metropolitan 1218 24.3 31.3 23.6 13.5 7.3
Urban 2932 21.7 32.8 24.2 13.4 7.9
Rural 2894 22.9 33.1 22.3 14.9 6.8
OCCUPATION
Self-employed 1510 26.1 27 26.2 15.2 5.5
Employee 2070 22.1 35.2 25 12.4 5.4
Manual worker 673 19.4 39.6 23.5 12.4 5.1
Not working 2800 22 32.2 20.3 15.1 10.4
OCCUPATION PARENTS
Both self-employed 1417 22.1 29.9 24.3 17.4 6.2
Self-employed and employed 723 21.9 33.1 24.8 13.9 6.3
Both employees 3455 22.4 33.3 23.3 13.4 7.6
PRESENT INCOME
Live comfortably 1644 21.6 29.6 25.6 17.4 5.9
Get by 3108 21 33.3 24.4 13.9 7.4
Difficult to manage 1461 21.2 35.1 23 12.2 8.5
Very hard to manage 813 32.9 33.3 14.4 11.4 8
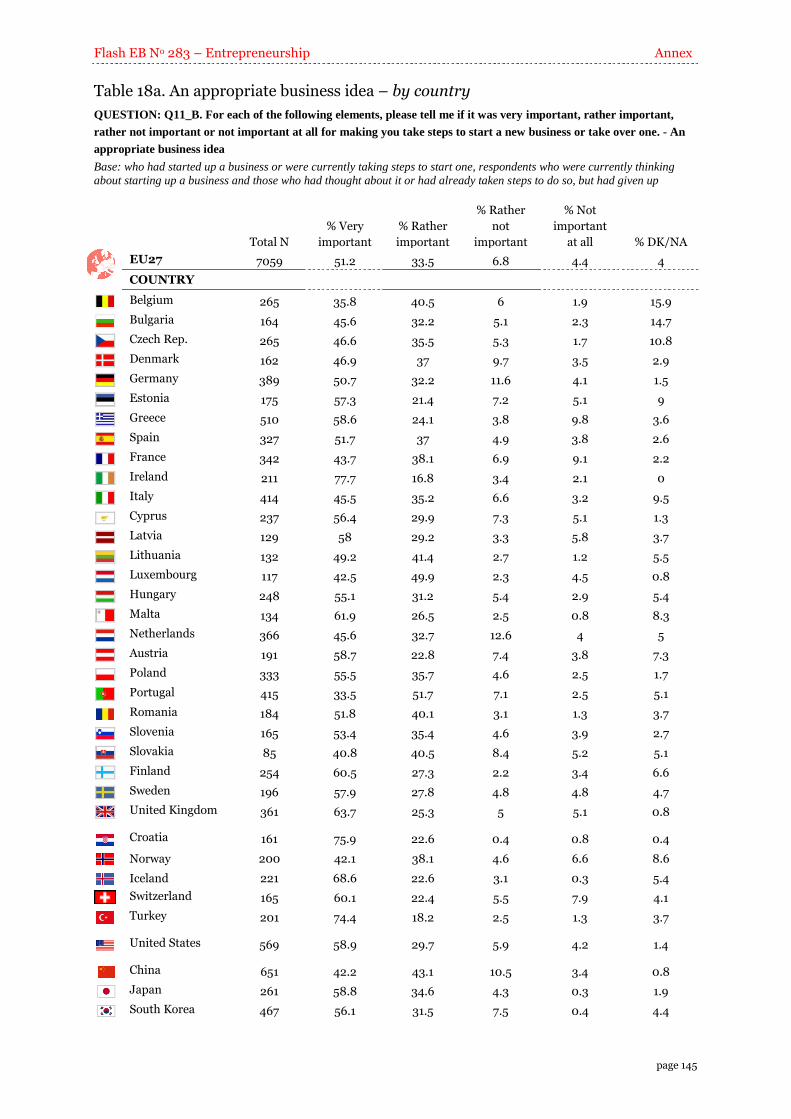
Flash EB No 283 – Entrepreneurship Annex
page 145
Table 18a. An appropriate business idea – by country
QUESTION: Q11_B. For each of the following elements, please tell me if it was very important, rather important,
rather not important or not important at all for making you take steps to start a new business or take over one. - An
appropriate business idea
Base: who had started up a business or were currently taking steps to start one, respondents who were currently thinking
about starting up a business and those who had thought about it or had already taken steps to do so, but had given up
Total N
% Very
important
% Rather
important
% Rather
not
important
% Not
important
at all % DK/NA
EU27 7059 51.2 33.5 6.8 4.4 4
COUNTRY
Belgium 265 35.8 40.5 6 1.9 15.9
Bulgaria 164 45.6 32.2 5.1 2.3 14.7
Czech Rep. 265 46.6 35.5 5.3 1.7 10.8
Denmark 162 46.9 37 9.7 3.5 2.9
Germany 389 50.7 32.2 11.6 4.1 1.5
Estonia 175 57.3 21.4 7.2 5.1 9
Greece 510 58.6 24.1 3.8 9.8 3.6
Spain 327 51.7 37 4.9 3.8 2.6
France 342 43.7 38.1 6.9 9.1 2.2
Ireland 211 77.7 16.8 3.4 2.1 0
Italy 414 45.5 35.2 6.6 3.2 9.5
Cyprus 237 56.4 29.9 7.3 5.1 1.3
Latvia 129 58 29.2 3.3 5.8 3.7
Lithuania 132 49.2 41.4 2.7 1.2 5.5
Luxembourg 117 42.5 49.9 2.3 4.5 0.8
Hungary 248 55.1 31.2 5.4 2.9 5.4
Malta 134 61.9 26.5 2.5 0.8 8.3
Netherlands 366 45.6 32.7 12.6 4 5
Austria 191 58.7 22.8 7.4 3.8 7.3
Poland 333 55.5 35.7 4.6 2.5 1.7
Portugal 415 33.5 51.7 7.1 2.5 5.1
Romania 184 51.8 40.1 3.1 1.3 3.7
Slovenia 165 53.4 35.4 4.6 3.9 2.7
Slovakia 85 40.8 40.5 8.4 5.2 5.1
Finland 254 60.5 27.3 2.2 3.4 6.6
Sweden 196 57.9 27.8 4.8 4.8 4.7
United Kingdom 361 63.7 25.3 5 5.1 0.8
Croatia 161 75.9 22.6 0.4 0.8 0.4
Norway 200 42.1 38.1 4.6 6.6 8.6
Iceland 221 68.6 22.6 3.1 0.3 5.4
Switzerland 165 60.1 22.4 5.5 7.9 4.1
Turkey 201 74.4 18.2 2.5 1.3 3.7
United States 569 58.9 29.7 5.9 4.2 1.4
China 651 42.2 43.1 10.5 3.4 0.8
Japan 261 58.8 34.6 4.3 0.3 1.9
South Korea 467 56.1 31.5 7.5 0.4 4.4

Annex Flash EB No 283 – Entrepreneurship
page 146
Table 18b. An appropriate business idea – by segment
QUESTION: Q11_B. For each of the following elements, please tell me if it was very important, rather important,
rather not important or not important at all for making you take steps to start a new business or take over one. - An
appropriate business idea
Base: who had started up a business or were currently taking steps to start one, respondents who were currently thinking
about starting up a business and those who had thought about it or had already taken steps to do so, but had given up
Total N
% Very
important
% Rather
important
% Rather
not
important
% Not
important
at all % DK/NA
EU27 7059 51.2 33.5 6.8 4.4 4
SEX
Male 4082 50.1 35.2 6.8 4.6 3.3
Female 2978 52.8 31.2 6.9 4.1 4.9
AGE
15 - 24 535 61.2 28 5.5 1.6 3.8
25 - 39 1800 58.1 31.4 5.2 2.6 2.7
40 - 54 2393 50.8 34.5 6.8 4.3 3.5
55 + 2292 43.9 35.7 8.4 6.6 5.5
EDUCATION (end of)
Until 15 years of age 1132 42.9 36.5 6.4 7.3 6.8
16 - 20 3236 51.1 33.5 7.4 4.4 3.6
20 + 2302 54.8 32.5 6.3 3.3 3.1
Still in education 265 62.5 27.8 5.7 0.7 3.2
URBANISATION
Metropolitan 1218 54.5 31.9 6.8 3 3.9
Urban 2932 52.1 33.1 6.5 4.4 3.9
Rural 2894 48.9 34.8 7.3 4.9 4.1
OCCUPATION
Self-employed 1510 54.2 29.1 9.7 5 2
Employee 2070 56.1 33 5.1 3.2 2.6
Manual worker 673 47.5 38.2 3.9 4.1 6.3
Not working 2800 46.9 35.1 7.3 5.1 5.5
OCCUPATION PARENTS
Both self-employed 1417 51.3 31.3 8.4 5 3.9
Self-employed and employed 723 59 30.5 5.2 3.3 2
Both employees 3455 50.1 34.1 6.8 4.7 4.3
PRESENT INCOME
Live comfortably 1644 53.3 31.4 7.5 4.6 3.3
Get by 3108 51.4 34.5 6.5 4.2 3.5
Difficult to manage 1461 47 34.9 7.4 4.4 6.3
Very hard to manage 813 54 31.6 6.1 5.2 3

Flash EB No 283 – Entrepreneurship Annex
page 147
Table 19a. Contact with an appropriate business partner – by country
QUESTION: Q11_C. For each of the following elements, please tell me if it was very important, rather important,
rather not important or not important at all for making you take steps to start a new business or take over one. -
Contact with an appropriate business partner
Base: who had started up a business or were currently taking steps to start one, respondents who were currently thinking
about starting up a business and those who had thought about it or had already taken steps to do so, but had given up
Total N
% Very
important
% Rather
important
% Rather
not
important
% Not
important
at all % DK/NA
EU27 7059 34 30.9 16.9 14 4.2
COUNTRY
Belgium 265 36.7 36.2 8.1 3.2 15.7
Bulgaria 164 42.3 28 7.9 5.5 16.2
Czech Rep. 265 35.4 34.9 11.5 6.1 12.2
Denmark 162 35.9 25.3 22.7 12.8 3.3
Germany 389 31.6 36.8 21.2 8.5 2
Estonia 175 42.9 26.8 8.7 10.4 11.2
Greece 510 32.4 19.4 14.7 32.2 1.2
Spain 327 31.7 24.7 19.5 21.3 2.8
France 342 34.3 38.3 13.2 12.6 1.6
Ireland 211 39.2 32.1 13.3 13.7 1.7
Italy 414 36.4 23.2 17 15.4 8
Cyprus 237 27.1 29.9 16.6 25.1 1.2
Latvia 129 59.6 26.2 4.2 5.1 5
Lithuania 132 38.5 40.9 10 5 5.6
Luxembourg 117 36.3 43.2 9.3 10.5 0.8
Hungary 248 49.4 28.9 9.4 5.4 7
Malta 134 31.9 29.5 28.4 1.4 8.8
Netherlands 366 32.7 25.7 23.2 14.2 4.1
Austria 191 43.6 32.1 12.1 5.9 6.3
Poland 333 30 25.6 21.6 19.2 3.6
Portugal 415 23.5 49.5 12.4 9.6 5
Romania 184 30.1 38 18.4 10.3 3.2
Slovenia 165 52.4 30.5 10.5 5.8 0.8
Slovakia 85 31.7 38.6 14.7 9.9 5.1
Finland 254 40.3 38.9 8.5 5.4 7
Sweden 196 38.2 38.8 10.4 7.5 5.1
United Kingdom 361 35 25.7 16.1 20 3.3
Croatia 161 55.1 36.6 5.5 0 2.8
Norway 200 23.7 30.5 9.3 30.7 5.8
Iceland 221 48.2 36.7 5.6 3.4 6.1
Switzerland 165 32.3 27.4 21.4 15.9 3.1
Turkey 201 59.5 27.5 7.6 3.6 1.7
United States 569 37.1 24.6 19.7 17.8 0.9
China 651 42.6 39.9 12.4 4.8 0.3
Japan 261 59.7 29.9 7.1 1.9 1.3
South Korea 467 51.7 29.1 10.4 2.6 6.2
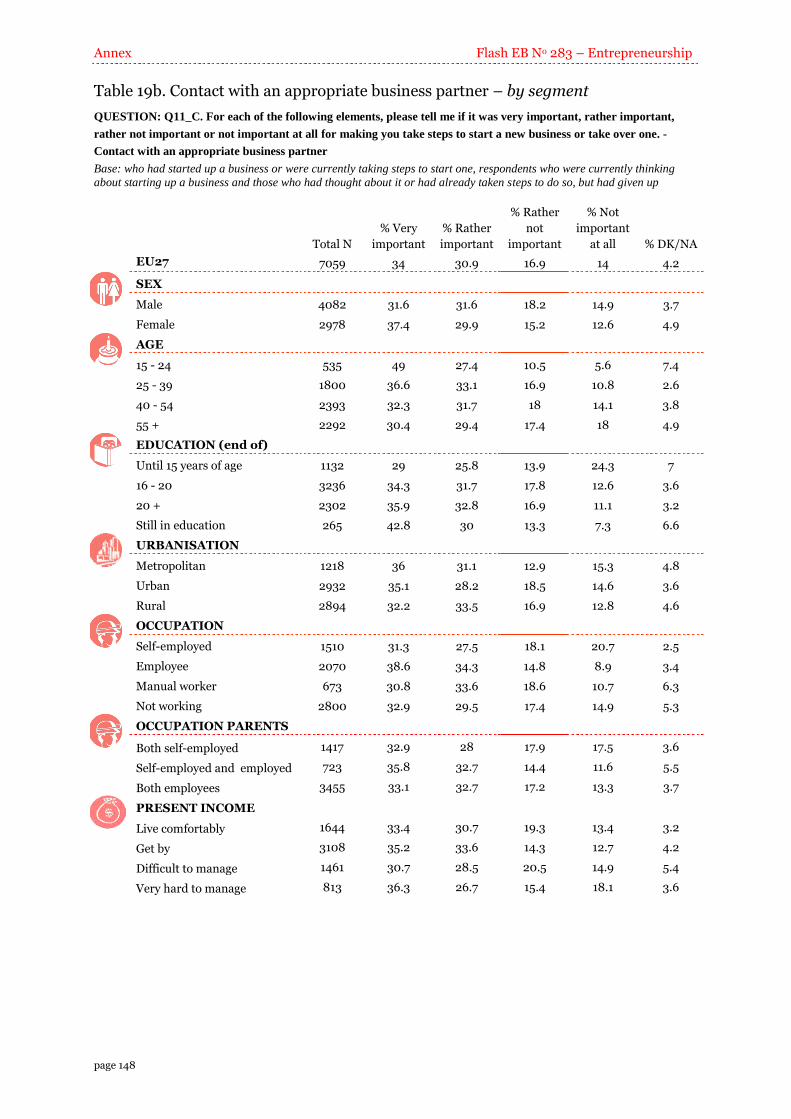
Annex Flash EB No 283 – Entrepreneurship
page 148
Table 19b. Contact with an appropriate business partner – by segment
QUESTION: Q11_C. For each of the following elements, please tell me if it was very important, rather important,
rather not important or not important at all for making you take steps to start a new business or take over one. -
Contact with an appropriate business partner
Base: who had started up a business or were currently taking steps to start one, respondents who were currently thinking
about starting up a business and those who had thought about it or had already taken steps to do so, but had given up
Total N
% Very
important
% Rather
important
% Rather
not
important
% Not
important
at all % DK/NA
EU27 7059 34 30.9 16.9 14 4.2
SEX
Male 4082 31.6 31.6 18.2 14.9 3.7
Female 2978 37.4 29.9 15.2 12.6 4.9
AGE
15 - 24 535 49 27.4 10.5 5.6 7.4
25 - 39 1800 36.6 33.1 16.9 10.8 2.6
40 - 54 2393 32.3 31.7 18 14.1 3.8
55 + 2292 30.4 29.4 17.4 18 4.9
EDUCATION (end of)
Until 15 years of age 1132 29 25.8 13.9 24.3 7
16 - 20 3236 34.3 31.7 17.8 12.6 3.6
20 + 2302 35.9 32.8 16.9 11.1 3.2
Still in education 265 42.8 30 13.3 7.3 6.6
URBANISATION
Metropolitan 1218 36 31.1 12.9 15.3 4.8
Urban 2932 35.1 28.2 18.5 14.6 3.6
Rural 2894 32.2 33.5 16.9 12.8 4.6
OCCUPATION
Self-employed 1510 31.3 27.5 18.1 20.7 2.5
Employee 2070 38.6 34.3 14.8 8.9 3.4
Manual worker 673 30.8 33.6 18.6 10.7 6.3
Not working 2800 32.9 29.5 17.4 14.9 5.3
OCCUPATION PARENTS
Both self-employed 1417 32.9 28 17.9 17.5 3.6
Self-employed and employed 723 35.8 32.7 14.4 11.6 5.5
Both employees 3455 33.1 32.7 17.2 13.3 3.7
PRESENT INCOME
Live comfortably 1644 33.4 30.7 19.3 13.4 3.2
Get by 3108 35.2 33.6 14.3 12.7 4.2
Difficult to manage 1461 30.7 28.5 20.5 14.9 5.4
Very hard to manage 813 36.3 26.7 15.4 18.1 3.6
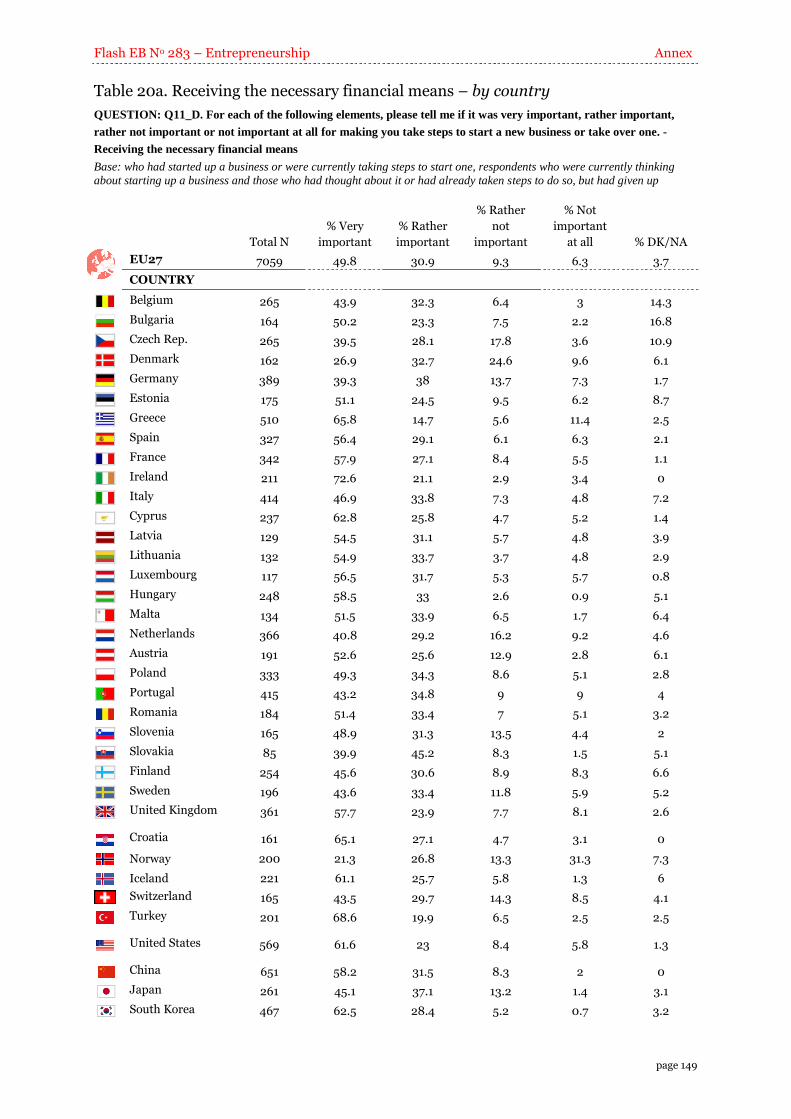
Flash EB No 283 – Entrepreneurship Annex
page 149
Table 20a. Receiving the necessary financial means – by country
QUESTION: Q11_D. For each of the following elements, please tell me if it was very important, rather important,
rather not important or not important at all for making you take steps to start a new business or take over one. -
Receiving the necessary financial means
Base: who had started up a business or were currently taking steps to start one, respondents who were currently thinking
about starting up a business and those who had thought about it or had already taken steps to do so, but had given up
Total N
% Very
important
% Rather
important
% Rather
not
important
% Not
important
at all % DK/NA
EU27 7059 49.8 30.9 9.3 6.3 3.7
COUNTRY
Belgium 265 43.9 32.3 6.4 3 14.3
Bulgaria 164 50.2 23.3 7.5 2.2 16.8
Czech Rep. 265 39.5 28.1 17.8 3.6 10.9
Denmark 162 26.9 32.7 24.6 9.6 6.1
Germany 389 39.3 38 13.7 7.3 1.7
Estonia 175 51.1 24.5 9.5 6.2 8.7
Greece 510 65.8 14.7 5.6 11.4 2.5
Spain 327 56.4 29.1 6.1 6.3 2.1
France 342 57.9 27.1 8.4 5.5 1.1
Ireland 211 72.6 21.1 2.9 3.4 0
Italy 414 46.9 33.8 7.3 4.8 7.2
Cyprus 237 62.8 25.8 4.7 5.2 1.4
Latvia 129 54.5 31.1 5.7 4.8 3.9
Lithuania 132 54.9 33.7 3.7 4.8 2.9
Luxembourg 117 56.5 31.7 5.3 5.7 0.8
Hungary 248 58.5 33 2.6 0.9 5.1
Malta 134 51.5 33.9 6.5 1.7 6.4
Netherlands 366 40.8 29.2 16.2 9.2 4.6
Austria 191 52.6 25.6 12.9 2.8 6.1
Poland 333 49.3 34.3 8.6 5.1 2.8
Portugal 415 43.2 34.8 9 9 4
Romania 184 51.4 33.4 7 5.1 3.2
Slovenia 165 48.9 31.3 13.5 4.4 2
Slovakia 85 39.9 45.2 8.3 1.5 5.1
Finland 254 45.6 30.6 8.9 8.3 6.6
Sweden 196 43.6 33.4 11.8 5.9 5.2
United Kingdom 361 57.7 23.9 7.7 8.1 2.6
Croatia 161 65.1 27.1 4.7 3.1 0
Norway 200 21.3 26.8 13.3 31.3 7.3
Iceland 221 61.1 25.7 5.8 1.3 6
Switzerland 165 43.5 29.7 14.3 8.5 4.1
Turkey 201 68.6 19.9 6.5 2.5 2.5
United States 569 61.6 23 8.4 5.8 1.3
China 651 58.2 31.5 8.3 2 0
Japan 261 45.1 37.1 13.2 1.4 3.1
South Korea 467 62.5 28.4 5.2 0.7 3.2
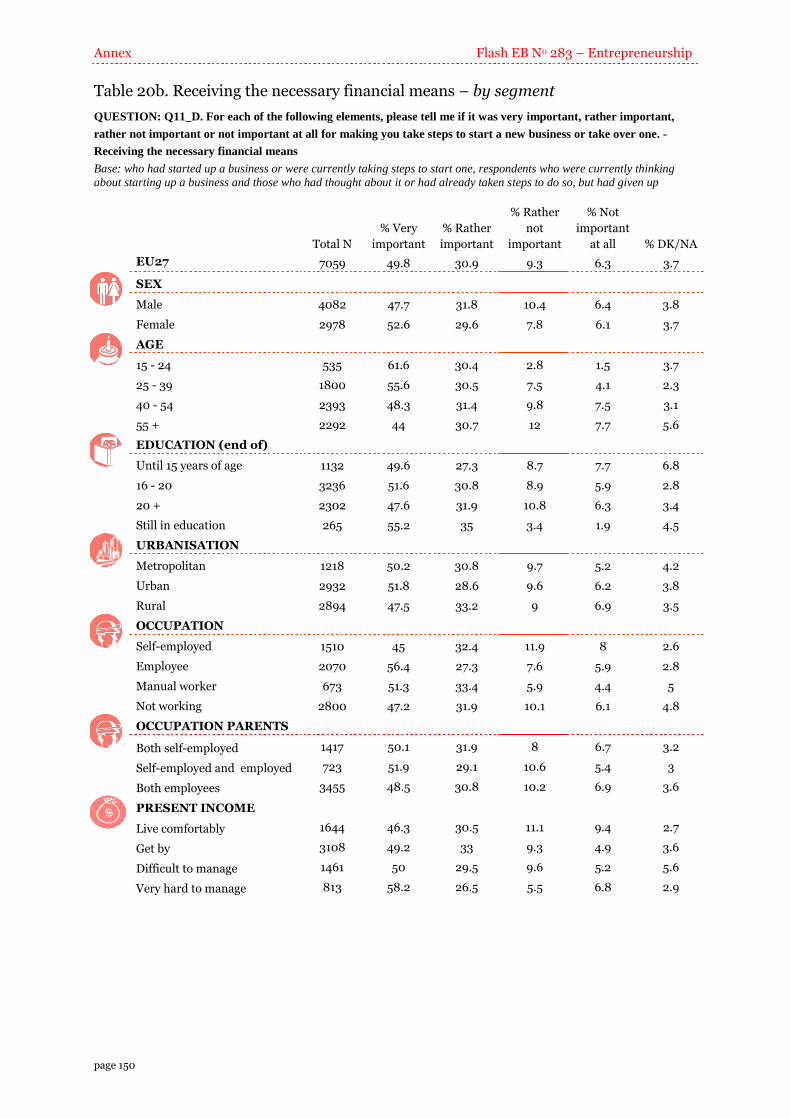
Annex Flash EB No 283 – Entrepreneurship
page 150
Table 20b. Receiving the necessary financial means – by segment
QUESTION: Q11_D. For each of the following elements, please tell me if it was very important, rather important,
rather not important or not important at all for making you take steps to start a new business or take over one. -
Receiving the necessary financial means
Base: who had started up a business or were currently taking steps to start one, respondents who were currently thinking
about starting up a business and those who had thought about it or had already taken steps to do so, but had given up
Total N
% Very
important
% Rather
important
% Rather
not
important
% Not
important
at all % DK/NA
EU27 7059 49.8 30.9 9.3 6.3 3.7
SEX
Male 4082 47.7 31.8 10.4 6.4 3.8
Female 2978 52.6 29.6 7.8 6.1 3.7
AGE
15 - 24 535 61.6 30.4 2.8 1.5 3.7
25 - 39 1800 55.6 30.5 7.5 4.1 2.3
40 - 54 2393 48.3 31.4 9.8 7.5 3.1
55 + 2292 44 30.7 12 7.7 5.6
EDUCATION (end of)
Until 15 years of age 1132 49.6 27.3 8.7 7.7 6.8
16 - 20 3236 51.6 30.8 8.9 5.9 2.8
20 + 2302 47.6 31.9 10.8 6.3 3.4
Still in education 265 55.2 35 3.4 1.9 4.5
URBANISATION
Metropolitan 1218 50.2 30.8 9.7 5.2 4.2
Urban 2932 51.8 28.6 9.6 6.2 3.8
Rural 2894 47.5 33.2 9 6.9 3.5
OCCUPATION
Self-employed 1510 45 32.4 11.9 8 2.6
Employee 2070 56.4 27.3 7.6 5.9 2.8
Manual worker 673 51.3 33.4 5.9 4.4 5
Not working 2800 47.2 31.9 10.1 6.1 4.8
OCCUPATION PARENTS
Both self-employed 1417 50.1 31.9 8 6.7 3.2
Self-employed and employed 723 51.9 29.1 10.6 5.4 3
Both employees 3455 48.5 30.8 10.2 6.9 3.6
PRESENT INCOME
Live comfortably 1644 46.3 30.5 11.1 9.4 2.7
Get by 3108 49.2 33 9.3 4.9 3.6
Difficult to manage 1461 50 29.5 9.6 5.2 5.6
Very hard to manage 813 58.2 26.5 5.5 6.8 2.9
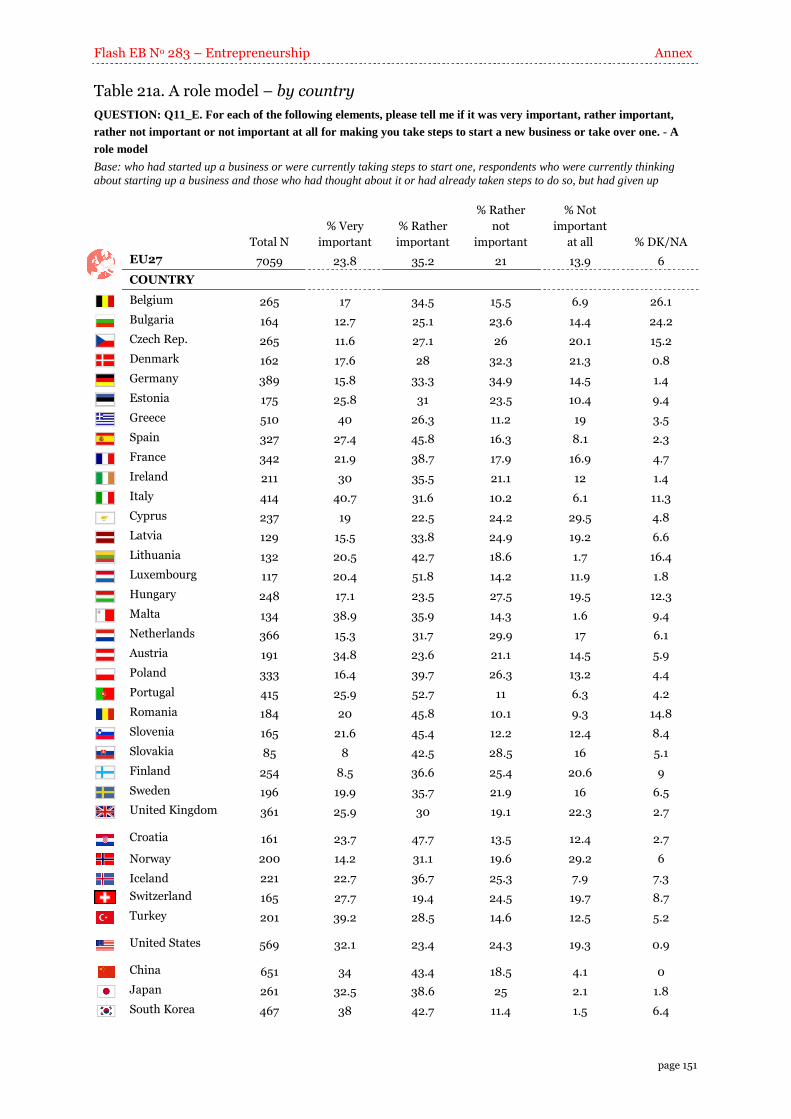
Flash EB No 283 – Entrepreneurship Annex
page 151
Table 21a. A role model – by country
QUESTION: Q11_E. For each of the following elements, please tell me if it was very important, rather important,
rather not important or not important at all for making you take steps to start a new business or take over one. - A
role model
Base: who had started up a business or were currently taking steps to start one, respondents who were currently thinking
about starting up a business and those who had thought about it or had already taken steps to do so, but had given up
Total N
% Very
important
% Rather
important
% Rather
not
important
% Not
important
at all % DK/NA
EU27 7059 23.8 35.2 21 13.9 6
COUNTRY
Belgium 265 17 34.5 15.5 6.9 26.1
Bulgaria 164 12.7 25.1 23.6 14.4 24.2
Czech Rep. 265 11.6 27.1 26 20.1 15.2
Denmark 162 17.6 28 32.3 21.3 0.8
Germany 389 15.8 33.3 34.9 14.5 1.4
Estonia 175 25.8 31 23.5 10.4 9.4
Greece 510 40 26.3 11.2 19 3.5
Spain 327 27.4 45.8 16.3 8.1 2.3
France 342 21.9 38.7 17.9 16.9 4.7
Ireland 211 30 35.5 21.1 12 1.4
Italy 414 40.7 31.6 10.2 6.1 11.3
Cyprus 237 19 22.5 24.2 29.5 4.8
Latvia 129 15.5 33.8 24.9 19.2 6.6
Lithuania 132 20.5 42.7 18.6 1.7 16.4
Luxembourg 117 20.4 51.8 14.2 11.9 1.8
Hungary 248 17.1 23.5 27.5 19.5 12.3
Malta 134 38.9 35.9 14.3 1.6 9.4
Netherlands 366 15.3 31.7 29.9 17 6.1
Austria 191 34.8 23.6 21.1 14.5 5.9
Poland 333 16.4 39.7 26.3 13.2 4.4
Portugal 415 25.9 52.7 11 6.3 4.2
Romania 184 20 45.8 10.1 9.3 14.8
Slovenia 165 21.6 45.4 12.2 12.4 8.4
Slovakia 85 8 42.5 28.5 16 5.1
Finland 254 8.5 36.6 25.4 20.6 9
Sweden 196 19.9 35.7 21.9 16 6.5
United Kingdom 361 25.9 30 19.1 22.3 2.7
Croatia 161 23.7 47.7 13.5 12.4 2.7
Norway 200 14.2 31.1 19.6 29.2 6
Iceland 221 22.7 36.7 25.3 7.9 7.3
Switzerland 165 27.7 19.4 24.5 19.7 8.7
Turkey 201 39.2 28.5 14.6 12.5 5.2
United States 569 32.1 23.4 24.3 19.3 0.9
China 651 34 43.4 18.5 4.1 0
Japan 261 32.5 38.6 25 2.1 1.8
South Korea 467 38 42.7 11.4 1.5 6.4
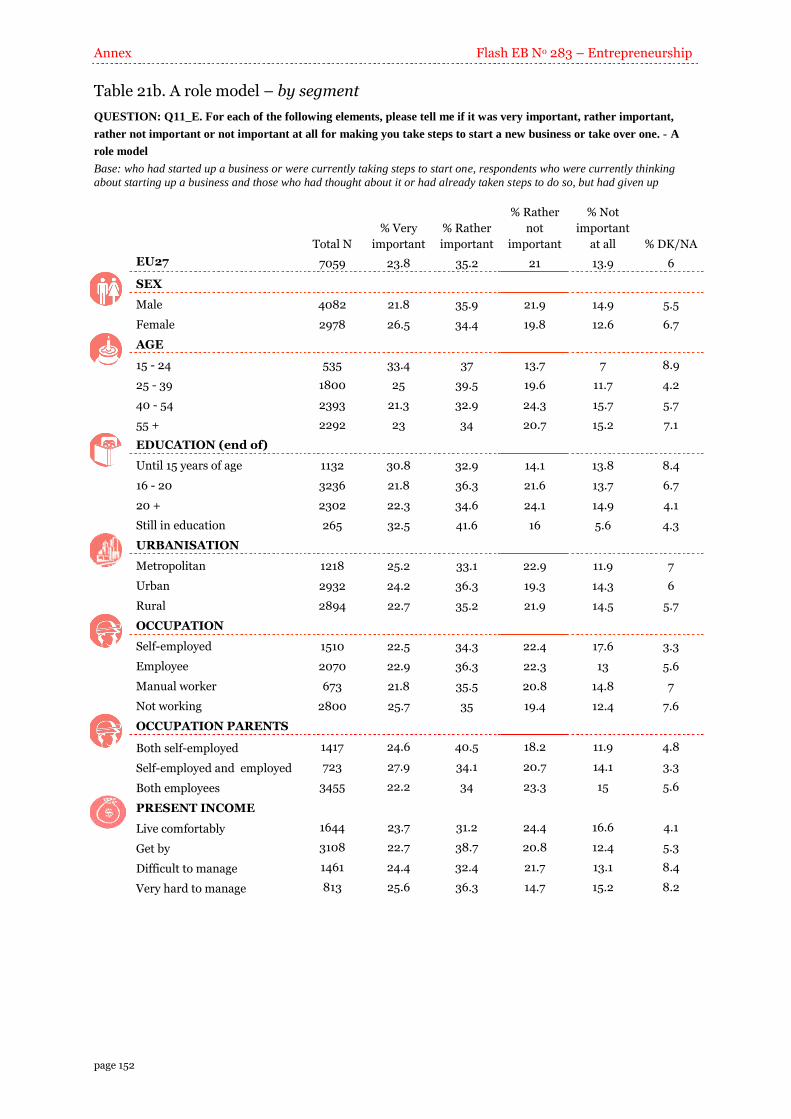
Annex Flash EB No 283 – Entrepreneurship
page 152
Table 21b. A role model – by segment
QUESTION: Q11_E. For each of the following elements, please tell me if it was very important, rather important,
rather not important or not important at all for making you take steps to start a new business or take over one. - A
role model
Base: who had started up a business or were currently taking steps to start one, respondents who were currently thinking
about starting up a business and those who had thought about it or had already taken steps to do so, but had given up
Total N
% Very
important
% Rather
important
% Rather
not
important
% Not
important
at all % DK/NA
EU27 7059 23.8 35.2 21 13.9 6
SEX
Male 4082 21.8 35.9 21.9 14.9 5.5
Female 2978 26.5 34.4 19.8 12.6 6.7
AGE
15 - 24 535 33.4 37 13.7 7 8.9
25 - 39 1800 25 39.5 19.6 11.7 4.2
40 - 54 2393 21.3 32.9 24.3 15.7 5.7
55 + 2292 23 34 20.7 15.2 7.1
EDUCATION (end of)
Until 15 years of age 1132 30.8 32.9 14.1 13.8 8.4
16 - 20 3236 21.8 36.3 21.6 13.7 6.7
20 + 2302 22.3 34.6 24.1 14.9 4.1
Still in education 265 32.5 41.6 16 5.6 4.3
URBANISATION
Metropolitan 1218 25.2 33.1 22.9 11.9 7
Urban 2932 24.2 36.3 19.3 14.3 6
Rural 2894 22.7 35.2 21.9 14.5 5.7
OCCUPATION
Self-employed 1510 22.5 34.3 22.4 17.6 3.3
Employee 2070 22.9 36.3 22.3 13 5.6
Manual worker 673 21.8 35.5 20.8 14.8 7
Not working 2800 25.7 35 19.4 12.4 7.6
OCCUPATION PARENTS
Both self-employed 1417 24.6 40.5 18.2 11.9 4.8
Self-employed and employed 723 27.9 34.1 20.7 14.1 3.3
Both employees 3455 22.2 34 23.3 15 5.6
PRESENT INCOME
Live comfortably 1644 23.7 31.2 24.4 16.6 4.1
Get by 3108 22.7 38.7 20.8 12.4 5.3
Difficult to manage 1461 24.4 32.4 21.7 13.1 8.4
Very hard to manage 813 25.6 36.3 14.7 15.2 8.2

Flash EB No 283 – Entrepreneurship Annex
page 153
Table 22a. Addressing an unmet social or ecological need – by country
QUESTION: Q11_F. For each of the following elements, please tell me if it was very important, rather important,
rather not important or not important at all for making you take steps to start a new business or take over one. -
Addressing an unmet social or ecological need
Base: who had started up a business or were currently taking steps to start one, respondents who were currently thinking
about starting up a business and those who had thought about it or had already taken steps to do so, but had given up
Total N
% Very
important
% Rather
important
% Rather
not
important
% Not
important
at all % DK/NA
EU27 7059 21.4 34.2 22.7 12.6 9.1
COUNTRY
Belgium 265 22.9 35.7 15.5 4.4 21.6
Bulgaria 164 11.6 30.6 15.2 7.9 34.8
Czech Rep. 265 7.9 21.4 29.4 22.4 18.9
Denmark 162 12.5 26.5 30.8 20.7 9.5
Germany 389 10.9 33.2 38.3 12.8 4.9
Estonia 175 23.3 32.1 19.3 7.4 18
Greece 510 45.1 30 9.3 11.3 4.3
Spain 327 24.2 37.1 18.3 14.2 6.1
France 342 27.4 37.6 18.7 14.1 2.1
Ireland 211 37.4 34.3 13.1 9.7 5.5
Italy 414 26.2 34.4 12.3 8.4 18.6
Cyprus 237 30.4 34.8 19.6 7.9 7.3
Latvia 129 18.2 35.2 17.9 7.9 20.8
Lithuania 132 19 32.3 24.4 12.7 11.6
Luxembourg 117 23.1 44.9 17.2 10.9 3.7
Hungary 248 14.6 23.2 29.6 16.7 15.9
Malta 134 38.5 32.2 11 5.2 13.1
Netherlands 366 20.8 26 30.1 14.8 8.2
Austria 191 24.5 35.1 21.8 10.5 8.1
Poland 333 18.7 42.5 23.6 9.6 5.6
Portugal 415 15.5 40.9 15.8 8.4 19.4
Romania 184 17.9 39.4 14.2 16.8 11.7
Slovenia 165 22.6 38.4 20.7 13.5 4.8
Slovakia 85 13.9 44 20.4 3.8 18
Finland 254 4.3 28.6 24.5 21.3 21.4
Sweden 196 17.6 32.1 24.2 17.8 8.4
United Kingdom 361 27.4 30 23.5 14 5.1
Croatia 161 22 45.8 13 3.6 15.5
Norway 200 16.7 37.3 17.5 19.1 9.5
Iceland 221 21.6 29.6 18.1 8.3 22.4
Switzerland 165 21.2 32.4 23.2 18 5.3
Turkey 201 47.6 31.1 11.7 6.1 3.5
United States 569 28.4 34 18.8 16.5 2.4
China 651 27 47.9 18.5 3.5 3.1
Japan 261 47.8 38.1 10.7 1.4 2
South Korea 467 27.4 43.4 16.8 2 10.4
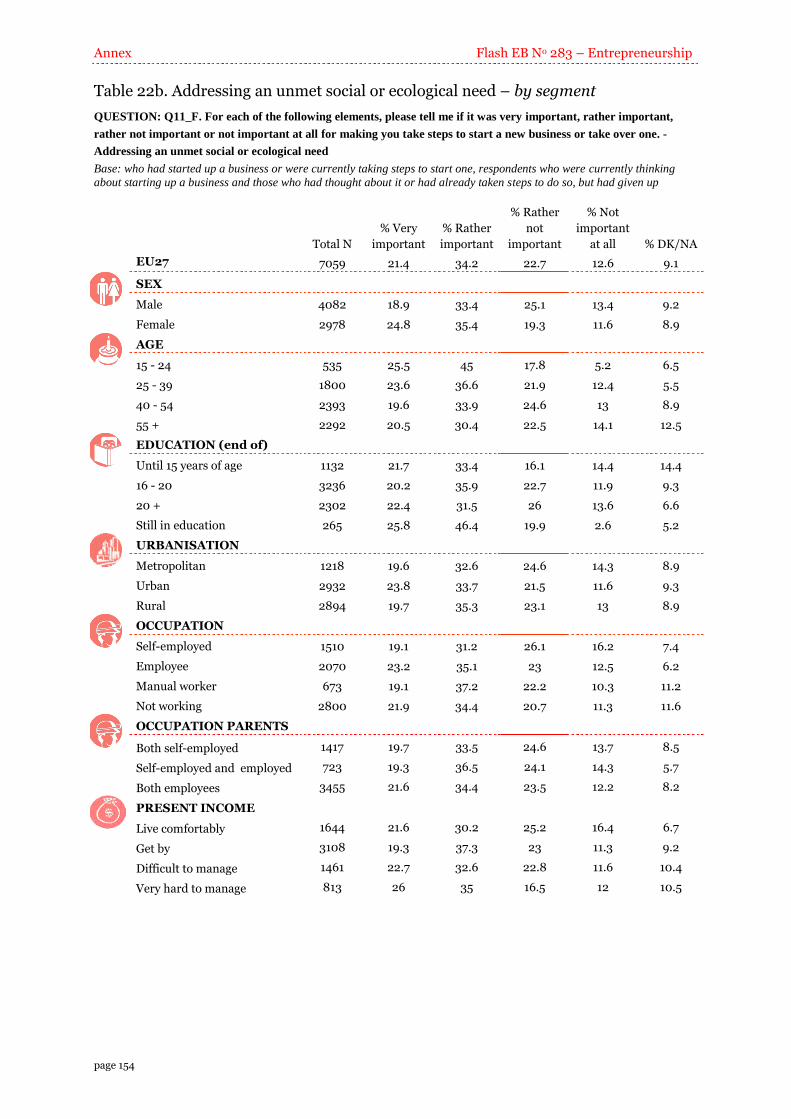
Annex Flash EB No 283 – Entrepreneurship
page 154
Table 22b. Addressing an unmet social or ecological need – by segment
QUESTION: Q11_F. For each of the following elements, please tell me if it was very important, rather important,
rather not important or not important at all for making you take steps to start a new business or take over one. -
Addressing an unmet social or ecological need
Base: who had started up a business or were currently taking steps to start one, respondents who were currently thinking
about starting up a business and those who had thought about it or had already taken steps to do so, but had given up
Total N
% Very
important
% Rather
important
% Rather
not
important
% Not
important
at all % DK/NA
EU27 7059 21.4 34.2 22.7 12.6 9.1
SEX
Male 4082 18.9 33.4 25.1 13.4 9.2
Female 2978 24.8 35.4 19.3 11.6 8.9
AGE
15 - 24 535 25.5 45 17.8 5.2 6.5
25 - 39 1800 23.6 36.6 21.9 12.4 5.5
40 - 54 2393 19.6 33.9 24.6 13 8.9
55 + 2292 20.5 30.4 22.5 14.1 12.5
EDUCATION (end of)
Until 15 years of age 1132 21.7 33.4 16.1 14.4 14.4
16 - 20 3236 20.2 35.9 22.7 11.9 9.3
20 + 2302 22.4 31.5 26 13.6 6.6
Still in education 265 25.8 46.4 19.9 2.6 5.2
URBANISATION
Metropolitan 1218 19.6 32.6 24.6 14.3 8.9
Urban 2932 23.8 33.7 21.5 11.6 9.3
Rural 2894 19.7 35.3 23.1 13 8.9
OCCUPATION
Self-employed 1510 19.1 31.2 26.1 16.2 7.4
Employee 2070 23.2 35.1 23 12.5 6.2
Manual worker 673 19.1 37.2 22.2 10.3 11.2
Not working 2800 21.9 34.4 20.7 11.3 11.6
OCCUPATION PARENTS
Both self-employed 1417 19.7 33.5 24.6 13.7 8.5
Self-employed and employed 723 19.3 36.5 24.1 14.3 5.7
Both employees 3455 21.6 34.4 23.5 12.2 8.2
PRESENT INCOME
Live comfortably 1644 21.6 30.2 25.2 16.4 6.7
Get by 3108 19.3 37.3 23 11.3 9.2
Difficult to manage 1461 22.7 32.6 22.8 11.6 10.4
Very hard to manage 813 26 35 16.5 12 10.5
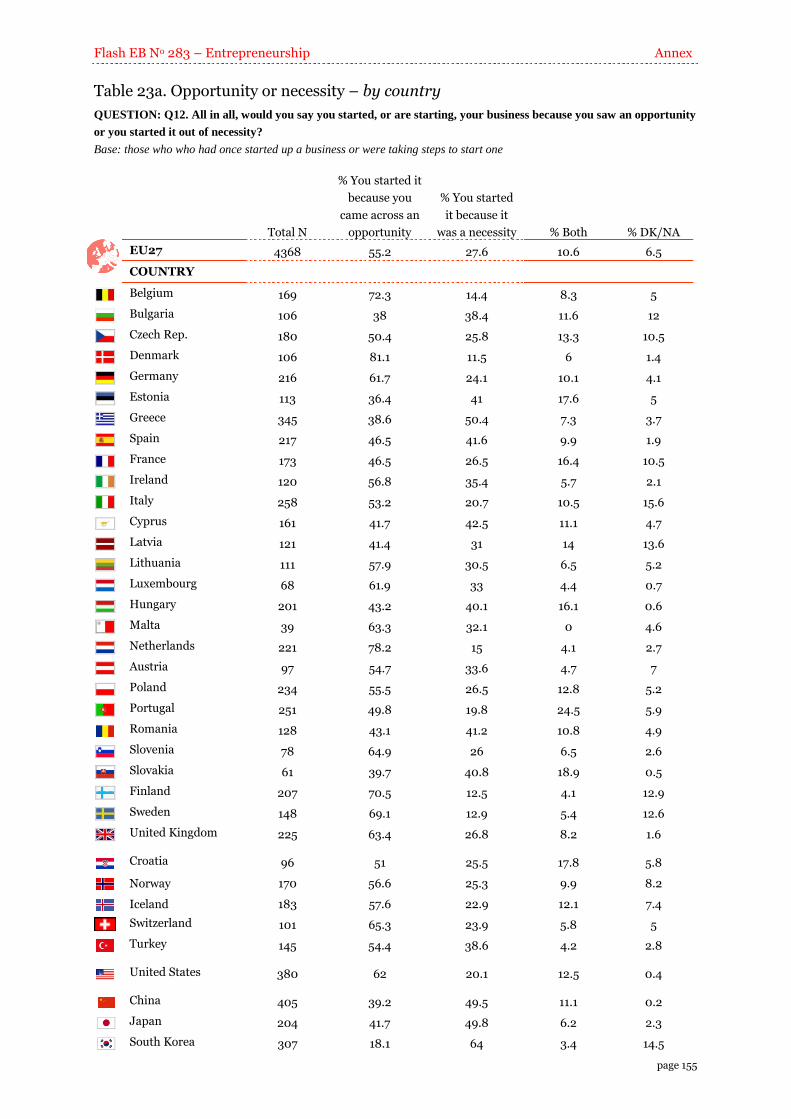
Flash EB No 283 – Entrepreneurship Annex
page 155
Table 23a. Opportunity or necessity – by country
QUESTION: Q12. All in all, would you say you started, or are starting, your business because you saw an opportunity
or you started it out of necessity?
Base: those who who had once started up a business or were taking steps to start one
Total N
% You started it
because you
came across an
opportunity
% You started
it because it
was a necessity % Both % DK/NA
EU27 4368 55.2 27.6 10.6 6.5
COUNTRY
Belgium 169 72.3 14.4 8.3 5
Bulgaria 106 38 38.4 11.6 12
Czech Rep. 180 50.4 25.8 13.3 10.5
Denmark 106 81.1 11.5 6 1.4
Germany 216 61.7 24.1 10.1 4.1
Estonia 113 36.4 41 17.6 5
Greece 345 38.6 50.4 7.3 3.7
Spain 217 46.5 41.6 9.9 1.9
France 173 46.5 26.5 16.4 10.5
Ireland 120 56.8 35.4 5.7 2.1
Italy 258 53.2 20.7 10.5 15.6
Cyprus 161 41.7 42.5 11.1 4.7
Latvia 121 41.4 31 14 13.6
Lithuania 111 57.9 30.5 6.5 5.2
Luxembourg 68 61.9 33 4.4 0.7
Hungary 201 43.2 40.1 16.1 0.6
Malta 39 63.3 32.1 0 4.6
Netherlands 221 78.2 15 4.1 2.7
Austria 97 54.7 33.6 4.7 7
Poland 234 55.5 26.5 12.8 5.2
Portugal 251 49.8 19.8 24.5 5.9
Romania 128 43.1 41.2 10.8 4.9
Slovenia 78 64.9 26 6.5 2.6
Slovakia 61 39.7 40.8 18.9 0.5
Finland 207 70.5 12.5 4.1 12.9
Sweden 148 69.1 12.9 5.4 12.6
United Kingdom 225 63.4 26.8 8.2 1.6
Croatia 96 51 25.5 17.8 5.8
Norway 170 56.6 25.3 9.9 8.2
Iceland 183 57.6 22.9 12.1 7.4
Switzerland 101 65.3 23.9 5.8 5
Turkey 145 54.4 38.6 4.2 2.8
United States 380 62 20.1 12.5 0.4
China 405 39.2 49.5 11.1 0.2
Japan 204 41.7 49.8 6.2 2.3
South Korea 307 18.1 64 3.4 14.5
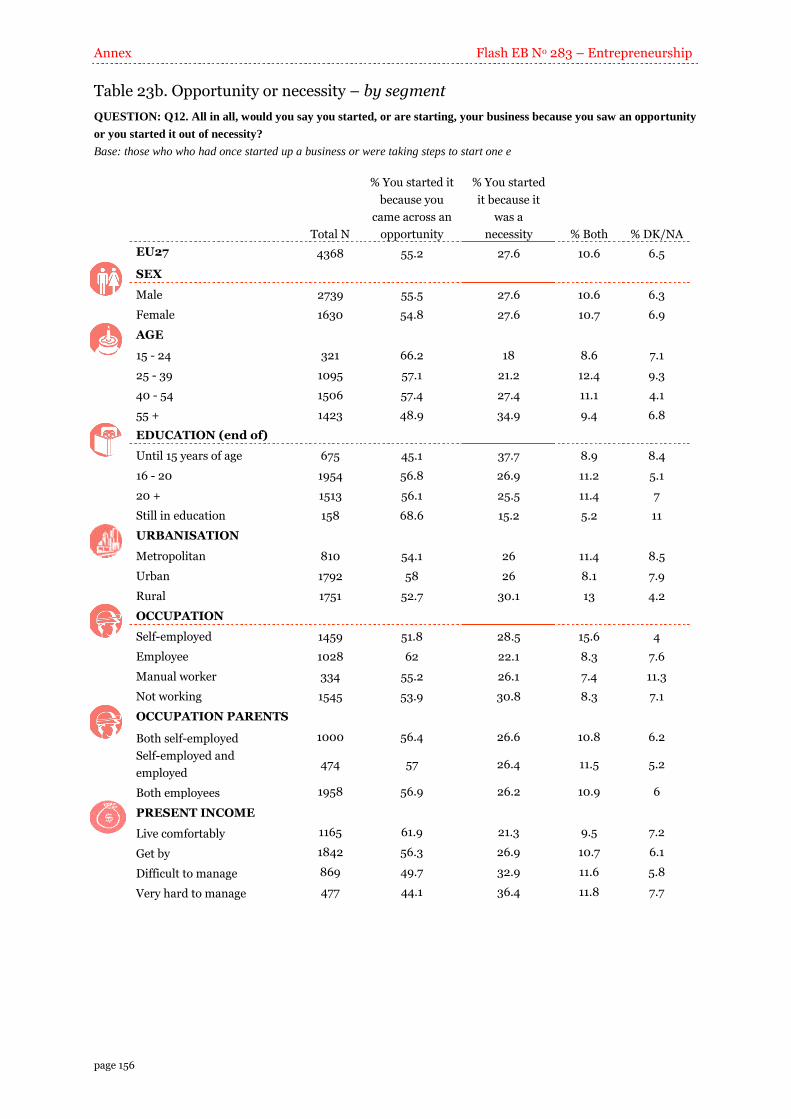
Annex Flash EB No 283 – Entrepreneurship
page 156
Table 23b. Opportunity or necessity – by segment
QUESTION: Q12. All in all, would you say you started, or are starting, your business because you saw an opportunity
or you started it out of necessity?
Base: those who who had once started up a business or were taking steps to start one e
Total N
% You started it
because you
came across an
opportunity
% You started
it because it
was a
necessity % Both % DK/NA
EU27 4368 55.2 27.6 10.6 6.5
SEX
Male 2739 55.5 27.6 10.6 6.3
Female 1630 54.8 27.6 10.7 6.9
AGE
15 - 24 321 66.2 18 8.6 7.1
25 - 39 1095 57.1 21.2 12.4 9.3
40 - 54 1506 57.4 27.4 11.1 4.1
55 + 1423 48.9 34.9 9.4 6.8
EDUCATION (end of)
Until 15 years of age 675 45.1 37.7 8.9 8.4
16 - 20 1954 56.8 26.9 11.2 5.1
20 + 1513 56.1 25.5 11.4 7
Still in education 158 68.6 15.2 5.2 11
URBANISATION
Metropolitan 810 54.1 26 11.4 8.5
Urban 1792 58 26 8.1 7.9
Rural 1751 52.7 30.1 13 4.2
OCCUPATION
Self-employed 1459 51.8 28.5 15.6 4
Employee 1028 62 22.1 8.3 7.6
Manual worker 334 55.2 26.1 7.4 11.3
Not working 1545 53.9 30.8 8.3 7.1
OCCUPATION PARENTS
Both self-employed 1000 56.4 26.6 10.8 6.2
Self-employed and
employed 474 57 26.4 11.5 5.2
Both employees 1958 56.9 26.2 10.9 6
PRESENT INCOME
Live comfortably 1165 61.9 21.3 9.5 7.2
Get by 1842 56.3 26.9 10.7 6.1
Difficult to manage 869 49.7 32.9 11.6 5.8
Very hard to manage 477 44.1 36.4 11.8 7.7
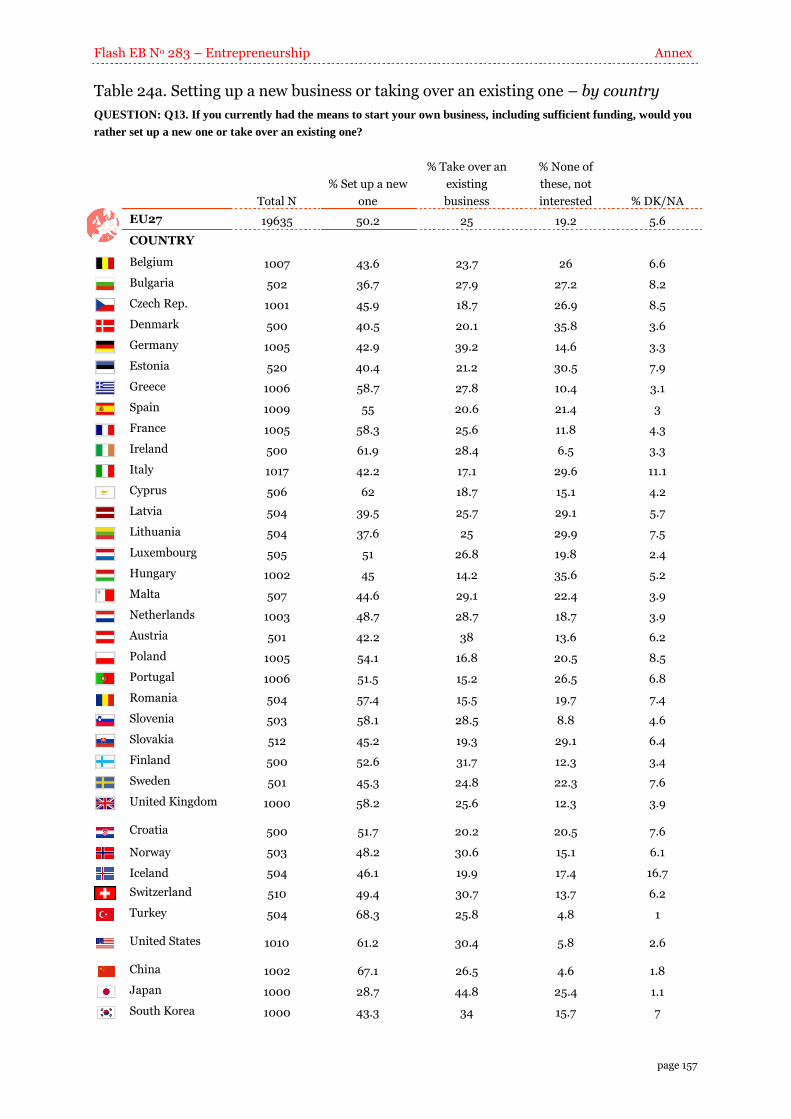
Flash EB No 283 – Entrepreneurship Annex
page 157
Table 24a. Setting up a new business or taking over an existing one – by country
QUESTION: Q13. If you currently had the means to start your own business, including sufficient funding, would you
rather set up a new one or take over an existing one?
Total N
% Set up a new
one
% Take over an
existing
business
% None of
these, not
interested % DK/NA
EU27 19635 50.2 25 19.2 5.6
COUNTRY
Belgium 1007 43.6 23.7 26 6.6
Bulgaria 502 36.7 27.9 27.2 8.2
Czech Rep. 1001 45.9 18.7 26.9 8.5
Denmark 500 40.5 20.1 35.8 3.6
Germany 1005 42.9 39.2 14.6 3.3
Estonia 520 40.4 21.2 30.5 7.9
Greece 1006 58.7 27.8 10.4 3.1
Spain 1009 55 20.6 21.4 3
France 1005 58.3 25.6 11.8 4.3
Ireland 500 61.9 28.4 6.5 3.3
Italy 1017 42.2 17.1 29.6 11.1
Cyprus 506 62 18.7 15.1 4.2
Latvia 504 39.5 25.7 29.1 5.7
Lithuania 504 37.6 25 29.9 7.5
Luxembourg 505 51 26.8 19.8 2.4
Hungary 1002 45 14.2 35.6 5.2
Malta 507 44.6 29.1 22.4 3.9
Netherlands 1003 48.7 28.7 18.7 3.9
Austria 501 42.2 38 13.6 6.2
Poland 1005 54.1 16.8 20.5 8.5
Portugal 1006 51.5 15.2 26.5 6.8
Romania 504 57.4 15.5 19.7 7.4
Slovenia 503 58.1 28.5 8.8 4.6
Slovakia 512 45.2 19.3 29.1 6.4
Finland 500 52.6 31.7 12.3 3.4
Sweden 501 45.3 24.8 22.3 7.6
United Kingdom 1000 58.2 25.6 12.3 3.9
Croatia 500 51.7 20.2 20.5 7.6
Norway 503 48.2 30.6 15.1 6.1
Iceland 504 46.1 19.9 17.4 16.7
Switzerland 510 49.4 30.7 13.7 6.2
Turkey 504 68.3 25.8 4.8 1
United States 1010 61.2 30.4 5.8 2.6
China 1002 67.1 26.5 4.6 1.8
Japan 1000 28.7 44.8 25.4 1.1
South Korea 1000 43.3 34 15.7 7
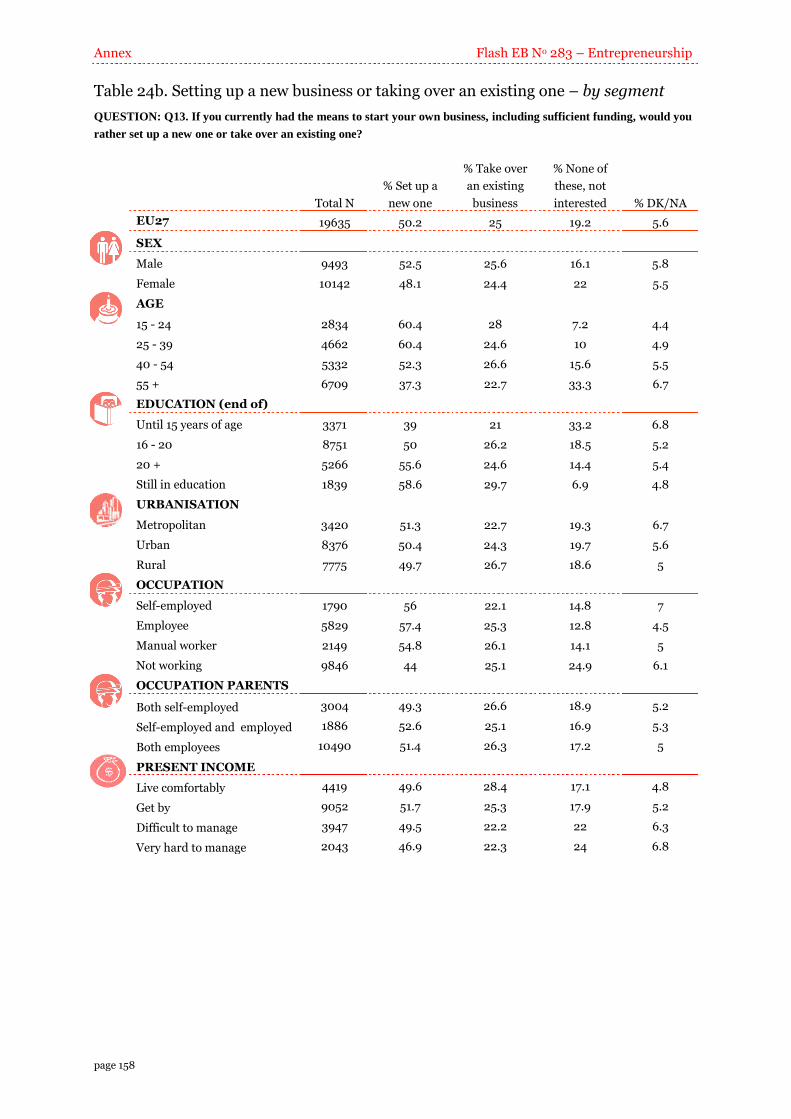
Annex Flash EB No 283 – Entrepreneurship
page 158
Table 24b. Setting up a new business or taking over an existing one – by segment
QUESTION: Q13. If you currently had the means to start your own business, including sufficient funding, would you
rather set up a new one or take over an existing one?
Total N
% Set up a
new one
% Take over
an existing
business
% None of
these, not
interested % DK/NA
EU27 19635 50.2 25 19.2 5.6
SEX
Male 9493 52.5 25.6 16.1 5.8
Female 10142 48.1 24.4 22 5.5
AGE
15 - 24 2834 60.4 28 7.2 4.4
25 - 39 4662 60.4 24.6 10 4.9
40 - 54 5332 52.3 26.6 15.6 5.5
55 + 6709 37.3 22.7 33.3 6.7
EDUCATION (end of)
Until 15 years of age 3371 39 21 33.2 6.8
16 - 20 8751 50 26.2 18.5 5.2
20 + 5266 55.6 24.6 14.4 5.4
Still in education 1839 58.6 29.7 6.9 4.8
URBANISATION
Metropolitan 3420 51.3 22.7 19.3 6.7
Urban 8376 50.4 24.3 19.7 5.6
Rural 7775 49.7 26.7 18.6 5
OCCUPATION
Self-employed 1790 56 22.1 14.8 7
Employee 5829 57.4 25.3 12.8 4.5
Manual worker 2149 54.8 26.1 14.1 5
Not working 9846 44 25.1 24.9 6.1
OCCUPATION PARENTS
Both self-employed 3004 49.3 26.6 18.9 5.2
Self-employed and employed 1886 52.6 25.1 16.9 5.3
Both employees 10490 51.4 26.3 17.2 5
PRESENT INCOME
Live comfortably 4419 49.6 28.4 17.1 4.8
Get by 9052 51.7 25.3 17.9 5.2
Difficult to manage 3947 49.5 22.2 22 6.3
Very hard to manage 2043 46.9 22.3 24 6.8
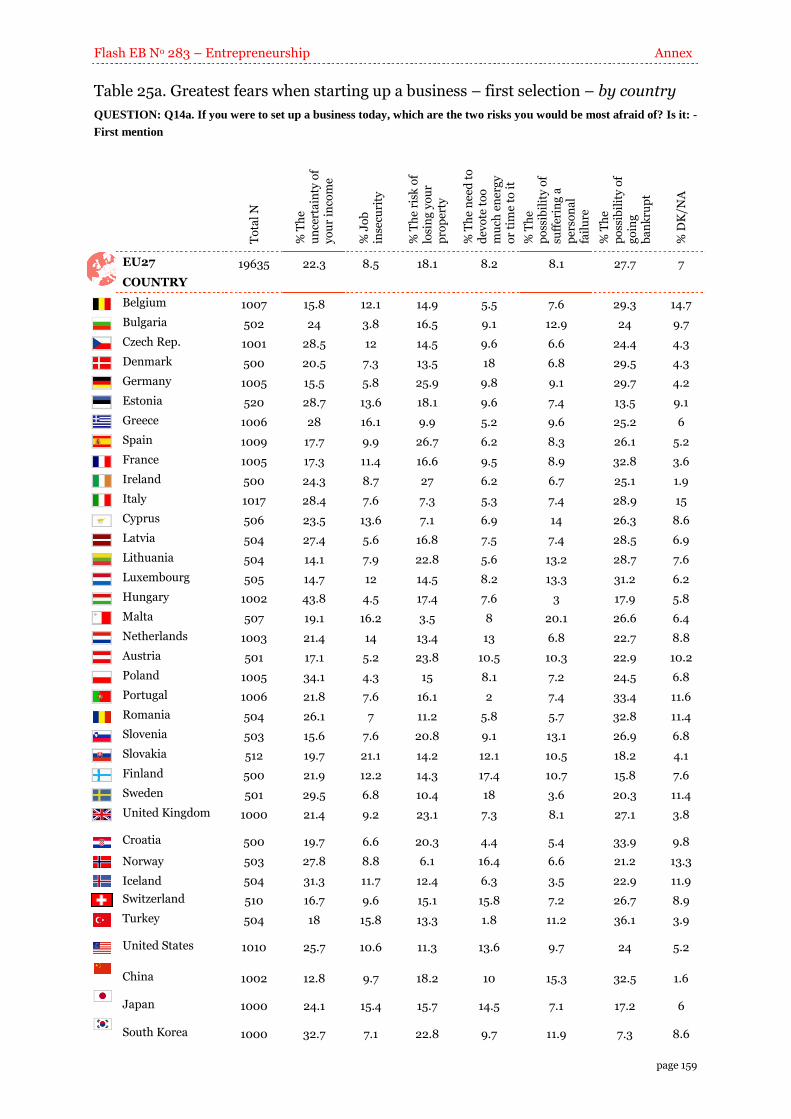
Flash EB No 283 – Entrepreneurship Annex
page 159
Table 25a. Greatest fears when starting up a business – first selection – by country
QUESTION: Q14a. If you were to set up a business today, which are the two risks you would be most afraid of? Is it: -
First mention
To
tal
N
% T
he
un
cert
ain
ty o
f y
ou
r in
com
e
% J
ob
in
secu
rity
% T
he
risk
of
losi
ng
yo
ur
pro
per
ty
% T
he
ne
ed t
o
dev
ote
to
o
mu
ch e
ner
gy
o
r ti
me
to i
t
% T
he
po
ssib
ilit
y o
f su
ffer
ing
a
per
son
al
fail
ure
% T
he
po
ssib
ilit
y o
f g
oin
g
ba
nk
rup
t
% D
K/N
A
EU27 19635 22.3 8.5 18.1 8.2 8.1 27.7 7
COUNTRY
Belgium 1007 15.8 12.1 14.9 5.5 7.6 29.3 14.7
Bulgaria 502 24 3.8 16.5 9.1 12.9 24 9.7
Czech Rep. 1001 28.5 12 14.5 9.6 6.6 24.4 4.3
Denmark 500 20.5 7.3 13.5 18 6.8 29.5 4.3
Germany 1005 15.5 5.8 25.9 9.8 9.1 29.7 4.2
Estonia 520 28.7 13.6 18.1 9.6 7.4 13.5 9.1
Greece 1006 28 16.1 9.9 5.2 9.6 25.2 6
Spain 1009 17.7 9.9 26.7 6.2 8.3 26.1 5.2
France 1005 17.3 11.4 16.6 9.5 8.9 32.8 3.6
Ireland 500 24.3 8.7 27 6.2 6.7 25.1 1.9
Italy 1017 28.4 7.6 7.3 5.3 7.4 28.9 15
Cyprus 506 23.5 13.6 7.1 6.9 14 26.3 8.6
Latvia 504 27.4 5.6 16.8 7.5 7.4 28.5 6.9
Lithuania 504 14.1 7.9 22.8 5.6 13.2 28.7 7.6
Luxembourg 505 14.7 12 14.5 8.2 13.3 31.2 6.2
Hungary 1002 43.8 4.5 17.4 7.6 3 17.9 5.8
Malta 507 19.1 16.2 3.5 8 20.1 26.6 6.4
Netherlands 1003 21.4 14 13.4 13 6.8 22.7 8.8
Austria 501 17.1 5.2 23.8 10.5 10.3 22.9 10.2
Poland 1005 34.1 4.3 15 8.1 7.2 24.5 6.8
Portugal 1006 21.8 7.6 16.1 2 7.4 33.4 11.6
Romania 504 26.1 7 11.2 5.8 5.7 32.8 11.4
Slovenia 503 15.6 7.6 20.8 9.1 13.1 26.9 6.8
Slovakia 512 19.7 21.1 14.2 12.1 10.5 18.2 4.1
Finland 500 21.9 12.2 14.3 17.4 10.7 15.8 7.6
Sweden 501 29.5 6.8 10.4 18 3.6 20.3 11.4
United Kingdom 1000 21.4 9.2 23.1 7.3 8.1 27.1 3.8
Croatia 500 19.7 6.6 20.3 4.4 5.4 33.9 9.8
Norway 503 27.8 8.8 6.1 16.4 6.6 21.2 13.3
Iceland 504 31.3 11.7 12.4 6.3 3.5 22.9 11.9
Switzerland 510 16.7 9.6 15.1 15.8 7.2 26.7 8.9
Turkey 504 18 15.8 13.3 1.8 11.2 36.1 3.9
United States 1010 25.7 10.6 11.3 13.6 9.7 24 5.2
China 1002 12.8 9.7 18.2 10 15.3 32.5 1.6
Japan 1000 24.1 15.4 15.7 14.5 7.1 17.2 6
South Korea 1000 32.7 7.1 22.8 9.7 11.9 7.3 8.6
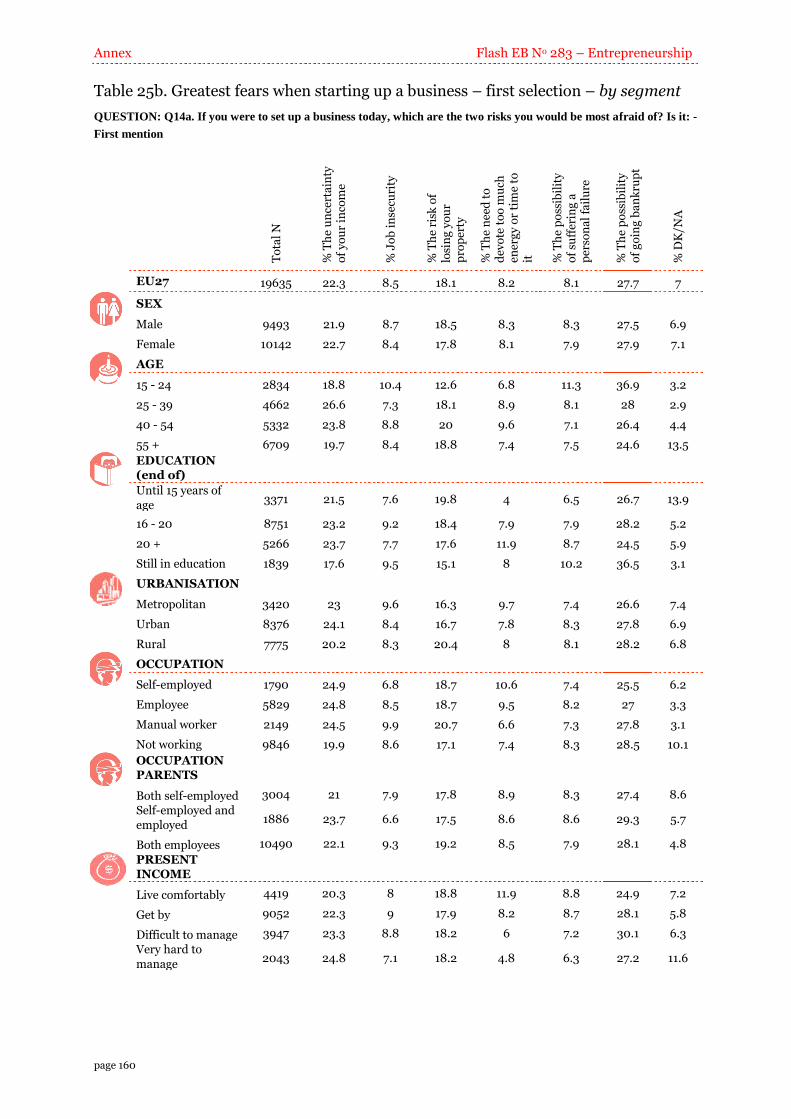
Annex Flash EB No 283 – Entrepreneurship
page 160
Table 25b. Greatest fears when starting up a business – first selection – by segment
QUESTION: Q14a. If you were to set up a business today, which are the two risks you would be most afraid of? Is it: -
First mention
To
tal
N
% T
he
un
cert
ain
ty
of
yo
ur
inco
me
% J
ob
in
secu
rity
% T
he
risk
of
losi
ng
yo
ur
pro
per
ty
% T
he
ne
ed t
o
dev
ote
to
o m
uch
en
erg
y o
r ti
me
to
it
% T
he
po
ssib
ilit
y
of
suff
erin
g a
p
erso
na
l fa
ilu
re
% T
he
po
ssib
ilit
y
of
go
ing
ba
nk
rup
t
% D
K/N
A
EU27 19635 22.3 8.5 18.1 8.2 8.1 27.7 7
SEX
Male 9493 21.9 8.7 18.5 8.3 8.3 27.5 6.9
Female 10142 22.7 8.4 17.8 8.1 7.9 27.9 7.1
AGE
15 - 24 2834 18.8 10.4 12.6 6.8 11.3 36.9 3.2
25 - 39 4662 26.6 7.3 18.1 8.9 8.1 28 2.9
40 - 54 5332 23.8 8.8 20 9.6 7.1 26.4 4.4
55 + 6709 19.7 8.4 18.8 7.4 7.5 24.6 13.5
EDUCATION (end of)
Until 15 years of
age 3371 21.5 7.6 19.8 4 6.5 26.7 13.9
16 - 20 8751 23.2 9.2 18.4 7.9 7.9 28.2 5.2
20 + 5266 23.7 7.7 17.6 11.9 8.7 24.5 5.9
Still in education 1839 17.6 9.5 15.1 8 10.2 36.5 3.1
URBANISATION
Metropolitan 3420 23 9.6 16.3 9.7 7.4 26.6 7.4
Urban 8376 24.1 8.4 16.7 7.8 8.3 27.8 6.9
Rural 7775 20.2 8.3 20.4 8 8.1 28.2 6.8
OCCUPATION
Self-employed 1790 24.9 6.8 18.7 10.6 7.4 25.5 6.2
Employee 5829 24.8 8.5 18.7 9.5 8.2 27 3.3
Manual worker 2149 24.5 9.9 20.7 6.6 7.3 27.8 3.1
Not working 9846 19.9 8.6 17.1 7.4 8.3 28.5 10.1
OCCUPATION PARENTS
Both self-employed 3004 21 7.9 17.8 8.9 8.3 27.4 8.6
Self-employed and
employed 1886 23.7 6.6 17.5 8.6 8.6 29.3 5.7
Both employees 10490 22.1 9.3 19.2 8.5 7.9 28.1 4.8
PRESENT INCOME
Live comfortably 4419 20.3 8 18.8 11.9 8.8 24.9 7.2
Get by 9052 22.3 9 17.9 8.2 8.7 28.1 5.8
Difficult to manage 3947 23.3 8.8 18.2 6 7.2 30.1 6.3
Very hard to
manage 2043 24.8 7.1 18.2 4.8 6.3 27.2 11.6
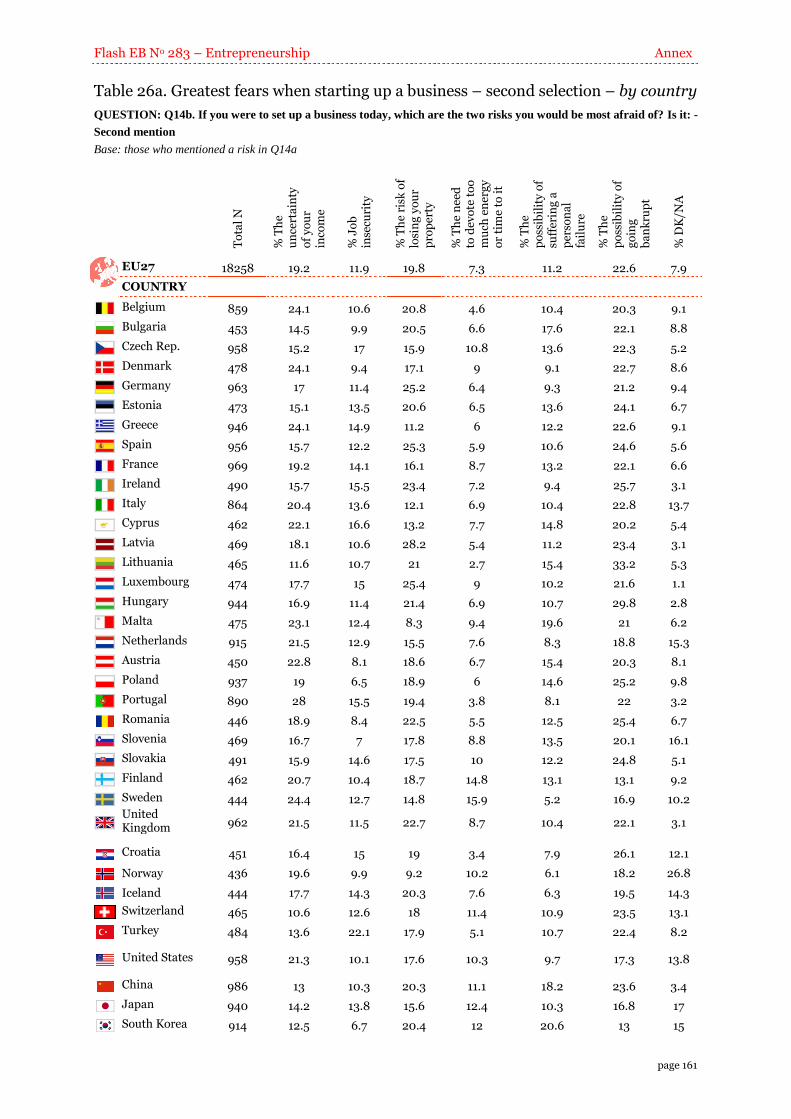
Flash EB No 283 – Entrepreneurship Annex
page 161
Table 26a. Greatest fears when starting up a business – second selection – by country
QUESTION: Q14b. If you were to set up a business today, which are the two risks you would be most afraid of? Is it: -
Second mention
Base: those who mentioned a risk in Q14a
To
tal
N
% T
he
un
cert
ain
ty
of
yo
ur
inco
me
% J
ob
in
secu
rity
% T
he
risk
of
losi
ng
yo
ur
pro
per
ty
% T
he
ne
ed
to d
evo
te t
oo
m
uch
en
erg
y
or
tim
e to
it
% T
he
po
ssib
ilit
y o
f su
ffer
ing
a
per
son
al
fail
ure
% T
he
po
ssib
ilit
y o
f g
oin
g
ba
nk
rup
t
% D
K/N
A
EU27 18258 19.2 11.9 19.8 7.3 11.2 22.6 7.9
COUNTRY
Belgium 859 24.1 10.6 20.8 4.6 10.4 20.3 9.1
Bulgaria 453 14.5 9.9 20.5 6.6 17.6 22.1 8.8
Czech Rep. 958 15.2 17 15.9 10.8 13.6 22.3 5.2
Denmark 478 24.1 9.4 17.1 9 9.1 22.7 8.6
Germany 963 17 11.4 25.2 6.4 9.3 21.2 9.4
Estonia 473 15.1 13.5 20.6 6.5 13.6 24.1 6.7
Greece 946 24.1 14.9 11.2 6 12.2 22.6 9.1
Spain 956 15.7 12.2 25.3 5.9 10.6 24.6 5.6
France 969 19.2 14.1 16.1 8.7 13.2 22.1 6.6
Ireland 490 15.7 15.5 23.4 7.2 9.4 25.7 3.1
Italy 864 20.4 13.6 12.1 6.9 10.4 22.8 13.7
Cyprus 462 22.1 16.6 13.2 7.7 14.8 20.2 5.4
Latvia 469 18.1 10.6 28.2 5.4 11.2 23.4 3.1
Lithuania 465 11.6 10.7 21 2.7 15.4 33.2 5.3
Luxembourg 474 17.7 15 25.4 9 10.2 21.6 1.1
Hungary 944 16.9 11.4 21.4 6.9 10.7 29.8 2.8
Malta 475 23.1 12.4 8.3 9.4 19.6 21 6.2
Netherlands 915 21.5 12.9 15.5 7.6 8.3 18.8 15.3
Austria 450 22.8 8.1 18.6 6.7 15.4 20.3 8.1
Poland 937 19 6.5 18.9 6 14.6 25.2 9.8
Portugal 890 28 15.5 19.4 3.8 8.1 22 3.2
Romania 446 18.9 8.4 22.5 5.5 12.5 25.4 6.7
Slovenia 469 16.7 7 17.8 8.8 13.5 20.1 16.1
Slovakia 491 15.9 14.6 17.5 10 12.2 24.8 5.1
Finland 462 20.7 10.4 18.7 14.8 13.1 13.1 9.2
Sweden 444 24.4 12.7 14.8 15.9 5.2 16.9 10.2
United Kingdom 962 21.5 11.5 22.7 8.7 10.4 22.1 3.1
Croatia 451 16.4 15 19 3.4 7.9 26.1 12.1
Norway 436 19.6 9.9 9.2 10.2 6.1 18.2 26.8
Iceland 444 17.7 14.3 20.3 7.6 6.3 19.5 14.3
Switzerland 465 10.6 12.6 18 11.4 10.9 23.5 13.1
Turkey 484 13.6 22.1 17.9 5.1 10.7 22.4 8.2
United States 958 21.3 10.1 17.6 10.3 9.7 17.3 13.8
China 986 13 10.3 20.3 11.1 18.2 23.6 3.4
Japan 940 14.2 13.8 15.6 12.4 10.3 16.8 17
South Korea 914 12.5 6.7 20.4 12 20.6 13 15
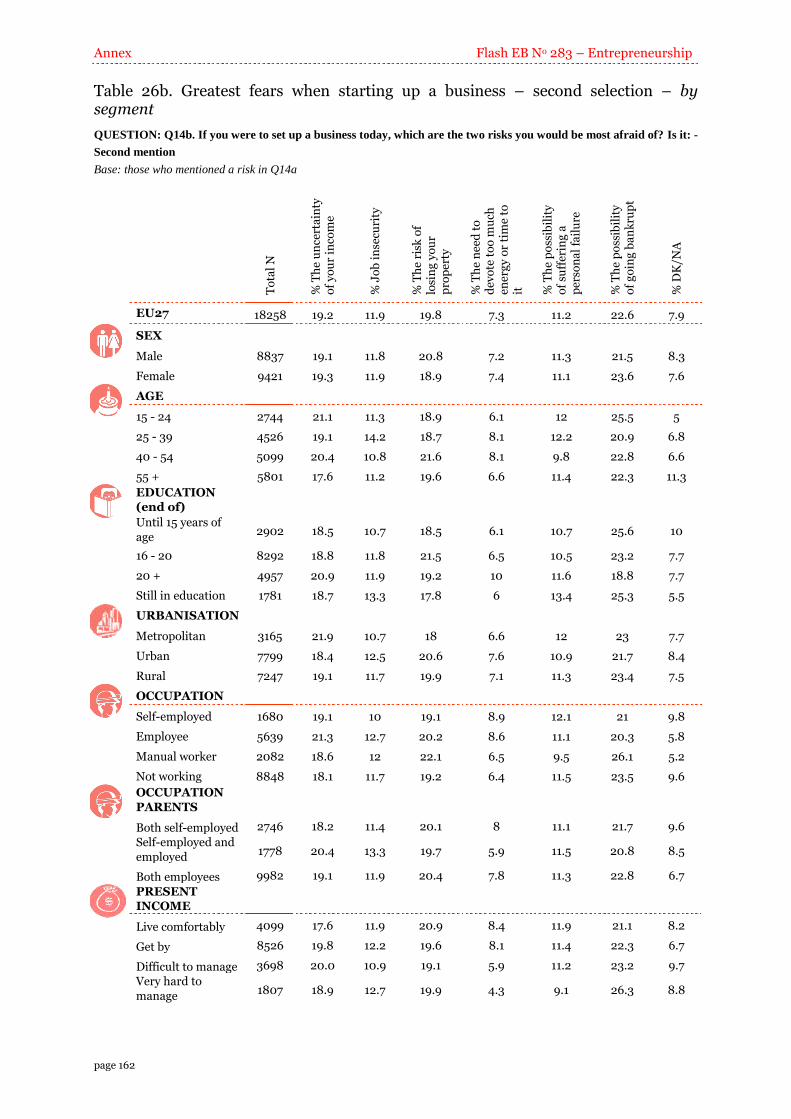
Annex Flash EB No 283 – Entrepreneurship
page 162
Table 26b. Greatest fears when starting up a business – second selection – by segment
QUESTION: Q14b. If you were to set up a business today, which are the two risks you would be most afraid of? Is it: -
Second mention
Base: those who mentioned a risk in Q14a
To
tal
N
% T
he
un
cert
ain
ty
of
yo
ur
inco
me
% J
ob
in
secu
rity
% T
he
risk
of
losi
ng
yo
ur
pro
per
ty
% T
he
ne
ed t
o
dev
ote
to
o m
uch
en
erg
y o
r ti
me
to
it
% T
he
po
ssib
ilit
y
of
suff
erin
g a
p
erso
na
l fa
ilu
re
% T
he
po
ssib
ilit
y
of
go
ing
ba
nk
rup
t
% D
K/N
A
EU27 18258 19.2 11.9 19.8 7.3 11.2 22.6 7.9
SEX
Male 8837 19.1 11.8 20.8 7.2 11.3 21.5 8.3
Female 9421 19.3 11.9 18.9 7.4 11.1 23.6 7.6
AGE
15 - 24 2744 21.1 11.3 18.9 6.1 12 25.5 5
25 - 39 4526 19.1 14.2 18.7 8.1 12.2 20.9 6.8
40 - 54 5099 20.4 10.8 21.6 8.1 9.8 22.8 6.6
55 + 5801 17.6 11.2 19.6 6.6 11.4 22.3 11.3
EDUCATION (end of)
Until 15 years of
age 2902 18.5 10.7 18.5 6.1 10.7 25.6 10
16 - 20 8292 18.8 11.8 21.5 6.5 10.5 23.2 7.7
20 + 4957 20.9 11.9 19.2 10 11.6 18.8 7.7
Still in education 1781 18.7 13.3 17.8 6 13.4 25.3 5.5
URBANISATION
Metropolitan 3165 21.9 10.7 18 6.6 12 23 7.7
Urban 7799 18.4 12.5 20.6 7.6 10.9 21.7 8.4
Rural 7247 19.1 11.7 19.9 7.1 11.3 23.4 7.5
OCCUPATION
Self-employed 1680 19.1 10 19.1 8.9 12.1 21 9.8
Employee 5639 21.3 12.7 20.2 8.6 11.1 20.3 5.8
Manual worker 2082 18.6 12 22.1 6.5 9.5 26.1 5.2
Not working 8848 18.1 11.7 19.2 6.4 11.5 23.5 9.6
OCCUPATION
PARENTS
Both self-employed 2746 18.2 11.4 20.1 8 11.1 21.7 9.6
Self-employed and
employed 1778 20.4 13.3 19.7 5.9 11.5 20.8 8.5
Both employees 9982 19.1 11.9 20.4 7.8 11.3 22.8 6.7
PRESENT INCOME
Live comfortably 4099 17.6 11.9 20.9 8.4 11.9 21.1 8.2
Get by 8526 19.8 12.2 19.6 8.1 11.4 22.3 6.7
Difficult to manage 3698 20.0 10.9 19.1 5.9 11.2 23.2 9.7
Very hard to
manage 1807 18.9 12.7 19.9 4.3 9.1 26.3 8.8
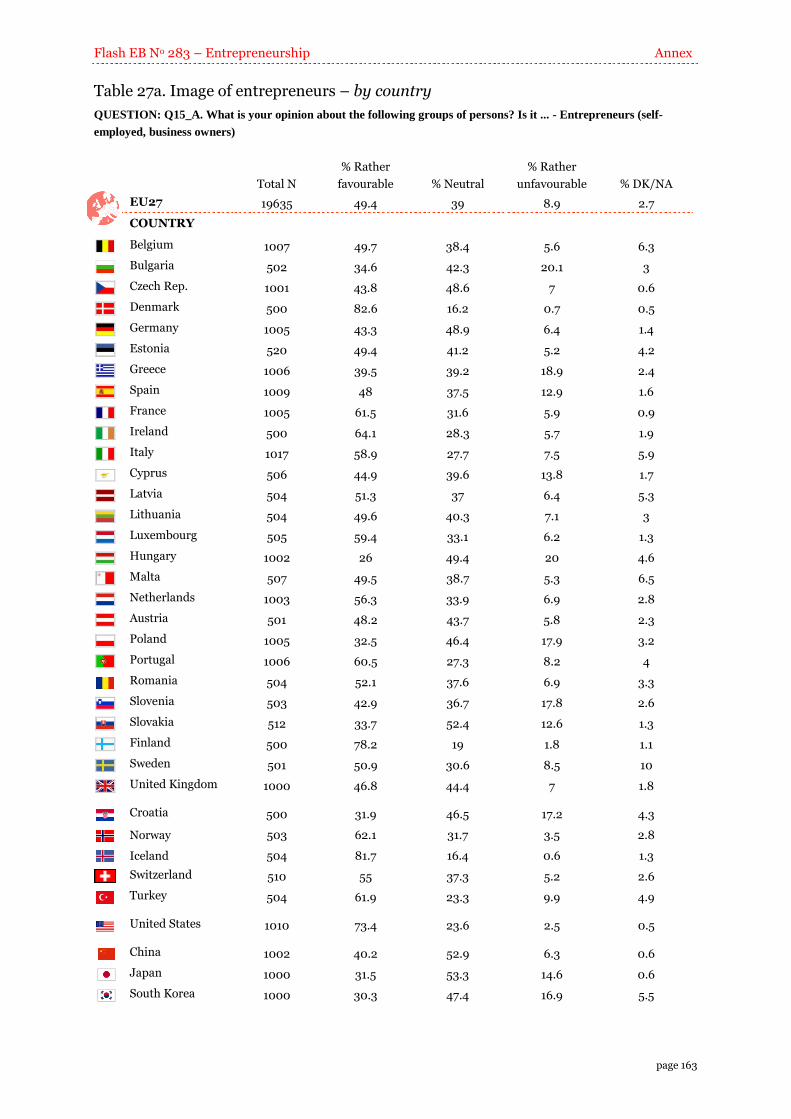
Flash EB No 283 – Entrepreneurship Annex
page 163
Table 27a. Image of entrepreneurs – by country
QUESTION: Q15_A. What is your opinion about the following groups of persons? Is it ... - Entrepreneurs (self-
employed, business owners)
Total N
% Rather
favourable % Neutral
% Rather
unfavourable % DK/NA
EU27 19635 49.4 39 8.9 2.7
COUNTRY
Belgium 1007 49.7 38.4 5.6 6.3
Bulgaria 502 34.6 42.3 20.1 3
Czech Rep. 1001 43.8 48.6 7 0.6
Denmark 500 82.6 16.2 0.7 0.5
Germany 1005 43.3 48.9 6.4 1.4
Estonia 520 49.4 41.2 5.2 4.2
Greece 1006 39.5 39.2 18.9 2.4
Spain 1009 48 37.5 12.9 1.6
France 1005 61.5 31.6 5.9 0.9
Ireland 500 64.1 28.3 5.7 1.9
Italy 1017 58.9 27.7 7.5 5.9
Cyprus 506 44.9 39.6 13.8 1.7
Latvia 504 51.3 37 6.4 5.3
Lithuania 504 49.6 40.3 7.1 3
Luxembourg 505 59.4 33.1 6.2 1.3
Hungary 1002 26 49.4 20 4.6
Malta 507 49.5 38.7 5.3 6.5
Netherlands 1003 56.3 33.9 6.9 2.8
Austria 501 48.2 43.7 5.8 2.3
Poland 1005 32.5 46.4 17.9 3.2
Portugal 1006 60.5 27.3 8.2 4
Romania 504 52.1 37.6 6.9 3.3
Slovenia 503 42.9 36.7 17.8 2.6
Slovakia 512 33.7 52.4 12.6 1.3
Finland 500 78.2 19 1.8 1.1
Sweden 501 50.9 30.6 8.5 10
United Kingdom 1000 46.8 44.4 7 1.8
Croatia 500 31.9 46.5 17.2 4.3
Norway 503 62.1 31.7 3.5 2.8
Iceland 504 81.7 16.4 0.6 1.3
Switzerland 510 55 37.3 5.2 2.6
Turkey 504 61.9 23.3 9.9 4.9
United States 1010 73.4 23.6 2.5 0.5
China 1002 40.2 52.9 6.3 0.6
Japan 1000 31.5 53.3 14.6 0.6
South Korea 1000 30.3 47.4 16.9 5.5
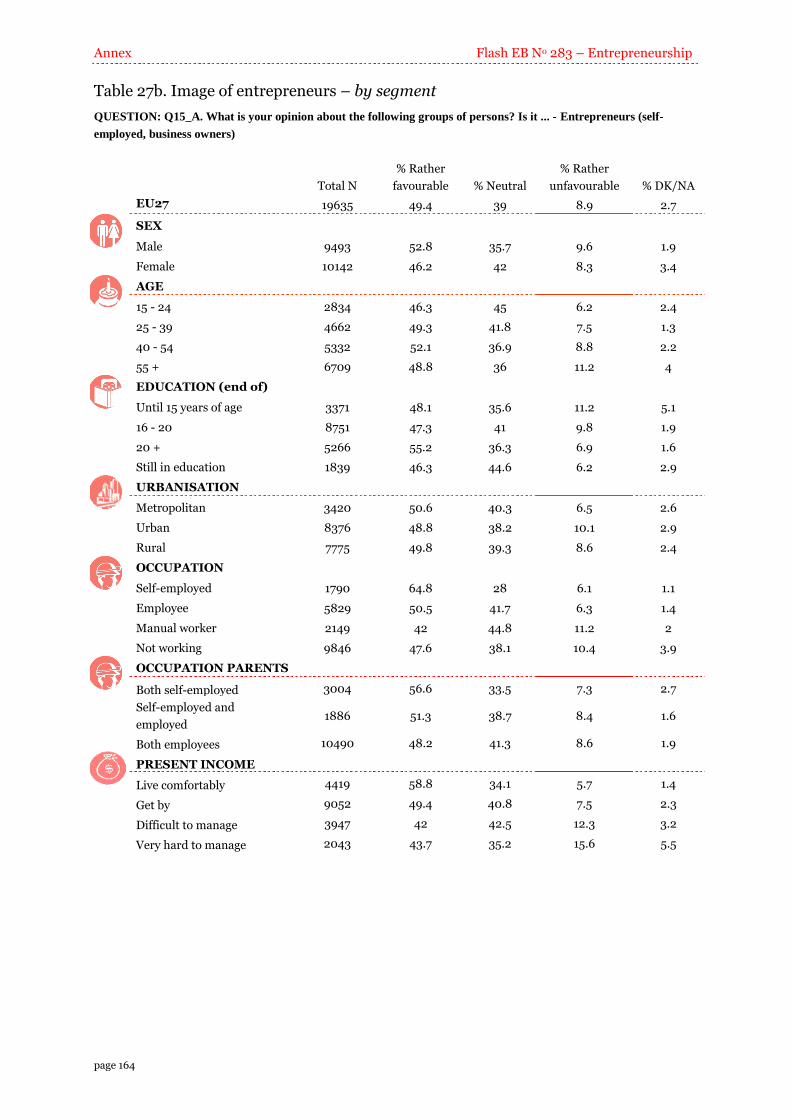
Annex Flash EB No 283 – Entrepreneurship
page 164
Table 27b. Image of entrepreneurs – by segment
QUESTION: Q15_A. What is your opinion about the following groups of persons? Is it ... - Entrepreneurs (self-
employed, business owners)
Total N
% Rather
favourable % Neutral
% Rather
unfavourable % DK/NA
EU27 19635 49.4 39 8.9 2.7
SEX
Male 9493 52.8 35.7 9.6 1.9
Female 10142 46.2 42 8.3 3.4
AGE
15 - 24 2834 46.3 45 6.2 2.4
25 - 39 4662 49.3 41.8 7.5 1.3
40 - 54 5332 52.1 36.9 8.8 2.2
55 + 6709 48.8 36 11.2 4
EDUCATION (end of)
Until 15 years of age 3371 48.1 35.6 11.2 5.1
16 - 20 8751 47.3 41 9.8 1.9
20 + 5266 55.2 36.3 6.9 1.6
Still in education 1839 46.3 44.6 6.2 2.9
URBANISATION
Metropolitan 3420 50.6 40.3 6.5 2.6
Urban 8376 48.8 38.2 10.1 2.9
Rural 7775 49.8 39.3 8.6 2.4
OCCUPATION
Self-employed 1790 64.8 28 6.1 1.1
Employee 5829 50.5 41.7 6.3 1.4
Manual worker 2149 42 44.8 11.2 2
Not working 9846 47.6 38.1 10.4 3.9
OCCUPATION PARENTS
Both self-employed 3004 56.6 33.5 7.3 2.7
Self-employed and
employed 1886 51.3 38.7 8.4 1.6
Both employees 10490 48.2 41.3 8.6 1.9
PRESENT INCOME
Live comfortably 4419 58.8 34.1 5.7 1.4
Get by 9052 49.4 40.8 7.5 2.3
Difficult to manage 3947 42 42.5 12.3 3.2
Very hard to manage 2043 43.7 35.2 15.6 5.5
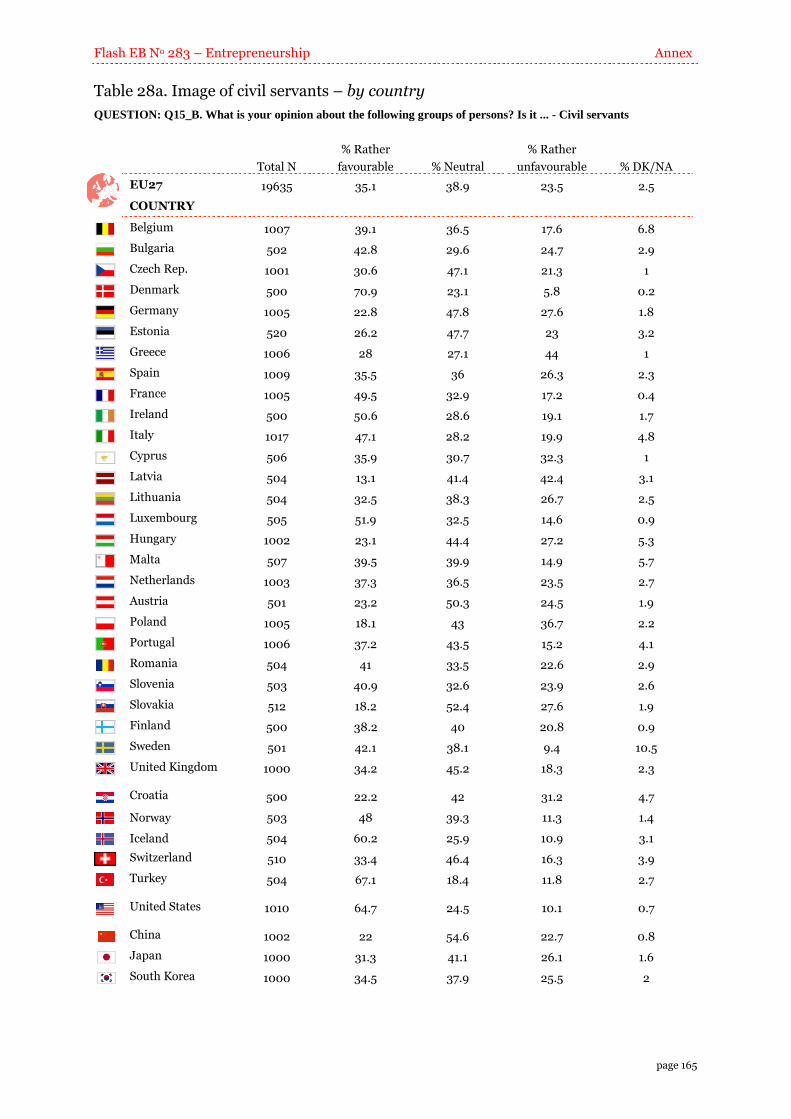
Flash EB No 283 – Entrepreneurship Annex
page 165
Table 28a. Image of civil servants – by country
QUESTION: Q15_B. What is your opinion about the following groups of persons? Is it ... - Civil servants
Total N
% Rather
favourable % Neutral
% Rather
unfavourable % DK/NA
EU27 19635 35.1 38.9 23.5 2.5
COUNTRY
Belgium 1007 39.1 36.5 17.6 6.8
Bulgaria 502 42.8 29.6 24.7 2.9
Czech Rep. 1001 30.6 47.1 21.3 1
Denmark 500 70.9 23.1 5.8 0.2
Germany 1005 22.8 47.8 27.6 1.8
Estonia 520 26.2 47.7 23 3.2
Greece 1006 28 27.1 44 1
Spain 1009 35.5 36 26.3 2.3
France 1005 49.5 32.9 17.2 0.4
Ireland 500 50.6 28.6 19.1 1.7
Italy 1017 47.1 28.2 19.9 4.8
Cyprus 506 35.9 30.7 32.3 1
Latvia 504 13.1 41.4 42.4 3.1
Lithuania 504 32.5 38.3 26.7 2.5
Luxembourg 505 51.9 32.5 14.6 0.9
Hungary 1002 23.1 44.4 27.2 5.3
Malta 507 39.5 39.9 14.9 5.7
Netherlands 1003 37.3 36.5 23.5 2.7
Austria 501 23.2 50.3 24.5 1.9
Poland 1005 18.1 43 36.7 2.2
Portugal 1006 37.2 43.5 15.2 4.1
Romania 504 41 33.5 22.6 2.9
Slovenia 503 40.9 32.6 23.9 2.6
Slovakia 512 18.2 52.4 27.6 1.9
Finland 500 38.2 40 20.8 0.9
Sweden 501 42.1 38.1 9.4 10.5
United Kingdom 1000 34.2 45.2 18.3 2.3
Croatia 500 22.2 42 31.2 4.7
Norway 503 48 39.3 11.3 1.4
Iceland 504 60.2 25.9 10.9 3.1
Switzerland 510 33.4 46.4 16.3 3.9
Turkey 504 67.1 18.4 11.8 2.7
United States 1010 64.7 24.5 10.1 0.7
China 1002 22 54.6 22.7 0.8
Japan 1000 31.3 41.1 26.1 1.6
South Korea 1000 34.5 37.9 25.5 2
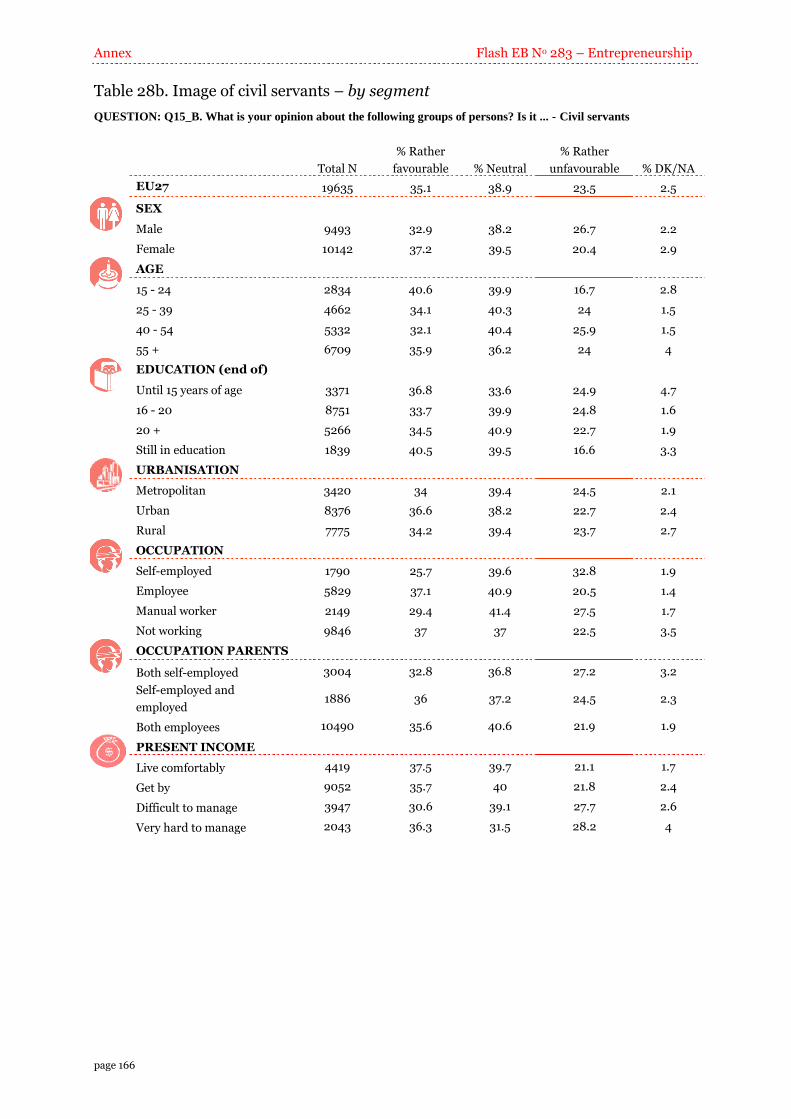
Annex Flash EB No 283 – Entrepreneurship
page 166
Table 28b. Image of civil servants – by segment
QUESTION: Q15_B. What is your opinion about the following groups of persons? Is it ... - Civil servants
Total N
% Rather
favourable % Neutral
% Rather
unfavourable % DK/NA
EU27 19635 35.1 38.9 23.5 2.5
SEX
Male 9493 32.9 38.2 26.7 2.2
Female 10142 37.2 39.5 20.4 2.9
AGE
15 - 24 2834 40.6 39.9 16.7 2.8
25 - 39 4662 34.1 40.3 24 1.5
40 - 54 5332 32.1 40.4 25.9 1.5
55 + 6709 35.9 36.2 24 4
EDUCATION (end of)
Until 15 years of age 3371 36.8 33.6 24.9 4.7
16 - 20 8751 33.7 39.9 24.8 1.6
20 + 5266 34.5 40.9 22.7 1.9
Still in education 1839 40.5 39.5 16.6 3.3
URBANISATION
Metropolitan 3420 34 39.4 24.5 2.1
Urban 8376 36.6 38.2 22.7 2.4
Rural 7775 34.2 39.4 23.7 2.7
OCCUPATION
Self-employed 1790 25.7 39.6 32.8 1.9
Employee 5829 37.1 40.9 20.5 1.4
Manual worker 2149 29.4 41.4 27.5 1.7
Not working 9846 37 37 22.5 3.5
OCCUPATION PARENTS
Both self-employed 3004 32.8 36.8 27.2 3.2
Self-employed and
employed 1886 36 37.2 24.5 2.3
Both employees 10490 35.6 40.6 21.9 1.9
PRESENT INCOME
Live comfortably 4419 37.5 39.7 21.1 1.7
Get by 9052 35.7 40 21.8 2.4
Difficult to manage 3947 30.6 39.1 27.7 2.6
Very hard to manage 2043 36.3 31.5 28.2 4
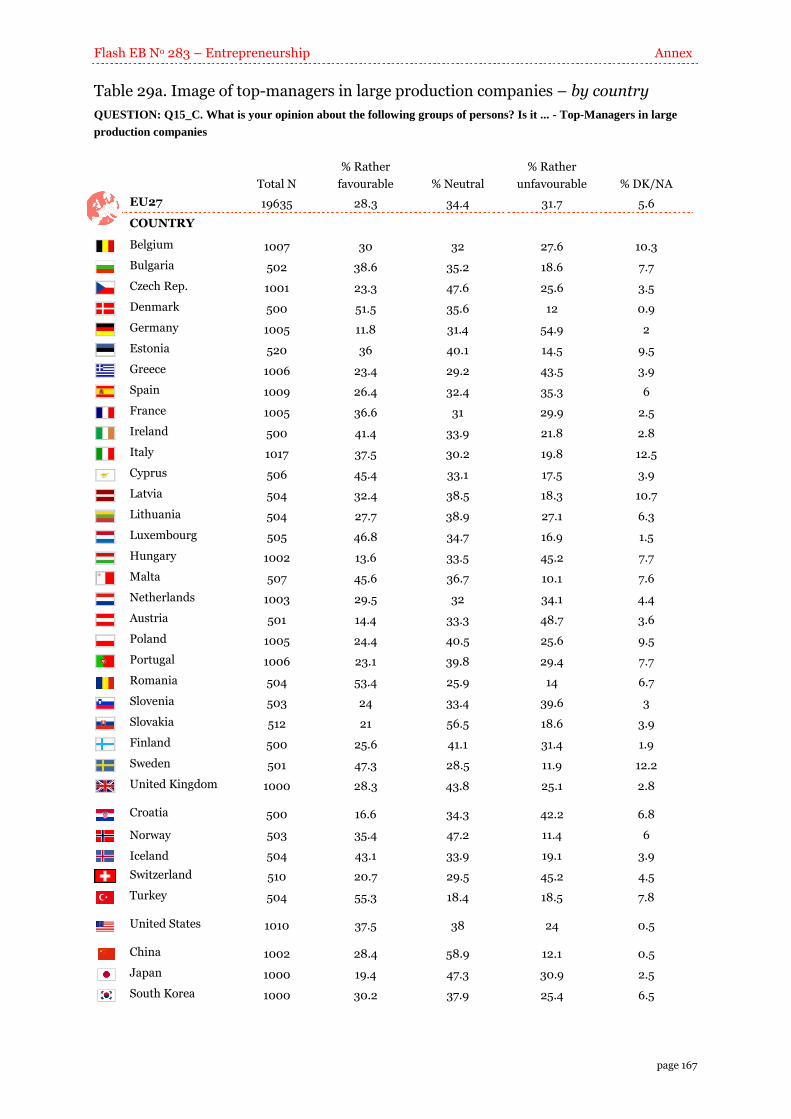
Flash EB No 283 – Entrepreneurship Annex
page 167
Table 29a. Image of top-managers in large production companies – by country
QUESTION: Q15_C. What is your opinion about the following groups of persons? Is it ... - Top-Managers in large
production companies
Total N
% Rather
favourable % Neutral
% Rather
unfavourable % DK/NA
EU27 19635 28.3 34.4 31.7 5.6
COUNTRY
Belgium 1007 30 32 27.6 10.3
Bulgaria 502 38.6 35.2 18.6 7.7
Czech Rep. 1001 23.3 47.6 25.6 3.5
Denmark 500 51.5 35.6 12 0.9
Germany 1005 11.8 31.4 54.9 2
Estonia 520 36 40.1 14.5 9.5
Greece 1006 23.4 29.2 43.5 3.9
Spain 1009 26.4 32.4 35.3 6
France 1005 36.6 31 29.9 2.5
Ireland 500 41.4 33.9 21.8 2.8
Italy 1017 37.5 30.2 19.8 12.5
Cyprus 506 45.4 33.1 17.5 3.9
Latvia 504 32.4 38.5 18.3 10.7
Lithuania 504 27.7 38.9 27.1 6.3
Luxembourg 505 46.8 34.7 16.9 1.5
Hungary 1002 13.6 33.5 45.2 7.7
Malta 507 45.6 36.7 10.1 7.6
Netherlands 1003 29.5 32 34.1 4.4
Austria 501 14.4 33.3 48.7 3.6
Poland 1005 24.4 40.5 25.6 9.5
Portugal 1006 23.1 39.8 29.4 7.7
Romania 504 53.4 25.9 14 6.7
Slovenia 503 24 33.4 39.6 3
Slovakia 512 21 56.5 18.6 3.9
Finland 500 25.6 41.1 31.4 1.9
Sweden 501 47.3 28.5 11.9 12.2
United Kingdom 1000 28.3 43.8 25.1 2.8
Croatia 500 16.6 34.3 42.2 6.8
Norway 503 35.4 47.2 11.4 6
Iceland 504 43.1 33.9 19.1 3.9
Switzerland 510 20.7 29.5 45.2 4.5
Turkey 504 55.3 18.4 18.5 7.8
United States 1010 37.5 38 24 0.5
China 1002 28.4 58.9 12.1 0.5
Japan 1000 19.4 47.3 30.9 2.5
South Korea 1000 30.2 37.9 25.4 6.5
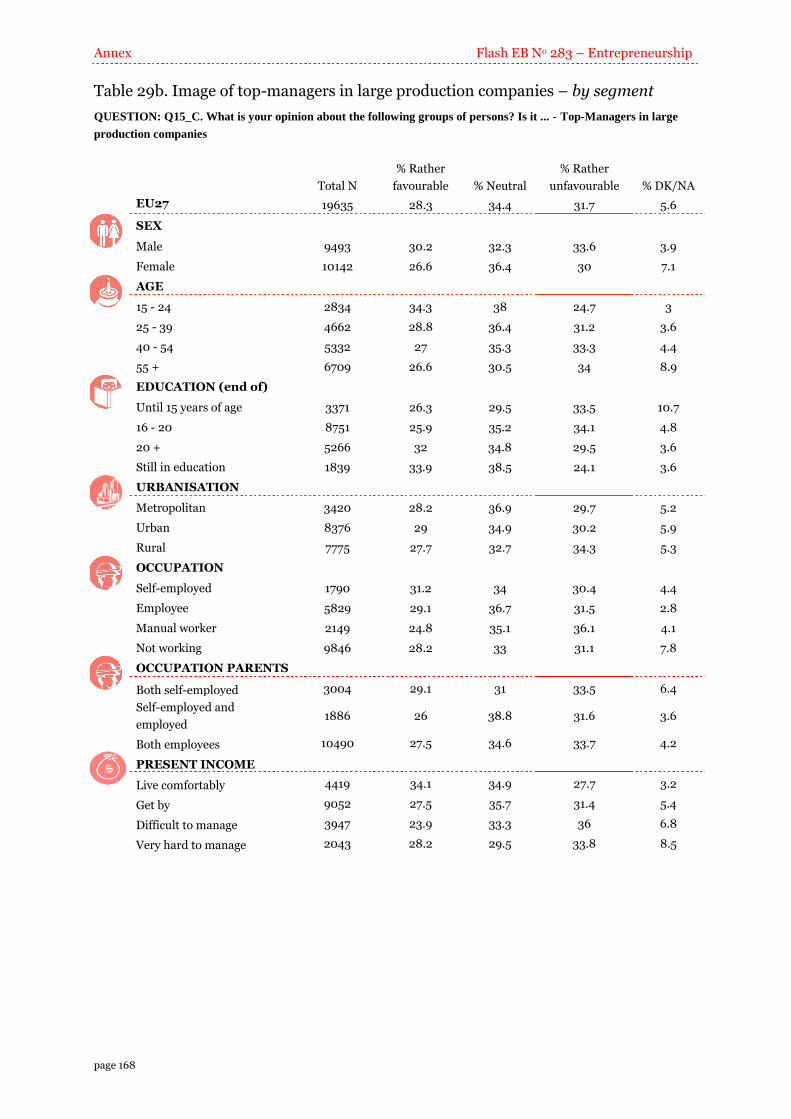
Annex Flash EB No 283 – Entrepreneurship
page 168
Table 29b. Image of top-managers in large production companies – by segment
QUESTION: Q15_C. What is your opinion about the following groups of persons? Is it ... - Top-Managers in large
production companies
Total N
% Rather
favourable % Neutral
% Rather
unfavourable % DK/NA
EU27 19635 28.3 34.4 31.7 5.6
SEX
Male 9493 30.2 32.3 33.6 3.9
Female 10142 26.6 36.4 30 7.1
AGE
15 - 24 2834 34.3 38 24.7 3
25 - 39 4662 28.8 36.4 31.2 3.6
40 - 54 5332 27 35.3 33.3 4.4
55 + 6709 26.6 30.5 34 8.9
EDUCATION (end of)
Until 15 years of age 3371 26.3 29.5 33.5 10.7
16 - 20 8751 25.9 35.2 34.1 4.8
20 + 5266 32 34.8 29.5 3.6
Still in education 1839 33.9 38.5 24.1 3.6
URBANISATION
Metropolitan 3420 28.2 36.9 29.7 5.2
Urban 8376 29 34.9 30.2 5.9
Rural 7775 27.7 32.7 34.3 5.3
OCCUPATION
Self-employed 1790 31.2 34 30.4 4.4
Employee 5829 29.1 36.7 31.5 2.8
Manual worker 2149 24.8 35.1 36.1 4.1
Not working 9846 28.2 33 31.1 7.8
OCCUPATION PARENTS
Both self-employed 3004 29.1 31 33.5 6.4
Self-employed and
employed 1886 26 38.8 31.6 3.6
Both employees 10490 27.5 34.6 33.7 4.2
PRESENT INCOME
Live comfortably 4419 34.1 34.9 27.7 3.2
Get by 9052 27.5 35.7 31.4 5.4
Difficult to manage 3947 23.9 33.3 36 6.8
Very hard to manage 2043 28.2 29.5 33.8 8.5

Flash EB No 283 – Entrepreneurship Annex
page 169
Table 30a. Image of managers in a bank or a similar institution – by country
QUESTION: Q15_D. What is your opinion about the following groups of persons? Is it ... - Managers in a bank or a
similar institutions
Total N
% Rather
favourable % Neutral
% Rather
unfavourable % DK/NA
EU27 19635 24.8 32.5 38.2 4.5
COUNTRY
Belgium 1007 27.3 32.9 31.8 7.9
Bulgaria 502 39.2 35 17.7 8.1
Czech Rep. 1001 24.7 46.2 25.7 3.4
Denmark 500 37.2 36.3 25.8 0.7
Germany 1005 9.9 30.6 57.4 2
Estonia 520 27.3 39 24.6 9.2
Greece 1006 24.6 29.9 41.6 3.9
Spain 1009 24.6 28.1 42.9 4.4
France 1005 26.7 31 41.1 1.1
Ireland 500 20 22.9 55.7 1.5
Italy 1017 35.2 29.7 25 10.1
Cyprus 506 50 29 17.7 3.3
Latvia 504 23 42.5 25.5 8.9
Lithuania 504 21.2 41.2 31.5 6.1
Luxembourg 505 43.2 32.5 23.2 1.1
Hungary 1002 7.8 30.7 54.4 7.1
Malta 507 52.5 34.4 6 7.2
Netherlands 1003 27.1 31.5 37.5 3.9
Austria 501 14.7 33.8 48.6 2.9
Poland 1005 25 41.5 25.3 8.2
Portugal 1006 19.4 34.5 39.2 6.9
Romania 504 53.4 24.6 17.1 4.9
Slovenia 503 18.2 30.1 48 3.7
Slovakia 512 22.7 54.7 18.2 4.4
Finland 500 43.4 40.9 14.6 1.1
Sweden 501 45.7 25.7 16.8 11.8
United Kingdom 1000 19.6 35.6 43.4 1.4
Croatia 500 19.4 32.8 39.9 7.9
Norway 503 36.1 45 13.5 5.4
Iceland 504 17.2 20.5 60 2.4
Switzerland 510 19.1 26.7 51.1 3.1
Turkey 504 53.1 19.8 19.1 8
United States 1010 41 38.4 20 0.6
China 1002 21.4 63.3 14.1 1.2
Japan 1000 18.6 46.7 31.8 2.8
South Korea 1000 30.2 41.8 22.1 5.9
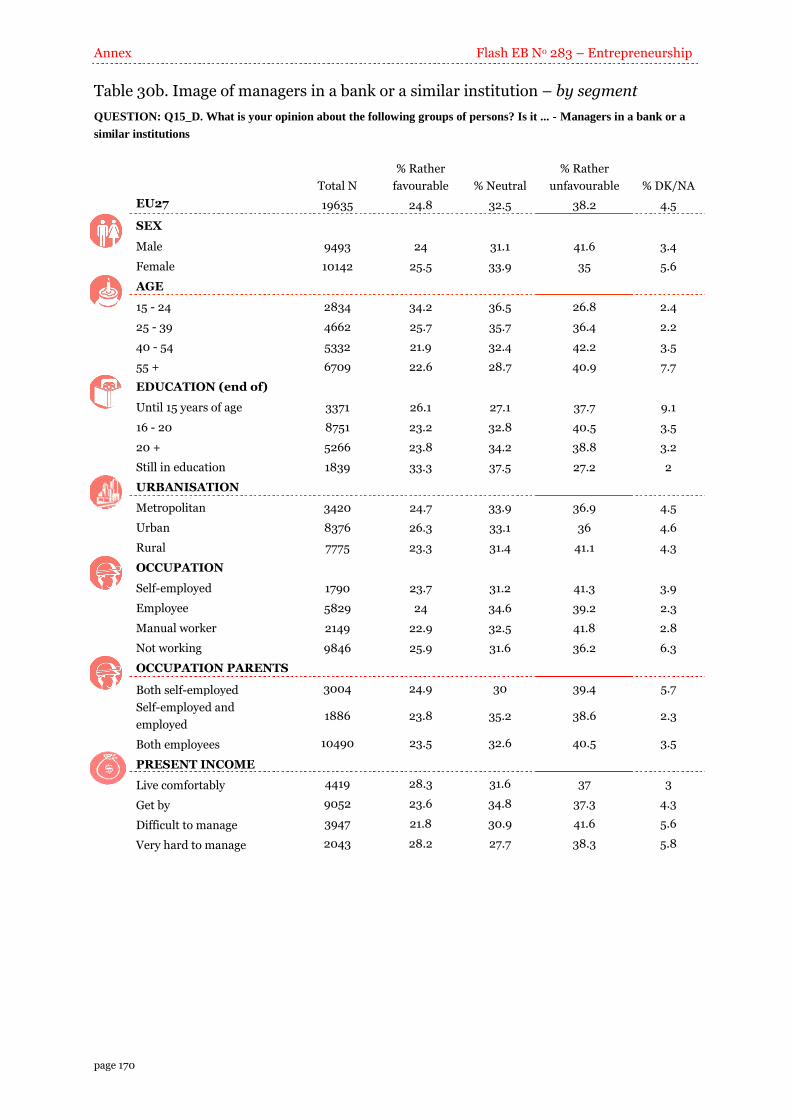
Annex Flash EB No 283 – Entrepreneurship
page 170
Table 30b. Image of managers in a bank or a similar institution – by segment
QUESTION: Q15_D. What is your opinion about the following groups of persons? Is it ... - Managers in a bank or a
similar institutions
Total N
% Rather
favourable % Neutral
% Rather
unfavourable % DK/NA
EU27 19635 24.8 32.5 38.2 4.5
SEX
Male 9493 24 31.1 41.6 3.4
Female 10142 25.5 33.9 35 5.6
AGE
15 - 24 2834 34.2 36.5 26.8 2.4
25 - 39 4662 25.7 35.7 36.4 2.2
40 - 54 5332 21.9 32.4 42.2 3.5
55 + 6709 22.6 28.7 40.9 7.7
EDUCATION (end of)
Until 15 years of age 3371 26.1 27.1 37.7 9.1
16 - 20 8751 23.2 32.8 40.5 3.5
20 + 5266 23.8 34.2 38.8 3.2
Still in education 1839 33.3 37.5 27.2 2
URBANISATION
Metropolitan 3420 24.7 33.9 36.9 4.5
Urban 8376 26.3 33.1 36 4.6
Rural 7775 23.3 31.4 41.1 4.3
OCCUPATION
Self-employed 1790 23.7 31.2 41.3 3.9
Employee 5829 24 34.6 39.2 2.3
Manual worker 2149 22.9 32.5 41.8 2.8
Not working 9846 25.9 31.6 36.2 6.3
OCCUPATION PARENTS
Both self-employed 3004 24.9 30 39.4 5.7
Self-employed and
employed 1886 23.8 35.2 38.6 2.3
Both employees 10490 23.5 32.6 40.5 3.5
PRESENT INCOME
Live comfortably 4419 28.3 31.6 37 3
Get by 9052 23.6 34.8 37.3 4.3
Difficult to manage 3947 21.8 30.9 41.6 5.6
Very hard to manage 2043 28.2 27.7 38.3 5.8
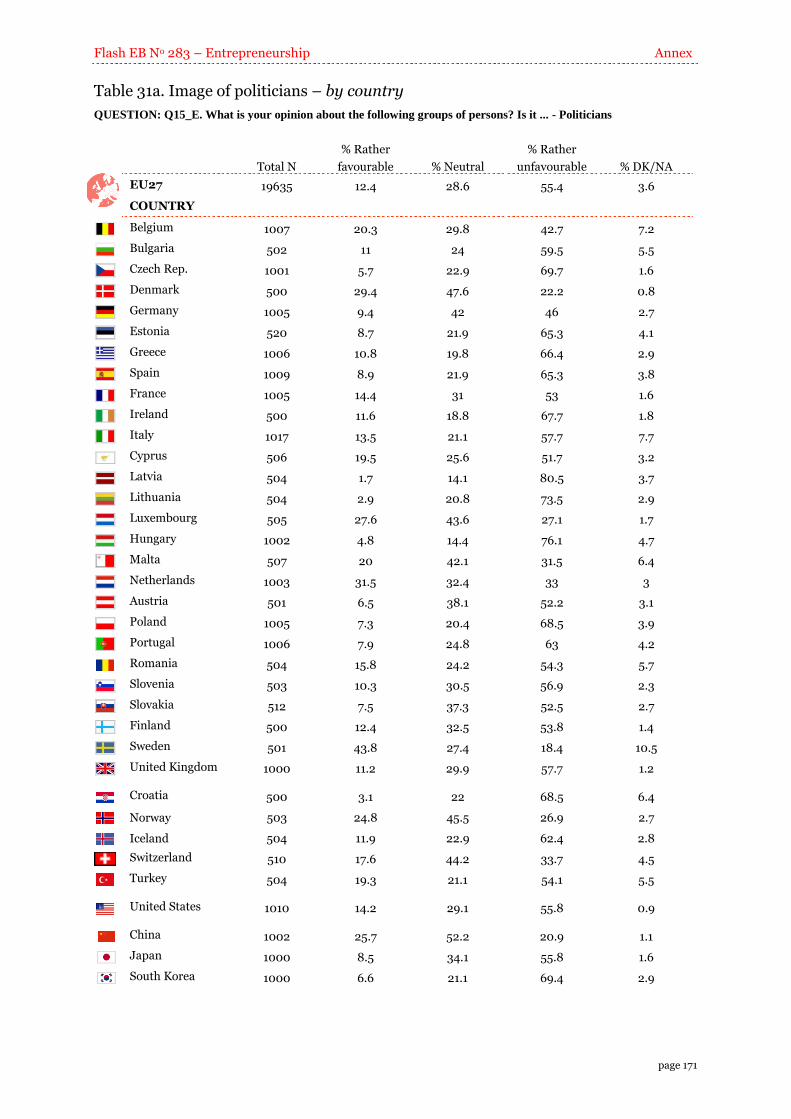
Flash EB No 283 – Entrepreneurship Annex
page 171
Table 31a. Image of politicians – by country
QUESTION: Q15_E. What is your opinion about the following groups of persons? Is it ... - Politicians
Total N
% Rather
favourable % Neutral
% Rather
unfavourable % DK/NA
EU27 19635 12.4 28.6 55.4 3.6
COUNTRY
Belgium 1007 20.3 29.8 42.7 7.2
Bulgaria 502 11 24 59.5 5.5
Czech Rep. 1001 5.7 22.9 69.7 1.6
Denmark 500 29.4 47.6 22.2 0.8
Germany 1005 9.4 42 46 2.7
Estonia 520 8.7 21.9 65.3 4.1
Greece 1006 10.8 19.8 66.4 2.9
Spain 1009 8.9 21.9 65.3 3.8
France 1005 14.4 31 53 1.6
Ireland 500 11.6 18.8 67.7 1.8
Italy 1017 13.5 21.1 57.7 7.7
Cyprus 506 19.5 25.6 51.7 3.2
Latvia 504 1.7 14.1 80.5 3.7
Lithuania 504 2.9 20.8 73.5 2.9
Luxembourg 505 27.6 43.6 27.1 1.7
Hungary 1002 4.8 14.4 76.1 4.7
Malta 507 20 42.1 31.5 6.4
Netherlands 1003 31.5 32.4 33 3
Austria 501 6.5 38.1 52.2 3.1
Poland 1005 7.3 20.4 68.5 3.9
Portugal 1006 7.9 24.8 63 4.2
Romania 504 15.8 24.2 54.3 5.7
Slovenia 503 10.3 30.5 56.9 2.3
Slovakia 512 7.5 37.3 52.5 2.7
Finland 500 12.4 32.5 53.8 1.4
Sweden 501 43.8 27.4 18.4 10.5
United Kingdom 1000 11.2 29.9 57.7 1.2
Croatia 500 3.1 22 68.5 6.4
Norway 503 24.8 45.5 26.9 2.7
Iceland 504 11.9 22.9 62.4 2.8
Switzerland 510 17.6 44.2 33.7 4.5
Turkey 504 19.3 21.1 54.1 5.5
United States 1010 14.2 29.1 55.8 0.9
China 1002 25.7 52.2 20.9 1.1
Japan 1000 8.5 34.1 55.8 1.6
South Korea 1000 6.6 21.1 69.4 2.9
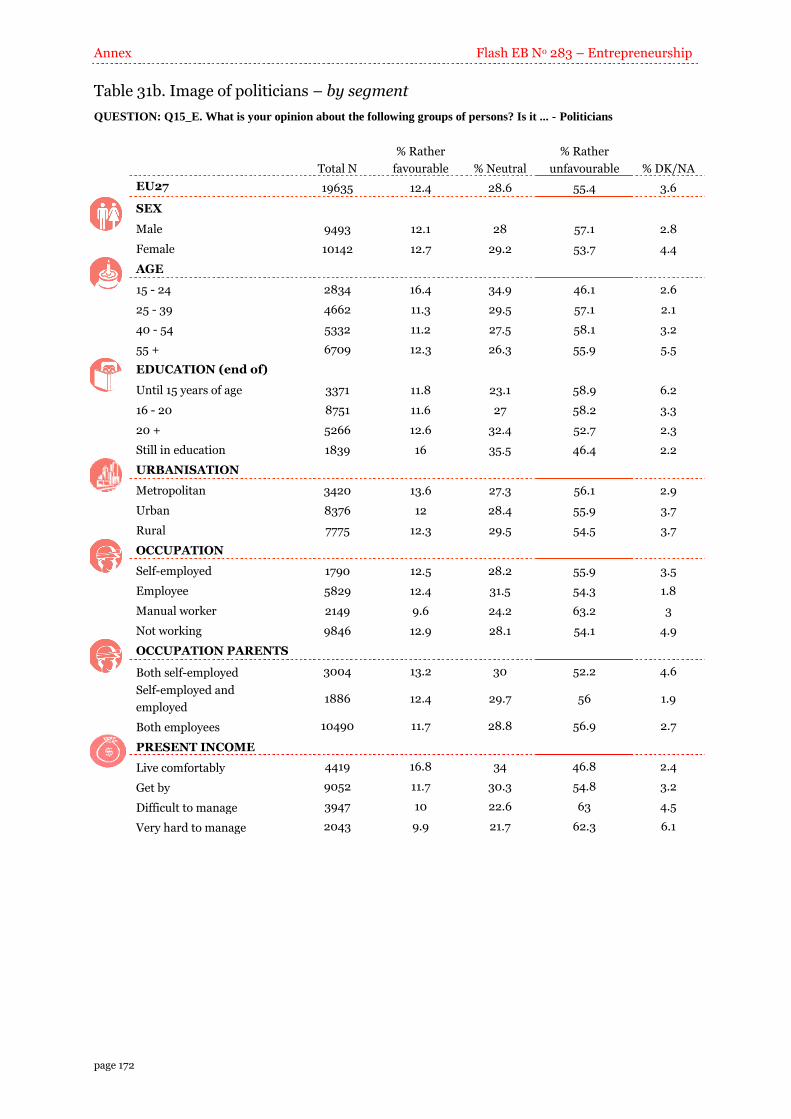
Annex Flash EB No 283 – Entrepreneurship
page 172
Table 31b. Image of politicians – by segment
QUESTION: Q15_E. What is your opinion about the following groups of persons? Is it ... - Politicians
Total N
% Rather
favourable % Neutral
% Rather
unfavourable % DK/NA
EU27 19635 12.4 28.6 55.4 3.6
SEX
Male 9493 12.1 28 57.1 2.8
Female 10142 12.7 29.2 53.7 4.4
AGE
15 - 24 2834 16.4 34.9 46.1 2.6
25 - 39 4662 11.3 29.5 57.1 2.1
40 - 54 5332 11.2 27.5 58.1 3.2
55 + 6709 12.3 26.3 55.9 5.5
EDUCATION (end of)
Until 15 years of age 3371 11.8 23.1 58.9 6.2
16 - 20 8751 11.6 27 58.2 3.3
20 + 5266 12.6 32.4 52.7 2.3
Still in education 1839 16 35.5 46.4 2.2
URBANISATION
Metropolitan 3420 13.6 27.3 56.1 2.9
Urban 8376 12 28.4 55.9 3.7
Rural 7775 12.3 29.5 54.5 3.7
OCCUPATION
Self-employed 1790 12.5 28.2 55.9 3.5
Employee 5829 12.4 31.5 54.3 1.8
Manual worker 2149 9.6 24.2 63.2 3
Not working 9846 12.9 28.1 54.1 4.9
OCCUPATION PARENTS
Both self-employed 3004 13.2 30 52.2 4.6
Self-employed and
employed 1886 12.4 29.7 56 1.9
Both employees 10490 11.7 28.8 56.9 2.7
PRESENT INCOME
Live comfortably 4419 16.8 34 46.8 2.4
Get by 9052 11.7 30.3 54.8 3.2
Difficult to manage 3947 10 22.6 63 4.5
Very hard to manage 2043 9.9 21.7 62.3 6.1
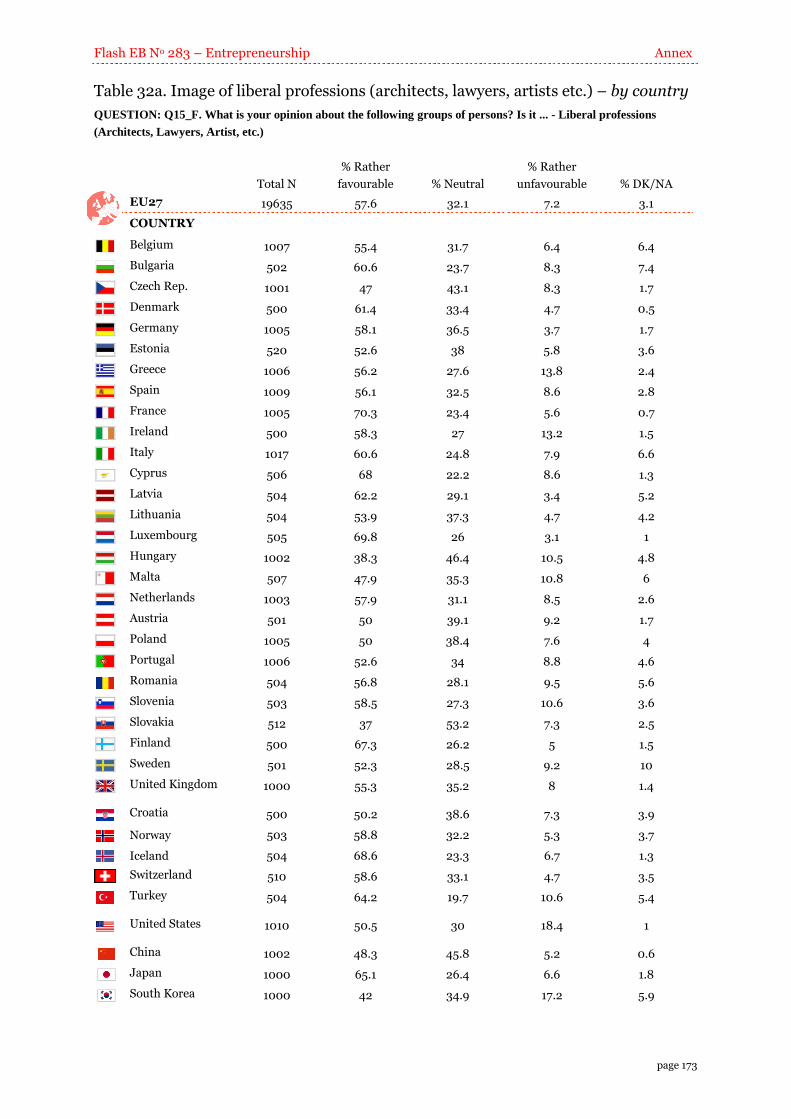
Flash EB No 283 – Entrepreneurship Annex
page 173
Table 32a. Image of liberal professions (architects, lawyers, artists etc.) – by country
QUESTION: Q15_F. What is your opinion about the following groups of persons? Is it ... - Liberal professions
(Architects, Lawyers, Artist, etc.)
Total N
% Rather
favourable % Neutral
% Rather
unfavourable % DK/NA
EU27 19635 57.6 32.1 7.2 3.1
COUNTRY
Belgium 1007 55.4 31.7 6.4 6.4
Bulgaria 502 60.6 23.7 8.3 7.4
Czech Rep. 1001 47 43.1 8.3 1.7
Denmark 500 61.4 33.4 4.7 0.5
Germany 1005 58.1 36.5 3.7 1.7
Estonia 520 52.6 38 5.8 3.6
Greece 1006 56.2 27.6 13.8 2.4
Spain 1009 56.1 32.5 8.6 2.8
France 1005 70.3 23.4 5.6 0.7
Ireland 500 58.3 27 13.2 1.5
Italy 1017 60.6 24.8 7.9 6.6
Cyprus 506 68 22.2 8.6 1.3
Latvia 504 62.2 29.1 3.4 5.2
Lithuania 504 53.9 37.3 4.7 4.2
Luxembourg 505 69.8 26 3.1 1
Hungary 1002 38.3 46.4 10.5 4.8
Malta 507 47.9 35.3 10.8 6
Netherlands 1003 57.9 31.1 8.5 2.6
Austria 501 50 39.1 9.2 1.7
Poland 1005 50 38.4 7.6 4
Portugal 1006 52.6 34 8.8 4.6
Romania 504 56.8 28.1 9.5 5.6
Slovenia 503 58.5 27.3 10.6 3.6
Slovakia 512 37 53.2 7.3 2.5
Finland 500 67.3 26.2 5 1.5
Sweden 501 52.3 28.5 9.2 10
United Kingdom 1000 55.3 35.2 8 1.4
Croatia 500 50.2 38.6 7.3 3.9
Norway 503 58.8 32.2 5.3 3.7
Iceland 504 68.6 23.3 6.7 1.3
Switzerland 510 58.6 33.1 4.7 3.5
Turkey 504 64.2 19.7 10.6 5.4
United States 1010 50.5 30 18.4 1
China 1002 48.3 45.8 5.2 0.6
Japan 1000 65.1 26.4 6.6 1.8
South Korea 1000 42 34.9 17.2 5.9
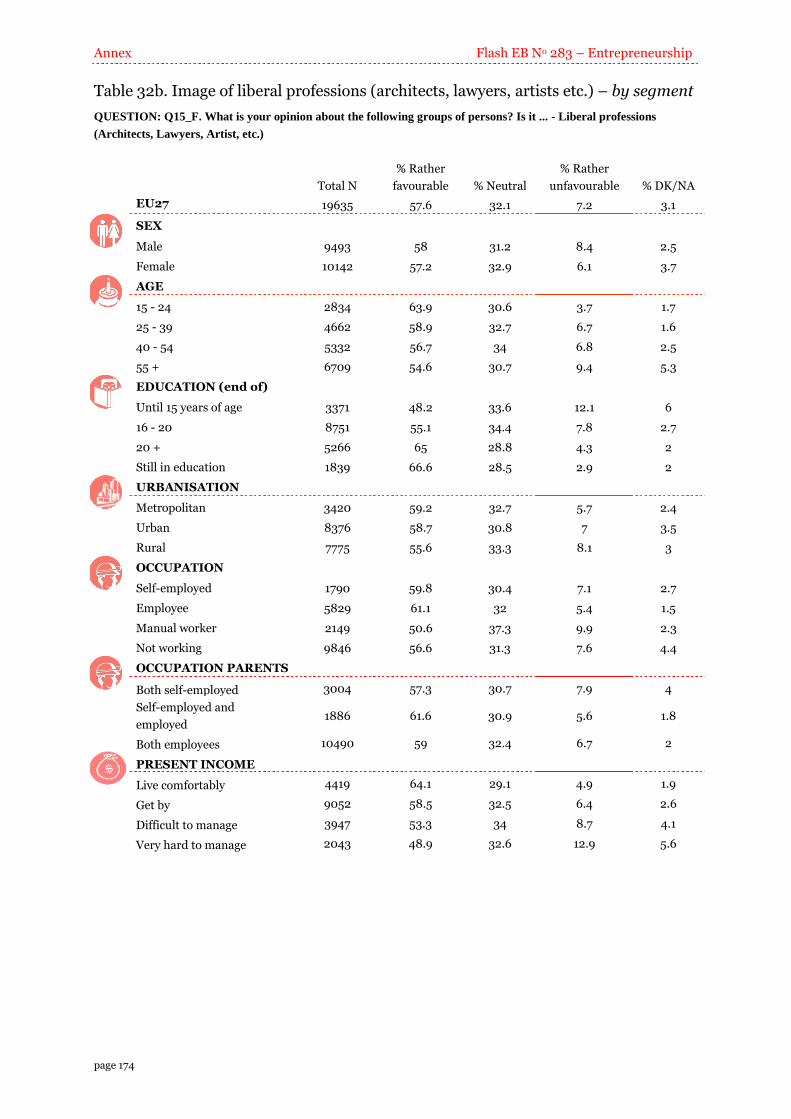
Annex Flash EB No 283 – Entrepreneurship
page 174
Table 32b. Image of liberal professions (architects, lawyers, artists etc.) – by segment
QUESTION: Q15_F. What is your opinion about the following groups of persons? Is it ... - Liberal professions
(Architects, Lawyers, Artist, etc.)
Total N
% Rather
favourable % Neutral
% Rather
unfavourable % DK/NA
EU27 19635 57.6 32.1 7.2 3.1
SEX
Male 9493 58 31.2 8.4 2.5
Female 10142 57.2 32.9 6.1 3.7
AGE
15 - 24 2834 63.9 30.6 3.7 1.7
25 - 39 4662 58.9 32.7 6.7 1.6
40 - 54 5332 56.7 34 6.8 2.5
55 + 6709 54.6 30.7 9.4 5.3
EDUCATION (end of)
Until 15 years of age 3371 48.2 33.6 12.1 6
16 - 20 8751 55.1 34.4 7.8 2.7
20 + 5266 65 28.8 4.3 2
Still in education 1839 66.6 28.5 2.9 2
URBANISATION
Metropolitan 3420 59.2 32.7 5.7 2.4
Urban 8376 58.7 30.8 7 3.5
Rural 7775 55.6 33.3 8.1 3
OCCUPATION
Self-employed 1790 59.8 30.4 7.1 2.7
Employee 5829 61.1 32 5.4 1.5
Manual worker 2149 50.6 37.3 9.9 2.3
Not working 9846 56.6 31.3 7.6 4.4
OCCUPATION PARENTS
Both self-employed 3004 57.3 30.7 7.9 4
Self-employed and
employed 1886 61.6 30.9 5.6 1.8
Both employees 10490 59 32.4 6.7 2
PRESENT INCOME
Live comfortably 4419 64.1 29.1 4.9 1.9
Get by 9052 58.5 32.5 6.4 2.6
Difficult to manage 3947 53.3 34 8.7 4.1
Very hard to manage 2043 48.9 32.6 12.9 5.6
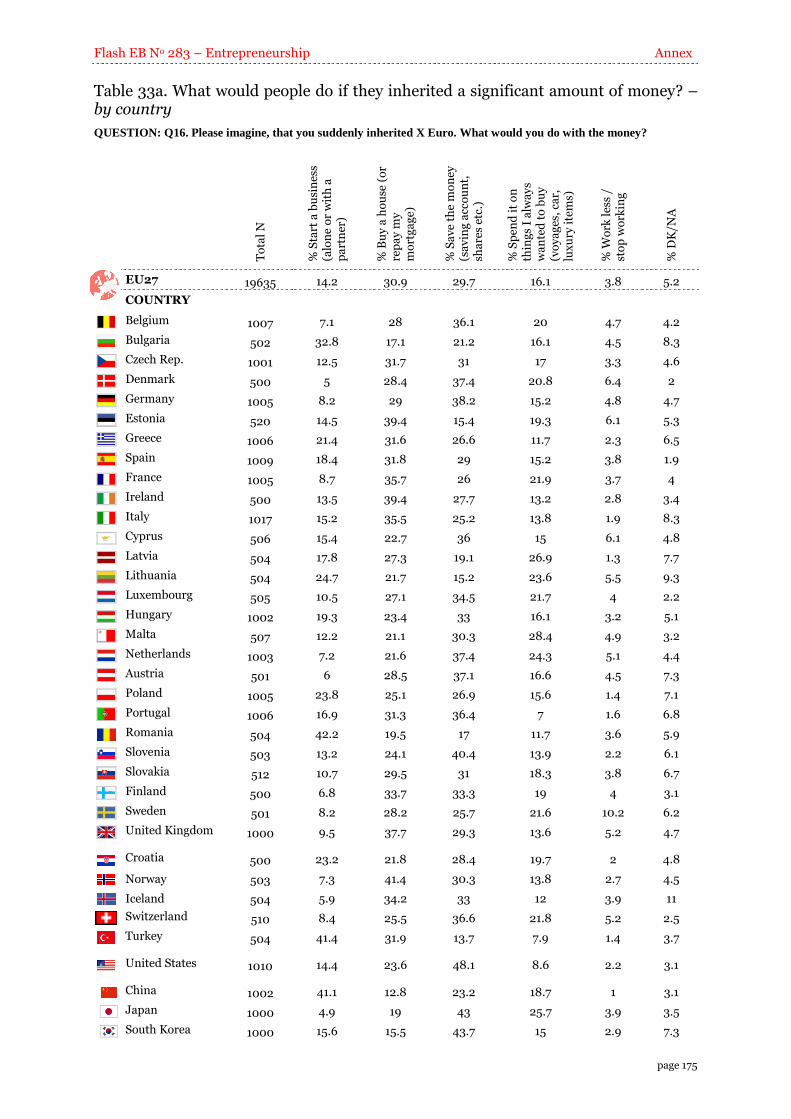
Flash EB No 283 – Entrepreneurship Annex
page 175
Table 33a. What would people do if they inherited a significant amount of money? – by country
QUESTION: Q16. Please imagine, that you suddenly inherited X Euro. What would you do with the money?
To
tal
N
% S
tart
a b
usi
nes
s (a
lon
e o
r w
ith
a
pa
rtn
er)
% B
uy
a h
ou
se (
or
rep
ay
my
m
ort
ga
ge)
% S
av
e th
e m
on
ey
(sa
vin
g a
cco
un
t,
sha
res
etc.
)
% S
pen
d i
t o
n
thin
gs
I a
lwa
ys
wa
nte
d t
o b
uy
(v
oy
ag
es,
car,
lu
xu
ry i
tem
s)
% W
ork
les
s /
sto
p w
ork
ing
% D
K/N
A
EU27 19635 14.2 30.9 29.7 16.1 3.8 5.2
COUNTRY
Belgium 1007 7.1 28 36.1 20 4.7 4.2
Bulgaria 502 32.8 17.1 21.2 16.1 4.5 8.3
Czech Rep. 1001 12.5 31.7 31 17 3.3 4.6
Denmark 500 5 28.4 37.4 20.8 6.4 2
Germany 1005 8.2 29 38.2 15.2 4.8 4.7
Estonia 520 14.5 39.4 15.4 19.3 6.1 5.3
Greece 1006 21.4 31.6 26.6 11.7 2.3 6.5
Spain 1009 18.4 31.8 29 15.2 3.8 1.9
France 1005 8.7 35.7 26 21.9 3.7 4
Ireland 500 13.5 39.4 27.7 13.2 2.8 3.4
Italy 1017 15.2 35.5 25.2 13.8 1.9 8.3
Cyprus 506 15.4 22.7 36 15 6.1 4.8
Latvia 504 17.8 27.3 19.1 26.9 1.3 7.7
Lithuania 504 24.7 21.7 15.2 23.6 5.5 9.3
Luxembourg 505 10.5 27.1 34.5 21.7 4 2.2
Hungary 1002 19.3 23.4 33 16.1 3.2 5.1
Malta 507 12.2 21.1 30.3 28.4 4.9 3.2
Netherlands 1003 7.2 21.6 37.4 24.3 5.1 4.4
Austria 501 6 28.5 37.1 16.6 4.5 7.3
Poland 1005 23.8 25.1 26.9 15.6 1.4 7.1
Portugal 1006 16.9 31.3 36.4 7 1.6 6.8
Romania 504 42.2 19.5 17 11.7 3.6 5.9
Slovenia 503 13.2 24.1 40.4 13.9 2.2 6.1
Slovakia 512 10.7 29.5 31 18.3 3.8 6.7
Finland 500 6.8 33.7 33.3 19 4 3.1
Sweden 501 8.2 28.2 25.7 21.6 10.2 6.2
United Kingdom 1000 9.5 37.7 29.3 13.6 5.2 4.7
Croatia 500 23.2 21.8 28.4 19.7 2 4.8
Norway 503 7.3 41.4 30.3 13.8 2.7 4.5
Iceland 504 5.9 34.2 33 12 3.9 11
Switzerland 510 8.4 25.5 36.6 21.8 5.2 2.5
Turkey 504 41.4 31.9 13.7 7.9 1.4 3.7
United States 1010 14.4 23.6 48.1 8.6 2.2 3.1
China 1002 41.1 12.8 23.2 18.7 1 3.1
Japan 1000 4.9 19 43 25.7 3.9 3.5
South Korea 1000 15.6 15.5 43.7 15 2.9 7.3
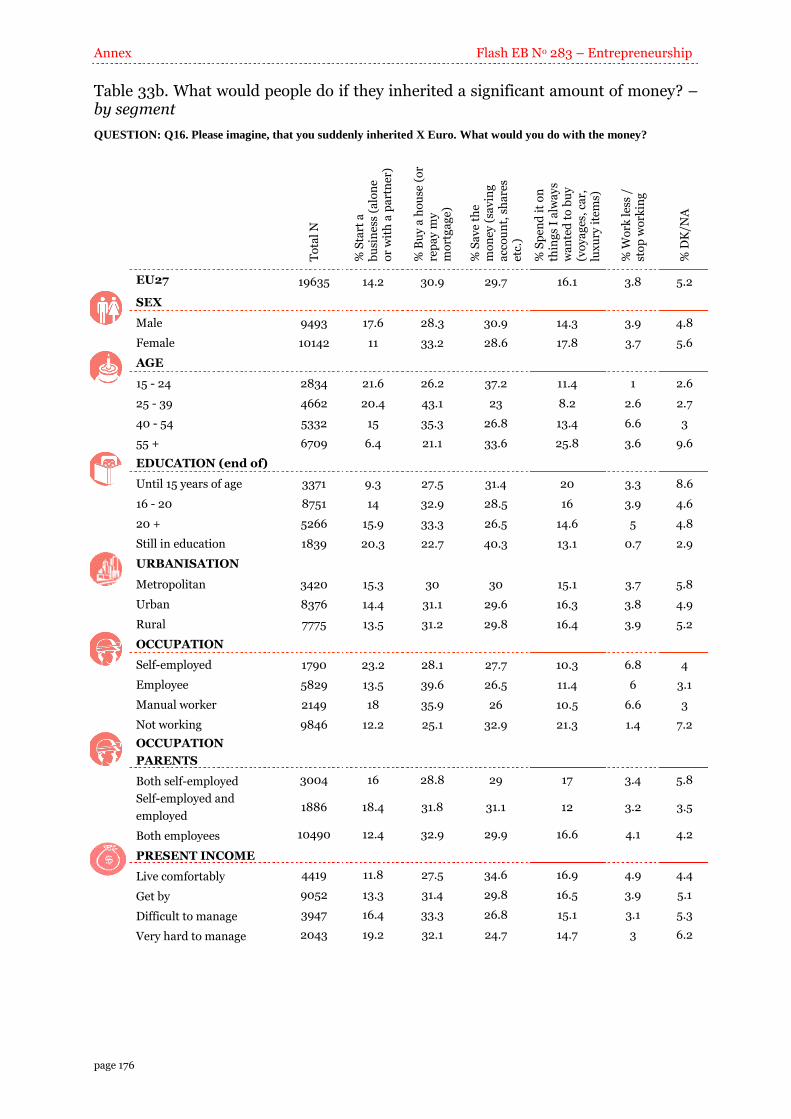
Annex Flash EB No 283 – Entrepreneurship
page 176
Table 33b. What would people do if they inherited a significant amount of money? – by segment
QUESTION: Q16. Please imagine, that you suddenly inherited X Euro. What would you do with the money?
To
tal
N
% S
tart
a
bu
sin
ess
(a
lon
e
or
wit
h a
pa
rtn
er)
% B
uy
a h
ou
se (
or
rep
ay
my
m
ort
ga
ge)
% S
av
e th
e m
on
ey (
sav
ing
a
cco
un
t, s
ha
res
etc.
)
% S
pen
d i
t o
n
thin
gs
I a
lwa
ys
wa
nte
d t
o b
uy
(v
oy
ag
es,
car,
lu
xu
ry i
tem
s)
% W
ork
les
s /
sto
p w
ork
ing
% D
K/N
A
EU27 19635 14.2 30.9 29.7 16.1 3.8 5.2
SEX
Male 9493 17.6 28.3 30.9 14.3 3.9 4.8
Female 10142 11 33.2 28.6 17.8 3.7 5.6
AGE
15 - 24 2834 21.6 26.2 37.2 11.4 1 2.6
25 - 39 4662 20.4 43.1 23 8.2 2.6 2.7
40 - 54 5332 15 35.3 26.8 13.4 6.6 3
55 + 6709 6.4 21.1 33.6 25.8 3.6 9.6
EDUCATION (end of)
Until 15 years of age 3371 9.3 27.5 31.4 20 3.3 8.6
16 - 20 8751 14 32.9 28.5 16 3.9 4.6
20 + 5266 15.9 33.3 26.5 14.6 5 4.8
Still in education 1839 20.3 22.7 40.3 13.1 0.7 2.9
URBANISATION
Metropolitan 3420 15.3 30 30 15.1 3.7 5.8
Urban 8376 14.4 31.1 29.6 16.3 3.8 4.9
Rural 7775 13.5 31.2 29.8 16.4 3.9 5.2
OCCUPATION
Self-employed 1790 23.2 28.1 27.7 10.3 6.8 4
Employee 5829 13.5 39.6 26.5 11.4 6 3.1
Manual worker 2149 18 35.9 26 10.5 6.6 3
Not working 9846 12.2 25.1 32.9 21.3 1.4 7.2
OCCUPATION
PARENTS
Both self-employed 3004 16 28.8 29 17 3.4 5.8
Self-employed and
employed 1886 18.4 31.8 31.1 12 3.2 3.5
Both employees 10490 12.4 32.9 29.9 16.6 4.1 4.2
PRESENT INCOME
Live comfortably 4419 11.8 27.5 34.6 16.9 4.9 4.4
Get by 9052 13.3 31.4 29.8 16.5 3.9 5.1
Difficult to manage 3947 16.4 33.3 26.8 15.1 3.1 5.3
Very hard to manage 2043 19.2 32.1 24.7 14.7 3 6.2
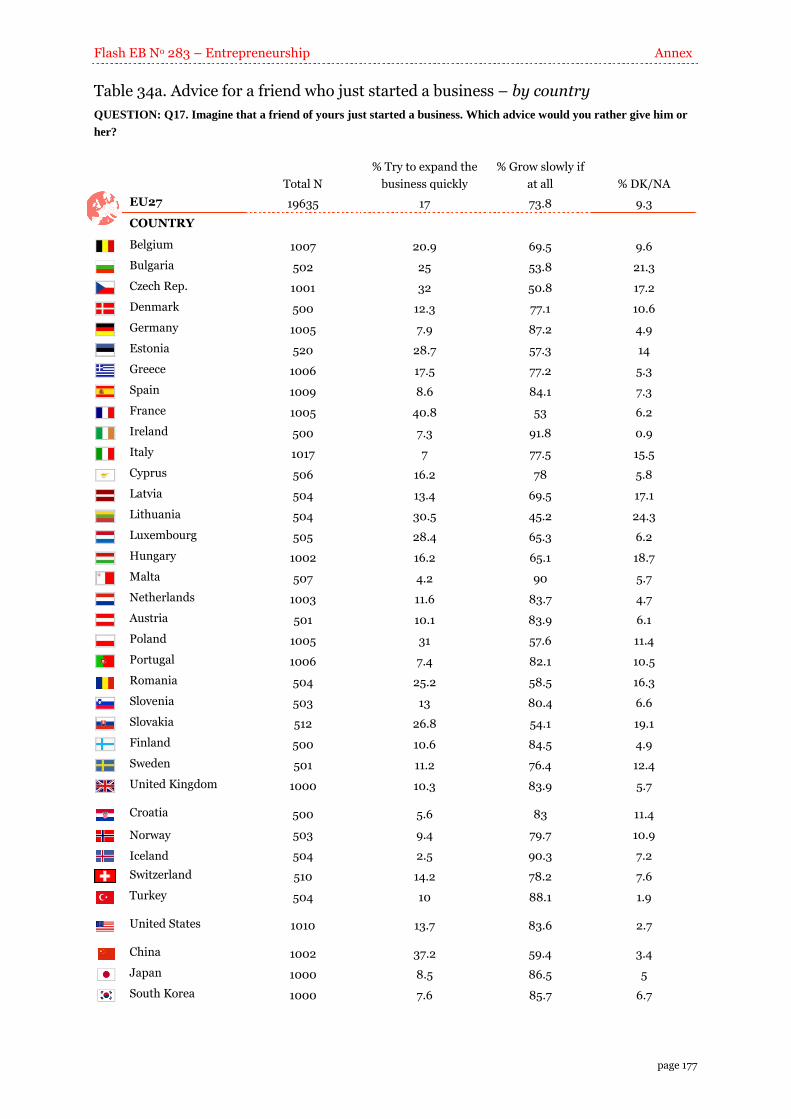
Flash EB No 283 – Entrepreneurship Annex
page 177
Table 34a. Advice for a friend who just started a business – by country
QUESTION: Q17. Imagine that a friend of yours just started a business. Which advice would you rather give him or
her?
Total N
% Try to expand the
business quickly
% Grow slowly if
at all % DK/NA
EU27 19635 17 73.8 9.3
COUNTRY
Belgium 1007 20.9 69.5 9.6
Bulgaria 502 25 53.8 21.3
Czech Rep. 1001 32 50.8 17.2
Denmark 500 12.3 77.1 10.6
Germany 1005 7.9 87.2 4.9
Estonia 520 28.7 57.3 14
Greece 1006 17.5 77.2 5.3
Spain 1009 8.6 84.1 7.3
France 1005 40.8 53 6.2
Ireland 500 7.3 91.8 0.9
Italy 1017 7 77.5 15.5
Cyprus 506 16.2 78 5.8
Latvia 504 13.4 69.5 17.1
Lithuania 504 30.5 45.2 24.3
Luxembourg 505 28.4 65.3 6.2
Hungary 1002 16.2 65.1 18.7
Malta 507 4.2 90 5.7
Netherlands 1003 11.6 83.7 4.7
Austria 501 10.1 83.9 6.1
Poland 1005 31 57.6 11.4
Portugal 1006 7.4 82.1 10.5
Romania 504 25.2 58.5 16.3
Slovenia 503 13 80.4 6.6
Slovakia 512 26.8 54.1 19.1
Finland 500 10.6 84.5 4.9
Sweden 501 11.2 76.4 12.4
United Kingdom 1000 10.3 83.9 5.7
Croatia 500 5.6 83 11.4
Norway 503 9.4 79.7 10.9
Iceland 504 2.5 90.3 7.2
Switzerland 510 14.2 78.2 7.6
Turkey 504 10 88.1 1.9
United States 1010 13.7 83.6 2.7
China 1002 37.2 59.4 3.4
Japan 1000 8.5 86.5 5
South Korea 1000 7.6 85.7 6.7
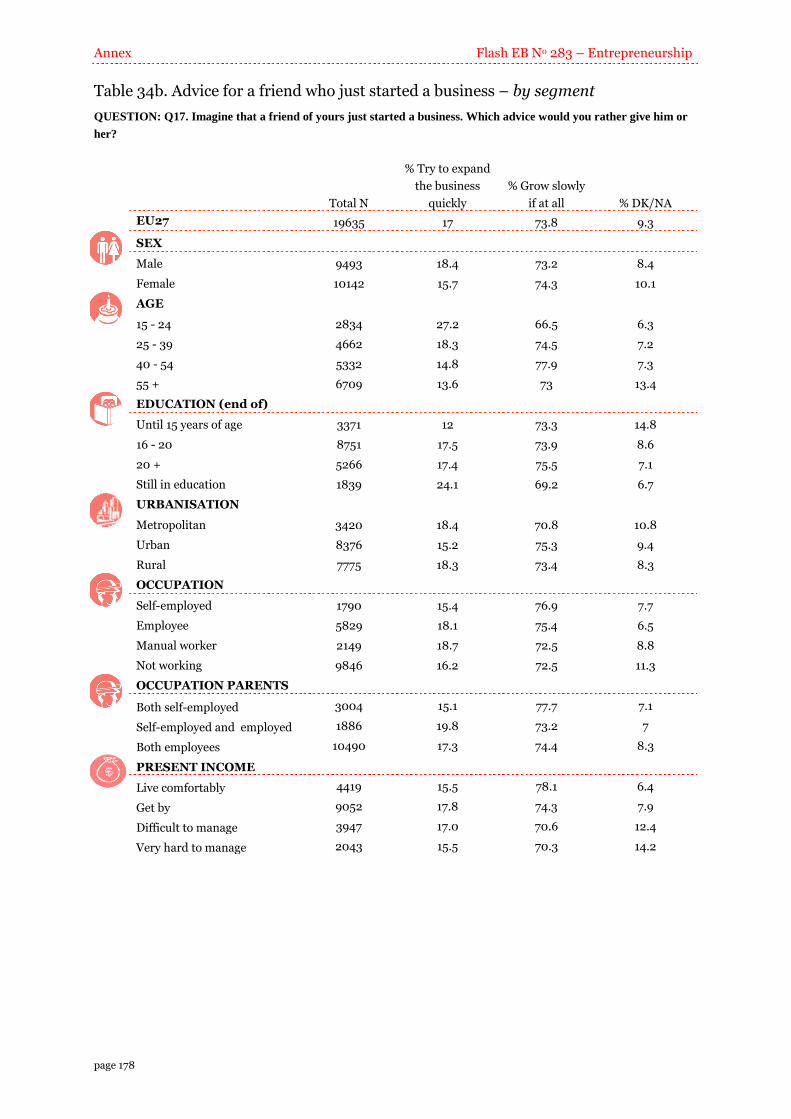
Annex Flash EB No 283 – Entrepreneurship
page 178
Table 34b. Advice for a friend who just started a business – by segment
QUESTION: Q17. Imagine that a friend of yours just started a business. Which advice would you rather give him or
her?
Total N
% Try to expand
the business
quickly
% Grow slowly
if at all % DK/NA
EU27 19635 17 73.8 9.3
SEX
Male 9493 18.4 73.2 8.4
Female 10142 15.7 74.3 10.1
AGE
15 - 24 2834 27.2 66.5 6.3
25 - 39 4662 18.3 74.5 7.2
40 - 54 5332 14.8 77.9 7.3
55 + 6709 13.6 73 13.4
EDUCATION (end of)
Until 15 years of age 3371 12 73.3 14.8
16 - 20 8751 17.5 73.9 8.6
20 + 5266 17.4 75.5 7.1
Still in education 1839 24.1 69.2 6.7
URBANISATION
Metropolitan 3420 18.4 70.8 10.8
Urban 8376 15.2 75.3 9.4
Rural 7775 18.3 73.4 8.3
OCCUPATION
Self-employed 1790 15.4 76.9 7.7
Employee 5829 18.1 75.4 6.5
Manual worker 2149 18.7 72.5 8.8
Not working 9846 16.2 72.5 11.3
OCCUPATION PARENTS
Both self-employed 3004 15.1 77.7 7.1
Self-employed and employed 1886 19.8 73.2 7
Both employees 10490 17.3 74.4 8.3
PRESENT INCOME
Live comfortably 4419 15.5 78.1 6.4
Get by 9052 17.8 74.3 7.9
Difficult to manage 3947 17.0 70.6 12.4
Very hard to manage 2043 15.5 70.3 14.2
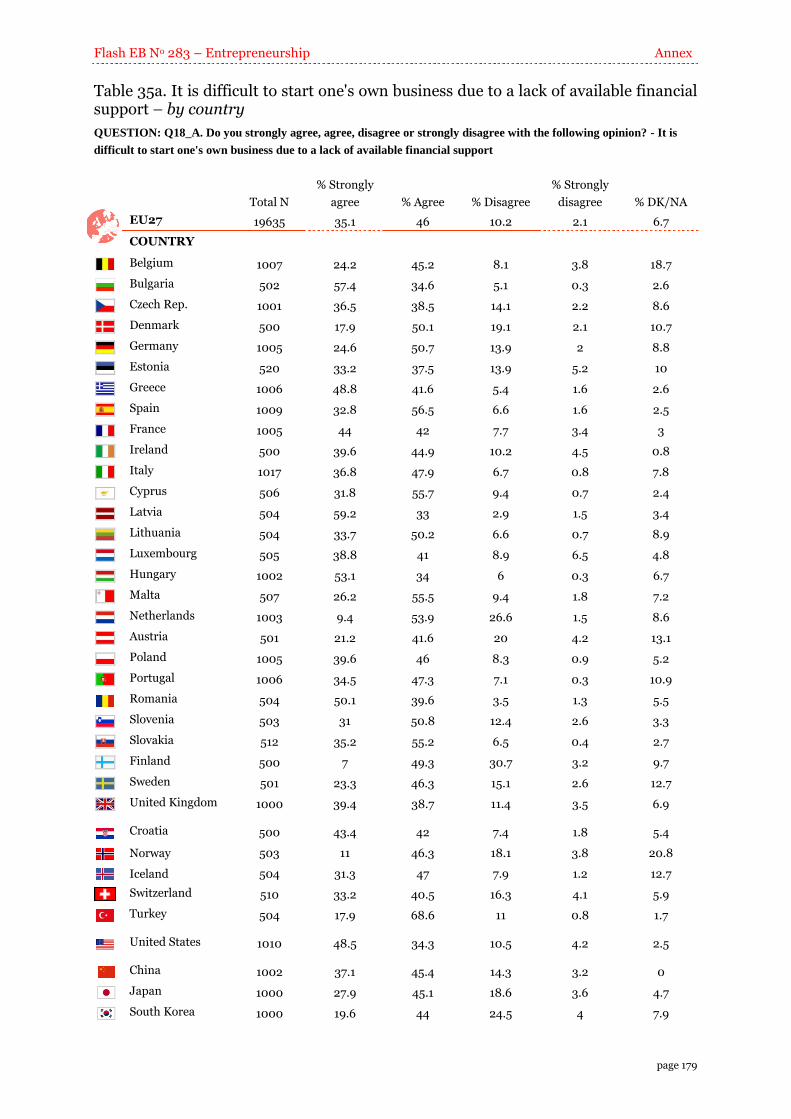
Flash EB No 283 – Entrepreneurship Annex
page 179
Table 35a. It is difficult to start one's own business due to a lack of available financial support – by country
QUESTION: Q18_A. Do you strongly agree, agree, disagree or strongly disagree with the following opinion? - It is
difficult to start one's own business due to a lack of available financial support
Total N
% Strongly
agree % Agree % Disagree
% Strongly
disagree % DK/NA
EU27 19635 35.1 46 10.2 2.1 6.7
COUNTRY
Belgium 1007 24.2 45.2 8.1 3.8 18.7
Bulgaria 502 57.4 34.6 5.1 0.3 2.6
Czech Rep. 1001 36.5 38.5 14.1 2.2 8.6
Denmark 500 17.9 50.1 19.1 2.1 10.7
Germany 1005 24.6 50.7 13.9 2 8.8
Estonia 520 33.2 37.5 13.9 5.2 10
Greece 1006 48.8 41.6 5.4 1.6 2.6
Spain 1009 32.8 56.5 6.6 1.6 2.5
France 1005 44 42 7.7 3.4 3
Ireland 500 39.6 44.9 10.2 4.5 0.8
Italy 1017 36.8 47.9 6.7 0.8 7.8
Cyprus 506 31.8 55.7 9.4 0.7 2.4
Latvia 504 59.2 33 2.9 1.5 3.4
Lithuania 504 33.7 50.2 6.6 0.7 8.9
Luxembourg 505 38.8 41 8.9 6.5 4.8
Hungary 1002 53.1 34 6 0.3 6.7
Malta 507 26.2 55.5 9.4 1.8 7.2
Netherlands 1003 9.4 53.9 26.6 1.5 8.6
Austria 501 21.2 41.6 20 4.2 13.1
Poland 1005 39.6 46 8.3 0.9 5.2
Portugal 1006 34.5 47.3 7.1 0.3 10.9
Romania 504 50.1 39.6 3.5 1.3 5.5
Slovenia 503 31 50.8 12.4 2.6 3.3
Slovakia 512 35.2 55.2 6.5 0.4 2.7
Finland 500 7 49.3 30.7 3.2 9.7
Sweden 501 23.3 46.3 15.1 2.6 12.7
United Kingdom 1000 39.4 38.7 11.4 3.5 6.9
Croatia 500 43.4 42 7.4 1.8 5.4
Norway 503 11 46.3 18.1 3.8 20.8
Iceland 504 31.3 47 7.9 1.2 12.7
Switzerland 510 33.2 40.5 16.3 4.1 5.9
Turkey 504 17.9 68.6 11 0.8 1.7
United States 1010 48.5 34.3 10.5 4.2 2.5
China 1002 37.1 45.4 14.3 3.2 0
Japan 1000 27.9 45.1 18.6 3.6 4.7
South Korea 1000 19.6 44 24.5 4 7.9
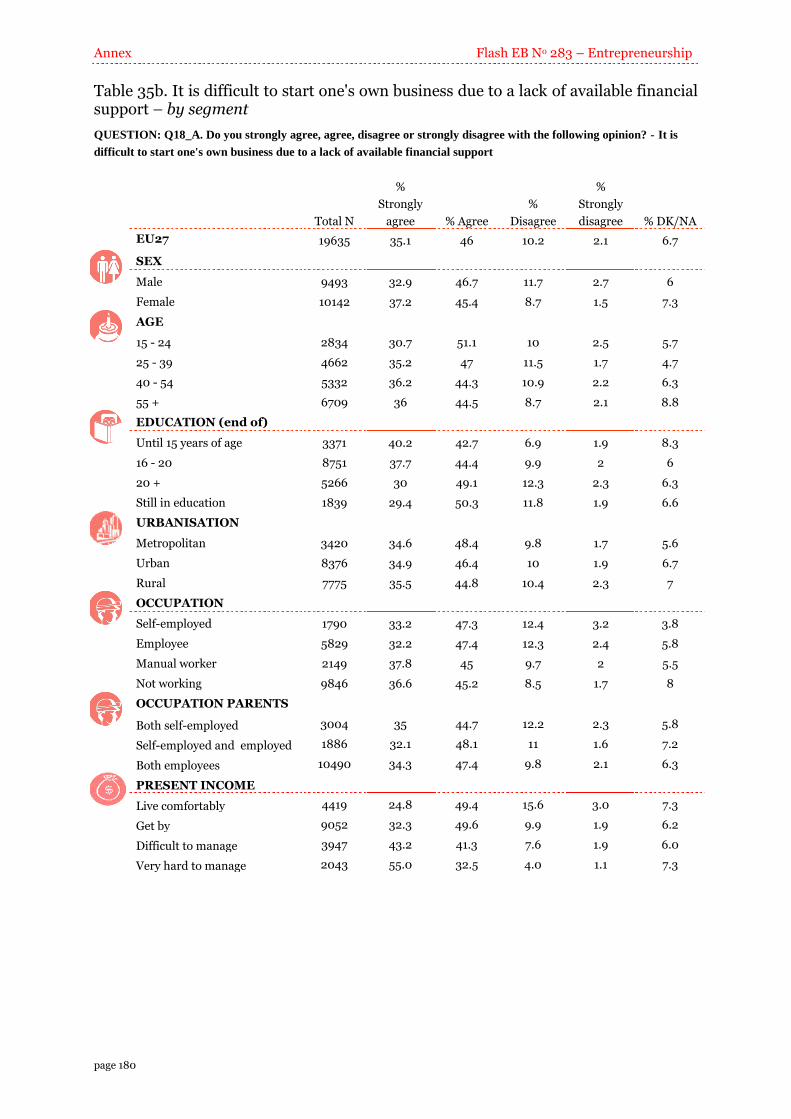
Annex Flash EB No 283 – Entrepreneurship
page 180
Table 35b. It is difficult to start one's own business due to a lack of available financial support – by segment
QUESTION: Q18_A. Do you strongly agree, agree, disagree or strongly disagree with the following opinion? - It is
difficult to start one's own business due to a lack of available financial support
Total N
%
Strongly
agree % Agree
%
Disagree
%
Strongly
disagree % DK/NA
EU27 19635 35.1 46 10.2 2.1 6.7
SEX
Male 9493 32.9 46.7 11.7 2.7 6
Female 10142 37.2 45.4 8.7 1.5 7.3
AGE
15 - 24 2834 30.7 51.1 10 2.5 5.7
25 - 39 4662 35.2 47 11.5 1.7 4.7
40 - 54 5332 36.2 44.3 10.9 2.2 6.3
55 + 6709 36 44.5 8.7 2.1 8.8
EDUCATION (end of)
Until 15 years of age 3371 40.2 42.7 6.9 1.9 8.3
16 - 20 8751 37.7 44.4 9.9 2 6
20 + 5266 30 49.1 12.3 2.3 6.3
Still in education 1839 29.4 50.3 11.8 1.9 6.6
URBANISATION
Metropolitan 3420 34.6 48.4 9.8 1.7 5.6
Urban 8376 34.9 46.4 10 1.9 6.7
Rural 7775 35.5 44.8 10.4 2.3 7
OCCUPATION
Self-employed 1790 33.2 47.3 12.4 3.2 3.8
Employee 5829 32.2 47.4 12.3 2.4 5.8
Manual worker 2149 37.8 45 9.7 2 5.5
Not working 9846 36.6 45.2 8.5 1.7 8
OCCUPATION PARENTS
Both self-employed 3004 35 44.7 12.2 2.3 5.8
Self-employed and employed 1886 32.1 48.1 11 1.6 7.2
Both employees 10490 34.3 47.4 9.8 2.1 6.3
PRESENT INCOME
Live comfortably 4419 24.8 49.4 15.6 3.0 7.3
Get by 9052 32.3 49.6 9.9 1.9 6.2
Difficult to manage 3947 43.2 41.3 7.6 1.9 6.0
Very hard to manage 2043 55.0 32.5 4.0 1.1 7.3
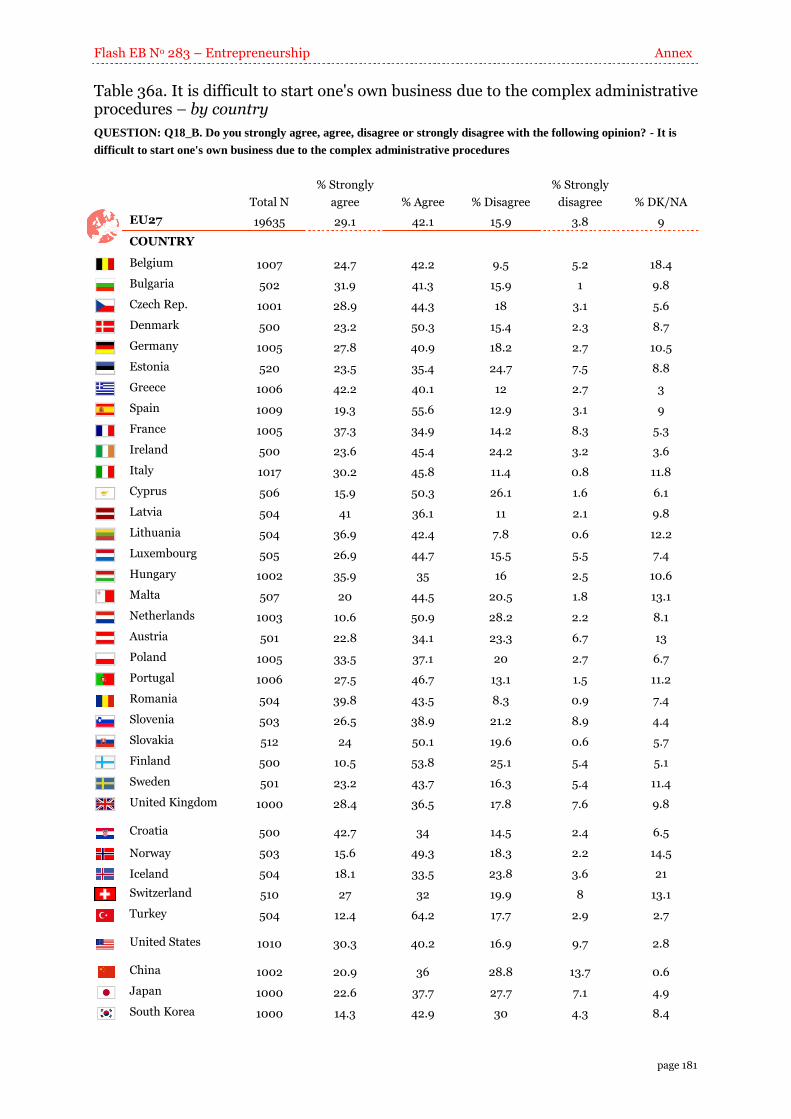
Flash EB No 283 – Entrepreneurship Annex
page 181
Table 36a. It is difficult to start one's own business due to the complex administrative procedures – by country
QUESTION: Q18_B. Do you strongly agree, agree, disagree or strongly disagree with the following opinion? - It is
difficult to start one's own business due to the complex administrative procedures
Total N
% Strongly
agree % Agree % Disagree
% Strongly
disagree % DK/NA
EU27 19635 29.1 42.1 15.9 3.8 9
COUNTRY
Belgium 1007 24.7 42.2 9.5 5.2 18.4
Bulgaria 502 31.9 41.3 15.9 1 9.8
Czech Rep. 1001 28.9 44.3 18 3.1 5.6
Denmark 500 23.2 50.3 15.4 2.3 8.7
Germany 1005 27.8 40.9 18.2 2.7 10.5
Estonia 520 23.5 35.4 24.7 7.5 8.8
Greece 1006 42.2 40.1 12 2.7 3
Spain 1009 19.3 55.6 12.9 3.1 9
France 1005 37.3 34.9 14.2 8.3 5.3
Ireland 500 23.6 45.4 24.2 3.2 3.6
Italy 1017 30.2 45.8 11.4 0.8 11.8
Cyprus 506 15.9 50.3 26.1 1.6 6.1
Latvia 504 41 36.1 11 2.1 9.8
Lithuania 504 36.9 42.4 7.8 0.6 12.2
Luxembourg 505 26.9 44.7 15.5 5.5 7.4
Hungary 1002 35.9 35 16 2.5 10.6
Malta 507 20 44.5 20.5 1.8 13.1
Netherlands 1003 10.6 50.9 28.2 2.2 8.1
Austria 501 22.8 34.1 23.3 6.7 13
Poland 1005 33.5 37.1 20 2.7 6.7
Portugal 1006 27.5 46.7 13.1 1.5 11.2
Romania 504 39.8 43.5 8.3 0.9 7.4
Slovenia 503 26.5 38.9 21.2 8.9 4.4
Slovakia 512 24 50.1 19.6 0.6 5.7
Finland 500 10.5 53.8 25.1 5.4 5.1
Sweden 501 23.2 43.7 16.3 5.4 11.4
United Kingdom 1000 28.4 36.5 17.8 7.6 9.8
Croatia 500 42.7 34 14.5 2.4 6.5
Norway 503 15.6 49.3 18.3 2.2 14.5
Iceland 504 18.1 33.5 23.8 3.6 21
Switzerland 510 27 32 19.9 8 13.1
Turkey 504 12.4 64.2 17.7 2.9 2.7
United States 1010 30.3 40.2 16.9 9.7 2.8
China 1002 20.9 36 28.8 13.7 0.6
Japan 1000 22.6 37.7 27.7 7.1 4.9
South Korea 1000 14.3 42.9 30 4.3 8.4

Annex Flash EB No 283 – Entrepreneurship
page 182
Table 36b. It is difficult to start one's own business due to the complex administrative procedures – by segment
QUESTION: Q18_B. Do you strongly agree, agree, disagree or strongly disagree with the following opinion? - It is
difficult to start one's own business due to the complex administrative procedures
Total N
%
Strongly
agree % Agree
%
Disagree
%
Strongly
disagree % DK/NA
EU27 19635 29.1 42.1 15.9 3.8 9
SEX
Male 9493 28.6 42 17.6 4.6 7.2
Female 10142 29.6 42.2 14.4 3.1 10.7
AGE
15 - 24 2834 22.6 47.8 17 3.5 9.1
25 - 39 4662 27.8 42.4 18.2 4.4 7.2
40 - 54 5332 30.7 40.7 16.9 4.3 7.4
55 + 6709 31.6 40.6 13.1 3.2 11.5
EDUCATION (end of)
Until 15 years of age 3371 31.8 42.3 11.3 2.3 12.3
16 - 20 8751 31.6 40.3 15.7 4.3 8.1
20 + 5266 26.4 43.3 18 4.7 7.6
Still in education 1839 21.8 46.1 19.5 2.4 10.3
URBANISATION
Metropolitan 3420 28.4 40.2 17.6 5.6 8.1
Urban 8376 28.1 43.9 15.5 3.3 9.2
Rural 7775 30.4 41.3 15.6 3.6 9.1
OCCUPATION
Self-employed 1790 29.9 36.9 22.5 7 3.7
Employee 5829 26.4 42.9 18.4 5.1 7.3
Manual worker 2149 30.3 45 14.2 3.4 7.1
Not working 9846 30.3 42 13.6 2.6 11.5
OCCUPATION PARENTS
Both self-employed 3004 30.7 41.7 16.9 3.7 7
Self-employed and employed 1886 27.5 41.1 17.9 4.4 9.1
Both employees 10490 29 42.2 16 4 8.8
PRESENT INCOME
Live comfortably 4419 24 42.7 19.1 5.7 8.5
Get by 9052 27.6 42.8 17.2 3.4 9.1
Difficult to manage 3947 33.1 43.7 12.3 3.6 7.3
Very hard to manage 2043 40 35.1 10.4 2.2 12.2
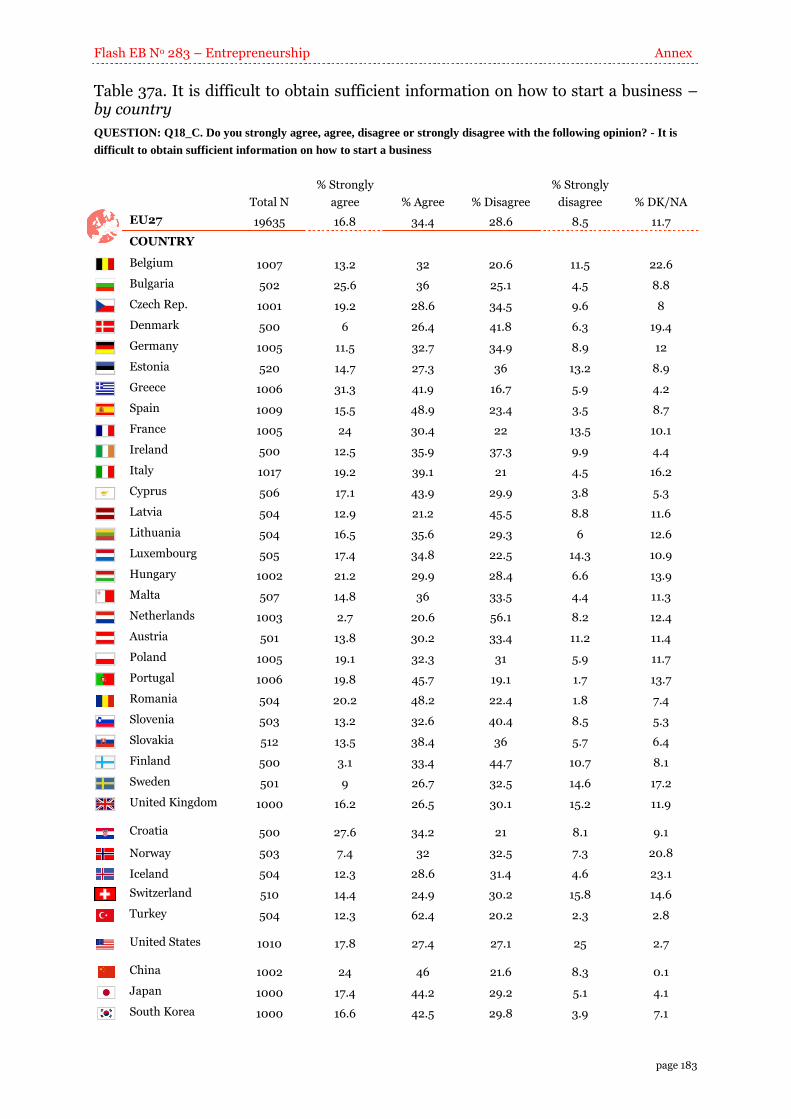
Flash EB No 283 – Entrepreneurship Annex
page 183
Table 37a. It is difficult to obtain sufficient information on how to start a business – by country
QUESTION: Q18_C. Do you strongly agree, agree, disagree or strongly disagree with the following opinion? - It is
difficult to obtain sufficient information on how to start a business
Total N
% Strongly
agree % Agree % Disagree
% Strongly
disagree % DK/NA
EU27 19635 16.8 34.4 28.6 8.5 11.7
COUNTRY
Belgium 1007 13.2 32 20.6 11.5 22.6
Bulgaria 502 25.6 36 25.1 4.5 8.8
Czech Rep. 1001 19.2 28.6 34.5 9.6 8
Denmark 500 6 26.4 41.8 6.3 19.4
Germany 1005 11.5 32.7 34.9 8.9 12
Estonia 520 14.7 27.3 36 13.2 8.9
Greece 1006 31.3 41.9 16.7 5.9 4.2
Spain 1009 15.5 48.9 23.4 3.5 8.7
France 1005 24 30.4 22 13.5 10.1
Ireland 500 12.5 35.9 37.3 9.9 4.4
Italy 1017 19.2 39.1 21 4.5 16.2
Cyprus 506 17.1 43.9 29.9 3.8 5.3
Latvia 504 12.9 21.2 45.5 8.8 11.6
Lithuania 504 16.5 35.6 29.3 6 12.6
Luxembourg 505 17.4 34.8 22.5 14.3 10.9
Hungary 1002 21.2 29.9 28.4 6.6 13.9
Malta 507 14.8 36 33.5 4.4 11.3
Netherlands 1003 2.7 20.6 56.1 8.2 12.4
Austria 501 13.8 30.2 33.4 11.2 11.4
Poland 1005 19.1 32.3 31 5.9 11.7
Portugal 1006 19.8 45.7 19.1 1.7 13.7
Romania 504 20.2 48.2 22.4 1.8 7.4
Slovenia 503 13.2 32.6 40.4 8.5 5.3
Slovakia 512 13.5 38.4 36 5.7 6.4
Finland 500 3.1 33.4 44.7 10.7 8.1
Sweden 501 9 26.7 32.5 14.6 17.2
United Kingdom 1000 16.2 26.5 30.1 15.2 11.9
Croatia 500 27.6 34.2 21 8.1 9.1
Norway 503 7.4 32 32.5 7.3 20.8
Iceland 504 12.3 28.6 31.4 4.6 23.1
Switzerland 510 14.4 24.9 30.2 15.8 14.6
Turkey 504 12.3 62.4 20.2 2.3 2.8
United States 1010 17.8 27.4 27.1 25 2.7
China 1002 24 46 21.6 8.3 0.1
Japan 1000 17.4 44.2 29.2 5.1 4.1
South Korea 1000 16.6 42.5 29.8 3.9 7.1
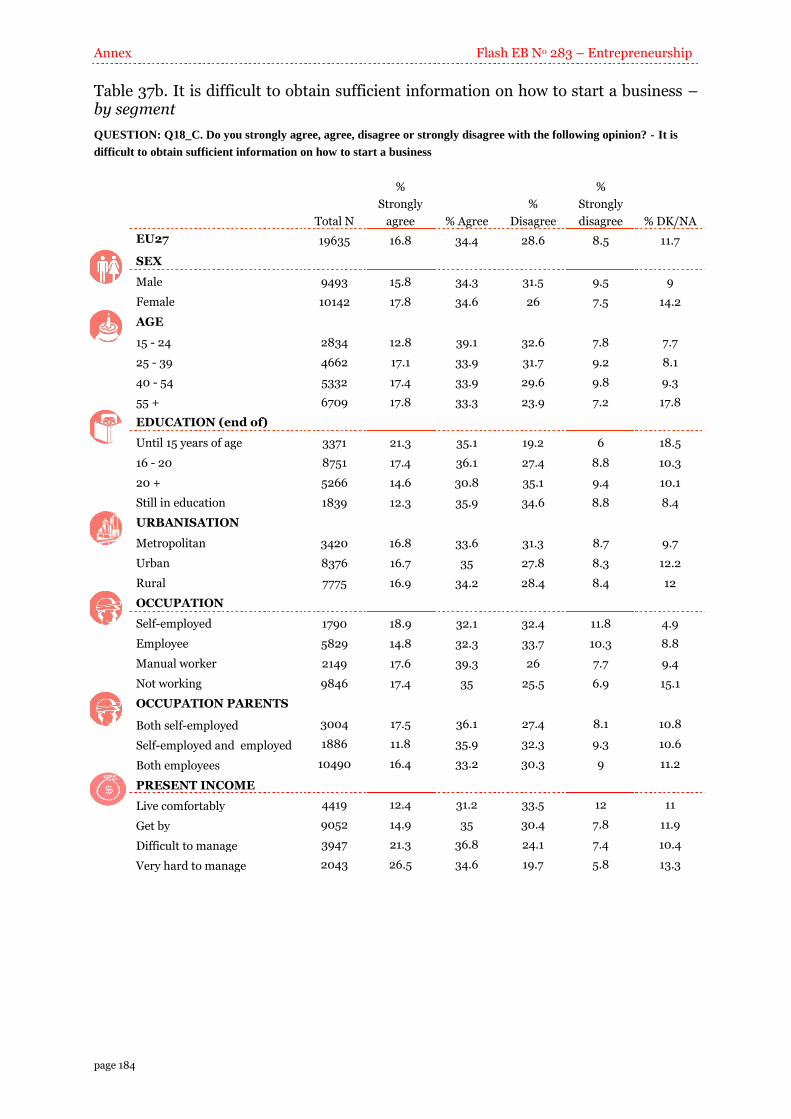
Annex Flash EB No 283 – Entrepreneurship
page 184
Table 37b. It is difficult to obtain sufficient information on how to start a business – by segment
QUESTION: Q18_C. Do you strongly agree, agree, disagree or strongly disagree with the following opinion? - It is
difficult to obtain sufficient information on how to start a business
Total N
%
Strongly
agree % Agree
%
Disagree
%
Strongly
disagree % DK/NA
EU27 19635 16.8 34.4 28.6 8.5 11.7
SEX
Male 9493 15.8 34.3 31.5 9.5 9
Female 10142 17.8 34.6 26 7.5 14.2
AGE
15 - 24 2834 12.8 39.1 32.6 7.8 7.7
25 - 39 4662 17.1 33.9 31.7 9.2 8.1
40 - 54 5332 17.4 33.9 29.6 9.8 9.3
55 + 6709 17.8 33.3 23.9 7.2 17.8
EDUCATION (end of)
Until 15 years of age 3371 21.3 35.1 19.2 6 18.5
16 - 20 8751 17.4 36.1 27.4 8.8 10.3
20 + 5266 14.6 30.8 35.1 9.4 10.1
Still in education 1839 12.3 35.9 34.6 8.8 8.4
URBANISATION
Metropolitan 3420 16.8 33.6 31.3 8.7 9.7
Urban 8376 16.7 35 27.8 8.3 12.2
Rural 7775 16.9 34.2 28.4 8.4 12
OCCUPATION
Self-employed 1790 18.9 32.1 32.4 11.8 4.9
Employee 5829 14.8 32.3 33.7 10.3 8.8
Manual worker 2149 17.6 39.3 26 7.7 9.4
Not working 9846 17.4 35 25.5 6.9 15.1
OCCUPATION PARENTS
Both self-employed 3004 17.5 36.1 27.4 8.1 10.8
Self-employed and employed 1886 11.8 35.9 32.3 9.3 10.6
Both employees 10490 16.4 33.2 30.3 9 11.2
PRESENT INCOME
Live comfortably 4419 12.4 31.2 33.5 12 11
Get by 9052 14.9 35 30.4 7.8 11.9
Difficult to manage 3947 21.3 36.8 24.1 7.4 10.4
Very hard to manage 2043 26.5 34.6 19.7 5.8 13.3
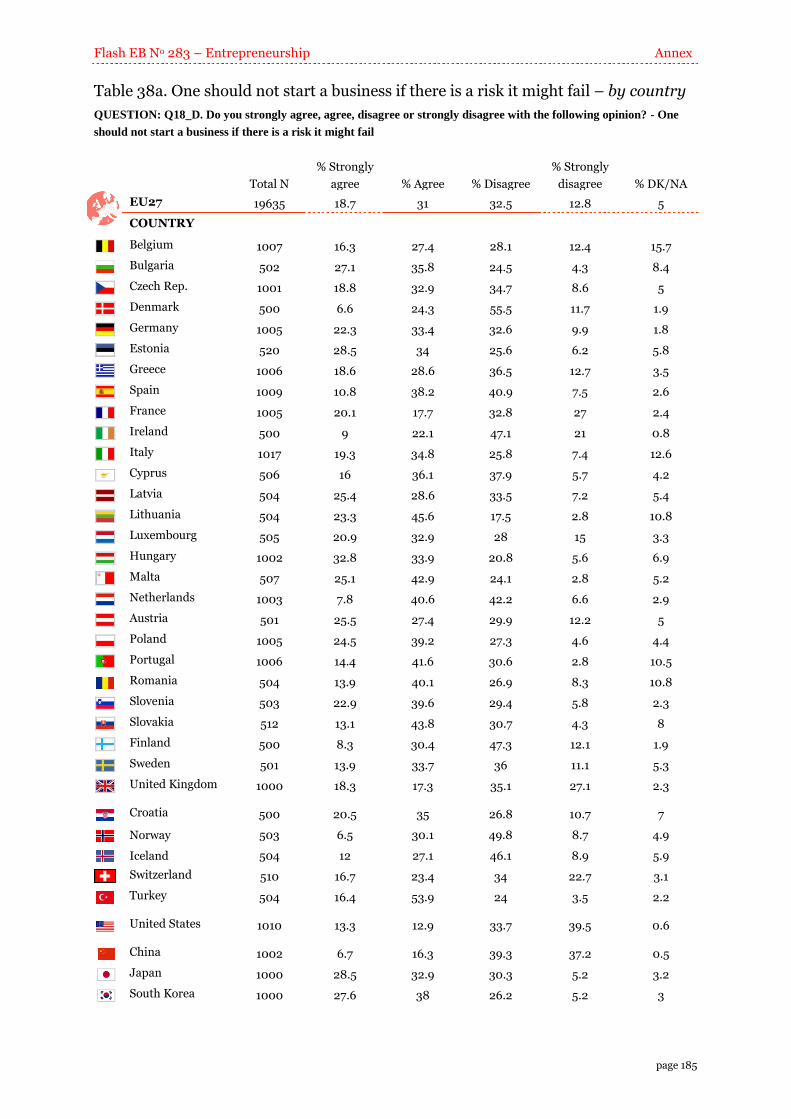
Flash EB No 283 – Entrepreneurship Annex
page 185
Table 38a. One should not start a business if there is a risk it might fail – by country
QUESTION: Q18_D. Do you strongly agree, agree, disagree or strongly disagree with the following opinion? - One
should not start a business if there is a risk it might fail
Total N
% Strongly
agree % Agree % Disagree
% Strongly
disagree % DK/NA
EU27 19635 18.7 31 32.5 12.8 5
COUNTRY
Belgium 1007 16.3 27.4 28.1 12.4 15.7
Bulgaria 502 27.1 35.8 24.5 4.3 8.4
Czech Rep. 1001 18.8 32.9 34.7 8.6 5
Denmark 500 6.6 24.3 55.5 11.7 1.9
Germany 1005 22.3 33.4 32.6 9.9 1.8
Estonia 520 28.5 34 25.6 6.2 5.8
Greece 1006 18.6 28.6 36.5 12.7 3.5
Spain 1009 10.8 38.2 40.9 7.5 2.6
France 1005 20.1 17.7 32.8 27 2.4
Ireland 500 9 22.1 47.1 21 0.8
Italy 1017 19.3 34.8 25.8 7.4 12.6
Cyprus 506 16 36.1 37.9 5.7 4.2
Latvia 504 25.4 28.6 33.5 7.2 5.4
Lithuania 504 23.3 45.6 17.5 2.8 10.8
Luxembourg 505 20.9 32.9 28 15 3.3
Hungary 1002 32.8 33.9 20.8 5.6 6.9
Malta 507 25.1 42.9 24.1 2.8 5.2
Netherlands 1003 7.8 40.6 42.2 6.6 2.9
Austria 501 25.5 27.4 29.9 12.2 5
Poland 1005 24.5 39.2 27.3 4.6 4.4
Portugal 1006 14.4 41.6 30.6 2.8 10.5
Romania 504 13.9 40.1 26.9 8.3 10.8
Slovenia 503 22.9 39.6 29.4 5.8 2.3
Slovakia 512 13.1 43.8 30.7 4.3 8
Finland 500 8.3 30.4 47.3 12.1 1.9
Sweden 501 13.9 33.7 36 11.1 5.3
United Kingdom 1000 18.3 17.3 35.1 27.1 2.3
Croatia 500 20.5 35 26.8 10.7 7
Norway 503 6.5 30.1 49.8 8.7 4.9
Iceland 504 12 27.1 46.1 8.9 5.9
Switzerland 510 16.7 23.4 34 22.7 3.1
Turkey 504 16.4 53.9 24 3.5 2.2
United States 1010 13.3 12.9 33.7 39.5 0.6
China 1002 6.7 16.3 39.3 37.2 0.5
Japan 1000 28.5 32.9 30.3 5.2 3.2
South Korea 1000 27.6 38 26.2 5.2 3
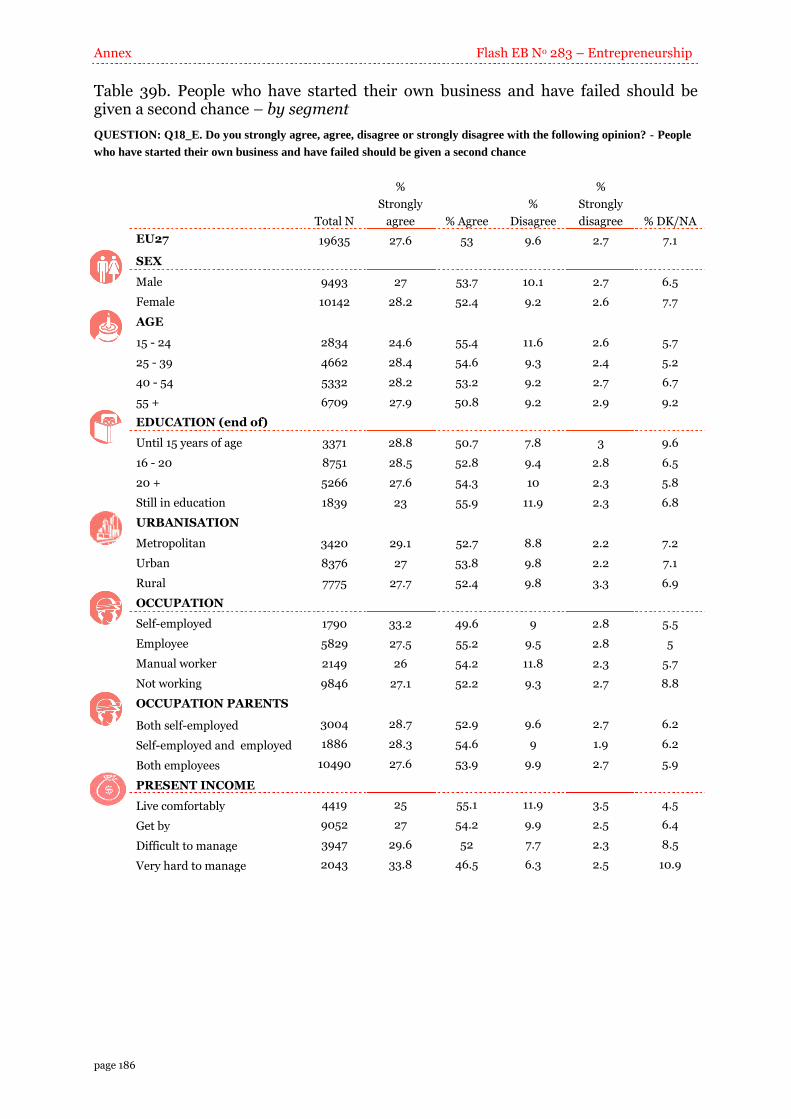
Annex Flash EB No 283 – Entrepreneurship
page 186
Table 39b. People who have started their own business and have failed should be given a second chance – by segment
QUESTION: Q18_E. Do you strongly agree, agree, disagree or strongly disagree with the following opinion? - People
who have started their own business and have failed should be given a second chance
Total N
%
Strongly
agree % Agree
%
Disagree
%
Strongly
disagree % DK/NA
EU27 19635 27.6 53 9.6 2.7 7.1
SEX
Male 9493 27 53.7 10.1 2.7 6.5
Female 10142 28.2 52.4 9.2 2.6 7.7
AGE
15 - 24 2834 24.6 55.4 11.6 2.6 5.7
25 - 39 4662 28.4 54.6 9.3 2.4 5.2
40 - 54 5332 28.2 53.2 9.2 2.7 6.7
55 + 6709 27.9 50.8 9.2 2.9 9.2
EDUCATION (end of)
Until 15 years of age 3371 28.8 50.7 7.8 3 9.6
16 - 20 8751 28.5 52.8 9.4 2.8 6.5
20 + 5266 27.6 54.3 10 2.3 5.8
Still in education 1839 23 55.9 11.9 2.3 6.8
URBANISATION
Metropolitan 3420 29.1 52.7 8.8 2.2 7.2
Urban 8376 27 53.8 9.8 2.2 7.1
Rural 7775 27.7 52.4 9.8 3.3 6.9
OCCUPATION
Self-employed 1790 33.2 49.6 9 2.8 5.5
Employee 5829 27.5 55.2 9.5 2.8 5
Manual worker 2149 26 54.2 11.8 2.3 5.7
Not working 9846 27.1 52.2 9.3 2.7 8.8
OCCUPATION PARENTS
Both self-employed 3004 28.7 52.9 9.6 2.7 6.2
Self-employed and employed 1886 28.3 54.6 9 1.9 6.2
Both employees 10490 27.6 53.9 9.9 2.7 5.9
PRESENT INCOME
Live comfortably 4419 25 55.1 11.9 3.5 4.5
Get by 9052 27 54.2 9.9 2.5 6.4
Difficult to manage 3947 29.6 52 7.7 2.3 8.5
Very hard to manage 2043 33.8 46.5 6.3 2.5 10.9
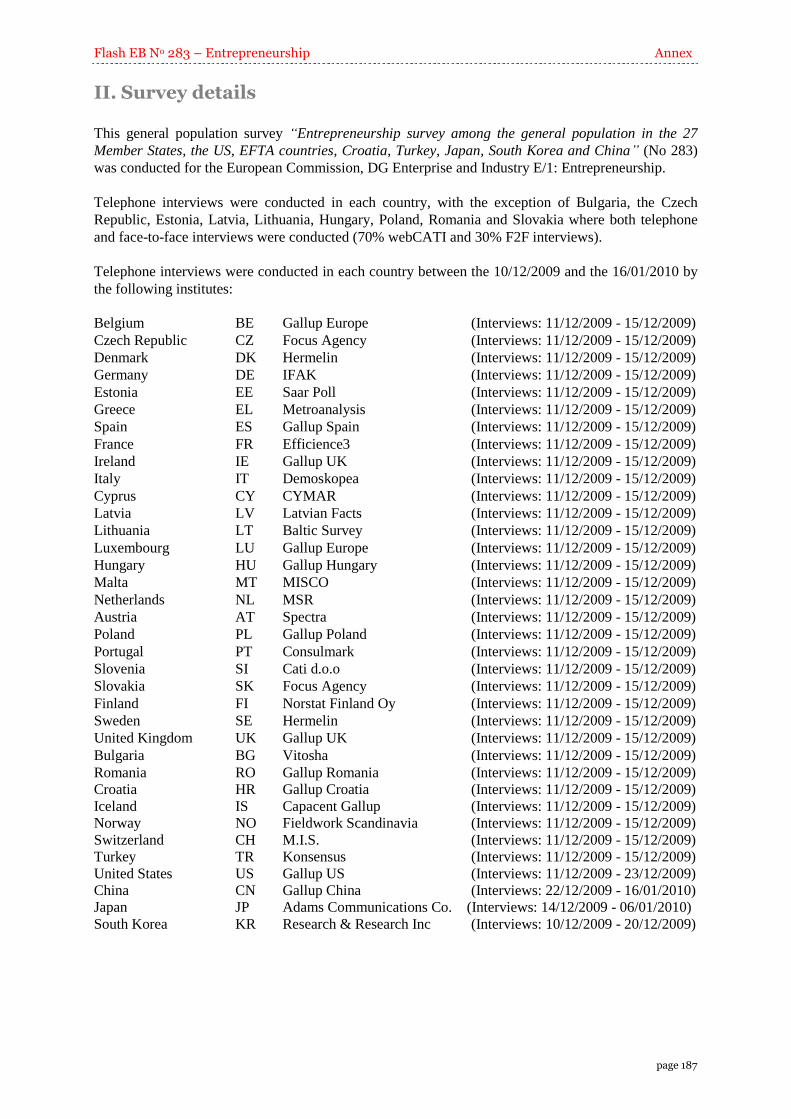
Flash EB No 283 – Entrepreneurship Annex
page 187
II. Survey details
This general population survey “Entrepreneurship survey among the general population in the 27
Member States, the US, EFTA countries, Croatia, Turkey, Japan, South Korea and China” (No 283)
was conducted for the European Commission, DG Enterprise and Industry E/1: Entrepreneurship.
Telephone interviews were conducted in each country, with the exception of Bulgaria, the Czech
Republic, Estonia, Latvia, Lithuania, Hungary, Poland, Romania and Slovakia where both telephone
and face-to-face interviews were conducted (70% webCATI and 30% F2F interviews).
Telephone interviews were conducted in each country between the 10/12/2009 and the 16/01/2010 by
the following institutes:
Belgium BE Gallup Europe (Interviews: 11/12/2009 - 15/12/2009)
Czech Republic CZ Focus Agency (Interviews: 11/12/2009 - 15/12/2009)
Denmark DK Hermelin (Interviews: 11/12/2009 - 15/12/2009)
Germany DE IFAK (Interviews: 11/12/2009 - 15/12/2009)
Estonia EE Saar Poll (Interviews: 11/12/2009 - 15/12/2009)
Greece EL Metroanalysis (Interviews: 11/12/2009 - 15/12/2009)
Spain ES Gallup Spain (Interviews: 11/12/2009 - 15/12/2009)
France FR Efficience3 (Interviews: 11/12/2009 - 15/12/2009)
Ireland IE Gallup UK (Interviews: 11/12/2009 - 15/12/2009)
Italy IT Demoskopea (Interviews: 11/12/2009 - 15/12/2009)
Cyprus CY CYMAR (Interviews: 11/12/2009 - 15/12/2009)
Latvia LV Latvian Facts (Interviews: 11/12/2009 - 15/12/2009)
Lithuania LT Baltic Survey (Interviews: 11/12/2009 - 15/12/2009)
Luxembourg LU Gallup Europe (Interviews: 11/12/2009 - 15/12/2009)
Hungary HU Gallup Hungary (Interviews: 11/12/2009 - 15/12/2009)
Malta MT MISCO (Interviews: 11/12/2009 - 15/12/2009)
Netherlands NL MSR (Interviews: 11/12/2009 - 15/12/2009)
Austria AT Spectra (Interviews: 11/12/2009 - 15/12/2009)
Poland PL Gallup Poland (Interviews: 11/12/2009 - 15/12/2009)
Portugal PT Consulmark (Interviews: 11/12/2009 - 15/12/2009)
Slovenia SI Cati d.o.o (Interviews: 11/12/2009 - 15/12/2009)
Slovakia SK Focus Agency (Interviews: 11/12/2009 - 15/12/2009)
Finland FI Norstat Finland Oy (Interviews: 11/12/2009 - 15/12/2009)
Sweden SE Hermelin (Interviews: 11/12/2009 - 15/12/2009)
United Kingdom UK Gallup UK (Interviews: 11/12/2009 - 15/12/2009)
Bulgaria BG Vitosha (Interviews: 11/12/2009 - 15/12/2009)
Romania RO Gallup Romania (Interviews: 11/12/2009 - 15/12/2009)
Croatia HR Gallup Croatia (Interviews: 11/12/2009 - 15/12/2009)
Iceland IS Capacent Gallup (Interviews: 11/12/2009 - 15/12/2009)
Norway NO Fieldwork Scandinavia (Interviews: 11/12/2009 - 15/12/2009)
Switzerland CH M.I.S. (Interviews: 11/12/2009 - 15/12/2009)
Turkey TR Konsensus (Interviews: 11/12/2009 - 15/12/2009)
United States US Gallup US (Interviews: 11/12/2009 - 23/12/2009)
China CN Gallup China (Interviews: 22/12/2009 - 16/01/2010)
Japan JP Adams Communications Co. (Interviews: 14/12/2009 - 06/01/2010)
South Korea KR Research & Research Inc (Interviews: 10/12/2009 - 20/12/2009)
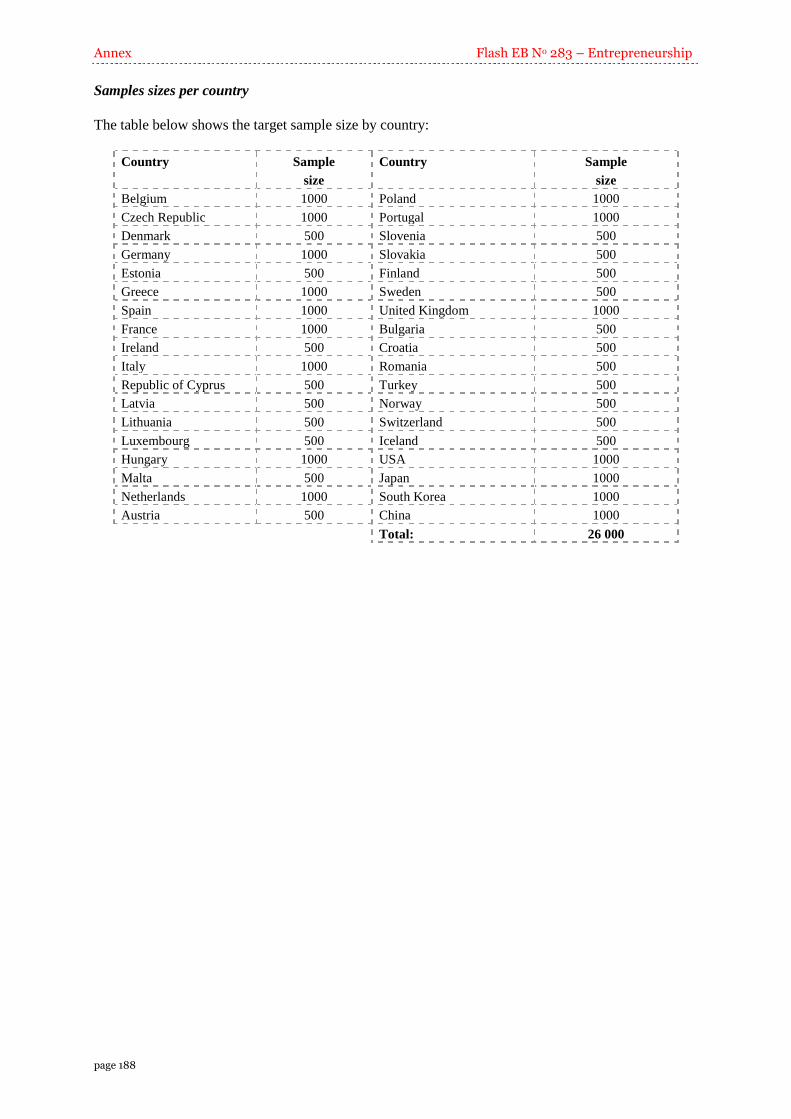
Annex Flash EB No 283 – Entrepreneurship
page 188
Samples sizes per country
The table below shows the target sample size by country:
Country Sample Country Sample
size size
Belgium 1000 Poland 1000
Czech Republic 1000 Portugal 1000
Denmark 500 Slovenia 500
Germany 1000 Slovakia 500
Estonia 500 Finland 500
Greece 1000 Sweden 500
Spain 1000 United Kingdom 1000
France 1000 Bulgaria 500
Ireland 500 Croatia 500
Italy 1000 Romania 500
Republic of Cyprus 500 Turkey 500
Latvia 500 Norway 500
Lithuania 500 Switzerland 500
Luxembourg 500 Iceland 500
Hungary 1000 USA 1000
Malta 500 Japan 1000
Netherlands 1000 South Korea 1000
Austria 500 China 1000
Total: 26 000
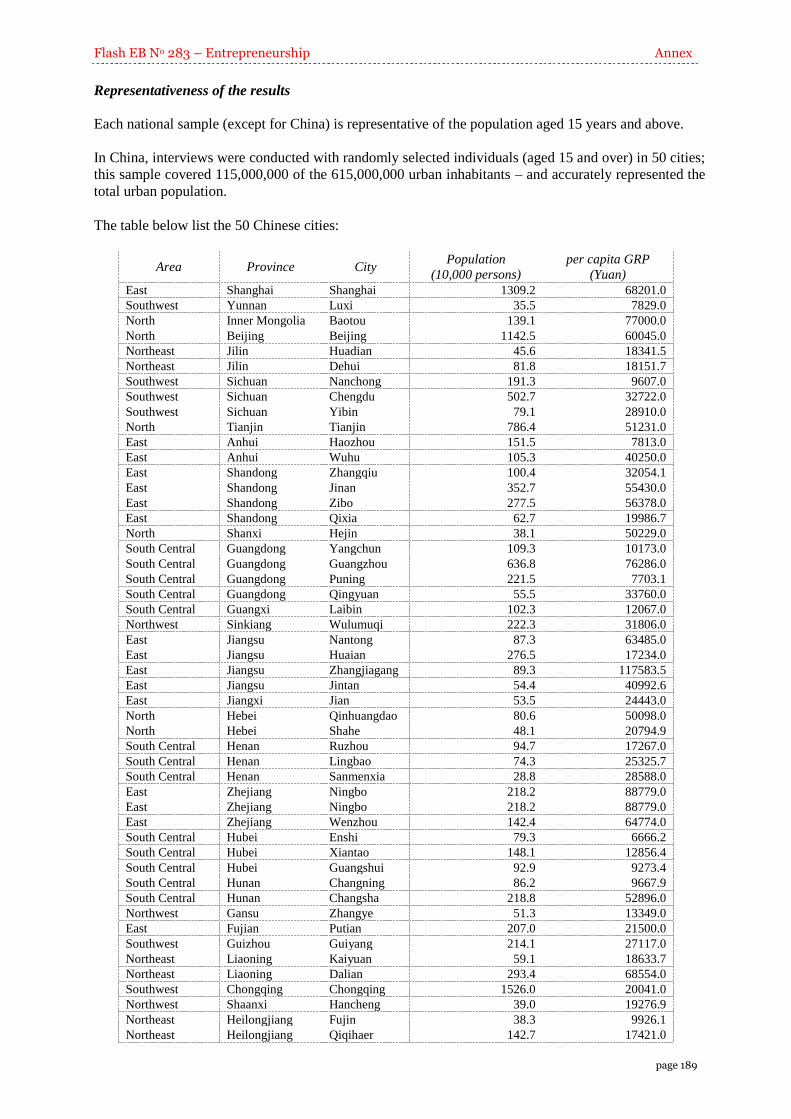
Flash EB No 283 – Entrepreneurship Annex
page 189
Representativeness of the results
Each national sample (except for China) is representative of the population aged 15 years and above.
In China, interviews were conducted with randomly selected individuals (aged 15 and over) in 50 cities;
this sample covered 115,000,000 of the 615,000,000 urban inhabitants – and accurately represented the
total urban population.
The table below list the 50 Chinese cities:
Area Province City Population
(10,000 persons)
per capita GRP
(Yuan)
East Shanghai Shanghai 1309.2 68201.0
Southwest Yunnan Luxi 35.5 7829.0
North Inner Mongolia Baotou 139.1 77000.0
North Beijing Beijing 1142.5 60045.0
Northeast Jilin Huadian 45.6 18341.5
Northeast Jilin Dehui 81.8 18151.7
Southwest Sichuan Nanchong 191.3 9607.0
Southwest Sichuan Chengdu 502.7 32722.0
Southwest Sichuan Yibin 79.1 28910.0
North Tianjin Tianjin 786.4 51231.0
East Anhui Haozhou 151.5 7813.0
East Anhui Wuhu 105.3 40250.0
East Shandong Zhangqiu 100.4 32054.1
East Shandong Jinan 352.7 55430.0
East Shandong Zibo 277.5 56378.0
East Shandong Qixia 62.7 19986.7
North Shanxi Hejin 38.1 50229.0
South Central Guangdong Yangchun 109.3 10173.0
South Central Guangdong Guangzhou 636.8 76286.0
South Central Guangdong Puning 221.5 7703.1
South Central Guangdong Qingyuan 55.5 33760.0
South Central Guangxi Laibin 102.3 12067.0
Northwest Sinkiang Wulumuqi 222.3 31806.0
East Jiangsu Nantong 87.3 63485.0
East Jiangsu Huaian 276.5 17234.0
East Jiangsu Zhangjiagang 89.3 117583.5
East Jiangsu Jintan 54.4 40992.6
East Jiangxi Jian 53.5 24443.0
North Hebei Qinhuangdao 80.6 50098.0
North Hebei Shahe 48.1 20794.9
South Central Henan Ruzhou 94.7 17267.0
South Central Henan Lingbao 74.3 25325.7
South Central Henan Sanmenxia 28.8 28588.0
East Zhejiang Ningbo 218.2 88779.0
East Zhejiang Ningbo 218.2 88779.0
East Zhejiang Wenzhou 142.4 64774.0
South Central Hubei Enshi 79.3 6666.2
South Central Hubei Xiantao 148.1 12856.4
South Central Hubei Guangshui 92.9 9273.4
South Central Hunan Changning 86.2 9667.9
South Central Hunan Changsha 218.8 52896.0
Northwest Gansu Zhangye 51.3 13349.0
East Fujian Putian 207.0 21500.0
Southwest Guizhou Guiyang 214.1 27117.0
Northeast Liaoning Kaiyuan 59.1 18633.7
Northeast Liaoning Dalian 293.4 68554.0
Southwest Chongqing Chongqing 1526.0 20041.0
Northwest Shaanxi Hancheng 39.0 19276.9
Northeast Heilongjiang Fujin 38.3 9926.1
Northeast Heilongjiang Qiqihaer 142.7 17421.0
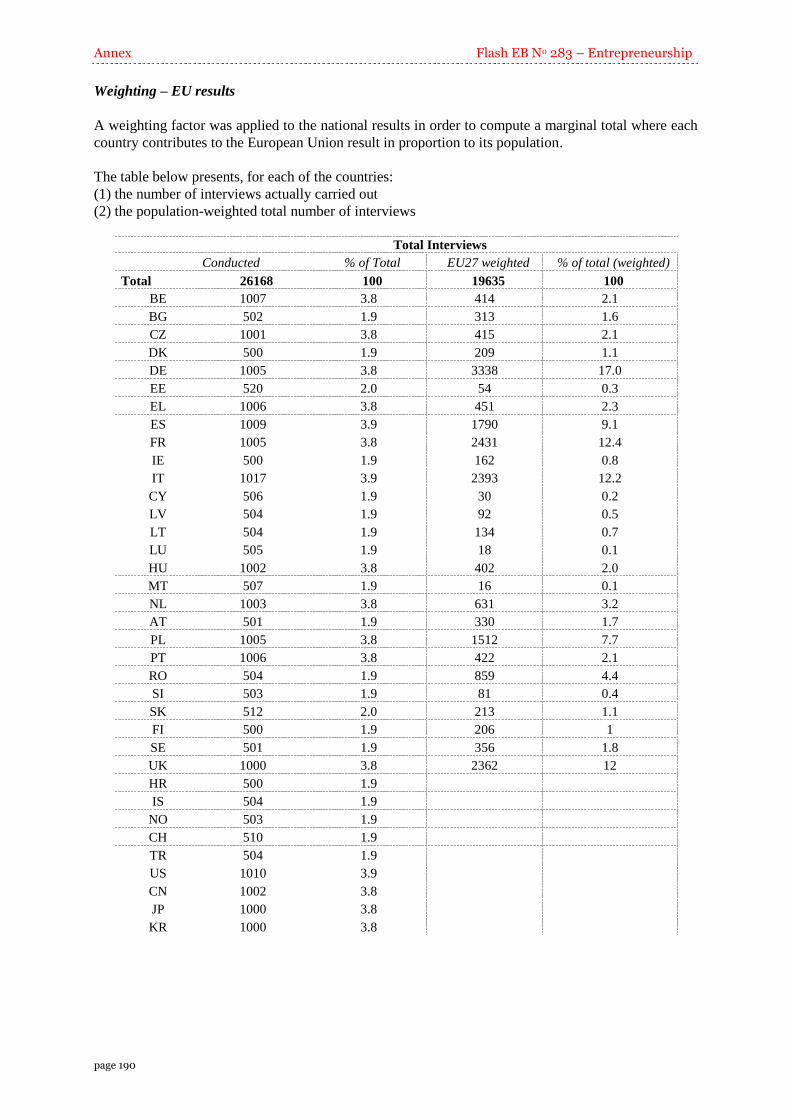
Annex Flash EB No 283 – Entrepreneurship
page 190
Weighting – EU results
A weighting factor was applied to the national results in order to compute a marginal total where each
country contributes to the European Union result in proportion to its population.
The table below presents, for each of the countries:
(1) the number of interviews actually carried out
(2) the population-weighted total number of interviews
Total Interviews
Conducted % of Total EU27 weighted % of total (weighted)
Total 26168 100 19635 100
BE 1007 3.8 414 2.1
BG 502 1.9 313 1.6
CZ 1001 3.8 415 2.1
DK 500 1.9 209 1.1
DE 1005 3.8 3338 17.0
EE 520 2.0 54 0.3
EL 1006 3.8 451 2.3
ES 1009 3.9 1790 9.1
FR 1005 3.8 2431 12.4
IE 500 1.9 162 0.8
IT 1017 3.9 2393 12.2
CY 506 1.9 30 0.2
LV 504 1.9 92 0.5
LT 504 1.9 134 0.7
LU 505 1.9 18 0.1
HU 1002 3.8 402 2.0
MT 507 1.9 16 0.1
NL 1003 3.8 631 3.2
AT 501 1.9 330 1.7
PL 1005 3.8 1512 7.7
PT 1006 3.8 422 2.1
RO 504 1.9 859 4.4
SI 503 1.9 81 0.4
SK 512 2.0 213 1.1
FI 500 1.9 206 1
SE 501 1.9 356 1.8
UK 1000 3.8 2362 12
HR 500 1.9
IS 504 1.9
NO 503 1.9
CH 510 1.9
TR 504 1.9
US 1010 3.9
CN 1002 3.8
JP 1000 3.8
KR 1000 3.8

Flash EB No 283 – Entrepreneurship Annex
page 191
Questionnaires
1. The questionnaire prepared for this survey is reproduced at the end of this results volume, in
English.
2. The institutes listed above translated the questionnaire in their respective national language(s).
3. One copy of each national questionnaire is annexed to the results (volume tables).
Tables of results
VOLUME A: COUNTRY BY COUNTRY
The VOLUME A tables present the European Union, USA, EFTA countries, Croatia, Turkey, Japan,
South Korea and China results country by country.
VOLUME B: RESPONDENTS’ DEMOGRAPHICS
The VOLUME B tables present the European Union results with the following socio-demographic
characteristics of respondents as breakdowns:
Volume B:
Sex (Male, Female)
Age (15-24, 25-39, 40-54, 55 +)
Subjective urbanisation (Metropolitan zone, Other town/urban centre, Rural zone)
Occupation (Self-employed, Employee, Manual worker, Not working)
Education (-15, 16-20, 21+, Still in full time education)
Occupation parents (Both self-employed, Self-employed and employed, Both employees)
Income (Live comfortably on present income, Get by on present income, Find it difficult to manage on
present income, Find it very hard to manage on present income)
Sampling error
Surveys are designed and conducted to provide an estimate of a true value of characteristics of a
population at a given time. An estimate of a survey is unlikely to exactly equal the true population
quantity of interest for a variety of reasons. One of these reasons is that data in a survey are collected
from only some – a sample of – members of the population, this to make data collection cheaper and
faster. The “margin of error” is a common summary of sampling error, which quantifies uncertainty
about (or confidence in) a survey result.
Usually, one calculates a 95 percent confidence interval of the format: survey estimate +/- margin of
error. This interval of values will contain the true population value at least 95% of time.
For example, if it was estimated that 45% of EU citizens are in favour of a single European currency
and this estimate is based on a sample of 100 EU citizens, the associated margin of error is about 10
percentage points. The 95 percent confidence interval for support for a European single currency
would be (45%-10%) to (45%+10%), suggesting that in the EU the support for a European single
currency could range from 35% to 55%. Because of the small sample size of 100 EU citizens, there is
considerable uncertainty about whether or not the citizens of the EU support a single currency.
As a general rule, the more interviews conducted (sample size), the smaller the margin of error. Larger
samples are more likely to give results closer to the true population quantity and thus have smaller
margins of error. For example, a sample of 500 will produce a margin of error of no more than about
4.5 percentage points, and a sample of 1,000 will produce a margin of error of no more than about 3
percentage points.
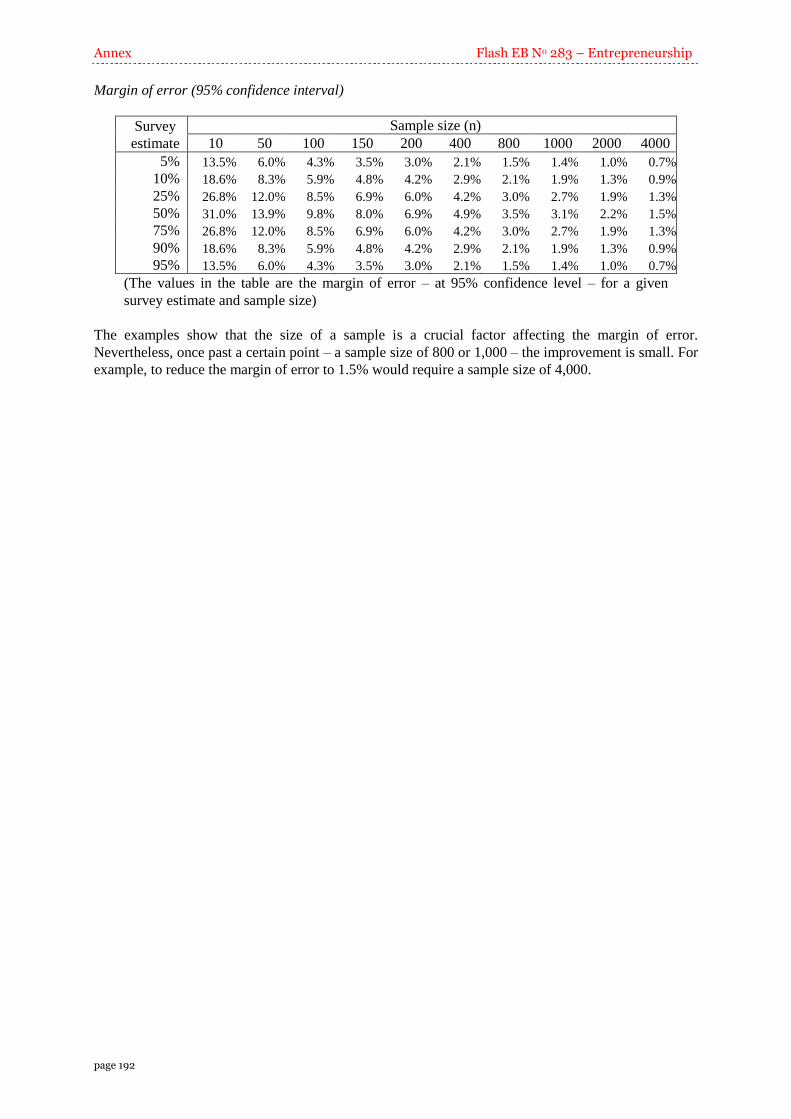
Annex Flash EB No 283 – Entrepreneurship
page 192
Margin of error (95% confidence interval)
Survey
estimate
Sample size (n)
10 50 100 150 200 400 800 1000 2000 4000
5% 13.5% 6.0% 4.3% 3.5% 3.0% 2.1% 1.5% 1.4% 1.0% 0.7%
10% 18.6% 8.3% 5.9% 4.8% 4.2% 2.9% 2.1% 1.9% 1.3% 0.9%
25% 26.8% 12.0% 8.5% 6.9% 6.0% 4.2% 3.0% 2.7% 1.9% 1.3%
50% 31.0% 13.9% 9.8% 8.0% 6.9% 4.9% 3.5% 3.1% 2.2% 1.5%
75% 26.8% 12.0% 8.5% 6.9% 6.0% 4.2% 3.0% 2.7% 1.9% 1.3%
90% 18.6% 8.3% 5.9% 4.8% 4.2% 2.9% 2.1% 1.9% 1.3% 0.9%
95% 13.5% 6.0% 4.3% 3.5% 3.0% 2.1% 1.5% 1.4% 1.0% 0.7%
(The values in the table are the margin of error – at 95% confidence level – for a given
survey estimate and sample size)
The examples show that the size of a sample is a crucial factor affecting the margin of error.
Nevertheless, once past a certain point – a sample size of 800 or 1,000 – the improvement is small. For
example, to reduce the margin of error to 1.5% would require a sample size of 4,000.
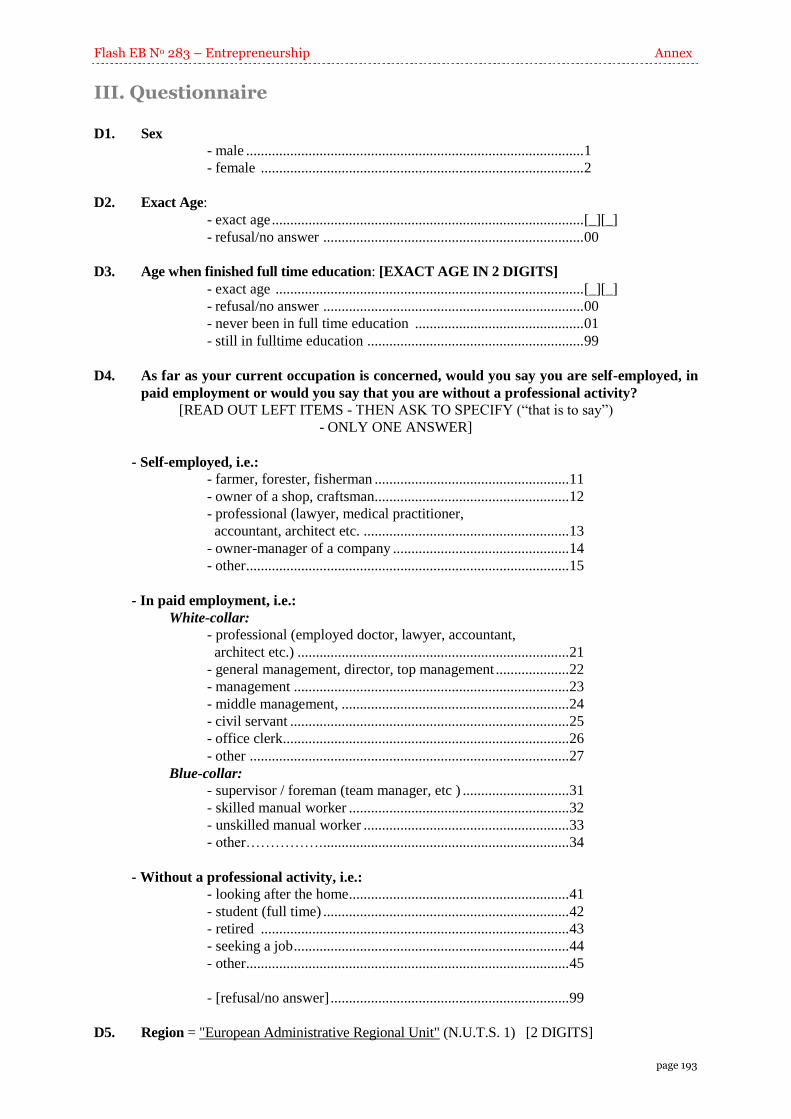
Flash EB No 283 – Entrepreneurship Annex
page 193
III. Questionnaire
D1. Sex
- male ............................................................................................ 1
- female ........................................................................................ 2
D2. Exact Age:
- exact age ..................................................................................... [_][_]
- refusal/no answer ....................................................................... 00
D3. Age when finished full time education: [EXACT AGE IN 2 DIGITS]
- exact age .................................................................................... [_][_]
- refusal/no answer ....................................................................... 00
- never been in full time education .............................................. 01
- still in fulltime education ........................................................... 99
D4. As far as your current occupation is concerned, would you say you are self-employed, in
paid employment or would you say that you are without a professional activity?
[READ OUT LEFT ITEMS - THEN ASK TO SPECIFY (“that is to say”)
- ONLY ONE ANSWER]
- Self-employed, i.e.:
- farmer, forester, fisherman ..................................................... 11
- owner of a shop, craftsman..................................................... 12
- professional (lawyer, medical practitioner,
accountant, architect etc. ........................................................ 13
- owner-manager of a company ................................................ 14
- other ........................................................................................ 15
- In paid employment, i.e.:
White-collar:
- professional (employed doctor, lawyer, accountant,
architect etc.) .......................................................................... 21
- general management, director, top management .................... 22
- management ........................................................................... 23
- middle management, .............................................................. 24
- civil servant ............................................................................ 25
- office clerk .............................................................................. 26
- other ....................................................................................... 27
Blue-collar:
- supervisor / foreman (team manager, etc ) ............................. 31
- skilled manual worker ............................................................ 32
- unskilled manual worker ........................................................ 33
- other……………. ................................................................... 34
- Without a professional activity, i.e.:
- looking after the home ............................................................ 41
- student (full time) ................................................................... 42
- retired .................................................................................... 43
- seeking a job ........................................................................... 44
- other ........................................................................................ 45
- [refusal/no answer] ................................................................. 99
D5. Region = "European Administrative Regional Unit" (N.U.T.S. 1) [2 DIGITS]
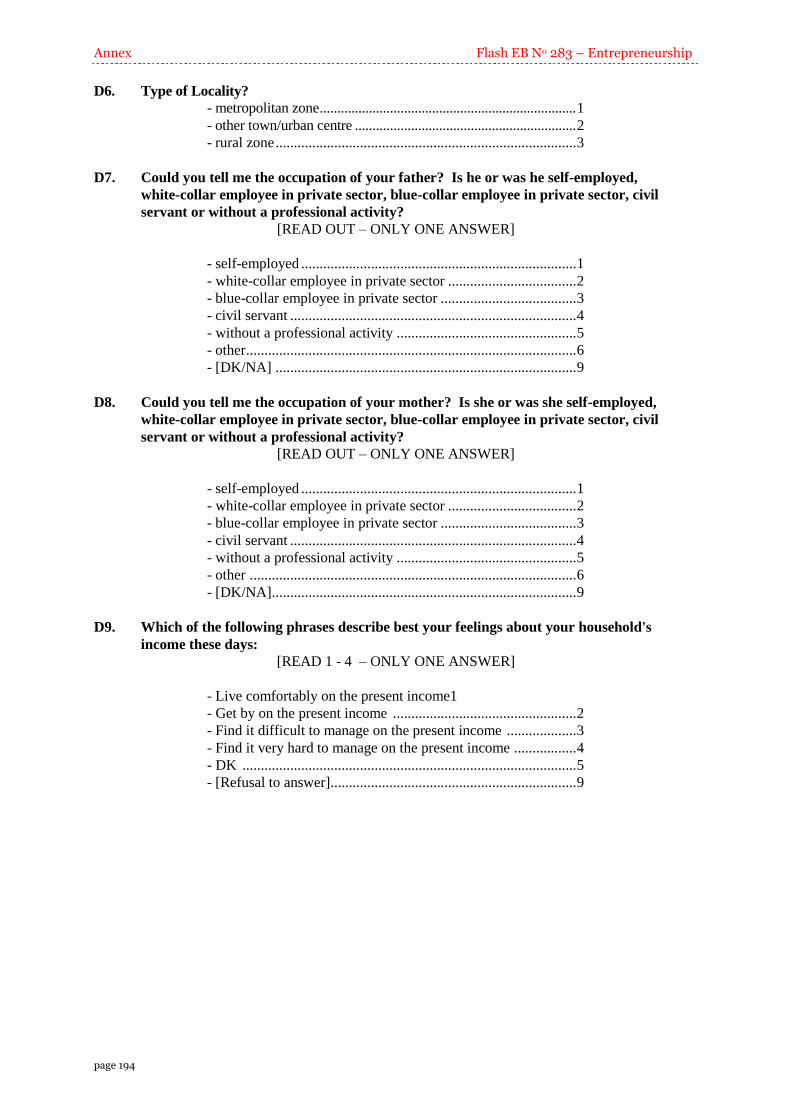
Annex Flash EB No 283 – Entrepreneurship
page 194
D6. Type of Locality?
- metropolitan zone ......................................................................... 1
- other town/urban centre ............................................................... 2
- rural zone .................................................................................. 3
D7. Could you tell me the occupation of your father? Is he or was he self-employed,
white-collar employee in private sector, blue-collar employee in private sector, civil
servant or without a professional activity?
[READ OUT – ONLY ONE ANSWER]
- self-employed ........................................................................... 1
- white-collar employee in private sector ................................... 2
- blue-collar employee in private sector ..................................... 3
- civil servant .............................................................................. 4
- without a professional activity ................................................. 5
- other .......................................................................................... 6
- [DK/NA] .................................................................................. 9
D8. Could you tell me the occupation of your mother? Is she or was she self-employed,
white-collar employee in private sector, blue-collar employee in private sector, civil
servant or without a professional activity?
[READ OUT – ONLY ONE ANSWER]
- self-employed ........................................................................... 1
- white-collar employee in private sector ................................... 2
- blue-collar employee in private sector ..................................... 3
- civil servant .............................................................................. 4
- without a professional activity ................................................. 5
- other ......................................................................................... 6
- [DK/NA]................................................................................... 9
D9. Which of the following phrases describe best your feelings about your household's
income these days:
[READ 1 - 4 – ONLY ONE ANSWER]
- Live comfortably on the present income1
- Get by on the present income .................................................. 2
- Find it difficult to manage on the present income ................... 3
- Find it very hard to manage on the present income ................. 4
- DK ........................................................................................... 5
- [Refusal to answer] ................................................................... 9
Flash EB No 283 – Entrepreneurship Annex
page 195
D10. Do you strongly agree, agree, disagree or strongly disagree with the following
statements?
[READ OUT – ROTATE – ONE ANSWER ONLY FOR EACH ITEM]
- strongly agree ........................................................................... 1
- agree ......................................................................................... 2
- disagree..................................................................................... 3
- strongly disagree ...................................................................... 4
- [DK/NA] .................................................................................. 9
a) In general, I am willing to take risks ............................................................. 1 2 3 4 9
b) Generally, when facing difficult tasks, I am certain that I will
accomplish them ........................................................................................... 1 2 3 4 9
c) My life is determined by my own actions, not by others or by chance ............ 1 2 3 4 9
d) If I see something I do not like, I change it .................................................. 1 2 3 4 9
e) The possibility of being rejected by others for standing up for my
decisions would not stop me .............................................................................. 1 2 3 4 9
f) I am an inventive person who has ideas ......................................................... 1 2 3 4 9
g) I am optimistic about my future .................................................................... 1 2 3 4 9
h) I like situations in which I compete with others ........................................... 1 2 3 4 9
i) When confronted with difficult tasks I can count on luck and the
help of others ..................................................................................................... 1 2 3 4 9
We are conducting a survey in the 27 countries of the European Union and in some other
countries concerning entrepreneurial activity.
Q1. Suppose you could choose between different kinds of jobs, which one would you prefer:
[READ OUT – ONE ANSWER ONLY]
- being an employee .................................................................... 1
- being self-employed … ............................................................ 2
- [none of these] .......................................................................... 3
- [DK/NA] .................................................................................. 9
[TO THOSE WHO ANSWERED “EMPLOYEE” IN Q1 (Q1=1)]31
Q2. Why would you prefer to be an employee rather than self-employed?
And what else? And what else ?
[DO NOT READ OUT – SPONTANEOUS – CODE THE ANSWERS BELOW– MULTIPLE
ANSWERS POSSIBLE – PLEASE PROBE FOR MORE ]
a) Regular, fixed income (versus irregular, variable income)… 1
b) Stability of employment ......................................................... 2
c) Fixed working hours ............................................................... 3
d) Protection by social security and/or insurances ...................... 4
e) Lack of business idea .............................................................. 5
f) Lack of finances for self-employment .................................... 6
g) Lack of skills for self-employment ........................................ 7
h) Severity of decision – difficult to reverse decision/
being tied to business .............................................................. 8
i) Afraid of red tape, problems with public authorities ............. 9
j) Afraid of legal and social consequences if I fail ................... 10
k) Other ..................................................................................... 11
please specify ..........................
l) DK/NA .................................................................................. 99
31
) If nothing is specified questions are asked to all.
Annex Flash EB No 283 – Entrepreneurship
page 196
[TO THOSE WHO ANSWERED “SELF-EMPLOYED” IN Q1 (Q1=2)]
Q3. Why would you prefer to be self-employed rather than an employee?
And what else? And what else ?
[DO NOT READ OUT – SPONTANEOUS – CODE THE ANSWERS BELOW – MULTIPLE
ANSWERS POSSIBLE– PLEASE PROBE FOR MORE]
a) Personal independence/self-fulfilment/interesting tasks ........ 1
b) Realisation of a business opportunity ..................................... 2
c) Better income prospects.......................................................... 3
d) Freedom to choose place and time of working ...................... 4
e) Lack of attractive employment opportunities ......................... 5
f) Members of family / friends are self-employed ...................... 6
g) Favourable economic climate…………………… ................. 7
h) To avoid uncertainties related to employment ....................... 8
i) To contribute to society ........................................................... 9
j) Other, ..................................................................................... 10
please specify ..........................
k) DK/NA ................................................................................. 99
[TO THOSE WHO DID NOT ANSWER “SELF-EMPLOYED” IN D4, i.e. are currently not self-
employed]
Q4. Regardless of whether or not you would like to become self-employed, would it be
feasible for you to be self-employed within the next 5 years?
[READ OUT – ONE ANSWER ONLY]
- Very feasible ............................................................................ 1
- Quite feasible ............................................................................ 2
- Not very feasible ...................................................................... 3
- Not feasible at all ...................................................................... 4
- [DK/NA]................................................................................... 9
[TO THOSE WHO ANSWERED “NOT VERY FEASIBLE” OR “NOT FEASIBLE AT ALL” IN Q4]
Q5. Why would it not be feasible for you to be self-employed within the next 5 years?
And what else? And what else ?
[DO NOT READ OUT – SPONTANEOUS – CODE THE ANSWERS BELOW – MULTIPLE
ANSWERS POSSIBLE– PLEASE PROBE FOR MORE]
a) Lack of business idea/opportunity .......................................... 1
b) Lack of finances for self-employment .................................... 2
c) Lack of skills for self-employment ......................................... 3
d) Burden of red tape / Administrative difficulties ..................... 4
e) The risk of failure and its legal and social
consequences is too big ......................................................... 5
f) It would be difficult to reconcile with my family
situation ................................................................................ 6
g) The current economic climate is not good for a
start-up ................................................................................... 7
h) Other .........................................................................................
please specify ..........................
i) Don’t know/No answer ........................................................... 9
Flash EB No 283 – Entrepreneurship Annex
page 197
Q6. I will read you a list of statements. Please tell me, do you strongly agree, agree, disagree
or strongly disagree with the following statements?
[READ OUT – ROTATE – ONE ANSWER ONLY FOR EACH ITEM]
- strongly agree ........................................................................... 1
- agree ......................................................................................... 2
- disagree..................................................................................... 3
- strongly disagree ...................................................................... 4
- [DK/NA] .................................................................................. 9
a) My school education helped me to develop my sense of initiative –
a sort of entrepreneurial attitude ................................................................... 1 2 3 4 9
b) My school education helped me to better understand the role of
entrepreneurs in society ................................................................................ 1 2 3 4 9
c) My school education made me interested to become an entrepreneur ........... 1 2 3 4 9
d) My school education gave me skills and know-how that enable me
to run a business ........................................................................................... 1 2 3 4 9
Q7. I am going to read you another list of statements. Please tell me, do you agree or disagree
with them?
[READ OUT – ROTATE – ONE ANSWER ONLY FOR EACH ITEM]
- strongly agree ........................................................................... 1
- agree ......................................................................................... 2
- disagree..................................................................................... 3
- strongly disagree ...................................................................... 4
- [DK/NA] .................................................................................. 9
a) Entrepreneurs create new products and services and benefit us all ............... 1 2 3 4 9
b) Entrepreneurs think only about their own wallet ........................................... 1 2 3 4 9
c) Entrepreneurs are job creators........................................................................ 1 2 3 4 9
d) Entrepreneurs exploit other people’s work .................................................... 1 2 3 4 9
Q8. Have you ever started a business or are you taking steps to start one?
[READ OUT – ONE ANSWER ONLY]
- yes ............................................................................................ 1
- no .............................................................................................. 2
- [DK/NA]................................................................................... 9
[IF Q8 = 2, i.e. for people who never started a business]
Q9. How would you describe your situation:
- It never came to your mind to start up a business .................... 1
- You are thinking about starting up a business ......................... 2
- You thought of it or you had already taken steps to start
a business but gave up ............................................................. 3
- [DK/NA]................................................................................... 9
Annex Flash EB No 283 – Entrepreneurship
page 198
[IF Q8 = 1, i.e. people who have started a business or a doing it now]
Q10. How would you describe your situation:
- You are currently taking steps to start a new business ............. 1
- You have started or taken over a business in the last
three years which is still active today .................................... 2
- You started or took over a business more than three
years ago and it’s still active ................................................. 3
- Once started a business, but currently you are no
longer an entrepreneur since business has failed ................... 4
- Once started a business, but currently you are no
longer an entrepreneur since business was sold,
transferred or closed .............................................................. 5
- [DK/NA]................................................................................... 9
[TO THOSE WHO ANSWERED Q8 = 1 OR Q9 = 3, i.e. people who are taking steps to start, are
running a business, had one in the past or had taken steps to start but gave up]
Q11. For each of the following elements, please tell me if it was very important, rather
important, rather not important or not important at all for making you take steps to
start a new business or take over one.
[READ OUT – ROTATE – ONE ANSWER PER LINE]
- Very important ......................................................................... 1
- Rather important ....................................................................... 2
- Rather not important ................................................................. 3
- Not important at all .................................................................. 4
- [DK/NA] .................................................................................. 9
a) Dissatisfaction with regard to your previous situation ................................... 1 2 3 4 9
b) An appropriate business idea ......................................................................... 1 2 3 4 9
c) Contact with an appropriate business partner ................................................ 1 2 3 4 9
d) Receiving the necessary financial means ....................................................... 1 2 3 4 9
e) A role model ................................................................................................. 1 2 3 4 9
f) Addressing an unmet social or ecological need ............................................. 1 2 3 4 9
[TO THOSE WHO ANSWERED Q8 = 1, i.e. people who at some time started a business or are taking
steps to do so]
Q12. All in all, would you say you started, or are starting, your business because you saw an
opportunity or you started it out of necessity?
[READ OUT – ONE ANSWER ONLY]
- You started it because you came across an opportunity ........... 1
- You started it because it was a necessity .................................. 2
- [Both – SPONTANEOUS] ....................................................... 3
- [DK/NA] .................................................................................. 9
Q13. If you currently had the means to start your own business, including sufficient funding,
would you rather set up a new one or take over an existing one?
[READ OUT – ONE ANSWER ONLY]
- Set up a new one ....................................................................... 1
- Take over an existing business ................................................. 2
- [None of these, not interested] ................................................. 3
- [DK/NA]................................................................................... 9
Flash EB No 283 – Entrepreneurship Annex
page 199
Q14. If you were to set up a business today, which are the two risks you would be most afraid
of? Is it:
[READ OUT – ROTATE – MAXIMUM TWO ANSWERS]
- The uncertainty of your income ............................................... 1
- Job insecurity ............................................................................ 2
- The risk of losing your property ............................................... 3
- The need to devote too much energy or time to it .................... 4
- The possibility of suffering a personal failure .......................... 5
- The possibility of going bankrupt ............................................ 6
- [DK/NA]................................................................................... 9
a) First mention ......................................................... 1 2 3 4 5 6 9
b) Second mention .................................................... 1 2 3 4 5 6 9
Q15. What is your opinion about the following groups of persons? Is it ...
[READ OUT – ONE ANSWER ONLY]
- rather favourable ..................................................................... 1
- neutral ...................................................................................... 2
. rather unfavourable .................................................................. 3
- [DK/NA]................................................................................... 9
a) Entrepreneurs (Self-employed, business owners) ............................................. 1 2 3 9
b) Civil servants .................................................................................................... 1 2 3 9
c) Top-Managers in large production companies. ................................................. 1 2 3 9
d) Managers in a bank or a similar institutions ..................................................... 1 2 3 9
e) Politicians .......................................................................................................... 1 2 3 9
f) Liberal professions (Architects, Lawyers, Artist etc.) ....................................... 1 2 3 9
Q16. Please imagine, that you suddenly inherited X Euro. What would you do with the
money?
[READ OUT – ROTATE – ONE ANSWER ONLY]
- Start a business (alone or with a partner) ............................................ 1
- Buy a house (or repay my mortgage)… ............................................. 2
- Save the money (saving account, shares etc.) .................................... 3
- Spend it on things I always wanted to buy (voyages, car,
luxury items) ....................................................................................... 4
- Work less / stop working ................................................................... 5
- [DK/NA] ............................................................................................. 9
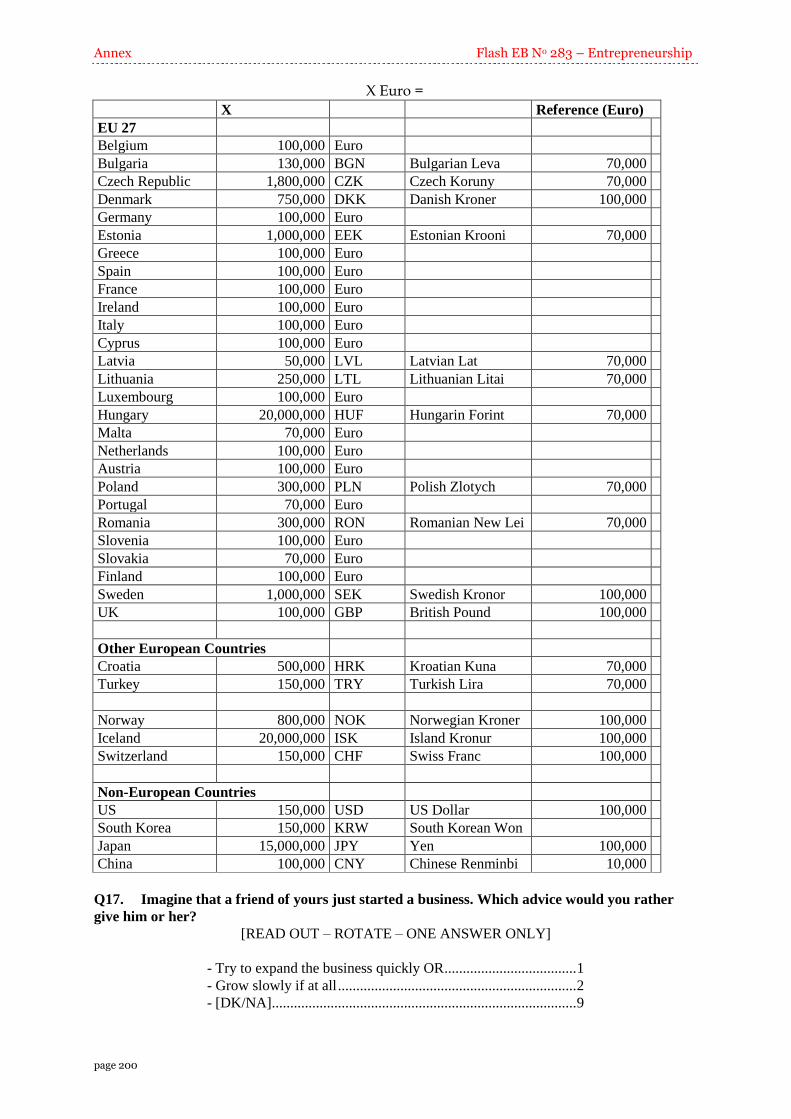
Annex Flash EB No 283 – Entrepreneurship
page 200
X Euro =
X Reference (Euro)
EU 27
Belgium 100,000 Euro
Bulgaria 130,000 BGN Bulgarian Leva 70,000
Czech Republic 1,800,000 CZK Czech Koruny 70,000
Denmark 750,000 DKK Danish Kroner 100,000
Germany 100,000 Euro
Estonia 1,000,000 EEK Estonian Krooni 70,000
Greece 100,000 Euro
Spain 100,000 Euro
France 100,000 Euro
Ireland 100,000 Euro
Italy 100,000 Euro
Cyprus 100,000 Euro
Latvia 50,000 LVL Latvian Lat 70,000
Lithuania 250,000 LTL Lithuanian Litai 70,000
Luxembourg 100,000 Euro
Hungary 20,000,000 HUF Hungarin Forint 70,000
Malta 70,000 Euro
Netherlands 100,000 Euro
Austria 100,000 Euro
Poland 300,000 PLN Polish Zlotych 70,000
Portugal 70,000 Euro
Romania 300,000 RON Romanian New Lei 70,000
Slovenia 100,000 Euro
Slovakia 70,000 Euro
Finland 100,000 Euro
Sweden 1,000,000 SEK Swedish Kronor 100,000
UK 100,000 GBP British Pound 100,000
Other European Countries
Croatia 500,000 HRK Kroatian Kuna 70,000
Turkey 150,000 TRY Turkish Lira 70,000
Norway 800,000 NOK Norwegian Kroner 100,000
Iceland 20,000,000 ISK Island Kronur 100,000
Switzerland 150,000 CHF Swiss Franc 100,000
Non-European Countries
US 150,000 USD US Dollar 100,000
South Korea 150,000 KRW South Korean Won
Japan 15,000,000 JPY Yen 100,000
China 100,000 CNY Chinese Renminbi 10,000
Q17. Imagine that a friend of yours just started a business. Which advice would you rather
give him or her?
[READ OUT – ROTATE – ONE ANSWER ONLY]
- Try to expand the business quickly OR .................................... 1
- Grow slowly if at all ................................................................. 2
- [DK/NA]................................................................................... 9
Flash EB No 283 – Entrepreneurship Annex
page 201
Q18. Do you strongly agree, agree, disagree or strongly disagree with the following opinion?
[READ OUT – ROTATE – ONE ANSWER ONLY FOR EACH ITEM]
- strongly agree ........................................................................... 1
- agree ......................................................................................... 2
- disagree..................................................................................... 3
- strongly disagree ...................................................................... 4
- [DK/NA] .................................................................................. 9
a) It is difficult to start one’s own business due to a lack of available
financial support............................................................................................ 1 2 3 4 9
b) It is difficult to start one’s own business due to the complex
administrative procedures ............................................................................. 1 2 3 4 9
c) It is difficult to obtain sufficient information on how to start a
business ......................................................................................................... 1 2 3 4 9
d) One should not start a business if there is a risk it might fail ........................ 1 2 3 4 9
e) People who have started their own business and have failed should
be given a second chance .............................................................................. 1 2 3 4 9