Entrepreneurship and Small Business Management Chapter 13 Using Financial Statements to Guide a...
28
Entrepreneurship and Small Business Management Chapter 13 Using Financial Statements to Guide a Business
-
Upload
gerald-manning -
Category
Documents
-
view
216 -
download
1
Transcript of Entrepreneurship and Small Business Management Chapter 13 Using Financial Statements to Guide a...

Entrepreneurship and Small Business Management
Chapter 13 Using Financial Statements to
Guide a Business

© 2012 Pearson Education, Upper Saddle River, NJ 07458.
All Rights Reserved.2
Entrepreneurship and Small Business Management, 1/eBy Steve Mariotti and Caroline Glackin
Ch. 13 Performance Objectives Understand an income statement.
Examine a balance sheet to determine a business’s financing strategy.
Use the balance sheet equation for analysis.
Perform a financial ratio analysis of an income statement.

© 2012 Pearson Education, Upper Saddle River, NJ 07458.
All Rights Reserved.3
Entrepreneurship and Small Business Management, 1/eBy Steve Mariotti and Caroline Glackin
Ch. 13 Performance Objectives(continued)
Calculate return on investment.
Perform same-size (common-size) analysis of an income statement.
Use quick, current, and debt ratios to analyze a balance sheet.

© 2012 Pearson Education, Upper Saddle River, NJ 07458.
All Rights Reserved.4
Entrepreneurship and Small Business Management, 1/eBy Steve Mariotti and Caroline Glackin
Financial Statements Entrepreneurs use three basic
financial statements: Income statement Balance sheet Cash flow statement
Together, these financial reports show the health of a business at a glance.

© 2012 Pearson Education, Upper Saddle River, NJ 07458.
All Rights Reserved.5
Entrepreneurship and Small Business Management, 1/eBy Steve Mariotti and Caroline Glackin
Income Statement Shows profit or loss over a particular
time period Revenues > Expenses = Positive Balance Expenses > Revenues = Negative
Balance
Prepared monthly
Serves as a scorecard; helps reveal problems
© 2012 Pearson Education, Upper Saddle River, NJ 07458.
All Rights Reserved.6
Entrepreneurship and Small Business Management, 1/eBy Steve Mariotti and Caroline Glackin
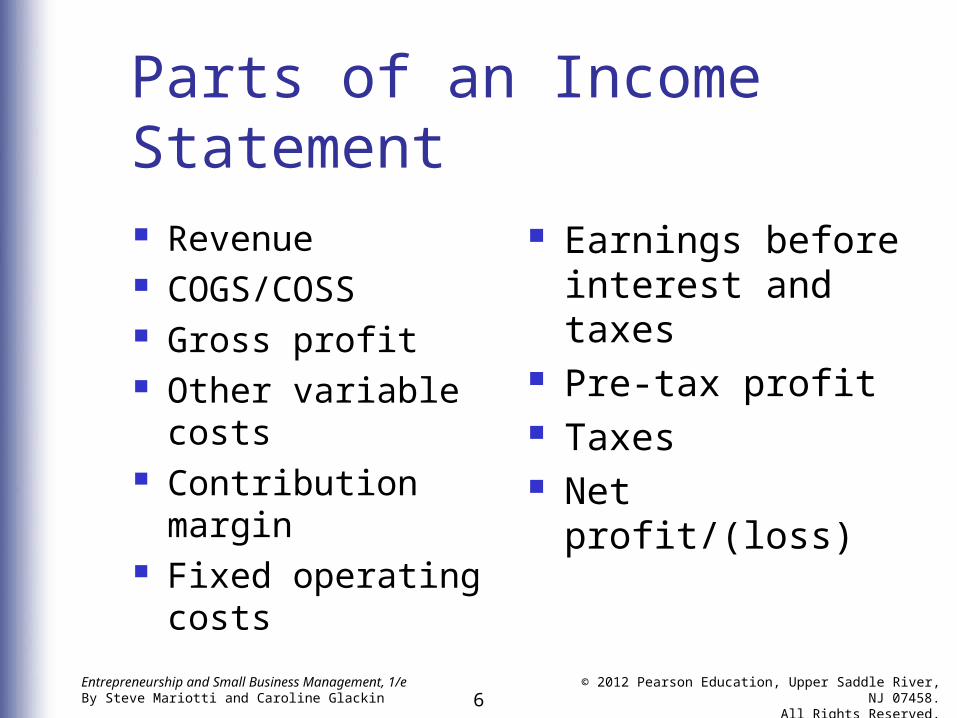
Parts of an Income Statement Revenue COGS/COSS Gross profit Other variable
costs Contribution
margin Fixed operating
costs
Earnings before interest and taxes
Pre-tax profit Taxes Net profit/(loss)

© 2012 Pearson Education, Upper Saddle River, NJ 07458.
All Rights Reserved.7
Entrepreneurship and Small Business Management, 1/eBy Steve Mariotti and Caroline Glackin
Income Statement: Basic Format

© 2012 Pearson Education, Upper Saddle River, NJ 07458.
All Rights Reserved.8
Entrepreneurship and Small Business Management, 1/eBy Steve Mariotti and Caroline Glackin
Income Statement Calculations

© 2012 Pearson Education, Upper Saddle River, NJ 07458.
All Rights Reserved.9
Entrepreneurship and Small Business Management, 1/eBy Steve Mariotti and Caroline Glackin
A Simple Income Statement

© 2012 Pearson Education, Upper Saddle River, NJ 07458.
All Rights Reserved.10
Entrepreneurship and Small Business Management, 1/eBy Steve Mariotti and Caroline Glackin
An Income Statement for a More Complex Business

© 2012 Pearson Education, Upper Saddle River, NJ 07458.
All Rights Reserved.11
Entrepreneurship and Small Business Management, 1/eBy Steve Mariotti and Caroline Glackin
Balance Sheet Called a “point-in-time” financial
statement because it shows the state of a business at a given moment
Typically prepared quarterly and at the end of the fiscal year (12-month accounting period chosen by the firm)

© 2012 Pearson Education, Upper Saddle River, NJ 07458.
All Rights Reserved.12
Entrepreneurship and Small Business Management, 1/eBy Steve Mariotti and Caroline Glackin
Parts of a Balance Sheet Assets—things the company owns
that are worth money Liabilities—the company’s debts
that must be paid (including unpaid bills)
Owner’s Equity (OE)— Assets – Liabilities = OE Also called “net worth” The amount of capital in the company

© 2012 Pearson Education, Upper Saddle River, NJ 07458.
All Rights Reserved.13
Entrepreneurship and Small Business Management, 1/eBy Steve Mariotti and Caroline Glackin
Balance Sheet (Horizontal Format)

© 2012 Pearson Education, Upper Saddle River, NJ 07458.
All Rights Reserved.14
Entrepreneurship and Small Business Management, 1/eBy Steve Mariotti and Caroline Glackin
Types/Examples of Assets Current assets—cash, items easily turned
into cash, and items used within one year Accounts receivable Inventory Supplies
Long-term assets—items that would take the business more than one year to use Equipment Furniture Machinery Real estate

© 2012 Pearson Education, Upper Saddle River, NJ 07458.
All Rights Reserved.15
Entrepreneurship and Small Business Management, 1/eBy Steve Mariotti and Caroline Glackin
Types/Examples of Liabilities Current liabilities—debts scheduled for
payment within one year (includes portion of long-term debt due within the year)
Long-term liabilities—debts to be paid over a time period longer than one year
Examples of liabilities: Accounts payable (bills) Loans from banks, family, or friends Mortgages Lines of credit

© 2012 Pearson Education, Upper Saddle River, NJ 07458.
All Rights Reserved.16
Entrepreneurship and Small Business Management, 1/eBy Steve Mariotti and Caroline Glackin
The Balance Sheet Equation
Assets – Liabilities = Owner’s Equity (OE)or
Assets = Liabilities + Owner’s Equityor
Liabilities = Assets – Owner’s Equity
(Net worth and capital are other names for OE.)

© 2012 Pearson Education, Upper Saddle River, NJ 07458.
All Rights Reserved.17
Entrepreneurship and Small Business Management, 1/eBy Steve Mariotti and Caroline Glackin
Total Assets Must Equal (“Balance”) Total Liabilities + Owner’s Equity
If an item was financed with debt, the loan is a liability.
If an item was purchased with the owner’s (or shareholders’) money, it was financed with equity.
Liabilities and owner’s equity pay for all assets.

© 2012 Pearson Education, Upper Saddle River, NJ 07458.
All Rights Reserved.18
Entrepreneurship and Small Business Management, 1/eBy Steve Mariotti and Caroline Glackin
Analyzing Balance Sheet Data
Compare balance sheets from two different points in time to see progress.
Calculate the percentage of change between the reports for each line item.
An increase in owner’s equity is one way to measure success.

© 2012 Pearson Education, Upper Saddle River, NJ 07458.
All Rights Reserved.19
Entrepreneurship and Small Business Management, 1/eBy Steve Mariotti and Caroline Glackin
Income Statement RatiosExpress each line item as a percentage of sales to see the relationship between items.
Amount (M)
Calculation % of Sales
Sales $10 ($10 ÷ $10) x 100
100%
Less total COGS $ 4 ($4 ÷ $10) X 100
40%
Less other var. costs
$ 0
Contribution margin
$ 6 ($6 ÷ $10) X 100
60%
Less fixed op. costs
$ 3 ($3 ÷ $10) x 100
30%
Profit $ 3 ($3 ÷ $10) x 100
30%
Taxes $ 1 ($1 ÷ $10) x 100
10%
Net profit/(loss) $ 2 ($2 ÷ $10) x 100
20%

© 2012 Pearson Education, Upper Saddle River, NJ 07458.
All Rights Reserved.20
Entrepreneurship and Small Business Management, 1/eBy Steve Mariotti and Caroline Glackin
Return on Investment (ROI)
Entrepreneurs “invest” time, energy, and money because they expect a “return” of money or satisfaction.
Return on investment (ROI) measures return as a percentage of the original investment.
(Net Profit ÷ Investment) X 100 = ROI%

© 2012 Pearson Education, Upper Saddle River, NJ 07458.
All Rights Reserved.21
Entrepreneurship and Small Business Management, 1/eBy Steve Mariotti and Caroline Glackin
Things Needed to Calculate ROI
Net profit—amount the firm has earned beyond what it has spent to cover costs
Total investment—start-up investment plus any additional money invested later
Period of time for which you are calculating ROI—typically one month or one year

© 2012 Pearson Education, Upper Saddle River, NJ 07458.
All Rights Reserved.22
Entrepreneurship and Small Business Management, 1/eBy Steve Mariotti and Caroline Glackin
Return on Sales (ROS) ROS is also called the “profit
margin” because it is an important measure of business profitability.
Net income ÷ sales = ROS
To express this ratio as a percentage, multiply it by 100.

© 2012 Pearson Education, Upper Saddle River, NJ 07458.
All Rights Reserved.23
Entrepreneurship and Small Business Management, 1/eBy Steve Mariotti and Caroline Glackin
Volume and Price Impact ROS
ROS Margin Range
Typical Product
Very low 2-5% Very high volume OR very high price
Low 6-10% High volume OR high price
Moderate 11-20% Moderate volume AND moderate price
High 20-30% Low volume OR low price
Very high 30% and up Very low volume OR very low price

© 2012 Pearson Education, Upper Saddle River, NJ 07458.
All Rights Reserved.24
Entrepreneurship and Small Business Management, 1/eBy Steve Mariotti and Caroline Glackin
Common-Sized (“Same-Size”) Analysis Lets you compare income statements,
even if sales amounts vary.
Compare your expenses with those incurred by other businesses in your industry, or for your own company at different points in time.
Operating ratio—expresses what percentage of sales dollars a particular expense item is using up

© 2012 Pearson Education, Upper Saddle River, NJ 07458.
All Rights Reserved.25
Entrepreneurship and Small Business Management, 1/eBy Steve Mariotti and Caroline Glackin
Quick and Current RatiosQuick Ratio: (Cash + Marketable Securities) ÷ Current
Liabilities Marketable securities—investments such as
certificates of deposit or Treasury bills If the quick ratio is greater than one, there is
enough cash to cover all bills (but not loans) within 24 hours.
Current Ratio: Current Assets ÷ Current Liabilities If the current ratio is greater than one, the
business could sell some assets to pay off its debts.

© 2012 Pearson Education, Upper Saddle River, NJ 07458.
All Rights Reserved.26
Entrepreneurship and Small Business Management, 1/eBy Steve Mariotti and Caroline Glackin
Debt Ratios
Debt-to-Equity Ratio: Total Debt ÷ Equity Indicates how many dollars in the business
were provided by owners/investors Example: A ratio of 1-to-1 means for every
$1 of debt, the company owns $1 of assets.
Debt Ratio: Total Debt ÷ Total Assets Indicates how many dollars in the business
were provided by creditors Example: A ratio of 0.5 means the
company is in debt for 50% of its assets.

© 2012 Pearson Education, Upper Saddle River, NJ 07458.
All Rights Reserved.27
Entrepreneurship and Small Business Management, 1/eBy Steve Mariotti and Caroline Glackin
Operating Efficiency Ratios Collection-period ratio—measures
the average number of days that sales are going uncollected
Receivable turnover ratio—measures the efficiency of your company’s efforts to collect receivables
Inventory turnover ratio—measures how quickly inventory is being sold

© 2012 Pearson Education, Upper Saddle River, NJ 07458.
All Rights Reserved.28
Entrepreneurship and Small Business Management, 1/eBy Steve Mariotti and Caroline Glackin
Formulas for Calculating Operating Efficiency Ratios Collection-Period Ratio:
Average Accounts Receivable (Balance Sheet) Average Daily Sales (Income Statement)
Receivable Turnover Ratio:
Total Sales (Income Statement) Average Accounts Receivable (Balance Sheet)
Inventory Turnover Ratio:
Cost of Goods Sold (Income Statement) Average Inventory (Balance Sheet)
= # of days
= # of times
= # of times