Entrepreneurial Optimism, Credit Availability, and Cost...
48
Electronic copy available at: http://ssrn.com/abstract=1437829 Entrepreneurial Optimism, Credit Availability, and Cost of Financing: Evidence from U.S. Small Businesses Na Dai * Assistant Professor School of Business SUNY at Albany 1400 Washington Ave Albany, NY 12222 Vladimir Ivanov Economic Fellow U.S. Securities and Exchange Commission Washington D.C. 20549 Abstract Does entrepreneurial optimism affect the credit availability to small firms and their cost of financing? Using a large sample of U.S. small businesses and a new measure of optimism, we find that higher levels of optimism result in significantly higher leverage. In addition, we find that firms with optimistic entrepreneurs tend to use more short-term debt. We do not find evidence that banks curtail lending to more optimistic entrepreneurs. In fact, banks are more likely to approve loan applications by optimistic entrepreneurs; they do not charge an interest premium; they do not require more collateral. * Dai (Corresponding author): Email: [email protected] ; Phone: 505-442-4962; Fax: 518-442-3045.
Transcript of Entrepreneurial Optimism, Credit Availability, and Cost...

Electronic copy available at: http://ssrn.com/abstract=1437829
Entrepreneurial Optimism, Credit Availability, and Cost of
Financing: Evidence from U.S. Small Businesses
Na Dai*
Assistant Professor School of Business SUNY at Albany
1400 Washington Ave Albany, NY 12222
Vladimir Ivanov Economic Fellow
U.S. Securities and Exchange Commission Washington D.C. 20549
Abstract Does entrepreneurial optimism affect the credit availability to small firms and their cost of financing? Using a large sample of U.S. small businesses and a new measure of optimism, we find that higher levels of optimism result in significantly higher leverage. In addition, we find that firms with optimistic entrepreneurs tend to use more short-term debt. We do not find evidence that banks curtail lending to more optimistic entrepreneurs. In fact, banks are more likely to approve loan applications by optimistic entrepreneurs; they do not charge an interest premium; they do not require more collateral.
* Dai (Corresponding author): Email: [email protected]; Phone: 505-442-4962; Fax: 518-442-3045.

Electronic copy available at: http://ssrn.com/abstract=1437829
1
Entrepreneurial Optimism, Credit Availability, and Cost of
Financing: Evidence from U.S. Small Businesses
1. Introduction
The prevalence of entrepreneurial optimism and its importance is well-recognized. For
instance, there is a vast psychology literature relevant to managerial behavior (see, for example,
Gilovich, Griffin, and Kahneman (2002), and Kahneman and Tversky (2000)) that documents
various types of irrational human behaviors. Some of the most robust biases refer to
overoptimism and overconfidence.1 Second, the entrepreneurship literature has demonstrated that
optimists are more likely to become entrepreneurs.2 Third, recent studies have shown that returns
to entrepreneurship are rather small compared to the risk involved (see Hamilton (2000) and
Moskowitz and Vissing-Jorgensen (2003)). One potential explanation for this “private equity
puzzle” is entrepreneurial overoptimism. Given the prevalence of entrepreneurial optimism and
its importance, surprisingly, its potential implications for small business financing and
investment decisions have received little attention with few exceptions (see, for example, De
Meza and Southey (1996), Cassar and Friedman (2007), and Landier and Thesman (2009)). Our
study aims to fill this gap in the literature. We explore the potential influence of entrepreneurial
optimism on small business financing decisions from three perspectives: capital structure, credit
availability, and the cost of capital.
1 See Larwood and Whittaker (1977), March and Shapira (1987), and Ben-David (2004) for behavioral studies based on samples of managers. 2 See, for example, Cooper, Woo and Dunkelberg (1988), Evans and Leighton (1989), De Meza and Southey (1996), Busenitz and Barney (1997), and Pinfold (2001).

2
The Achilles heel of any behavioral corporate finance study is the empirical measure of
managerial bias. Toward this end, we design an innovative measure of optimism. In particular,
we use the difference between the unbiased probability that the entrepreneur’s application for
loans will be denied given the firm characteristics and credit conditions and the entrepreneur’s
subjective assessment of this probability as our measure of optimism. We relate our optimism
measure to various demographic characteristics of entrepreneurs and show that white male
entrepreneurs with higher level of education are more optimistic, while entrepreneurs’ business
experience reduces their optimism. To account for the potential nonlinearity of the relation
between optimism and our variables of interest, we further design fractional tercile ranks as
additional measures of optimism.
To the best of our knowledge, this is the first empirical study on the impact of managerial
optimism on capital structure in small business setting. We expect that the optimism of
entrepreneurs may have a much more important impact on the small businesses’ capital structure
than big corporations because mechanisms that might constrain less-than-fully-rational managers
of a big corporation into making rational decisions might not be available in small firms. For
example, the external market for corporate control might not work well for tightly-held small
firms. Furthermore, some internal corporate governance mechanisms, such as proxy fights,
boards of directors, might not be available.
There is a large body of the small business lending literature that examine how the credit
availability and cost of lending change with the level of information asymmetry associated with
small businesses (see, e.g., Petersen and Rajan (1994), Berger, Klapper, and Udell (2001)), and
Berger and Udell (2002), among others). At the broad level, these studies have found that the
credit availability decreases and the cost of financing increases with the level of information

3
asymmetry. The relationship between small firms and banks, as well as the proximity
geographically, help reduce information asymmetry and thus improve the credit conditions of
small businesses (see, e.g. Petersen and Rajan (2002)). Our paper examines how the behavioral
attributes (optimism) of the entrepreneurs potentially affect the above-mentioned conditions
controlling for the level of information asymmetry. De Meza and Southey (1996) and De Meza
(2002) argue that those unrealistically optimistic self-select to become entrepreneurs and the
entrepreneurial optimism increases over-lending especially when financiers are not completely
immune to over-optimism. The existing literature remains silent in terms of empirical evidence
on the relation between entrepreneurial optimism and the potential over-lending. To the best of
our knowledge, our paper is the first to empirically address this issue.
Because the predictions of behavioral capital structure models are similar to those derived
from the traditional asymmetric information and agency cost theory of capital structure, in our
analysis we control for the predictions of standard, non-behavioral capital structure models.
Controlling for various firm characteristics such as firm age, firm size, percentage of tangible
assets, etc., we find that more optimistic entrepreneurs self-select to use more debt. The positive
relation between optimism and debt ratio, however, is nonlinear and only significant for the most
optimistic entrepreneurs. Specifically, a small firm with the most optimistic entrepreneur has a
debt ratio 268% higher than a similar firm with the least optimistic entrepreneur. Furthermore,
we find that more optimistic entrepreneurs use more short-term debt than less optimistic
entrepreneurs. Specifically, a small firm with the most optimistic entrepreneur has a ratio of
short-term debt to long-term debt about 7% higher than a similar firm with the least optimistic
entrepreneur. This relationship is not linear either. Small firms’ choice of short-term debt versus

4
long-term debt is most sensitive to optimism in the bottom tercile group and least sensitive in the
middle tercile group.
We do not find evidence that financiers respond to optimism by curtailing lending to
more optimistic entrepreneurs. In fact, we find that optimistic entrepreneurs have better access to
credit. Specifically, they are less likely to pay their trade credit late and their loan applications
are more likely to be approved. Furthermore, we show that optimistic entrepreneurs are not more
frequently required to provide collateral for their loans, nor are they charged with higher interest
rates compared to their less optimistic peers. These findings imply that financiers do not
necessarily have better knowledge than entrepreneurs about their unrealistic optimism. If this is
the case, as predicted by De Meza (2002), entrepreneurial optimism may intensify the over-
lending caused by asymmetric information.
In our opinion, our study makes contributions to the following fields in the finance and
entrepreneurship literature. First, our paper adds to the literature on the impact of managerial
optimism on decision-making. Heaton (2002) pioneered this area by presenting a model of
several corporate finance decisions based on managerial optimism. The existing empirical
studies so far have been focusing on the model’s prediction with regard to under- or over-
investment. For example, Malmendier and Tate (2005, 2007) document a positive link between
overconfidence of CEOs for large public firms and overinvestment, using the personal
investments of these CEOs in their companies as a measure of overconfidence. Cassar and
Friedman (2007) find that overconfidence increases the likelihood that an individual will begin
pursuing startup activities. However, outside of entry decisions, they do not find overconfidence
to be a significant determinant of the amount of financial and human capital the entrepreneur
invests in the startup or the risk of the entrepreneurial investment. Landier and Thesmar (2009) is

5
closest to our study. They model the effect of entrepreneurial optimism on financial contracting,
particularly the choice of short-term debt and long-term debt and find supporting evidence using
a France survey data. This study extends their empirical findings by examining both the choice
of debt versus equity and the choice of various debt contract characteristics using the US Federal
Reserve Board’s SSBF data. Since US financial markets differ substantially from the French
financial markets (for example, in terms of the availability of venture capital, the structure of the
banking system, etc.), this study provides new and important evidence on the impact of
managerial optimism on capital structure.
Second, this study contributes to the empirical literature on small business lending. In the
last decade, researchers have analyzed the impact of firm characteristics, relationship with banks,
distance from banks, as well as the consolidation of the bank industry on credit availability to
small businesses.3 More recently, Cole, Goldberg, and White (2004) and Berger, Miller,
Petersen, Rajan, and Stein (2005) study the impact of bank organizational forms (large banks
versus small banks) on the credit availability to entrepreneurial borrowers. These empirical
studies have been largely focusing on the credit availability to small businesses from the
perspective of overcoming asymmetric information problems (adverse selection and moral
hazard). A distinguishing feature of our study is that we analyze, in addition to the well
documented agency considerations, the impact of entrepreneurial optimism on credit availability
as well as the cost of capital of small businesses. Furthermore, our empirical evidence sheds light
on whether financiers have better knowledge than entrepreneurs about their unrealistic optimism
and whether and how they respond to optimism. We show financiers do not curtail lending to
3 In the past decade, small business lending has attracted a considerable amount of scholarly attention (see Berger and Udell (1998) and Berger, Saunders, Scalise, and Udell (1998) for recently surveys).

6
more optimistic entrepreneurs, supporting the notion proposed in De Meza (2002) that
entrepreneurial over-optimism makes the over-lending even more pronounced.
The remainder of the paper is organized as follows: Section 2 reviews relevant literature
and develops testable hypotheses; Section 3 introduces the method that we apply to measure
entrepreneurial optimism; Section 4 summarizes the sample and data; Section 5 reports the
results of our empirical analysis; finally, Section 6 summarizes our primary conclusions.
2. Background and Hypotheses Development
In this section, we briefly review the existing literature on capital structure and
managerial optimism and put forth two hypotheses regarding the effect of managerial optimism
on small businesses’ capital structure.
2.1. Literature review
A. Managerial Optimism
The role of managerial optimism and overconfidence in a firm’s investment and
financing decisions has been a subject of an ongoing debate in the corporate finance literature.
Following Roll’s (1983) pioneering study on the role of managerial overoptimism in corporate
acquisitions, the merits of managers’ possible departure from full rationality, and behavioral
corporate finance in general, have been examined in a number of theoretical and empirical
studies.
Heaton (2002) is the first to introduce a behavioral capital structure model. He suggests
that because optimistic managers systematically attach higher probabilities to good firm
performance than the capital market, they believe that the capital market undervalues the firm’s

7
risky securities. Thus, in an efficient market, issuing a risky security is always perceived by
optimistic managers as a negative net present value event. Heaton’s model thus induces a
pecking order capital structure preference, where managers prefer internal cash or risk-free debt
to risky debt, and prefer risky debt to equity. Hackbarth (2008) develops a trade-off model of
capital structure with optimistic and overconfident managers. His model predicts that optimistic
managers choose higher debt levels and issue new debt more often. On the other hand, the
optimism has also a beneficial effect in his model since it restrains managers from wasting the
funds of the corporation.
However, the predictions of Heaton (2002) and Hackbarth (2008) are not novel, since
they are also independently derived from the traditional agency and asymmetric information
models of capital structure discussed in the previous sub-section. Thus, when testing the
predictions of the behavioral capital structure models one has to control for the agency and
asymmetric information explanations of the capital structure choice.
Several empirical studies examine the effect of managerial optimism on corporate
investment decisions. Malmendier and Tate (2004) study the effects of optimism on the
sensitivity of investment to cash flow. They use the propensity for a manager to voluntarily hold
in-the-money stock options in his own firm as a manager-level proxy for optimism. Malmendier
and Tate (2004) find that the sensitivity of investment to cash flow is higher for the more
optimistic CEOs. It is especially high for optimistic CEOs in equity-dependent firms, that is, in
situations where perceived financial constraints are most binding. Malmendier and Tate (2007)
test the effect of managerial optimism on a firm’s M&A activity. They find that optimistic CEOs
complete more mergers, especially diversifying mergers, which tend to be value decreasing.
Also, the biggest effect of optimism is among the least equity dependent firms, since managers

8
of such do not have to issue new equity that they, as optimists, would perceive as undervalued.
Lastly, investors are more skeptical about bid announcements when they are made by optimistic
CEOs.
B. Capital Structure
Over the years, numerous theories on why and how firms borrow money have been
proposed. Among those, there are generally three explanations of a firm’s capital structure
decisions that have received the most attention from finance scholars: the Pecking Order Theory
(Myers and Majluf (1984), Myers (1984)), The Trade-Off Theory (Jensen and Meckling (1976),
Jensen (1986), Hart and Moore (1994)), and the Market Timing Theory (Baker and Wurgler
(2002)). The pecking order theory is based on asymmetric information arguments and predicts
that firms turn to the sources of financing with the lowest degree of information asymmetry first.
Thus, according to this theory firms utilize retained earnings first, then use debt financing (which
has a smaller adverse selection premium than outside equity), and use outside equity as a last
resort. On the other hand, the trade-off theory asserts that the decision to use debt is based on the
trade-off between the benefits from debt (tax deductibility of interest payments, disciplining
effect on managers) and costs associated with it (costs of financial distress, shareholder-
debtholder conflicts). Lastly, the market timing theory, which is the newest of the three, argues
that the firm issues equity in hot equity markets and debt in cold equity markets.
The voluminous empirical literature on capital structure has so far yielded mixed results
on which theory best explains a firm’s capital structure decision.4 A recent study by Frank and
Goyal (2008) documents six core factors that significantly affect capital structure decisions:
4 See Titman and Wessels (1988), Harris and Raviv (1991), Shyam-Sunder and Myers (1999), Graham and Harvey (2001), Frank and Goyal (2003), Mackay and Phillips (2005), Leary and Roberts (2005).

9
mean industry leverage, market-to-book ratios, tangibility of assets, firm profits, firm size, and
expected inflation.
While the overwhelming majority of empirical studies involve publicly traded firms, very
few focus on small private firms. These limited studies typically focus on venture capital backed
firms (see e.g., Cumming (2005)). Most recently, Cole (2009) investigates the capital structure
decisions of small private U.S. firms. He finds that firm size, age, and profitability are negatively
related to firm leverage and firm liquidity, risk and tangibility of assets are positively related to
firm leverage.
B. Small Business Lending
Like capital structure, the area of small business lending has been an active area for
research over the last twenty years. Petersen and Rajan (1994) show that small firms concentrate
their external borrowing from banks. The asymmetric information problems that plague the
relationship between small business and lenders (Stiglitz and Weiss (1981)) could be mitigated
in various ways. Probably the main way is by relying on relationship lending. Petersen and Rajan
(1994) find that building close ties with lenders results in larger availability of credit. Berger et al
show that smaller banks are better at collecting soft information and dealing with
informationally-opaque borrowers than larger banks. Petersen and Rajan (2002) document that
improvement in lender productivity leads to greater distance between borrowers and lenders.
Berger and Udell (1995) find that small firms with longer bank relationships pay lower rates and
have to provide less collateral.
In addition to relationship lending, bank competition could also improve the credit
conditions for small firms. Towards that end, Rice and Strahan (2008) find that in states more

10
open to branching small firms are able to obtain loans at interest rates 25 to 45 basis points lower
than firms located in states that restrict branching. On the other hand, Petersen and Rajan (1995)
find that more small firms are able to obtain credit in concentrated markets.
Again, like in the case with capital structure, very few studies have examined the role that
entrepreneurial optimism plays in small business lending. With this study we try to shed more
light on this issue.
2.2 Testable Hypotheses
With few exceptions (see, for example, Landier and Thesman (2009) and De Meza and
Southey (1996)), the debate on the role of managerial optimism has so far mainly focused on
established public firms. Even then, few attempts have been made to date to examine the effect
of optimistic managers on a firm’s capital structure. Why is it interesting to study the effect of
managerial optimism on entrepreneurial ventures’ financing decisions? First, financing policies
undertaken at the early stages in a firm’s lifecycle have significant impact on that firm’s future
development, performance, governance and ownership structure. Second, there is a growing
strand of literature in economics that presents evidence that rewards from entrepreneurship tend
to be small compared to the risks involved, and explains this finding with entrepreneurs’
tendency to be overly optimistic about the potential returns from entrepreneurship.5 It would be
interesting to examine whether optimism also affects startups’ financing decisions. Third, in
those types of companies often entrepreneurs are the managers.6 Hence, mechanisms that might
constrain less-than-fully-rational managers of a big corporation into making rational decisions
might or might not be available in small firms. For example, the external market for corporate
5 See Hamilton (2000) and Moskowitz and Vissing-Jorgensen (2003). 6 For example, Berger and Udell (1998) report that this is the case in 86% of the firms included in the 1993 NSSFB.

11
control might not work well for tightly-held small firms. In addition, some internal corporate
governance mechanisms, such as proxy fights, boards of directors, might not be available.
Fourth, providing small business with an access to financing has for years been a subject of
various government policies. Investigation of how entrepreneurial optimism affects small
businesses’ financing decisions might help policy makers and financial institutions with their
decisions on how much capital and in what form to extend to small firms.
Heaton’s model suggests that small firms run by optimistic entrepreneurs should prefer
debt to outside equity financing. De Meza and Southey (1996) specifically model the capital
structure of a startup as a result of managerial optimism. One of the main predictions of their
model is that entrepreneurs prefer internal cash or risk-free debt to risky debt, and prefer risky
debt to equity. Therefore, based on these predictions we test the following hypothesis:
H1: Optimistic entrepreneurs are more likely to prefer debt to equity financing. Thus, controlling
for other determinants of capital structure, small firms with optimistic entrepreneurs are more
likely to choose highly levered capital structure.
Even if optimistic entrepreneurs prefer debt to equity, what type of debt securities will
they opt for? Standard bargaining-based models of capital structure (see Berglöf and Thadden
(1994)) predict that a firm will have both short-term and long-term debt claims. The maturity of
debt financing clearly matters to small firms. Bank loans to small businesses usually tend to be
short-term (Gertler and Gilchrist (1994), Chittenden, Hall, and Hutchinson (1996), Berger and
Udell (1998)). Although Heaton’s model does not distinguish between debt with various
maturity, Landier and Thesmar (2009) model the effect of entrepreneurial optimism on the
choice of short-term debt vs. long-term debt. They argue that optimists would self-select into

12
short-term debt for two reasons: (1) it bridges the gap in beliefs by letting the entrepreneur take a
bet on his project’s success, and (2) it also lets the investor impose adaptation decisions in bad
states. Thus, our second testable hypothesis is the following:
H2: Optimistic entrepreneurs are likely to use more short-term debt.
It should be noted that ours is not the first study to look at small firms’ debt maturity
choice. For example, Scherr and Hulburt (2001) document that small firms are more likely to use
short-term debt if their assets have shorter maturities and if they have very low or very high
default probability. Landier and Thesmar (2009) test their model using French data and find that
optimistic entrepreneurs tend to use more short-term debt. However, no study to date has
examined the impact of managerial optimism on debt maturity for a large sample of U.S. small
firms. Thus, with our study we hope to add some new evidence to the current literature on debt
maturity of small firms.
De Meza and Southey (1996) and De Meza (2001) argue that the presence of
overoptimistic entrepreneurs would result in generally lower quality of borrowers, excessive
lending, and lower expected return per loan for lenders. The next set of predictions relate to
whether lending institutions tend to curtail lending to optimistic entrepreneurs. Banks might have
the incentives to do this in order to protect themselves from the entrance of lower quality
borrowers to the current borrower pool and eventual decrease in their expected rates of return.
Limitations on lending could also be manifested in credit rationing, charging higher interest
rates, and requiring for more collateral (Manove and Padilla (1999)). If optimistic entrepreneurs
indeed face tighter credit constraints, then we conjecture the following:

13
H3: Optimistic entrepreneurs’ loan applications are more likely to be rejected.
H4: Optimistic entrepreneurs are more often requested to provide collateral for the loans
granted, other things equal.
H5: The interest rate of loans granted to optimistic entrepreneurs is higher, other things equal.
3. A New Measure of Entrepreneurial Optimism
One of the challenges incurred in empirical studies of behavioral corporate finance is
measuring managerial behavioral biases. Without such an empirical measure, the optimistic
managers approach is difficult to distinguish from traditional agency theory (Baker, Rubak and
Wurgler (2004)) or models of costly external financing built on asymmetric information (Stein
(2003)). Here we use the difference between the realistic probability that the entrepreneur’s
application for loans will be denied given the firm characteristics and credit conditions and the
entrepreneur’s subjective assessment of this probability as our measure of optimism. If the latter
is smaller than the former, we determine that the entrepreneur is optimistic.
Let EU(d|x) be the unbiased probability that the entrepreneur will be denied a loan if she
applies for it conditional on a vector of firm characteristics and credit conditions x. Similarly, let
ES(d|x) be the expected value of entrepreneur I’s assessment on the probability that she will be
denied if she applies for a loan conditional on the same vector of firm characteristics and credit
conditions x, taken under their subjective probability distribution, denoted by ES( ). Our measure
of optimism is the simply
OptimismI= EU(d|x)- ES(d|x).

14
Both the 1998 and 2003 Federal Reserve Board surveys ask entrepreneurs the following
question:
“During the last three years, were there times when [FIRM] needed credit, but did not
apply because it thought the application would be turned down?” Entrepreneurs’ answers to this
question are impacted by the true credit condition of the firm and also the entrepreneurs’ hubris
or level of optimism.
We use the answer to this question as our value for ES(d|x). Specifically, it is equal to 1 if
the entrepreneur’s answer to the above question is “yes”, and zero otherwise. We then use a set
of variables including firm characteristics and credit conditions to predict the realistic probability
that entrepreneurs’ application for loans will potentially be turned down. Empirically, we run a
logit regression where the dependent variable is ES(d|x) on this set of variables. The estimated
probability based on the logit regression is our value of EU(d|x). For entrepreneurs without
behavioral bias the difference EU(d|x)- ES(d|x) should be 0. For optimistic entrepreneurs, this
difference should be positive, since they overestimate the true state of their firm. It should be
noted that EU(d|x) could also differ from ES(d|x) also because of random errors that rational
entrepreneurs make. Thus, EU(d|x)- ES(d|x) could have two components: a bias and an error.
However, the error is by assumption unpredictable with the information set x and its mean should
be zero.
We also design fractional tercile ranks to take into account the possible nonlinearity of
the relation between entrepreneurial optimism and variables of our interest. First, the fractional
rank is calculated for each entrepreneur, from 0 to 1 based on our first optimism measure. Then
the fractional tercile ranks are constructed as follows:
Bottom Tercile Rank: TRank_1=min(1/3, Fractional rank)

15
Middle Tercile Rank: TRank_2=min(1/3, Fractional rank-Trank_1)
Top Tercile Rank: TRank_3=min(1/3, Fractional rank-Trank_1-Trank_2)
By design, entrepreneurs with the top tercile rank are most optimistic. This tercile
breakdown of the optimism measure allows us to differentiate between more and less optimistic
entrepreneurs. We use the above-mentioned measures of entrepreneurial optimism to empirically
test the hypotheses outlined in the previous section. We believe that this measure is superior to
some of the demographic characteristics that previous studies rely on to measure optimism. The
main reason is that demographic characteristics might proxy for a host of other things. Also, as
often happens in the empirical analysis, a subset of the demographic characteristics might have
insignificant coefficients or coefficients with opposite signs from those predicted. This makes it
difficult to interpret whether managerial optimism has a significant impact or not. Using a single
measure of optimism makes it easier to gauge statistical significance and interpret the coefficient.
4. Data and Summary Statistics
The primary source of data for this study is the Federal Reserve Board’s 1998 and 2003
SSBF data. The firms surveyed constitute a nationally representative sample of about 7,800
small businesses operating in the U.S., where a small business is defined as a non-financial, non-
farm enterprise employing fewer than 500 full-time equivalent employees.
The SSBF data provides information on each enterprise’s balance sheet, income
statement, its credit history, the firm’s characteristics, including two-digit SIC code,
organizational form, age, location, how the firm was established, and demographic
characteristics of each firm’s primary owner, including gender, age, business experience, and
education. The surveyed data also provides detailed information about each firm’s most recent

16
borrowing experience. This includes whether the firm applied for credit and for firm that applied,
whether the potential lender approved or denied the firm’s credit application, and, if the lender
extended credit, the terms of the loan.
Of the 7,801 firms surveyed by the 1998 and 2003 SSBF, we exclude firms that are
inherited or acquired as a gift or publicly traded. We require that the primary owners of firms are
responsible for daily management. Firm without assets information are also excluded. This
leaves us 6,320 firms, where 2960 firms are from the 1998 survey and the other 3360 firms are
from the 2003 survey.
[Insert Table 1 here.]
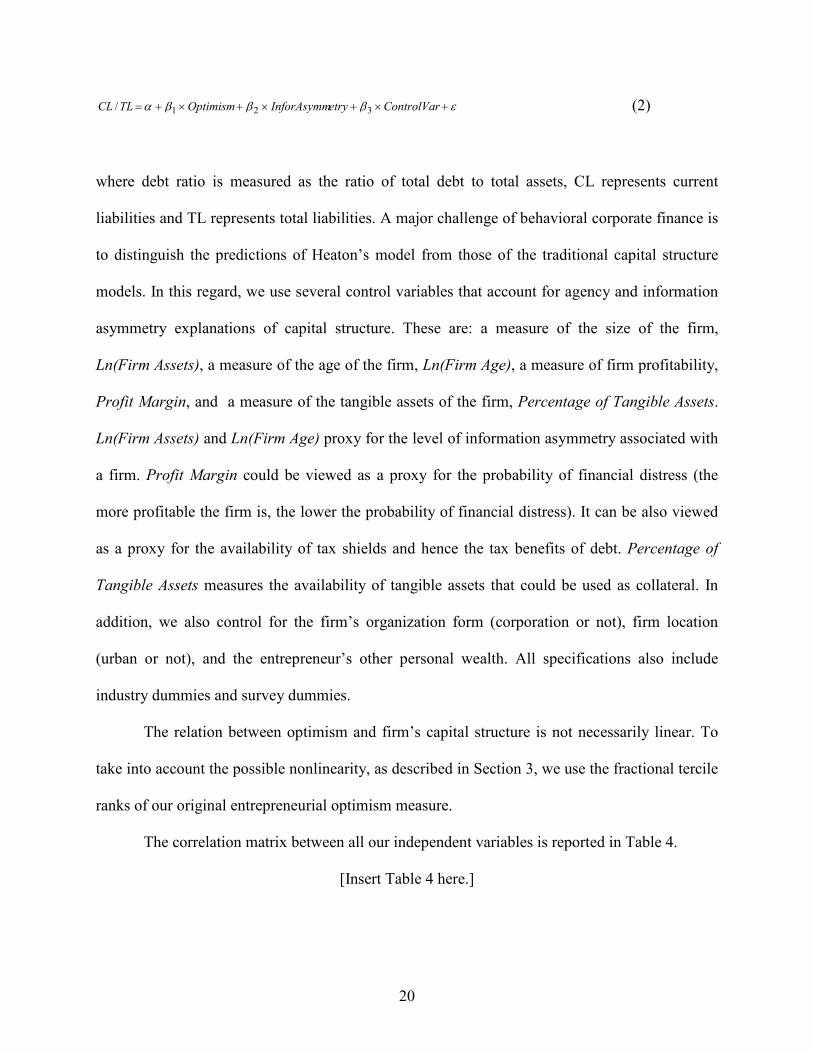
Table 1 summarizes selected characteristics of our sample. Small businesses exhibit high
debt/assets ratio. For instance, the mean debt ratio of 1998 survey firms is 210%, with a median
of 40%; the mean debt ratio of 2003 survey firms is 130%, with a median of 40%. Current
liability on average accounts for 44.5% of total liability according to the 1998 survey. The
similar measure is 42.6% based on the 2003 survey.
The mean and median ages of entrepreneurs are around 50-52. Entrepreneurs on average
have 17-20 years’ business experience. Male entrepreneurs account for 73.2% and 77.9% of the
1998 sample and the 2003 sample, respectively. More than 50% of the entrepreneurs have
college and graduate degrees.
About 26.6% of the 1998 sample and 41.9% of the 2003 sample applied for credits from
various financial institutions in last three years prior to each survey. The percentages of applied
loans that were always approved are 72.5% and 87.4%, respectively, for the 1998 and 2003
sample. For about 17.9% of the 1998 sample and 8.5% of the 2003 sample, loans that they
applied for over the past three years were always denied.

17
Panel D of Table 1 summarizes the characteristics of approved small business loans. The
mean and median sizes of loans granted for the 2003 sample are $776.1 million and 100.0
million, larger than the similar measures for the 1998 sample, which are $316.3 million and
$45.0 million. The mean and median lengths of loans for the 2003 sample are 47 months and 24
months, shorter than those for the 1998 sample, which are 53 months and 36 months. The
average loan interest rate of the 2003 sample is 6.0%, 1.6% higher than the concurrent prime
rate; while the average loan interest rate of the 1998 sample is 9.2%, 1.0% higher than the
concurrent prime rate. About 53.9% of the loans require certain type of collateral for the 2003
sample, lower than the same measure for the 1998 sample, which is 60.6%. The mean and
median distances between the firm and the lender for the 1998 sample are 18.4 miles and 2
miles, while the same measures increase to 56.8 miles and 5 miles in the 2003 survey. On the
other hand, the length of the relationship between the firm and the lender appear to be longer in
the 2003 survey than in the 1998 survey. For instance, the mean length of the relationship is 60
months in the former, while 36 months in the latter.
5. Empirical Analysis
5.1. Measures of Entrepreneurial Optimism
To measure entrepreneurial optimism, as described in Section 3, we start with a set of
logit regressions, where the dependent variable is a dummy equal to one if the entrepreneur did
not apply for a loan because he or she is afraid that the application will be turned down, even
though the firm needs credit, and zero otherwise. Our independent variables are categorized into
three groups. The first group of variables includes the Dun & Bradstreet (DB) credit score

18
rankings.7 The higher the ranking, the lower the credit risk of the firm. The second group of
explanatory variables consists of selected characteristics of firms that potentially will impact
whether financiers will grant the applier a loan or not. These variables include firm size,
measured as the natural logarithm of assets, firm age, profit margin, the ratio of tangible assets to
total assets, the ratio of debt to total assets, a dummy variable indicating whether the firm is
organized as a corporation, and a dummy variable indicating whether the firm is located in the
urban areas. The third group of variables includes two indicator variables related to the
bankruptcy history of the firm and the owner. If the firm or the owner had been bankrupt before,
the indicator variables are set to equal to 1, and 0 otherwise. An additional control variable is the
owners’ other personal wealth, excluding the value of the small business. We also include
industry dummies and survey year dummy in all specifications.
[Insert Table 2 here.]
Regressions in Table 2 show that DB scores, firm size, firm age, urban firms, and
entrepreneur’s other personal wealth are negatively associated with our dependent variables,
while corporation, the percentage of tangible assets, and the bankruptcy history of the owner and
the firm are positively correlated to our dependent variables.
We then estimate the predicted likelihood that the firm’s loan application will be denied
using the coefficients estimated in specification 3 as reported in Table 2. This predicted
likelihood indicates to what extent the entrepreneurs were discouraged to apply for a loan by
objective factors such as the firm’s credit risk and level of information asymmetry. The
difference between the actual value of our dependent variable and the predicted likelihood, thus,
7 If the original Dun & Bradstreet credit scores fall in the range of 0-10, the SSBF DB score ranking is 1; if the score is 11-25, then the ranking is 2; if the score is 26-50, then the ranking is 3; if the score is 51-75, then the ranking is 4; if the score is 76-90, then the ranking is 5; if the score is 91-100, the ranking is 6.

19
measures the contribution of the entrepreneur’s subjective assessment to the above-mentioned
behavior. We use the negative of this difference as our measure of entrepreneurial optimism.
5.2. The Demographics of Optimism
To check the robustness of our optimism measure, we relate it to various demographic
characteristics of entrepreneurs. The existing literatures have shown that gender, race, education,
and experience impact the level of optimism.8 For instance, males are typically more optimistic
than females. White entrepreneurs are found to be more optimistic than entrepreneurs from other
races. Education increases the level of optimism, while experience tends to reduce optimism
because individuals learn from experience to achieve less biased subjective assessment.
[Insert Table 3 here.]
Consistent with the existing literature, we show in Table 3 that male and white
entrepreneurs with higher level of education are more optimistic, while the experience of the
entrepreneur is negatively associated with our optimism measure.
5.3. Entrepreneurial Optimism and Small Business Capital Structure
Both De Meza and Southey (1996) and Heaton (2002) suggest that optimistic
entrepreneurs prefer debt to equity. Landier and Thesmar (2009) propose that optimists self-
select into short-term debt. We empirically examine these two predictions using the 1998 and
2003 SSBF data in this section. The specifications are presented as following.
εβββα +×+×+×+= ControlVaretryInforAsymmOptimismDebtRatio 321 (1)
8 See, for example, Frank (1988), Lundeberg, Fox, and Puncochar (1994), Barber and Odean (2001), Shane (2007), and Fraser and Greene (2008).
20
εβββα +×+×+×+= ControlVaretryInforAsymmOptimismTLCL 321/ (2)
where debt ratio is measured as the ratio of total debt to total assets, CL represents current
liabilities and TL represents total liabilities. A major challenge of behavioral corporate finance is
to distinguish the predictions of Heaton’s model from those of the traditional capital structure
models. In this regard, we use several control variables that account for agency and information
asymmetry explanations of capital structure. These are: a measure of the size of the firm,
Ln(Firm Assets), a measure of the age of the firm, Ln(Firm Age), a measure of firm profitability,
Profit Margin, and a measure of the tangible assets of the firm, Percentage of Tangible Assets.
Ln(Firm Assets) and Ln(Firm Age) proxy for the level of information asymmetry associated with
a firm. Profit Margin could be viewed as a proxy for the probability of financial distress (the
more profitable the firm is, the lower the probability of financial distress). It can be also viewed
as a proxy for the availability of tax shields and hence the tax benefits of debt. Percentage of
Tangible Assets measures the availability of tangible assets that could be used as collateral. In
addition, we also control for the firm’s organization form (corporation or not), firm location
(urban or not), and the entrepreneur’s other personal wealth. All specifications also include
industry dummies and survey dummies.
The relation between optimism and firm’s capital structure is not necessarily linear. To
take into account the possible nonlinearity, as described in Section 3, we use the fractional tercile
ranks of our original entrepreneurial optimism measure.
The correlation matrix between all our independent variables is reported in Table 4.
[Insert Table 4 here.]

21
The results from the debt ratio regression are presented in Table 5. As seen from the
table, we do not find significant correlation between entrepreneurial optimism and debt ratio for
the full sample. Nevertheless, we do find (Model 5) that optimism significantly and positively
increases debt ratio within the most-optimistic group (with top tercile optimism rank). The
optimism measure of the bottom and the middle tercile groups is set to 0 in regression 5. The
positive coefficient of the top tercile group here has two implications: first, the most optimistic
group has significantly higher debt ratios than the other two groups; secondly, within the most
optimistic group, the relation between optimism and debt ratio is linear and positive.
Specifically, a small firm with the most optimistic entrepreneur has a debt ratio 268% higher
than the one with the least optimistic entrepreneur assuming they are urban corporations in the
same industry, and are of the same size, age, percentage of tangible assets, and profitability.
Since our specifications control for the firms’ level of information asymmetry, this finding lends
support to the notion that the firm’s capital structure decision is not only a function of
information asymmetry, but also a function of entrepreneurial optimism. However, this latter
relation is not linear. It holds only for the most optimistic entrepreneurs.
[Insert Table 5 here.]
Some of the control variables are also significant. For example, similar to previous
findings we document that firms with smaller asset base tend to borrow less. This could be either
because they have less to offer as collateral or because smaller firms are generally more
informationally opaque and thus have higher levels of information asymmetry (or both). In
support of the asymmetric information argument, we also find that firms with lower tangible
assets tend to have lower debt ratios, although the coefficient is statistically significant only in
Model 5. In addition, larger owner wealth results in higher debt ratios. It is typical of owners to

22
provide personal commitments when a firm tries to borrow money (see Avery, Bostic, and
Samolyk (1998)) which serve as substitutes for business collateral. One could expect that the
higher the owner’s wealth, the greater her ability to provide such personal commitment. Small
firms organized as corporations are also able to borrow more.
Next, we investigate whether more optimistic entrepreneurs use more short-term debt.
Panel B of Table 5 provides the results of this analysis. Unlike the debt ratio analysis, here we
find significantly positive coefficients for all five optimism measures. Thus, more optimistic
entrepreneurs use more short-term debt. This is consistent with the findings in Landier and
Thesmar (2009) who use French survey data. The impact of optimism on small firms’ debt
maturity structure is both statistically and economically significant. Specifically, a small firm
with the most optimistic entrepreneur has a ratio of short-term debt to long-term debt about 7%
higher than one with the least optimistic entrepreneur assuming other aspects of the firms
similar. However, in contrast to Landier and Thesmar (2009), we find this relationship is not
linear. For instance, we show that the choice of debt maturity is most sensitive to the level of the
owner’s optimism for the bottom tercile small businesses (with a coefficient of 0.234), and least
sensitive for the middle tercile group (with a coefficient of 0.081).
Our findings are robust to controlling for various firm characteristics. For example, we
also find that older firms use more short-term debt, while firms with large fraction of tangible
assets and firms organized as corporations tend to use more long-term debt claims. An
interesting result from Table 6 is also the fact that higher owner wealth is associated with more
short-term debt.
5.4 Entrepreneurial Optimism and Credit Availability

23
In this section, we examine whether and how entrepreneurial optimism impacts credit
availability. We use two proxies for credit availability. The first measure is the fraction of a
firm’s trade credit that is paid late. As Petersen and Rajan (1994) argue, stretching trade credit is
a very expensive way to obtain finance, and a firm is likely to do so only when rationed by
institutional lenders. If over-optimistic entrepreneurs are more likely to be rationed, then a
positive correlation between entrepreneurial optimism and fraction of a firm’s trade credit that is
paid late is expected. The second measure is an indicator variable which is set to equal to one if
the loan for which the firm most recently applied for is approved, and 0 otherwise.9 If financiers
curtail lending to optimistic entrepreneurs, we should observe a negative association between
optimism and the likelihood of approval. Specifically, our regression models are the following:
εβββα +×+×+×+= olOtherContretryInforAsymmOptimismtPaidLateTradeCredi 321 (3)
εβββα +×+×+×+= olOtherContretryInforAsymmOptimismApproval 321 (4)
[Insert Table 6 here.]
We run tobit regressions with two-sided censoring in Panel A of Table 6 where the
dependent variables are the natural logarithm of the fraction of a firm’s trade credit that is paid
late (percentage). We use firm size, measured as the natural logarithm of assets, percentage of
tangible assets, and firm age as proxies for the level of information asymmetry. In addition, we
also control for firm profit margin, organization form (corporation or not), firm location (urban
or not), and the entrepreneur’s other personal wealth. All specifications also include industry
dummies and survey dummies.
9 In both surveys, entrepreneurs reply whether their most recently applied loans have always been approved, sometimes approved, and always denied. If the entrepreneurs reply “always denied”, then the dummy variable Approval is set to equal to 0. We also set Approval equal to 1 only when entrepreneurs reply “always approved”. The empirical results are robust in the sense that loan applications of more optimistic entrepreneurs are more likely to be approved. We did not report this set of results for briefness. They are available upon request.

24
Consistent with Petersen and Rajan (1994), we find firm age is negatively associated with
the percentage of trade credit paid late. In addition, we show that entrepreneurs’ personal wealth
is negatively related to the percentage of trade credit paid late. We find entrepreneurial optimism
is significantly and negatively associated with the percentage of trade credit paid late, suggesting
that more optimistic entrepreneurs in fact have better access to credit than less optimistic
entrepreneurs. This finding calls into question the notion that optimistic entrepreneurs are
rationed by financiers.
In Panel B of Table 6, we run logit regressions to examine whether entrepreneurial
optimism impacts the likelihood of loan approval. In addition to the control variables we use in
Panel A, we also include dummies indicating the credit risk of the firm, such as owner bankrupt
dummy, firm bankrupt dummy, and DB score ranking dummies. The coefficients of our five
optimism measures are all significantly positive, indicating financiers probably do not ration
optimistic entrepreneurs, consistent with our finding from Panel A. In addition, similar to Cole,
Goldberg, and White (2004), we find that smaller and younger firms are more likely to be denied
by financiers. Both the firms’ bankruptcy history and the entrepreneur’s bankruptcy history
increases the likelihood that their loan applications will be denied. Furthermore, we show that if
firms have too many short-term liabilities, their loan applications are more likely to be denied.
Urban firms are less likely to be denied by financiers than their rural counterparties.
Our analysis in this section shows that more optimistic entrepreneurs are not necessarily
rationed by financial lenders as they do not as often pay their trade credit late as their less
optimistic counterparts. Furthermore, we find that financiers are more likely to approve more
optimistic entrepreneurs’ loan applications.

25
5.5 Entrepreneurial Optimism and Cost of Financing
In this section, we analyze whether financial lenders curtail lending to optimistic
entrepreneurs by, for instance, requesting collateral more often, and charging a higher interest
rate. Specifically, if financial lenders curtail lending to optimistic entrepreneurs, then we expect
the loans granted to optimistic entrepreneurs are more often collateralized, and the loan interest
rate is higher. Our specifications are summarized as follows:
εββββα +×+×+×+×+= olOtherContrLoanetryInforAsymmOptimismCollateral 4321 (5)
εββββα +×+×+×+×+= olOtherContrLoanetryInforAsymmOptimismSpread 4321 (6)
where Collateral is a dummy which is equal to 1 if collateral is required for a specific loan;
finally, spread is measured as the difference between the actual interest rate charged and the
concurrent prime rate.
[Insert Table 7 here.]
In Panel A of Table 7 we run a set of logit regressions where the dependent variable is a
dummy which is set to equal to one if collateral is required for a specific loan and 0 otherwise. In
Panel B of Table 7, the dependent variable is the spread between the actual interest rate charged
and the concurrent prime rate.
The coefficients of our optimism measures are significantly and negatively associated
with the likelihood of collateral requirement, providing further evidence that financiers do not
necessarily curtail lending to optimistic entrepreneurs. Consistent with the existing literature
(see, e.g., Chan and Kanatas (1985), Stiglitz and Weiss (1986), and Besanko and Thakor (1987)),
we show that the size and length of loans are positively associated with the requirement of
collateral, while the length of the relationship between the borrower and the financier decreases

26
the likelihood of collateral request. In addition, we find if the entrepreneur was bankrupt before,
he or she is more likely to be requested to provide collateral.
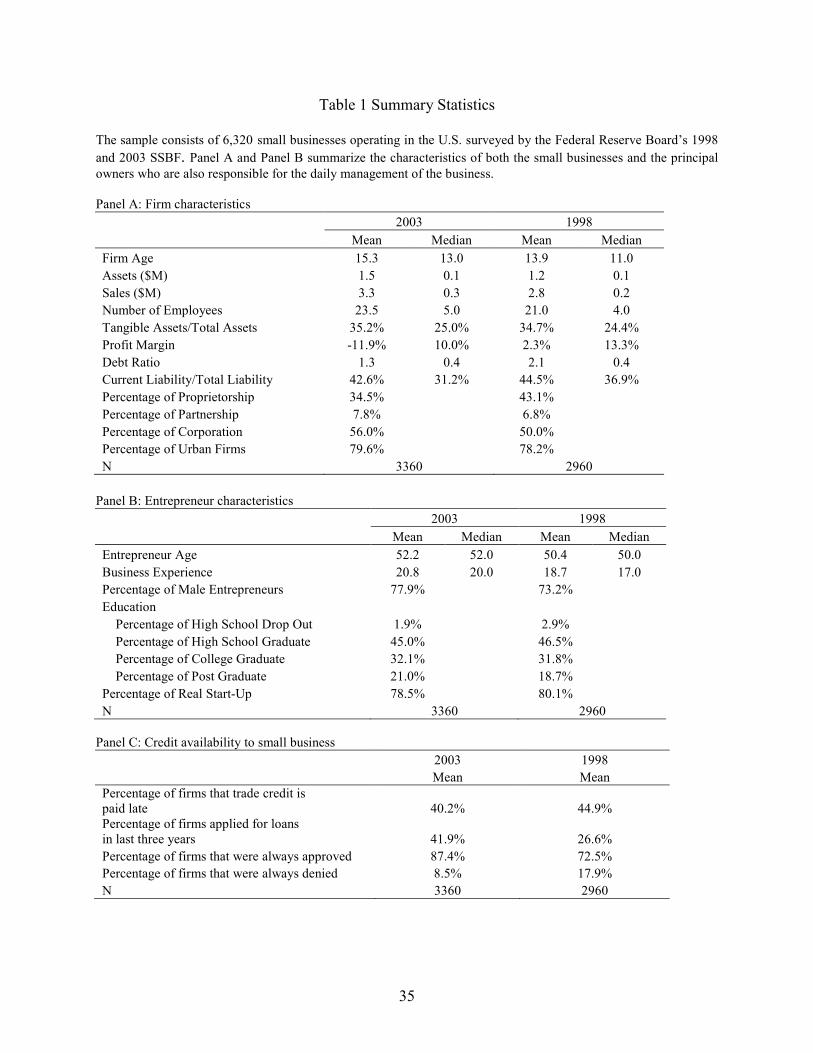
We do not find evidence that optimistic entrepreneurs are charged an interest premium by
financial lenders. In contrast, we show that optimism is negatively associated with the spread
between the actual interest rate and concurrent prime rate. Furthermore, we find larger and older
firms are charged a lower spread, consistent with existing literature. The distance between the
borrower and the financier significantly increases the spread, while the coefficients on the length
of relationship are negative, but not significant.
In summary, we show that financiers do not require collateral from optimistic
entrepreneurs more often than from the less optimistic ones; they also do not charge a higher
interest premium on loans granted to more optimistic entrepreneurs. These findings do not
support the notion that financiers respond to optimism by curtail lending. One possible
explanation for our findings is that financiers not necessarily have better knowledge about
entrepreneurs’ unrealistic prospects.
6. Conclusion
We examine the impact of entrepreneurial optimism on small businesses’ financing
decisions using the 1998 and 2003 SSBF data. With this our study contributes to the current
empirical literature on small business financing which has largely ignored managerial optimism
as a factor in firms’ financing decisions. To achieve this goal, we design an innovative measure
of optimism: we use the difference between the realistic probability that the entrepreneur’s
application for loans will be denied given the firm characteristics and credit conditions and the

27
entrepreneur’s subjective assessment on this probability as our measure of optimism. If the latter
is smaller than the former, we determine that the entrepreneur is more optimistic, and vice versa.
Using this optimism measure, we find that the heterogeneity of optimism among
entrepreneurs influences their capital structure decision. Particularly, we show that more
optimistic entrepreneurs self-select to use more debt and more short-term debt than less
optimistic ones, supporting Heaton (2000) assertion that firm capital structure is a function of
managerial optimism and Landier and Thesmar (2009) predictions that short-term debt is more
appropriate for optimistic entrepreneurs. The impact of managerial optimism is both statistically
and economically significant after controlling for factors that represent the level of information
asymmetry of the firm. Thus, our findings indicate that optimistic entrepreneurs are associated
with higher financial risk, which may impact the success/failure of small businesses. In addition,
we show the relationships between optimism and the level of debt and the choice of short-term
debt are not linear as predicted by or shown in previous theoretical and empirical works. In
particular, we find that optimism has the most significant influence on capital structure for the
group of firms with most overoptimistic entrepreneurs. On the contrary, the debt maturity
decision is most sensitive to optimism for the group of firms with the lowest level of optimism.
We further show that financiers do not curtail lending to more optimistic entrepreneurs
and optimistic entrepreneurs do not have worse credit availability than their less optimistic peers.
The results are robust to various measures we use to proxy for credit availability and cost of
borrowing. These findings suggest that financiers may not have better knowledge than
entrepreneurs about their unrealistic optimism. De Meza (2002) argue that asymmetric
information creates a systematic opportunity for low-quality firms to free-ride on financial offers
made to better firms and entrepreneurial over-optimism makes the over-lending even more

28
pronounced. This is particularly true if financiers are not always immune to optimism. Thus, our
findings that financiers do not curtail lending to more optimistic entrepreneurs imply the
possibility of over-lending.

29
Appendix: Definition of Variables
Dependent Variables
Capital Structure
Debt Ratio the ratio of total debt (both trade credit and interesting bearing loans) to total assets
CL/TL the ratio of current liabilities to total liabilities
Independent Variables
Demographic characteristics of entrepreneurs
Gender a dummy variable, which is set to equal to one if the primary owner is male, 0 if female
Education a dummy variable, which is set to equal to one if the entrepreneur is college graduate or have post-graduate degrees, and 0 otherwise
Experience number of years of experience as managing or owning a business
White a dummy variable, which is set to equal to one if the entrepreneurs is White, and 0 otherwise
Firm Information Asymmetry
Ln(Assets) natural logarithm of firm's total assets
Ln(Firm age+1) Natural logarithm of the length of ownership by the current owners plus one
Percentage of tangible assets the ratio of tangible assets (net PPE and land) to total assets
Other control variables
Profit margin the ratio of net income to sales
Corporation a dummy variable, which is set to equal to one if the business is organized as a corporation, 0 otherwise
Urban a dummy variable, which is set to equal to one if the business is located in MSA, 0 otherwise
Ln(Wealth) natural logarithm of the entrepreneur’s other personal wealth, excluding the small business
Firm bankrupt a dummy variable, which is set to equal to one if the firm was bankrupt before, and 0 otherwise
Owner bankrupt a dummy variable, which is set to equal to one if the entrepreneur was bankrupt before, and 0 otherwise
DB score dummies
If the original Dun & Bradstreet credit scores fall in the range of 0-10, the SSBF DB score ranking is 1; if the score is 11-25, then the ranking is 2; if the score is 26-50, then the ranking is 3; if the score is 51-75, then the ranking is 4; if the score is 76-90, then the ranking is 5; if the score is 91-100, the ranking is 6.
Industry dummies two digit SIC code
Year dummies the year when the loan was applied

30
References
Ang, J. S., 1991. Small Business Uniqueness and the Theory of Financial Management, The Journal of Small Business Finance 1, 1-13. Avery, R. B., R. W. Bostic, and K. A. Samolyk, 1998. The Role of Personal Wealth in Small Business Finance, Journal of Banking and Finance 22, 1019-1061. Baker, M., Ruback, R., and J. Wurgler, 2004. Behavioral corporate finance: A survey, working paper. Baker, M., and J. Wurgler, 2002. Market timing and capital structure, Journal of Finance 57, 1–32. Barber, B.M., and T. Odean, 2001. Boys will be boys: Gender, overconfidence, and common stock investments, Quarterly Journal of Economics 116, 261-292. Berger. A.N., and G.F. Udell, 1998. The economics of small business finance: The roles of private equity and debt markets in the financial growth cycle. Journal of Banking and Finance 22, 613-637. Berger, A. N., and G. F. Udell, 2002. Small business credit availability and relationship leding: then importance of bank organizational structure. The Economic Journal 112, 32-53. Berglöf, E. and E. von Thadden, 1994. Short-Term Versus Long-Term Interests: Capital Structure with Multiple Investors. The Quarterly Journal of Economics 109, 1055-1084
Bhaird, C., and B.Lucey. 2009. Determinants of capital structure in Irish SMEs. Small Business Economics. Forthcomming.
Busenitz, L., and J. Barney, 1997. Differences between entrepreneurs and managers in large organizations: Biases and heuristics in strategic decision making. Journal of Business Venturing 12, 9–30. Camerer, C., and D. Lovallo, 1999. Optimism and excess entry: an experimental approach, American Economic Review 89, 306-318. Cassar, G., 2004. The Financing of Business Start-ups, Journal of Business Venturing 19, 261-283. Cassar, G., and H. Friedman, 2007. Does overconfidence affect entrepreneurial investment? The Wharton School, University of Pennsylvania, Working paper. Cassar, G. and S. Holmes, 2003. Capital Structure and Financing of SMEs: Australian Evidence, Accounting and Finance 43, 123-147.

31
Chittenden, F., G. Hall, and P. Hutchinson, 1996. Small Firm Growth, Access to Capital Markets and Financial Structure: Review of Issues and an Empirical Investigation, Small Business Economics 8, 56-67. Cole, R., 2008. What Do We Know About the Capital Structure of Privately Held Firms? Evidence from the Surveys of Small Business Finance, unpublished working paper. Cooper, A., C. Woo, and W. Dunkelberg, 1988. Entrepreneurs' perceived chances for success, Journal of Business Venturing 3, 97-108. Cumming, D.J., 2005. Capital structure in venture finance. Journal of Corporate Finance 11, 550-585. De Meza, D., and C. Southey, 1996. The borrower’s curse: optimism, finance, and entrepreneurship, The Economic Journal 106, 375-386. Evans, D.S., and L.S. Leighton, 1989. Some empirical aspects of entrepreneurship, American Economic Review 76, 519-539. Frank, M.Z., 1988. An intertemporal model of industrial exit. Quarterly Journal of Economics 103, 333–44. Frank, M.Z., and V.K. Goyal, 2003. Testing the pecking order theory of capital structure, Journal of Financial Economics 67, 217–248. Frank, M.Z., and V.K. Goyal, 2007. Capital structure decisions: What factors are reliably important?,unpublished working paper. Fraser, S., and F.J. Greene, 2006. The effects of experience on entrepreneurial optimism and uncertainty, Economica 73, 169-192. Gertler, M., and S. Gilchrist, 1994. Monetary Policy, Business Cycle and the Behavior of Small Business Firms, Quarterly Journal of Economics 109, 309-340. Gilovich, T., D. Griffin, and D. Kahneman, eds., 2002. Heuristics and Biases: The psychology of intuitive judgment, (Cambridge, UK: Cambridge University Press). Graham, J.R., and C. Harvey, 2001. The theory and practice of corporate finance: evidence from the field, Journal of Financial Economics 60, 187–243. Hackbarth, D., 2008. Managerial traits and capital structure decisions. Journal of Financial and Quantitative Analysis 43, 843-881. Hall, G., P. Hutchinson, and N. Michaelas, 2004. Determinants of the Capital Structures of European SMEs, Journal of Business Finance & Accounting 31, 711-728.

32
Hamilton, B. 2000. Does Entrepreneurship Pay? An Empirical Analysis of the Returns to Self-Employment. Journal of Political Economy 108:604–30. Harris, M., and A. Raviv, 1991. The theory of capital structure, Journal of Finance 46, 297–356. Hart, O., and J. Moore, 1994. A theory of debt based on the inalienability of human capital, Quarterly Journal of Economics 109, 841–879. Heaton, J.B., 2002. Managerial optimism and corporate finance, Financial Management 31 33-45. Heyman, D., M. Deloof, and H. Ooghe, 2008. The Financial Structure of Private Held Belgian Firms, Small Business Economics 30, 301-313. Hutchinson, R. W., 1995. The capital structure and investment decisions of the small owner-managed firm: Some exploratory issues. Small Business Economics 7, 231-239
Jensen, M.C., 1986. Agency costs of free cash flow, corporate finance, and takeovers, American Economic Review 76, 323–329. Jensen, M.C., and W.H. Meckling, 1976. Theory of the firm: managerial behavior, agency costs and ownership structure, Journal of Financial Economics 3, 305–360. Jordan, J., J. Lowe, and P. Taylor, 1998. Strategy and Financial Policy in UK Small Firms, Journal of Business Finance & Accounting 25, 1-27. Kahneman, D., and A. Tversky, eds., 2000. Choices, Values, and Frames, (Cambridge, UK: Cambridge University Press). Keasey, K., and R. Watson, 1987. Non-financial Symptoms and the Prediction of Small Company Failure: A Test of Argenti's Hypothesis. Journal of Business Finance & Accounting 14, 335-354. Landier, A., and D. Thesmar, 2009. Financial contracting with optimistic entrepreneurs: theory and evidence. Review of Financial Studies 22, 117-150. Leary, M.T., and M.R. Roberts, 2005. Do firms rebalance their capital structures?, Journa of Finance 60, 2575–2619. Lopez-Gracia, J. and C. Aybar-Arias, 2000. An Empirical Approach to the Financial Behaviour of Small and Medium Sized Companies, Small Business Economics 14, 55-63. Lowe, J., J. McKenna, and G. E. Tibbits. 1990. Small Firm Growth and Failure : Public Policy Issues and Practical Problems, in K. M. Renfrew and R. C. McCosker (eds), The Growing Small Business, Proceedings of the Fifth National Small Business Conference, 175-190.

33
Lundeberg, M.A., and P.W. Fox, and J. Punccohar, 1994. Highly confident but wrong: Gender differences and similarities in confidence judgments, Journal of Educational Psychology 86, 114-121. Mackay, P., and G.M. Phillips, 2005. How does industry affect firm financial structure?, Review of Financial Studies 18, 1433–1466. Malmendier, U., and G. Tate, 2005. CEO optimism and corporate investment, Journal of Finance 60, 2661-2700. Malmendier, U., and G. Tate, 2008. Who makes acquisitions? CEO overconfidence and the market’s reaction, Journal of Financial Economics 89, 20-43. Michaelas, N., F. Chittenden, and P. Poutziouris, 1999. Financial Policy and Capital Structure Choice in UK SMEs: Empirical Evidence from Company Panel Data, Small Business Economics 12, 113-130. Mishra, C. S. and D. L. McConaughy, 1999. Founding Family Control and Capital Structure: The Risk of Loss of Control and the Aversion to Debt, Entrepreneurship Theory and Practice 23, 53-64. Moskovitz, T., and A. Vissing-Jorgensen. 2002. The Private Equity Puzzle. American Economic Review 92: 745–78. Myers, S.C., 1984. The capital structure puzzle, Journal of Finance 39, 575–592. Myers, S., and N. Majluf, 1984. Corporate financing and investment decisions when firms have information that investors do not have. Journal of Financial Economics 13, 187-221. Perloff, L. S., and B. K. Fetzer, 1986. Self-other judgments and perceived vulnerability to victimization, Journal of Personality and Social Psychology 50, 502-510. Peterson, R., and J. Shulman, 1987. Capital Structure of Growing Small Firms: A 12-Country Study on Becoming Bankable. International Small Business Journal 5, Petit, R., and R. Singler, 1985. Small Business Finance: A Research Agenda. Financial Management, 47-60. Pinfold, J., 2001. The expectations of new business founders, Journal of Small Business Management 39, 279-285. Prince, M., 1993. Women, men, and money styles, Journal of Economic Psychology 14,175-182. Romano, C. A., G. A. Tanewski and K. X. Smyrnios, 2001. Capital structure decision making: A model for family business. Journal of Business Venturing 13, 285-310.

34
Shane, S., 2007. The illusions of entrepreneurship, Yale University Press, New Heaven & London. Shyam-Sunder, L., and S.C. Myers, 1999. Testing static tradeoff against pecking order models of capital structure, Journal of Financial Economics 51, 219–244. Stein, J. C., 2003. Agency, information and corporate investment, in George Constantinides, Milton Harris, Rene Stulz, eds., Handbook of the Economics of Finance. Amsterdam: North-Holland. Storey, D., R. Watson, and P. Wynarczyk. 1987. FastGrowth Small Businesses. A Study of 40 Small Firms in North East England. Research Paper No. 67 (London Department of Employment). Van Der Wijst, N. and R. Thurik , 1993. Determinants of Small Firm Debt Ratios: An Analysis of Retail Panel Data, Small Business Economics 5, 55-65. Taylor, S. E., 1989. Positive Illusions: Creative self deception and the healthy mind. New York: Basic Books. Titman, S., and R. Wessels, 1988. The determinants of capital structure choice, Journal of Finance 43, 1–21. Weinstein, N. D., 1980. Unrealistic optimism about future life-events. Journal of Personality and Social Psychology 39, 806-820.
35
Table 1 Summary Statistics The sample consists of 6,320 small businesses operating in the U.S. surveyed by the Federal Reserve Board’s 1998
and 2003 SSBF. Panel A and Panel B summarize the characteristics of both the small businesses and the principal
owners who are also responsible for the daily management of the business. Panel A: Firm characteristics
2003 1998
Mean Median Mean Median
Firm Age 15.3 13.0 13.9 11.0
Assets ($M) 1.5 0.1 1.2 0.1
Sales ($M) 3.3 0.3 2.8 0.2
Number of Employees 23.5 5.0 21.0 4.0
Tangible Assets/Total Assets 35.2% 25.0% 34.7% 24.4%
Profit Margin -11.9% 10.0% 2.3% 13.3%
Debt Ratio 1.3 0.4 2.1 0.4
Current Liability/Total Liability 42.6% 31.2% 44.5% 36.9%
Percentage of Proprietorship 34.5% 43.1%
Percentage of Partnership 7.8% 6.8%
Percentage of Corporation 56.0% 50.0%
Percentage of Urban Firms 79.6% 78.2%
N 3360 2960
Panel B: Entrepreneur characteristics
2003 1998
Mean Median Mean Median
Entrepreneur Age 52.2 52.0 50.4 50.0
Business Experience 20.8 20.0 18.7 17.0
Percentage of Male Entrepreneurs 77.9% 73.2%
Education
Percentage of High School Drop Out 1.9% 2.9%
Percentage of High School Graduate 45.0% 46.5%
Percentage of College Graduate 32.1% 31.8%
Percentage of Post Graduate 21.0% 18.7%
Percentage of Real Start-Up 78.5% 80.1%
N 3360 2960
Panel C: Credit availability to small business
2003 1998
Mean Mean
Percentage of firms that trade credit is paid late 40.2% 44.9% Percentage of firms applied for loans in last three years 41.9% 26.6%
Percentage of firms that were always approved 87.4% 72.5%
Percentage of firms that were always denied 8.5% 17.9%
N 3360 2960

36
Panel D: Characteristics of most recently approved loans
2003 1998
Mean Median Mean Median
Amount Applied ($000) 780.4 100.0 307.7 45.6
Amount Approved ($000) 776.1 100.0 316.3 45.0
Amount Approved/Assets 87.0% 26.6% 136.0% 20.8%
Loan Length (months) 47.0 24.0 52.8 36.0
Loan Interest Rate 6.0% 5.9% 9.2% 9.0%
Relationship with Lender (months) 103.7 60.0 67.2 36.0
Distance from lender (miles) 56.8 5.0 18.4 2.0
Collateralized 53.9% 60.6%
Percentage of Fixed Interest Loans 46.7% 66.2%
Loan Types
Percentage of Line of Credit 62.3% 33.3%
Percentage of Capital Lease 1.1% 5.3%
Percentage of Mortgage 10.4% 10.5%
Percentage of Vehicle Loans 10.5% 17.2%
Percentage of Equipment Loans 10.5% 19.1%
Percentage of Other Loans 7.3% 14.6%
N 1289 645

37
Table 2 Measure of Entrepreneurial Optimism The dependent variable of the logit regressions is an indicator variable which is equal to one if over the last three years (prior to each survey), the entrepreneur did not apply for credit because he/she was afraid of being turned down even though the firm needed funding, and 0 otherwise. We measure the predicted probability that entrepreneur’s loan application will potentially been turned down given a set of objective factors (for instance, the firm’s credit conditions and information asymmetry) and the entrepreneur’s subjective assessment of this probability as our measure of optimism. ***, **, and * denote statistical significance at 1%, 5%, and 10% confidence level, respectively.
1 2 3
Coefficient p-value Coefficient p-value Coefficient p-value
Intercept -0.737*** 0.000 1.487*** 0.000 0.469* 0.082
DB Score
DB_Score=2 -0.617*** 0.000 -0.836*** 0.000 -0.795*** 0.000
DB_Score=3 -0.482*** 0.000 -0.784*** 0.000 -0.696*** 0.000
DB_Score=4 -0.355*** 0.004 -0.591*** 0.000 -0.509*** 0.000
DB_Score=5 -0.523*** 0.000 -0.623*** 0.000 -0.561*** 0.000
DB_Score=6 -1.549*** 0.000 -1.451*** 0.000 -1.273*** 0.000
Firm Characteristics
Ln(Assets) -0.121*** 0.000 -0.028 0.143
Ln(Firm Age) -0.405*** 0.000 -0.317*** 0.000
Profit Margin -0.008 0.250 -0.010 0.298
Tangible Assets 0.595*** 0.000 0.462*** 0.000
Debt Ratio 0.001 0.545 0.002 0.218
Corporation 0.079 0.295 0.190** 0.014
Urban 0.158 0.062 -0.247*** 0.004
Bankruptcy History
Firm Bankrupt 1.310*** 0.001
Owner Bankrupt 1.575*** 0.000
Owner Personal Wealth -1.301*** 0.000
Industry Dummies Yes Yes Yes
2003 Survey Yes Yes Yes
N 6320 6231 6230
Pseudo R2 (%) 2.68 6.18 10.41

38
Table 3 The Demographics of Optimism In this table, we relate this optimism measure to various demographics of entrepreneurs. The dependent variable is the optimism measure estimated based on specification 3 in Table 2. ***, **, and * denote statistical significance at 1%, 5%, and 10% confidence level, respectively.
(1) (2) (3) (4)
Intercept -0.025*** -0.042*** -0.052*** -0.052***
(0.008) (0.000) (0.000) (0.000)
Male 0.034*** 0.035*** 0.033*** 0.037***
(0.002) (0.002) (0.003) (0.001)
White 0.043*** 0.044*** 0.044***
(0.000) (0.000) (0.000)
Education 0.020** 0.020**
(0.031) (0.033)
Ln(Experience) -0.012*
(0.083)
N 6230 6230 6230 6230
Adjusted R-square (%) 0.13 0.43 0.49 0.52

39
Tab
le 4
Corr
elat
ion M
atri
x
O
pti
mis
m
Op
tim
ism
F
ract
ion
al
Ran
k
Tra
nk_
1
Tra
nk_
2
Tra
nk_
3
Ln
(Ass
ets)
L
n(F
irm
A
ge+
1)
Per
cen
tage
of
Tan
gib
le
Ass
ets
Pro
fit
Mar
gin
C
orp
ora
tion
Urb
an
Op
tim
ism
Fra
ctio
nal
R
ank
0.8
45
(0
.00
0)
Tra
nk_
1
0.9
54
0.7
78
(0
.00
0)
(0.0
00
)
Tra
nk_
2
0.7
10
0.9
46
0.6
56
(0
.00
0)
(0.0
00
) (0
.00
0)
Tra
nk_
3
0.4
97
0.7
78
0.3
37
0.6
57
(0
.00
0)
(0.0
00
) (0
.00
0)
(0.0
00
)
Ln
(Ass
ets)
-0
.00
0
-0.2
02
-0.0
23
-0.2
48
-0.2
24
(1
.00
0)
(0.0
00
) (0
.06
4)
(0.0
00
) (0
.00
0)
Ln
(Fir
m A
ge+
1)
-0.0
00
-0.2
42
0.0
15
-0.2
50
-0.3
79
0.2
57
(1
.00
0)
(0.0
00
) (0
.24
6)
(0.0
00
) (0
.00
0)
(0.0
00
)
Per
cen
tage
of
Tan
gib
le
Ass
ets
-0.0
00
0.0
91
-0.0
11
0.0
90
0.1
25
0.1
04
0.0
02
(1
.00
0)
(0.0
00
) (0
.37
4)
(0.0
00
) (0
.00
0)
(0.0
00
) (0
.84
7)
Pro
fit
Mar
gin
-0
.00
0
0.0
09
0.0
13
0.0
15
0.0
84
0.0
21
0.0
18
0.0
11
(1
.00
0)
(0.4
70
) (0
.31
9)
(0.2
49
) (0
.51
4)
(0.1
00
) (0
.16
0)
(0.0
00
)
Co
rpora
tion
0.0
00
-0.0
84
-0.0
18
-0.1
19
-0.0
78
0.4
37
0.1
08
-0.1
03
-0.0
21
(1
.00
0)
(0.0
00
) (0
.16
1)
(0.0
00
) (0
.00
0)
(0.0
00
) (0
.00
0)
(0.0
00
) (0
.10
3)
Urb
an
-0.0
00
0.0
31
-0.0
13
0.0
19
0.0
84
-0.0
16
-0.0
51
-0.1
23
-0.0
09
0.0
73
(1
.00
0)
(0.0
16
) (0
.30
3)
(0.1
29
) (0
.00
0)
(0.1
99
) (0
.00
0)
(0.0
00
) (0
.46
2)
(0.0
00
)
Ln
(Ow
ner
Wea
lth
) 0
.00
0
-0.3
67
-0.0
74
-0.4
43
-0.3
29
0.5
09
0.2
70
-0.0
75
0.0
02
0.2
97
0.0
70
(1
.00
0)
(0.0
00
) (0
.00
0)
(0.0
00
) (0
.00
0)
(0.0
00
) (0
.00
0)
(0.0
00
) (0
.85
6)
(0.0
00
) (0
.00
0)

40
Table 5 Entrepreneurial Optimism and Capital Structure This table represents the regression analysis of the relation between entrepreneurial optimism and the capital structure of the small businesses. In Panel A, we examine whether optimism impacts the Total Debt/Total Assets ratio. In Panel B, we analyze whether optimism impacts the Current Liabilities/Total Liabilities. ***, **, * denote statistical significance at 1%, 5%, and 10% confidence level, respectively. A: Total Debt/Total Assets
(1) (2) (3) (4) (5)
Intercept 17.297*** 17.117*** 17.868*** 17.604*** 15.814***
(0.000) (0.000) (0.000) (0.000) (0.000)
Optimism -0.001
(0.998)
Optimism Fractional Rank 0.242
(0.783)
TRank_1 -2.166
(0.365)
TRank_2 -1.032
(0.565)
TRank_3 8.129***
(0.004)
Ln (Owner Wealth) 1.692*** 1.731*** 1.653*** 1.586*** 2.003***
(0.001) (0.001) (0.002) (0.004) (0.000)
Ln (Assets) -1.397*** -1.396*** -1.395*** -1.399*** -1.371***
(0.000) (0.000) (0.000) (0.000) (0.000)
Ln (Firm Age+1) -0.295 -0.282 -0.284 -0.319 -0.005
(0.346) (0.346) (0.364) (0.312) (0.988)
Profit Margin 0.001 0.001 0.001 0.001 0.001
(0.978) (0.982) (0.970) (0.968) (0.981)
Percentage of Tangible Assets -1.004 -1.022 -1.017 -0.969 -1.352*
(0.162) (0.156) (0.157) (0.179) (0.063)
Corporation 2.054*** 2.048*** 2.054*** 2.067*** 1.941***
(0.000) (0.000) (0.000) (0.000) (0.000)
Urban 0.408 0.398 0.403 0.428 0.209
(0.477) (0.489) (0.482) (0.457) (0.717)
Industry Dummies Yes Yes Yes Yes Yes
Survey Dummies Yes Yes Yes Yes Yes
N 6230 6230 6230 6230 6230
Adjusted R-Square (%) 2.28 2.28 2.29 2.29 2.29

41
Panel B: Current Liability/Total Liability
(1) (2) (3) (4) (5)
Intercept 0.480*** 0.428*** 0.417*** 0.449*** 0.447***
(0.000) (0.000) (0.000) (0.000) (0.000)
Optimism 0.061***
(0.000)
Optimism Fractional Rank 0.066***
(0.001)
TRank_1 0.234***
(0.000)
TRank_2 0.081**
(0.047)
TRank_3 0.146**
(0.028)
Ln (Owner Wealth) 0.026** 0.036*** 0.030** 0.033*** 0.030**
(0.026) (0.003) (0.010) (0.007) (0.011)
Ln (Assets) -0.005 -0.004 -0.005* -0.004 -0.004
(0.104) (0.146) (0.091) (0.162) (0.192)
Ln (Firm Age+1) 0.049*** 0.053*** 0.048*** 0.051*** 0.054***
(0.000) (0.000) (0.000) (0.000) (0.000)
Percentage of Tangible Assets -0.339*** -0.344*** -0.339*** -0.343*** -0.345***
(0.000) (0.000) (0.000) (0.000) (0.000)
Profit Margin 0.001 0.001 0.001 0.001 0.001
(0.124) (0.141) (0.137) (0.139) (0.131)
Corporation -0.032*** -0.033*** -0.032*** -0.032*** -0.033***
(0.009) (0.007) (0.008) (0.008) (0.007)
Urban 0.025* 0.022 0.025* 0.023* 0.021
(0.059) (0.092) (0.055) (0.079) (0.107)
Industry Dummies Yes Yes Yes Yes Yes
Survey Dummies Yes Yes Yes Yes Yes
N 4930 4930 4930 4930 4930
Adjusted R-Square (%) 10.55 10.39 10.55 10.27 10.28

42
Table 6 Entrepreneurial Optimism and Credit Availability Panel A summarizes the tobit regressions with two-sided censoring of percentage of trade credit paid late (in natural logarithm format). In Panel B, we use the logit regression to analyze whether entrepreneurial optimism impacts the likelihood that a loan application is approved or denied. ***, **, and * denote statistical significance at the 1%, 5%, and 10% confidence level. Panel A: Percentage of Trade Credit Paid Late
(1) (2) (3) (4) (5)
Intercept -1.074** 0.720 1.053** 0.328 -0.261
(0.033) (0.166) (0.038) (0.527) (0.619)
Optimism -2.034***
(0.000)
Optimism Fractional Rank -2.184***
(0.000)
TRank_1 -7.871***
(0.000)
TRank_2 -3.607***
(0.000)
TRank_3 -1.616**
(0.044)
Ln (Owner Wealth) -0.633*** -0.955*** -0.782*** -0.961*** -0.650***
(0.000) (0.000) (0.000) (0.000) (0.000)
Ln (Assets) 0.127*** 0.105*** 0.132*** 0.097** 0.085**
(0.001) (0.006) (0.000) (0.011) (0.027)
Ln (Firm Age+1) -0.166* -0.281*** -0.143* -0.254*** -0.220**
(0.054) (0.002) (0.099) (0.004) (0.018)
Percentage of Tangible Assets -0.017 0.111 -0.036 0.083 -0.018
(0.937) (0.609) (0.865) (0.704) (0.935)
Profit Margin 0.010 0.011 0.011 0.013 0.011
(0.666) (0.669) (0.640) (0.589) (0.644)
Debt Ratio 0.001 0.001 0.001 0.001 0.001
(0.741) (0.793) (0.849) (0.889) (0.895)
CL/TL 0.135 0.060 0.136 0.010 -0.026
(0.441) (0.735) (0.438) (0.956) (0.885)
Corporation 0.217 0.259* 0.231 0.239 0.232
(0.134) (0.079) (0.110) (0.106) (0.120)
Urban 0.231 0.332** 0.229 0.321** 0.289*
(0.134) (0.034) (0.136) (0.041) (0.070)
Industry Dummies Yes Yes Yes Yes Yes
Survey Dummies Yes Yes Yes Yes Yes
N 3624 3624 3624 3624 3624
Adjusted R-Square (%) 2.28 1.53 2.32 1.25 0.78

43
Panel B: Likelihood of loan approval
(1) (2) (3) (4) (5)
Intercept -0.861 -3.501*** -3.842*** -3.026*** -3.189***
(0.256) (0.000) (0.000) (0.000) (0.000)
Optimism 2.529***
(0.000)
Optimism Fractional Rank 3.569***
(0.000)
TRank_1 9.917***
(0.000)
TRank_2 7.289***
(0.000)
TRank_3 8.263***
(0.000)
Ln (Owner Wealth) 0.921*** 1.319*** 1.082*** 1.507*** 1.510***
(0.000) (0.000) (0.000) (0.000) (0.000)
Ln (Assets) 0.202*** 0.213*** 0.210*** 0.215*** 0.226***
(0.000) (0.000) (0.000) (0.000) (0.000)
Ln (Firm Age+1) 0.414*** 0.487*** 0.433*** 0.440*** 0.567***
(0.001) (0.000) (0.000) (0.000) (0.000)
Percentage of Tangible Assets -0.589** -0.680** -0.664** -0.603** -0.777***
(0.026) (0.010) (0.012) (0.022) (0.002)
Profit Margin 0.031 0.029 0.035 0.027 0.030
(0.150) (0.165) (0.104) (0.198) (0.152)
Debt/Assets -0.007 -0.007 -0.006 -0.006 -0.008
(0.216) (0.213) (0.245) (0.318) (0.162)
Current Liability/Total Debt -1.030*** -0.962*** -1.024*** -0.876*** -0.827***
(0.000) (0.000) (0.000) (0.000) (0.000)
Corporation 0.061 -0.005 0.034 -0.021 -0.072
(0.748) (0.977) (0.857) (0.912) (0.688)
Urban -0.450** -0.523** -0.466** -0.508** -0.647***
(0.044) (0.018) (0.037) (0.020) (0.002)
Owner Bankrupt -1.633*** -1.141** -1.385*** -0.888* -1.396***
(0.001) (0.026) (0.003) (0.078) (0.006)
Firm Bankrupt -1.746** -1.506** -1.600** -1.284* -1.751**
(0.016) (0.049) (0.024) (0.082) (0.021)
DB Score Dummies Yes Yes Yes Yes Yes
Industry Dummies Yes Yes Yes Yes Yes
Survey Dummies Yes Yes Yes Yes Yes
N 2067 2067 2067 2067 2067
Pseudo R-Square (%) 32.04 30.09 32.06 28.43 22.23

44
Table 7 Entrepreneurial Optimism and Cost of Borrowing In Panel A, we examine whether financial lenders curtail lending to optimistic entrepreneurs by require collateral more often using logit regressions. The dependent variable is equal to one if collateral is required for a specific loan, and 0 otherwise. In Panel B, we analyze whether financial lenders curtail lending to optimistic entrepreneurs by charging a higher interest rate. The dependent variable is the spread between the actual interest rate charged on the most recently applied loans and the concurrent prime rate. ***, **, and * denote statistical significance at the 1%, 5%, and 10% confidence level. Panel A: Collateral
(1) (2) (3) (4) (5)
Intercept -4.353*** -3.699*** -3.936*** -3.819*** -3.892***
(0.000) (0.000) (0.000) (0.000) (0.000)
Optimism -0.498***
(0.002)
Optimism Fractional Rank -0.708***
(0.004)
TRank_1 -1.574***
(0.008)
TRank_2 -1.208***
(0.000)
TRank_3 -1.607**
(0.044)
Control Variables
Ln (Owner Wealth) -0.286*** -0.378*** -0.319*** -0.382*** -.309***
(0.008) (0.001) (0.004) (0.001) (0.005)
Ln (Assets) 0.019 0.014 0.020 0.013 0.010
(0.664) (0.753) (0.650) (0.772) (0.818)
Ln (Firm Age+1) 0.104 0.063 0.112 0.069 0.060
(0.211) (0.459) (0.177) (0.415) (0.492)
Percentage of Tangible Assets 0.211 0.263 0.204 0.251 0.273
(0.273) (0.176) (0.288) (0.195) (0.162)
Profit Margin -0.080 -0.082 -0.079 -0.080 -0.082
(0.438) (0.425) (0.445) (0.434) (0.424)
Debt/Assets -0.007 -0.006 -0.007 -0.006 -0.005
(0.518) (0.534) (0.499) (0.517) (0.581)
Current Liability/Total Debt 0.061 0.050 0.060 0.043 0.043
(0.729) (0.775) (0.731) (0.808) (0.806)
Corporation -0.091 -0.077 -0.086 -0.077 -0.077
(0.501) (0.571) (0.528) (0.571) (0.571)
Urban -0.154 -0.125 -0.153 -0.123 -0.117
(0.255) (0.356) (0.256) (0.362) (0.389)
Owner Bankrupt 1.190* 1.239* 1.120 1.189* 1.324*
(0.098) (0.086) (0.120) (0.099) (0.068)
Firm Bankrupt -0.184 -0.253 -0.280 -0.325 -0.202
(0.849) (0.796) (0.773) (0.739) (0.836)
Loan Size 0.433*** 0.431*** 0.433*** 0.428*** 0.430***
(0.000) (0.000) (0.000) (0.000) (0.000)
Loan Length 0.118* 0.118* 0.117* 0.117* 0.113*
(0.069) (0.069) (0.071) (0.072) (0.081)

45
Ln (Distance) 0.014 0.016 0.015 0.019 0.020
(0.721) (0.686) (0.707) (0.631) (0.625)
Ln (Relationship) -0.074** -0.073** -0.075** -0.072** -0.075**
(0.029) (0.031) (0.027) (0.034) (0.026)
DB Score Dummies Yes Yes Yes Yes Yes
Loan Type Dummies Yes Yes Yes Yes Yes
Industry Dummies Yes Yes Yes Yes Yes
Survey Dummies Yes Yes Yes Yes Yes
N 1741 1741 1741 1741 1741
Pseudo R-Square (%) 14.46 14.41 14.34 14.31 14.21
46
Panel B: Spread over prime-rate
(1) (2) (3) (4) (5)
Intercept 5.779*** 6.918*** 6.631*** 6.745*** 6.404***
(0.000) (0.000) (0.000) (0.000) (0.000)
Optimism -0.897***
(0.000)
Optimism Fractional Rank -1.222***
(0.000)
TRank_1 -3.225***
(0.000)
TRank_2 -2.108***
(0.000)
TRank_3 -1.853**
(0.032)
Control Variables
Ln (Owner Wealth) -0.336*** -0.493*** -0.409*** -0.500*** -0.345***
(0.004) (0.000) (0.001) (0.000) (0.004)
Ln (Assets) -0.121** -0.131*** -0.119** -0.134*** -0.135***
(0.010) (0.006) (0.012) (0.005) (0.005)
Ln (Firm Age+1) -0.348*** -0.416*** -0.334*** -0.405*** -0.388***
(0.000) (0.000) (0.000) (0.000) (0.000)
Percentage of Tangible Assets -0.099 -0.008 -0.111 -0.025 -0.019
(0.636) (0.971) (0.595) (0.907) (0.929)
Profit Margin -0.014 -0.014 -0.015 -0.014 -0.013
(0.499) (0.481) (0.457) (0.502) (0.532)
Debt/Assets -0.003 -0.002 -0.003 -0.003 -0.002
(0.716) (0.748) (0.661) (0.705) (0.817)
Current Liability/Total Debt -0.151 -0.172 -0.149 -0.187 -0.190
(0.439) (0.378) (0.444) (0.337) (0.331)
Corporation 0.019 0.045 0.029 0.047 0.041
(0.895) (0.757) (0.843) (0.751) (0.779)
Urban -0.160 -0.109 -0.165 -0.107 -0.109
(0.266) (0.451) (0.251) (0.460) (0.455)
Owner Bankrupt 0.766 0.792 0.664 0.737 0.923
(0.254) (0.239) (0.324) (0.274) (0.174)
Firm Bankrupt 1.189 1.033 1.004 0.915 1.030
(0.260) (0.328) (0.341) (0.387) (0.333)
Ln (Distance) 0.119*** 0.123*** 0.119*** 0.129*** 0.131***
(0.005) (0.004) (0.005) (0.002) (0.002)
Ln (Relationship) -0.023 -0.022 -0.024 -0.021 -0.028
(0.519) (0.535) (0.497) (0.557) (0.443)
Loan Size -0.181*** -0.185*** -0.180*** -0.190*** -0.190***
(0.001) (0.001) (0.001) (0.000) (0.001)
Loan Length -0.034 -0.035 -0.036 -0.038 -0.044
(0.626) (0.623) (0.610) (0.593) (0.535)
Fixed Interest Rate 0.466*** 0.464*** 0.459*** 0.457*** 0.456***
(0.001) (0.001) (0.001) (0.001) (0.001)
Collateralized -0.326** -0.317** -0.316** -0.305** -0.288**
(0.012) (0.015) (0.015) (0.019) (0.027)

47
DB Score Dummies Yes Yes Yes Yes Yes
Loan Type Dummies Yes Yes Yes Yes Yes
Industry Dummies Yes Yes Yes Yes Yes
Survey Dummies Yes Yes Yes Yes Yes
N 1741 1741 1741 1741 1741
Pseudo R-Square (%) 14.68 16.32 14.57 14.10 13.51