Entrepreneurial Innovation Impact on Recycling Municipal ...
13
sustainability Article Entrepreneurial Innovation Impact on Recycling Municipal Waste. A Panel Data Analysis at the EU Level Cristian Silviu Banacu 1 , Mihail Busu 2, * , Raluca Ignat 3 and Carmen Lenuta Trica 3 1 Faculty of Management, The Bucharest University of Economic Studies, 6 Piata Romana, 1st district, 010374 Bucharest, Romania; [email protected] 2 Faculty of Business Administration in Foreign Languages, The Bucharest University of Economic Studies, 6 Piata Romana, 1st district, 010374 Bucharest, Romania 3 Faculty of Agrifood and Environmental Economics, The Bucharest University of Economic Studies, 6 Piata Romana, 1st district, 010374 Bucharest, Romania; [email protected] (R.I.); [email protected] (C.L.T.) * Correspondence: [email protected] Received: 26 August 2019; Accepted: 15 September 2019; Published: 19 September 2019 Abstract: Based on recent findings of the economic literature on the implications of entrepreneurial innovation for recycling municipal waste, this paper aims to examine the main factors of recycling municipal waste at the European Union (EU) level. In this study, the authors developed a linear regression model to analyze the relationship between business expenditure on research and development (R&D), private investments, gross domestic product (GDP) expenditures on R&D, resource productivity, and environmental taxes on the recycling rate of municipal waste (RRMW). In our analyses, we used data from the Statistical Office of the European Union (EUROSTAT) and five statistical hypotheses were validated through a multiple regression model with panel data using the statistical software EViews 11. The study was conducted in 27 European Union countries between 2010 and 2017. Our results indicate that business expenditure on R&D, private investments, GDP expenditures on R&D, and resource productivity have a direct and significant impact on the RRMW, while environmental taxes have a significant and inverse impact on the RRMW. These findings underline that public policies should be focused on increasing the use of private and public investments on R&D for recycling municipal waste. Keywords: entrepreneurial innovation; municipal waste; recycling; sustainability; econometric model; panel data; quantitative analysis; environmental factors 1. Introduction The purpose of the paper is to examine what the main factors of recycling municipal waste at the European level are, using a linear regression model in order to discover and analyze the relationship between several economic factors and the recycling rate of municipal waste (RRMW). The question of the research is what is the entrepreneurial innovation impact on the RRMW? Previous studies proved several impacts and answered in different modes to this specific question. Still, the study intended to demonstrate the impact of entrepreneurial innovation interpreted as business expenditure on R&D, resource productivity, and environmental taxes on the RRMW. The motivation for this approach is given by the fact that entrepreneurial innovation is no longer a desiderate, but rather a constant key activity of our society. Both public policy and business environment have an interest in all of the innovative solutions for the improvement of their activity, as well as in the positive impact of the innovation on the return of business. Constant improvement of the activity is due to the implementation of the innovation results. Sustainability 2019, 11, 5125; doi:10.3390/su11185125 www.mdpi.com/journal/sustainability
Transcript of Entrepreneurial Innovation Impact on Recycling Municipal ...

sustainability
Article
Entrepreneurial Innovation Impact on RecyclingMunicipal Waste. A Panel Data Analysis at theEU Level
Cristian Silviu Banacu 1, Mihail Busu 2,* , Raluca Ignat 3 and Carmen Lenuta Trica 3
1 Faculty of Management, The Bucharest University of Economic Studies, 6 Piata Romana, 1st district,010374 Bucharest, Romania; [email protected]
2 Faculty of Business Administration in Foreign Languages, The Bucharest University of Economic Studies,6 Piata Romana, 1st district, 010374 Bucharest, Romania
3 Faculty of Agrifood and Environmental Economics, The Bucharest University of Economic Studies, 6 PiataRomana, 1st district, 010374 Bucharest, Romania; [email protected] (R.I.); [email protected] (C.L.T.)
* Correspondence: [email protected]
Received: 26 August 2019; Accepted: 15 September 2019; Published: 19 September 2019�����������������
Abstract: Based on recent findings of the economic literature on the implications of entrepreneurialinnovation for recycling municipal waste, this paper aims to examine the main factors of recyclingmunicipal waste at the European Union (EU) level. In this study, the authors developed alinear regression model to analyze the relationship between business expenditure on researchand development (R&D), private investments, gross domestic product (GDP) expenditures on R&D,resource productivity, and environmental taxes on the recycling rate of municipal waste (RRMW).In our analyses, we used data from the Statistical Office of the European Union (EUROSTAT) and fivestatistical hypotheses were validated through a multiple regression model with panel data using thestatistical software EViews 11. The study was conducted in 27 European Union countries between2010 and 2017. Our results indicate that business expenditure on R&D, private investments, GDPexpenditures on R&D, and resource productivity have a direct and significant impact on the RRMW,while environmental taxes have a significant and inverse impact on the RRMW. These findingsunderline that public policies should be focused on increasing the use of private and public investmentson R&D for recycling municipal waste.
Keywords: entrepreneurial innovation; municipal waste; recycling; sustainability; econometricmodel; panel data; quantitative analysis; environmental factors
1. Introduction
The purpose of the paper is to examine what the main factors of recycling municipal waste at theEuropean level are, using a linear regression model in order to discover and analyze the relationshipbetween several economic factors and the recycling rate of municipal waste (RRMW). The question ofthe research is what is the entrepreneurial innovation impact on the RRMW?
Previous studies proved several impacts and answered in different modes to this specific question.Still, the study intended to demonstrate the impact of entrepreneurial innovation interpreted asbusiness expenditure on R&D, resource productivity, and environmental taxes on the RRMW.
The motivation for this approach is given by the fact that entrepreneurial innovation is nolonger a desiderate, but rather a constant key activity of our society. Both public policy and businessenvironment have an interest in all of the innovative solutions for the improvement of their activity,as well as in the positive impact of the innovation on the return of business. Constant improvement ofthe activity is due to the implementation of the innovation results.
Sustainability 2019, 11, 5125; doi:10.3390/su11185125 www.mdpi.com/journal/sustainability

Sustainability 2019, 11, 5125 2 of 13
Entrepreneurship is being recognized as the main solution for economic development and socialwelfare [1,2]. Still, the economic growth may be determined by many other responsible factors, andsome of them are quite unexpected [3], especially those in the Asian development model. Nevertheless,entrepreneurial manifestation has the government’s or local public authorities’ support [4], and businessenvironments sustenance, too. Starting with Schumpeter’s complex definition [5] on entrepreneurship,there were many conceptual approaches regarding the role of an entrepreneur, from the personwho bears the uncertainty, to that person who allocates resources with multiple uses [6]. Therefore,entrepreneurship seems to be the foundation of recycling activities even in the municipal waste field.
The link between innovation and entrepreneurship [7] crossed from the historical perspective toeconomic growth and innovation entrepreneurship, with two directions: innovation in product-marketand technology innovation. Precursor studies already have demonstrated that innovation andentrepreneurship are positively related to each other [8] and together will have an impact on economicgrowth. Plus, the question still remains: Do they have an impact on the RRMW?
Innovation nowadays becomes important in waste management, too, as it is needed in order toresolve the issue of the huge annual quantities of municipal waste all over the world and to maintainurban and rural areas as clear as possible. Taking into consideration that current environment policy isbased on sustainability [9], waste management has at least three dimensions: economic, ecological,and social [10], especially in highly-urbanized centers. From this perspective, it is very importantto see what would be the solutions for better recycling the municipal waste. The municipalities andpublic policy makers try to identify which would be the most effective solution [11,12] for urban waste,no matter the type—domestic or waste from municipal services, solid, e-waste, dust, food, or anydebris from cleaning activities. Obviously, there are studies that demonstrate an important differencebetween urban and rural areas in managing waste [13,14], while taking into consideration the highernumber of solutions in waste management for rural households, legal or less legal, such as burning,composing, using them as fertilizers for vegetable cultivation, etc.
In this regard, innovation was used and, for example, even green channels were proposed fore-waste [15] in order for the countries to reach green economy principles. The conclusions of differentother studies demonstrate that even e-waste management is not as developed and as well prepared asthe high-tech industry is and produces [16].
The approach might be slightly different and more effective for the food industry [17], as theinnovation brought to light very effective recycling solutions to this sector. This is the place whereentrepreneurs may intervene in an innovative way [18] and boost the link between entrepreneurshipand innovation in order to generate better and more functional recycling solutions.
Therefore, conceptual and empirical studies were run in order to better demonstrate how muchentrepreneurship determines economic growth [19,20], concludes towards a circular economy [21],boosts innovation or vice-versa [22–24], and even show the link between these three concepts:innovation, entrepreneurship, and economic growth [25]. Moreover, empirical studies were run inorder to find out innovative solutions for smart partnerships [26] and sustainable development [27].Considering all these issues, in order to understand the impact of entrepreneurial innovation on theRRMW, it is important to determine what the business expenditure on R&D and the GDP expenditureson R&D (as main supportive factors for innovation) are, then private investments in general as keyfactors for entrepreneurship and recycling rates.
The connection between entrepreneurial innovation and recycling municipal waste has beenstudied by many economists. It was proved that there is a close entrepreneurial link between innovationand recycling of municipal waste [28]. Other authors [29–31] concluded that business expenditure onR&D have a positive impact on the RRMW.
Moreover, while some researchers [32,33] underline that private investments have a significantimpact on the RRMW, other scientists [34,35] argue that GDP expenditures on R&D by the businessenterprise sector have a positive impact on the RRMW in EU member states. Nevertheless,da Cruz et al. [36] and Busu [37] conclude that the environmental taxes and productivity of the

Sustainability 2019, 11, 5125 3 of 13
resources have a direct and significant impact on the RRMW. Resource productivity is the grossdomestic product (GDP) divided by domestic material consumption (DMC), where DMC measuresthe total amount of materials directly used by an economy. It is defined as the annual quantity of rawmaterials extracted from the domestic territory of the focal economy, plus all physical imports minusall physical exports.
Starting from the above-mentioned empirical results, we state our research question: “What isthe entrepreneurial innovation impact on the RRMW?” Besides what is already known in this area,we will try to make an estimation on which of the five independent factors (i.e., business expenditureon R&D, private investments, GDP expenditures on R&D, resource productivity, and environmentaltaxes) has the greatest impact on the dependent variable of the quantitative model.
Nowadays, EU has 28 member states which joined the Union at different times. In the past20 years, there were three moments when new countries joined EU: In 2004, when 10 new memberstates joined EU; in 2007, two new states adhered to EU; and in 2013, when a new state joined EU.Due to data availability, our analysis covers the period between 2010 and 2017.
This paper has the following structure. Firstly, we make a descriptive analysis of themacroeconomic key indicators of the RRMW at the EU level. RRMW measures the share of recycledmunicipal waste in the total municipal waste generation and the ratio is expressed in percentagepoints. Secondly, the relationship between entrepreneurial innovation and RRMW is analyzed.Research hypotheses are formulated and then tested through the regression analysis. Further research,limitations, and conclusions are summarized in the last section of the article.
2. Materials and Methods
2.1. Research Methodology
Before starting the quantitative analyses, we have formulated five statistical hypotheses(see Table 1).
Table 1. Statistical hypotheses.
H1 Business expenditures on R&D at the EU level have a positive impact on the RRMW.
H2 Private investments are strongly correlated with RRMW at the EU level.
H3 GDP expenditures on R&D by the business enterprise sector have a positive impact on the RRMW in EU member states
H4 Resource productivity has a positive impact on the RRMW in EU countries
H5 Environmental taxes have a significant impact on the RRMW at the EU level
R&D = research and development; RRMW = recycling rate of municipal waste; GDP = gross domestic product;EU = European Union.
These five hypotheses were tested with a multiple linear regression analysis, by the statisticalsoftware Eviews 11.0. A description of the analysis is provided in Section 3.
2.2. Description of the Entrepreneurial Innovation and Recycling at the EU Level
Several approaches to recycling businesses and economy models have different emphasis on themain components [38]. They share several useful principles, aiming to:
• Use of the “waste = food” approach to help recover waste materials, to make sure that biologicalmaterials could be reused at the end of their life;
• Extend the life of product and materials, if possible, over multiple “cycles”;• Conserve or regenerate living systems and nature;• Retain the water, the embedded energy, and other inputs in the material and product for as long
as possible;• Push for taxes, market mechanisms, and policies that encourage “polluter pays” regulations.
Sustainability 2019, 11, 5125 4 of 13
A business model and relationship based on a recycling model were given by Weetman [38](see Figure 1). The framework was made of six blocks: circular inputs, product design, process designand circular flows, business models and relationships, and, eventually, enablers and accelerators.
Sustainability 2019, 11, x FOR PEER REVIEW 4 of 14
A business model and relationship based on a recycling model were given by Weetman [38] (see Figure 1). The framework was made of six blocks: circular inputs, product design, process design and circular flows, business models and relationships, and, eventually, enablers and accelerators.
Figure 1. Business models and relationships framework for recycling. Source: Weetman [38].
As can be seen in Figure 1, this definition underlines the need to minimize waste by repairing, reusing, and innovating the concept of recycling.
In our study, five macroeconomic indicators describing entrepreneurship innovation with significant impact on the RRMW were used. They will be the independent variables of the linear regression model in our study.
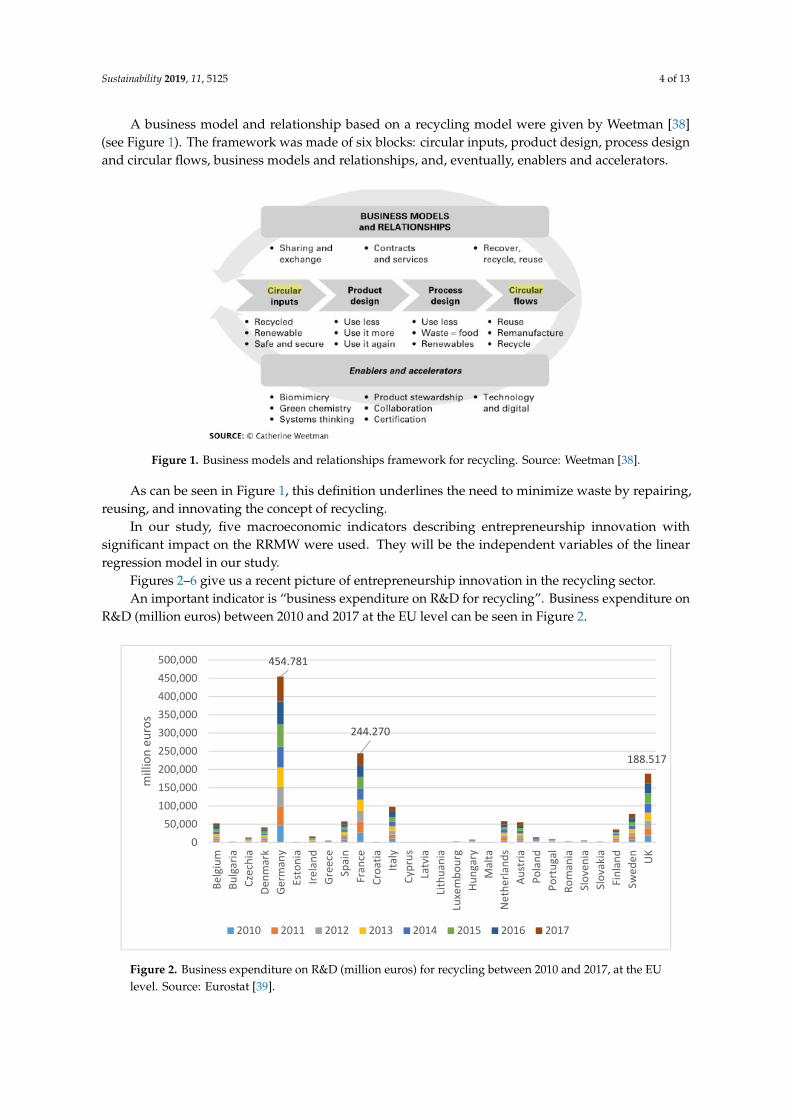
Figures 2–6 give us a recent picture of entrepreneurship innovation in the recycling sector. An important indicator is “business expenditure on R&D for recycling”. Business expenditure
on R&D (million euros) between 2010 and 2017 at the EU level can be seen in Figure 2.
Figure 2. Business expenditure on R&D (million euros) for recycling between 2010 and 2017, at the EU level. Source: Eurostat [39].
454.781
244.270
188.517
050,000
100,000150,000200,000250,000300,000350,000400,000450,000500,000
Belg
ium
Bulg
aria
Czec
hia
Denm
ark
Germ
any
Esto
nia
Irela
ndGr
eece
Spai
nFr
ance
Croa
tiaIta
lyCy
prus
Latv
iaLit
huan
iaLu
xem
bour
gHu
ngar
yM
alta
Neth
erla
nds
Aust
riaPo
land
Port
ugal
Rom
ania
Slov
enia
Slov
akia
Finl
and
Swed
en UK
mill
ion
euro
s
2010 2011 2012 2013 2014 2015 2016 2017
Figure 1. Business models and relationships framework for recycling. Source: Weetman [38].
As can be seen in Figure 1, this definition underlines the need to minimize waste by repairing,reusing, and innovating the concept of recycling.
In our study, five macroeconomic indicators describing entrepreneurship innovation withsignificant impact on the RRMW were used. They will be the independent variables of the linearregression model in our study.
Figures 2–6 give us a recent picture of entrepreneurship innovation in the recycling sector.An important indicator is “business expenditure on R&D for recycling”. Business expenditure on
R&D (million euros) between 2010 and 2017 at the EU level can be seen in Figure 2.
Sustainability 2019, 11, x FOR PEER REVIEW 4 of 14
A business model and relationship based on a recycling model were given by Weetman [38] (see Figure 1). The framework was made of six blocks: circular inputs, product design, process design and circular flows, business models and relationships, and, eventually, enablers and accelerators.
Figure 1. Business models and relationships framework for recycling. Source: Weetman [38].
As can be seen in Figure 1, this definition underlines the need to minimize waste by repairing, reusing, and innovating the concept of recycling.
In our study, five macroeconomic indicators describing entrepreneurship innovation with significant impact on the RRMW were used. They will be the independent variables of the linear regression model in our study.
Figures 2–6 give us a recent picture of entrepreneurship innovation in the recycling sector. An important indicator is “business expenditure on R&D for recycling”. Business expenditure
on R&D (million euros) between 2010 and 2017 at the EU level can be seen in Figure 2.
Figure 2. Business expenditure on R&D (million euros) for recycling between 2010 and 2017, at the EU level. Source: Eurostat [39].
454.781
244.270
188.517
050,000
100,000150,000200,000250,000300,000350,000400,000450,000500,000
Belg
ium
Bulg
aria
Czec
hia
Denm
ark
Germ
any
Esto
nia
Irela
ndGr
eece
Spai
nFr
ance
Croa
tiaIta
lyCy
prus
Latv
iaLit
huan
iaLu
xem
bour
gHu
ngar
yM
alta
Neth
erla
nds
Aust
riaPo
land
Port
ugal
Rom
ania
Slov
enia
Slov
akia
Finl
and
Swed
en UK
mill
ion
euro
s
2010 2011 2012 2013 2014 2015 2016 2017
Figure 2. Business expenditure on R&D (million euros) for recycling between 2010 and 2017, at the EUlevel. Source: Eurostat [39].
Sustainability 2019, 11, 5125 5 of 13
From Figure 2 we can see that, in 2017, the countries with the most business expenditure onR&D for recycling were Germany (68.4 million), followed by France (32.5 million), and the UnitedKingdom (UK) (26.2 billion). At the same time, in the last rankings were Cyprus (0.04 million), Malta(0.038 million), and Latvia (0.038 million).
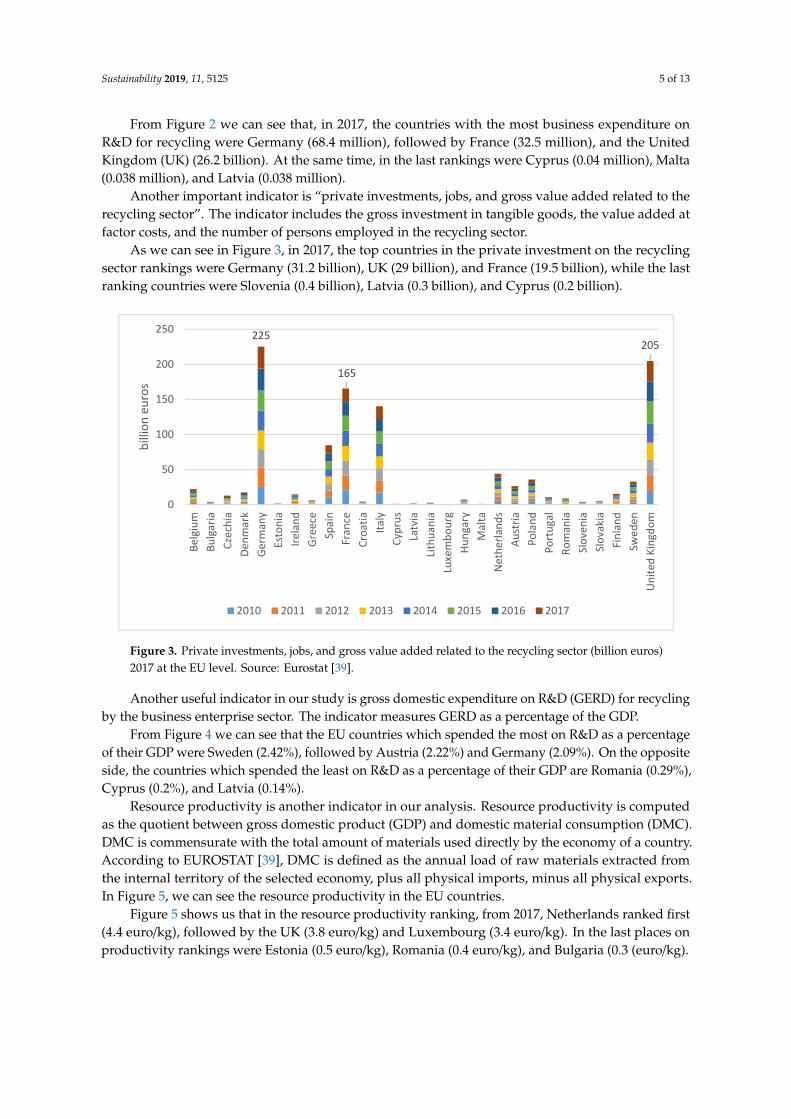
Another important indicator is “private investments, jobs, and gross value added related to therecycling sector”. The indicator includes the gross investment in tangible goods, the value added atfactor costs, and the number of persons employed in the recycling sector.
As we can see in Figure 3, in 2017, the top countries in the private investment on the recyclingsector rankings were Germany (31.2 billion), UK (29 billion), and France (19.5 billion), while the lastranking countries were Slovenia (0.4 billion), Latvia (0.3 billion), and Cyprus (0.2 billion).
Sustainability 2019, 11, x FOR PEER REVIEW 5 of 14
From Figure 2 we can see that, in 2017, the countries with the most business expenditure on R&D for recycling were Germany (68.4 million), followed by France (32.5 million), and the United Kingdom (UK) (26.2 billion). At the same time, in the last rankings were Cyprus (0.04 million), Malta (0.038 million), and Latvia (0.038 million).
Another important indicator is “private investments, jobs, and gross value added related to the recycling sector”. The indicator includes the gross investment in tangible goods, the value added at factor costs, and the number of persons employed in the recycling sector.
As we can see in Figure 3, in 2017, the top countries in the private investment on the recycling sector rankings were Germany (31.2 billion), UK (29 billion), and France (19.5 billion), while the last ranking countries were Slovenia (0.4 billion), Latvia (0.3 billion), and Cyprus (0.2 billion).
Figure 3. Private investments, jobs, and gross value added related to the recycling sector (billion euros) 2017 at the EU level. Source: Eurostat [39].
Another useful indicator in our study is gross domestic expenditure on R&D (GERD) for recycling by the business enterprise sector. The indicator measures GERD as a percentage of the GDP.
Figure 4. Gross domestic expenditure on research and development (GERD) by the business enterprise sector as a percentage of GDP between 2010 and 2017, at the EU level. Source: Eurostat [39].
225
165
205
0
50
100
150
200
250
Belg
ium
Bulg
aria
Czec
hia
Denm
ark
Germ
any
Esto
nia
Irela
ndGr
eece
Spai
nFr
ance
Croa
tiaIta
lyCy
prus
Latv
iaLit
huan
iaLu
xem
bour
gHu
ngar
yM
alta
Neth
erla
nds
Aust
riaPo
land
Port
ugal
Rom
ania
Slov
enia
Slov
akia
Finl
and
Swed
enUn
ited
King
dom
billi
on e
uros
2010 2011 2012 2013 2014 2015 2016 2017
15.6 16.618
02468
101214161820
% o
f GDP
2010 2011 2012 2013 2014 2015 2016 2017
Figure 3. Private investments, jobs, and gross value added related to the recycling sector (billion euros)2017 at the EU level. Source: Eurostat [39].
Another useful indicator in our study is gross domestic expenditure on R&D (GERD) for recyclingby the business enterprise sector. The indicator measures GERD as a percentage of the GDP.
From Figure 4 we can see that the EU countries which spended the most on R&D as a percentageof their GDP were Sweden (2.42%), followed by Austria (2.22%) and Germany (2.09%). On the oppositeside, the countries which spended the least on R&D as a percentage of their GDP are Romania (0.29%),Cyprus (0.2%), and Latvia (0.14%).
Resource productivity is another indicator in our analysis. Resource productivity is computedas the quotient between gross domestic product (GDP) and domestic material consumption (DMC).DMC is commensurate with the total amount of materials used directly by the economy of a country.According to EUROSTAT [39], DMC is defined as the annual load of raw materials extracted fromthe internal territory of the selected economy, plus all physical imports, minus all physical exports.In Figure 5, we can see the resource productivity in the EU countries.
Figure 5 shows us that in the resource productivity ranking, from 2017, Netherlands ranked first(4.4 euro/kg), followed by the UK (3.8 euro/kg) and Luxembourg (3.4 euro/kg). In the last places onproductivity rankings were Estonia (0.5 euro/kg), Romania (0.4 euro/kg), and Bulgaria (0.3 (euro/kg).

Sustainability 2019, 11, 5125 6 of 13
Sustainability 2019, 11, x FOR PEER REVIEW 5 of 14
From Figure 2 we can see that, in 2017, the countries with the most business expenditure on R&D for recycling were Germany (68.4 million), followed by France (32.5 million), and the United Kingdom (UK) (26.2 billion). At the same time, in the last rankings were Cyprus (0.04 million), Malta (0.038 million), and Latvia (0.038 million).
Another important indicator is “private investments, jobs, and gross value added related to the recycling sector”. The indicator includes the gross investment in tangible goods, the value added at factor costs, and the number of persons employed in the recycling sector.
As we can see in Figure 3, in 2017, the top countries in the private investment on the recycling sector rankings were Germany (31.2 billion), UK (29 billion), and France (19.5 billion), while the last ranking countries were Slovenia (0.4 billion), Latvia (0.3 billion), and Cyprus (0.2 billion).
Figure 3. Private investments, jobs, and gross value added related to the recycling sector (billion euros) 2017 at the EU level. Source: Eurostat [39].
Another useful indicator in our study is gross domestic expenditure on R&D (GERD) for recycling by the business enterprise sector. The indicator measures GERD as a percentage of the GDP.
Figure 4. Gross domestic expenditure on research and development (GERD) by the business enterprise sector as a percentage of GDP between 2010 and 2017, at the EU level. Source: Eurostat [39].
225
165
205
0
50
100
150
200
250
Belg
ium
Bulg
aria
Czec
hia
Denm
ark
Germ
any
Esto
nia
Irela
ndGr
eece
Spai
nFr
ance
Croa
tiaIta
lyCy
prus
Latv
iaLit
huan
iaLu
xem
bour
gHu
ngar
yM
alta
Neth
erla
nds
Aust
riaPo
land
Port
ugal
Rom
ania
Slov
enia
Slov
akia
Finl
and
Swed
enUn
ited
King
dom
billi
on e
uros
2010 2011 2012 2013 2014 2015 2016 2017
15.6 16.618
02468
101214161820
% o
f GDP
2010 2011 2012 2013 2014 2015 2016 2017
Figure 4. Gross domestic expenditure on research and development (GERD) by the business enterprisesector as a percentage of GDP between 2010 and 2017, at the EU level. Source: Eurostat [39].
Sustainability 2019, 11, x FOR PEER REVIEW 6 of 14
From Figure 4 we can see that the EU countries which spended the most on R&D as a percentage of their GDP were Sweden (2.42%), followed by Austria (2.22%) and Germany (2.09%). On the opposite side, the countries which spended the least on R&D as a percentage of their GDP are Romania (0.29%), Cyprus (0.2%), and Latvia (0.14%).
Resource productivity is another indicator in our analysis. Resource productivity is computed as the quotient between gross domestic product (GDP) and domestic material consumption (DMC). DMC is commensurate with the total amount of materials used directly by the economy of a country. According to EUROSTAT [39], DMC is defined as the annual load of raw materials extracted from the internal territory of the selected economy, plus all physical imports, minus all physical exports. In Figure 5, we can see the resource productivity in the EU countries.
Figure 5. Resource productivity in the EU countries between 2010 and 2017 (euro/kg).
Figure 5 shows us that in the resource productivity ranking, from 2017, Netherlands ranked first (4.4 euro/kg), followed by the UK (3.8 euro/kg) and Luxembourg (3.4 euro/kg). In the last places on productivity rankings were Estonia (0.5 euro/kg), Romania (0.4 euro/kg), and Bulgaria (0.3 (euro/kg).
Another useful indicator in our research is environmental taxes. Environmental tax revenue series display total tax revenue by category of environmental taxes: energy taxes, transport taxes, pollution taxes, resource taxes, and the sum of pollution and resource taxes. The series is presented in billions of euro. In Figure 6 we can see the amounts (in billion euros) collected by the EU member states in 2017.
2.4 3.7
29.0 29.9
3.0
27.6
0
5
10
15
20
25
30
35
Belg
ium
Bulg
aria
Czec
hia
Denm
ark
Germ
any
Esto
nia
Irela
ndGr
eece
Spai
nFr
ance
Croa
tiaIta
lyCy
prus
Latv
iaLit
huan
iaLu
xem
bour
gHu
ngar
yM
alta
Neth
erla
nds
Aust
riaPo
land
Port
ugal
Rom
ania
Slov
enia
Slov
akia
Finl
and
Swed
en UK
euro
/kg
2010 2011 2012 2013 2014 2015 2016 2017
Figure 5. Resource productivity in the EU countries between 2010 and 2017 (euro/kg).
Another useful indicator in our research is environmental taxes. Environmental tax revenue seriesdisplay total tax revenue by category of environmental taxes: energy taxes, transport taxes, pollutiontaxes, resource taxes, and the sum of pollution and resource taxes. The series is presented in billions ofeuro. In Figure 6 we can see the amounts (in billion euros) collected by the EU member states in 2017.
From Figure 6 we can see that the EU member states with the highest revenues from environmentaltax collection were, in 2017, Germany (59.3 billion euros), followed by Italy (57.4 billion euros) andthe UK (55.8 billion euros). In this ranking, in the last places were Estonia (0.7 billion euros), Cyprus(0.6 billion euros), and Malta (0.3 billion euros).

Sustainability 2019, 11, 5125 7 of 13
Hence, the description of the above macroeconomic indicators of innovation and recyclingindicates that the Western and Northern EU countries were the top-ranking countries, with the highestdegree of entrepreneurship innovation implementation, while the Eastern and Southern EU countrieswere at the bottom of these rankings. This could be explained by the well-developed environmentalpolicies in the Northern and Western EU states.Sustainability 2019, 11, x FOR PEER REVIEW 7 of 14
Figure 6. Environmental taxes (billion euros) between 2010 and 2017 at the EU level. Source: Eurostat [39].
From Figure 6 we can see that the EU member states with the highest revenues from environmental tax collection were, in 2017, Germany (59.3 billion euros), followed by Italy (57.4 billion euros) and the UK (55.8 billion euros). In this ranking, in the last places were Estonia (0.7 billion euros), Cyprus (0.6 billion euros), and Malta (0.3 billion euros).
Hence, the description of the above macroeconomic indicators of innovation and recycling indicates that the Western and Northern EU countries were the top-ranking countries, with the highest degree of entrepreneurship innovation implementation, while the Eastern and Southern EU countries were at the bottom of these rankings. This could be explained by the well-developed environmental policies in the Northern and Western EU states.
3. Results
For the quantitative analysis, RRMW was set as the endogenous variable (Y), determined by five exogenous variables. They were: Business expenditures on R&D (X1); private investments, jobs, and the added value related to the recycling sector (X2); GDP expenditure on R&D (GERD) by the business enterprise sector (X3); resource productivity (X4); and environmental taxes (X5). Linear regression analysis was made through the following steps: performing the quantitative analysis, estimating the model parameters, and checking the results.
A description of the statistical indicators used in our study (min, max, median, mean, and standard deviation) is given in Table 2. The values of median and mean are useful indicators of how close the data is to normal distribution. If the median and the mean approximate each other, we could assume that the data has a normal distribution [40].
463.980436.754 427.622
0
100,000
200,000
300,000
400,000
500,000
600,000
Belg
ium
Bulg
aria
Czec
hia
Denm
ark
Germ
any
Esto
nia
Irela
ndGr
eece
Spai
nFr
ance
Croa
tiaIta
lyCy
prus
Latv
iaLit
huan
iaLu
xem
bour
gHu
ngar
yM
alta
Neth
erla
nds
Aust
riaPo
land
Port
ugal
Rom
ania
Slov
enia
Slov
akia
Finl
and
Swed
enUn
ited
King
dom
billi
on e
uros
2010 2011 2012 2013 2014 2015 2016 2017
Figure 6. Environmental taxes (billion euros) between 2010 and 2017 at the EU level. Source: Eurostat [39].
3. Results
For the quantitative analysis, RRMW was set as the endogenous variable (Y), determined by fiveexogenous variables. They were: Business expenditures on R&D (X1); private investments, jobs, andthe added value related to the recycling sector (X2); GDP expenditure on R&D (GERD) by the businessenterprise sector (X3); resource productivity (X4); and environmental taxes (X5). Linear regressionanalysis was made through the following steps: performing the quantitative analysis, estimating themodel parameters, and checking the results.
A description of the statistical indicators used in our study (min, max, median, mean, and standarddeviation) is given in Table 2. The values of median and mean are useful indicators of how close thedata is to normal distribution. If the median and the mean approximate each other, we could assumethat the data has a normal distribution [40].
Table 2. Descriptive statistics of the variables in the model.
Variable Unit Min Mean Median Max St. Dev. N
RRMW (Y) % 6.400 37.178 34.800 67.600 14.882 27Business expend. (X1) Mill. euros 38 7.741 7.800 68.644 12.340 27
Private (X2) Bill. euros 0.200 6.200 6.400 31.200 4.326 27GERD (X3) % 0.14 0.786 0.710 2.42 0.123 27
Res_prod (X4) Euro/kg 0.300 2.123 2.100 4.400 0.789 27Environ tax(X5) Bill. euros 0.303 8.171 7.895 59.259 8.930 27
Source: EViews 11.0 output. RRMW = recycling rate of municipal waste; Business expendit. = business expenditures;GERD = Gross domestic expenditure on research and development; Res_prod = resource productivity.
In Table 2 we can see that the median and mean values are close to each other; therefore, we couldconclude that the variables in our model are normally distributed.

Sustainability 2019, 11, 5125 8 of 13
The multicollinearity test among the independent variables (X1, X2, X3, X4, and X5) used in ourmodel was performed by the Pearson correlation analysis. In Table 3 we can see the values of thepairwise correlation coefficients. Since these values are smaller than ±0.30, we could assume that thereare no multicollinearity issues among the exogenous variables [41].
Table 3. Pearson correlation matrix between explanatory variables.
Variable X1 X2 X3 X4 X5
X1 1X2 0.113 1X3 0.125 0.137 1X4 0.207 0.205 0.149 1X5 0.198 0.278 0.098 0.101 1
Source: EViews 11.0 output.
Now we will perform the Lagrange multiplier (LM) Breusch–Pagan test and the F-test to determinewhether the research model we used in our analysis, given by Equation (1), was pooled data, fixed effects,or random effects.
The F-test was used for testing the validity of the pooled model against the fixed effects model [42].In order to perform this test, we will consider the unrestricted and restricted models.
(i) Restricted model:Yi = Xβ+ εi, i = 1, N. (1)
(ii) Unrestricted model: Yi = Xiβi + u.
The fixed effects estimator or within estimator of the slope coefficient β estimates the withinmodel by ordinary least square (OLS) analysis:
β =(XTX
)−1XTY. (2)
The null and alternative hypotheses are:
• H0 : βi = β;• H1 : βi , β.
If the null hypothesis is accepted, then the restricted model is accepted. Otherwise, the fixed effectmodel would be suitable for our analysis.
The F-test results can be seen in Table 4.
Table 4. Fixed effect test.
F-Statistic 3.48Probability 0.190
Since the probability p-value (probability = 0.190) is greater than the 0.05 threshold, we will acceptthe Null Hypothesis and conclude that random effect model should be used in our study.
Now, in order to make a choice between random models and pooled data we will use the LMBreusch–Pagan test [43].
By means of this test, we analyzed the existence of the kth order autocorrelation of residual values.We assumed that the errors regression model is given by the following equation:
ut = ρ1ut−1 + ρ2ut−2 + . . .+ ρkut−k + νt, for t = k, n and νt ∼ N(0, σ2ν). (3)
In order to assess the presence of the kth order autocorrelation, we tested the following null andalterative hypothesis:

Sustainability 2019, 11, 5125 9 of 13
• H0: σ2u = 0;
• H1: σ2u , 0;
If the null hypothesis is accepted, then the pooled model will be suitable for our analysis.The results of the LM Breusch–Pagan test can be seen in Table 5.
Table 5. The Lagrange Multiplier Breusch–Pagan test.
Cross Section Time Both
Coeff. 29.13 52.28 82.48Prob. 0.091 0.583 0.036
Upon analyzing the results of the random effect test in Table 5, we accepted the null hypothesis,since the probability p-value (probability = 0.091) was greater than the threshold 0.05. Hence,we concluded that the pooling of the model in Equation (1) was suitable for our analysis.
The five statistical hypotheses formulated in the previous section were tested with a multipleregression equation using the pooled least square (PLS) method. We used this approach in order toanalyze the impact of the entrepreneurial innovation on the RRMW at the EU level between 2010and 2017.
The evolution of the RRMW between 2010 and 2017 in EU countries was analyzed with a regressionmodel and we obtained the following results (see Table 6):
Table 6. Impact of independent variables on the RRMW in the EU countries during 2010 to 2017.
Dependent Variable: RRMWMethod: Pooled Least Square
Sample: 2010–2017Total panel observations: 216
RRMW = B(0) + B(1) × BUSINESS_EXPEND + B(2) × PRIVATE + B(3) × GERD + B(4) × RES_PROD +B(5) × ENVIRON_TAX
Coefficient Std. Error t-Statistic Prob.
C −2.23786 1.165 4.298750 0.0009BUSINESS_EXPEND 0.658946 1.235 3.674397 0.0023
PRIVATE 0.764987 1.414 4.096785 0.0019GERD 0.385684 1.152 2.673098 0.0175
RES_PROD 0.276856 1.167 1.987658 0.0210ENVIRON_TAX −0.187912 1.725 1.678934 0.0421
R-squared 0.729867 Mean dependent var 7.6882Adjusted R-squared 0.684598 S.D. dependent var 0.9876
S.E. of regression 0.198763 Akaike info criterion 1.9287Sum squared resid. 1.765487 Schwarz criterion 1.8035
Log likelihood 112.7623 Hannan–Quinn criter. 1.7036Durbin–Watson stat 2.060983
According to the table above, the regression equation is:
Y = −2.237 + 0.658X1 + 0.764X2 + 0.385X3 + 0.276X4 −0.187X5, (4)
where:
• Y = recycling rate of municipal waste;• X1 = business expenditures on R&D;• X2 = private investments, jobs, and gross added value related to the recycling sector;• X3 = GDP on R&D by the business enterprise sector;• X4 = resource productivity;• X5 = environmental taxes.

Sustainability 2019, 11, 5125 10 of 13
Therefore, we could conclude that all independent variables in our model had a significant impacton the dependent variable and, hence, all five hypotheses were validated.
4. Discussion
In this section we discuss the results of the multiple linear regression analyzed by the PLS method.The method was used by the authors to estimate the impact of entrepreneurial innovation on recyclingmunicipal waste.
Analyzing the RRMW evolution in the 27 EU countries, from 2010 to 2017 through independentvariables (business expenditures on R&D, private investments, jobs, and value added related torecycling sector, GDP on R&D by business enterprise sector, resource productivity, and environmentaltaxes), through the multifactorial linear regression analysis, we obtained the following equation(see Table 6): Y = −2.237 + 0.658X1 + 0.764X2 + 0.385X3 + 0.276X4 − 0.187X5, with the standard errorcoefficients (1.235), (1.414), (1.152), (1.667), and (1.162). Moreover, since the value of R-squared was0.729, we could conclude that 72.9% of the variability of the endogenous variable is explained bythe variability of the exogenous variables. Additionally, the value of the Durbin–Watson statistic(DW = 2.06) is close to 2 and; therefore, we could affirm that the regression errors are not autocorrelated.
The positive coefficients of X1, X2, X3, and X4 in the PLS model reveal the fact that businessexpenditures on R&D, private investments, jobs, and added value related to the recycling sector, GDPexpenditure on R&D by the business enterprise sector, and resource productivity have a positiveimpact on the RRMW, while the negative coefficient of X5 leads to the conclusion that any increasein environmental taxes would lead to a decrease in RRMW. The regulatory framework plays anessential role in modeling RRMW. This explains the fact that an increase of the expenses related to theenvironmental taxes could be an impediment for potential investors in ecological projects. No matterhow peculiar this conclusion may appear at a first glance, there are situations when the increase of theenvironmental taxes in the field of the waste can lead to the decrease of RRMW. First of all, a unitaryenvironmental tax in the field of waste does not lead directly to the increase of the RRMW, but adifferentiated tax system is required depending on the category of waste for which it is applied. Then,there is the entrepreneurs’ perspective: Decreasing the economic facilities of waste generators andincreasing their contributions will just demotivate them to get involved in recycling actions. Moreover,the opportunistic behavior of entrepreneurs may be developing, as they will look for other ways toelude the law and to be able to strengthen their profit. Additionally, the p-values associated withthe independent variables in Table 6 (prob.), compared to the 0.05 threshold, give us the conclusionthat all independent variables of the regression model were significant in their relationship with theendogenous variable, the RRMW.
The quantitative analysis concluded that the model was valid and the independent variableswere significant for RRMW in all 27 EU countries, since the values of the estimated coefficients ofthe regression model were statistically significant. The results of the paper confirm recent studies ofentrepreneurship innovation for recycling municipal waste [44,45].
5. Conclusions
The conclusions of our study were in line with the work of Bell et al. [46], who developed amultiple linear regression analysis to determine the impact of entrepreneurial innovation on therecycling of municipal waste in EU countries, partially explained by business expenditure on R&D,private investments, jobs, and the added value with respect to recycling. The results are also connectedto other studies [47,48], which underline that an important step of achieving a high rate of recyclingmunicipal waste is to rise resource productivity. The authors underline that resource productivity,private investments on recycling, and business expenditure on R&D for recycling are significant factorsof recycling management.
The regression analysis was based on a panel data retrieved from EUROSTAT over a timeframe ofeight years, so one of the limitations of this study is related to the time length of the analysis. Hence,

Sustainability 2019, 11, 5125 11 of 13
future studies should consider longer periods of time for their analyses, which may reveal a moreaccurate picture of the econometric model applied for the analyzed macroeconomic indicators.
Author Contributions: M.B. contributed to the gathering of the data and estimating the regression model; R.I.and C.L.T. provided general aspects for the conceptual and theoretical approach of the study; M.B. and C.S.B.contributed to putting together all the numerical results and to conclusions and recommendations, as well as tothe limitations of the study and further research; R.I. and C.L.T. contributed to the literature review; M.B. wasresponsible for the overall writing process.
Funding: This research was funded by the Romanian government through the CERTRAN project—The Upgradeof the Research Capacity in Economics through Development of a Transdisciplinary Research Infrastructure.
Acknowledgments: The research published in this article has been supported by the Romanian governmentthrough the CERTRAN project—The Upgrade of the Research Capacity in Economics through Development of aTransdisciplinary Research Infrastructure.
Conflicts of Interest: The authors declare no conflicts of interest.
Abbreviations
EU European UnionR&D Research and developmentGDP Gross domestic productRRMW Recycling rate of municipal wasteMSW Municipal solid wasteEUROSTAT Statistical Office of the European UnionDMC Domestic material consumptionPLS Pooled least squareOLS Ordinal least squareGERD Gross domestic expenditure on R&DUK United Kingdom
References
1. Amman, T.S.; Haffar, J.M.; Ghoneim, A.; Arabiyat, O. The influence of institutional and conductive aspectson entrepreneurial innovation Evidence from GEM data. J. Enterp. Inf. Manag. 2019, 32, 366–389.
2. Ignat, R. Premises and challenges of entrepreneurship in Romanian rural areas. Econ. Ser. Manag. 2012, 15,423–435.
3. Błazejowski, M.; Kwiatkowski, J.; Gazda, J. Sources of economic growth: A global perspective. Sustainability2019, 11, 275. [CrossRef]
4. Rosca, V. Sustainable development of a city by using a football club. Theor. Empir. Res. Urban Manag. 2010, 5,61–68.
5. Schumpeter, J.A. The Theory of Economic Development; Harvard University Press: Cambridge, UK, 1934.6. Nooteboom, B.; Stam, E. Micro-Foundations for Innovation Policy, Chapter: Entrepreneurship and Innovation;
Amsterdam University Press: Amsterdam, The Netherlands, 2008.7. Thurik, R.; Wennekers, S. Linking entrepreneurship and economic growth. Small Bus. Econ. 1999, 13, 27–56.8. Zhao, F. Exploring the synergy between entrepreneurship and innovation. Int. J. Entrep. Behav. Res. 2005, 11,
25–41. [CrossRef]9. Kralj, D. Innovative systemic approach for promoting sustainable innovation for zero construction waste.
Kybernetes 2011, 40, 275–289. [CrossRef]10. Venkateswaran, S. Managing waste: Ecological, economic and social dimensions. Econ. Political Wkly. 1994,
29, 2907–2911.11. Callan, S.J.; Thomas, J.M. Economies of Scale and Scope: A Cost Analysis of Municipal Solid Waste Services;
University of Wisconsin Press: Madison, WI, USA, 2001; Volume 77, pp. 548–560.12. Kang, J.; Lin, J.; Zhao, X.; Zhao, S.; Kou, L. Decomposition of the urban water footprint of food consumption:
A case study of Xiamen City. Sustainability 2017, 9, 135. [CrossRef]13. Johnstone, N.; Labonne, J. Generation of Household Solid Waste in OECD Countries: An Empirical Analysis Using
Macroeconomic Data; University of Wisconsin Press: Madison, WI, USA, 2004; Volume 80, pp. 529–538.
Sustainability 2019, 11, 5125 12 of 13
14. Trica, C.L. Eco-Entrepreneurial Development in the Rural Environmental Area, Rural Communities in the GlobalEconomy, Beyond the Classical Rural Economy Paradigms; Istudor, N., de Los Rios, I., Andrei, J.-V., Eds.; NovaScience Publishers: Hauppauge, NY, USA, 2017; ISBN 978-1-53610-255-0.
15. Grant, R. E-waste challenges in Cape Town Opportunity for the green economy? In Urban and SpatialChallenges in South Africa: Continuing The Conversation; Izziv, U., Ed.; Urbanisticni inštitut Republike Slovenije:Ljubljana, Slovenije, 2019; Volume 30, pp. 5–23.
16. Rode, S. E-Waste Management in Mumbai Metropolitan Region: Constraints and Opportunities, Theoretical andEmpirical Researches in Urban Management; Research Center in Public Administration and Public Services:Bucharest, Romania, 2012; Volume 7, pp. 89–103.
17. Borrello, M.; Caracciolo, F.; Lombardi, A.; Pascucci, S.; Cembalo, L. Consumers’ perspective on circulareconomy strategy for reducing food waste. Sustainability 2017, 9, 141. [CrossRef]
18. Zhai, Y.-M.; Sun, W.-Q.; Tsai, S.-B.; Wang, Z.; Zhao, Y.; Chen, Q. An empirical study on entrepreneurialorientation, absorptive capacity, and SMEs’ innovation performance: A sustainable perspective. Sustainability2018, 10, 314. [CrossRef]
19. Pargaru, I.; Dinu, M.; Teodor, C. Review and prospects of environmental problems in the city of Bucharest.Qual. Access Success 2017, 18, 302–306.
20. Fletcher, M.; Loane, S.; Rahman, M.; Fatima, N. Entrepreneurship and urban growth: Dimensions andempirical models. J. Small Bus. Enterp. Dev. 2011, 18, 608–626.
21. Ghura, H.; Li, X.; Harraf, A. Moderating relationship of institutions for opportunity entrepreneurship andeconomic development. World J. Entrep. Manag. Sustain. Dev. 2013, 13, 350–374. [CrossRef]
22. Trica, C.L.; Banacu, C.S.; Busu, M. Environmental factors and sustainability of the circular economy model atthe European Union level. Sustainability 2018, 11, 1114. [CrossRef]
23. Weerawardena, J.; Coote, L. An empirical investigation into entrepreneurship and organizationalinnovation-based competitive strategy. J. Res. Mark. Entrep. 2001, 3, 51–70. [CrossRef]
24. Mocanu, M.; Ciurea, C. Developing an index score for the internal auditor profile in Romania based on realdata analysis. Econ. Comput. Econ. Cybern. Stud. Res. 2019, 53, 93–111. [CrossRef]
25. Woodside, A.; Mir Bernal, P.; Coduras, A.; Woodside, A. Constructing cased-based macro models: Cultures’consequences on entrepreneurship, innovation, and quality-of-life. In Case Study Research: Core Skill Sets inUsing 15 Genres; Emerald Group Publishing Limited: Bingley, UK, 2016; pp. 433–488.
26. Farinha, L.; Ferreira, J.; Nunes, S. Linking innovation and entrepreneurship to economic growth. Compet. Rev.2018, 28, 451–475. [CrossRef]
27. Dobrea, R.; Molănescu, G.; Bus.u, C. Food Sustainable Model Development: An ANP Approach to PrioritizeSustainable Factors in the Romanian Natural Soft Drinks Industry Context. Sustainability 2015, 7, 10007–10020.[CrossRef]
28. Mourad, M. Recycling, recovering and preventing “food waste”: Competing solutions for food systemssustainability in the United States and France. J. Clean. Prod. 2016, 126, 461–477. [CrossRef]
29. Yabar, H.; Uwasu, M.; Hara, K. Tracking environmental innovations and policy regulations in Japan: Casestudies on dioxin emissions and electric home appliances recycling. J. Clean. Prod. 2013, 44, 152–158.[CrossRef]
30. Nemat, B.; Razzaghi, M.; Bolton, K.; Rousta, K. The role of food packaging design in consumer recyclingbehavior—A literature review. Sustainability 2019, 11, 4350. [CrossRef]
31. Jabłonska, B.; Kiełbasa, P.; Korenko, M.; Drózdz, T. Physical and chemical properties of waste from PETbottles washing as a component of solid fuels. Energies 2019, 12, 2197. [CrossRef]
32. Paunov, C. The global crisis and firms’ investments in innovation. Res. Policy 2012, 41, 24–35. [CrossRef]33. Caniato, F.; Caridi, M.; Crippa, L.; Moretto, A. Environmental sustainability in fashion supply chains: An
exploratory case-based research. Int. J. Prod. Econ. 2012, 135, 659–670. [CrossRef]34. Dangelico, R.M.; Pujari, D. Mainstreaming green product innovation: Why and how companies integrate
environmental sustainability. J. Bus. Ethics 2010, 95, 471–486. [CrossRef]35. Horbach, J.; Rennings, K. Environmental innovation and employment dynamics in different technology
fields—An analysis based on the German Community Innovation Survey 2009. J. Clean. Prod. 2013, 57,158–165. [CrossRef]
36. da Cruz, N.F.; Simões, P.; Marques, R.C. Economic cost recovery in the recycling of packaging waste: Thecase of Portugal. J. Clean. Prod. 2012, 37, 8–18. [CrossRef]
Sustainability 2019, 11, 5125 13 of 13
37. Busu, M. Adopting circular economy at the European Union Level and its impact on economic growth.Soc. Sci. 2019, 8, 159. [CrossRef]
38. Weetman, C. A Circular Economy Handbook for Business and Supply Chains: Repair, Remake, Redesign, Rethink;Kogan Page Publishers: London, UK, 2016; ISBN 13 078-0749476755.
39. Eurostat. Your Key to European Statistics. 2017. Available online: http://ec.europa.eu/eurostat (accessed on24 June 2019).
40. Hozo, S.P.; Djulbegovic, B.; Hozo, I. Estimating the mean and variance from the median, range, and the sizeof a sample. BMC Med Res. Methodol. 2005, 5, 13. [CrossRef]
41. Dabholkar, P.A.; Shepherd, C.D.; Thorpe, D.I. A comprehensive framework for service quality: Aninvestigation of critical conceptual and measurement issues through a longitudinal study. J. Retail. 2000, 76,139–173. [CrossRef]
42. Schmidheiny, K. Panel Data: Fixed and Random Effects. Basel Universität, 2016. Available online:http://www.schmidheiny.name/teaching/panel2up.pdf (accessed on 18 July 2019).
43. Block, J. Long-Term Orientation of Family Firms: An Investigation of R&D Investments, Downsizing Practices, andExecutive Pay; Gabler: Wiesbaden, Germany, 2009. Available online: https://link.springer.com/book/10.1007/
978-3-8349-8412-8 (accessed on 18 August 2019).44. Rada, E.C.; Zatelli, C.; Cioca, L.I.; Torretta, V. Selective collection quality index for municipal solid waste
management. Sustainability 2018, 10, 257. [CrossRef]45. Rada, E.C.; Bresciani, C.; Girelli, E.; Ragazzi, M.; Schiavon, M.; Torretta, V. Analysis and measures to improve
waste management in schools. Sustainability 2016, 8, 840. [CrossRef]46. Bell, J.; Paula, L.; Dodd, T.; Nemeth, S.; Nanou, C.; Mega, V.; Campos, P. EU ambition to build the world’s
leading bioeconomy—Uncertain times demand innovative and sustainable solutions. New Biotechnol. 2018,40, 25–30. [CrossRef] [PubMed]
47. Silva, A.; Rosano, M.; Stocker, L.; Gorissen, L. From waste to sustainable materials management: Three casestudies of the transition journey. Waste Manag. 2017, 61, 547–557. [CrossRef] [PubMed]
48. Troschinetz, A.M.; Mihelcic, J.R. Sustainable recycling of municipal solid waste in developing countries.Waste Manag. 2009, 29, 915–923. [CrossRef] [PubMed]
© 2019 by the authors. Licensee MDPI, Basel, Switzerland. This article is an open accessarticle distributed under the terms and conditions of the Creative Commons Attribution(CC BY) license (http://creativecommons.org/licenses/by/4.0/).