ENTOM 490 Grape Pest Management Lecture 1 Integrated Pest Management
69
ENTOM 490 Grape Pest Management Lecture 1 Integrated Pest Management Principles Lecturer: Allan Felsot Professor, Dept. of Entomology Food & Environmental Quality Lab Rm 128 East [email protected] Phone: 372-7365
Transcript of ENTOM 490 Grape Pest Management Lecture 1 Integrated Pest Management

ENTOM 490Grape Pest Management
Lecture 1
Integrated Pest ManagementPrinciples
Lecturer:Allan FelsotProfessor, Dept. of EntomologyFood & Environmental Quality LabRm 128 [email protected]: 372-7365
Why Do Organisms Become Pests?
How Do We Cope with Pests?
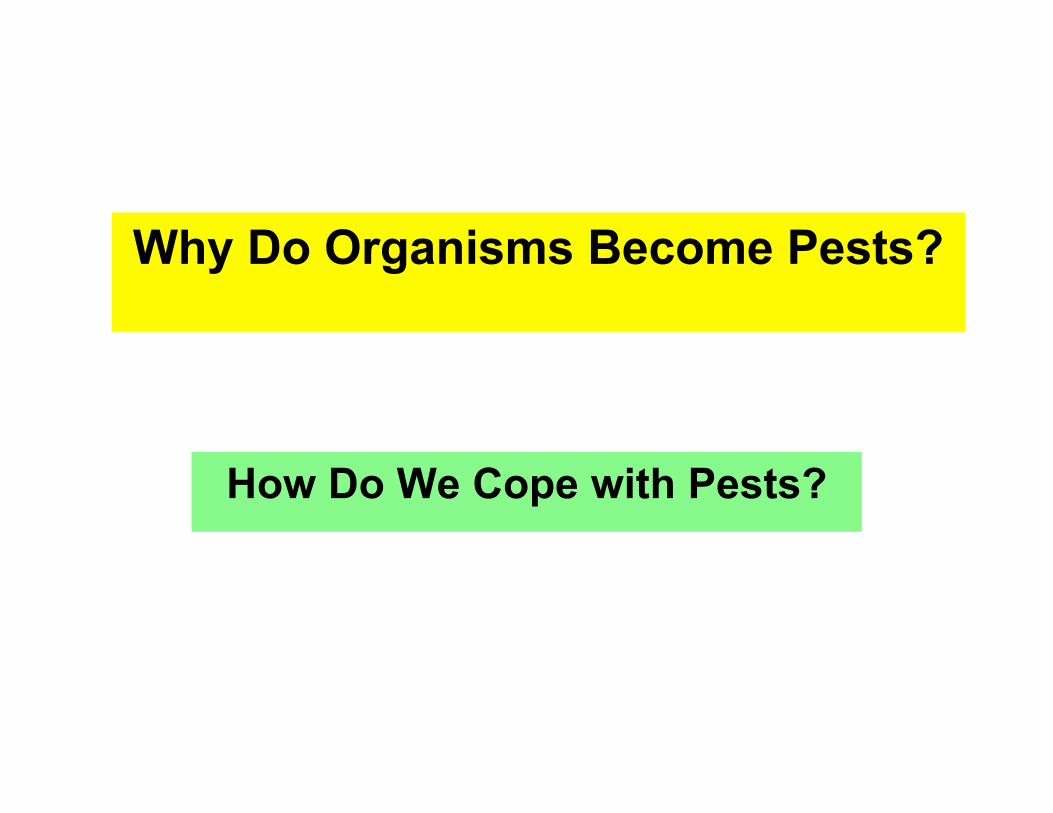
Grape Pest Management
• Lecture 1: Integrated Pest Management– Historical Overview– Principles & Strategies– Overview of crop protection technology
• Lecture 2: Pesticide technology– Use of pesticides on grapes– Regulatory control of pesticides– Human & Ecological Toxicity Testing for
Registration

• Lecture 3: Mode of Action of GrapePesticides Against Pests– Herbicides– Insecticides– Fungicides
• Lecture 4: Using Pesticides– The Product Label and MSDS– Safety Considerations– Application Technology– Adjuvants
Grape Pest Management

Why Do Organisms Become Pests?
Natural vs. Agricultural Ecosystems

Natural vs. Agroecosystems
Natural Ecosystems– Diversity rich– Plant nutrients stored &
recycled– Infrequent perturbations– Dominated by native
species– Good natural control
Agroecosystems– Diversity poor– Plant nutrients
depleted– Frequent perturbations– Invaded by exotic
species– Poor natural control

Agroecosystems DemandManagement
Easier for one species to become dominantNutrients are continually removed by annualharvestingPest can be native or imported– pests are opportunists– consider presence or absence of mortality
factors as limiting or enhancing factor
Conflict among economic value of crop, itssusceptibility to damage from pests, and removalof nutrients demands management of both thepest and the crop.

Why Are Pests Pests?
Limited tolerance for damageChange in physical conditionsChange in food sourcesChange in mortality factors– Disease– Predators & Parasitoids
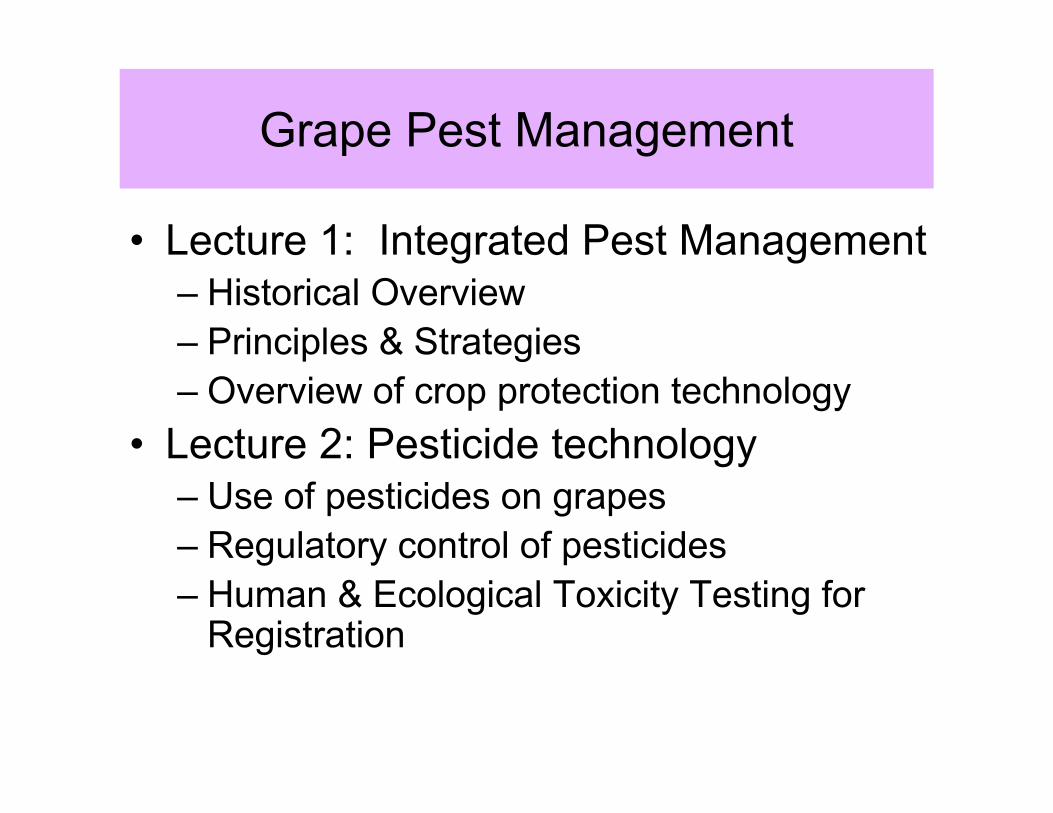
Knutson et al 1993
fresh processedvegetables
fresh processed fruit
-80
-60
-40
-20
0
% YieldReduction
� 50% reduction � zero use
Estimated Effects of Reduction in Pesticide Use
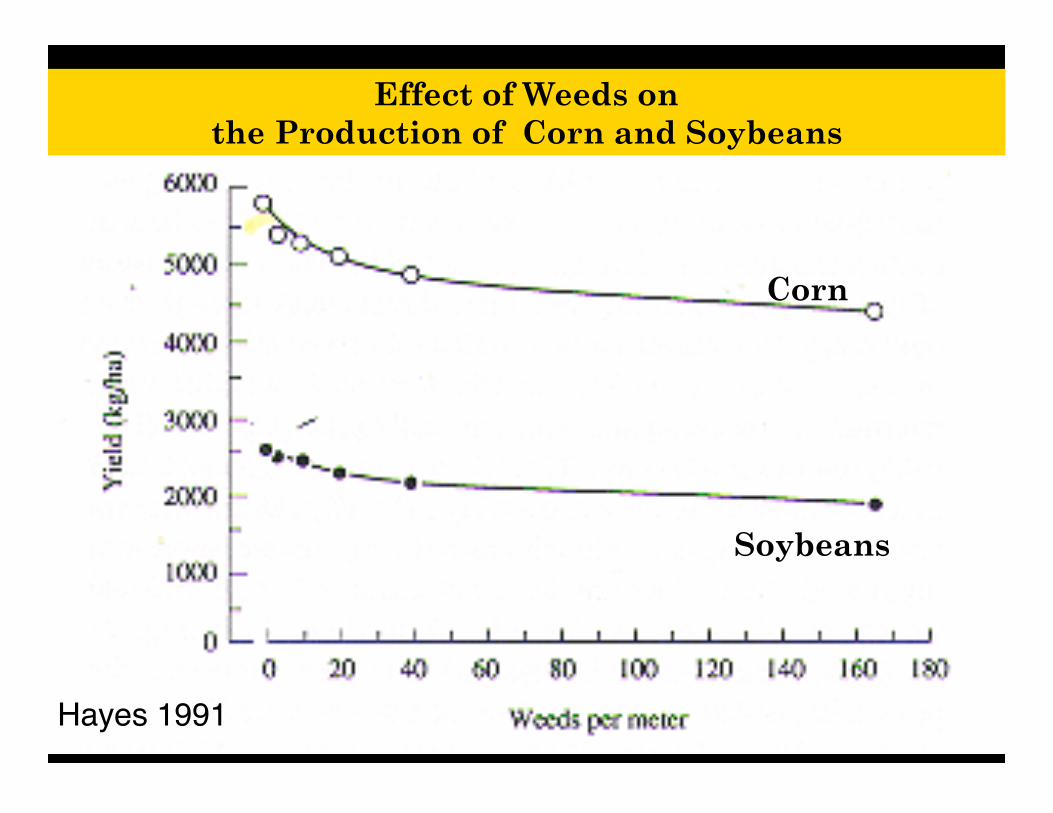
Effect of Weeds onthe Production of Corn and Soybeans
Corn
Soybeans
Hayes 1991

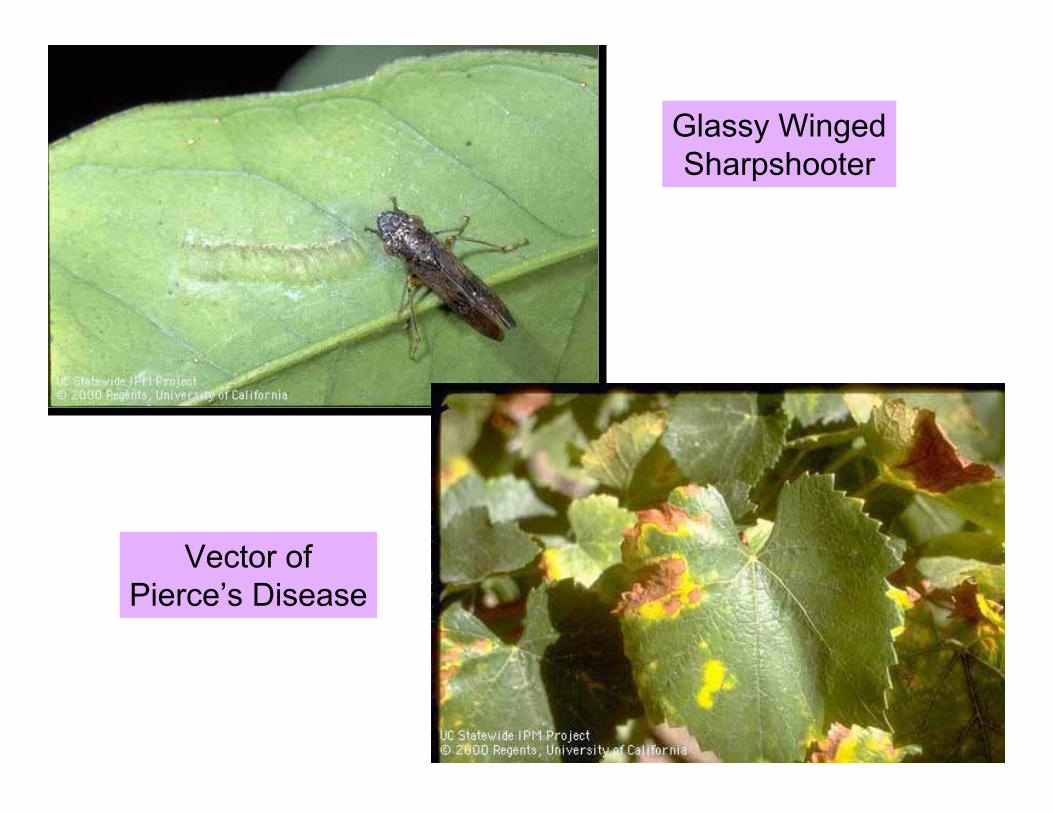
Glassy WingedSharpshooter
Vector ofPierce’s Disease
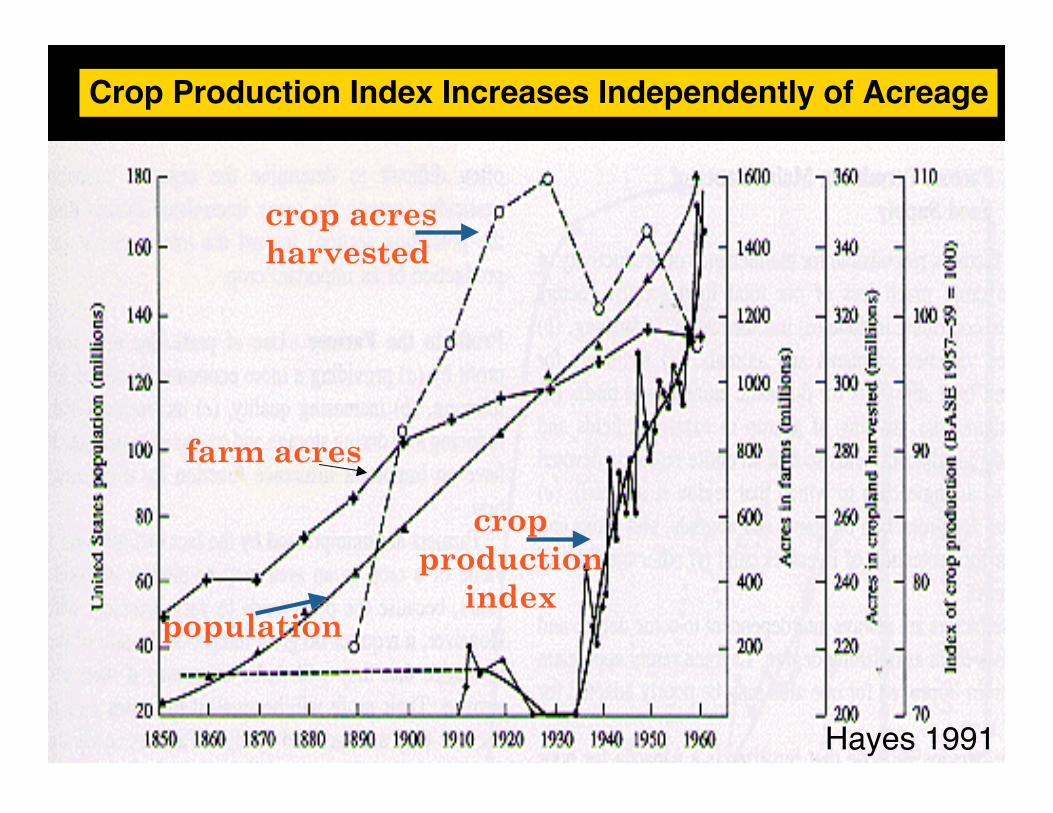
cropproduction
index
crop acresharvested
farm acres
population
Crop Production Index Increases Independently of Acreage
Hayes 1991
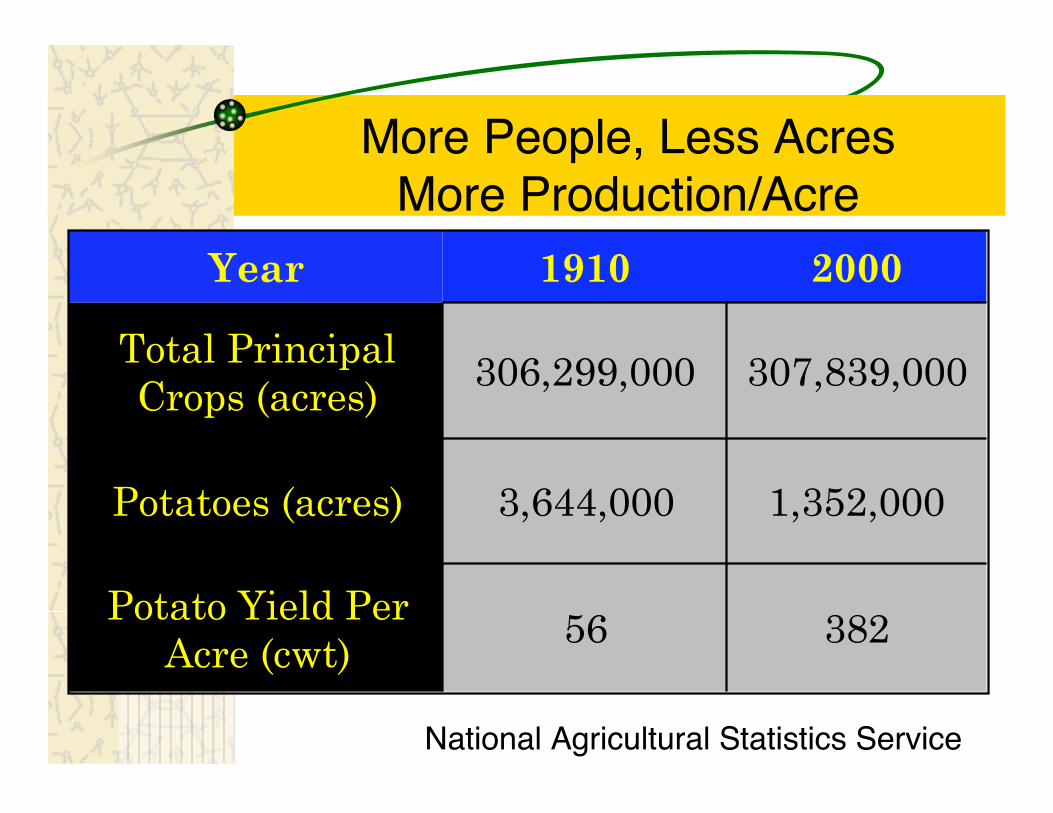
306,299,000
3,644,000
307,839,000
1,352,000
56 382
Total PrincipalCrops (acres)
Potatoes (acres)
Potato Yield PerAcre (cwt)
1910 2000Year
More People, Less AcresMore Production/Acre
National Agricultural Statistics Service
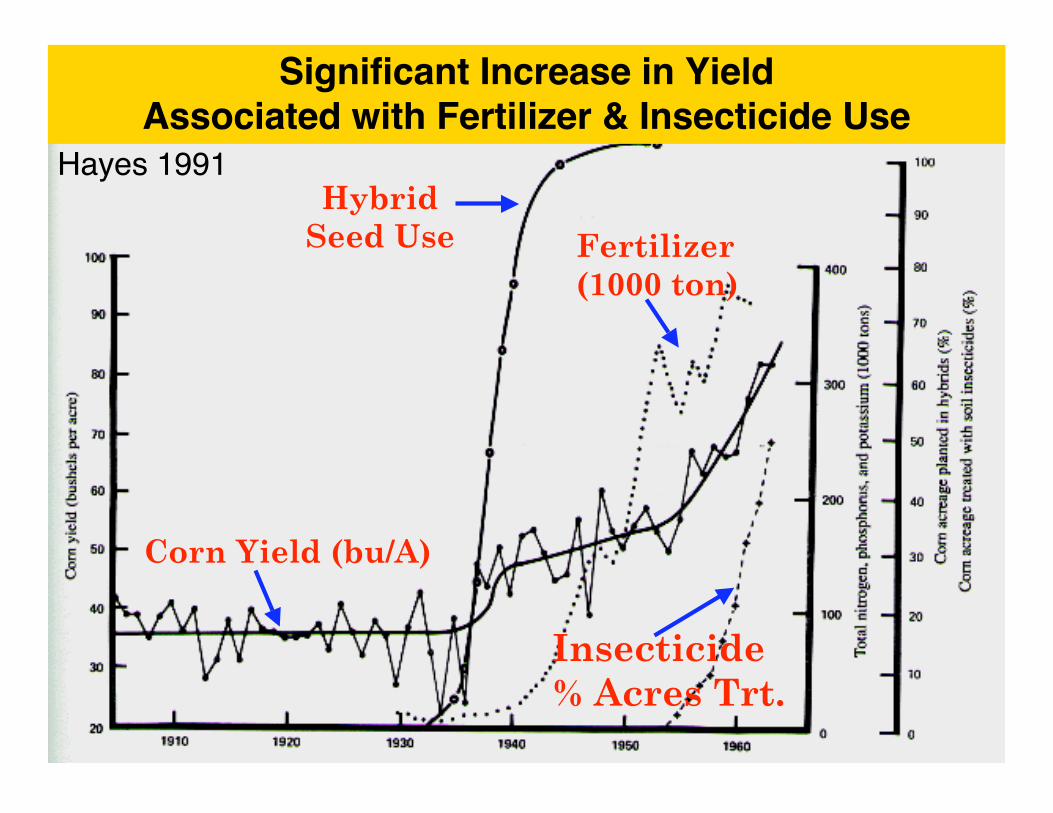
Corn Yield (bu/A)
HybridSeed Use Fertilizer
(1000 ton)
Insecticide% Acres Trt.
Significant Increase in YieldAssociated with Fertilizer & Insecticide Use
Hayes 1991
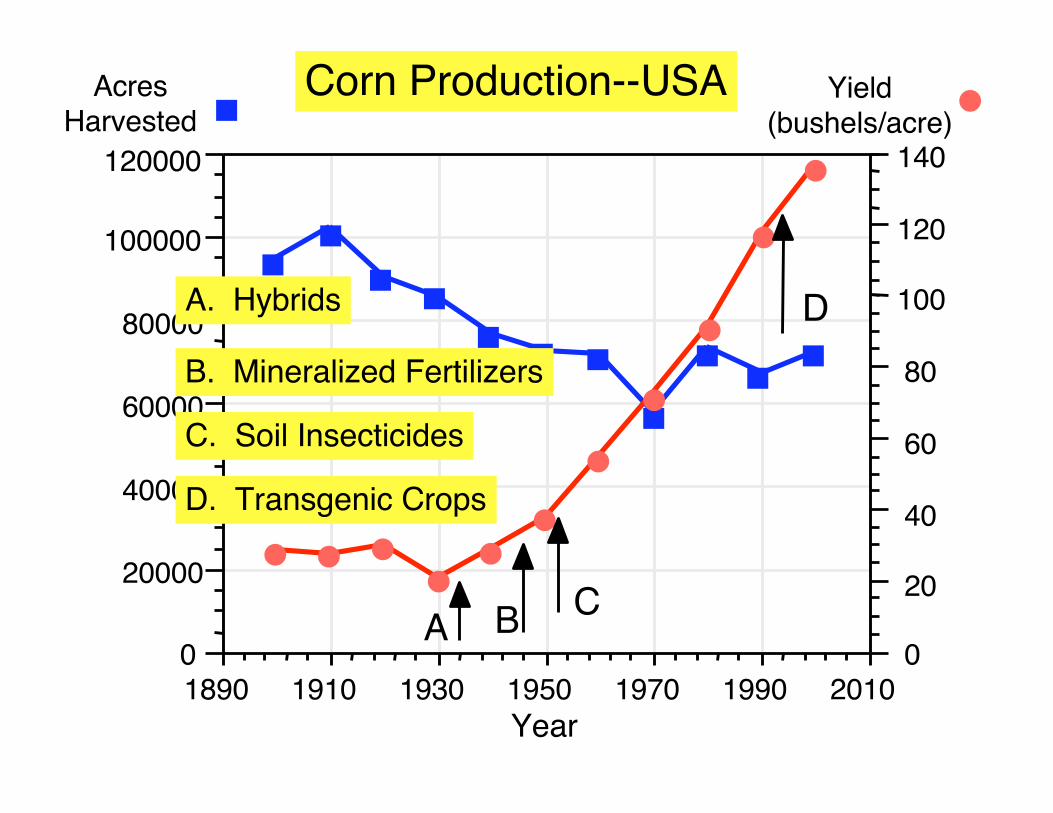
�Yield(bushels/acre)
Year
�Acres
Harvested
��
�
�
���
��
��
�
�
�
�
�
��
����
0
20000
40000
60000
80000
100000
120000
0
20
40
60
80
100
120
140
1890 1910 1930 1950 1970 1990 2010
Corn Production--USA
A
A. Hybrids
B
B. Mineralized Fertilizers
C
C. Soil Insecticides
D
D. Transgenic Crops
The Down Side of Pesticides
Worker exposure & poisoningPest resistanceReduction of natural enemiesPotential for adverse environmentalhealth effectsPotential for human health effects

8123TOTAL
200Government regulations for prevention
1800Groundwater contamination
2100Bird losses
24Fishery losses
942Crop losses
320Honeybee and pollination losses
1400Cost of pesticide resistance
520Loss of natural enemies
30Domestic animals deaths & contamination
787Public health impacts
Million $/yrCosts
Estimated Total U.S. Economic & Social CostsAssociated with Pesticide Use (Pimental et al. 1993)
Reconciliation
Integrated Control ConceptIntegrated Pest ManagementEcologically Based Pest ManagementSustainable Agriculture
Integrated Control Concept
First enunciated by Stern et al. (1959) as aresponse to problems with pest controlstrategies (or lack thereof) in the era of DDT– Pest arthropods resistance to insecticides– Secondary outbreaks of arthropod pests other than
those against which control was originally directed– Rapid resurgence of treated pest species
necessitating repetitious pesticide applications– Pesticide residues on food and forage crops– Hazards to pesticide handlers and to persons,
livestock, and wildlife subjected to contamination bydrift
– Legal complications from suits and other actionspertaining to the above problem

Pesticide Spray Drift ProblemsHistorical Perspective
1945-46, CA: Drift of calcium arsenate fromtomato fields causes death of dairy animals fedhay from adjacent alfalfa field1952, CA: Civil Aeronautics Administration (FAA)bans use of 2,4-D dust due to widespreaddamage to cotton and grapes from use onnearby cereal grains1952-53: At least nine crop-dusting cases reachappellate courts (suggesting many more casesat lower courts)
Why Did Problems inPest Control Arise during the 1950’s?
Limited knowledge of biological science– Population ecology; community ecology
Narrow approach to insect control– DDT seen as “silver bullet”; rapidly adopted to
exclusion of other tactics
Few studies on effects of chemicals on othercomponents of ecosystem besides pestsPressure to solve problems NOWSome skeptical that biotic factors are of anyconsequence in the control of pest populations
According to Sterns et al. (1959)

The Solution: Integration ofBiological & Chemical Control
Biological control: “The action of parasites,predators, or pathogens on a host or preypopulation which produces a lower averagedensity than would prevail in the absence ofthese agents”– A.K.A. natural control mechanism in natural
populations– May or may not be sufficient to lower pest population
to economic insignificance
Chemical control: Use of chemicals (syntheticor botanical) to reduce pest populations that riseto damaging levels
The Solution: Integration ofBiological & Chemical Control
“Biological control and chemical control are notnecessarily alternative methods;”– “in many cases they may be complementary, and with
adequate understanding, can be made to augment onanother.”
“One reason for the apparent incompatibility ofbiological and chemical control is our failure torecognize that the control of arthropodpopulations is a complex ecological problem.”– “This leads to the error of imposing insecticides on the
ecosystem, rather than fitting them into it.”
Stern et al. 1959

Integrated Control Concept
Applied pest control which combines andintegrates biological and chemical control– Chemical control is used as necessary and in
a manner which is least disruptive tobiological control
– Integrated control may make use of naturallyoccurring biological control as well asbiological control effected by manipulated orintroduced biotic agents

Integrated Pest Management
Born as the Integrated Control Concept– Integration of biological control, cultural practices, and
chemical control
Definition: An ecologically based system formanaging pest populations to protect publichealth or to allay economic loss to a crop
Objective (from Huffaker & Smith 1980)– “The development of improved, ecologically oriented
pest management systems that optimize, on a long-term bases, costs and benefits of crop protection.”

IPM’s Three Broad Objectives
Maintain profitability, or economic soundness,when managing pests– i.e, pest management actions should be economically
justified
Minimize selection pressure on pest populationsfrom management tactics– i.e., manage to avoid development of pest resistance
Maintain environmental quality– i.e., minimize the impact of management tactics on
the environment
Funderburk & Higley 1994
Essential Elements of IPM
Correctly identify pest & its life history(bionomics)Characterize population dynamicsDevelop economic injury levels andthresholdsDevelop scouting & sampling plansDevelop alternative control options

Pest Identification
Systematics– Classification of organisms
• Thus, correct identification of species– Phylogenetic/evolutionary relationships
Natural History– Life cycle– Phenology
• Development of an organism in relation to time
• How does pest phenology relate to phenology of the crop?
– How does the organism feed, grow, infect, etc.• What is the effect on the plant?
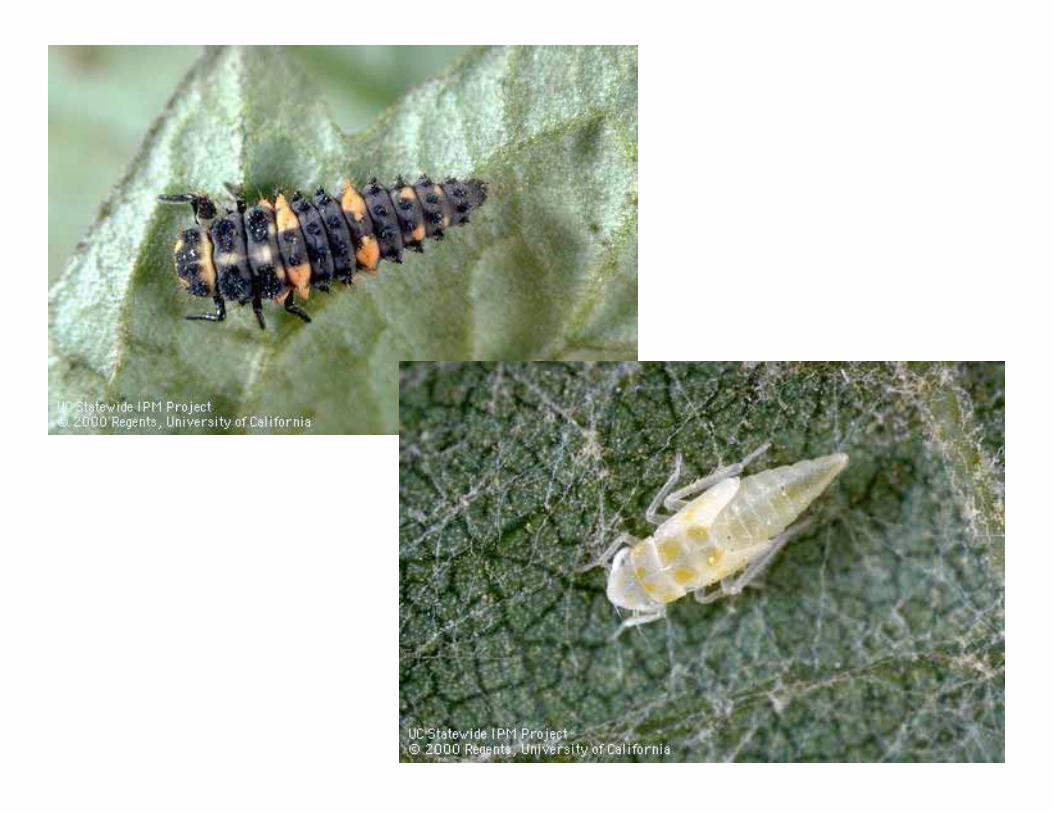

Which Mite Might Be Beneficial?
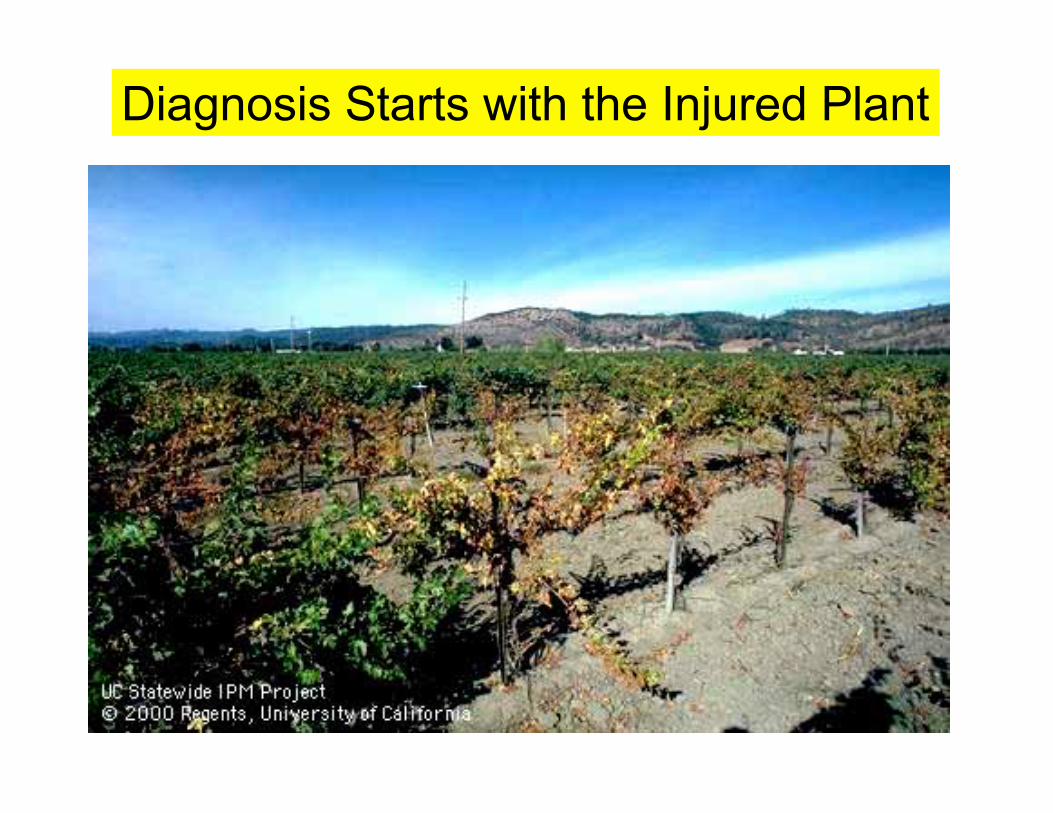
Diagnosis Starts with the Injured Plant

Taking Action RequiresKnowing The Biology
GrapePhylloxera
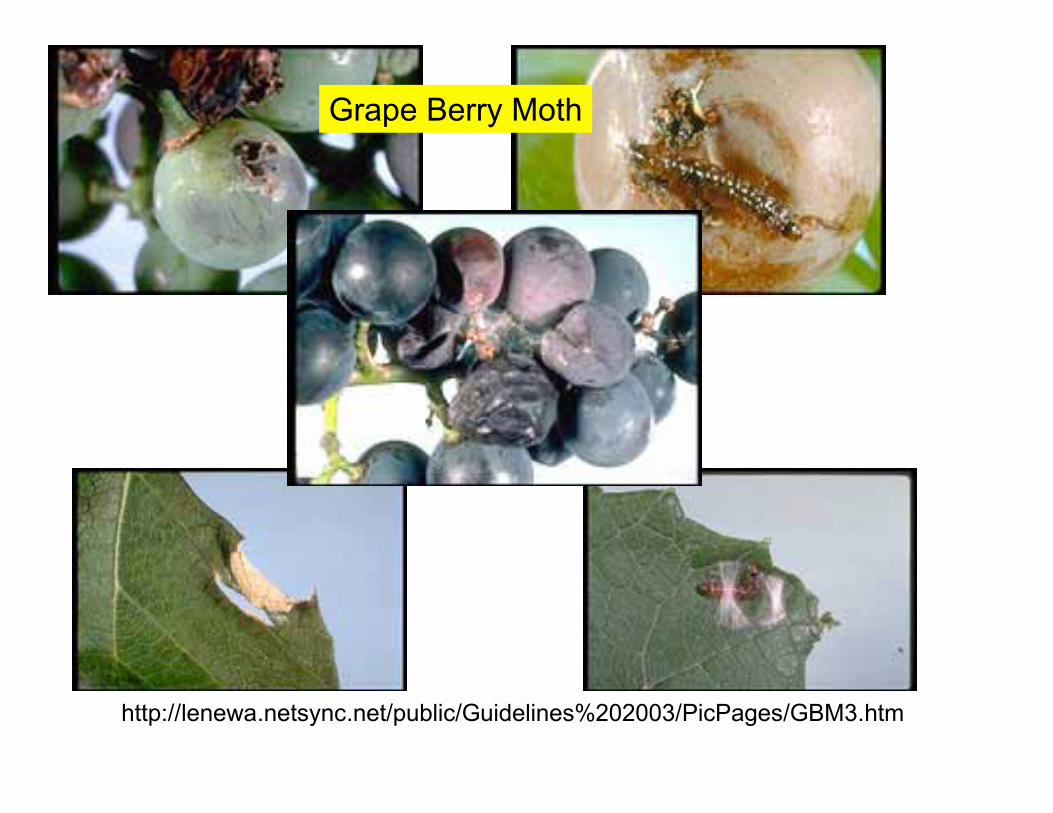
http://lenewa.netsync.net/public/Guidelines%202003/PicPages/GBM3.htm
Grape Berry Moth

Patterns (Phenology)of Grape Berry MothEgg Deposition on
Wild Grapes at TwoLocations in New York
Date5/20 6/29 8/8 9/17 10/27
1987
1988
Hoffman et al. 1992
How many mothgenerations per cropseason?
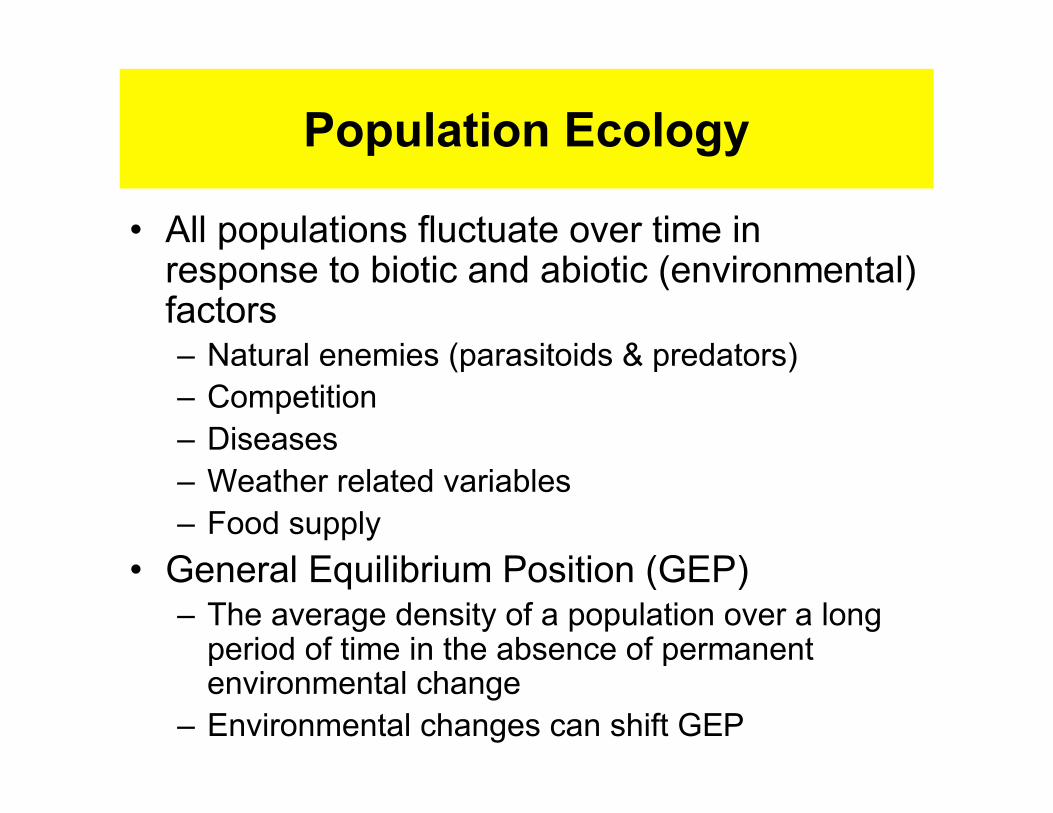
Population Ecology
• All populations fluctuate over time inresponse to biotic and abiotic (environmental)factors– Natural enemies (parasitoids & predators)– Competition– Diseases– Weather related variables– Food supply
• General Equilibrium Position (GEP)– The average density of a population over a long
period of time in the absence of permanentenvironmental change
– Environmental changes can shift GEP

Pop
ulat
ion
Den
sity
Time
GeneralEquilibriumPosition (GEP)
Insect Populations Fluctuate in Response toBiotic & Environmental Factors

Population Ecology and RelationshipBetween Pest Control Action
• Economic Injury Level (EIL)– The lowest population density that will
cause economic damage• Economic damage is the amount of injury that
will justify the cost of a control measure
• Variable depending on season, location, marketeconomics
EIL =Control Cost
Commodity Value x Yield Loss per Pest

Economic Injury Level (EIL)P
opul
atio
n D
ensi
ty
Time
GeneralEquilibriumPosition (GEP)

• Economic Threshold (ET)– The density at which control measures
should be determined to prevent anincreasing pest population from reachingthe economic injury level
• Lower than the EIL (for example, can be set at80% of EIL)
• Permits sufficient time for the initiation ofcontrol measures
• Permits time for control measures to take effectbefore population reaches the EIL
Population Ecology and RelationshipBetween Pest Control Action

Economic Injury Level (EIL)
Economic Threshold (ET)P
opul
atio
n D
ensi
ty
Time
GeneralEquilibriumPosition (GEP)
No Action Necessary

Economic Injury Level (EIL)
Economic Threshold (ET)
Pop
ulat
ion
Den
sity
Time
GeneralEquilibriumPosition (GEP)
Control Measures Implemented
Economic Injury Level (EIL)
Economic Threshold (ET)
Pop
ulat
ion
Den
sity
Time
GeneralEquilibriumPosition (GEP)
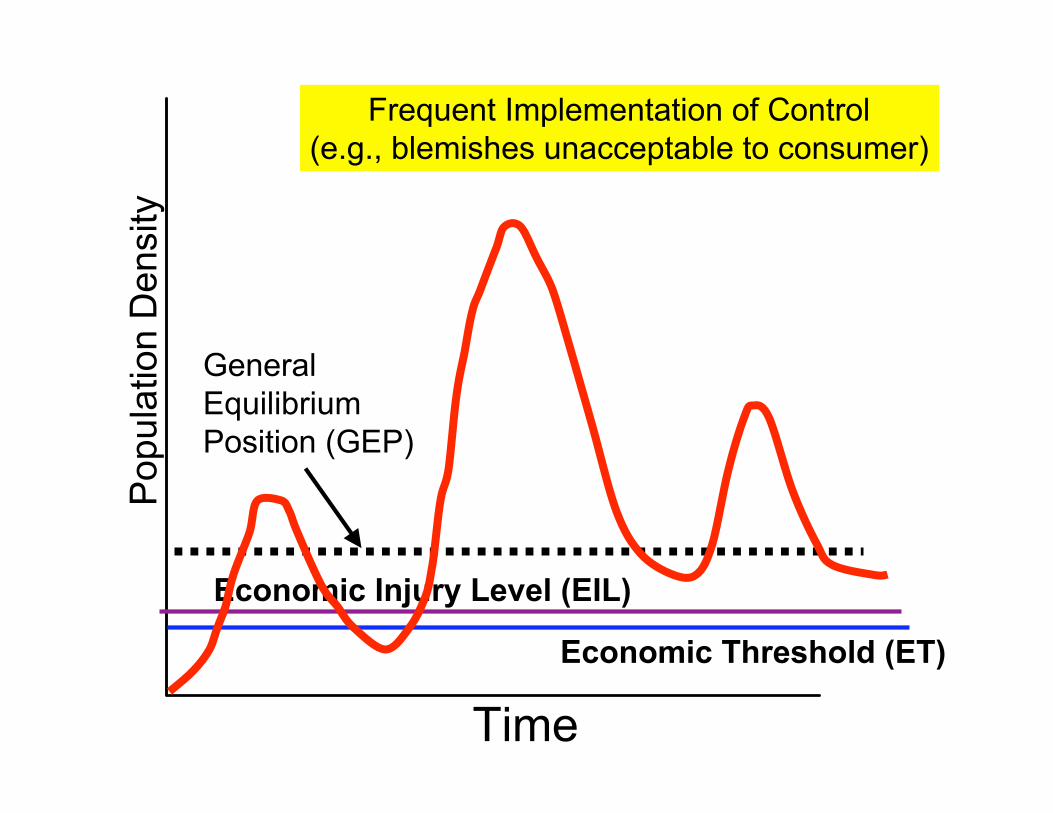
Frequent Implementation of Control(e.g., blemishes unacceptable to consumer)

Economic Threshold (ET)
Pop
ulat
ion
Den
sity
Time
GeneralEquilibrium
Position (GEP)
Frequent Implementation of Control Necessary(e.g., blemishes unacceptable to consumer)
Treatment
Economic Injury Level (EIL)
Monitoring Populations(Scouting and Sampling Plans)
• Collecting pests and measuring density– Direct collection
• Counting bodies (weed counts; presence or absence ofinsects; Infected planted parts; insect or disease injury)
– Trapping• Baits
• Elucidating the relationship between thesampled units and the plant injury– Corollary is understanding the relationship
between plant injury and economic damage

Date
Strong Phenological Correspondence Between Egg Deposition byGrape Berry Moth on Wild Grapes and Pheromone Trap Catch in
an Adjacent Vineyard (Hoffman et al. 1992)
1987
1988
5/5 6/24 8/13 10/2
Num
ber
of M
oths
Per
Tra
p P
er W
eek
Num
er of Eggs P
er 1000G
rape Berries
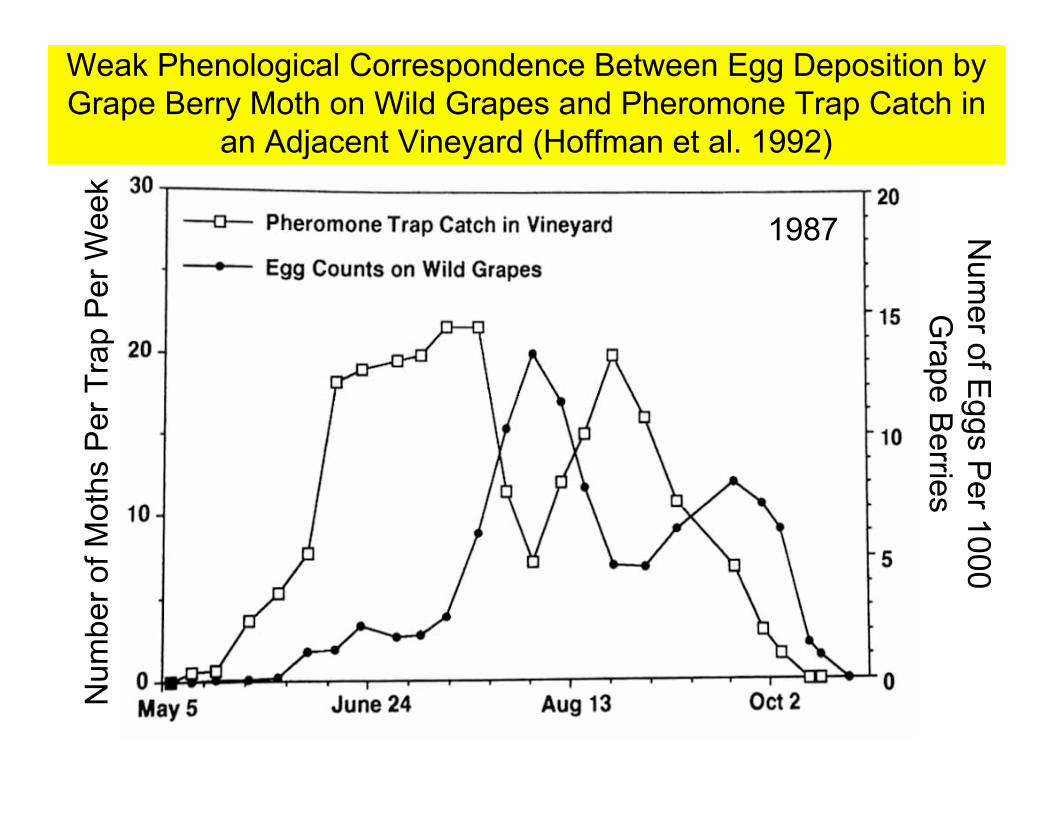
Weak Phenological Correspondence Between Egg Deposition byGrape Berry Moth on Wild Grapes and Pheromone Trap Catch in
an Adjacent Vineyard (Hoffman et al. 1992)
1987
Num
ber
of M
oths
Per
Tra
p P
er W
eek
Num
er of Eggs P
er 1000G
rape Berries

Percentage Damaged Berry Clusters During the Third Week in July
Per
cent
age
Dam
aged
Ber
ries
at H
arve
st
Hoffman et al. 1992
Relationship Between Percentage Cluster Damage by GrapeBerry Moth During Third Week in July and Percentage Berry
Damage at Harvest (Hoffman et al. 1992)
Early-Harvested Variety

Percentage Damaged Berry Clusters During the Third Week in July
Per
cent
age
Dam
aged
Ber
ries
at H
arve
st
Relationship Between Percentage Cluster Damage by GrapeBerry Moth During Third Week in July and Percentage Berry
Damage at Harvest (Hoffman et al. 1992)
Late-Harvested Variety
• Making a decision as to when economicthreshold is reached– Fixed sampling plans
– Sequential sampling plans
Monitoring Populations(Scouting and Sampling Plans)

Fixed Sampling Plans
• Number of plant samples or units to besampled is fixed
• Decision to treat is made when a fixedproportion of the sampled units has exceededthe infestation number or damage threshold
• Example (based on Nault & Kennedy 1996)– European corn borer larvae bore into potato stems
in southeast US– Economic threshold is 30% damaged stems– Scouts samples 100 potato stems in an 18-30 ha
area (10 sites within the area X 10 stems per site)

Sequential Sampling Plans
• A binomial sampling plan (pest or injurypresent/not present on each sampling unit)that is based on the probability (likelihood) ofthe population density exceeding theeconomic threshold with each incrementalobservation (sample)– Faster and more efficient than fixed sampling– Construct a graph with decision lines that “tell” the
scout to stop sampling and not treat, continuesampling, or stop sampling and implement controlwith each successive sample observed

Stop Sampling;Spray Recommended
Stop SamplingNo Spray
ContinueSampling
Number of Sites Sampled
Cum
ulat
ive
Num
ber
of
Dam
aged
Pot
ato
Ste
ms
Sequential Sampling Plans for European Corn BorerIn Potato Stems (Economic Threshold = 10% Damage)
Nault & Kennedy 1996

Stop Sampling;Spray Recommended
Stop SamplingNo Spray
ContinueSampling
Number of Sites Sampled
Cum
ulat
ive
Num
ber
of
Dam
aged
Pot
ato
Ste
ms
Sequential Sampling Plans for European Corn BorerIn Potato Stems (Economic Threshold = 30% Damage)
Nault & Kennedy 1996

Pest Management Tactics
• Preventive– Tactics used to avoid potential pest problems
• Practices can be implemented without knowledgeof pest density
• Therapeutic– Actions used to remedy or ameliorate an existing
problem• Practices should be implemented when pest
density is likely to become economically damaging• May be used when economically damaging pest
density cannot be feasibly detected by scouting orcannot be reliably controlled by rescue pesticideapplications
(Based on Funderburk and Higley 1994)
Pest Management Tools
Cultural practices
Mechanical control
Plant resistance
Parasitoids & Predators
Pesticides
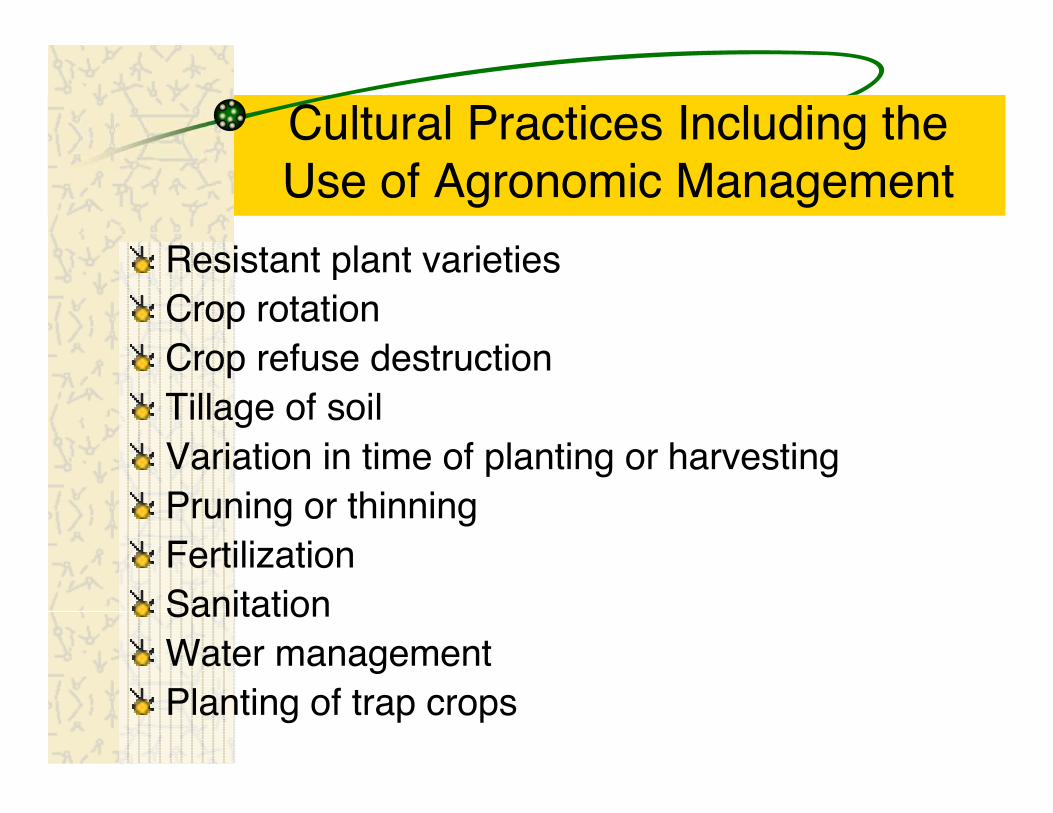
Cultural Practices Including theUse of Agronomic Management
Resistant plant varietiesCrop rotationCrop refuse destructionTillage of soilVariation in time of planting or harvestingPruning or thinningFertilizationSanitationWater managementPlanting of trap crops

Mechanical Methods
Hand destructionExclusion by screen, barriersTrapping, suction devices, collectingmachinesCrushing and grinding

Biological Control(Parasitoids & Predators)
Protection and encouragement of naturalenemies (augmentation)Introduction, artificial increase, and colonizationof specific parasitoids and predatorsPropagation and dissemination of specificbacteria, virus, fungus, and protozoan diseases
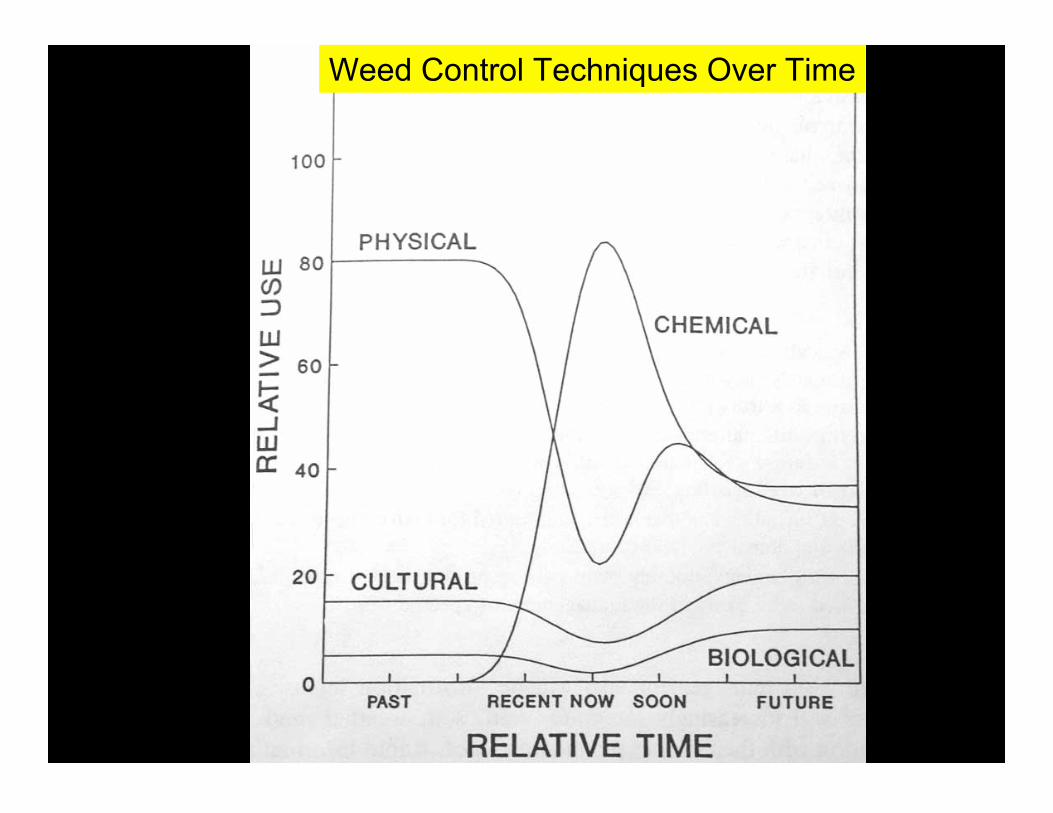
Weed Control Techniques Over Time

Why Don’t Growers Use More MicrobialPesticides and Biological Controls?
� Specificity not matched
� Microbials can’t reach “internal” feeders
� Not broad spectrum
� Not as effective
� May be slower
� Not useful under all climate conditions
� May not exist
� Long lead time for development

Definitions: ‘Pesticide’
Defined by law, Federal Insecticide, Fungicide, &Rodenticide Act (FIFRA, 1947)Any substance or mixture intended forpreventing, destroying, repelling, or mitigatingany pestPest: insect, rodent, plant, virus, bacteria, fungi– Exempted: microbes living on or in humans– Includes: whatever the EPA administrator rules to be
a pest
Includes plant growth regulators, defoliants,pheromones, desiccants, disinfectants

Economic return-cost ratio favorable– $4 - $29 returned per $1 spent– However,
• Ratio goes down when– price of crop decreases but pesticide cost is
fixed;– a product is used and pest populations are not
at a level that will cause economic damage– development costs for a new product are high
Advantages of Pesticides
Advantages of Pesticides
Many times they are the only practicalor available technologyRapid action– can be used in an emergency– biodegradable (modern pesticides)
Wide range of properties, uses, andmethods of application– broad spectrum to selective

MarketValue
Total Production Expenses
Labor Fertilizer Pesticides0
50000
100000
150000
2000001992
1997
Farming Costs & Returns
USDA Database
$ x 106

Organic Agriculture
Some people believe organic agriculture doesnot use pesticidesA visit to the WA State Dept. of AgricultureOrganic web site indicates there are manycertified organic pesticides registered– Bt sprays– Neem– Pyrethrums– Boric acid– Soaps– Oils

� Use of selective insecticides� Only treating areas where pest-
natural enemy ratio is unfavorable� Proper timing of pesticide use� Rapidly degradable pesticide
Characteristics of Pesticides & UseCompatible with IPM
Over 225 Different Crops GrownCommercially in WA

Are We On a Treadmill?
Costs of Research & Development areextremely high– $70 million– It may take 15 years to recover a positive
cash flow
Is pesticide use rising significantly?