Developing a cohesive digital presence for your charity and social enterprise organisation

St. John Fisher CollegeFisher Digital Publications
Education Doctoral Ralph C. Wilson, Jr. School of Education
8-2012
Enterprise Risk Management: FrameworkPresence and EffectivenessErika P. McBrideSt. John Fisher College
How has open access to Fisher Digital Publications benefited you?Follow this and additional works at: http://fisherpub.sjfc.edu/education_etd
Part of the Education Commons
This document is posted at http://fisherpub.sjfc.edu/education_etd/18 and is brought to you for free and open access by Fisher Digital Publications atSt. John Fisher College. For more information, please contact [email protected].
Recommended CitationMcBride, Erika P., "Enterprise Risk Management: Framework Presence and Effectiveness" (2012). Education Doctoral. Paper 18.
Please note that the Recommended Citation provides general citation information and may not be appropriate for your discipline. Toreceive help in creating a citation based on your discipline, please visit http://libguides.sjfc.edu/citations.

Enterprise Risk Management: Framework Presence and Effectiveness
AbstractThe field of enterprise risk management (ERM) was born from corporate scandals early in this century.COSO published its Integrated Framework in 2004, outlining eight ERM components that, when present andfunctioning effectively, provide reasonable assurance an organization will meet its objectives. Since then,organizations have been increasingly urged to adopt risk oversight practices, with research conducted tomeasure the level of ERM framework adoption. These studies show varying levels of ERM application, withminimal evidence of ERM effectiveness. To consolidate existing studies, a fixed effects meta-analysis ofproportions was conducted, revealing a 47.4% level of framework adoption. An experiment was alsoperformed to determine the effectiveness of ERM methods. A test group was provided training on the ERMrisk assessment method of heat mapping, versus a control group that learned ERM framework history. Bothgroups were provided a list of scenarios, and were asked to determine which risks should be mitigated. Thetesting group showed improvement in risk-reduction decisions, confirmed by a one-tail t -test, where t (46) =- 3.57, p = 0.0004, and Cohen’s d of 1.02, indicating a statistically significant difference in group means as aresult of the treatment. These findings highlight an opportunity to conduct additional research to gain greaterinsight into organizations that have yet to adopt an ERM framework, while further analysis should also beconducted into the effectiveness of other ERM tools. Ultimately, this research provides greater impetus forERM adoption, potentially critical protections against the next economic downturn.
Degree TypeDissertation
Degree NameDoctor of Education (EdD)
DepartmentExecutive Leadership
First SupervisorJason Berman
Second SupervisorBruce Blaine
Subject CategoriesEducation
This dissertation is available at Fisher Digital Publications: http://fisherpub.sjfc.edu/education_etd/18

Enterprise Risk Management:
Framework Presence and Effectiveness
By
Erika P. McBride, CPA
Submitted in partial fulfillment
of the requirements for the degree
Ed.D. in Executive Leadership
Supervised by
Dr. Jason Berman
Committee Member
Dr. Bruce Blaine
Ralph C. Wilson, Jr. School of Education St. John Fisher College
August, 2012

ii
Dedication
While the doctoral journey is often lonely, I could not have accomplished this
goal without the love and encouragement of many individuals. First, I must thank my
husband, Paul, for offering to help me in whatever way he could; without his support, I
could never have completed this doctoral program. I must also thank my sons, Evan and
Connor, for understanding all the times when mom “just had to finish this one thing,” and
for the impromptu hugs when I needed them most. Many thanks to my mother, whose
strength has inspired me throughout my life, and also to my father, who unfortunately
could not live to see this day, but I am sure he is proud. As well, thank you to the many
friends, family members, and colleagues who encouraged me along the way.
In addition, I must also thank my dissertation committee, Dr. Jason Berman and
Dr. Bruce Blaine, for their guidance, the head-scratching, and a few laughs in the process.
Thanks also to Dr. Karyl Mammano, for lending her expertise to this relatively little-
known topic. This team’s direction enabled me to research the topics that most interested
me, but in a way that was manageable in the short-term, leading to a successful
conclusion for all involved.
Finally, I must thank my Ed.D. cohort, particularly my fellow Unique ONEs. I
could have not asked for a better team of cheerleaders and supporters. Ed, Karey, Leslie,
Mary Karol, and Shirley – there is a special place in my heart for each of you, and I truly
hope we continue to encourage each other in the future, by engaging, enriching and
inspiring our unique journeys.

iii
Biographical Sketch
Erika P. McBride, CPA, currently manages the Risk Analytics organization at
Paychex, Inc. Beginning in 1988, Ms. McBride attended the State University of New
York at Geneseo, and graduated with a Bachelors of Sciences degree in Accounting in
1992. She began attending Rochester Institute of Technology in 1995, and graduated
with a Master of Business Administration degree in 2001. In the summer of 2010, she
came to St. John Fisher College to begin doctoral studies in the Ed.D. program in
Executive Leadership. Ms. McBride pursued her research in the field of enterprise risk
management under the direction of Dr. Jason Berman and Dr. Bruce Blaine, receiving the
Ed.D. degree in August 2012.

iv
Acknowledgements
I must once again thank my husband for the financial support he provided me in
reaching this lifetime goal; I optimistically say that that these family savings have been
undoubtedly well-spent. Additional thanks go to my mother for her contributions to this
cause. I also thank my employer, Paychex, Inc., for supporting my continuing education
through its tuition reimbursement program. Without these financial sources, completion
of this journey would not have been possible.
v
Abstract
The field of enterprise risk management (ERM) was born from corporate scandals
early in this century. COSO published its Integrated Framework in 2004, outlining eight
ERM components that, when present and functioning effectively, provide reasonable
assurance an organization will meet its objectives. Since then, organizations have been
increasingly urged to adopt risk oversight practices, with research conducted to measure
the level of ERM framework adoption. These studies show varying levels of ERM
application, with minimal evidence of ERM effectiveness.
To consolidate existing studies, a fixed effects meta-analysis of proportions was
conducted, revealing a 47.4% level of framework adoption. An experiment was also
performed to determine the effectiveness of ERM methods. A test group was provided
training on the ERM risk assessment method of heat mapping, versus a control group that
learned ERM framework history. Both groups were provided a list of scenarios, and
were asked to determine which risks should be mitigated. The testing group showed
improvement in risk-reduction decisions, confirmed by a one-tail t-test, where t (46) = -
3.57, p = 0.0004, and Cohen’s d of 1.02, indicating a statistically significant difference in
group means as a result of the treatment. These findings highlight an opportunity to
conduct additional research to gain greater insight into organizations that have yet to
adopt an ERM framework, while further analysis should also be conducted into the
effectiveness of other ERM tools. Ultimately, this research provides greater impetus for
ERM adoption, potentially critical protections against the next economic downturn.

vi
Table of Contents
Dedication ........................................................................................................................... ii
Biographical Sketch ........................................................................................................... iii
Acknowledgements ............................................................................................................ iv
Abstract ............................................................................................................................... v
Table of Contents ............................................................................................................... vi
List of Tables ..................................................................................................................... ix
List of Figures ..................................................................................................................... x
Chapter 1: Introduction ....................................................................................................... 1
History............................................................................................................................. 1
Problem Statement ........................................................................................................ 10
Theoretical Rationale .................................................................................................... 14
Statement of Purpose .................................................................................................... 19
Research Questions ....................................................................................................... 19
Significance of the Study .............................................................................................. 20
Definition of Terms....................................................................................................... 21
Summary ....................................................................................................................... 22
Chapter 2: Review of the Literature .................................................................................. 24
Introduction and Purpose .............................................................................................. 24
Review of the Literature ............................................................................................... 24
Chapter Summary ......................................................................................................... 52

vii
Chapter 3: Research Design Methodology ....................................................................... 57
General Perspective ...................................................................................................... 57
Problem Statement ........................................................................................................ 57
Research Context .......................................................................................................... 59
Research Participants .................................................................................................... 60
Instruments .................................................................................................................... 63
Procedures ..................................................................................................................... 65
Data Analysis ................................................................................................................ 65
Methodology Summary ................................................................................................ 67
Chapter 4: Results ............................................................................................................. 68
Research Question 1 ..................................................................................................... 68
Research Question 2 ..................................................................................................... 72
Chapter 5: Discussion ....................................................................................................... 76
Introduction ................................................................................................................... 76
Implications of Findings ............................................................................................... 76
Limitations .................................................................................................................... 80
Recommendations ......................................................................................................... 81
Conclusion .................................................................................................................... 82
References ......................................................................................................................... 83
Appendix A ....................................................................................................................... 89
Appendix B ....................................................................................................................... 90
Appendix C ....................................................................................................................... 91
Appendix D ....................................................................................................................... 92
viii
Appendix E ....................................................................................................................... 93
Appendix F........................................................................................................................ 94
Appendix G ....................................................................................................................... 95
Appendix H ....................................................................................................................... 96
Appendix I ........................................................................................................................ 97
Appendix J ........................................................................................................................ 98
Appendix K ....................................................................................................................... 99
Appendix L ..................................................................................................................... 100
Appendix M .................................................................................................................... 102
Appendix N ..................................................................................................................... 103
Appendix O ..................................................................................................................... 106
Appendix P...................................................................................................................... 107
Appendix Q ..................................................................................................................... 108
Appendix R ..................................................................................................................... 112
Appendix S...................................................................................................................... 113
Appendix T ..................................................................................................................... 114
Appendix U ..................................................................................................................... 115
Appendix V ..................................................................................................................... 116
ix
List of Tables
Item Title Page
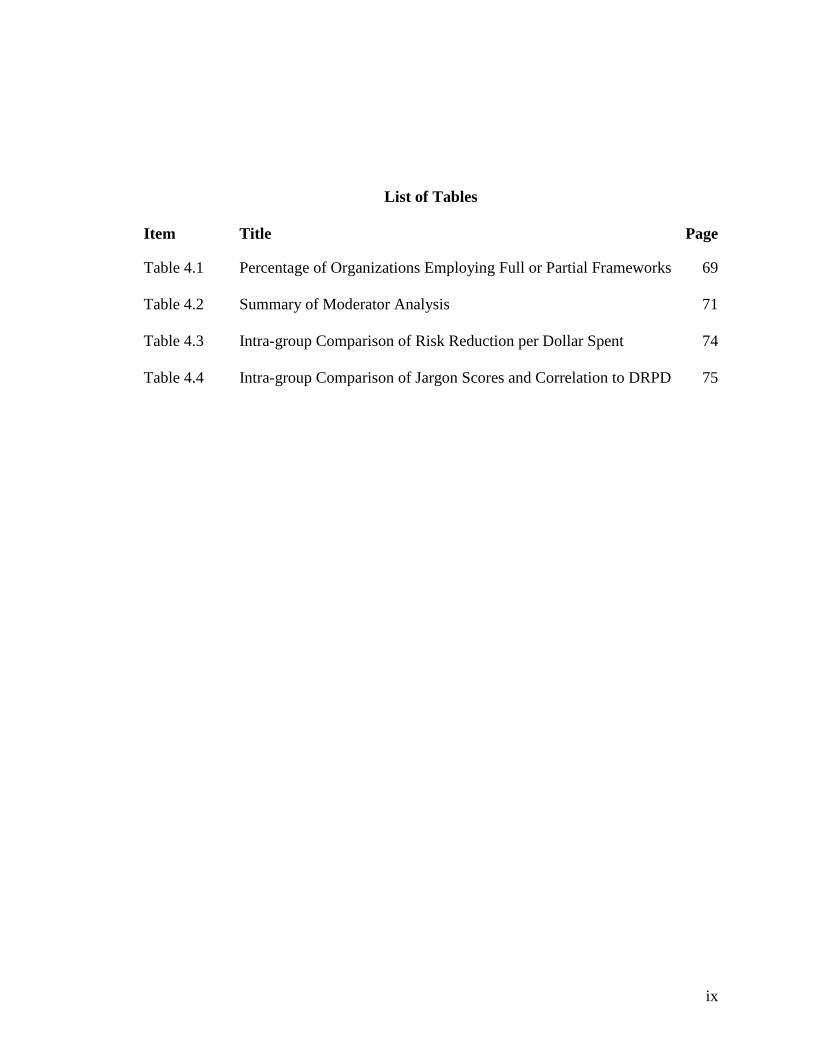
Table 4.1 Percentage of Organizations Employing Full or Partial Frameworks 69
Table 4.2 Summary of Moderator Analysis 71
Table 4.3 Intra-group Comparison of Risk Reduction per Dollar Spent 74
Table 4.4 Intra-group Comparison of Jargon Scores and Correlation to DRPD 75
x
List of Figures
Item Title Page
Figure 3.1 Display of Meta-Analysis Literature Research Process 60
Figure 4.1 Meta-Analysis Forest Plot 70

1
Chapter 1: Introduction
Historically, the concept of risk management has largely reflected the prevailing
attitudes of society. During the Greek and Roman eras, through the Crusades, individuals
felt they had little control over the future; rather, some variant of God’s will would
determine the outcome of a situation. With increasing geographic explorations, man
began to believe the future may be influenced, and the development of algebra enabled
scholars to compute probabilities, the building blocks of risk models of today (Bernstein,
1995). In modern times, risk management techniques have been extensively applied in
the insurance, health care, and banking sectors (Bodenheimer, 1999; Buehler, Freeman &
Hulme, 2008; Outreville, 1998). The focus of this research, however, is the emerging
field of enterprise risk management (ERM), specifically the COSO Integrated
Framework, its application throughout corporate environments, and whether the use of
these principles and techniques modifies an individual’s inherent decision making
tendencies.
History
Sarbanes-Oxley Act of 2002. Early in this century, several high-profile business
failures and scandals resulted in tremendous losses by investors and other stakeholders.
For example, Enron, a Texas-based energy company, was using accounting loopholes and
shell companies to hide losses from unsuccessful transactions, and failed to properly
report related-party transactions. When these transgressions came to light in late 2001,
Enron reported its intent to restate financial statements dating back to 1997, reducing

2
stockholders’ equity by $1.2 billion. The resulting collapse of confidence created a
severe down-grade of Enron’s long-term debt, and Enron filed for bankruptcy in
December 2001. By late January 2002, Enron’s stock price had plummeted to $0.67,
from $83 a year earlier, costing stockholders billions of dollars. Several executives were
subsequently sentenced and imprisoned (Reinstein & Weirich, 2002).
Shortly thereafter, an internal auditor from WorldCom, a Mississippi
telecommunications company, notified the company’s audit committee that she also
discovered fraudulent accounting practices. The company had been misclassifying
operating costs as capital expenditures, thereby overstating its annual income. It was
later determined that corporate profits were exaggerated by $11 billion, the biggest fraud
in the history of American business. WorldCom declared bankruptcy in July 2002, as its
stock value declined by $180 billion (Barrier, 2003).
Throughout these scandals, the public was asking – where were the auditors
(Reinstein & Weirich, 2002)? Arthur Andersen, the independent auditors for both Enron
and WorldCom, appeared to have its judgment clouded by the millions of dollars
received from these businesses in audit and consulting fees (Randall, 2003). Due to the
perceived ineffectiveness of the external audit, Washington was concerned that the public
was going to lose faith in the securities markets (Felo & Solieri, 2003). As a result,
Senator Paul S. Sarbanes (D – Maryland) and Representative Michael G. Oxley (R –
Ohio) sponsored the Public Company Accounting Reform and Investor Protection Act,
which came to be known as the Sarbanes-Oxley Act of 2002 (SOx) (McElveen, 2002).
The act was passed by nearly unanimous votes in the House and the Senate. This
far-reaching piece of legislation established significant regulations relative to public

3
accounting firms, financial auditing standards, and corporate governance, a marked
departure from the accounting industry’s previous self-regulated stance (McElveen, 2002;
Moeller, 2007). Described as the most important financial regulatory legislation in over
70 years, the act includes several key points (Moeller, 2007).
• The Securities and Exchange Commission was required to establish the five-
member Public Company Accounting Oversight Board, giving them the
responsibility for setting standards, investigating auditors, and holding them
accountable.
• Chief executive officers (CEOs) and chief financial officers (CFOs) were now
required to certify their organization’s financial reports, taking personal
responsibility for misstatements.
• The connection between auditors and their clients was redefined, making audit
committees directly responsible for the relationship, as well as audit and
accounting practices.
• Certain transactions, including loans, involving officers and directors were
banned for public companies.
• Enforcement measures were strengthened, including criminal penalties for
offenders (McElveen, 2002).
Section 404 of the Sarbanes-Oxley Act (SOx 404), more specifically, addresses
the effectiveness of management assertions relative to financial statement accuracy
(Farrell, 2004; Felo & Solieri, 2003). Under SOx 404, management must attest to the
effectiveness of their organization’s internal control structure within the company’s
annual report (Sarbanes-Oxley Act of 2002, 2002). Departing from past practices, this
4
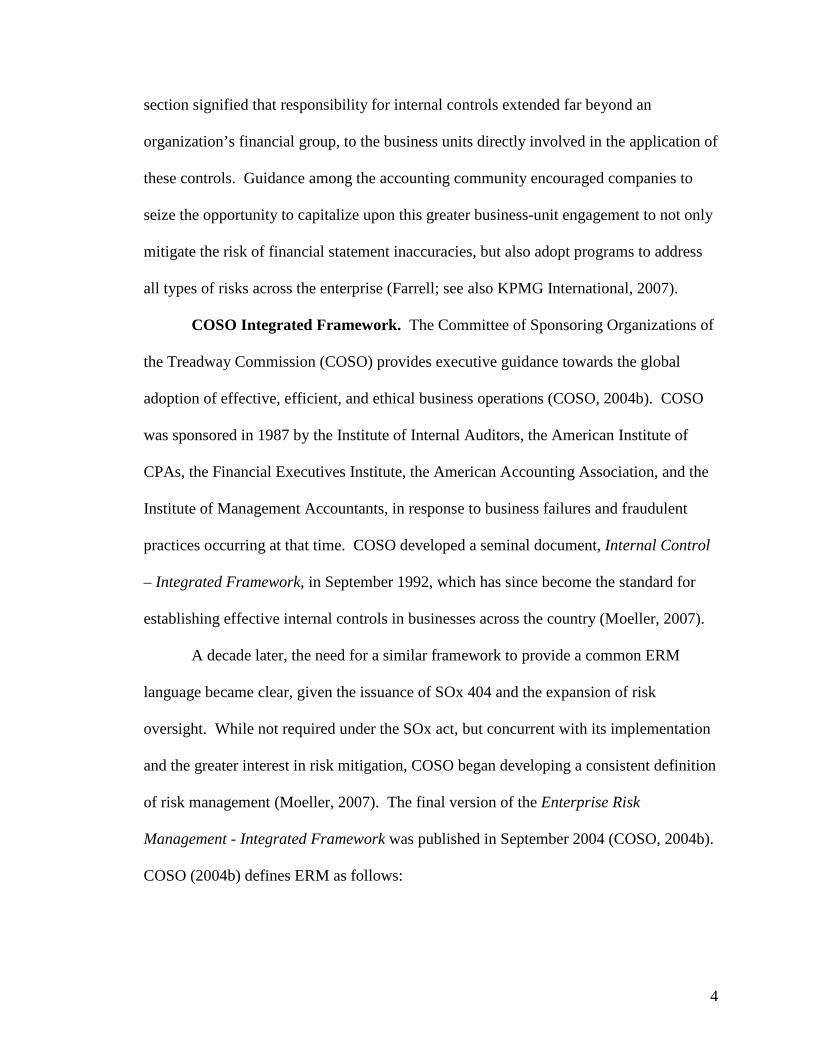
section signified that responsibility for internal controls extended far beyond an
organization’s financial group, to the business units directly involved in the application of
these controls. Guidance among the accounting community encouraged companies to
seize the opportunity to capitalize upon this greater business-unit engagement to not only
mitigate the risk of financial statement inaccuracies, but also adopt programs to address
all types of risks across the enterprise (Farrell; see also KPMG International, 2007).
COSO Integrated Framework. The Committee of Sponsoring Organizations of
the Treadway Commission (COSO) provides executive guidance towards the global
adoption of effective, efficient, and ethical business operations (COSO, 2004b). COSO
was sponsored in 1987 by the Institute of Internal Auditors, the American Institute of
CPAs, the Financial Executives Institute, the American Accounting Association, and the
Institute of Management Accountants, in response to business failures and fraudulent
practices occurring at that time. COSO developed a seminal document, Internal Control
– Integrated Framework, in September 1992, which has since become the standard for
establishing effective internal controls in businesses across the country (Moeller, 2007).
A decade later, the need for a similar framework to provide a common ERM
language became clear, given the issuance of SOx 404 and the expansion of risk
oversight. While not required under the SOx act, but concurrent with its implementation
and the greater interest in risk mitigation, COSO began developing a consistent definition
of risk management (Moeller, 2007). The final version of the Enterprise Risk
Management - Integrated Framework was published in September 2004 (COSO, 2004b).
COSO (2004b) defines ERM as follows:

5
Enterprise risk management is a process, effected by an entity’s board of
directors, management and other personnel, applied in strategy setting and across
the enterprise, designed to identify potential events that may affect the entity, and
manage risk to be within its risk appetite, to provide reasonable assurance
regarding the achievement of entity objectives (p. 2).
Moeller (2007) dissects this definition into several key elements:
• ERM is a process, a series of documented steps to review and analyze
potential risks, with action taken accordingly.
• ERM is implemented by organizational personnel close to the risk situation,
allowing them to grasp its implications.
• ERM application occurs via strategy setting across an entire organization.
• An entity’s risk appetite, the amount of risk an organization is willing to
assume in its quest for value, must be considered qualitatively or
quantitatively.
• ERM, by design, should help an organization achieve its objectives.
• However, ERM provides only reasonable, not absolute, assurance that
organizational objectives will be achieved (Moeller, 2007).
COSO’s (2004b) Integrated Framework document describes eight ERM components,
which directly relate to an organization’s objectives, as depicted in a three-dimensional
cube (see Appendix A) (Moeller, 2007). A discussion of each element follows.
Risk components. Within the cube, the eight horizontal rows correspond to
interrelated risk components (COSO, 2004b). The Internal Environment represents the
capstone element, encompassing an organization’s risk philosophy, the board’s attitudes,

6
and the entity’s integrity and ethical values, among other factors (COSO; Moeller, 2007).
One primary output of this component, which feeds other elements of the framework, is
the organization’s risk appetite. This concept represents a sometimes subjective measure
of the level of risk an entity will accept or reject based on the likelihood of a risk
occurring and the potential impact. This relationship is often depicted in a visual map,
also known as a heat map, illustrated in Appendix B (Ballou & Heitger, 2005; Moeller).
Within Objective Setting, ERM ensures a process is in place to establish
objectives that support and align with the organizational mission, and are within the risk
appetite (COSO, 2004b). A formal mission statement is often a critical element, the
foundation of an overall strategy and a springboard for more specific, functional, strategic
objectives (Moeller, 2007). COSO then outlines the development of strategic,
operational, reporting, and compliance objectives, depicted on the top of the COSO cube.
These objectives must take into account the deliverables from the Internal Environment,
through the establishment of acceptable risk tolerance ranges (Moeller).
Event Identification includes the detection of internal or external incidents or
occurrences that affect the achievement of an entity’s objectives (Moeller, 2007). These
events are often thought of as negative in consequence, but may also provide positive
outcomes, or both. Events may be categorized among the types of influencing factors,
such as external economic, natural environmental, social, internal process-related, and/or
technological, classifications that are critical to ensure comprehensive risks are
considered (Ballou & Heitger, 2005; Moeller). Within this component, organizations
should have processes established to monitor the environment for potentially significant

7
risk events, via process flow analyses, interviews, questionnaires, and escalation triggers,
among others (COSO, 2004b; Moeller).
The Risk Assessment component “represents the core of COSO ERM,” enabling
an organization to evaluate the extent to which a risk may inhibit or enhance its ability to
meet objectives (Moeller, 2007, p. 73). Each assessment should consider the likelihood
of the risk occurring and the potential impact to the organization. This result should be
measured against the entity’s risk appetite, as illustrated in the heat map in Appendix B
(Moeller; see also Ballou & Heitger, 2005).
Both inherent and residual risks should be evaluated within this assessment
(Moeller, 2007). Inherent risk is defined by the U.S. Government’s Office of
Management and Budget as the “potential for waste, loss, unauthorized use, or
misappropriation due to the nature of an activity itself” (as cited in Moeller, 2007).
Inherent risk is generally the result of external factors, outside the control of
management. Residual risk, meanwhile, is the risk remaining after mitigating factors
have been installed, implying that risks may not be completely eliminated (Moeller).
These factors may be portrayed by the likelihood of the risk occurring and the potential
impact of an event, both on high/medium/low scales, to determine an overall risk
assessment and heat map illustration. Other organizations may use probability
estimations or best/worst case scenarios, indicating no singular approach required (Ballou
& Heitger, 2005).
Within the Risk Response component, an organization should react to each risk
assessed through a variety of means (Moeller, 2007). Risk avoidance involves
disengaging from the risk completely, possibly by divesting a line of business, while risk

8
reduction may be accomplished through a wide range of strategic business decisions.
Meanwhile, risk sharing is commonly achieved through the purchase of insurance and
other hedging means. Risk acceptance is then, simply, taking no action, which may be
appropriate depending on a risk’s likelihood and impact (Moeller). These responses are
factored into the heat map discussion, with adjustments noted and residual risks
highlighted, as depicted in Appendix C (Ballou & Heitger, 2005).
Control Activities represent the policies and procedures required to ensure the
various risk responses are executed (Moeller, 2007). The review of control activities is
very similar to the SOx audit procedures required to monitor internal controls, using such
concepts as segregation of duties and audit trails, among others, with noteworthy
expansions in application (Ballou & Heitger, 2005; Moeller). This verification may be
accomplished through performance indicators, physical controls, and reviews by both
top-level and line-level management (Moeller).
The Information and Communication component, rather than being an
independent module, highlights the processes and tools needed to link the other ERM
components (Moeller, 2007). While simple in theory, organizations often exhibit a
complex web of disjointed information systems relative to operational and financial
processes. Enterprise-wide risk technology applications may assist with connecting these
communications, tools which are becoming increasingly common in larger organizations
(Bamberger, 2010; Moeller). Timely reporting of ERM at all levels must occur to ensure
program effectiveness (Ballou & Heitger, 2005).
Intentionally, Monitoring has been placed at the bottom of the stack of
components, as this process is necessary to ensure all the remaining ERM components

9
continue to work effectively (Moeller, 2007). Continuous monitoring processes are
needed to identify deviations from the installed ERM plan. Virtual real-time monitoring
can often be accomplished through the use of dashboard tools, which quickly
communicate status changes to various levels of management (Moeller). Effective
monitoring also enables an organization to refine its assessments and expand its ERM
framework, further solidifying the entity’s risk philosophy and culture (Ballou & Heitger,
2005).
Objectives. A philosophical commitment is required to effectively embed risk
perspectives into the pursuit of organizational goals (Ballou & Heitger, 2005). Therefore,
each of the eight ERM components should be managed relative to the organization’s
ability to achieve its objectives (Moeller, 2007). Within this second dimension, across
the top of the COSO cube as shown in Appendix A, objectives may be bucketed into four
categories. Strategic risk objectives represent the possibility that an entity may not reach
its strategic objectives, whether those goals encompass improved market share, revenue
growth, or the expansion of populations served. The Reporting risk objective concerns
the reliability of an organization’s reporting mechanisms, including both financial and
non-financial data. Compliance risks involve an organization’s ability to comply with a
range of governmental or industry regulations. This category also includes legal risks,
which may be completely unanticipated. Finally, Operations-level risks, while depicted
in the framework as the same width as the remaining three objectives, typically represent
a wide variety and high number of risks that may impact an entity’s operations (Moeller,
2007).
10
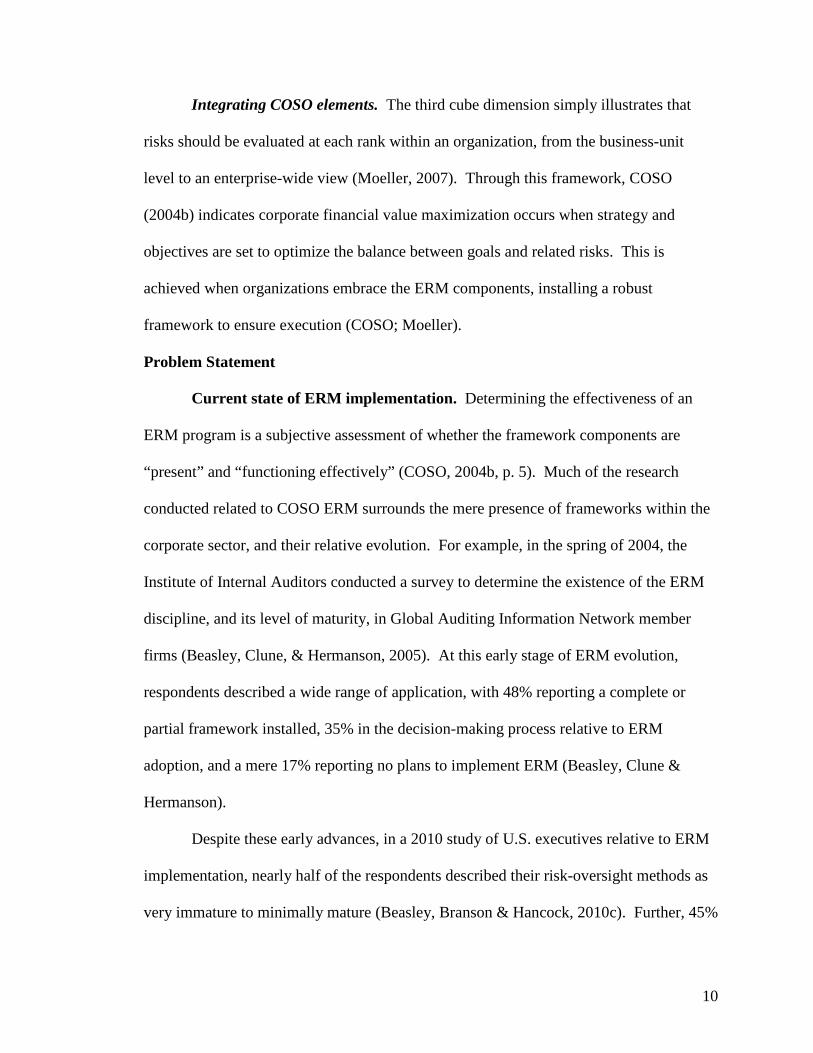
Integrating COSO elements. The third cube dimension simply illustrates that
risks should be evaluated at each rank within an organization, from the business-unit
level to an enterprise-wide view (Moeller, 2007). Through this framework, COSO
(2004b) indicates corporate financial value maximization occurs when strategy and
objectives are set to optimize the balance between goals and related risks. This is
achieved when organizations embrace the ERM components, installing a robust
framework to ensure execution (COSO; Moeller).
Problem Statement
Current state of ERM implementation. Determining the effectiveness of an
ERM program is a subjective assessment of whether the framework components are
“present” and “functioning effectively” (COSO, 2004b, p. 5). Much of the research
conducted related to COSO ERM surrounds the mere presence of frameworks within the
corporate sector, and their relative evolution. For example, in the spring of 2004, the
Institute of Internal Auditors conducted a survey to determine the existence of the ERM
discipline, and its level of maturity, in Global Auditing Information Network member
firms (Beasley, Clune, & Hermanson, 2005). At this early stage of ERM evolution,
respondents described a wide range of application, with 48% reporting a complete or
partial framework installed, 35% in the decision-making process relative to ERM
adoption, and a mere 17% reporting no plans to implement ERM (Beasley, Clune &
Hermanson).
Despite these early advances, in a 2010 study of U.S. executives relative to ERM
implementation, nearly half of the respondents described their risk-oversight methods as
very immature to minimally mature (Beasley, Branson & Hancock, 2010c). Further, 45%

11
of U.S. respondents described no intent for ERM implementation (Beasley, Branson &
Hancock, 2010b). Therefore, across these two surveys spanning six years, the percentage
of surveyed organizations who noted no intent to install an ERM program fluctuated from
17% to 45% (Beasley, Branson & Hancock, 2010b; Beasley, Clune & Hermanson, 2005).
While the populations certainly vary among these survey participants, a limited
commitment to COSO’s ERM theory may be evident.
A possible contributing factor related to the delay of ERM implementation is the
reality that clear definitions of the various types of risk do not appear to exist. Rather,
each ERM entity must establish its own risk classifications, also known as a risk
taxonomy, a structure to describe the categories and subcategories of risks (Banham,
2004; Lam, 2003). Once identified, each category must be aligned with the
organizational business model and assigned to a responsible owner for the framework to
be effective (Hampton, 2009). A description of a possible risk structure within a for-
profit venture is included as Appendix D. Because of this variability, the role of ERM in
an organization, and the associated risk oversight, could vary from firm to firm, a
complicating factor that may impact the speed at which an organization applies an ERM
framework (A. Smith, personal communication, October 19, 2010).
In addition to the lack of clear categorical definitions, respondents to the 2010
study who did not yet implement ERM articulated several alternate impediments to the
complete adoption of a program (Beasley, Branson & Hancock, 2010c). While
respondents could select more than one response, the most common rationale, cited by
60.5% of these participants, was that “risks are monitored in other ways besides ERM”
(Beasley, Branson & Hancock, p. 13). An explanation of “no requests to change our risk

12
management approach have been made” was provided by nearly 30% of respondents,
with 28% indicating there were “too many pressing needs” (Beasley, Branson &
Hancock, p. 13). Twenty-one percent of participants also reported the belief that they
“do not see benefits exceeding the costs” (Beasley, Branson & Hancock, p. 14). As clear
evidence of ERM value has not been presented within the literature, these explanations
for the lack of an ERM framework may be difficult to objectively overcome.
Meanwhile, in another recent study, Beasley, Branson and Hancock (2010a)
solicited participant perceptions regarding the COSO cube itself. While 41% of
respondents indicated the cube was an appropriate portrayal of the connectedness of
ERM elements, 29.5% reported the cube to be complicated, just as ERM is complicated.
An additional 26.4% said the cube is “unnecessarily complicated,” causing negative
reactions to the framework (Beasley, Branson & Hancock, 2010a, p. 7). The majority of
free-form responses requested more practical guidance through case studies and
examples. However, over half of the respondents also indicated they were not familiar
with Volume 2 of the COSO framework, Application Techniques, which provides various
templates and tools (Beasley, Branson & Hancock, 2010a). Increased discussion of the
usage of these techniques may impact acceptability of the framework as a whole.
Possibly as a result of these critiques, the International Organization for
Standardization (ISO), a federation of national standard-setting bodies across the world,
published further risk management principles and guidelines (ISO, 2009). ISO
recommends organizations implement, and continuously improve, a framework to
integrate risk management processes into all facets of an entity’s culture, a model shown
in Appendix E. While it may be viewed as an alternative approach to ERM, the ISO

13
standard is consistent with the previous COSO framework; however, ISO more clearly
defines the iterative processes within the application of ERM. This guidance may
provide greater ease of understanding among professionals new to the risk discipline, a
useful feature as investors continuously expect more from risk managers (McClean,
2010). The Risk and Insurance Management Society (RIMS) (2009), describes several
other recent standards, including the 2009 OCEG Red Book, the 2008 BS 31100, and the
2012 Solvency II. However, the COSO ERM framework appears to be the most widely
used, with 65% of public companies reporting COSO as the primary source for ERM
guidance (Beasley, Branson & Hancock, 2010a).
Organizational need for ERM. As described in the literature, the need for ERM
within public companies is multi-faceted. First, while ERM may be seen as the latest
fashion in business improvements, recent proxy disclosure rules issued by the Securities
and Exchange Commission, SEC Rule 33-9089, increases risk management requirements
for publicly-traded companies. More specifically, the rule requires companies disclose
the role of the board of directors in providing risk oversight, compensation policies based
upon risk, and the character of risk management discussions between executives and the
board of directors (Bugalla, Fox, Hackett & McGuinness, 2011). Even prior to this
mandate, companies were adopting ERM in apparent response to credit rating agency
urgings, who also valued strategic risk management practices when evaluating a
company's credit worthiness (Bugalla, et.al).
Secondly, the 2008 financial crisis may not have occurred if enterprise risks were
closely understood (Risk and Insurance Management Society (RIMS), 2009). AIG’s
former CEO blamed the company’s financial emergency on internal risk management

14
failures (Mollenkamp, Ng, Blevin & Smith, 2008). RIMS (2009) further reports the
meltdown was not only due to the failure to fully embrace ERM principles and behaviors,
but also companies’ failure to use ERM competencies to influence decision making for
strategic choices, both risk-taking and risk-avoiding (see also Hatch & Jutras, 2010).
Thirdly, best-practice organizations are reported to utilize ERM to create value by
ensuring the execution of strategies across the enterprise. The increased focus of senior
management on major risks helps to ensure the risks are repeatedly assessed and
mitigated. Therefore, an effective ERM program not only protects shareholder value, it
also enhances an organization’s value creation opportunities (Driscoll, 2011). However,
while these rationales may be compelling, they have yet to be proven beyond mere
supposition. Therefore, additional research is necessary into the value provided by ERM,
particularly its ability to influence risk decision making.
Theoretical Rationale
COSO. This dissertation research will be governed by two distinct theories, the
primary being the COSO framework itself. As described, this framework was intended to
provide a model whereby organizations could consider their risk-related activities, as well
as the activities’ impacts on one another, as a heuristic to support organizational
objectives (Moeller, 2007). Specifically, within the COSO cube (see Appendix A), the
eight horizontal rows represent interrelated risk components (COSO, 2004b). By design,
management of these risk components should assist an organization in achieving its
objectives, depicted on the top of the cube (Moeller, 2007). Therefore, from a theoretical
perspective, the manipulation or absence of any of these components could impact an
organization’s outcomes. However, while Beasley, Branson and Hancock (2010a) find

15
COSO to be the primary ERM guidance referenced by organizations, the cube is
complicated, perhaps resulting in varied levels of ERM commitment across the
professional landscape, with a clear degree of usage of the discipline yet to be
determined. Moreover, the underlying assumption that execution of risk components will
impact organizational objectives has yet to be tested, possibly contributing further to
inconsistent application of the theory in corporate settings.
Behavioral economics. The field of behavioral economics utilizes a combination
of psychology and economics to study decisions made by individuals when human
limitations and complications are introduced (Mullainathan & Thaler, 2001). Within the
behavioral economics realm, Tversky and Kahneman (1979) developed a theory as a
marked refinement of the previously-established Expected Utility Theory (EUT), which
describes individuals as rational, self-interested decision makers, consistently seeking
pleasure and avoiding pain. Prospect Theory (PT), rather, provides several tenets where
decision making appears to be irrational (Tversky & Kahneman, 1979).
First, individuals are generally risk averse, meaning they weigh the negative value
of losses to be more than the benefit derived from gains. For example, if presented with
the option of taking a coin toss, with the outcome of winning $200 if the flip came up
heads, and losing $100 if it would be tails, individuals overwhelmingly do not take the
bet. However, if value-maximization is the goal, as would be presumed for a rational
person, the person should take the bet. While flipping the coin once could produce a
negative outcome, if the coin is fair, producing equal numbers of heads and tails over
time, positive outcomes are certain over the long term. Specifically, if the coin was
flipped 5,000 times, the expected value would be (2,500 X $200) - (2,500 X $100), a gain

16
of $250,000. PT, therefore, indicates some irrationality in decision making (Thaler,
Tversky, Kahneman & Schwartz, 1997).
PT also states that if an individual can choose between a sure gain, or take a
chance to win a larger gain and risk the chance of winning nothing, they will take the sure
thing. In this way, they are risk averse on the gains side of the equation. However,
converse actions are demonstrated within a loss scenario. If an individual is given the
choice between a sure loss, or a gamble that could result in a larger loss or no loss at all, a
person will typically take the chance. Therefore, individuals are risk seeking within the
realm of losses (Wilkinson, 2008). Tversky and Kahneman (1979) demonstrated this
theory through various pairings of scenarios, with statistically significant results, an
example of which is shown in Appendix F. These irrational preferences varied with the
relative dollar amount of the decisions, the odds associated with the gamble, as well as
the distance from a fixed reference point (Tversky & Kahneman, 1979).
Relative to the COSO ERM framework, decisions are made throughout the
components represented in the cube. However, nowhere is it more apparent than in the
Risk Response layer, where, once risks have been identified and assessed, the treatment
of the risk is determined. If Tversky and Kahneman’s (1979) scenarios could be thought
of as risks faced by an organization, they may be depicted on a heat map, with negative
prospects shown in Appendix G. Then, given the choice between the two options, an
individual would make either the same or the opposite decision that PT would otherwise
dictate.
17
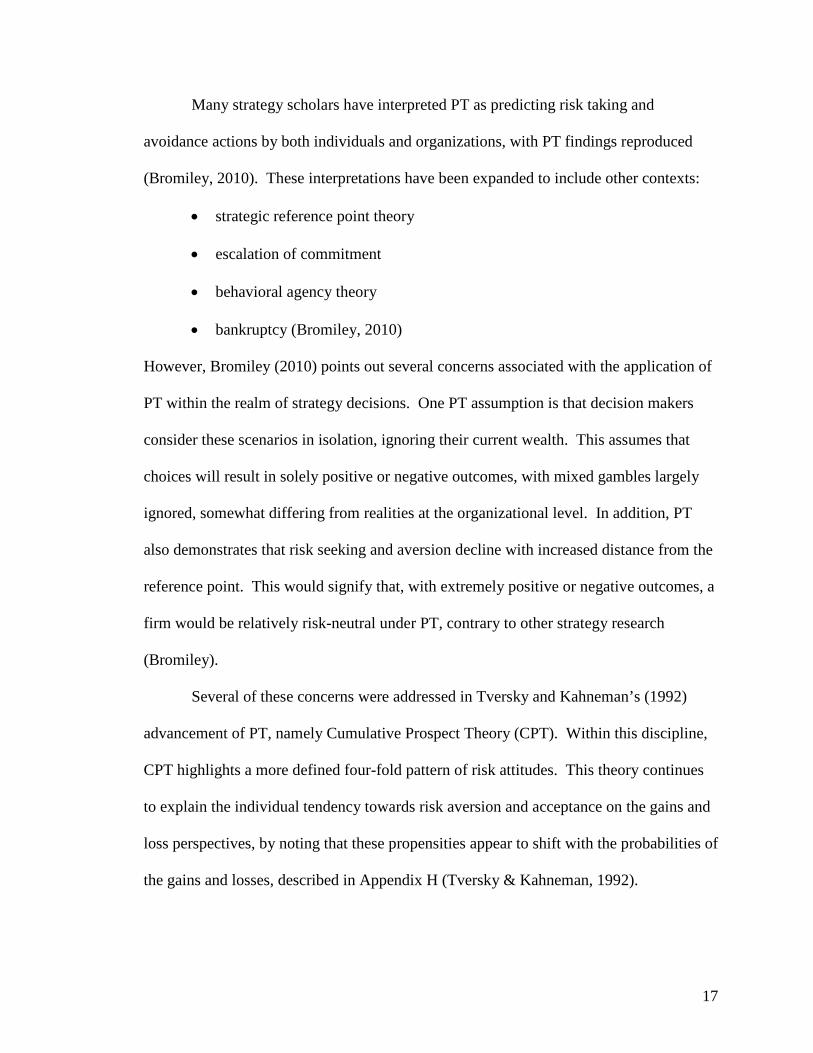
Many strategy scholars have interpreted PT as predicting risk taking and
avoidance actions by both individuals and organizations, with PT findings reproduced
(Bromiley, 2010). These interpretations have been expanded to include other contexts:
• strategic reference point theory
• escalation of commitment
• behavioral agency theory
• bankruptcy (Bromiley, 2010)
However, Bromiley (2010) points out several concerns associated with the application of
PT within the realm of strategy decisions. One PT assumption is that decision makers
consider these scenarios in isolation, ignoring their current wealth. This assumes that
choices will result in solely positive or negative outcomes, with mixed gambles largely
ignored, somewhat differing from realities at the organizational level. In addition, PT
also demonstrates that risk seeking and aversion decline with increased distance from the
reference point. This would signify that, with extremely positive or negative outcomes, a
firm would be relatively risk-neutral under PT, contrary to other strategy research
(Bromiley).
Several of these concerns were addressed in Tversky and Kahneman’s (1992)
advancement of PT, namely Cumulative Prospect Theory (CPT). Within this discipline,
CPT highlights a more defined four-fold pattern of risk attitudes. This theory continues
to explain the individual tendency towards risk aversion and acceptance on the gains and
loss perspectives, by noting that these propensities appear to shift with the probabilities of
the gains and losses, described in Appendix H (Tversky & Kahneman, 1992).

18
Utilizing the foundation established by Tversky and Kahneman (1992), Harbaugh,
Krause, and Vesterlund (2010) conducted a study to test the validity of the fourfold
pattern of attitudes under both a price and a choice task. This research provides a model
showing behavior is predictable, in the aggregate, when individuals are presented with
price decision-making tasks. However, under choice tasks, individual responses did not
differ significantly from random choices (Harbaugh, et al.). To put it into context, if a
person is buying a new automobile, they may have a choice between a car with a certain
safety feature, and another vehicle without the feature. If the decision is perceived to be a
choice task, the car without the safety feature may be selected. However, if the
salesperson describes the decision as a feature available for an additional cost, the buyer
may approach the decision with a risk-averse attitude and buy the safer vehicle
(Harbaugh, et al.). Therefore, with identical sets of facts, the method by which
information is presented may lead to a different decision. This may emphasize the need
for a consistent method of information presentation, such as heat map visualization,
mitigating incongruity created by varied language within problem discussions.
An additional foundational work on myopic loss aversion was published by
Thaler, Tversky, Kahneman, and Schwartz (1997). This research indicates aggregate
data provided to decision makers, along with opportunities to change decisions, may
mitigate the impact of myopia and loss-aversion (Thaler, et al.). This perspective also
relates to a possible heat map analysis, with greater complexity associated with scenarios
as compared with the previous PT theory. In any case, given the relative lack of ERM
frameworks installed and minimal formalized oversight, a lack of standardized data

19
presentation is likely, and hence the likelihood of decisions contrary to the goal of value
maximization.
Statement of Purpose
Despite the establishment of the COSO ERM framework, the vast majority of
studies have not analyzed the effectiveness of an ERM framework in influencing
decisions, merely the presence of the framework in an organization. A recent study
attempted to dissect the relationship between ERM and firm performance, citing five
factors that affect a firm: environmental uncertainty, industry competition, firm size, firm
complexity, and board of directors’ monitoring of risk (Gordon, Loeb & Tseng, 2009).
The authors indicate these factors must be considered when evaluating the installation of
ERM, as firm performance is contingent upon these contextual items (Gordon, Loeb &
Tseng). While this study certainly touches upon a facet of effectiveness, namely firm
performance, it does not directly address whether the use of ERM impacts the decisions
that led to that performance, but rather the other factors at play. This dissertation
research will be focused not only on the presence of ERM frameworks, but also on the
influence of ERM on decision making, in an effort to determine how the use of ERM
tools impacts risk-response decisions.
Research Questions
James Lam (2009) purports “Risk Management addresses what specific decisions
are made to optimize the company’s risk-return profile” (p. 24). However, existing
studies indicate minimal empirical evidence of ERM effectiveness. As such, two
research questions follow: To what extent have ERM frameworks been implemented in
organizations? Once installed, does the use of ERM components improve risk decision

20
making? More specifically, would the heat-map presentation of a risk scenario result in a
better decision than would otherwise be made in the absence of such tools? Additional
understanding among these questions may provide a basis to determine the effectiveness
of ERM, thereby potentially providing greater impetus for ERM advocacy, or possible
divestiture from the ERM methodology.
Significance of the Study
Empirical ERM studies of the kind described in this proposal have not yet been
conducted. Despite that apparent fact, organizations are increasingly encouraged to adopt
an ERM framework, such as through the issuance of SEC Rule 33-9089. This legislation
was enacted in the wake of the most recent economic crisis, which some say was a failure
of risk management (RIMS, 2009). Agencies are also considering an organization’s risk
management practices in determining an organization’s credit rating, providing greater
impetus for establishment of a framework (Bugalla, Fox, Hackett & McGuinness, 2011).
Court decisions have further confirmed executive and director personal responsibility for
risk oversight (Laster & Haas, 2006; WellCare Health Plans, Inc., 2010).
In spite of this increasing trend toward ERM advocacy, organizations continue to
struggle with implementation, possibly due to the complexity of the COSO model itself
(Beasley, Branson & Hancock, 2010a). This research will not only assess the extent of
ERM implementation, but will also determine whether greater understanding of tools and
techniques will improve application of risk principles as a whole. More importantly, the
ability of ERM techniques to overcome inherent decision making bias will be studied,
with the goal of understanding how risk decision making can be influenced through the

21
application of ERM methodologies. Whatever impact the research reveals, the empirical
findings would provide a successful contribution to the ERM literature.
Definition of Terms
For the purpose of this research, key terms and concepts have been defined in the
following table.
Key Concept Definition
Enterprise Risk
Management (ERM)
A process, established by senior leadership, designed to identify
potential events across an enterprise and determine how these
risks should be managed to support an organization in reaching
their objectives (COSO, 2004b).
Chief Risk Officer (CRO) An individual typically responsible for providing ERM
leadership, vision, and direction, and the establishment of an
ERM framework (Lam, 2003).
Heat map The visual representation of the likelihood and impact of one or
many risks.
Inherent risk Risk associated with the very nature of an activity (Moeller,
2007).
Internal controls Actions taken within an organization to reasonably ensure the
reliability of financial reporting; a key element of the Sarbanes–
Oxley Act of 2002, which required improvements in internal
controls in U.S. public corporations.
Residual risk Risk remaining after inherent risk is mitigated (Moeller, 2007).
22
Key Concept Definition
Risk appetite A tolerable range of risks that an organization will accept
(Moeller, 2007).
Risk assessment The COSO cube component whereby risks are analyzed,
considering their likelihood and impact, to determine how
the risks should be managed (COSO, 2004b).
Risk aversion Reluctance of a person to accept the uncertainty of an
outcome (Tversky & Kahneman, 1979).
Risk components The eight inter-related horizontal layers of the COSO ERM
framework that represent steps needed to achieve an entity’s
objectives (COSO, 2004b).
Risk response The COSO risk component, following risk assessment,
whereby risk mitigation techniques are selected, such as
avoidance, reduction, sharing, or acceptance (COSO,
2004b).
Summary
In an age of ever-increasing focus on corporate scandals and overly risky
decisions, the ERM discipline continues to emerge, with increasing rationale to install a
framework. However, existing studies indicate minimal empirical evidence of ERM
effectiveness, leading to questions regarding the value of an ERM program. Further
analysis into the impact of risk assessment techniques may provide a basis to determine
the effectiveness of ERM on decision making, providing greater impetus for ERM
advocacy, or encouraging withdrawal from this discipline.

23
The remaining chapters present additional information based on the literature
reviewed, and further research and analysis.
Chapter 2: Review of the Literature – The review of the literature includes
research relevant to the topic of ERM, including its acceptance, drivers behind its
acceptance, the role of the board of directors, and application tools and techniques,
among other factors.
Chapter 3: Research Design Methodology – This chapter describes the details
regarding the quantitative design of this study, including rationale for this method of
research.
Chapter 4: Results – This chapter presents a meta-analysis of existing ERM
studies, as well as findings from an intervention study to determine the effect of ERM
techniques on risk decision making.
Chapter 5: Discussion – This chapter will describe the implications of the
findings, limitations of the study, and future recommendations.

24
Chapter 2: Review of the Literature
Introduction and Purpose
Since the COSO ERM Framework was published, variable levels of acceptance
have been identified among organizations. This dynamic has been the focus of research
over the years, a summary of which will be discussed. However, while considerable
studies have been conducted on the ERM topic, the effectiveness of these frameworks in
terms of influencing strategic decision making has not been addressed in the literature to
date, a facet of ERM that will be the focus of this dissertation research.
Review of the Literature
ERM presence. While the COSO ERM Framework was published in September
2004, preliminary versions had been issued more than a year prior, allowing companies
to begin installing ERM protocols proactively (Beasley, Clune & Hermanson, 2005). To
gain an understanding of the ERM evolution, the Institute of Internal Auditors (IIA)
Research Foundation conducted a survey in early 2004 relative to the extent of ERM
implementation, among other facets of current internal audit concerns. The online survey
was provided to more than 1,700 IIA Global Auditing Information Network members,
with 175 responses obtained, the majority of participants holding the chief audit
executive role. Seventy percent of respondents were from U.S. organizations,
representing a broad spectrum of industries (Beasley, et al.). The state of ERM
development indicated by respondents ranged from “complete ERM framework in place”
to “no ERM framework in place and no plans to implement one” (Beasley, et al., 2005, p.

25
528). At this early stage of ERM evolution, 11% of survey respondents, indicated a
complete ERM framework installed, with the majority reporting a partial framework.
Seventeen percent, however, indicated no intention to implement an ERM program.
With the variability in ERM adoption, these researchers believe the ERM initiative will
continue to gain momentum, with internal audit functions increasingly incorporated into
these programs (Beasley, et al.).
Also in 2004, the Conference Board, a not-for-profit organization that distributes
information to assist businesses to “strengthen their performance and better serve
society,” partnered with Mercer Oliver Wyman, a risk management consulting group, to
perform an additional survey relative to the status of ERM (Hexter & Gates, 2005, page
ii). Participants included 271 executives from primarily North American and European
companies, with sales ranging from $1 billion to $50 billion. While the executives
represented a wide variety of industries, nearly half came from the manufacturing or
financial sectors (Hexter & Gates).
Within this study, survey participants reported an overwhelming inclination to
adopt ERM, with 91% indicating their acceptance of the ERM idea, or active engagement
in program implementation. Two-thirds of board members and senior managers also
described risk management as an increasing priority. However, only a small number,
11%, reported full implementation of ERM. Limited ERM practices were also employed,
with 15% of organizations merging ERM into their strategic planning process, and only
18% maintaining a risk inventory, a basic building block of ERM. Regardless, 58% of
participants reported ERM’s ability to improve decision making, and the majority also
described improved communication to the board. Those with mature programs were

26
more likely to describe their framework as providing management consensus, increasing
accountability, and improved governance (Hexter & Gates).
Consistent with the previously mentioned study, Hexter and Gates (2005) report
ERM as a “work in progress,” with an estimate of three to five years needed to fully
integrate risk management practices (p. 27). While several case studies of successful
programs were also presented, these researchers describe an inability to provide a clear
recipe for ERM implementation. This challenge is due to the variety of influencing
factors, such as organizational culture, and the positional power and dedication of those
championing the initiative. However, the researchers claim companies should formalize
efforts to identify and assess all material risks to enable ongoing effectiveness in the
current environment (Hexter & Gates).
Over the next several years, the global financial crisis brought risk management
even further into the limelight, with boards of directors and executives increasingly
scrutinized for their inability to manage risks effectively. Regulatory pressures increased
as well, with the New York Stock Exchange, for example, issuing risk-governance rules
in 2004, and Standard & Poor’s reporting their explicit consideration of ERM processes
when assigning credit ratings. (Beasley, Branson & Hancock, 2009).
The ERM Initiative at North Carolina State University embarked on a new study
in late 2008, surveying over 700 organizations within the American Institute of Certified
Public Accountants (AICPA) Business and Industry Group to determine how entities
were using ERM to respond to challenges in the current environment. Through the
utilization of an eleven-point Likert scale, responses ranged from “not at all” to “a great
deal” or a similar sentiment (Beasley, Branson & Hancock, 2009, p. 5). Researchers
27
noted that some bias may be realized if the voluntary participant responses differed from
those organizations that did not respond (Beasley, et al.). As reported by CFOs or their
equivalents, over 60% claimed the volume and complexity of risks had changed
significantly over the past five years. Thirty-six percent further indicated they were taken
by surprise by a particular event within that time frame, but 66% reported no change to
the risk disclosures in their financial statements. Despite the majority describing risk-
averse organizational cultures, nearly half, 44%, reported no ERM process in place and
no plans for implementation, with an additional 18% in investigative stages. However, of
the organizations surveyed, 75% of the boards were making increasing requests for senior
management involvement in risk oversight, but only 18% had instituted a chief risk
officer (CRO) position (Beasley, et al.). These findings demonstrated a continued
variability in the employment of ERM methodologies, despite increased external
pressures and heightened volume and complexity of risks. The researchers also
highlighted the potential dangers associated with a reliance on ad hoc communication of
risks. However, several emerging trends may have indicated the presence of sufficient
support upon which ERM frameworks may be installed, namely a greater interest by
boards of directors and a desire for a structured risk oversight approach (Beasley, et al.).
This study was performed again the following year to provide updated insights
relative to senior management responses to the changing risk landscape, particularly in
light of the Securities and Exchange Commission’s 2009 proxy rules requiring companies
to disclose the board’s role in risk oversight. The ERM Initiative once more partnered
with the AICPA Business, Industry, and Government team, surveying 331 executives
through an online tool, utilizing questions similar to the previous study. Respondents

28
again corresponded to a variety of industries, with finance and real estate, not-for-profit,
manufacturing, and services the most common (Beasley, Branson & Hancock, 2010c).
Using the same eleven-point Likert scale, the majority of executives continued to indicate
their perspective that the risk environment was continuing to grow in velocity and
complexity, with 74% at least moderately surprised by an unforeseen event. Slightly less
than half, 47.5%, described a risk-averse culture, signaling the possibility that more
comprehensive risk assessment and mitigation strategies would be likely in the future.
However, once again, 40% of respondents had no plans to institute an ERM program,
with an additional 17% in the investigative stage, little change from the status reported in
the prior year. Similarly, nearly half, 48.7%, reported immature to minimally mature
sophistication relative to their risk oversight processes, with 70% also not reporting the
top risks to the board of directors. These findings were consistent with the previous
study, with a slight increase in the number reporting a CRO installed, at 23% (Beasley, et
al.).
The next year, in July 2010, the researchers were commissioned by the Chartered
Institute of Management Accountants (CIMA) to conduct a similar survey of its
membership, with 264 responses secured from across the globe. Findings from this
survey were consolidated with the previously-described AICPA results, with CIMA
statistics integrated with the prior findings. However, in this report, U.S. results were
described separate from the global findings, highlighting some variations in perspective.
For example, 84% of U.S. respondents, versus 61% of global participants, ranked their
risk management as very immature to moderately mature. Nearly half, 48%, of U.S.
respondents rated their organizations as risk averse or strongly risk averse, with only 11%

29
characterizing their ERM process as complete and formal. Forty-five percent of the U.S.
respondents indicated no plans to implement a framework (Beasley, Branson & Hancock,
2010b).
In both studies, the researchers reported increased expectations for improved risk
oversight, with 45% of U.S. boards and 58% of global boards requesting greater
executive involvement (Beasley, Branson & Hancock, 2010b). Regardless, and despite
increased regulatory pressures, ERM evolution remained relatively immature among
these populations. The economic crisis may have, paradoxically, delayed
implementation, as organizations were likely occupied by merely surviving the climate.
Once again, a reliance on ad hoc risk reporting and informal risk response mechanisms
presented concern in this turbulent environment, with a review of risk management
fundamentals likely needed to launch a renewed ERM focus (Beasley, et al., 2010c).
Perception of COSO. In June 2010, the researchers from the ERM Initiative
were commissioned by COSO to conduct a further study, focusing not only on the
evolution of ERM, but also the usage of the COSO ERM framework. Members of the
COSO contributing organizations were solicited via an online survey instrument, with
460 ultimate respondents representing a variety of industries. The majority of
participants led the internal audit function at their organizations, followed by CFOs,
CROs, and controllers (Beasley, Branson & Hancock, 2010a). Respondents were asked
to rate the state of their risk management practices using a five-point Likert scale, ranging
from “very immature” to “very mature” (Beasley, Branson & Hancock, 2010a, p. 2).
Within this study, just over 20% described their level of ERM program maturity
as somewhat or very mature, with a higher proportion, 42.4%, as somewhat or very
30
immature. Furthermore, 35% revealed they were minimally or not at all satisfied with the
level of reporting provided to senior executives. Two-thirds of participants described
formal key risk reporting to the board, but nearly half, 44%, claimed minimal or no
formal processes to identify and monitor risks, despite increasing board requests for such
discipline (Beasley, Branson & Hancock, 2010a).
Concerning the perceptions of the COSO framework, 65% of respondents were at
least fairly familiar with the structure, with less than 8% reporting they were not at all
familiar. Correspondingly, organizations primarily looked to the COSO framework for
guidance in implementing ERM, at 54.6%. Nearly two-thirds reported the framework as
providing significant “theoretically sound principles and guidance,” with nearly half
indicating it also significantly provided a common ERM language and clearly described
the key elements of a robust process (Beasley, Branson & Hancock, 2010a, p. 6).
However, nearly 30% reported the framework’s minimal demonstration of the value
provided by ERM, and limited improved assessment of risk acceptance relative to
organizational objectives. Over one-third also claimed the framework provides minimal
clear and practical guidance for the implementation of ERM, and 26.4% described the
cube depiction as unnecessarily complicated (Beasley, et al.).
Consistent with similar studies, these findings showed a generally immature level
of ERM in the majority of organizations. Dissatisfaction with the level of oversight was
apparent, despite increasing interest by boards of directors. The value of incremental
investment in an ERM infrastructure was continuing to be questioned by decision
makers; the researchers suggest a refocus on the notion that risks must be understood to
also realize organizational rewards. While respondents may support ERM theoretically,

31
they appear to be challenged by translating these concepts into practical application. Few
of the respondents were aware of Volume 2 of the ERM framework, titled Application
Techniques (COSO, 2004a). Possibly as a result, COSO reported an initiative to issue a
series of thought papers to provide implementation guidance and tools to assist in
managing risk holistically (Beasley, Branson & Hancock, 2010a.).
Throughout these studies relative to the presence of ERM, a clear picture of the
trend in this level of adoption has not emerged. Rather, considerable variability is
apparent; in fact, surveyed organizations who reported no intent to install an ERM
program varied from 17% to 45% of the total (Beasley, Branson & Hancock, 2010b;
Beasley, Clune & Hermanson, 2005). These results may be impacted by the differing
populations surveyed, and possibly the relatively small sample sizes involved, or may
simply be an indication of the confusion surrounding the adoption of ERM in the
corporate sector.
Industry-specific studies. In addition to multi-industry surveys relative to the
presence of ERM, several additional studies have been performed regarding risk
management in traditionally risk-focused industries, namely financial services and
insurance. These studies have expanded to include ERM topics, with similar research
questions posed relative to the presence and maturity of ERM practices.
Financial services. Risk management has been a topic within the financial
services sector for many decades, through the notion of portfolio diversification and
investment hedging (Buehler, Freeman & Hulme, 2008). As the definition of risk
management has expanded to include ERM, financial institutions have also been
challenged to broaden their perspectives. The international accounting firm Deloitte &

32
Touche LLP performs targeted risk management research within this industry, via the
Global Risk Management Survey series. Through the utilization of various Likert scales,
these surveys present a comprehensive understanding of the risk management issues
faced by financial institutions throughout the world, including ERM, enabling
organizations to benchmark their risk processes against others in the industry (Deloitte &
Touche LLP, 2007).
The first of these surveys performed since finalization of the COSO ERM
framework, the 2004 fourth edition reported survey responses from 162 financial
institutions across five continents. Researchers reported the most compelling finding to
be the dramatic rise in the role of the CRO, with 81% of respondents indicating the
appointment of this individual in their organization. Three-quarters of these CROs
reported to the board of directors or CEO, an indicator of the level of influence held by
these individuals, with 59% of organizations reporting board responsibility for risk
oversight. At this early stage of ERM evolution, less than one-quarter of respondents
indicated an ability to integrate risks across business units, geography, or risk types.
Participants reported technology and data concerns to be the primary barrier to achieving
a holistic risk approach. This elusive integration signified the likelihood that ERM would
be a primary focus in the foreseeable future, particularly in light of regulatory pressures
in the post-Enron environment (Hida II & Goodspeed, 2005).
In the fifth edition, Deloitte & Touche LLP (2007) collected 130 responses from
CROs and other risk professionals at local, regional, and global financial organizations in
2006. These institutions reported an increase in board of director oversight of ERM, with
70% of respondents indicating this level of focus, compared with 59% in 2004. Eighty-

33
four percent of organizations reported the appointment of a CRO, an increase from 81%
since the fourth edition of the survey. Respondents overwhelmingly rated their
mitigation of traditional risk areas, such as market, liquidity, and credit risk, as extremely
or very effective, at over 70% of the total. However, the respondents rated their
expansion to ERM oversight as less operative, with less than 50% of organizations rating
their mitigation of business continuity, IT security, operating, or vendor risk as very
effective. At this point, 35% of executives reported an established ERM program, with
32% in the process of establishing a framework, and 18% planning to create one. Three-
quarters of respondents also described the value of their ERM program as outweighing
the costs, but only 4% indicated quantification of the benefits (Deloitte & Touche LLP).
At this juncture, the researchers reported risk management to be particularly
critical for financial institutions as stewards of customer assets and the cornerstone of the
world’s financial system. The researchers recounted heightened scrutiny and regulatory
oversight performed, commensurate with this role. Establishing effective risk
management in an ever-changing landscape, however, is a challenge, confirmed by varied
levels of achievement reported by these financial institutions. The researchers further
report that effective holistic management of risks enables an organization to utilize risk-
taking strategically, creating value and building a competitive advantage (Deloitte &
Touche LLP, 2007).
The 2008 survey, the sixth edition, included responses from 111 global financial
institutions, illuminating their approach to mitigating risks in an ever-challenging
environment. The economic turmoil that began in late 2007 made risk management an
even greater priority, with the ability to assess the impact of volatile markets and react

34
quickly of critical importance. Despite this assertion, only 73% of institutions surveyed
indicated the presence of a CRO or its equivalent, a decline from the 84% reported in the
previous edition, a trend that was not explicitly discussed in the survey report. Seventy-
seven percent of organizations indicated risk governance held at the board of director
level, with 63% indicating a formal statement of risk appetite employed. Concerning
ERM, 36% of organizations reported an established program, with an additional 23% in
the creation process. Again, the change from the previous survey is not discussed;
however, of the larger institutions, those with $100 billion or more in assets, 58%
reported an ERM framework installed. The vast majority of organizations with an ERM
program, 85%, reported the benefits to outweigh the costs, both quantified and non-
quantified. Nevertheless, only 20% of institutions indicated well-developed usage of risk
methodologies, including key risk indicators and scenario analysis (Deloitte Touche
Tomatsu, 2009).
The researchers maintain that appropriate oversight and governance is critical to
establishing a pervasive risk culture. The organization’s risk appetite, strategy, and
overall framework must be sufficiently responsive to combat a dynamic environment,
with multiple layers of risk considered. At the time of the survey, the regulatory response
to the economic crisis was still unknown; however, new requirements would likely be
stringent. As a result, significant transformations may be necessary for the organizations
participating in the survey (Deloitte Touche Tomatsu, 2009).
A more recent edition, the seventh, utilized similar participants, with 131 global
financial institutions completing the survey during 2010. The purpose of the survey
remained the same since the fourth edition, with the additional recommendation to

35
continue dialogue and encouragement of risk management usage. Among other inquiries,
similar questions from the past editions were once again posed. These participants
indicated 86% of organizations have a CRO, an increase from the 2008 finding of 73%.
The CRO reported to the board at 85% of organizations surveyed (Deloitte Global
Services Limited, 2011). This iteration showed 79% of organizations with an ERM
framework in place. A shared risk technology model was increasingly cited, enabling
risk managers to access accurate, detailed information, including third-party
arrangements and transaction-level data. Again, these executives rated their
organizations as very or extremely effective in managing the traditional financial risks;
however, less than 40% of organizations had similar perspectives on the effectiveness of
enterprise risk or operating risk programs. The researchers once more reported the need
to respond appropriately to a changing landscape, and encouraged the implementation of
an ERM program to develop a comprehensive viewpoint, with risk management
considerations likely to be introduced into executive compensation programs (Deloitte
Global Services Limited).
Throughout this series of surveys, the ERM topic became a stronger presence,
moving from latter parts of the assessments to a place of prominence over the six-year
time span. A comparison of analogous questions and their associated responses is
depicted in Appendix I. Despite overall progress in the adoption of ERM, and the
associated focus on the topic, the recurring theme of a need to more fully embrace the
holistic discipline in the financial industry was clear (Deloitte Global Services Limited,
2011).

36
While motivations to implement ERM within the financial industry may appear
evident, further research was conducted to determine whether alternative ERM models
may co-exist within these ventures, more plausible than in other industries given the long
risk history in banking. Two banks were selected for field study, leading-edge
organizations that had expanded their risk focus to include strategic items and risk
appetite discussions. Seventy-five interviews were conducted with senior leaders and
risk management staff as the primary source of data, with direct observations of risk
management in practice as well. The researcher described four types of risk
management, all of which are enterprise-wide, but provide various levels of focus and
differing priorities: (a) risk silo management, (b) integrated risk management, (c) risk-
based management, and (d) holistic risk management. Three of these practices emerged
from the field study of the first bank, all except risk-based management. The second
bank initially appeared similar, but further analysis revealed the ingrained risk silo
management culture, seconded by the risk-based management framework. In both cases,
the tone from the top of the organization appeared to determine the ERM philosophy
applied, with the officers responding differently to pressures for governance, namely the
shareholder value obligation, versus a risk-based control imperative (Mikes, 2009).
This researcher describes a dynamic whereby later variations of ERM within the
same organizations take on strategic importance. To leverage ERM to its fullest
potential, the entity must align the risk management mixture with corporate culture and
priorities. The researcher suggested additional research be conducted to determine if
these risk management patterns are duplicated or differ elsewhere in the industry, with
further exploration into the field of operational risk in particular. Longitudinal studies

37
would also assist in confirming the drivers behind these various risk management styles.
In this budding practice of ERM, various adoption strategies would likely continue
(Mikes, 2009). Throughout the financial industry, therefore, a trend toward ERM
adoption is clear, but variable levels of commitment are apparent, mirroring the
unpredictable pattern in industries at large.
Insurance. Aon Corporation (Aon) is a leading provider of risk management,
insurance, and reinsurance services across the world, ranked as the top global insurance
brokerage in 2009 (Aon Corporation, n.d.). Aon Analytics, in turn, provides empirical
information to enable businesses to make educated decisions about the risks facing their
organizations and risk management. Aon Analytics conducted a survey in late 2006 and
early 2007, soliciting risk-ranking responses from 320 diverse entities in 29 countries.
All participants reported annual revenues in excess of $1 billion, with 70% representing
publicly-owned corporations (Aon Corporation, 2007).
Respondents were asked to rank the risks facing their organizations, from a choice
of 31 categories of risk. The risk of a damaged reputation was ranked as number one
across all revenue strata and regions, followed by business interruption and third-party
liability. The more traditional risk categories of financial risk and physical damage
appeared much further down the list, at points eight and nine. Variable levels of
preparedness to mitigate these top ten risks were described, with the lowest levels of
readiness reported for the top-ranked reputation risk (Aon Corporation, 2007). Forty-two
percent of respondents depicted their reliance on experience and intuition to identify risk,
a sentiment more common in North and South America than elsewhere. Greater board
involvement was also reported, with 78% of participants describing executive policies on
38
risk oversight. A vast majority, 90%, indicated the presence of a formal risk management
or insurance organization, with 61% structured within the finance department. Risk
identification, quantification, and analysis were described as top priorities in the two-year
term, with a need to manage enterprise-wide risks second in importance. The researchers
reported these findings as an indication of the shift in risk management priorities beyond
the historical realm. This migration is commensurate with the increasing complexity and
volume of risk, particularly on the world-wide scale. The researchers recommend
companies fully assess their capacity to assume more risks, necessary to leverage global
opportunities (Aon Corporation, 2007).
Aon conducted a somewhat more comprehensive survey in the third quarter 2009,
designed to determine the degree to which ERM had been put into practice, how it was
being utilized, and the impact on balancing organizational culture, company needs, and
stakeholder requirements. Slightly over 200 respondents participated in the web-based
study, 40% from North and Latin America, once again representing a variety of
organizations. Participants included risk managers, CROs, CFOs, and treasurers, among
others, providing feedback relative to their risk management perspectives and concerns
(Aon Corporation, 2010).
Aon previously established a five-stage ERM maturity model, used to benchmark
an organization’s progress relative to ERM adoption. Within this model, the maturity
levels include (a) initial/lacking, (b) basic, (c) defined, (d) operational, and (e) advanced.
The 2010 respondents most commonly indicated their programs to be in the defined or
operational stages, at 55% of the total, a marked increase from the 2007 levels, with 7%
at advanced stages. Participants reported the primary drivers behind increasing ERM

39
maturity as the need for improved governance and transparency, use of best practices,
and enhanced organizational performance and decision making. Respondents described
increased success in augmenting shareholder value in conjunction with more mature
ERM programs. Survey findings and positive trends were grouped into nine hallmarks of
advanced ERM, with expert advice offered to readers to assist in their ERM adoption
efforts. Six specific case studies were presented as well, illustrating practical guidelines
for application. The researchers point out that each organization’s journey is unique,
with its roots in corporate culture being the primary unifying factor. However, the most
advanced practitioners are best positioned to fully leverage emerging opportunities (Aon
Corporation, 2010).
These industry-specific studies generally show a higher level of adoption of ERM
than research conducted in the broader community, with over half of banking and
insurance firms typically reporting a mature program. This disparity may be the result of
the longer history of the application of risk management techniques in the banking and
insurance disciplines (Mitchell, 2010; Outreville, 1998). Familiarity with risk concepts,
and commitment to risk mitigation by the very nature of their operations, thereby create a
more welcoming culture for ERM adoption among the financial and insurance industries.
Role of the board of directors. As mentioned in the previous studies, boards
play a key role in influencing ERM implementation. As ERM began to evolve, research
commenced to take a closer look at this critical responsibility. For example, in late 2005
and early 2006, the Conference Board partnered with McKinsey & Company, a
management consulting firm, and KPMG’s Audit Committee Institute to conduct
research into the role of U.S. corporate boards in ERM (Brancato, Tonello, Hexter &

40
Newman, 2006). Research was performed through a series of interviews with corporate
directors, a 32-question survey, a review of Fortune 100 companies’ board committee
charters, and legal analysis. A total of 127 directors responded to the survey, with an
additional 30 director interviews conducted, representing a variety of industries. The
insight provided would be critical in understanding the challenges faced by boards in
responding to the need for comprehensive oversight (Brancato, et al.).
Several key trends emerged through the synthesis of these various information
sources. Nearly 90% of directors claimed a high degree of confidence in their
understanding of the risks faced by their organization, particularly critical given the New
York Stock Exchange rules and a variety of other legal and regulatory pressures. Over
half of the directors then reported that strategic risks presented the greatest threat; as
such, a top-down view of risk management is critical to the board’s strategic role.
However, while they claimed to have a good grasp on strategic risk implications, less
than 60% appeared to understand the interaction of various business segments within the
overall risk portfolio. Despite these challenges, directors repeatedly announced that the
tone at the top was critical, with the risk culture then infused to line-level management.
Finally, companies should look to their peers, particularly those in the banking and
insurance industries, for best practices and emerging trends in risk management
(Brancato, Tonello, Hexter & Newman, 2006).
The researchers then provide a series of recommendations to boards who wished
to improve their ERM abilities. Boards should review their committee structures and
charters, assess board competencies relative to risk oversight, develop processes to ensure
directors are fulfilling their fiduciary responsibilities, develop a robust ERM reporting
41
system and monitoring process, and spend time with executives that hold a key risk
perspective. The researchers then caution directors in terms of a false sense of security
created by ad hoc risk discussions, with a systematic ERM process needed to fully
understand emerging risks (Brancato, Tonello, Hexter & Newman, 2006).
Several years later, in third quarter 2010, COSO teamed up with Protiviti, a
business consulting and internal audit firm, to conduct a survey relative to board of
director risk oversight responsibilities and their methods. This insight would be helpful
in understanding the current state of the risk oversight process, as well as wishes for the
future. Using subscription lists from publications serving boards of directors, Protiviti
obtained 200 director-level participants from primarily U.S.-based corporations. These
individuals completed an online questionnaire. Again, because participation was
voluntary, some bias may have been experienced within the resulting findings (Protiviti,
2010).
For many of the survey questions, the researchers reported slightly positive
responses relative to the presence of foundational risk-oversight elements, with
variability in underlying processes. For example, 53% of respondents reported their
oversight process to be effective or highly effective, but 71% described a lack of
execution of mature risk oversight processes. The level of perceived effectiveness also
appears to vary based on the size of the organization. For instance, 65% of respondents
from public companies with over $1 billion in annual revenue reported effective/highly
effective processes, compared with 13% of not-for-profit organization directors.
Regardless, 84% percent of respondents reported board responsibility for oversight

42
processes, the vast majority of which also have an audit committee involved in risk
oversight (Protiviti, 2010).
The researchers contend that, once again, organizations may derive benefit from a
more ERM-dedicated board, a defined risk appetite, and rigorous dialogue. Articulation
of the risk appetite would provide a common language and approach to risks across the
enterprise. The researchers recommended an appetite statement be constructed using
several underlying assertions, such as the company’s position on protecting its reputation,
debt rating, financial strength, and loss exposure. Once defined, associated conversations
should include debates on both the upside and downside of taking on more risk, inherent
strategic assumptions, and the impact of emerging risks, among other topics. Overall,
tremendous opportunities to enhance board risk oversight were apparent, a consistent
theme throughout these surveys (Protiviti, 2010).
Given the integral role organizational leadership plays in ERM, additional
researchers became interested in the text that executives involved in risk oversight were
reading. An online survey was launched in 2007 to help researchers identify potential
gaps in the literature, and highlight partnership opportunities for academics. The survey
invitation was sent to 87 risk executives, members of the Strategic Risk Councils of the
Conference Board of Canada, and the U.S. Conference Board. Ultimately, 44 responses
were secured, representing a variety of industries. All participants had some ERM
experience, and 95% named ERM as their major area of expertise, with over half holding
the title of CRO or higher (Fraser, Schoening-Thiessen & Simkins, 2008).
Each participant was presented 88 readings, consisting nearly equally of articles,
books, and research reports. The executives were asked if they read the item, and if so,
43
how much value it added to their knowledge of ERM. Participant responses were
gathered using a five-point Likert scale, ranging from “never heard of it/not relevant” to
“read more than 80%/a must read for ERM” (Fraser, Schoening-Thiessen & Simkins,
2008, p. 80). The mean levels of reading and value did not differ among publication
types. However, participants with greater levels of experience read more often, with a
mean read rating of 1.92 out of 5, compared with the less-experienced at 1.38, but the
value provided did not differ significantly between these groups. The top ten articles,
books, and top eleven research reports were then provided, a listing which included
several researchers cited in this dissertation. The COSO Integrated Framework (2004b)
was the most widely read, at 74% of respondents, with an average value rating.
Interestingly, nearly half of respondents reported they seldom followed COSO’s
recommended techniques, contrary to the findings of Beasley, Branson and Hancock
(2010a). Participants also provided a listing of additional items they felt contributed to
their understanding of risk, but not necessarily ERM specifically (Fraser, Schoening-
Thiessen & Simkins, 2008).
The researchers opined that ERM is a critical topic for organizational survival and
future success, with external events driving executives to learn more about the subject.
Not only are agencies utilizing ERM within their credit rating analyses, stakeholders are
demanding better risk management, and holding boards accountable. Entities new to
ERM continue to experience challenges, with additional research required so that
executives can learn from others’ successes. The researchers encouraged academics to
conduct research in collaboration with risk professionals to further assist the expansion of
ERM (Fraser, Schoening-Thiessen & Simkins, 2008).

44
Factors influencing ERM. Researchers have also begun to delve into dynamics
behind ERM implementation, as the firms that adopt ERM may be motivated by a variety
of underlying factors, such as increased pressure from regulators, in addition to the
proposed COSO outcome of enhanced ability to attain organizational objectives. Pagach
and Warr (2011) further analyzed the underlying characteristics of ERM-adopting
organizations, in an effort to scaffold upon existing research that implied a range of
drivers behind the establishment of an ERM framework. Utilizing the appointment of a
CRO as an indicator of ERM adoption, 138 publicly-traded companies were included in
this study. The researchers conducted a multivariate analysis to assess factors that had
been theorized drivers of the ERM decision, such as financial, asset, and market
characteristics, as well as executive compensation packages which may affect
organizational risk attitudes (Pagach & Warr).
To analyze the relationship between organizational factors and the dependent
variable, the hiring of a CRO, the researchers considered the use of logistical regression
(Pagach & Warr, 2011). However, this method would likely product inaccurate statistics,
as the assumption that the underlying variables are mutually independent cannot be made.
Rather, the researchers used a hazard-model approach, which also incorporates the
impact of time in the CRO hiring decision.
Findings indicate that larger firms were more apt to appoint a CRO (β = 0.635, p
< 0.01), as well as those with higher cash flow (β = 0.130, p < 0.05) and return volatility
(β = 0.611, p < 0.05), as were entities with a higher proportion of shares held by
institutional investors (β = 0.745, p < 0.05). Additional metrics to measure CEO
compensation-plan sensitivity to stock volatility also show a positive relationship with

45
CRO appointment (β = 0.251, p < 0.1), a likely scenario if ERM is believed to reduce
downside risk without hindering an organization’s ability to embrace opportunities.
These findings are consistent with the theoretical advantages of ERM. However, the
researchers indicated that further analysis is needed to gain insight into the evolution of
ERM throughout these firms, as earlier research in the field (Liebenberg & Hoyt, 2003)
revealed the appointment of a CRO is not necessarily an indicator of an effective ERM
program (Pagach & Warr, 2011).
Value creation. The global accounting organization, KPMG International,
commissioned the Economist Intelligence Unit to also conduct research into how
companies defined risk management. This analysis provided information relative to
dynamics needed to transform ERM from an organizational cost center to a value center,
delivering operational and financial value. A total of 435 senior professionals were
surveyed from organizations across the globe, representing entities reporting over $1
billion in annual revenues (KPMG International, 2007).
Survey respondents described a variety of environmental factors causing
organizations to increase investment in ERM, such as enhanced regulatory pressures
(54%), the emergence of new business risks (35%), and amplified focus on risk and
controls by investors (32%), findings consistent with previous studies. The majority of
respondents, at 59%, also indicated an improved coordination between risk management
and internal audit, but nearly two-thirds of companies expressed difficulties in
coordinating efforts with other assurance areas. Twenty-two percent of respondents also
reported the limited awareness of risks presented as an ongoing barrier to the
dissemination of risk principles; increased dialogues would be necessary to bring risk

46
expertise into strategic decisions. The researchers recommend technology be
implemented to further increase the value proposition, with the option of outsourcing
explored if additional expertise was required (KPMG International, 2007).
The researchers pointed out that the calculative mindset was in a state of flux; no
longer must something be measurable to exist. Forward-looking organizations would see
risk management becoming a corporate consciousness, supporting informed value
judgments with robust data and insight. While risk conversations often focus on the
downside, astute organizations would realize the risk of lost opportunities apparent in this
quickly-changing international economy. Fully embracing the risk discipline across an
organization would allow ERM to move beyond value preservation to value creation
(KPMG International, 2007).
In August 2010, Aberdeen Group, a fact-based research organization, also became
interested in the growth of ERM, particularly as a result of the economic situation. The
housing market collapse, coupled with the financial crisis, represented a highly
improbable event. According to the researchers, greater focus on ERM ensued,
particularly as organizations became more cognizant of the need to protect their
reputation. The researchers conducted a survey of over 210 companies across the globe,
80% of which had increased their ERM focus over the past year. The survey was
designed to explore the methods by which best-in-class organizations were implementing
ERM tools to mitigate risk and improve decision making (Hatch & Jutras, 2010).
To determine the best-in-class organizations, the researchers used three key
performance criteria: (a) cash flow forecasts with 94% accuracy and 13% higher than
other companies, (b) 17% improvement in risk detection and assessment effectiveness,

47
7% higher than their peers, and (c) 3% loss in revenue over the past 12 months, 10% less
than other companies. The ERM strategic methods were then determined from these
organizations, compared with the remaining survey participants. Thirty-six percent of the
best-in-class companies reported the building of a risk-conscious culture, and 36% also
secured executive commitment for ERM endeavors. These figures were 31% and 26%
among the remaining population, respectively. The top tier also reported the presence of
a mature ERM program most often, at 22% of the total, compared with 12% for the
industry average. These companies were also 75% more likely to utilize “what-if”
scenario methods (Hatch & Jutras, 2010).
While this study does not present an argument for causation, the differing effect
sizes may present further research opportunities to identify potential correlations between
ERM maturity and financial performance. Case studies relative to several best-in-class
companies were also presented for benchmarking purposes. The researchers stressed the
need for organizations to assimilate ERM into their culture, driving towards better
decision making and achievement of company objectives. The researchers further
encouraged organizations to use predictive analytic tools and modeling to assess and
monitor risk. It was suggested that best-in-class companies also increase the use of ERM
technology, and build links between the ERM program and compensation to ensure
ongoing accountability (Hatch & Jutras, 2010).
Effectiveness. Despite the growth in the application of ERM methodologies,
researchers from the University of Maryland realized that limited empirical evidence
existed in terms of the impact on firm performance. They theorized that the relationship
between these dynamics is contingent upon a harmony between an ERM program and

48
factors specific to the firm, namely environmental uncertainty, industry competition, firm
complexity, firm size, and board monitoring. The researchers developed an ERM index,
synthesizing these factors. Research was conducted through an empirical study of 112
U.S. firms, representing 22 industries, which disclosed information about their ERM
programs in 2005 Securities and Exchange Commission filings (Gordon, Loeb & Tseng,
2009).
For each organization in the sample, firm performance was measured by the one-
year excess stock market return to shareholders for 2005. The ERM index was then
calculated using the four objectives outlined by COSO ERM, namely strategy,
operations, reporting, and compliance, with each indicator standardized among the
sample before combination into the index. The ERM index was then used as a proxy for
ERM. Summary statistics showed a highly negative degree of correlation between the
absolute value of residuals from the ERM equation, and the level of board monitoring (β
= -3.076, p = 0.001) (Gordon, Loeb & Tseng, 2009).
These findings confirmed the researchers’ argument that the ERM/firm
performance relationship is predicated on a match with firm-specific variables. However,
the researchers point out that the study only utilized data from 2005, with one-year excess
stock market returns representing only one of a number of methods to assess
performance. Further, different contingency variables could also be considered in this
analysis. As a result, the researchers indicated the study findings to be preliminary, but a
significant step in empirical study relative to ERM (Gordon, Loeb & Tseng, 2009).
Heat mapping. Regardless of a company’s current level of ERM presence, one
method of portraying risk assessment, as described by COSO (2004a), is the risk map, the

49
“graphic representation of likelihood and impact of one or more risks,” often described as
a heat map (p. 47). Heat maps provide a depiction of either the quantitative or qualitative
measure of a risk’s likelihood and impact factors on two axes, enabling an organization to
highlight potential events which are more or less significant (COSO, see also Ballou &
Heitger, 2005; Hampton, 2009; Moeller, 2007). This visual portrayal enables
management to prioritize their attention as necessary (COSO). An example of such a
map is shown in Appendix B.
As reported by Lam (2003), heat mapping is becoming increasingly common as a
method for entities to monitor risks across the enterprise. The development and
implementation of a heat map involve several key steps, namely
• development of an overall classification schema for all kinds of risk in an
organization;
• creation of a list of specific risks based on prior events and self-assessment;
and
• evaluation of the likelihood and impact of each potential event, based on
management judgment or empirical risk models (Lam, 2003).
Once established, each item on the heat map should be further analyzed, with
various methods of response considered. For example, all companies encounter risks that
are of low severity and low probability, such as the failure of a voicemail system. These
failures are rather unlikely, and, typically, an organization would be able to work around
such a service interruption. These types of risks should be monitored to ensure they
remain at an acceptable level (Lam, 2003). Conversely, risks high in likelihood and
impact are faced by few companies, given the significant management attention and

50
mitigation plans needed to effectively protect the entity from such an event. Meanwhile,
risks that are highly likely but result in a minimal impact, such as the theft of office
supplies, are generally self-insured by a company (Lam, 2003).
Lastly, risks that are potentially high in severity but have a low likelihood of
occurring, such as an earthquake or a fire, are often suitably mitigated through the use of
insurance (Lam, 2003). The portion of these high-severity, low-likelihood, risks that are
so unpredictable that they cannot be foreseen, such as the 9/11 terrorist attacks, have been
described as black swan events (Taleb, 2007). While, by definition, black swan events
cannot be reasonably predicted, the role of the risk manager is to try to identify these
exposures whenever feasible, possibly through the use of risk consultants, and to
introduce the likelihood into risk discussions (Barton, Shenkir & Walker, 2008;
Hampton, 2009).
In actuality, exposures encountered by an organization vary greatly in likelihood
and severity ranges, depending on the entity’s specific operations and business
environmental volatility. As such, effective monitoring methods and reporting protocols
must be established to detect any shifts in the risk landscape (Lam, 2003). It should be
noted that the quality of a heat map is highly dependent on the efficacy of the process by
which it was created (Lam). A successful heat map process is comprehensive, consistent,
and provides accountability for management and monitoring of the risks identified. If
built without standard risk definitions, and the assignment of arbitrary probabilities and
impacts, the resulting map would yield little benefit other than increased awareness of
select issues (Lam). However, if done properly, the map can be “a highly effective tool

51
for risk identification and assessment,” with wide usage occurring due to its ability to
consider both financial and nonfinancial risks (Lam, 2003, p. 283).
This method of risk mapping, or heat mapping, is described to be commonly used
in the world of ERM (Jablonowski, 2007). The Federation of European Risk
Management Associations reports members in the CRO role frequently communicate via
a series of risk maps and their linkages to corporate objectives (Pratt, 2007). Heat
mapping has been cited by one particular corporation as the “primary tool used by
management and the board to holistically track risk” (Hexter & Vainberg, 2011, p. 2).
This particular board found the primary value of the heat map to be the discussions
generated, considering as well the element of risk velocity, the speed at which a risk can
evolve from concept to impact (Hexter & Vainberg). Heat maps may also be used to
communicate the relative impact and likelihood of a specific risk, such as fraud, for
example, to senior management (Bishop & Hydoski, 2009). This flexibility enables heat
map adoption by a multitude of businesses; in fact, at the 2011 Risk and Insurance
Management Society conference, nearly all of the sessions over the four-day forum
contained a version of a heat map (F. Fiorille, personal communication, May 3, 2011).
Aligning this technique with Prospect Theory, described in Chapter 1, the risk-
mitigation preference indicated will depend on the method by which a problem is framed,
dubbed the framing effect (Plous, 1993). For example, the phrase “400 people will die”
(Statement A) is identical in fact to “400 people will not be saved” (Statement B).
However, the more positive stance by which Statement B is framed may lead to
preferential leanings versus Statement A (Wilkinson, 2008). These predispositions

52
possibly highlight the need for consistent presentation of options, such as through the use
of a heat map.
Chapter Summary
Methodological review. As described, empirical studies within the field of ERM
overwhelmingly use survey methodologies to gather data. In fact, of the research studies
presented, 80% primarily used surveys (Aon Corporation, 2007, 2010; Beasley, Branson
& Hancock, 2009, 2010a, 2010b, 2010c; Beasley, Clune & Hermanson, 2005; Deloitte
Global Services Limited, 2011; Deloitte & Touche LLP, 2007; Deloitte Touche Tomatsu,
2009; Fraser, Schoening-Thiessen & Simkins, 2008; Hatch & Jutras, 2010; Hexter &
Gates, 2005; Hida II & Goodspeed, 2005; KPMG International, 2007; Protiviti, 2010).
These instruments were typically administered online to members of a professional
community, constituents in groups that would possibly be the most likely to be engaged
in ERM activities, such as the COSO member organizations. This concentration would
likely indicate a potential bias in responses, a fact cited in several studies (Beasley, et al.,
2009; 2010a; Protiviti, 2010). Many of these surveys targeted a global audience; only
one showed the U.S. findings separately from international responses, with marked
differences noticed (Beasley, et al., 2010b). However, multiple industries are typically
represented throughout these studies.
Moreover, many of these surveys asked, in essence, the same questions, to the
same or similar populations included in other surveys. Studies recounted in the ERM
Presence section, in particular, are nearly identical, whereby participants were asked to
rate their impression of ERM, the level of ERM maturity an organization has reached,
who is primarily accountable for execution, and the trend in risk interest. These

53
comments hold true within industry-specific surveys as well. The questions were also
very similar, with one survey in particular administered relatively unchanged over a
seven-year time span (Deloitte Global Services Limited, 2011; Deloitte & Touche LLP,
2007; Deloitte Touche Tomatsu, 2009; Hida II & Goodspeed, 2005). Despite the rather
static survey questions, participants differed among each study, making longitudinal
findings unfeasible.
Regardless, findings were relatively inconsistent throughout all the surveys
reviewed. These descriptive statistics reported that ERM frameworks vary by degrees of
maturity, but show greater maturity in the financial industry, likely due to a longer history
of risk appreciation (Deloitte Global Services Limited, 2011; Deloitte & Touche LLP,
2007; Deloitte Touche Tomatsu, 2009; Hida II & Goodspeed, 2005). The series of
surveys also indicated varied progress in ERM, with the presence, in some cases,
appearing to grow over the years, including more active engagement by boards of
directors. Researchers would typically include a ray of good hope in their
recommendations, with phraseology implying there is a long way to go, but things are
improving. This posture was repeated relative to the studies of board involvement
(Protiviti, 2010).
More recently, deeper analysis within certain ERM factors began to be performed
using somewhat different methodologies, including interviews and analysis of public
records, as well as univariate and multivariate methods of assessment (Brancato, Tonello,
Hexter & Newman, 2006; Gordon, Loeb & Tseng, 2009; Mikes, 2009; Pagach and Warr,
2011). No consistent measurement tools were used throughout these studies; however,
the researchers conducting an analysis on ERM effectiveness did make an attempt to
54
construct an ERM index, which may be used by researchers in the future (Gordon, Loeb
& Tseng). Heat mapping, meanwhile, a common method of risk assessment, also has yet
to be researched in terms of effectiveness. This lack of causal understanding and
unifying tools in the literature may be an indicator of the infancy of the ERM discipline.
Several studies provided additional recommendations to assist the practitioner in
implementing ERM, often through the use of case studies (Aon Corporation, 2010; Hatch
& Jutras, 2010; Hexter & Gates, 2005).
It should be noted that several of these research studies have not appeared in peer-
reviewed literature, in some cases with the research arm of a for-profit venture
conducting the study (Aon Corporation, 2007; Deloitte Global Services Limited, 2011;
Deloitte & Touche LLP, 2007; Deloitte Touche Tomatsu, 2009; Hatch & Jutras, 2010;
Hida II & Goodspeed, 2005; KPMG International, 2007; Protiviti, 2010). The
administration of these studies may have been somewhat self-serving by several of these
organizations, as they often provide significant consulting practices, which may be able
to assist an organization with establishing their ERM framework. However, use of these
reports may have limited publication bias, presenting a more complete picture of the state
of ERM.
Gaps/recommendations. As mentioned, the majority of studies asked the same
or similar questions, and the widespread use of solely descriptive statistics indicates a
relative immaturity within the literature. Findings across the studies are somewhat
inconclusive, leading to the question of how much incremental knowledge each study
contributed to the academic discussion. A marked exception, however, surrounds the
perception of the COSO cube itself. Interestingly, nearly half of Fraser, Schoening-
55
Thiessen and Simkins’ (2008) respondents reported they seldom followed COSO’s
recommended techniques, contrary to the findings of Beasley, Branson and Hancock
(2010a). The fact that more recent studies have utilized techniques other than surveys is
an encouraging indicator that some of the gap may be reduced.
Many of these studies also, more recently, have been providing best-practice
guidance to assist practitioners in developing their own programs, occasionally through
the use of case studies. However, alternate studies report that organizations must build a
model unique to the enterprise (Aon Corporation, 2010). This factor may pose
questionable benefits presented by the best-in-class information. Nevertheless, COSO
has begun issuing thought papers to, once again, assist ERM practitioners in developing
tools and techniques, but not necessarily the establishment of a framework overall.
However, no studies utilizing an intervention appear to have been conducted
relative to this topic. Rather, the effectiveness study describes merely the correlation
between ERM and firm performance (Gordon, Loeb & Tseng, 2009). A high degree of
correlation, however, does not determine causation. Therefore, no findings have ensured
whether ERM tools and techniques, such as heat mapping, provide value; only a sense
that benefits outweigh the costs has been discussed. This return-on-investment has not
been fully quantified to date, indicating the need for further investigative studies.
Conclusion. To summarize this analysis, studies within the ERM topic certainly
show opportunities to implement an ERM framework and integrate the discipline into
corporate operations. However, existing studies indicate minimal empirical evidence of
ERM effectiveness, possibly limiting its perception as a provider of value. Meanwhile,
Beasley & Frigo (2010) report the objective of ERM as “to increase the likelihood that

56
strategic objectives are realized and value is preserved and enhanced” (p. 33). Additional
research into ERM’s ability to assist an entity in meeting its objectives could provide
greater impetus for ERM advocacy, incrementally more so than the state of the literature
today.
57
Chapter 3: Research Design Methodology
General Perspective
As described, organizations are increasingly encouraged to adopt an ERM
framework, both as a best practice, as well as through actions by the New York Stock
Exchange, the Securities and Exchange Commission and credit rating agencies (Beasley,
Branson & Hancock, 2009; Bugalla, Fox, Hackett & McGuinness, 2011; COSO, 2004b;
RIMS, 2009). Correspondingly, much of the research conducted related to ERM
surrounds the presence of frameworks within the corporate sector, and their relative
evolution, with varying results described throughout the literature. Organizations who
continue to struggle with implementation cite various causes, among them, a lack of
perceived value of an ERM program (Beasley, Branson & Hancock, 2010a; 2010c).
However, while some may not see the value, others blame the 2008 financial crisis on
failures of ERM, alluding to the potential significance of the ERM discipline
(Mollenkamp, Ng, Blevin & Smith, 2008; RIMS, 2009). Still, while an effective ERM
program is reported to protect and enhance shareholder value (Driscoll, 2011), empirical
tests as to the effectiveness of ERM have not been performed to date.
Problem Statement
As such, the first question to be researched asks to what extent ERM frameworks
have been implemented in organizations, following, for example, COSO and ISO
guidance. While many studies have been conducted in this regard over the last decade, a
wide variety of survey results have been described. These findings may be impacted by

58
the diverse populations participating in the studies, as well as, in some cases, relatively
small sample sizes. Meta-analysis, a research technique whereby research findings are
analyzed across studies, represents one approach to synthesize information from
divergent research. To align with this methodology, the relevant studies must be
empirical in nature, generating quantitative findings among comparable concepts, with
similar statistical forms (Lipsey & Wilson, 2001). As described in Chapter 2, the
majority of ERM studies ask respondents to rate the extent of ERM implementation, with
minimal trends apparent. The number of participants in these surveys ranged from 111 to
just over 700, representing a wide variety of industries, summarized in Appendix J. A
meta-analysis of these diverse descriptive statistics had not been conducted to date,
representing an opportunity to use effect sizes to standardize the various measures, in an
effort to analyze this pool of information to determine the relative evolution of ERM.
The second question asks if the usage of ERM component application techniques
improves decision making in risk scenarios. Given the causality implied by this question,
experimental research techniques were appropriate to determine if a treatment, namely
the introduction of ERM concepts, influence an outcome, in this case, risk-response
decision making. Not only does this experiment support causality, it represents an
advancement of ERM research into inferential statistics, a step beyond the descriptive
statistics generated by the surveys previously conducted within the ERM arena, while
also remaining consistent with the general propensity for quantitative methods in this
literature (Creswell, 2009). The greater understanding provided by this research offers a
basis to determine the effectiveness of ERM, thereby potentially providing further
impetus for ERM advocacy, or recommended withdrawal from ERM methodology.

59
Research Context
For the meta-analysis portion of this research, an empirical literature review was
conducted, including studies on the ERM-evolution topic published in peer-reviewed
journals between 2004 and 2011. The ABI INFORM/Global and Business Source
Complete databases were primarily utilized for this purpose, using keywords of “COSO,”
“enterprise risk management,” and “survey.” Studies performed completely external to
the U.S. were excluded from the scope of this analysis. In addition to journal research,
further information was drawn from the associated article resource lists. Surveys from
credible professional organizations were also analyzed, as well as information published
by the ERM Initiative at North Carolina State University. All studies included within the
scope of the meta-analysis provided information that was descriptive-statistics in nature,
asking similar questions about the rate of ERM adoption and its evolution, on various
Likert scales. This selection process is documented in Figure 3.1.
Meanwhile, a liberal arts university in western New York provided the setting for
the experimental study. Based in the Catholic-education tradition, the college is located
just east of Rochester, and offers 32 academic majors, 12 graduate programs, and three
doctoral programs (St. John Fisher College, 2011 July 20a). While 2,700 full-time
undergraduate students attend the college, (St. John Fisher College, 2011 July 20b), for
this study, students from the school of business were the targeted participants. These
individuals likely represented the varied backgrounds and attitudes of those who assume
decision-making roles in a corporate environment, the setting where ERM frameworks
are applied.

60
Display of Meta-Analysis Literature Research Process
Figure 3.1. Process by which studies were identified and selected for the final meta-
analysis.
Research Participants
The meta-analysis included studies performed among business professionals in
primarily corporate and banking environments. These participants represented CEOs,
CFOs, CROs, and those in internal audit roles. Individuals with these titles typically are
strategically involved relative to the installation and usage of an ERM framework
(Moeller, 2007); therefore, the survey participant perspectives regarding ERM adoption
and maturity were suitable for this meta-analysis.
61
As described, the participants for the intervention study were students from a
western New York liberal arts university’s school of business. Leading up to the study,
the researcher visited two classes of MBA students, and one upper-level undergraduate
accounting class. The students were notified they would receive extra credit points by
participating, as well as refreshments the evening of the study. The potential participant
count totaled approximately 90 students. Regardless of the students’ progress in their
relative areas of study, the participants likely knew very little about the ERM topic.
However, prior to the study, the students were asked if they understood ERM jargon via a
questionnaire. Individuals with prior ERM knowledge were included in the study,
allowing for the assessment of non-equivalent groups, as well as providing an additional
covariate for analysis. Other diversities among the population were intentional, as
leaders of all types are asked to evaluate risk and make corresponding decisions in an
organization, both formally and informally.
Upon arrival, participants were assigned to Group 1 or Group 2, control versus
test, respectively, with the researcher and a faculty member handing out alternate
materials to effect this assignment. Each student was provided an envelope of
information, with a jargon questionnaire attached to the envelope, as shown in Appendix
M, along with an informed consent form, pictured in Appendix L. Participants were
instructed to proceed to their respective rooms, depending on their envelope color. A
total of 48 participants were assigned to the two groups in this manner, 21 in Group 1,
and 27 in Group 2.
Upon entering the room, the students were invited to sit at a table, and complete
the informed consent and jargon questionnaire, using a four-point Likert scale to

62
determine the participant’s familiarity with ERM terminology. The informed consent
forms were collected by a facilitator in each room. Once preparations were completed,
the facilitators launched their respective WebEx trainings. The WebEx sessions were
approximately 42 to 45 minutes in length, including 12 to 15 minutes of lecture, and an
additional 30 minutes in which the students performed the exercise. Through a video
recording, the researcher thanked the participants, and instructed them to remove a copy
of the presentation slides from their envelope, shown in Appendices O and P.
Through a PowerPoint presentation delivered via WebEx recording, Group 1
participants were then introduced to the history of ERM, namely the Sarbanes-Oxley Act,
the definition of ERM, the detailed components of the COSO cube, and ERM framework
presence survey results. Group 2, meanwhile, was provided a very brief history of ERM
and the COSO definition, with heat maps then discussed in detail. Methods to identify an
organization’s risk appetite were shown, along with how various risks could be placed on
the map to evaluate whether they were within the company’s appetite, and how risk
responses move the risk’s respective placement on the map. Presentation notes are
detailed in Appendix Q.
Once the lectures were completed, both groups were then shown a photograph of
an owner of a pizza shop. The researcher described how this owner had a budget surplus,
and was facing a variety of risks over the coming year. The participants were told to
remove the remaining materials from their envelope, including a summary of the
assignment, and ten risk scenarios that they could choose to address. These scenarios are
included as Appendix N. Group 2 participants also received a heat map, with the pizza
shop’s risks plotted against the organization’s risk appetite, illustrated in Appendix R.

63
Participants were asked to identify which risks they would mitigate, working
independently, within 30 minutes. A timer on the WebEx began counting down in five-
minute increments. Once completed, the participants were asked to indicate the extent to
which the training materials helped them make their decisions, on a four-point Likert
scale. A space for additional comments was provided as well, shown as Appendix S.
The students were then instructed to place their materials in the envelope, submit it to the
room facilitator, and then exit the room to enjoy some refreshments. The decisions made
by each group were then analyzed in a between-subject comparison to determine if a
statistically-significant difference between the group outcomes exists (Creswell, 2009).
This testing approach is summarized in Appendix K.
Instruments
To conduct the meta-analysis, research findings relative to the adoption and
maturity of ERM frameworks were aggregated, with an effect size determined. As many
of the existing studies report descriptive ERM-implementation statistics, the various
Likert scale results were aligned to provide suitable cross-study comparisons, with
differences in the mean of the dependent variable, namely ERM adoption, calculated
(Creswell, 2009). A second independent variable, the timeframe in which the survey was
conducted, was also analyzed, along with the relationship between these two variables.
Statistical tools within the Excel application were used to assist with the interpretation of
the impact of independent variables.
Meanwhile, as described, an assessment was developed to determine the extent of
ERM knowledge among the intervention-study participants. The students were given a
listing of a variety of terms, 20 in all, related to random business topics, with four terms

64
relating to ERM subject matter. Participants were then asked to rank their familiarity
with these various terms on a four-point Likert scale, ranging from Very Familiar to Not
At All Familiar. Responses thereby allowed the researcher to determine the level of
participant experience with ERM tools and techniques, providing a method to identify
non-equivalent groups, and presenting another covariate analysis opportunity. This
instrument is detailed in Appendix M.
The scenarios used for the intervention study were potential decisions confronting
a fictitious business owner. This owner was entering into a new fiscal year with a
budgetary surplus, but facing a variety of risks with differing likelihoods and potential
impacts. The cost of various corrective measures was indicated for each potential risk.
The budget surplus was insufficient to perform all the risk-mitigation actions, so the
participants chose from the potential actions in an effort to minimize risk. This
instrument, included as Appendix N, was reviewed by various faculty members and
fellow Ed.D. students, as well as business professionals and a former pizza shop owner.
Group 1 members made their decisions based upon their prior knowledge and
interpretation of the scenarios, with minimal influence provided by the training.
As described, however, Group 2 was given an intervention, namely an
introduction to ERM terminology and examples of risk seeking and risk averse behavior.
The risk appetite concept was described, along with the formula used to calculate risk.
Several scenarios were then presented, in an effort to demonstrate how a risk appetite
level is identified. Once the risk appetite is developed, examples of how it could be used
to determine appropriate risk responses were provided. The slides used for the study and
the accompanying intervention lecture notes are included as Appendices O and P.

65
At the conclusion of the intervention, the testing group was provided the same
scenarios as the control group. However, they were also given a heat map, with the
various risks plotted in terms of likelihood and potential impact, aligned against a risk
appetite curve. These participants were instructed to use the heat map to assist in making
their respective combination of decisions. This example heat map is included as
Appendix R. Participants in both groups indicated their choices directly on the scenario
sheets, which were collected at the end of the experiment for scoring purposes. Both
groups were also provided a manipulation validity check, an example of which is
included as Appendix S.
Procedures
Once the research proposal was successfully defended, the respective IRB
applications were submitted. IRB requirements for the meta-analysis were minimal,
enabling this portion of the research to be conducted in quick succession. Meanwhile,
logistics related to the experiment were finalized to ensure readiness when the spring
2012 semester began. The experiment was conducted in March 2012, followed by the
statistical analysis of the results and presentation to the dissertation committee.
Data Analysis
Meta-analysis. In the realm of meta-analysis, a research finding refers to a
statistical depiction of the relationship between the relevant variables, such as a
correlation coefficient within a single research study, or the difference between the means
of a dependent variable for varied conditions within an experiment. Effect size statistics,
meanwhile, represent the direction and/or magnitude of research findings. This statistic
must be computed consistently across studies to allow for effective meta-analysis,

66
coupled with the inverse variance weight to properly align findings from studies
involving varied sample sizes. These factors are then used to calculate the mean and
confidence interval. (Lipsey & Wilson, 2001). For purposes of this study, these statistics
were determined relative to the adoption and maturity of ERM frameworks, with a
moderator analysis also conducted to determine the impact of time periods.
Experiment. As described in Chapter 1, inherent risk is defined by the U.S.
Government’s Office of Management and Budget as the “potential for waste, loss,
unauthorized use, or misappropriation due to the nature of an activity itself” (as cited in
Moeller, 2007). Inherent risk is generally the result of external factors, outside the
control of management. Residual risk, meanwhile, is the risk remaining after mitigating
factors have been installed (Moeller). These risks may be quantified by adapting the
statistical formula for expected value, whereby the expected loss may be calculated as the
product of the risk likelihood and potential impact (Harbaugh, Krause & Vesterlund,
2009).
As the second research question asks if the usage of ERM component application
techniques improves decision making in risk scenarios, a hypothesis was utilized.
Assume the variable IR represents the total inherent risk within the scenarios at the start
of the experiment. This IR is calculated as the sum of the impact x likelihood
calculations among all risk scenarios. Once the participants made their selections, the
residual risk was calculated using the impacts and likelihoods remaining after the
mitigation measures, denoted as RR. The difference between IR and RR (delta-R)
represented the reduction in risk as a result of participant decisions. To perform these
mitigation measures, each participant spent a portion of the fictitious business owner’s

67
budget surplus. Delta-R was then divided by the dollars spent by that participant, to
determine the delta-R per dollar. These delta-R per dollar calculations were then
aggregated within each group to determine the mean delta-R per dollar, or DRPD. Once
the experiment was conducted, the respective DRPDs were calculated, using the scoring
methods in Appendices T and U. These results were then assessed to determine if the
testing group showed a higher DRPD than the control group, through the use of a t-test.
Among these parametric statistics, significant shifts in outcomes support the notion that
risk management tools, namely heat maps, positively influence risk-reduction decisions.
Methodology Summary
As described in Chapter 2, quantitative studies dominate the ERM literature, with
these experiments no exception. However, the methods described within this research
had not been utilized within the ERM arena to date. The growing body of descriptive
statistics relative to the presence of ERM presented an opportunity to summarize the
results among somewhat diverse populations utilizing meta-analysis methods.
Meanwhile, the developing, but still immature, literature related to ERM showed minimal
information relative to the effectiveness of the theory in assisting organizations in
reducing risk. To understand the ability of ERM tools and applications to change a
default decision, an intervention study was used to test causality via the impact of a
treatment (Creswell, 2009). As a result, these research findings encourage greater
advocacy of ERM applications, potentially influencing the direction of the ERM industry
evolution.

68
Chapter 4: Results
As described in Chapters 1 through 3, the current state of the ERM literature
reveals varied levels of framework presence; as a result, the current level of ERM
adoption is not clearly understood. Moreover, existing studies provide minimal proof of
ERM effectiveness, with research that depicts the causal effects of ERM on appropriate
outcome variables yet to be conducted. This chapter presents the results of research
conducted within both of these areas, in relation to specific research questions. To
examine the level of ERM framework presence in organizations, a meta-analysis of
existing studies was conducted. Further research included the execution of an
experiment, whereby the impact of ERM tools on decision making was assessed. The
respective analyses are outlined below.
Research Question 1
The first question asks to what extent have ERM frameworks been implemented
in organizations. Numerous surveys have been conducted that measure rates of ERM
implementation over the last several years; meta-analysis was used to synthesize these
findings. To be included in the meta-analysis, the surveys must have been conducted
after the COSO ERM framework was issued in 2004, and were required to ask some form
of a framework presence and maturity question, with participants from U.S.-based
organizations. The eleven studies included in the meta-analysis are indicated by an
asterisk in the Reference list. The populations surveyed generally represented for-profit
entities, to which ERM practices have particular relevance.

69
In each study, respondents were asked to rate the level of ERM framework
adoption, with typical responses of “complete formal enterprise-wide risk management
process in place,” to “no enterprise-wide management process,” through the use of
various Likert scales (Beasley, Branson & Hancock, 2010c, p. 11). For purposes of this
meta-analysis, the effect size statistic was defined to be the sample percentage reporting
full or partial adoption. A fixed effects of proportions meta-analysis was conducted, to
describe the present sample of studies as an estimate of the overall population effect. The
sample sizes varied across the studies, from 111, to over 1,400, as presented in Table 4.1.
Table 4.1
Percentage of Organizations Employing Full or Partial Frameworks
Author Year n
Full/Partial
Installation
Beasley, Clune & Hermanson 2005 123 50%
Hida & Goodspeed 2005 162 25%
Deloitte & Touche, LLP 2007 130 67%
Aon Corporation 2009 551 76%
Beasley, Branson & Hancock 2009 701 31%
Deloitte Touche Tomatsu 2009 111 59%
Beasley, Branson & Hancock 2010c 331 33%
Beasley, Branson & Hancock 2010a 460 21%
Hatch & Jutras 2010 213 49%
Deloitte Global Services Limited 2011 131 79%
Rims & Advisen, Ltd 2011 1,431 54%

70
The various effect sizes were then aggregated by the inverse variance weight, to
determine the mean effect size across all the studies. The weighted mean effect size
among the eleven surveys was calculated to be 47.4% (SD=20.1%), indicating that less
than half of the organizations participating reported a full or partial ERM framework.
This analysis is illustrated by a forest plot, shown as Figure 4.1.
Meta-Analysis Forest Plot
Figure 4.1. Forest plot illustrating the presence of full or partial ERM frameworks
defined by each study included in the meta-analysis. The studies are sorted by
publication date. The size of the squares indicates the relative weight given to each study
0 0.2 0.4 0.6 0.8 1Percent of respondents reporting partial or full adoption

71
in the analysis. The cumulative effect size as studies progress is indicated by the circles,
with the final result being 47.4% when all studies were included, as indicated by the
diamond.
A moderator analysis was then conducted to determine if the adoption rates were
affected by the time period during which the study was conducted, with the population
stratified into time periods of 2005 through 2007, the years following COSO framework
publication, and 2009 through 2011, after the economic downturn. The relative means
and standard deviations are provided in Table 4.2.
Table 4.2
Summary of Moderator Analysis
2005 - 2007
(n = 3)
2009 - 2011 (n = 8)
Mean 44.03% 47.75%
SD 21.12% 21.10%
The mean effect size for the studies performed from 2005 through 2007 was 44%,
compared with studies from 2009 through 2011, with a mean of 48%, with SDs relatively
consistent over the two groups. A Cohen’s d calculated at 0.18 indicates minimal ERM
framework application differences between these time periods. Therefore, as an answer
to Question 1, which asks to what extent ERM frameworks have been implemented
across organizations, less than half of those surveyed, 47.4%, report employing a full or
partial ERM framework, with limited growth reported in recent years.

72
Research Question 2
Experiment procedures. The second research question then asks, once installed,
does the use of ERM component application techniques improve risk decision making?
More specifically, would the heat-map presentation of a risk scenario result in a better
decision than would otherwise be made in the absence of such tools? To determine the
potential influence of an ERM heat mapping tool, and the corresponding causality related
to improved decision making, an experiment was conducted, using two groups of
participants. To test this hypothesis, the participants were alternately assigned to either
the control group, who received training on basic ERM concepts, or the testing group,
who was trained on heat mapping techniques.
Data analysis. Upon entering the study, participants were asked to complete a
jargon questionnaire, in an effort to test for the possibility of non-equivalent control and
treatment groups, and also assess the relative baseline understanding of ERM
terminology. Each group was then provided their respective training, either on ERM
general concepts (control group) or more specific heat-mapping techniques (treatment
group). All participants were then asked to, from the perspective of a small business
owner, determine how they would respond to a variety of risk scenarios.
All participants began the experiment with the same level of risk inherent in the
small business owner scenario. The variable IR represents this total inherent risk,
calculated as the sum of the impact x likelihood calculations among all risk scenarios, as
depicted in Appendix T. Once the participants made their selections, the residual risk
was calculated using the impacts and likelihoods remaining after the mitigation measures,
denoted as RR. These RR levels are shown in Appendix U. The difference between IR

73
and RR (delta-R) thereby represents the reduction in risk as a result of participant
decisions.
To perform these mitigation measures, each participant spent a portion of the
fictitious business owner’s budget surplus. Delta-R was then divided by the dollars spent
by that participant, to determine the delta-R per dollar. The delta-R per dollar
calculations were then aggregated within the control and testing groups to determine the
mean delta-R per dollar, or DRPD within each group. If the hypothesis were to hold true,
the DRPD for the testing group would be significantly greater than the DRPD for the
control group, due to the heat mapping training provided.
Once the experiment was conducted, based on the participant decisions, the
residual risk score was calculated, using the scoring methodology outlined in Appendix
U. The difference between the residual risk and the inherent risk score was then
calculated (delta-R, or DR), and divided by the dollars utilized, to determine the risk
reduction per dollar spent (DRPD). The researcher summary of the scenario decisions,
the resulting DRPD calculation, as well as the participant jargon questionnaire results, is
shown in Appendix V. These results were then aggregated to calculate the mean DRPD
for both Group 1 and Group 2, and subsequently compared, to determine if the resulting
decisions presented a statistical difference between the two groups, with results shown in
see Table 4.3.
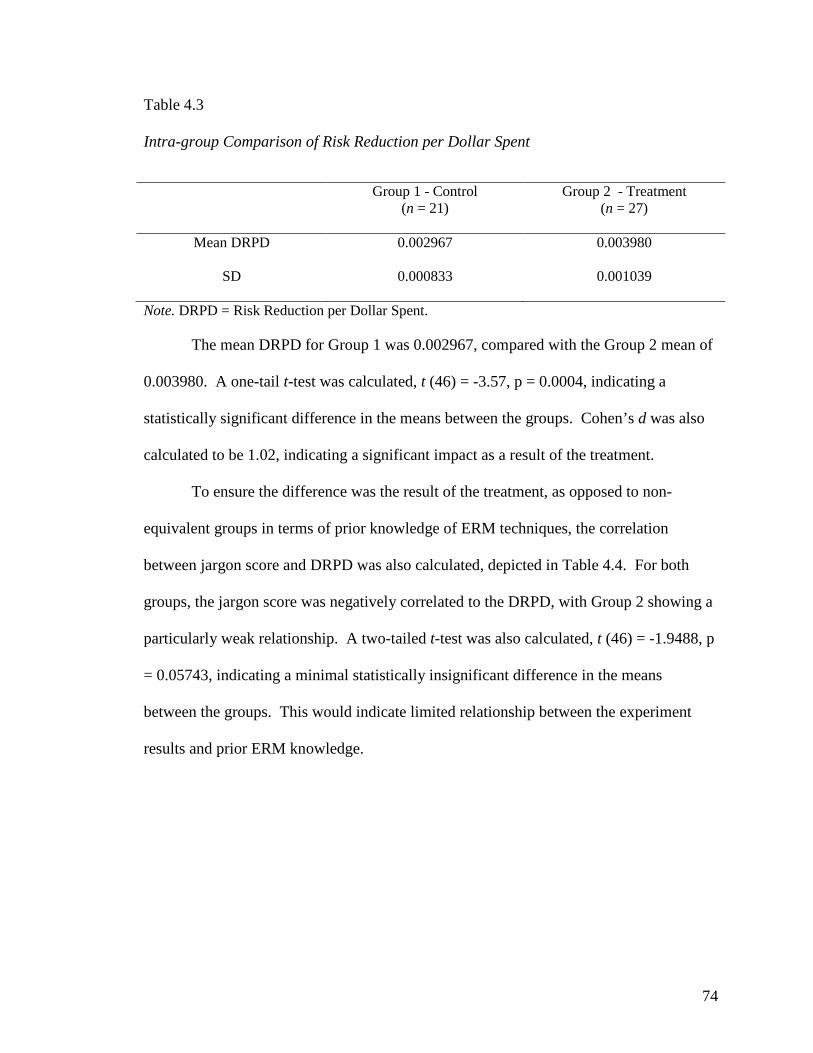
74
Table 4.3
Intra-group Comparison of Risk Reduction per Dollar Spent
Group 1 - Control
(n = 21)
Group 2 - Treatment (n = 27)
Mean DRPD 0.002967 0.003980
SD 0.000833 0.001039
Note. DRPD = Risk Reduction per Dollar Spent.
The mean DRPD for Group 1 was 0.002967, compared with the Group 2 mean of
0.003980. A one-tail t-test was calculated, t (46) = -3.57, p = 0.0004, indicating a
statistically significant difference in the means between the groups. Cohen’s d was also
calculated to be 1.02, indicating a significant impact as a result of the treatment.
To ensure the difference was the result of the treatment, as opposed to non-
equivalent groups in terms of prior knowledge of ERM techniques, the correlation
between jargon score and DRPD was also calculated, depicted in Table 4.4. For both
groups, the jargon score was negatively correlated to the DRPD, with Group 2 showing a
particularly weak relationship. A two-tailed t-test was also calculated, t (46) = -1.9488, p
= 0.05743, indicating a minimal statistically insignificant difference in the means
between the groups. This would indicate limited relationship between the experiment
results and prior ERM knowledge.

75
Table 4.4
Intra-group Comparison of Jargon Scores and Correlation to DRPD
Group 1 - Control
(n = 21)
Group 2 - Treatment (n = 27)
Mean Jargon Score 6.5238 7.7037
Correlation with DRPD -0.2775 -0.0426
Conclusion. In relation to the second research question, experimental procedures
and resulting statistics indicate the training and use of heat mapping techniques positively
impact risk-scenario decision making. This dynamic, supported by this hypothesis test,
may provide greater impetus for the usage of ERM frameworks, a causality that had yet
to be discussed in the literature. Implications of these findings in the broader business
context will be provided in greater detail in Chapter 5.

76
Chapter 5: Discussion
Introduction
As described in Chapter 1, increased media and regulatory focus has been
directed towards corporate scandals and overly risky decisions in the last decade. As a
result, the ERM discipline has evolved, with increased motivations to apply frameworks
to business enterprises (Bugalla, Fox, Hackett & McGuinness, 2011). However, to date,
varied levels of ERM framework adoption have been indicated throughout the literature,
with organizations continuing to struggle understanding the framework and its
application (Beasley, Branson & Hancock, 2010a). Possibly contributing to
implementation deficiencies is a relative lack of empirical tests to demonstrate ERM
effectiveness, leading to questions about the benefits of a program (Beasley, Branson &
Hancock, 2010c). This dissertation research discerned the aggregate level of ERM
adoption, through meta-analysis techniques. In addition, an experiment was conducted to
determine the effectiveness of ERM tools, namely heat mapping techniques, which
suggested that brief training in this methodology would improve decision making in risk
scenarios, potentially providing greater impetus for ERM advocacy. In Chapter 5,
implications of this research in the broader business community will be discussed, along
with methodological limitations and recommendations for further research.
Implications of Findings
ERM adoption. Since the COSO framework was deployed in 2004, a variety of
empirical studies have been published in this realm, with survey techniques utilized to

77
determine the extent of ERM framework application among the business community.
Once the framework was introduced as a means of aligning with SOx 404, companies
began installing frameworks in relatively short order, with a 2005 study revealing 50% of
respondents with a full or partial framework installed (Beasley, Clune & Hermanson,
2005). As time has passed, increased urgings have occurred from the regulatory
standpoint, with the Securities and Exchange Commission and New York Stock
Exchange requiring board oversight of risks across the enterprise, and disclosure of these
methods in the organizational financial statements. Credit rating agencies, meanwhile,
have also increased requirements surrounding enterprise risk programs. However,
despite the passing of time and these various prompting efforts, the meta-analysis
indicated an aggregate level of adoption to be slightly below 50%, a seemingly low level
of implementation when the external regulatory and credit-issuing pressures are
understood.
Therefore, despite a recent survey that indicates much higher levels of ERM
framework application at 79%, (Deloitte, 2011), and the opinion that the benefits of a
program outweigh the costs (Deloitte & Touche LLP, 2007; Deloitte Touche Tomatsu,
2009), as a whole, organizations continue to elect to forego the ERM discipline, possibly
due to the complicated nature of the framework (Beasley, Branson & Hancock, 2010a).
Rather, entities may have appeared to elect other means of risk oversight in an effort to
satisfy regulatory and credit-agency requests. As described by Beasley, Branson and
Hancock, (2010c), over 60% of survey respondents indicated that “risks are monitored in
other ways besides ERM” (p. 13). Therefore, it is possible that the majority of

78
organizations that do not cite a moderate or mature level of ERM adoption are likely to
employ a variety of alternate techniques, or possibly rely on intuitive measures.
To assist organizations with these efforts, a host of governance, risk, and
compliance (GRC) applications have been introduced into the marketplace. These
systems enable an organization to oversee risks across the enterprise, through the
identification and assessment of risks, aggregation of volumes of data, assignment of risk
owners, and continual monitoring of risk-mitigation activities. During 2008, the total
market for GRC software was estimated at $52 billion, with exponential growth likely
due to increased regulations. While GRC systems offer powerful tools to assist with
compliance, and in fact, were reported to have alerted Goldman Sachs to the pending
housing downturn, enabling the organization to proactively divest from mortgage-backed
securities, these applications also create the risk of leadership over-reliance (Bamberger,
2010). RIMS (2009) warns that these financial models, built by Ph.D.s using historical
market behaviors, led to inordinate assumptions of risk in an effort to gain profits, which
ultimately resulted in billion-dollar write downs. Rather, RIMS (2009) stresses that
merely implementing a framework is not enough; ERM behaviors must be exhibited at all
levels of an organization to be effective.
ERM effectiveness. Beyond the mere presence of a framework, an experimental
effort to demonstrate ERM technique effectiveness was performed. Given a brief
training on heat mapping methods, a group of business students showed improvement in
decision making when compared with untrained peers. When asked to describe how they
made their scenario decisions, the control group generally recounted a reliance on their
intuition, with “gut feeling” reported by a particular participant (McBride, 2012). While

79
organizations cite the fact that COSO is complicated (Beasley, Branson & Hancock,
2010a), the heat mapping methodology can provide greater insight to inform strategic
decisions. This was demonstrated, as a brief training in heat mapping improved risk-
reduction decision making by as much as one-third, with mean risk reduction increasing
from 0.30 to 0.40 basis points between the groups. While this improvement cannot be
used to predict dollars saved or revenue gained, success, or lack thereof, is often the
result of a variety of decisions and opportunities, continual layers that determine ultimate
outcomes (Gladwell, 2008).
Cumulative Prospect Theory consistently demonstrates irrational decision making
under risk and uncertainty (Tversky & Kahneman, 1992; see also Harbaugh, Krause, and
Vesterlund , 2010). Over half of small businesses fail within the first four years of
existence, with over 30% failing after two years (Knaup, 2005). If ERM tools could help
a business owner make slightly better decisions, working strategically to understand their
risk appetite versus only using their gut to make decisions, greater longevity may result,
particularly given the irrational decisions typically made under Prospect Theory. Heat
mapping is not the only technique that may be considered; additional ERM techniques
could also be employed, such as the development of a risk taxonomy and risk appetite
statement, formal methods to solicit feedback regarding potential events, or other
quantitative approaches, such as Value at Risk calculations or sensitivity analysis.
Similarly, in large organizations, the economic crisis has been called a failure of
risk management (RIMS, 2009). A prior study reported higher levels of ERM maturity
employed by best-in-class organizations, in terms of financial performance, when
compared with the larger corporate population, but this correlation analysis did not

80
establish causation (Hatch & Jutras, 2010). A previous empirical study was conducted to
determine the impact of ERM on firm performance, with a hypothesis that bottom-line
improvement is dependent upon a harmony between an ERM program and factors
specific to the firm, namely environmental uncertainty, industry competition, firm
complexity, firm size, and board monitoring. Study findings confirmed the researchers’
theory that the ERM/firm performance relationship is predicated on these firm-specific
variables (Gordon, Loeb & Tseng, 2009), but the study does not directly address whether
the use of ERM impacts the decisions that led to that performance, but rather the other
factors involved. Basic tools such as heat mapping, along with periodic identification of
risks and implication discussions, might assist an organization in recognizing potential
black swan events (Taleb, 2007), in addition to informing incremental decisions that may
not only protect, but also enhance the bottom line.
Limitations
The current meta-analysis presents limitations based on the relatively small
number of studies included. While several of the incorporated studies were from non-
peer reviewed sources, many additional studies may have been conducted, with the
results unpublished. This publication bias, with directionality not understood, may have
therefore influenced the meta-analysis results. Furthermore, the studies included in the
meta-analysis, in some cases, focused on certain facets of the population, within specific
industries, for example, or members in a professional organization. These particular
participants may show a higher level of ERM adoption, as financial and insurance
organizations historically showed greater risk management focus (Buehler, Freeman &

81
Hulme, 2008; Outreville, 1998). However, industry as a moderating variable was not
assessed.
Within the experiment, college students were used as a proxy for small business
owners, whereby their likely limited experience regarding entrepreneurial decision-
making may have impacted scenario outcomes. Moreover, the research was conducted in
an academic setting, with all the relevant details provided. Responses may have differed
if emotions, along with the additional stress and uncertainty a small business owner
experiences, were introduced. In addition, for purposes of this experiment, the decisions
were made in isolation, which may be unlike the group decision-making environment at
many organizations. Therefore, despite the internal validity strengths of this experiment,
ecological validity may be lacking, providing greater questions surrounding the
alignment with behavioral economics dynamics.
Recommendations
To further evolve the ERM literature, scholarly research should be applied to the
additional methods of risk oversight that organizations have employed. As shown by the
forest plot in Figure 4.1, the aggregate level of framework adoption has not increased
since 2009. Therefore, rather than duplicating the past surveys, greater insight into the
majority of organizations that have yet to adopt ERM should be developed, along with
assessment of the efficacy of these techniques and the steps required for implementation.
To test this more fully, a longitudinal study of the success of similar firms, whereby one
group indicates their use of ERM techniques in the notes to their financial statements,
versus a second group who does not describe ERM, but may rather use intuition to guide
decisions, would provide further insight into these critical decision points. To further

82
analyze these dynamics, a formal cost versus benefit calculation of ERM should be
assessed, and compared against alternate risk assessment techniques, possibly providing
further rationale for ERM framework implementation.
To assist with this effort, COSO should publish information, similar to this
research, demonstrating that the cube concepts are not as complicated as they originally
appear. Several white papers have been published in this regard, with frequency of usage
unclear, depicting the application of tools and techniques. However, minimal literature
has shown the effectiveness of ERM techniques in improving decisions. Further analysis
should be conducted regarding the usefulness of the variety of ERM tools, with an
assessment of the effectiveness of these concepts in translating the COSO theory into
practice, in an effort to increase the approachability and friendliness of the concepts.
Meanwhile, ERM techniques should be introduced into academic settings, such as
accounting, finance, and MBA programs, as these graduates would likely be called upon
to make decisions in cases of risk and uncertainty in the future.
Conclusion
The purpose of this research is to advance the field of ERM, by aggregating
previous study findings and proving the effectiveness of ERM techniques. This
dissertation effectively clarified the level of ERM framework adoption, by removing
information that clouded the overall outcomes. Moreover, experimental methods
demonstrated that the use of ERM techniques, one as simple as heat mapping, effectively
improved decision making in risk contexts. This factor alone could provide greater
impetus for ERM adoption, a potentially critical protection against the next economic
downturn.

83
References
References marked with an asterisk indicate studies included in the meta-analysis.
Aon Corporation (2007). Global risk management survey ‘07. Retrieved from Aon website: http://secure.eloqua.com/web/AON/GRMS07_Executive_Summary_1.pdf.
* Aon Corporation (2009). Global risk management survey ‘09. Retrieved from Aon website: http://img.en25.com/Web/AON/GlobalRiskManagementSurvey2009.pdf.
Aon Corporation (2010). Global risk management survey ‘10. Retrieved from Aon website: http://www.aon.com/attachments/2010_Global_ERM_Survey.pdf.
Aon Corporation (n.d.). [Corporate Web site]. Retrieved from http://www.aon.com/about-aon/company-overview.jsp.
Ballou, B., & Heitger, D.L. (2005, Winter). A building-block approach for implementing COSO’s enterprise risk management – Integrated framework. Management Accounting Quarterly 6(2), 1-10.
Bamberger, K.A. (2010, March). Technologies of compliance: Risk and regulation in a digital age. Texas Law Review 88(4), 669-739.
Banham, R. (2004, June). Enterprising views of risk management. Journal of Accountancy 197(6), 65.
Barrier, M. (2003, December). One right path. The Internal Auditor 60(6), 52-57.
Barton, T.L., Shenkir, W.G. & Walker, P.L. (2008, December). Managing the unthinkable event. Financial Executive, 24(10), pg. 24-29.
* Beasley, M.S., Branson, B.C., & Hancock, B.V. (2009). Report on the current state of enterprise risk oversight. Retrieved from North Carolina State University website: http://poole.ncsu.edu/erm/documents/AICPAResearchStudy32309.pdf.
* Beasley, M.S., Branson, B.C., & Hancock, B.V. (2010a). COSO’s 2010 report on ERM. Retrieved from COSO website: http://www.coso.org/documents/ COSOSurveyReportFULL-Web-R6FINALforWEBPOSTING111710.pdf.
Beasley, M.S., Branson, B.C., & Hancock, B.V. (2010b). Enterprise risk oversight: A global analysis. Retrieved from American Institute of CPAs website: http://www.aicpa.org/ InterestAreas/BusinessIndustryAndGovernment/ Resources/ERM/DownloadableDocuments/Enterprise%20Risk%20v3.pdf.

84
* Beasley, M.S., Branson, B.C., & Hancock, B.V. (2010c). Report on the current state of enterprise risk oversight: 2nd edition. Retrieved from North Carolina State University website: http://poole.ncsu.edu/d/erm/weblogs/summaries/2008/state-erm-2nd-2010.pdf.
* Beasley, M.S., Clune, R. & Hermanson, D.R. (2005, November/December). Enterprise risk management: An empirical analysis of factors associated with the extent of implementation. Journal of Accounting and Public Policy 24(6), 521-531.
Beasley, M.S., & Frigo, M.L. (2010). ERM and its role in strategic planning and strategy execution. In J. Fraser & B. Simkins (Eds.), Enterprise risk management: Today’s leading research and best practices for tomorrow’s executives (pp. 31-50). Hoboken, NJ: John Wiley & Sons, Inc.
Bernstein, P.L. (1995, January/February). Risk as a history of ideas. Financial Analysts Journal 51(1), 7-12.
Bishop, T.J.F. & Hydoski, F.E. (2009, October). Mapping your fraud risks. Harvard Business Review, p. 76.
Bodenheimer, T. (1999, February 11). The movement for improved quality in health care. New England Journal of Medicine 340(6), 488-492.
Brancato, C.K., Tonello, M., Hexter, E. & Newman, K.R. (2006). The role of U.S. corporate boards in enterprise risk management. Retrieved from The Conference Board website: http://www.conference-board.org/publications/ publicationdetail.cfm?publicationid=1190.
Bromiley, P. (2010, August 17). Looking at prospect theory. Strategic Management Journal, 31(1), 1357-1370. doi:10.1002/smj.885.
Buehler, K., Freeman, A. & Hulme, R. (2008, September). The new arsenal of risk management. Harvard Business Review 86(9), 92-100.
Bugalla, J., Fox, C.A., Hackett, J. & McGuinness, K. (2011, February 13). How a new SEC rule changed the way companies look at risk management. Retrieved from The National Law Review website: http://www.natlawreview.com/article/how-new-sec-rule-changed-way-companies-look-risk-management.
Creswell, J.W. (2009). Research design: Qualitative, quantitative, and mixed methods approaches. Thousand Oaks, CA: SAGE Publications, Inc.
Committee of Sponsoring Organizations of the Treadway Commission (2004a). Application Techniques. Jersey City, NJ: Committee of Sponsoring Organizations of the Treadway Commission.

85
Committee of Sponsoring Organizations of the Treadway Commission (2004b). Enterprise risk management - Integrated framework. Retrieved from http://www.coso.org/documents/COSO_ERM_ExecutiveSummary.pdf.
* Deloitte Global Services Limited (2011). Global risk management survey, seventh edition: Navigating in a changed world. Retrieved from Deloitte & Touche website: http://www.deloitte.com/assets/Dcom-UnitedStates/Local%20Assets/Documents/ us_fsi_grms_031711.pdf.
* Deloitte & Touche, LLP (2007). Global risk management survey: Fifth edition. Retrieved from Deloitte & Touche website: http://www.deloitte.com/assets/Dcom-Albania/Local% 20Assets/Documents/ al_fsi_global_risk_mgmt_survey2007.pdf.
* Deloitte Touche Tomatsu (2009). Global risk management survey: Sixth edition. Retrieved from Deloitte & Touche website: http://www.deloitte.com/assets/Dcom-UnitedStates/Local% 20Assets/Documents/us_fsi_GlobalRskMgmtSrvy_June09.pdf.
Driscoll, M. (2011, June 16). ERM: What is best practice now? Business Finance Magazine. Retrieved from http://www.businessfinancemag.com.
Farrell, J. (2004, August). Internal controls and managing enterprise-wide risks. The CPA Journal, 74(8), 11-12.
Felo, A.J., & Solieri, S.A. (2003, February). New laws, new challenges: Implications of Sarbanes-Oxley. Strategic Finance, 84(8), 31-34.
Fraser, J., Schoening-Thiessen, K. & Simkins, B. (2008, Spring/Summer). Who reads what most often? A survey of enterprise risk management literature read by risk executives. Journal of Applied Finance, 18(1), 73-91.
Gladwell, M. (2008). Outliers: The story of success. New York, NY: Little, Brown and Company.
Gordon, L.A., Loeb, M.P. & Tseng, C-Y. (2009, July/August). Enterprise risk management and firm performance: A contingency perspective. Journal of Accounting and Public Policy, 28(4) 301-327. Doi:10.1016/j.jaccpubpol.2009.06.006.
Hampton, J. (2009). Fundamentals of enterprise risk management. New York, NY: AMACOM, a division of American Management Association.
Harbaugh, W.T., Krause, K., & Vesterlund, L. (2010, June). The fourfold pattern of risk attitudes in choice and pricing tasks. The Economic Journal 120(545), 595-611.
* Hatch, D. & Jutras, C. (2010). The executive enterprise risk management (ERM) agenda. Unpublished manuscript, Aberdeen Group, Inc.

86
Hexter, E.S. & Gates, S. (2005, June). From risk management to risk strategy. Retrieved from The Conference Board website: http://www.conference-board.org/publications/ publicationdetail.cfm?publicationid=997.
Hexter, E.S. & Vainberg, G. (2011, January). Risk oversight practices: Two success stories. The Conference Board, 3(2).
* Hida II, E.T. & Goodspeed, I. (2005, April). Deloitte’s fourth bi-annual global risk management survey says. South African Financial Markets Journal, 1(1). Retrieved from http://www.financialmarketsjournal.co.za/1stedition/printedarticles/ printgrmsurvey.htm.
International Organization for Standardization (2009). Risk management – Principles and guidelines. Retrieved from http://www.iso.org/iso/catalogue_detail.htm? csnumber=43170.
Jablonowski, M. (2007). The real value of ERM. Risk Management Magazine, pg. 16-21.
Knaup, A. E. (2005, May). Survival and longevity in the Business and Employment Dynamics data. Monthly Labor Review, 128(5), 50-56.
KPMG International (2007). The evolution of risk and controls. Retrieved from KPMG’s website: http://www.kpmg.com/GR/en/IssuesAndInsights/ArticlesPublications/ ERM/Pages/The-evolution-of-risk-and-controls.aspx.
Lam, J. (2003). Enterprise risk management: From incentives to controls. Hoboken, NJ: John Wiley & Sons, Inc.
Lam, J. (2009, May). Key requirements for enterprise-wide risk management: Lessons learned from the global financial crisis. The RMA Journal, 91(8), 22-27.
Laster, J.T. & Haas, S.M. (2006, December). Delaware Supreme Court adopts the Caremark standard while holding that good faith is not an independent fiduciary duty. Insights; the Corporate & Securities Law Advisor, 20(12), 2-5.
Liebenberg, A.P. & Hoyt, R.E. (2003, Spring). The determinants of enterprise risk management: Evidence from the appointment of chief risk officers. Risk Management and Insurance Review, 6(1), 37-52.
Lipsey, M.W. & Wilson, D.B. (2001). Practical meta-analysis. Thousand Oaks, CA: SAGE Publications, Inc.
McBride, E.P. (2012). [Experiment results]. Unpublished raw data.
McClean, C. (2010). ISO 31000 – The new, streamlined risk management standard. Retrieved from Forrester Research, Inc. website: http://www.forrester.com/rb/ Research/iso_31000_%26%238212%3B_new%2C_streamlined_risk_management/q/id/56027/t/2.

87
McElveen, M. (2002, December). New rules, new challenges. The Internal Auditor, 59(6), 40-47.
Mikes, A. (2009, March). Risk management and calculative cultures. Management Accounting Research, 20(1), 18-40.
Mitchell, D. (2010). The big bang. Financial Planning, 40(8), 41.
Moeller, R.R. (2007). COSO enterprise risk management: Understanding the new integrated ERM framework. Hoboken, NJ: John Wiley & Sons, Inc.
Mollenkamp, C., Ng, S., Plevin, L. & Smith, R. (2008, November 3). Behind AIG’s fall; Risk models failed to pass real-world test. The Wall Street Journal. p. A.1.
Mullainathan, S. & Thaler, R.H. (2001). Behavioral economics. International Encyclopedia of the Social and Behavioral Sciences, 1094-1100. doi:10.1016/B0-08-043076-7/02247-6.
Outreville, J.F. (1998). Theory and practice of insurance. Norwell, MA: Kluwer Academic Publishers.
Pagach, D. & Warr, R. (2011, March). The characteristics of firms that hire chief risk officers. Journal of Risk and Insurance, 78(1), 185-211.
Plous, S. (1993). The psychology of judgment and decision making. New York, NY: McGraw-Hill Inc.
Pratt, N. (2007, September). Risk management: CROs on the rise. The Banker, pg. 1.
Protiviti (2010). Board risk oversight: A progress report. Retrieved from Protiviti website: http://www.protiviti.com/en-US/Insights/Browse-by-Content/Current-Challenges/ Documents/Board-Risk-Oversight-Survey-COSO-Protiviti.pdf.
Randall, R. (2003, July). The fall of Arthur Andersen. Strategic Finance, 85(1), 21-23.
Reinstein, A. & Weirich, T.R. (2002, December). Accounting issues at Enron. The CPA Journal, 72(12). 20-25.
Risk and Insurance Management Society (RIMS) (2009). RIMS executive report – The 2008 financial crisis: A wake-up call for enterprise risk management . Retrieved from RIMS website:http://community.rims.org/RIMS/RIMS/Community/Resources/ ViewDocument/ Default.aspx?DocumentKey=6742a2ba-1b1d-446e-85c3-b0c8880f42fb.
Risk and Insurance Management Society (RIMS) (2011). RIMS executive report – An overview of widely used risk management standards and guidelines. Retrieved from RIMS website: http://www.rims.org/resources/ERM/Documents/ RIMS%20Executive%20Report%20on%20Widely%20Used%20Standards%20and%20 Guidelines%20March%202010.pdf.

88
* Risk and Insurance Management Society (RIMS) & Advisen Ltd (2011). 2011 enterprise risk management survey. Retrieved from RIMS website: http://www.rims.org/Sales/Documents/RIMS%202011%20ERM%20Benchmark%20Survey%20final.pdf.
Sarbanes-Oxley Act of 2002, 15 U.S.C. § 7201 et seq. (Office of the Law Revision Counsel of the U.S. House of Representatives 2006).
St. John Fisher College (2011 July 20a). About St. John Fisher College. Retrieved from St. John Fisher College website: http://www.sjfc.edu/about/index.dot.
St. John Fisher College (2011 July 20b). Fast facts about Fisher. Retrieved from St. John Fisher College website: http://www.sjfc.edu/admissions/freshman/about/.
Taleb, N. (2007). The black swan. New York, NY: Random House.
Thaler, R.H., Tversky, A., Kahneman, D. & Schwartz, A. (1997). The effect of myopia and loss aversion on risk taking: An experimental test. The Quarterly Journal of Economics, 112(2). 647-661.
Tversky, A. & Kahneman, D. (1979). Prospect theory: An analysis of decision under risk. Econometrica, 47(2), 263-291.
Tversky, A. & Kahneman, D. (1992, October). Advances in prospect theory: Cumulative representation of uncertainty. Journal of Risk and Uncertainty, 5(4), 297-323.
WellCare Health Plans, Inc. (2010, July 7). WellCare Cleared by Court to Pursue Former Executives. Retrieved from WellCare website: http://ir.wellcare.com/ phoenix.zhtml?c=176521&p=irol-newsArticle&ID=1445327&highlight=.
Wilkinson, N. (2008). Decision-making under risk and uncertainty. In An Introduction to Behavioral Economics. New York, NY: Palgrave Macmillan.

89
Appendix A
The COSO cube depicts the relationship between ERM components, corporate
objectives, and the organizational level at which these principles are applied.
From Enterprise Risk Management – Integrated Framework, Executive Summary, 2004.

90
Appendix B
Within the Risk Assessment component, organizations should consider the
likelihood of various risks occurring, and the potential impact to the organization,
compared against the entity’s risk appetite.
Adapted from A Building-Block Approach for Implementing COSO’s Enterprise Risk
Management – Integrated Framework, 2005.
Low
Low
Medium
Med
ium
High
High
Impa
ct
Likelihood
Risk 1
Risk 2
Risk 3
Risk 4

91
Appendix C
The Risk Response component recommends an organization react to each risk
assessed through a variety of means, mitigating inherent risk to a reduced residual risk
level.
Adapted from A Building-Block Approach for Implementing COSO’s Enterprise Risk
Management – Integrated Framework, 2005.
Low
Low
Medium
Med
ium
High
High
Impa
ct
Likelihood
Risk 1
Risk 2
Risk 3
Risk 4
(Accept)
(Reduce)
(Share)
(Avoid)

92
Appendix D
An example of an effective risk structure, aligned against an organization’s
business model with clear ownership, may include the following categories:
Risk Category/Sub-Category Description
Production Creation of goods or services sold or distributed
Design Risk Efforts to develop the right product for a market
Process Risk Overseeing processes to efficiently create products
Marketing Efforts to reach customers or to develop markets
Needs Risk Understanding what potential customers will buy
Volume Risk Selling enough units to meet required return
Pricing Risk Obtaining a price to cover variable and fixed costs
Finance Managing cash flows, creating needed return
Credit Risk Obtaining the value expected from transactions
Portfolio Risk Managing liquid and illiquid assets to earn a return
Technology Changing technologies and their impact
Business Support Risk Using technology in daily production and marketing
Communications Risk Linking operating units, vendors, and customers
Administration Processing efficiency, performance, and structure
Performance Risk Meeting leadership and behavioral goals
Structure Risk Pursuing optimal hierarchical relationships
Business Unit Managing functional risk within an operating unit
Key Initiatives Managing projects that are extremely critical
From Fundamentals of Enterprise Risk Management, 2009.

93
Appendix E
ISO developed a new framework displaying the relationship between risk
management principles and risk processes.
From Risk Management – Principles and Guidelines, 2009.

94
Appendix F
Tversky and Kahneman demonstrated Prospect Theory through decision making
scenarios, both positive and negative prospects.
Preferences Between Positive and Negative Prospects
Positive prospects Negative prospects
Problem 3: (4,000, 0.80) < (3,000) Problem 3’: (-4,000, 0.80) > (-3,000)
N = 95 [20] [80]* N = 95 [92]* [8]
Adapted from Prospect Theory: An Analysis of Decision Under Risk

95
Appendix G
The Tversky and Kahneman scenario 3’ could be presented on a heat map.
Low
Low
Medium
Med
ium
High
High
Impa
ct
Likelihood
(-4,000, 0.8)
(-3,000)

96
Appendix H
The fourfold risk pattern under CPT predicts that when faced with a risky decision,
people will be:
• Risk-seeking over low-probability gains,
• Risk-averse over high-probability gains,
• Risk-averse over low-probability losses, and
• Risk-seeking over high-probability losses.
From Advances in prospect theory: Cumulative representation of uncertainty, 1992.

97
Appendix I
The Global Risk Management Survey responses may be compared over the last
several editions, as the same questions have been asked repeatedly.
Topic 4th Edition
2004
5th Edition
2006
6th Edition
2008
7th Edition
2010
Number of respondents 162 130 111 131
Presence of a CRO 81% 84% 73% 86%
Board-level ERM oversight 59% 70% 77% 78%
Cohesive risk structure 15% - 38% 35% 36% 52%
ERM framework in progress
N/A 32% 23% 27%
Plan to create a framework N/A 18% 23% N/A
Total N/A 85% 82% 79%
Very/extremely effective in non-traditional ERM areas
N/A <50% <50% <50%
From Deloitte’s Fourth Bi-Annual Global Risk Management Survey Says, 2005; Global
Risk Management Survey: Fifth Edition, 2007; Global Risk Management Survey: Sixth
Edition, 2009; and Global Risk Management Survey, Seventh Edition, 2011.

98
Appendix J
A preliminary meta-analysis table is constructed as follows:
Author Title Year nEvolution Effect
Size Unit of Measurement Other Descriptors/Notes
Aon Global Risk Management Survey '07 2007 320 Insurance Only
Aon Global Risk Management Survey '09 2009 551 76%Established risk management policies - Yes/Partial Insurance Only
Aon Global Risk Management Survey '10 2010 N/A 62%Defined/Operational/Advanced within their maturity model Insurance Only, many outside the U.S.
Beasley, Clune & Hermanson
ERM: An empirical analysis of factors associated with the extent of implementation 2005 123 50% Partially/completely implemented ERM 5-point Likert scale
Beasley, Branson & HancockReport on the Current State of ERM Oversight (AICPA) 2009 701 31%
Partial/complete enterprise-wide RM process in place 11-point Likert scale
Beasley, Branson & HancockReport on the Current State of ERM Oversight (AICPA) - 2nd Edition 2010 331 33%
Partial/complete enterprise-wide RM process in place 11-point Likert scale
Beasley, Branson & HancockEnterprise Risk Oversight - A Global Analysis (CIMA & AICPA) 2010
264 (CIMA only)
46% global 26% U.S.
"Complete/formal/robust ERM process" (doesn't include partial)
Effect sizes are for both AICPA & CIMA studies
Beasley, Branson & Hancock COSO's 2010 Report on ERM 2010 460 20.8% Very/somewhat mature ERM process 5-point Likert scale
DeloitteGlobal Risk Management Survey: Fifth Edition 2007 130 67% Program in place or currently implementing Financial Services Only
DeloitteGlobal Risk Management Survey: Sixth Edition 2009 111 59% Program in place or currently implementing Financial Services Only
DeloitteGlobal Risk Management Survey: Seventh Edition 2011 131 79% Program in place or currently implementing Financial Services Only
Hatch & JutrasThe Executive Enterprise Risk Management (ERM) Agenda 2010 213 49% Full/Partial
Differentiates between Best In Class and Laggards
Hida & GoodspeedDeloitte's Fourth Bi-Annual Global Risk Management Survey Says: 2005 162 25%
"Less than 1/4 indicate they are able to integrate risk across major dimensions of risk type." Financial Services Only
RIMS and Advisen, LTD2011 Enteprise Risk Management Survey 2011 1431 54% Full/Partial 94% U.S. companies
not described in detail in Exec Sum - whole study needed

99
Appendix K
The experimental testing approach is designed as follows:
Student group 1
(control)
Treatment (heat
mapping training)
Student group 2 (test)
Test decisions related to scenario
Bogus Treatment
Test decisions related to scenario

100
Appendix L
St. John Fisher College
Institutional Review Board
Informed Consent Form
Title of study: Business Decision Making under Risk and Uncertainty
Name(s) of researcher(s): Erika McBride
Faculty Supervisor: Dr. Jason Berman Phone for further information: ext. 8086
Purpose of study: This study will analyze a combination of decisions made by individuals in a business context, when presented with various risk scenarios.
Approval of study: This study has been reviewed and approved by the St. John Fisher College Institutional Review Board (IRB).
Place of study: St. John Fisher College Length of participation: 60 minutes or less
Risks and benefits: The expected risks and benefits of participation in this study are explained below:
Participation in this study presents minimal risks, namely boredom and the risk of time passing wasted. Participants will benefit via inclusion in a drawing for a gift card and/or receipt of an extra credit point for their Bittner School coursework.
Method for protecting confidentiality/privacy:
Decision making responses will be captured anonymously, and will be destroyed once aggregated.
Your rights:
As a research participant, you have the right to:
1. Have the purpose of the study, and the expected risks and benefits fully explained to you before you choose to participate.
2. Withdraw from participation at any time without penalty.
3. Refuse to answer a particular question without penalty.

101
Appendix L (continued)
4. Be informed of appropriate alternative procedures or courses of treatment, if any, that might be advantageous to you.
5. Be informed of the results of the study.
I have read the above, received a copy of this form, and I agree to participate in the above-named study.
_____________________________ ____________________________ _____________
Print name (Participant) Signature Date
_____________________________ ____________________________ _____________
Print name (Investigator) Signature Date
If you have any further questions regarding this study, please contact the researcher listed above. If you or your child experiences emotional or physical discomfort due to participation in this study, contact the Office of Academic Affairs at (585) 385-8034 or the Wellness Center at (585) 385-8280 for appropriate referrals.
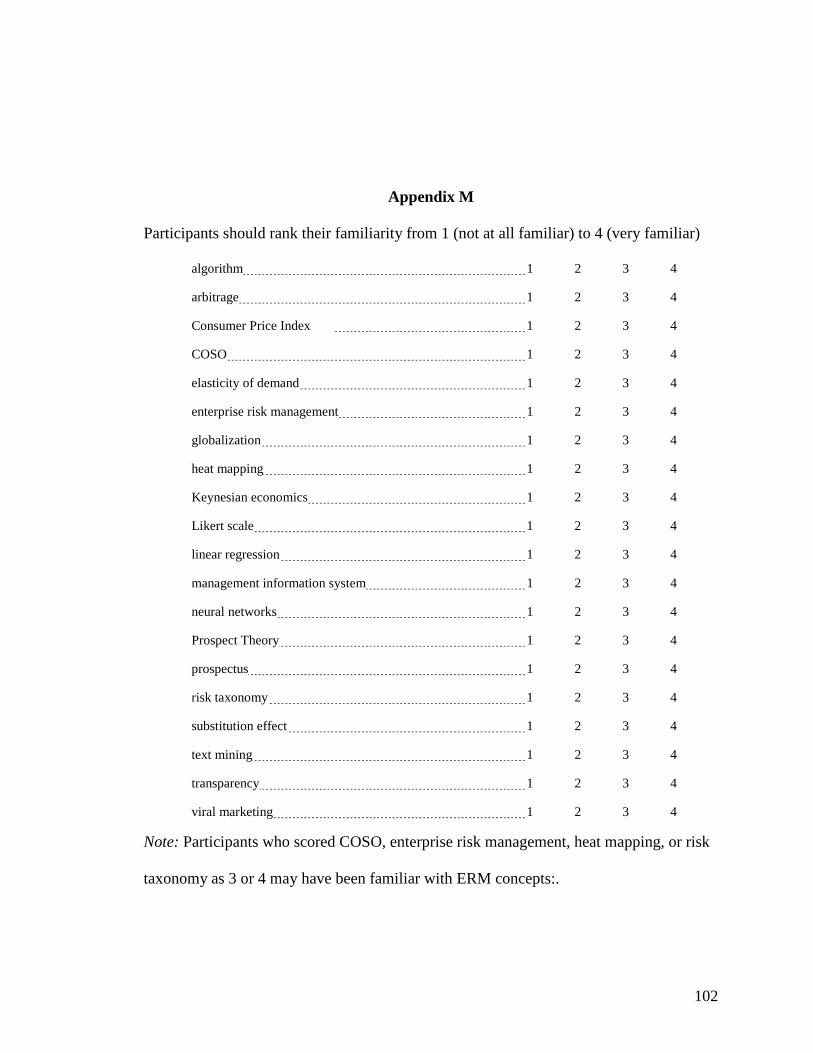
102
Appendix M
Participants should rank their familiarity from 1 (not at all familiar) to 4 (very familiar)
algorithm 1 2 3 4
arbitrage 1 2 3 4
Consumer Price Index 1 2 3 4
COSO 1 2 3 4
elasticity of demand 1 2 3 4
enterprise risk management 1 2 3 4
globalization 1 2 3 4
heat mapping 1 2 3 4
Keynesian economics 1 2 3 4
Likert scale 1 2 3 4
linear regression 1 2 3 4
management information system 1 2 3 4
neural networks 1 2 3 4
Prospect Theory 1 2 3 4
prospectus 1 2 3 4
risk taxonomy 1 2 3 4
substitution effect 1 2 3 4
text mining 1 2 3 4
transparency 1 2 3 4
viral marketing 1 2 3 4
Note: Participants who scored COSO, enterprise risk management, heat mapping, or risk
taxonomy as 3 or 4 may have been familiar with ERM concepts:.

103
Appendix N
Decision Making Scenarios
You are the owner and general manager of a local village pizza shop, Pauly’s Pizza. You sell pizza, wings, and several other food items typically associated with a pizza place. The staff consists of an assistant manager, three cooks, and three delivery drivers, and the shop is open seven days a week. The store has been in operation for five years, and has begun to turn a profit, allowing you, as the owner, to take a periodic salary draw. As the current fiscal year draws to a close, you acknowledge that Pauly’s Pizza is facing a variety of situations that risk the longevity of the business. You have $10,000 left in surplus from the prior year, some or all of which you may direct toward reducing these risks. Or, you may elect to do nothing. A description of these risks is below, along with the associated annual costs to address them. Please indicate what action(s) you will take as the owner of Pauly’s Pizza, with an eye toward continued prosperity.
1. Reckless Driving - One of your drivers has received several traffic tickets for reckless driving and speeding. You worry that he will cause an accident and seriously injure someone, with potentially disastrous consequences, figuring it’s possible in the near future. Should you fire the person, and pay a placement agency to help find a new driver that is safer?
COST $1,000 Yes No
2. New Neighbors - Just down the block from Pauly’s Pizza, a storefront has been vacant for some time, and a very strong rumor is that another establishment, Patty’s Pizza, is considering moving in. It’s not large enough for a whole pizza restaurant, but Patty would just serve slices there that she would cook at another place. You believe the change is almost certain, and worry about the impact on your future profitability, estimating that a new pizza outlet could cut your revenues considerably. Should you proactively rent the space yourself for storage purposes, in an effort to avoid this situation?
COST $3,000 Yes No
3. Low-Carb Craze - The national obesity epidemic has caused many individuals to reduce the amount of carbohydrates in their diet. As a result, national statistics show that pizza industry revenue has dropped 10% as a result, a trend that is likely to continue. Should you hire a chef to develop a low-carb pizza option? You do not believe this pizza would provide a competitive advantage, but rather protect your current revenue stream.
COST $2,000 Yes No

104
Appendix N (continued)
4. Employee Theft - Your drivers and chefs regularly handle cash and customer credit card information. You employ appropriate internal control processes, and they are good employees. While unlikely, you worry that they may be tempted to steal the cash or use customer credit cards inappropriately. This situation could not only cost you directly, but may also damage Pauly’s Pizza’s reputation in the community. Should you install clearly-visible cameras as a deterrent?
COST $2,000 Yes No
5. Refrigeration Risk - Pauly’s Pizza is located in an area known for very hot summers. The current refrigeration equipment has seen better days, and has a difficult time keeping food cold and chicken wings frozen. You worry that the chicken wings may spoil, and your staff would unwittingly serve it to customers, making them ill. While not likely, it is certainly possible, and would likely result in the loss of your right to serve food. Should you invest in high-tech sub-zero freezers?
COST $1,500 Yes No
6. Oven Breakdowns - Similar to your refrigerator, your pizza ovens are old, and in need of repair. Approximately once a month, maybe 10 times a year, the oven goes down, and it takes a couple of hours to get the oven up and running, a minor inconvenience. Should you invest in a new oven?
COST $2,500 Yes No
7. Sauce Supply - Pauly’s Pizza gets all of its pizza sauce from a local supplier. You worry about having all of your eggs in this basket, knowing that disruption in supply is possible in this economic environment, but a contract provision currently prevents you from using additional suppliers. If supplier disruption occurs, you may be forced to close for a couple days until a new sauce source can be found. Should you offer to pay the supplier a fee to waive this portion of the contract, allowing you to proactively shop elsewhere for pizza sauce?
COST $500 Yes No
8. Rental Rate - You currently rent your restaurant space, and you hear rumors that your landlord may double the rent, with severe impacts to your business. You think it’s unlikely, but you believe you can offer the landlord a one-time fee to lock in your current rate for another year. Should you enter into this contract addendum?
COST $500 Yes No
105
Appendix N (continued)
9. Chef Turnover - A new big movie theater has opened in town. They are planning to serve pizza, so they are looking for experienced pizza chefs. You worry that they will lure away your cooks, figuring it is pretty likely, and it may take you several weeks to find new chefs and train them. Should you give the staff a bonus if they enter into a handshake agreement to stay on another year?
COST $1,000 Yes No
10. Discount Offers - When Pauly’s Pizza first opened, you held a big advertising campaign to gain initial business. However, you have seen your new customer base drop slightly, down 5% last year, a trend that you think will continue. Should you do a one-time discount offer to individuals and businesses new to the area, in an effort to maintain market share?
COST $1,000 Yes No

106
Appendix O
Slides used for the control group training (actual presentation includes animation):

107
Appendix P
Slides used for the intervention training (actual presentation includes animation):

108
Appendix Q
The following notes outline the lecture performed for the testing group:
Slide 1
Risk management – not a new concept. Been around since people felt they were controlling their destinies, rather than waiting for the result of God’s will. Merchant seamen began insurance the cargos of their ships way back in the time of the Crusades, giving birth to the insurance industry that is such big business today. In the last century, the risk management term began to be used in the banking and finance sectors, where the notion of diversifying your portfolio to manage your risk is a fact of life. In more recent decades, risk management became a term adopted by the medical industry as well, in their efforts to improve the quality of care while also protecting themselves from costly lawsuits.
Slide 2
Enterprise Risk Management (COSO) – “a process, effected by an entity’s board of directors, management, and other personnel, applied in strategy setting and across the enterprise, designed to identify potential events that may affect the entity, and manage risk to be within its risk appetite, to provide reasonable assurance regarding the achievement of entity objectives.”
Whole series of steps and a growing discipline around ERM – we are focusing on a couple specific components, and then one tool in particular that organizations are using to help them with managing their risks.
Slide 3
First you need to know what level of risk you are willing to take on – is the organization risk seeking? Risk seeking means you’ll take a chance, roll the dice in hopes of a payoff.
Examples of risk-seeking industries?
Investment bankers – venture capitalists
Stock car racing
Risk averse means the organization would rather not take a chance, being very cautious about their actions, because the consequences may be more than they are willing to bear.

109
Appendix Q (continued)
Examples of risk-averse (risk sensitive) industries?
Nuclear power – airlines
Kodak
How do companies acknowledge their stance on risk? They can run through a bunch of scenarios….
- Are we going to introduce a new car, knowing that if it’s involved in a rear-end collision, there’s a possibility that the gas tank is going to blow up. We’d want to know how likely that is to happen, right? Will it happen half the time? 1 in 10,000? And what would the impact be if it does blow up? Could be pretty bad, right, especially if a child is sitting in the back seat?
- What if we find out that the president of our company is involved in some activity in violation of ethics policy – using company vehicles to bring guests to town for his daughter’s wedding, say. We’d know that wasn’t good – he shouldn’t be doing it, but once it’s done, what do we do? We’d want to find out how many people knew, so how likely it is to get out. And we’d want to try to figure out what the public would say about it – how aggravated would they be? If we were a privately owned company, no big deal, right? If we were publicly-owned with some obligation to shareholders, bigger deal? If we were a bank that got a lot of money from a government bailout, and the vehicle in question is the corporate jet, it could be a much bigger deal, right?
There are more scenarios than we could think of, and if you’re a real creative person, you could think of thousands and thousands of ways of fallout, right? But in each case, you want to get a feel for the likelihood of an event occurring, and then the potential impact in case it does.
This could be shown in a formula like this…
Risk = (probability of an event occurring) x (expected impact if it occurs)
Slide 4
This could be set up in a visual map – set up the axes. And then you can plot scenarios on it…
1 – Let’s allow bungee jumping off the Kearney tower
2 – Introduce a new type of tater tot at that buffet
3 – Build facilities across the street and have students, faculty and staff cross it
110
Appendix Q (continued)
4 – What if we have a supply of pencils and paper in the library next to all the computers so when you’re looking something up and then you have to run upstairs to get the book, you can write it down. Sure, the chances that people are not going to return the pencils is pretty high, but the impact is pretty low, especially if they’re these little golf pencils – cheap, nobody wants them because there’s no eraser.
As you go through these scenarios, you’d start to see a pattern emerge of risks you’re willing to accept and those you’re not. You could kind of see the dividing line between the two, and that would be your risk appetite. Draw it. Organizations then develop a risk appetite statement to describe their level of risk acceptance.
Once they developed an understanding of their appetite, they can plot future scenarios on this heat map, to see how it lines up against their appetite.
Slide 5
Let’s say we’re St. John Fisher College, and a generous alumnus gives us a building. It’s a brick building, with a wooden storage structure on the back. Let’s talk about the risk of fire, and plot it on the map (upper left). What are some ways that companies can help protect themselves from this risk?
Insurance – sharing the risk with someone else
Reduce - tear down wooden structure (reduce likelihood)
install sprinklers (reduce likelihood & impact)
Get rid of the building completely – avoidance
Risk acceptance
Slide 6
This is Pauly, he owns a pizza shop, and he has identified a variety of potential risks. He has a $10,000 budget surplus from the prior year, and needs to decide which of the risks he would like to try to address, if any. Pretend you’re Pauly, it’s your pizza shop, and you’d like to minimize some risks, but note that you do not have enough funds to address all the risks. Rather, you should attempt to realize the greatest risk reduction per dollar spent, using the heat maps attached to the scenarios to assist you. Pull out the information now – you should have 3 sheets. This is important…the numbers on the heat map correspond to the various scenarios. So the risk associated with Scenario 1, Reckless Driving, is in the upper left hand box, just outside the risk appetite line. If you elect to take action on the Reckless Driving risk, imagine how that point could move on the heat map, just as we did in the examples.

111
Appendix Q (continued)
Using the heat map, and imagining how each point would change by the action you take, please indicate, by circling “yes” or “no” under each option, which risk-mitigation measures you will do. Again, you only have $10,000, so you CAN’T DO EVERYTHING! You must work independently. You will have 30 minutes to complete this exercise. When finished, take that jargon sheet that you filled out first, flip it over, and provide summary comments. Please place all of your materials in your envelope, and give the envelope to the room facilitator. Feel free to leave when you are finished. Please pick up a debriefing form as you exit the room, and THANK YOU FOR YOUR PARTICIPATION!

112
Appendix R
Heat map materials for the testing group, Group 2:
Unlikely
Min
or
Possible
Mod
erat
e
Almost Certain
Maj
or
Impa
ct
Likelihood
Pauly’s PizzaHeat Map
Likely
1
2
34
5
8
7
10 6
9
113
Appendix S
The influence of the training and heat map materials was understood through the
following manipulation validity check:
Summary Comments
Participants should indicate the extent to which they used the training materials or heat map to help make their scenario decisions, from 1 (not at all) to 4 (extensively).
How much did you use the training materials/heat map to assist in making the scenario decisions?
1 2 3 4
Feel free to provide any additional comments regarding how you came to your decisions:

114
Appendix T
Each participant’s inherent risk level was scored as follows:
1
1
2 4
Impa
ct
Likelihood
Pauly’s PizzaHeat Map – Inherent Risk Scoring
3
1
2
34
5
8
7
10 6
9
IR Scoring
1 2*6=122 4*5=203 3*3=94 1*3=35 2*5=106 4*1=47 2*2=48 1*6=69 3*4=1210 3*1=3
IR total=83
23
45
6

115
Appendix U
Each participant’s residual risk level was scored as follows:
1
1
2 4
Impa
ct
Likelihood
Pauly’s PizzaHeat Map – Residual Risk Scoring
3
2
3
4
5
8
7
106
9
RR Scoring
1 1*6=62 0*0=03 2*1=24 1*3=35 1*5=56 1*1=17 2*1=28 1*1=19 2*4=810 2*1=2
RR total=30
23
45
6 1

116
Appendix V
Raw data results from the experiment:
Participant Jargon Total 1 2 3 4 5 6 7 8 9 10 RR Score Delta-R $ Spent Delta-R/$ Manipulation Check
A1 4 Y N Y N Y Y Y Y N N 55 28 8,000 0.003500 3A2 5 Y Y N N Y Y Y N N Y 46 37 9,500 0.003895 1A3 8 Y Y N N Y Y N N Y Y 44 39 10,000 0.003900 3A4 6 Y N N Y Y Y N N N Y 68 15 8,000 0.001875 2A5 6 N Y N N Y Y Y Y Y Y 43 40 10,000 0.004000 3A6 6 N N Y Y Y Y Y Y N Y 60 23 10,000 0.002300 2A7 7 Y N Y N Y Y N N Y Y 57 26 9,000 0.002889 2A8 6 Y N N Y Y Y Y N N Y 66 17 8,500 0.002000 1A9 10 N N Y Y Y Y N N N N 68 15 8,000 0.001875 2A10 4 Y N N Y Y Y Y Y N Y 61 22 9,000 0.002444 1A11 10 N Y N Y Y Y Y Y N N 48 35 10,000 0.003500 2A12 6 N N Y Y Y N Y N Y Y 64 19 8,000 0.002375 3A13 6 Y N N N Y N Y N Y Y 65 18 5,000 0.003600 1A14 7 N N Y Y Y Y N N N Y 67 16 9,000 0.001778 2A15 8 N Y N Y Y Y N N N Y 54 29 10,000 0.002900 1A16 6 Y N Y N Y Y Y Y Y N 51 32 9,000 0.003556 2A17 4 N Y N Y Y N Y Y Y Y 46 37 9,500 0.003895 2A18 9 Y N N Y Y Y N N N Y 68 15 8,000 0.001875 1A20 5 Y Y N N Y Y Y Y N Y 41 42 10,000 0.004200 3A21 8 Y Y N Y Y Y N N N N 49 34 10,000 0.003400 2A22 6 N N N N Y Y N Y N Y 69 14 5,500 0.002545 2B1 8 Y N N Y Y Y Y Y N Y 61 22 9,000 0.002444 2B2 5 Y Y Y N Y N N Y Y N 36 47 9,000 0.005222 4B3 6 Y N N Y Y Y Y Y N Y 61 22 9,000 0.002444 4B4 12 N N N N Y Y Y Y N Y 67 16 6,000 0.002667 2B5 12 Y Y N N Y N Y N Y N 46 37 7,000 0.005286 2B6 11 Y Y N N Y Y Y Y Y N 38 45 10,000 0.004500 3B7 7 Y N N N Y Y N Y N N 64 19 5,500 0.003455 2B8 5 Y N Y Y Y Y Y Y N N 55 28 10,000 0.002800 2B9 12 N Y Y N Y Y Y Y N N 41 42 10,000 0.004200 3B10 9 Y Y N Y Y N N Y Y Y 42 41 10,000 0.004100 3B11 6 Y Y N N Y Y N N N N 49 34 8,000 0.004250 3B12 10 Y Y Y N Y N N N Y N 41 42 8,500 0.004941 4B13 5 Y Y Y N Y N Y Y N Y 37 46 9,500 0.004842 3B14 6 N Y Y N Y Y N N Y N 44 39 10,000 0.003900 2B15 8 N N Y N Y Y Y Y Y Y 56 27 9,000 0.003000 3B16 8 Y Y Y Y Y N N Y N N 40 43 10,000 0.004300 4B17 9 Y Y Y N Y N Y Y Y N 34 49 9,500 0.005158 4B18 6 Y Y N N Y Y Y Y Y N 38 45 10,000 0.004500 3B19 5 Y Y Y N Y N N Y Y Y 35 48 10,000 0.004800 4B20 9 Y Y N N Y Y Y N Y N 43 40 9,500 0.004211 4B21 5 Y Y N N Y N N Y Y Y 42 41 8,000 0.005125 3B22 5 Y Y N N Y Y Y Y Y N 38 45 10,000 0.004500 2B23 6 Y N N Y Y Y N N N Y 68 15 8,000 0.001875 2B24 6 N Y Y N Y N N N Y Y 46 37 8,500 0.004353 2B25 9 N N Y Y Y Y N N N Y 67 16 9,000 0.001778 2B26 11 N Y N Y Y Y Y Y N N 48 35 10,000 0.003500 3B27 7 N Y Y N N Y N Y Y Y 43 40 10,000 0.004000 3
Scenario Choices