Enterprise Monitoring & Event Management
4
Surveillance DB ™ Enterprise Monitoring & Event Management PRODUCT DATASHEET Key Benefits Reduce system downtime by detecting problems before they affect the database Quickly identify problems that are causing a crisis for end users and hindering business objectives Enterprise-wide, dashboard monitoring displays the status of servers and entities Monitor application data and receive proactive alerts of potential problems before the database is affected Determines the root cause of a recent outage using Flashback analysis Produce high quality reports from the Surveillance Centralized Repository Database, and generate numerous pre-defined reports for each monitored platform. Bradmark’s Surveillance DB ™ provides real-time diagnostics, unattended event management, and historical analysis of the performance and utilization of your database environment. Capture high-level comprehensive views of the overall system health, and drill-down to the root cause of performance bottlenecks. Out-of-the-box, Surveillance’s unattended event management allows you to get immediate feedback of performance issues throughout your enterprise. Highly customizable rule sets and event handlers can then be tailored to your specific requirements including taking remedial action. For after-the-fact problem diagnostics, capacity planning, and service-level monitoring, Surveillance’s Central Repository can store historical performance and utilization information from the entire enterprise. Real-Time, Proactive Solutions to Ensure Database Uptime Efficient diagnostics and effective problem identification with a real-time perspective. From the NORAD ® Family of Products
Transcript of Enterprise Monitoring & Event Management

Surveillance DB™
Enterprise Monitoring & Event Management
PRODUCT DATASHEET
Key Benefits
Reduce system downtime by detecting problems before they affect the database
Quickly identify problems that are causing a crisis for end users and hindering business objectives
Enterprise-wide, dashboard monitoring displays the status of servers and entities
Monitor application data and receive proactive alerts of potential problems before the database is affected
Determines the root cause of a recent outage using Flashback analysis
Produce high quality reports from the Surveillance Centralized Repository Database, and generate numerous pre-defined reports for each monitored platform.
Bradmark’s Surveillance DB™ provides real-time diagnostics, unattended event management, and historical analysis of the performance and utilization of your database environment. Capture high-level comprehensive views of the overall system health, and drill-down to the root cause of performance bottlenecks.
Out-of-the-box, Surveillance’s unattended event management allows you to get immediate feedback of performance issues throughout your enterprise. Highly customizable rule sets and event handlers can then be tailored to your specific requirements including taking remedial action. For after-the-fact problem diagnostics, capacity planning, and service-level monitoring, Surveillance’s Central Repository can store historical performance and utilization information from the entire enterprise.
Real-Time, Proactive Solutions to Ensure Database Uptime
Efficient diagnostics and effective problem identification with a real-time perspective.
From the NORAD® Family of Products

The Surveillance DB Event Management is used to provide peace of mind by becoming the smoke detector whose sole purpose is to continually monitor the database for conditions which have a negative impact on performance and/or availability and alert technical professionals before a raging fire gets out of control. To accomplish this, Surveillance DB uses its extensive alerting and alarming facility that comes with a large set of predefined rules.
To begin monitoring, the DBA adjusts default threshold values and collection intervals before turning on the rules to be monitored. The DBA then defines how the alerts are to be sent when a violation occurs. NORAD Surveillance DB can be easily configured to notify multiple DBAs or technical professionals by e-mail, pager, HP Openview or Tivoli alerts, pop-up windows, or record the error in the Windows NT Event Log. The DBA can also execute a fix-it job by executing any operating system executable, including SQL*Plus and ISQL.
In most RDBMS environments, blocked users can cause performance to instantly degrade. Surveillance DB can be used to monitor for blocked users, and if a user is found to be blocking other users for an extended period of time, Surveillance DB can send the entire DBA staff an e-mail.
If the problem is not resolved in a designated period of time, Surveillance DB can then page the entire DBA staff, e-mail DBA management, and execute SQL*Plus to kill the offending
user’s process or session before it destroys system response time or prevents other users from entering data.
Event Management provides unattended monitoring. As long as the Surveillance DB Server Agent is running, continuous monitoring of the rules that the DBA has explicitly turned on occurs, even if the Surveillance DB console is not connected.
Surveillance DB Historical Repository is used to obtain a historical perspective when the Surveillance DB Event Management Option detects and alerts technical professionals that conditions are occurring which are negatively impacting performance. Data from the Historical Repository can be used to trend performance and space utilization data to support system upgrades and/or additional disk space. DBAs can also use the data to establish baselines for threshold values in Event Management’s rule definitions.
To accomplish this, Surveillance DB provides a facility for the DBA to store data from predefined and user-defined collections at user-specified intervals. The DBA specifies how much data to keep, (a day, week, month, year), while the Surveillance DB Repository Manager continuously purges data that falls outside the specified time frame. Any ODBC-compliant reporting tool can be used to query and/or graph the historical data.
Most DBAs want to know the rate at which their databases are growing to ensure that sufficient disk space is always available and to estimate when a database might run out of space at the current growth rate.
Surveillance DB Historical Repository can be used to store the daily utilization for the database’s data files or tablespaces. An ODBC-compliant reporting tool can then be used to query and/or graph the utilization, in addition to calculating the growth rate. This data will enable the DBA to estimate when additional disk space will be required and provide ample time for technical professionals to purchase and install that disk space. To ensure efficient performance, the Historical Repository Option is designed to query and save only the data that the DBA has requested.
Surveillance DB will continuously monitor for rules violations and alert technical professionals before problems become critical.
Detect Problems and Notify Multiple DBAs with Event Management
Identify the Critical Issues with Unattended Monitoring
Go Back in Time with the Historical Repository
Support System Upgrade Planning

User-defined collections (UDCs) are used to extend the Surveillance DB Event Management and Historical Repository capabilities to application data and data integrity. To accomplish this, Surveillance DB provides a facility for DBAs to easily write new data collections, which are the basis for new rules or repository stores. A user-defined collection is an easily configurable file that specifies
the SQL statement to be executed by Surveillance DB. Business executives might want to be notified when the number of orders being processed each hour falls below a certain number. The DBA can write a user-defined collection that queries the count of records in the ORDERS table. The Surveillance DB built-in statistics calculator can be used to derive the change in the numbers of orders since the last refresh interval. The Event Management Option can page or e-mail business executives when the hourly rate of orders processed falls below a certain number.
The Historical Repository Option can be used to store this hourly count over a period of time. This information could then be used to graph the growth rate of orders over the last week, month, quarter, etc., thus providing business executives with the necessary information. User-defined collections are not limited to application data and data integrity. They can be used in conjunction with the Surveillance DB standard, predefined collections to monitor additional performance data. The built-in statistics calculator can also be used to calculate averages, high water marks, and rate per second.
Surveillance DB Real Time Diagnostics Option is used during a crisis situation to determine exactly what is currently happening in the database. Data from Real Time Diagnostics is also used to obtain a real-time perspective when the Event Management detects and alerts technical professionals that conditions are occurring which are negatively impacting performance or availability. DBAs can also use real-time data to establish baselines for threshold values in Event Management’s rule definitions.
Surveillance DB provides a facility to display an extensive set of predefined windows that provide an immediate global view of database activity and detailed performance metrics such as session/process activity, locks, batch contention, file I/O, and much more. Real-time data from multiple RDBMS can be viewed simultaneously. Data from each window can be sorted or filtered while most statistics can be graphed over time. In addition, each window or graph can be configured to refresh at either the default collection interval or its own refresh interval.
If Event Management alerts the DBA that a user is blocking other users for an extended period of time – causing a work stoppage, Real-time Diagnostics can be used to identify the user’s session that is causing the problem. Drilling down to session details reveals that the user’s session has issued an exclusive lock on the LEDGERS table that is preventing other users from entering general ledger records. The DBA is also able to determine that the user has selected data for update purposes, but has neglected to save or abort the update, causing other users to wait. The DBA can then request that the user save or abort the data. If the user can’t be found, the DBA could decide to kill the user’s session, allowing other users to enter general ledger records. If the DBA is not available, Event Management that’s pre-configured, can kill the session automatically – the work stoppage will be eliminated without intervention from technical professionals.
Without Surveillance DB, work stoppage will continue until the DBA is notified by the user community that there is a performance problem. Once available, the DBA has to write and/or run scripts that query the multitude of performance statistics to determine the cause of the problem before the work stoppage can be eliminated.
Use the Historical Repository to track performance over time, and establish a baseline for performance expectations.
Key Point:
The value Surveillance DB provides to organizations today becomes even more significant if the DBA is unavailable for an extended period of time due to vacation, illness, or other performance problems.
Extend Monitoring Capabilities to Application Data
View the Big Picture or the Details with a Real Time Perspective
Reduce Downtime by Quickly Identifying Problems
About Bradmark
Privately-held for more than 25 years, Bradmark Technologies, Inc. develops, markets, sells, and supports data management solutions that provide anytime — anywhere access to managing database, application and operating system components. In addition to a direct sales force, Bradmark has an established worldwide network of channel partners.
To order, or for more information on other Bradmark products:
Phone: (800) 621-2808 or outside the U.S.: (713) 621-2808 Fax: (713) 621-1639
Bradmark Regional Offices:
Bradmark EMEA Tel: +31 (0) 251 268 248
Bradmark Technologies UK Ltd. Tel: +44 (0) 870 240 6285
Bradmark Deutschland Tel: +49 (0) 211 52391 154
Bradmark Asia Tel: +86 10 8458 0860
Or visit: www.bradmark.com
© 2009 Bradmark Technologies, Inc. All Rights Reserved. Surveillance DB, OS, IQ and RS are trademarked product names of Bradmark Technologies, Inc. All other product names herein have been used for identification purposes only, and may be trademarks and/or registered trademarks of their respective companies. Surveillance DB Data Sheet
Print Date: 04/09
System Requirements
Console Requirements:
• Windows 2000 or later• 600 MHz Pentium Processor• 128 MB of RAM• 100 MB free hard disk space
Agent Requirements:
• Platforms: Windows 2000 or later, AIX, HP-UX PA-RISC, HP-UX Itanium, Linux x86, Solaris SPARC, Solaris x64, Tru64
• Full 64-bit support on UNIX and Linux• TCP/IP• 80 MB free hard disk space, more for
repositories (Windows)• 300 MB free hard disk space (UNIX)
RDBMS Requirements:
• Oracle v 7.3.4, 8.0.x, 8i, 9i-9.2 and 10.1-10.2
• Sybase ASE v 11.0 or later• Sybase Rep. Server v 12.1 or later• Sybase IQ Server v 12.5 or later• Microsoft SQL Server v 7.0, 2000-05 • DB2 UDB version 7.2, 8.1-8.2 and 9.1
Product Summary
Increase Availability... Continuous evaluation of rules for violations combined with unattended alerting allows problems to be detected and resolved before a crisis can effect availability.
Plan for the Future... Use trend performance and space utilization data to support system upgrades and/or decisions regarding additional disk space.
Maximize Scarce Resources... The DBA can concentrate on improving performance and developing new databases rather than looking for problems.
Monitor Business Objectives... Alert business executives when objectives are not being met by extending alerting and alarming capabilities to application data.
Reduce the Impact of a Crisis... During a crisis, identify problems quickly with an immediate global view of database activity and detailed performance metrics without writing scripts.
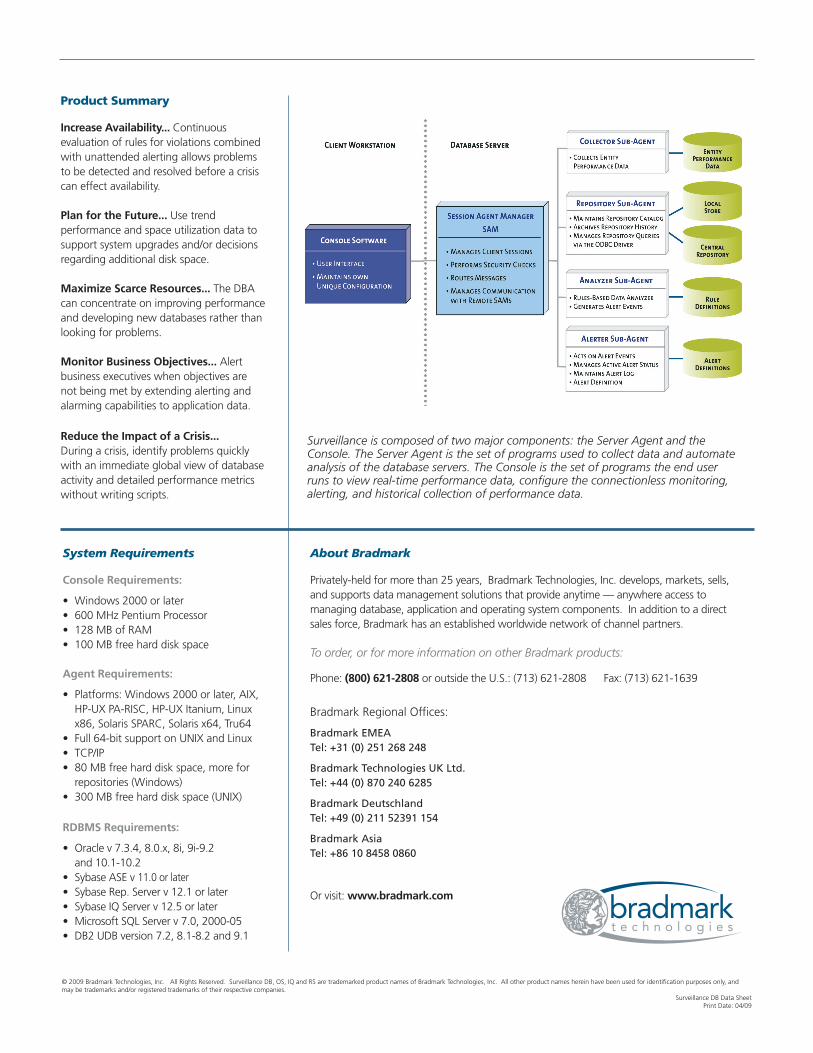
Surveillance is composed of two major components: the Server Agent and the Console. The Server Agent is the set of programs used to collect data and automate analysis of the database servers. The Console is the set of programs the end user runs to view real-time performance data, configure the connectionless monitoring, alerting, and historical collection of performance data.