Ensemble-averaged Rabi oscillations in a ferromagnetic ...
7
ARTICLE Received 17 Sep 2016 | Accepted 18 May 2017 | Published 28 Jun 2017 Ensemble-averaged Rabi oscillations in a ferromagnetic CoFeB film Amir Capua 1,2,3 , Charles Rettner 1 , See-Hun Yang 1 , Timothy Phung 1 & Stuart S.P. Parkin 1,2 Rabi oscillations describe the process whereby electromagnetic radiation interacts coherently with spin states in a non-equilibrium interaction. To date, Rabi oscillations have not been studied in one of the most common spin ensembles in nature: spins in ferromagnets. Here, using a combination of femtosecond laser pulses and microwave excitations, we report the classical analogue of Rabi oscillations in ensemble-averaged spins of a ferromagnet. The microwave stimuli are shown to extend the coherence-time resulting in resonant spin amplification. The results we present in a dense magnetic system are qualitatively similar to those reported previously in semiconductors which have five orders of magnitude fewer spins and which require resonant optical excitations to spin-polarize the ensemble. Our study is a step towards connecting concepts used in quantum processing with spin-transport effects in ferromagnets. For example, coherent control may become possible without the complications of driving an electromagnetic field but rather by using spin-polarized currents. DOI: 10.1038/ncomms16004 OPEN 1 IBM Research Division, Almaden Research Center, 650 Harry Road, San Jose, California 95120, USA. 2 Max Planck Institute for Microstructure Physics, Weinberg 2, D-06120 Halle (Saale), Germany. 3 Electrical Engineering Department, The Hebrew University of Jerusalem, The Edmond J. Safra Campus—Givat Ram, Jerusalem 9190401, Israel. Correspondence and requests for materials should be addressed to A.C. (email: [email protected]) or to S.S.P.P. (email: [email protected]). NATURE COMMUNICATIONS | 8:16004 | DOI: 10.1038/ncomms16004 | www.nature.com/naturecommunications 1
Transcript of Ensemble-averaged Rabi oscillations in a ferromagnetic ...

ARTICLE
Received 17 Sep 2016 | Accepted 18 May 2017 | Published 28 Jun 2017
Ensemble-averaged Rabi oscillations in aferromagnetic CoFeB filmAmir Capua1,2,3, Charles Rettner1, See-Hun Yang1, Timothy Phung1 & Stuart S.P. Parkin1,2
Rabi oscillations describe the process whereby electromagnetic radiation interacts coherently
with spin states in a non-equilibrium interaction. To date, Rabi oscillations have not been
studied in one of the most common spin ensembles in nature: spins in ferromagnets. Here,
using a combination of femtosecond laser pulses and microwave excitations, we report the
classical analogue of Rabi oscillations in ensemble-averaged spins of a ferromagnet. The
microwave stimuli are shown to extend the coherence-time resulting in resonant spin
amplification. The results we present in a dense magnetic system are qualitatively similar to
those reported previously in semiconductors which have five orders of magnitude fewer spins
and which require resonant optical excitations to spin-polarize the ensemble. Our study is a
step towards connecting concepts used in quantum processing with spin-transport effects in
ferromagnets. For example, coherent control may become possible without the complications
of driving an electromagnetic field but rather by using spin-polarized currents.
DOI: 10.1038/ncomms16004 OPEN
1 IBM Research Division, Almaden Research Center, 650 Harry Road, San Jose, California 95120, USA. 2 Max Planck Institute for Microstructure Physics,Weinberg 2, D-06120 Halle (Saale), Germany. 3 Electrical Engineering Department, The Hebrew University of Jerusalem, The Edmond J. Safra Campus—GivatRam, Jerusalem 9190401, Israel. Correspondence and requests for materials should be addressed to A.C. (email: [email protected]) or to S.S.P.P.(email: [email protected]).
NATURE COMMUNICATIONS | 8:16004 | DOI: 10.1038/ncomms16004 | www.nature.com/naturecommunications 1

Isolated electron or nuclear spin states are ideal candidatesfor quantum information processing1–5. A practical gatewayto this world is also provided by macroscopic quantum
systems that are large cooperative ensembles6. Superfluids7,8,superconductors9,10 and ultracold dilute atomic vapours11–13
are examples of such systems. In ferromagnets, macroscopicquantum behaviour asserts itself at low temperatures (mK)and/or small enough length scales (nanometre scale)14–16. In thatlimit, the observables of angular momentum obey the classicalequations of motion. Hence, a great deal of insight into thequantum world is gained from studies of the classical ensemble-averaged analogues17.
Spin ensembles in semiconductors have been considered inthe context of quantum computing18,19 for which resonantcircularly polarized light is used to excite the superpositionspin state at low temperatures. Nevertheless, dense ferroma-gnetic systems having five orders of magnitude more spinsthan semiconductors and which exhibit spontaneous spin-splitting at room temperature, are not currently consideredsuitable for such applications. Their spin states lack protectiondue to spin–spin and spin–lattice interactions20. While these maybe overcome at low temperatures14 or by careful engineeringof their band structure20, their coherent manipulation bynon-adiabatic interactions remains unexplored, even in theclassical limit.
The coherent manipulation of spin ensembles require operat-ing in the non-adiabatic regime which pertains whenever theelectromagnetic radiation and the state representing the ensembleare not in equilibrium, namely, when excessive energy istransferred back and forth between the ensemble and theoscillatory field before the steady precessional state is reached.In ferromagnets, the adiabatic interaction has been primarilyexplored using ferromagnetic resonance (FMR)21,22 methods.Similar studies of the magnetic order have also been conductedby analysing the impulse response in the absence of the rotatingfield using the time-resolved magneto-optical Kerr effect(TR-MOKE)23–27. Despite the extensive studies of spindynamics in ferromagnetic metals, little attention has beendrawn to the non-adiabatic transitions. This non-equilibriummode of operation can be accessed by either modifying the stateof the radiation, for instance when the oscillatory field is turnedon as in the application of p-pulses28, or that of the magneti-zation, when the rotating field is already present and steady stateconditions prevail.
Here we demonstrate the non-adiabatic regime in ensemble-averaged spins of a ferromagnet and show that a perturbation byan intense ultrashort optical pulse can initiate Rabi oscillationsthat are observable even in a dense ferromagnetic system. This isachieved in a ferromagnetic compound of CoFeB whose responseis shown to be accurately described by Rabi’s formula. The phaseand amplitude responses reveal a frequency chirp which can becontrolled by applying a static magnetic field. We find that theintroduction of a transient torque in the form of a pulsedmagnetic field occurring on a picosecond timescale betterdescribes the interaction with the optical pulse. Our experimentsfurther indicate that the microwave field induces coherence in theinhomogeneously broadened ensemble by selecting a subset ofspins that are driven resonantly. Hence, the ensemble dephasingis suppressed and relaxation times that represent more closelythose of individual spins result. Finally, in agreement withGilbert’s damping theory29, we show that the intrinsic relaxationtimes can be tuned by proper choice of the external magneticfield30 to initiate resonant spin amplification19,31 that result inspin-mode locking32 of the system. These effects show thepotential of exploiting techniques developed for quantumcoherent manipulation in ferromagnets.
ResultsSample details. The sample studied was a Co36Fe44B20 filmhaving a thickness of 11 Å that was perpendicularly magnetizedand grown by magnetron sputtering. The effective anisotropyfield, m0HKeff, was measured to be B140 mT, with m0 beingthe magnetic permeability. From TR-MOKE measurements ofthe free induction decay responses (Fig. 1a) a Gilbert dampingconstant, a, of 0.023 and an inhomogeneous distribution ofthe effective anisotropy field, m0DHKeff, of 17.5 mT weredetermined33. We describe here the dynamical processes inthe ferromagnet using a and DHKeff rather than using thespin–lattice, and transverse spin polarization decay times34,35,T1 and T2
*, respectively, which are commonly used to describequantum coherent phenomena, due to the physical origins of theGilbert damping29 (Supplementary Note 1).
Rabi oscillations in a ferromagnet. The concept of our experi-ment is presented in Fig. 1b. A microwave field is used to drivespin precessions in the film which are then perturbed by a fem-tosecond optical pulse that is phase-locked to the microwavesignal. The temporal recovery is recorded by a weak optical probepulse as a function of a pump-probe delay time using the MOKEdetection scheme. Example of the measured responses for threevalues of applied magnetic field, H0, are presented in Fig. 1c–e.A distinct envelope is seen to modulate the carrier signal.This envelope exhibits a systematic behaviour; the time of itsminimum increases as H0 approaches the resonance field, Hres.These traces do not stem from spin wave interference generatedby the microwave and by the optical pump as we show in thefollowing.
The responses for a complete set of H0 fields, are illustrated inFig. 1f. At H0oHres, the shift in time of the minima is seen clearlyand forms a valley. At H04Hres, a maximum is formed instead,making the response asymmetric. Plotting in addition thetheoretical prediction for these signatures as given by thegeneralized Rabi formula for the frequency of the nutations:
OGR ¼
ffiffiffiffiffiffiffiffiffiffiffiffiffiffiffiffiffiffiffiffiffiffiffiffiffiffiffiffiffiffiffiffiffiffiffiffiffiffiffiffiffiffiffiffiffiffiffiffiffiffiffiffiffiffiffigm0H0�oRFð Þ2þ gm0hRFð Þ2
qð1Þ
results in a very good agreement with the measured features.In equation (1) g, hRF and oRF are the gyromagnetic ratio,microwave amplitude and microwave angular frequency,respectively. The equation was derived under the assumptionthat the magnetocrystalline and demagnetization fields are smallcompared to the external field. The apparent agreement indicatesthat the ensemble-averaged Rabi oscillations are observable in theferromagnetic film and implies that the well-established methodsand techniques used in coherent quantum processing can beapplied on ferromagnetic materials and vice versa36.
Regarding the coherence times of the interaction, while theRabi cycles we record occur on timescales of few hundreds ofpicoseconds depending on the detuning from resonance, theeffective coherence time is B500 ps which consists of the intrinsicdecay time of B1.15 ns and the dephasing lifetime due to theinhomogeneous broadening ofB0.95 ns (Methods section).Hence, the coherence times are longer than the Rabi cycle andallow its observation.
Phase responses. The phase responses which are generally lessaccessible in experiments that address the coherent light-matterinteractions are also measurable in our experiment. We analysethem by plotting the data set of Fig. 1f as a two-dimensionalcontour plot (Fig. 2a). Before the pump pulse arrives, a net phaseshift ofB0.75 p is measured across the resonance (Fig. 2b) asexpected. Surprisingly, at times (pump-probe delays) well afterthe perturbation, a phase shift ofB2.75 p is observed as H0 is
ARTICLE NATURE COMMUNICATIONS | DOI: 10.1038/ncomms16004
2 NATURE COMMUNICATIONS | 8:16004 | DOI: 10.1038/ncomms16004 | www.nature.com/naturecommunications
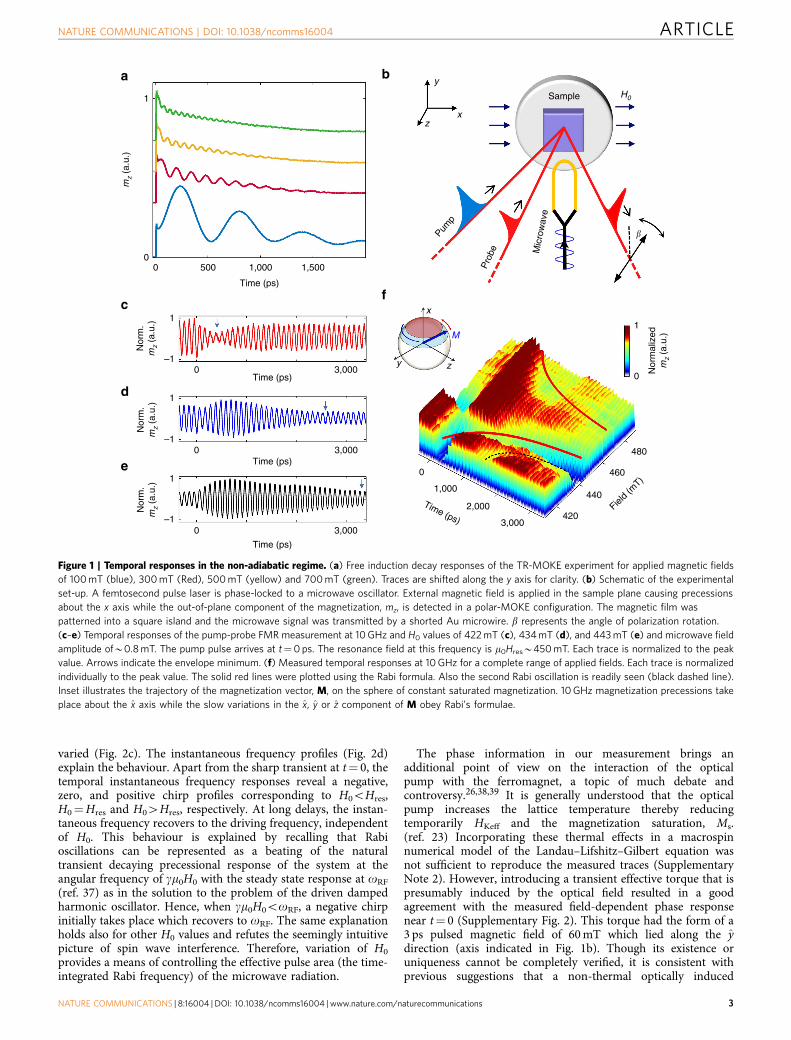
varied (Fig. 2c). The instantaneous frequency profiles (Fig. 2d)explain the behaviour. Apart from the sharp transient at t¼ 0, thetemporal instantaneous frequency responses reveal a negative,zero, and positive chirp profiles corresponding to H0oHres,H0¼Hres and H04Hres, respectively. At long delays, the instan-taneous frequency recovers to the driving frequency, independentof H0. This behaviour is explained by recalling that Rabioscillations can be represented as a beating of the naturaltransient decaying precessional response of the system at theangular frequency of gm0H0 with the steady state response at oRF
(ref. 37) as in the solution to the problem of the driven dampedharmonic oscillator. Hence, when gm0H0ooRF, a negative chirpinitially takes place which recovers to oRF. The same explanationholds also for other H0 values and refutes the seemingly intuitivepicture of spin wave interference. Therefore, variation of H0
provides a means of controlling the effective pulse area (the time-integrated Rabi frequency) of the microwave radiation.
The phase information in our measurement brings anadditional point of view on the interaction of the opticalpump with the ferromagnet, a topic of much debate andcontroversy.26,38,39 It is generally understood that the opticalpump increases the lattice temperature thereby reducingtemporarily HKeff and the magnetization saturation, Ms.(ref. 23) Incorporating these thermal effects in a macrospinnumerical model of the Landau–Lifshitz–Gilbert equation wasnot sufficient to reproduce the measured traces (SupplementaryNote 2). However, introducing a transient effective torque that ispresumably induced by the optical field resulted in a goodagreement with the measured field-dependent phase responsenear t¼ 0 (Supplementary Fig. 2). This torque had the form of a3 ps pulsed magnetic field of 60 mT which lied along the ydirection (axis indicated in Fig. 1b). Though its existence oruniqueness cannot be completely verified, it is consistent withprevious suggestions that a non-thermal optically induced
1 Sample
�
H0
y
zx
y z
M
x
mz
(a.u
.)
Nor
m.
mz
(a.u
.)
Nor
mal
ized
mz
(a.u
.)
00
0–1
11
0
Nor
m.
mz
(a.u
.)
–1
1
Nor
m.
mz
(a.u
.)
–1
1
500 1,000 1,500
Pump
Pro
be Mic
row
ave
3,000
Time (ps)
Time (ps)
0 3,000
0
1,000
Time (ps)Fiel
d (mT)
2,000
3,000420
440
460
480Time (ps)
0 3,000
Time (ps)
a b
c
d
e
f
Figure 1 | Temporal responses in the non-adiabatic regime. (a) Free induction decay responses of the TR-MOKE experiment for applied magnetic fields
of 100 mT (blue), 300 mT (Red), 500 mT (yellow) and 700 mT (green). Traces are shifted along the y axis for clarity. (b) Schematic of the experimental
set-up. A femtosecond pulse laser is phase-locked to a microwave oscillator. External magnetic field is applied in the sample plane causing precessions
about the x axis while the out-of-plane component of the magnetization, mz, is detected in a polar-MOKE configuration. The magnetic film was
patterned into a square island and the microwave signal was transmitted by a shorted Au microwire. b represents the angle of polarization rotation.
(c–e) Temporal responses of the pump-probe FMR measurement at 10 GHz and H0 values of 422 mT (c), 434 mT (d), and 443 mT (e) and microwave field
amplitude ofB0.8 mT. The pump pulse arrives at t¼0 ps. The resonance field at this frequency is m0HresB450 mT. Each trace is normalized to the peak
value. Arrows indicate the envelope minimum. (f) Measured temporal responses at 10 GHz for a complete range of applied fields. Each trace is normalized
individually to the peak value. The solid red lines were plotted using the Rabi formula. Also the second Rabi oscillation is readily seen (black dashed line).
Inset illustrates the trajectory of the magnetization vector, M, on the sphere of constant saturated magnetization. 10 GHz magnetization precessions take
place about the x axis while the slow variations in the x, y or z component of M obey Rabi’s formulae.
NATURE COMMUNICATIONS | DOI: 10.1038/ncomms16004 ARTICLE
NATURE COMMUNICATIONS | 8:16004 | DOI: 10.1038/ncomms16004 | www.nature.com/naturecommunications 3

480
460
Fie
ld (
mT
)
Fie
ld (
mT
)440
420
475 � ~ �
450
425
–300 –200 –100 2,200 2,300 2,400
Fie
ld (
mT
)
Inst
anta
neou
sfr
eque
ncy
(GH
z)475
450
425
0
0
1,000
1,000
2,000
2,000
3,000
3,000
Time (ps)
Time (ps) Time (ps) Time (ps)
1
0
–1
Nor
mal
ized
mz
(a.u
.)
Nor
mal
ized
mz
(a.u
.)1
0
–1
mz
(a.u
.)
1
10
9.5
9
�RF
��0H0
Sum
0
–1
� > 2�
a
b c d
Figure 2 | Phase response. (a) Dependence of the phase responses on the applied field at 10 GHz. Data set of Fig. 1f is presented in a two-dimensional
contour plot to represent the phase information. Each temporal response was normalized individually. Blue curved guiding line indicates the location of the
valley in Fig. 1f. (b) Phase response before the perturbation. The figure presents a close-up of the black dashed area of a for times between � 300 and
� 100 ps. An overall phase shift of B0.75p is measured across the resonance as indicated by the vertical black dashed lines representing the phase front
at highest and lowest applied fields. Data are not normalized. (c) Phase response at long delays corresponding to black dashed area in a for times between
2,200 and 2,400 ps. Data are presented in normalized units. The measured net phase shift across the resonance is B2.75p. Black dashed lines represent
the phase front at highest and lowest applied fields. (d) Instantaneous frequency profiles at m0H0 values of 424 mT (blue), 444 mT (red) and 468 mT
(yellow) corresponding the blue, red and yellow dashed lines of a, respectively. Inset illustrates the decomposition of the total response to the steady state
response of the system at oRF and the natural response at the angular frequency of gm0H0. The same reasoning also accounts for the asymmetry seen in
the responses of Fig. 1f.
0.5
–0.5
0 1,000500 1,500
Time (ps)
Nor
mal
ized
mz
(a.u
.) 0.5
–0.5
0 1,000500 1,500
Time (ps)
Nor
mal
ized
mz
(a.u
.)
0.5
–0.5
0 1,000500 1,500
Time (ps)
Nor
mal
ized
mz
(a.u
.) 0.5
–0.5
0 1,000500 1,500
Time (ps)
Nor
mal
ized
mz
(a.u
.)
0.5
–0.5
0 1,000500 1,500
Time (ps)
Nor
mal
ized
mz
(a.u
.) 0.5
–0.5
0 1,000500 1,500
Time (ps)
Nor
mal
ized
mz
(a.u
.)
a
b
c
d
e
f
Figure 3 | Microwave power dependence of the Rabi frequency. (a–c) Temporal responses for the CoFeB sample for microwave field amplitudes of 7.5 mT
(a), 1.3 mT (b) and 0.25 mT (c). Responses were measured at a frequency of 10 GHz and m0H0¼446 mT. The envelopes (red dashed lines) exhibit a similar
temporal form independent of the microwave amplitude. (d–f) Temporal responses of a 4 nm-thick molecular beam epitaxy (MBE) grown single-crystal Fe
sample at microwave field amplitudes of 7.5 mT (d), 4.7 mT (e) and 2.3 mT (f). Responses were measured at a frequency of 12 GHz and m0H0¼ 143 mT. In
contrast to the sputter deposited CoFeB film, the envelope exhibits a clear dependence on the microwave amplitude. Measurements in a–f were carried out
at the resonance conditions. Guiding dashed lines indicate the envelopes.
ARTICLE NATURE COMMUNICATIONS | DOI: 10.1038/ncomms16004
4 NATURE COMMUNICATIONS | 8:16004 | DOI: 10.1038/ncomms16004 | www.nature.com/naturecommunications

magnetic field may exist38. Possible sources for such fieldinclude demagnetization and anisotropy change inducedfield40,41, photo-induced anisotropy42, the inverse Faradayeffect42–45, as well as magnetic circular dichroism46 and arefurther discussed in Supplementary Note 3. It is possible that atlower optical pump intensities the Landau–Lifshitz–Gilbertequation may solely account for the experimental results.Furthermore, it is worth noting that although our macrospinmodel lacks spatial resolution, it reproduces the experimentalresults. Hence, spin waves are not included in the calculation andcannot account for our experimental observations.
Microwave amplitude dependent Rabi oscillations. Anothermeans of controlling the effective pulse area is by modifying theamplitude of the microwave field. This effect is most readilyseen under resonance conditions for which the generalized Rabifrequency simplifies to Or¼ gm0hRF. The measured results areshown in Fig. 3a–c. Surprisingly, no dependence of the envelope onthe microwave amplitude is revealed. This apparent discrepancy isresolved by considering the contributions to equation (1). Themaximal applied microwave field amplitude was m0hRFB7.5 mTwhile the inhomogeneous linewidth broadening at 10 GHz, as
derived from the value of DHKeff (ref. 33), is 10.5 mT meaning thatthe off-resonant detuning term in equation (1) is dominating theresponse regardless of the microwave power. When the measure-ment was repeated on a single-crystal Fe sample which wasepitaxially grown and hence exhibited a vanishingly smallinhomogeneous broadening, the predicted increase in the Rabifrequency according to Rabi’s formula was verified (Fig. 3d–f).
Resonant spin amplification. Next, we turn to show that thetrain of optical pulses can be utilized to lock the phases of thespins constituting the ensemble by the process of resonant spinamplification19,31. This mode of operation requires thatcoherence persist for a duration longer than the laser repetitiontime, TR (Fig. 4a). As follows from Gilbert’s theory for damping,the rate of transfer of spin angular momentum to the lattice,1/tint, can be controlled by the magnitude of H0 (ref. 33).Accordingly, interference effects between subsequent responsesare expected at low H0 values. The nature of the interferencewill then depend on the relative phase, F, between the opticalpump pulse and the microwave signal (Fig. 4a).
Measured responses as a function of F are presented inFig. 4b–e. At high magnetic field (m0H0¼ 450 mT) and short tint
0.5
–0.5
0 1,000 2,000
Time (ps)
Time
–0.5
270
180
90
0
0.5 1
�rf �
�rf�
0
Nor
mal
ized
mz
(a.u
.)
0.5
–0.5
0 1,000 2,000
Time (ps)
Nor
mal
ized
mz
(a.u
.)
Pha
se (
degr
ee)
0.5
–0.5
0
0
1,000
1,500
2,000
3,000
Time (ps)
Time (ps)Nor
mal
ized
mz
(a.u
.)
Microwave
Magnetizationresponse
Opticalsignals
Pump
� �
Pump
Probe Probe
TR
mz (a.u.)
a
b
c
d
ef
g
Figure 4 | Microwave spin-subgroup selection and resonant spin amplification. (a) Schematic arrangement of the signals in time. (b–d) Dependence of
the temporal response on the relative phase between the optical pump pulse and the microwave signal, F, for short intrinsic lifetime, tint. Data presented
for a frequency of 10 GHz and m0H0¼450 mT and relative phases of 0� (b), 90� (c) and 180� (d). Variation of F has no effect on the envelope; the carrier
signal shifts within the same envelope. (e) Dependence of temporal response on F for long intrinsic lifetime, tint. Data is presented for a frequency of 1 GHz
and m0H0¼ 90 mT. For F¼90�, constructive interference results in a sharp pulsation of the magnetization. Likewise, for additional 180�, at F¼ 270�,
pulsations of opposite polarity are generated. When the phase is tuned to F¼0� and F¼ 180�, destructive interference takes place and no pulsations are
observed. (f) Illustration of the inhomogeneous broadening at 10 GHz corresponding to b–d. (g) Illustration of the inhomogeneous broadening at 1 GHz
corresponding to e. In f,g, blue solid line indicates the total effective resonance line which includes contributions of the inhomogeneous broadening. Blue
shaded resonances indicate the subgroups that are selected by the microwave. Red solid lines indicate the subgroups that are not interacting with the
microwave signal. Data are shown for the CoFeB sample. The linewidths presented were determined from the experimental data.
NATURE COMMUNICATIONS | DOI: 10.1038/ncomms16004 ARTICLE
NATURE COMMUNICATIONS | 8:16004 | DOI: 10.1038/ncomms16004 | www.nature.com/naturecommunications 5

(B 1.1 ns) compared to TR of 12.5 ns, the interaction of eachpump pulse within the train of pulses can be regarded as anisolated event (Fig. 4b–d). In contrast, for low external magneticfields (m0H0¼ 90 mT) and correspondingly long tint (B5 ns),interference occurs and the moment at which the opticalpulse is sent becomes critical (Fig. 4e). The observed pulsationsof the magnetization indicate that the spins within theensemble have become synchronized, that is, mode-locking takesplace32.
In addition to the intrinsic relaxation, the decay of the transientresponse is governed also by dephasing of the inhomogeneouslybroadened ensemble so that the effective decay time of the response,teff, is given by: 1/teff¼ 1/tintþ 1/tIH where tIH represents theensemble dephasing33. While a fundamentally different dependenceon F is observed in the two regimes of Fig. 4b–e, the inhomogeneousbroadening causes teff to be very similar in both cases andcorresponds toB0.51 andB0.49 ns, respectively. This fact showsthat the long intrinsic relaxation time, tint, in the case of low H0
(Fig. 4e) can be sensed despite the significant ensemble dephasing. Byuse of the relations Doint¼ 2/tint and DoIH¼ 2/tIH for the intrinsicresonance linewidth and inhomogeneous broadening, respectively,DointE1.75 rad GHz and DoIHE2.15 rad GHz were extractedfor m0H0¼ 450 mT, while DointE0.43 rad GHz andDoIHE3.66 rad GHz were found for m0H0¼ 90 mT (Fig. 4f,g). Incontrast to the high H0 case, at low H0 only a subset of spins whichexhibit long tint are interacting while the interaction with the off-resonant spins is suppressed, namely, the microwave inducescoherence in the ensemble. Hence, the inhomogeneity is effectivelyovercome and teff extends towards its upper limit of tint that describethe individual spins (see Supplementary Note 4 for moreinformation).
Conclusions. In summary, in this work we report the non-adiabatic regime in dense ferromagnetic metals using a pump-probe FMR type measurement. Extensions of the present workwill have wide applicability to the exploration of more complexcoherent phenomena in ferromagnets such as Ramsey inter-ference, self-induced transparency, Hahn spin echo and slow lightapplications with magnetostatic waves, and of more complexmagnetic systems such as magnetic systems with multiple com-ponents. In particular, the reported observations allow to makethe connection between concepts that are used in quantuminformation processing and apply them on the atomically engi-neered ferromagnetic systems. For example, the electromagneticradiation required to manipulate the magnetic moments in thenon-adiabatic interaction can be replaced by spin-transfer torquefrom spin currents generated by the spin Hall effect to causesimilar precessions. In such case Rabi nutations are made possiblewithout the complications of a driving electromagnetic field.
MethodsSample preparation. The CoFeB film was prepared on thermally oxidized Si(100)substrate and consisted of the following structure, starting from the substrate side:SiO2 (250)/Ta (100)/CoFeB (11)/MgO (11)/Ta (30) (numbers are in nominalthicknesses in angstroms). The MgO layer was deposited by RF sputtering.The sample was annealed at a temperature of 275 �C for 30 min while applyinga 1 T field in the out-of-plane direction. The polycrystalline CoFeB thin filmhas a body centred cubic crystal structure that is highly non-textured. Theinterfaces and boundaries of the crystallites naturally further reduce thesymmetries. In-plane and out-of-plane magnetization loops are shown inSupplementary Fig. 5. The single crystalline 40 Å-thick Fe film was grown on aMgO(100) substrate using molecular beam epitaxy.
For the pump-probe FMR measurement the samples were patterned to amagnetic island of 20� 20 mm2 using electron-beam lithography. A shorted Aumicrowire was having lateral dimensions of 5� 20mm2 and a thickness of 100 nmwas patterned at a distance of 1 mm away from the island by lift-off to drive themicrowave signal.
Ferromagnetic resonance pump-probe measurement. A Ti:Sapphire oscillatoremitting B70 fs linearly polarized pulses at 800 nm having energy of B5 nJ perpulse was used for the optical measurements. The beam was focused to a spot sizeof B10 mm. The pump beam was applied at an incident angle of B22� measuredfrom the normal to the sample plane. The probe pulses were attenuated by20 dB relative to the pump. The timing jitter between the optical pump and themicrowave signal was measured to be smaller than 1 ps. All measurements werecarried out at room temperature. The maximum microwave power applied was1 W and corresponded to an amplitude of B7.5 mT.
In the pump-probe FMR measurements, a double lock-in detection scheme wasused for which the microwave signal was modulated at 50 KHz and the optical probeat 1 KHz. To exert sufficient torque by the optical pump, the external magnetic fieldwas applied at an angle of 4� away from the sample plane. The same arrangementwas used also in the TR-MOKE measurements. The dimensions of the Au microwirewere 5� 20mm2 while its thickness was 100 nm. The signal was launched into themicrowire from a 50 ohm microstrip. Care was taken that the bonding to themicrowire was significantly shorter than the quarter radio frequency (RF) wavelengthso that the microwire can be considered as a lumped short circuit element which inprinciple reflects all energy besides the radiation losses. To verify our considerationsthe microwire was simulated using the high frequency structural simulator.
FMR measurement without the presence of the optical pump were carried outalso at other RF powers. A heating effect would have changed the magnetizationsaturation, Ms, which in turn would have modified HKeff. From these measuredresponses we could not identify any heating effects. The reflected energy wasabsorbed in the third port of a microwave isolator which indeed heated up to someextent.
Extraction of decay times from TR-MOKE measurements. Extraction of theensemble dephasing times and the intrinsic spin relaxation times from TR-MOKEmeasurements was based on the analysis presented in ref. 31. Accordingly, a andDHKeff were obtained by fitting the measured effective linewidths, Doeff, with theequation:
Doeff ¼ agm0 2H0 �HKeffð Þþ gH0
2ffiffiffiffiffiffiffiffiffiffiffiffiffiffiffiffiffiffiffiffiffiffiffiffiffiffiffiH2
0 �H0HKeff
p m0DHKeff for H04HKeff
Doeff ¼ agm0H02HKeff
H0� H0
HKeff
� �þ gHKeffffiffiffiffiffiffiffiffiffiffiffiffiffiffiffiffiffiffiffiffiffi
H2Keff �H2
0
p m0DHKeff for H0oHKeff
ð2Þ
Here, Doeff¼ 2/teff, and teff is the overall decay time of the precessional motion asmeasured in the TR-MOKE experiment. This analysis is valid for H0 much largeror much smaller than HKeff. The first terms of the equation represent the intrinsiclinewidth Doint while the second terms represent the inhomogeneous broadeningDoIH. For H0BHKeff, as in the case where m0H0¼ 90 mT, tint and tIH wereextracted numerically33.
Data availability. The data that support the findings of this study are availablefrom the corresponding author on request.
References1. Fuchs, G. D., Dobrovitski, V. V., Toyli, D. M., Heremans, F. J. & Awschalom, D. D.
Gigahertz dynamics of a strongly driven single quantum spin. Science 326,1520–1522 (2009).
2. Neumann, P. et al. Quantum register based on coupled electron spins in aroom-temperature solid. Nat. Phys. 6, 249–253 (2010).
3. Chekhovich, E. A. et al. Nuclear spin effects in semiconductor quantum dots.Nat. Mater. 12, 494–504 (2013).
4. Christle, D. J. et al. Isolated electron spins in silicon carbide with millisecondcoherence times. Nat. Mater. 14, 160–163 (2015).
5. Yale, C. G. et al. Optical manipulation of the Berry phase in a solid-state spinqubit. Nat. Photon. 10, 184–189 (2016).
6. Leggett, A. J. et al. Dynamics of the dissipative two-state system. Rev. Mod.Phys. 59, 1–85 (1987).
7. Bishop, D. J. & Reppy, J. D. Study of the superfluid transition intwo-dimensional 4 He films. Phys. Rev. Lett. 40, 1727–1730 (1978).
8. Desbuquois, R. et al. Superfluid behaviour of a two-dimensional Bose gas.Nat. Phys. 8, 645–648 (2012).
9. Clarke, J., Cleland, A. N., Devoret, M. H., Esteve, D. & Martinis, J. M. Quantummechanics of a macroscopic variable: the phase difference of a josephsonjunction. Science 239, 992–997 (1988).
10. Berkley, A. J. et al. Entangled macroscopic quantum states in twosuperconducting qubits. Science 300, 1548–1550 (2003).
11. Anderson, M. H., Ensher, J. R., Matthews, M. R., Wieman, C. E. & Cornell, E. A.Observation of bose-einstein condensation in a dilute atomic vapor. Science 269,198–201 (1995).
12. Bloch, I., Hansch, T. W. & Esslinger, T. Measurement of the spatial coherenceof a trapped Bose gas at the phase transition. Nature 403, 166–170 (2000).
ARTICLE NATURE COMMUNICATIONS | DOI: 10.1038/ncomms16004
6 NATURE COMMUNICATIONS | 8:16004 | DOI: 10.1038/ncomms16004 | www.nature.com/naturecommunications
13. Hancox, C. I., Doret, S. C., Hummon, M. T., Luo, L. & Doyle, J. M. Magnetictrapping of rare-earth atoms at millikelvin temperatures. Nature 431, 281–284(2004).
14. Awschalom, D. D., Divincenzo, D. P. & Smyth, J. F. Macroscopic quantumeffects in nanometer-scale magnets. Science 258, 414–421 (1992).
15. Kleff, S., Delft, J. v., Deshmukh, M. M. & Ralph, D. C. Model for ferromagneticnanograins with discrete electronic states. Phys. Rev. B 64, 220401 (2001).
16. Deshmukh, M. M. et al. Magnetic anisotropy variations and nonequilibriumtunneling in a cobalt nanoparticle. Phys. Rev. Lett. 87, 226801 (2001).
17. Abragam, A. The Principles of Nuclear Magnetism (Clarendon Press, 1961).18. Kikkawa, J. M., Smorchkova, I. P., Samarth, N. & Awschalom, D. D.
Room-temperature spin memory in two-dimensional electron gases. Science277, 1284–1287 (1997).
19. Kikkawa, J. M. & Awschalom, D. D. Lateral drag of spin coherence in galliumarsenide. Nature 397, 139–141 (1999).
20. Schoen, M. A. W. et al. Ultra-low magnetic damping of a metallic ferromagnet.Nat. Phys. 12, 839–842 (2016).
21. Kalarickal, S. S. et al. Ferromagnetic resonance linewidth in metallic thin films:comparison of measurement methods. J. Appl. Phys. 99, 093909 (2006).
22. Beaujour, J. M., Ravelosona, D., Tudosa, I., Fullerton, E. E. & Kent, A. D.Ferromagnetic resonance linewidth in ultrathin films with perpendicularmagnetic anisotropy. Phys. Rev. B 80, 180415 (2009).
23. Beaurepaire, E., Merle, J. C., Daunois, A. & Bigot, J. Y. Ultrafast spin dynamicsin ferromagnetic nickel. Phys. Rev. Lett. 76, 4250–4253 (1996).
24. Koopmans, B., van Kampen, M., Kohlhepp, J. T. & de Jonge, W. J. M. Ultrafastmagneto-optics in nickel: magnetism or optics? Phys. Rev. Lett. 85, 844–847(2000).
25. Bigot, J.-Y., Vomir, M. & Beaurepaire, E. Coherent ultrafast magnetism inducedby femtosecond laser pulses. Nat. Phys. 5, 515–520 (2009).
26. Koopmans, B. et al. Explaining the paradoxical diversity of ultrafastlaser-induced demagnetization. Nat. Mater. 9, 259–265 (2010).
27. Rudolf, D. et al. Ultrafast magnetization enhancement in metallic multilayersdriven by superdiffusive spin current. Nat. Commun. 3, 1037 (2012).
28. Griffiths, D. J. Introduction to Quantum Mechanics 2nd edn (Pearson PrenticeHall, 2005).
29. Gilbert, T. L. A phenomenological theory of damping in ferromagneticmaterials. IEEE Trans. Magn. 40, 3443–3449 (2004).
30. Hanson, R., Dobrovitski, V. V., Feiguin, A. E., Gywat, O. & Awschalom, D. D.Coherent dynamics of a single spin interacting with an adjustable spin bath.Science 320, 352–355 (2008).
31. Kikkawa, J. M. & Awschalom, D. D. Resonant spin amplification in n-typeGaAs. Phys. Rev. Lett. 80, 4313–4316 (1998).
32. Greilich, A. et al. Mode locking of electron spin coherences in singly chargedquantum dots. Science 313, 341–345 (2006).
33. Capua, A., Yang, S.-H., Phung, T. & Parkin, S. S. P. Determination of intrinsicdamping of perpendicularly magnetized ultrathin films from time-resolvedprecessional magnetization measurements. Phys. Rev. B 92, 224402 (2015).
34. Bloch, F. Nuclear induction. Phys. Rev. 70, 460–474 (1946).35. Atxitia, U. & Chubykalo-Fesenko, O. Ultrafast magnetization dynamics rates
within the Landau-Lifshitz-Bloch model. Phys. Rev. B 84, 144414 (2011).36. Capua, A. et al. Coherent control in a semiconductor optical amplifier
operating at room temperature. Nat. Commun. 5, 5025 (2014).37. Torrey, H. C. Transient nutations in nuclear magnetic resonance. Phys. Rev. 76,
1059–1068 (1949).38. Kirilyuk, A., Kimel, A. V. & Rasing, T. Ultrafast optical manipulation of
magnetic order. Rev. Mod. Phys. 82, 2731–2784 (2010).39. Zhang, G. P., Latta, T., Babyak, Z., Bai, Y. H. & George, T. F. All-optical spin
switching: a new frontier in femtomagnetism—A short review and a simpletheory. Mod. Phys. Lett. B 30, 16300052 (2016).
40. van Kampen, M. et al. All-optical probe of coherent spin waves. Phys. Rev. Lett.88, 227201 (2002).
41. Bigot, J. Y., Vomir, M., Andrade, L. H. F. & Beaurepaire, E. Ultrafastmagnetization dynamics in ferromagnetic cobalt: the role of the anisotropy.Chem. Phys. 318, 137–146 (2005).
42. Hansteen, F., Kimel, A., Kirilyuk, A. & Rasing, T. Nonthermal ultrafastoptical control of the magnetization in garnet films. Phys. Rev. B 73, 014421(2006).
43. Kimel, A. V. et al. Ultrafast non-thermal control of magnetization byinstantaneous photomagnetic pulses. Nature 435, 655–657 (2005).
44. Stanciu, C. D. et al. All-optical magnetic recording with circularly polarizedlight. Phys. Rev. Lett. 99, 047601 (2007).
45. Cornelissen, T. D., Cordoba, R. & Koopmans, B. Microscopic model for alloptical switching in ferromagnets. Appl. Phys. Lett. 108, 142405 (2016).
46. Khorsand, A. R. et al. Role of magnetic circular dichroism in all-opticalmagnetic recording. Phys. Rev. Lett. 108, 127205 (2012).
AcknowledgementsWe thank Dr Dan Rugar, Dr Chris Lutz and Dr John Mamin for fruitful discussions, andChris Lada for expert technical assistance. A.C. thanks the Viterbi Foundation and theFeder Family Foundation for supporting this research.
Author contributionsA.C. conceived the experiments and carried them out. S.-H.Y. grew the samples. C.R.patterned the devices. A.C., S.-H.Y., T.P., C.R. and S.S.P.P. analysed the data and co-wrote the paper.
Additional informationSupplementary Information accompanies this paper at http://www.nature.com/naturecommunications
Competing interests: The authors declare no competing financial interests.
Reprints and permission information is available online at http://npg.nature.com/reprintsandpermissions/
How to cite this article: Capua, A. et al. Ensemble-averaged Rabi oscillations in aferromagnetic CoFeB film. Nat. Commun. 8, 16004 doi: 10.1038/ncomms16004(2017).
Publisher’s note: Springer Nature remains neutral with regard to jurisdictional claims inpublished maps and institutional affiliations.
Open Access This article is licensed under a Creative CommonsAttribution 4.0 International License, which permits use, sharing,
adaptation, distribution and reproduction in any medium or format, as long as you giveappropriate credit to the original author(s) and the source, provide a link to the CreativeCommons license, and indicate if changes were made. The images or other third partymaterial in this article are included in the article’s Creative Commons license, unlessindicated otherwise in a credit line to the material. If material is not included in thearticle’s Creative Commons license and your intended use is not permitted by statutoryregulation or exceeds the permitted use, you will need to obtain permission directly fromthe copyright holder. To view a copy of this license, visit http://creativecommons.org/licenses/by/4.0/
r The Author(s) 2017
NATURE COMMUNICATIONS | DOI: 10.1038/ncomms16004 ARTICLE
NATURE COMMUNICATIONS | 8:16004 | DOI: 10.1038/ncomms16004 | www.nature.com/naturecommunications 7