Bloomington Faculty Council Enrollment Update October 6, 2009

Cheltenham School District Enrollment Projections
2018-19 Update
Prepared by the Montgomery County Planning Commission
March 5, 2019

This page intentionally left blank

Cheltenham School District Enrollment Projections
2018-19 Update
Prepared By The Montgomery County Planning Commission
March 5, 2019
This report is the first complete update to the original Enrollment Study prepared in November, 2016. It represents a supplement to
the original study, but incorporates new data where available and recalibrates the projec#on model to best reflect the most recent
trends and expected demographic ac#vity affec#ng future enrollments

Board of School Directors
Julie Haywood, President Joel I. Fishbein, Vice President
David L. Cohen William England Pamela Henry
Jean McWilliams Christopher A. Pender Sr.
Daniel Schultz Kate Thomson
Superintendent Dr. Wagner Marseille

Table of Contents
Introduction ........................................................................................................................................................................ 1
School District Characteristics Population ............................................................................................................................................................ 3
Birth Patterns ...................................................................................................................................................... 5
School District Enrollment .............................................................................................................................. 6
Private/Charter School Enrollment ............................................................................................................... 8
Housing Activity Impacts of Housing on Enrollment .............................................................................................................. 11
Housing Units Built ......................................................................................................................................... 15
Housing Units Proposed ................................................................................................................................ 17
Housing Sales .................................................................................................................................................... 19
District Enrollment Projections Cohort Progression Model ........................................................................................................................... 21
Projected Enrollment Summaries ................................................................................................................ 22
Conclusion ........................................................................................................................................................................... 25
Appendix: Elementary School Profiles ........................................................................................... 27

Cheltenham School District Enrollment Projec�ons, 2018-19 Update
1
Introduction
The Cheltenham School District experienced a period of steady growth beginning in 2009, with enrollment peaking in 2016 at 4,618 students.
In the Fall of 2016, MCPC conducted its original enrollment study and projected continued growth of 391 students over ten years from 2016
to 2026. The original study identified several factors driving that historical and potential growth. These included an increase in the number
of public school students coming from existing multifamily apartments, a significant rebound in housing sales activity that was resulting in
more students from household turnover, and proximity to Philadelphia. These factors spoke to the situation that Cheltenham experienced a
lot of growth due to their quality, diversity of housing options, and location next to an urban school district with a complicated reputation.
After two years from the original study, the results show a change in the enrollment trajectory of the district. The original projection did
show a slight decrease in the first year, but predicted steady growth beyond until 2026. In reality, the Cheltenham School District has seen a
decrease in enrollment of 340 students since the original study. Some potential reasons for the sudden shift could be an increase in private
school enrollment, aging facilities, and increased residency enforcement. Also, existing multifamily student population decreased by over
18% since 2015 and up until that point it had been steadily growing.
MCPC has now prepared another complete update utilizing the most recent enrollment data (2017-18 and 2018-19) and updated data for all
research factors. Due to the relatively stark change in the enrollment dynamic of the district, this report will outline three options for the
district to consider. Option 1 and 2 share the same flat birth scenario and make no adjustment for future growth due to housing construction.
The singular difference is in the progression rate—Option 1 takes into account the last five years of enrollment, while Option 2 takes the last
three years. Option 3 increases births each year by a factor of two and also accounts for growth due to housing construction. The reason for
including all three options instead of updating the originally preferred, is to help the district see as many potential futures given the relative
uncertainty of whether the last two years are the beginning of a longer trend or a temporary situation.
PART 1—SCHOOL DISTRICT
CHARACTERISTICS

Cheltenham School District Enrollment Projec�ons, 2018-19 Update
3
FIGURE 1: Population of Cheltenham School District, 1980-2020
Source: U.S. Census Bureau, except 2020 Projections (DVRPC and MCPC)
1990 2000 2010 2020 (Forecasted)
Total
1980-1990
Change
1980-1990
Percent Total
1990-2000
Change
1990-2000
Percent Total
2000-2010
Change
2000-2010
Percent Total
2010-2020
Change
2010-2020
Percent
CSD 34,923 -586 -1.7% 36,875 1,952 5.6% 36,793 -82 -0.2% 37,512 719 2.0%
Montgomery County 678,111 34,740 5.4% 748,987 70,876 10.5% 799,874 50,887 6.8% 840,934 41,060 5.1%
FIGURE 2: Population Totals, 1990-2020
Source: U.S. Census Bureau, except 2020 Forecasts (DVRPC and MCPC)
• Population in the CSD had been declining for
several decades due to shrinking household sizes
and slow growth typical of inner ring suburbs,
however in 2000 it grew significantly before
slightly dipping in 2010.
• The forecast for 2020 calls for growth of 2% from
2010. Estimates through 2017 show that the
District has grown and is on track to reach its
projection.
• However, total population does not necessarily
correlate with school-age population and public
enrollment. Up until recently, enrollment had
grown in the past decade despite variability in the
population.
1A. School District Characteris�cs—Popula�on
33,500
34,000
34,500
35,000
35,500
36,000
36,500
37,000
37,500
38,000
1980 1990 2000 2010 2020 (projected)
Cheltenham School District Enrollment Projec�ons, 2018-19 Update
4
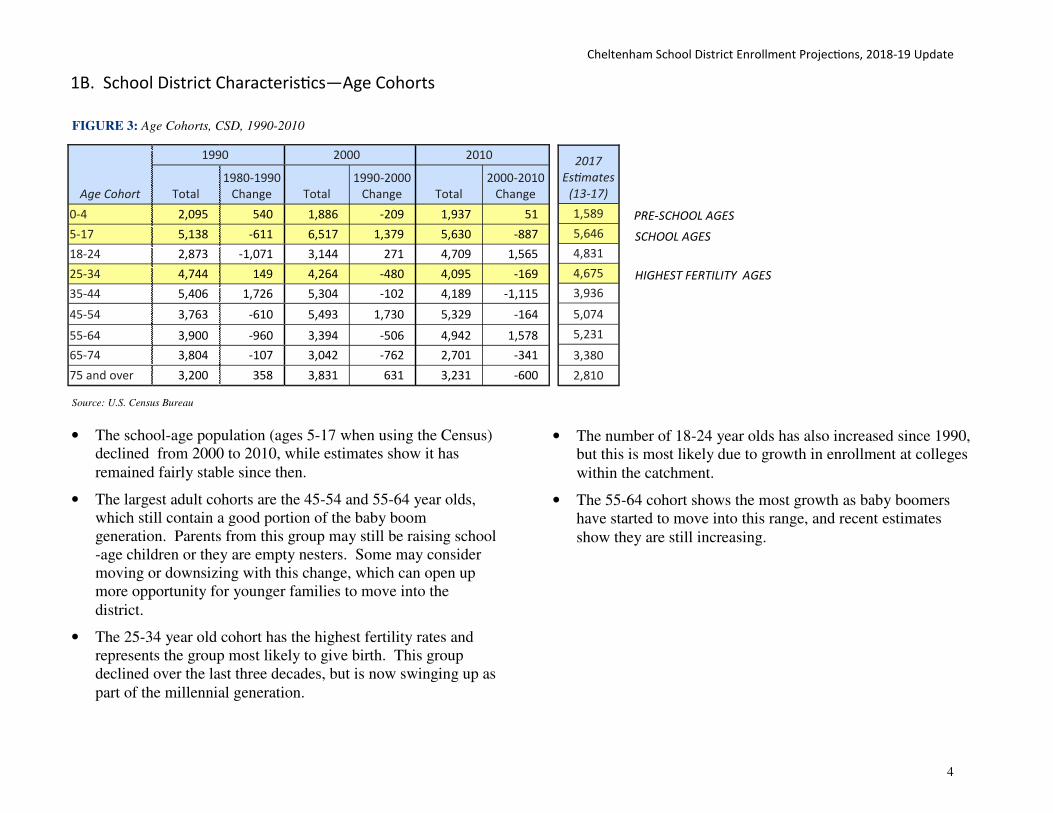
1B. School District Characteris�cs—Age Cohorts
• The school-age population (ages 5-17 when using the Census)
declined from 2000 to 2010, while estimates show it has
remained fairly stable since then.
• The largest adult cohorts are the 45-54 and 55-64 year olds,
which still contain a good portion of the baby boom
generation. Parents from this group may still be raising school
-age children or they are empty nesters. Some may consider
moving or downsizing with this change, which can open up
more opportunity for younger families to move into the
district.
• The 25-34 year old cohort has the highest fertility rates and
represents the group most likely to give birth. This group
declined over the last three decades, but is now swinging up as
part of the millennial generation.
• The number of 18-24 year olds has also increased since 1990,
but this is most likely due to growth in enrollment at colleges
within the catchment.
• The 55-64 cohort shows the most growth as baby boomers
have started to move into this range, and recent estimates
show they are still increasing.
Age Cohort
2000 2010
Total
1980-1990
Change Total
1990-2000
Change Total
2000-2010
Change
0-4 2,095 540 1,886 -209 1,937 51
5-17 5,138 -611 6,517 1,379 5,630 -887
18-24 2,873 -1,071 3,144 271 4,709 1,565
25-34 4,744 149 4,264 -480 4,095 -169
35-44 5,406 1,726 5,304 -102 4,189 -1,115
45-54 3,763 -610 5,493 1,730 5,329 -164
55-64 3,900 -960 3,394 -506 4,942 1,578
65-74 3,804 -107 3,042 -762 2,701 -341
75 and over 3,200 358 3,831 631 3,231 -600
1990
FIGURE 3: Age Cohorts, CSD, 1990-2010
Source: U.S. Census Bureau
PRE-SCHOOL AGES
SCHOOL AGES
HIGHEST FERTILITY AGES
2017
Es#mates
(13-17)
1,589
5,646
4,831
4,675
3,936
5,074
5,231
3,380
2,810

Cheltenham School District Enrollment Projec�ons, 2018-19 Update
5
1C. School District Characteris�cs—Birth Pa2erns
Source: Pennsylvania Department of Health
FIGURE 4: Number of Live Births in Cheltenham SD by School Calendar Year (Sept.-Aug.) FIGURE 5: Number of Live Births in
CSD by School Calendar Year (Sept.-
Aug.)
Source: Pennsylvania Department of Health
School Year CSD
2000-01 405
2001-02 371
2002-03 366
2003-04 373
2004-05 380
2005-06 408
2006-07 372
2007-08 344
2008-09 380
2009-10 305
2010-11 336
2011-12 336
2012-13 340
2013-14 331
1997-98 369
1998-99 370
1999-00 375
2014-15 374
2015-16 337
2016-17 352
FIGURE 6: Montgomery County Live Births, Annually
• Birth activity provides a window into
the potential size of kindergarten classes
six years later.
• Birth activity has declined slightly over
time in the CSD, but at a much slower
rate than most area districts and the
county as a whole (Fig. 6).
• Recent birth data shows an increase in
2016-17 and the average over the last
four years is greater than the preceding
four year period.
• All district birth data has been
calculated to match the school calendar
year (Sept.—Aug.) for greater
correlation accuracy.
8,200
8,400
8,600
8,800
9,000
9,200
9,400
9,600
0
50
100
150
200
250
300
350
400
450

Cheltenham School District Enrollment Projec�ons, 2018-19 Update
6
1D. School District Characteris�cs—Enrollment History
FIGURE 7: School District Enrollment by Grade Divisions, 2009-2018
Source: Cheltenham School District (enrollment as of the 1st day of October each school year)
Source: Cheltenham School District (enrollment as of the 1st day of October each school year)
Year
Total
K-12
Number Change
from Previous Year
Percent Change
from Previous Year
2009-10 4,348 84 2.0%
2010-11 4,443 95 2.2%
2011-12 4,458 15 0.3%
2012-13 4,503 45 1.0%
2013-14 4,561 58 1.3%
2014-15 4,565 4 0.1%
2015-16 4,535 -30 -0.7%
2016-17 4,618 83 1.8%
2017-18 4,528 -90 -1.9%
2018-19 4,278 -250 -5.5%
Grade K-5 Grade 5-6 Grade 9-12
1,537 657 1,458
1,567 707 1,479
1,619 651 1,469
1,656 659 1,448
1,702 709 1,473
1,729 685 1,466
1,768 683 1,366
1,765 723 1,438
1,731 734 1,365
1,585 733 1,285
Grade 7-8
696
690
719
740
677
685
718
692
698
675
FIGURE 8: District Enrollment by Division, 2009-2018
• Between 2009 and 2016, the district grew by 270 students.
Since the 2016-17 SY, enrollment has dropped by 340.
• The largest absolute decrease is at the elementary school level
with the high school losing the second most students. The last
three years have seen some growth in 5-6, while 7-8 has started
to decrease. The atypically large classes seen in some of the
elementary schools over the last 3-5 years have all moved on
from those schools into Elkins Park and Cedarbrook. These
large classes have yet to be replaced by similarly sized classes
resulting in overall enrollment decreases.
• At a certain point, continued growth at a grade division often
begins to stabilize as all grade levels approach high figures.
The ability to continue growing becomes more difficult since
the entry grades must keep getting larger and larger for this to
happen. Note the KG and 1st grade class sizes in Figure 9 on
the following page.
400
900
1,400
1,900
2,400
2,900
3,400
3,900
4,400
4,900
K-4
5-6
7-8
9-12
Total K-
12
Cheltenham School District Enrollment Projec�ons, 2018-19 Update
7
1D. School District Characteris�cs—Enrollment History Con#nued
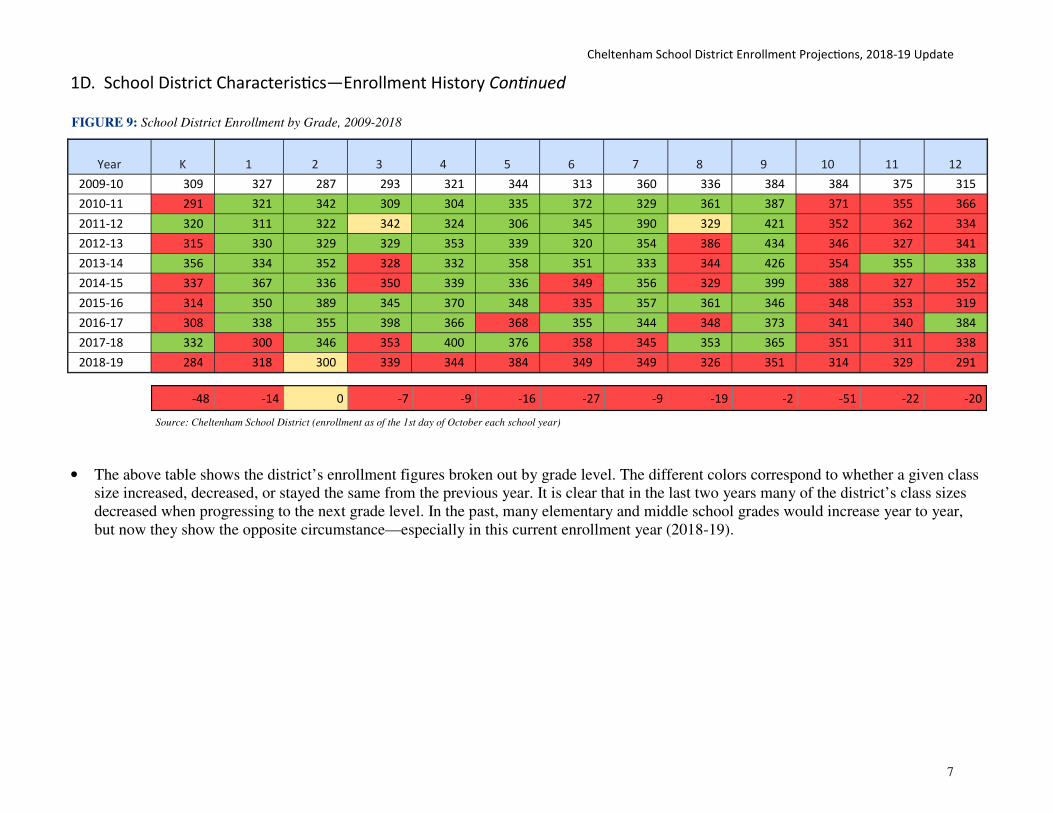
FIGURE 9: School District Enrollment by Grade, 2009-2018
Source: Cheltenham School District (enrollment as of the 1st day of October each school year)
Year K 1 2 3 4 5 6 7 8 9 10 11
2009-10 309 327 287 293 321 344 313 360 336 384 384 375
2010-11 291 321 342 309 304 335 372 329 361 387 371 355
2011-12 320 311 322 342 324 306 345 390 329 421 352 362
2012-13 315 330 329 329 353 339 320 354 386 434 346 327
2013-14 356 334 352 328 332 358 351 333 344 426 354 355
2014-15 337 367 336 350 339 336 349 356 329 399 388 327
2015-16 314 350 389 345 370 348 335 357 361 346 348 353
2016-17 308 338 355 398 366 368 355 344 348 373 341 340
12
315
366
334
341
338
352
319
384
2017-18 332 300 346 353 400 376 358 345 353 365 351 311 338
2018-19 284 318 300 339 344 384 349 349 326 351 314 329 291
• The above table shows the district’s enrollment figures broken out by grade level. The different colors correspond to whether a given class
size increased, decreased, or stayed the same from the previous year. It is clear that in the last two years many of the district’s class sizes
decreased when progressing to the next grade level. In the past, many elementary and middle school grades would increase year to year,
but now they show the opposite circumstance—especially in this current enrollment year (2018-19).
-48 -14 0 -7 -9 -16 -27 -9 -19 -2 -51 -22 -20

Cheltenham School District Enrollment Projec�ons, 2018-19 Update
8
1E. School District Characteris�cs—Private School Enrollments
Year
Private School
Students Dataset
2010* 845 ACS, 5 Year Es�mates,
2017* 984
ACS, 5 Year Es�mates,
2013-2017
2000 1,216
Census 2000,
Summary File 3
Percent in Private
School
18.4%
15.3%
17.2%
FIGURE 10: Private School Enrollment According to U.S. Census Bureau
* 5 Year Estimates from the ACS are an average of 5 years worth
of sampling data
School Year
Private School
Students
2010-2011 578
2011-2012 602
2012-2013 610
2013-2014 630
2014-2015 616
2015-2016 632
2016-2017 702
2017-2018 607
2018-2019 618
FIGURE 11: Private School Enrollment According
to CSD Records
Source: Cheltenham School District Data Year Charter
2012-2013 71
2013-2014 83
2014-2015 77
2015-2016 86
2016-2017 42
2017-2018 77
FIGURE 12: Charter and Cyber-Charter Enrollment According to Cheltenham Records
Source: Cheltenham School District Data
• The general trend in the county is that private school enrollment has
declined since 2000, particularly since the Recession, but numbers
have rebounded slightly since the economic recovery.
• Two data sources appear to show different patterns in private school
students living in the district—the U.S. Census show an increase
while Cheltenham SD records show recent decline. Census data is
averaged over five years and tells us less about the changes within
those years. Cheltenham data showed a peak in private school
students in 2016 at 702 which dropped by nearly 100 within the next
year.
• Some of the increase in recent years could be due to temporary
conditions involving the closure of Cedarbrook Middle School. The
extent of the difference between 06-10 and 13-17 Census data is
questionable given the margin of error and associated census data,
but an increase is clear. The district data shows a fairly variable rate
between 600 and 635 students with 2016 being an outlier.
• Charter school options, including cyber charter schools, are at
relatively low numbers and have remained stable since 2012 except
for the 2016-17 school year.

This page intentionally left blank

PART 2—HOUSING ACTIVITY
Cheltenham School District Enrollment Projec�ons, 2018-19 Update
11
2A. Housing Ac�vity—Impacts of Housing—School Age Children by Type, 2010 Census Analysis
Single Family Detached Single Family A2ached Mul�family
School Age Children per Household in
Exis�ng Units 0.55 0.41 0.18
School Age Children per Household in
New Units 0.93 0.21 0.06
Montgomery County
Single Family Detached Single Family A2ached Mul�family
School Age Children per Household in 0.51 0.52 0.28
School Age Children per Household in
New Units * N/A N/A N/A
Cheltenham School District
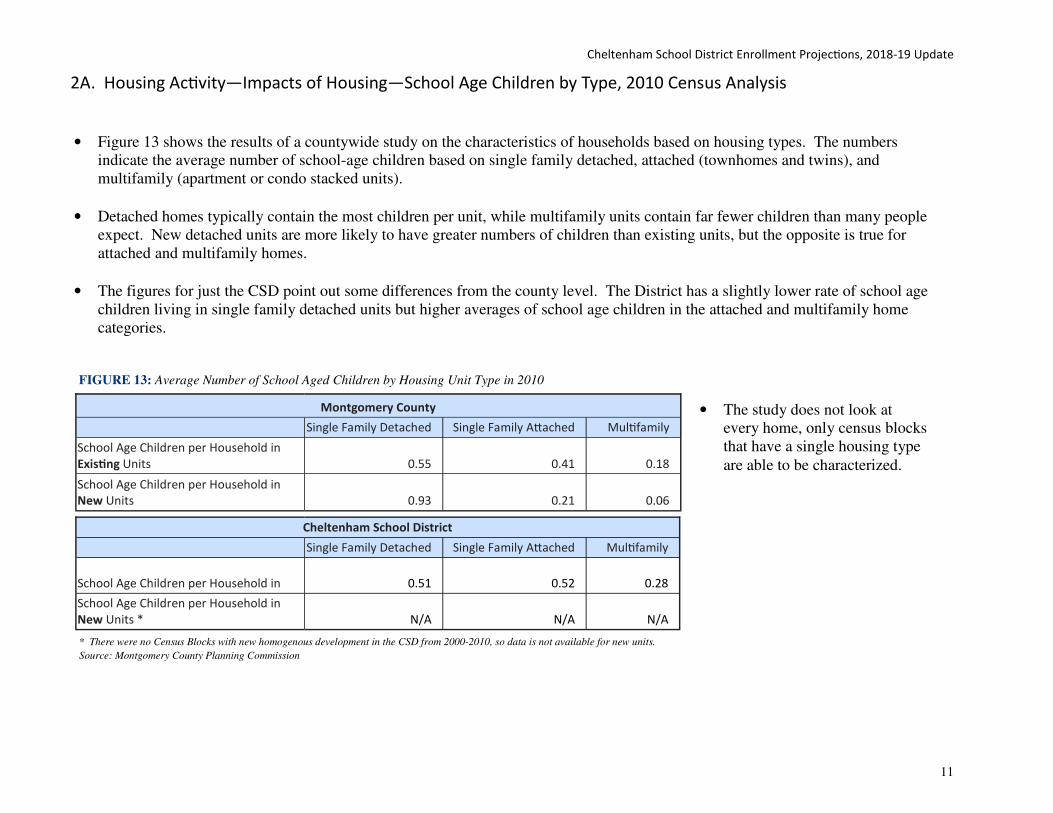
FIGURE 13: Average Number of School Aged Children by Housing Unit Type in 2010
Source: Montgomery County Planning Commission
• Figure 13 shows the results of a countywide study on the characteristics of households based on housing types. The numbers
indicate the average number of school-age children based on single family detached, attached (townhomes and twins), and
multifamily (apartment or condo stacked units).
• Detached homes typically contain the most children per unit, while multifamily units contain far fewer children than many people
expect. New detached units are more likely to have greater numbers of children than existing units, but the opposite is true for
attached and multifamily homes.
• The figures for just the CSD point out some differences from the county level. The District has a slightly lower rate of school age
children living in single family detached units but higher averages of school age children in the attached and multifamily home
categories.
• The study does not look at
every home, only census blocks
that have a single housing type
are able to be characterized.
* There were no Census Blocks with new homogenous development in the CSD from 2000-2010, so data is not available for new units.

Cheltenham School District Enrollment Projec�ons, 2018-19 Update
12
2B. Housing Ac�vity—Impacts of Housing—Mul�family Housing
• MCPC analyzed student records matching the addresses of all multifamily properties in the district with 10 or more units across four time
periods going back to 2009.
• The results in Figure 14 show that there are actually fewer students per unit than shown through the 2010 study, but that they have risen
above the countywide average.
• They also reveal that these numbers had been going up and more students were living in existing apartment units than in the past.
However, in the last few years the number of students originating from existing multifamily developments has come back down to near
the 2009-10 level.
FIGURE 14: Actual Cheltenham SD Data for All Multi-
family Developments with 10 Units or More
Note: Only includes public students and ratio is based on units,
not households.
Source: Cheltenham SD Records and MCPC analysis
Year
Cheltenham
SD Students Student / Unit
2012-13 920 0.19
2015-16 982 0.20
2009-10 776 0.16
Units
4,792
4,792
4,792
2018-19 799 4,792 0.16

Cheltenham School District Enrollment Projec�ons, 2018-19 Update
13
FIGURE 15: Actual CSD Data for Multifamily Developments with 10 Units or More
Name Type Street Address ES Units
Date
Built
2018-19 Students /
Unit Ra�o
2015-16
Total
2012-13
Total
2009-10
Total
Lynnewood Gardens Rental 2047 Mather Way Combo 1800 1945 0.23 545 526 501
The Towers at Wyncote Rental 8460, 8470, 8480 Limekiln Pike GL 1095 1966 0.14 217 186 89
Wyncote House Rental 25 Washington Ln GL 304 1963 0.01 3 1 0
Elkins Park House Condo 7900 Old York Road WY 237 1957 0.02 3 2 0
Brookview at Elkins Park Rental 1000-7000 Brookview Pl MY 216 1990 0.21 36 34 38
Church Road Condo Condo 1600 Church Road WY 169 1962 0.10 10 12 8
Melrose Sta�on Apartments Rental 902 Valley Road MY 134 1955 0.43 63 71 63
Chelbourne Plaza Condo 46 Township Line Rd MY 100 1965 0.06 3 7 7
Briar House Condo 8302 Old York Road WY 98 1973 0.01 0 0 0
Melrose Court Apartments Rental 7340 York Rd / 1308 Willow Ave MY 74 1949 0.26 16 10 12
Breyer Estates Condominiums Condo 100 Breyer Drive WY 68 1985 0.00 4 3 0
Coventry House Apartments Rental 7301 Coventry Ave MY 62 1966 0.00 0 1 0
Hillbrook Apartments Rental 651 Brooke Rd GL 60 1961 0.08 7 4 9
Elkins Park Gardens Rental 8000 High School Rd MY 50 1952 0.08 13 14 13
Rolling Hill Apartments Rental 26 Township Line Rd MY 47 1967 0.23 17 12 10
Melrose Park House Condo 900 Valley Road MY 40 1982 0.00 0 1 2
Elkins Court Condo 700 Elkins Avenue WY 37 1930 0.05 3 4 1
Park Side Manor Rental 7876 Spring Ave MY 34 1950 0.44 4 3 1
Laurwyck Manor Apartments Rental 22 Township Line Rd MY 32 1960 0.28 14 8 7
Glenside Apartments Rental 40 Mount Carmel Ave GL 26 1961 0.12 0 1 0
Northwood Condo Condo 650 Brooke Road GL 25 1965 0.08 3 4 5
The Manor Apartments Rental 777 Limekiln Pike GL 21 1961 0.00 0 0 0
Elkins Park Apartments Rental 415 Church Rd WY 19 1922 0.47 8 5 6
Regina Rose Apartments Rental 515 Stahr Rd MY 12 1924 0.25 3 0 0
Valley Apartments Rental 7318, 7324, 7326 Coventry Ave MY 12 1955 0.42 11 7 2
Beaver View Apartments Rental 615 Paxson Avenue GL 10 1950 0.10 1 0 0
Brookside Terrace Rental 534 E. Church Rd MY 10 1965 0.20 1 4 2
2018-19
Total*
421
155
3
4
45
17
57
6
1
19
0
0
5
4
11
0
2
15
9
3
2
0
9
3
5
1
2
2B. Housing Ac�vity—Impacts of Housing—Exis�ng Mul�family Inventory
Source: Montgomery County Planning Commission
*The roster used to analyze the 2018-19 SY was taken at the beginning of the year, while rosters for 2015-16, 2012-13, 2009-10 were from the end of the year.

Cheltenham School District Enrollment Projec�ons, 2018-19 Update
14
2C. Housing Ac�vity—Impacts of Housing—Migra�on
FIGURE 16: Select Age Cohorts in CSD Area Households
Related to Geographic Mobility
Source: American Community Survey, 2013-2017 Estimates
Persons in households
that have moved within
the last year
Persons in
Households
Percent of
Persons in
Households
People Age 1-4 179 3.7%
People Age 5-17 617 12.7%
People Age 25-34 857 17.6%
Total People 4,872 100%
Persons in households
that have remained in
the same house
Persons in
Households
Percent of
Persons in
Households
People Age 1-4 1,198 3.7%
People Age 5-17 5,029 15.7%
People Age 25-34 3,818 11.9%
Total People 32,088 100%
• Figure 16 appears to indicate that there is a similar likelihood of pre-
school age and lesser likelihood of school age children in households
that have moved in the last year compared to households who have
remained in place. However, these figures don’t tell us who those
new households are replacing. If no children were in the house
before, then it would still be a net gain.
• Households that have moved into the district have a relatively high
likelihood of having persons aged 25-34.
Year of Housing Units Sold 2013
Number of Exis�ng Units Sold 356
Incoming Students at Address of
Units Sold 61
2015
430
93
Outgoing Students at Address of
Units Sold 43 51
Net Change in Students from
Sales Ac#vity +18 +42
2011
250
45
18
+27
2017
530
117
82
+35
FIGURE 17: Impact of Housing Units Sold on Enrollment
Source: CSD Records, MCPC Median Price Sales Reports
• MCPC compared detailed sales transactions with student
address records to identify the actual number of students
leaving a home as compared to those who entered after the
same home was sold.
• This data shows a consistent net gain from housing sales
within the school district.

Cheltenham School District Enrollment Projec�ons, 2018-19 Update
15
2D. Housing Ac�vity—Housing Units Built
FIGURE 18: Housing Units Built in the CSD by Housing Type, 2008-2017
Source: Montgomery County Planning Commission
• The last five years of housing construction in the
district shows an average of 31 units per year. Nearly
all of the developments were single family attached
units within the “Wyngate” development with “1600
Church Road” the notable MF exception. The net
impact on enrollment based on these housing types
averages out to approximately 7 students per year. This
baseline is used to determine what additional impact
will be caused by new development expected in the
future should it outpace previous construction rates.
• The map on the following page identifies all units built
over the last five years.
ES School
Boundary 2013 2014 2015 2016 2017 Total 13-17
Cheltenham 0 0 0 0 0 0
Glenside 5 36 40 14 16 111
Myers 0 0 0 0 0 0
Wyncote 1 55 0 24 0 80
Total 6 91 40 38 16 191
FIGURE 19: Housing Units Built by Elementary School Boundary Areas, 2013-2017
Source: Montgomery County Planning Commission
0
10
20
30
40
50
60
70
80
90
100
2008 2009 2010 2011 2012 2013 2014 2015 2016 2017
Single Family Detached Single Family Attached Multifamily

Cheltenham School District Enrollment Projec�ons, 2018-19 Update
16
n
n
n
n
n
n
n
CHELTENHAM AVE
WA
SH
ING
TO
N L
N
EA
ST
ON
RD
CE
DA
R R
D
GLENSIDE AVE
NE
W S
EC
ON
D S
T
LIMEKILN
PIK
E
FR
ON
T S
T
GR
EE
NW
OO
D A
VE
COTTMAN AVE
TO
OK
AN
Y C
RE
EK
PK
WY
ASHMEAD RDASHBOURNE RD
CE
NT
RA
L A
VE
TOWNSHIP LINE RD
OG
ONTZ AVE
RIC
ES M
ILL
RD
MT CARMEL AVE
CHURCH RD
LIMEKILN PIKE
WyncoteES
´0 0.5 10.25
Miles
Jenkintown
CedarbrookMS
£¤309
Types of Units Built
SFD SFA MF
Sp
rin
gfi
eld
Cheltenham
Abington
MyersES
CheltenhamES
Elkins ParkSchool
GlensideES
CheltenhamHS
Philadelphia
Myers ES Wyncote ES Glenside ESCheltenham ES
FIGURE 20: Housing Units Built in the CSD by Housing Type, 2013-2017

Cheltenham School District Enrollment Projec�ons, 2018-19 Update
17
2E. Housing Ac�vity—Housing Units Proposed & Poten�al Table
• Figure 22 shows all known properties in play for development. Only the
first grouping is considered likely based on submitted plans or approvals
and discussion with township staff. The timelines are only estimates on
our part. A project may move forward more quickly, or as is often the
case, get delayed due to unforeseen circumstances. The second grouping
ranges from potential development that may take longer to become a
reality or only be theoretical at this point.
FIGURE 22: Possible Housing Developments and Impact on Public School Enrollment
FIGURE 21: Housing Units Proposed in the CSD, 2008-2017
0
50
100
150
200
250
300
2008 2009 2010 2011 2012 2013 2014 2015 2016 2017
Single Family Detached Single Family Attached Multifamily
Development Type
Total
Units
Built by School
Years Notes
Public School
Children Impact
Factor for School
Age Children
Ashbourne Meadows SFD 90 2020, 2021, 2022 Pre-Construc�on Complete—Construc�on to begin
by mid-2019.
73 .93
Ashbourne Meadows SFA 76 2020, 2021, 2022 Pre-Construc�on Complete—Construc�on to begin
by mid-2019.
21 .31
Melrose Court Apartments
(Addi�ons)
MF 27 2020 Owner seeking to add 27 new units to the building
through rehabilita�on.
4 .18
Other Future Possibili�es
Laverock Hill MF 216 Currently working its way through the development
process, including various legal hurdles. Could be
age-restricted.
Melrose Country Club Melrose Country Club is currently being explored by
a number of interested par�es—most hypothe�cal
development plans revolve around housing.
Enclave at Kerlin Farm MF 79 Age-Restricted development to be built across from
Ashbourne Meadows. Preliminary EDU’s have been
granted. There is some local concern that some of
the occupants may poten�ally bring children with
them.

Cheltenham School District Enrollment Projec�ons, 2018-19 Update
18
FIGURE 23: Proposed Housing Developments (Expected in Green, Potential in Yellow)
n
n
n
n
n
n
n
CHELTENHAM AVEW
AS
HIN
GT
ON
LN
EA
ST
ON
RD
CE
DA
R R
D
GLENSIDE AVE
NE
W S
EC
ON
D S
T
LIMEKILN
PIK
E
FR
ON
T S
T
GR
EE
NW
OO
D A
VE
COTTMAN AVE
TO
OK
AN
Y C
RE
EK
PK
WY
ASHMEAD RDASHBOURNE RD
CE
NT
RA
L A
VE
TOWNSHIP LINE RD
OGO
NTZ AVE
RIC
ES M
ILL
RD
MT CARMEL AVE
CHURCH RD
LIMEKILN PIKE
WyncoteES
´0 0.5 10.25
Miles
Jenkintown
CedarbrookMS
£¤309
Sp
rin
gfi
eld
Cheltenham
Abington
MyersES
CheltenhamES
Elkins ParkSchool
GlensideES
CheltenhamHS
Philadelphia
Ashbourne Meadows 90 SFD and 76 SFA Units Pre-construction nearing completion. Construction to begin mid-2019.
Enclave at Kerlin Farm 79 MF Units Age-Restricted development with preliminary approval for 79 EDUs. May contain a few students.
Melrose Court Apartments 27 MF Units Construction of a 27 unit addition is likely to begin within the next year.
Melrose Country Club Potential residential develop-ment if country club is bought for redevelopment.
Laverock Hill 216 MF Units Currently going through the develop-ment process, including various legal concerns. Could be age-restricted.

Cheltenham School District Enrollment Projec�ons, 2018-19 Update
19
2F. Housing Ac�vity—Housing Sales Ac�vity
FIGURE 24: Total Housing Units Sold (Existing) at Market Rate in the CSD, 2008-2017
Source: Montgomery County Planning Commission
ES School
Boundary
Market Rate Unit Sales—Exis#ng Units Only
2013 2014 2015 2016 2017 Total 13-17
Cheltenham 74 72 76 91 90 403
Glenside 85 101 118 132 155 591
Myers 60 93 73 87 100 413
Wyncote 137 143 163 175 185 803
Total 356 409 430 485 530 2210
FIGURE 25: Existing Housing Units Sold by Elementary School Boundary Areas, 2013-2017
Source: Montgomery County Planning Commission
• Housing sales rebounded since the historic low
of 2011. Since 2011, the number of sales
within Cheltenham SD has grown consistently.
Sales are now at a level above where they were
before the recession.
• Sales have also been analyzed at the elementary
school level as shown in Figure 25. Myers and
Glenside have seen the most sales and Glenside
has seen nearly 83% growth in sales within the
last five years.
0
100
200
300
400
500
600
2008 2009 2010 2011 2012 2013 2014 2015 2016 2017

PART 3—DISTRICT ENROLLMENT PROJECTIONS

Cheltenham School District Enrollment Projec�ons, 2018-19 Update
21
3A. Projec�ons—Progression Rates
School Year B-K K-1 1-2 2-3 3-4 4-5 5-6 6-7 7-8 8-9 9-10 10-11 11-12
2009-10 0.828 1.168 1.059 1.043 1.022 1.021 1.065 1.020 1.057 1.143 1.046 0.915 1.013
2010-11 0.766 1.039 1.046 1.077 1.038 1.044 1.081 1.051 1.003 1.152 0.966 0.924 0.976
2011-12 0.784 1.069 1.003 1.000 1.049 1.007 1.030 1.048 1.000 1.166 0.910 0.976 0.941
2013-14 1.035 1.060 1.067 0.997 1.009 1.014 1.035 1.041 0.972 1.104 0.816 1.026 1.034
2014-15 0.887 1.031 1.006 0.994 1.034 1.012 0.975 1.014 0.988 1.160 0.911 0.924 0.992
2015-16 1.030 1.039 1.060 1.027 1.057 1.027 0.997 1.023 1.014 1.052 0.872 0.910 0.976
2016-17 0.917 1.076 1.014 1.023 1.061 0.995 1.020 1.027 0.975 1.033 0.986 0.977 1.088
2017-18 0.988 0.974 1.024 0.994 1.005 1.027 0.973 0.972 1.026 1.049 0.941 0.912 0.994
2018-19 0.835 0.958 1.000 0.980 0.975 0.960 0.928 0.975 0.945 0.994 0.860 0.937 0.936
5 Year
Avg. 0.931 1.016 1.021 1.004 1.026 1.004 0.979 1.002 0.990 1.058 0.914 0.932 0.997
2012-13 0.847 1.031 1.058 1.022 1.032 1.046 1.046 1.026 0.990 1.319 0.822 0.929 0.942
FIGURE 25: Grade Progression Rates Over the Last Ten Years
• Grade progression rates reflect the historical relationship of one class as it goes from grade to grade over time. A ratio larger than
1.0 means that the class is growing that year due to new students entering the district.
• These rates reflect all the trends that have been discussed in this study. All of these rates are tempered by the recent decline in
students seen at nearly all grade levels. The five year averages help balance out some of the recent volatility with the original
trend based progressions from a few years prior.
A cohort progression model is a commonly used method that relies on recent trend data to forecast the future. It uses “Progression Rates” to
establish ratios that reflect what happens to a class size as it advances from one grade to the next. All grades over multiple years are
calculated and averages are used to program future class sizes over the next ten years. These rates will account for most recent trends and
assumes that they will continue. Adjustments can be made when warranted. For more details on the background and structure of the
traditional cohort progression model, please see Part 3 of the original 2016 MCPC study.

Cheltenham School District Enrollment Projec�ons, 2018-19 Update
22
3D. Projec�on Results —All Grades
School Year K 1 2 3 4 5 6 7 8 9 10 11 12 TOTAL
2019-20 305 288 325 301 348 345 376 350 345 345 321 293 328 4,270
2020-21 348 310 294 326 309 349 338 377 346 365 315 299 292 4,269
2021-22 314 354 317 295 334 310 342 339 373 366 334 294 298 4,269
2022-23 328 319 361 318 303 336 304 343 335 394 335 311 293 4,278
2023-24 322 333 325 362 326 304 329 304 339 355 360 312 310 4,282
2024-25 322 327 340 327 372 327 298 329 301 359 324 336 311 4,273
2025-26 322 327 334 341 335 373 320 299 326 318 328 302 335 4,261
2026-27 322 327 334 335 350 336 365 321 295 345 291 305 301 4,229
2027-28 322 327 334 335 344 351 329 366 318 313 315 271 304 4,231
2028-29 322 327 334 335 344 345 344 330 362 336 286 294 270 4,230
Births 6
Years Ago*
328
374
337
352
346
346
346
346
346
346
FIGURE 26: Projected Enrollments, OPTION 1—Base Future Birth Estimate (5-year Progression)
* The birth figure for each row does not pertain to births during that year, but rather the births that occurred six years prior to the projected year. The average birth-to-kindergarten ratio is then applied to get
the projected kindergarten class.
School Year Total
Annual
Change
2019-20 4,270 -8
2020-21 4,269 -1
2021-22 4,269 0
2022-23 4,278 9
2023-24 4,282 4
2024-25 4,273 -9
2025-26 4,261 -12
2026-27 4,229 -32
2027-28 4,231 2
2028-29 4,230 -1
• Progression Rate averages are based on
five years.
• Future births are estimated as an average
of the last five years.
Grade K-4 Grade 7-8 Grade 9-12
1,567 695 1,286
1,588 723 1,271
1,614 711 1,292
1,629 678 1,333
1,669 643 1,337
1,688 630 1,329
1,660 624 1,283
1,669 617 1,242
1,663 684 1,203
1,663 692 1,186
Grade 5-6
721
687
652
639
633
625
694
702
681
689

Cheltenham School District Enrollment Projec�ons, 2018-19 Update
23
3D. Projec�on Results —All Grades
School Year K 1 2 3 4 5 6 7 8 9 10 11 12 TOTAL
2019-20 300 285 322 300 344 342 374 346 343 334 326 296 331 4,241
2020-21 342 300 288 322 304 341 333 371 340 351 311 307 298 4,207
2021-22 308 343 304 288 326 302 333 330 364 348 326 293 309 4,173
2022-23 321 309 347 304 292 324 294 330 324 373 324 308 294 4,143
2023-24 316 322 313 347 308 290 316 291 324 332 347 305 309 4,120
2024-25 316 317 326 312 351 306 283 313 286 332 309 327 307 4,084
2025-26 316 317 321 326 316 349 298 280 307 293 308 291 329 4,052
2026-27 316 317 321 321 331 315 340 295 275 315 273 290 293 4,001
2027-28 316 317 321 321 325 329 306 337 290 282 293 257 292 3,985
2028-29 316 317 321 321 325 323 320 304 331 298 262 276 258 3,970
Births 6
Years Ago*
328
374
337
352
346
346
346
346
346
346
FIGURE 27: Projected Enrollments, OPTION 2—Base Future Birth Estimate (3-year Progression)
* The birth figure for each row does not pertain to births during that year, but rather the births that occurred six years prior to the projected year. The average birth-to-kindergarten ratio is then applied to get
the projected kindergarten class.
School Year Total
Annual
Change
2019-20 4,241 -37
2020-21 4,207 -34
2021-22 4,173 -34
2022-23 4,143 -30
2023-24 4,120 -24
2024-25 4,084 -35
2025-26 4,052 -32
2026-27 4,001 -51
2027-28 3,985 -16
2028-29 3,970 -15
• Progression Rate averages are based on
three years.
• Future births are estimated as an average
of the last five years.
Grade K-4 Grade 7-8 Grade 9-12
1,550 689 1,287
1,556 710 1,267
1,569 694 1,276
1,573 654 1,299
1,606 615 1,293
1,623 599 1,274
1,596 587 1,221
1,605 571 1,171
1,599 627 1,124
1,599 634 1,094
Grade 5-6
716
674
634
618
606
589
647
654
635
643

Cheltenham School District Enrollment Projec�ons, 2018-19 Update
24
3D. Projec�on Results —All Grades
School Year K 1 2 3 4 5 6 7 8 9 10 11 12 TOTAL
2019-20 305 288 324 301 347 345 375 349 345 344 320 292 327 4,263
2020-21 350 312 296 327 311 351 340 378 348 367 317 301 293 4,291
2021-22 317 357 320 299 338 314 345 342 376 370 337 297 302 4,315
2022-23 333 324 366 323 309 341 309 348 341 400 340 317 298 4,348
2023-24 335 338 330 367 331 309 333 309 344 359 365 317 315 4,353
2024-25 336 340 345 331 377 332 303 334 306 363 329 341 316 4,353
2025-26 338 342 347 346 340 378 325 303 331 323 333 307 340 4,352
2026-27 340 343 349 348 355 341 370 326 300 349 296 310 306 4,334
2027-28 342 345 350 350 357 356 334 371 323 317 320 276 309 4,351
2028-29 344 347 352 352 359 358 349 335 367 341 290 298 275 4,368
Births 6
Years Ago*
328
374
337
352
354
356
358
360
362
364
FIGURE 28: Projected Enrollments, OPTION 3—Slight Birth Growth with Housing Adjustment
* The birth figure for each row does not pertain to births during that year, but rather the births that occurred six years prior to the projected year. The average birth-to-kindergarten ratio is then applied to get
the projected kindergarten class.
School Year Total
Annual
Change
2019-20 4,263 -15
2020-21 4,291 28
2021-22 4,315 24
2022-23 4,348 33
2023-24 4,353 5
2024-25 4,353 0
2025-26 4,352 -1
2026-27 4,334 -18
2027-28 4,351 17
2028-29 4,368 17
• Progression Rate averages are based on
five years.
• Future births are estimated growing by 2
each year.
• An adjustment of 63 students spread over
the projection results was also incorporated
to account for likely housing construction.
Grade K-4 Grade 7-8 Grade 9-12
1,565 694 1,284
1,596 726 1,278
1,632 718 1,306
1,656 689 1,354
1,701 653 1,356
1,729 640 1,349
1,712 634 1,302
1,735 626 1,261
1,744 694 1,223
1,754 702 1,205
Grade 5-6
720
691
659
650
643
635
704
712
690
707

Cheltenham School District Enrollment Projec�ons, 2018-19 Update
25
Conclusion
Our original study recognized some major factors driving growth in the District’s student enrollment—reduced private school attendance,
more students coming out of existing multifamily developments, and more students resulting from the sale of households. Two school year
periods later, most of these factors have significantly shifted resulting in a different enrollment trajectory than originally projected. Private
school attendance in the District likely grew the last few years. Growth in students coming from existing multifamily developments reverted,
especially in large complexes like Lynnewood Gardens. In addition, all of the historically large elementary school classes observed in the
original study have since moved into Elkins Park and have not been replaced by similarly sized kindergartens and first grades.
Enrollment figures over the last two school years combined with other new data has informed our perception of what is happening in the
Cheltenham School District. The steady growth observed between 2009 and 2016 is difficult to sustain unless new elementary classes are
larger compared to those progressing onto the middle schools. At some point all of the grade levels reach a high point and growth becomes
less likely to achieve even if large class sizes are sustained. Some of the higher grade levels are still in line to receive growth bubbles that
originated in aforementioned kindergarten or first grade classes 6-10 years ago.
The updated projections show a district that is likely to see overall enrollment continue its decrease unless anticipated housing is constructed,
births increase, and elementary classes start to grow again. Option 1 tempers the recent pace of decline by incorporating the last five years of
enrollment history in its progression rates. While Option 2 shows the most drastic decline due to the fact the progression rates are based on
only the last three years. Option 3 accounts for a slight increase in births each year, some growth due to housing construction, and a five-year
progression rate. This option represents the most likely future for the district and is the most finely-tuned model. Ashbourne Meadows is to
begin construction in the summer of 2019 and will likely start affecting district enrollments the following school year. This development,
along with continued housing churn due to sales, and possible increases in birth activity could be enough to moderate or reverse the recent
trend of decline within the district.

APPENDIX—ELEMENTARY SCHOOL PROFILES

Cheltenham School District Enrollment Projec�ons, 2018-19 Update
27
Cheltenham ES
Year
New Units Built Exis�ng Units Sold
SFD SFA MF Total SFD SFA MF Total
2013 0 0 0 0 53 21 0 74
2014 0 0 0 0 53 19 0 72
2015 0 0 0 0 58 18 0 76
2016 0 0 0 0 64 27 0 91
2017 0 0 0 0 60 30 0 90
Total 0 0 0 0 288 115 0 403
Development Type
Total
Units 2019 2020 2021 2022 2023
Public School
Children Impact
(2019 beyond)
Ashbourne Meadows* SFD + SFA 166 56 55 55 94 Children
Past Enrollment
Housing Data
Housing Potential
• Past Enrollment— A number of
large classes have moved through
the school in recent years,
increasing enrollment significantly
from where it was in 2011.
However, those classes are largely
gone and new classes have not
been as large.
• Housing—No construction
recently but Ashbourne Meadows
is on the horizon, although those
children could be assigned to or
split between Myers. Sales have
grown stronger in the past five
years.
* Ashbourne Meadows may be split between Cheltenham ES & Myers ES.
Year K 1 2 3 4 Total
Annual
Change
2011-12 70 76 81 103 79 409 -19
2012-13 74 77 81 82 105 419 10
2013-14 90 86 86 87 88 437 18
2014-15 78 98 96 87 95 454 17
2015-16 100 85 113 99 93 490 36
2016-17 86 107 98 116 108 515 25
2017-18 92 84 106 91 113 486 -29
2018-19 80 87 89 109 86 451 -35
Cheltenham School District Enrollment Projec�ons, 2018-19 Update
28
Glenside ES
Year
New Units Built Exis�ng Units Sold
SFD SFA MF Total SFD SFA MF Total
2013 0 5 0 5 67 18 0 85
2014 0 36 0 36 81 20 0 101
2015 0 40 0 40 91 27 0 118
2016 0 14 0 14 90 42 0 132
2017 0 16 0 16 108 45 2 155
Total 0 111 0 111 440 149 2 591
Development Type
Total
Units 2019 2020 2021 2022 2023
Public School
Children Impact
(2019 beyond)
N/A
Past Enrollment
Housing Data
Housing Potential
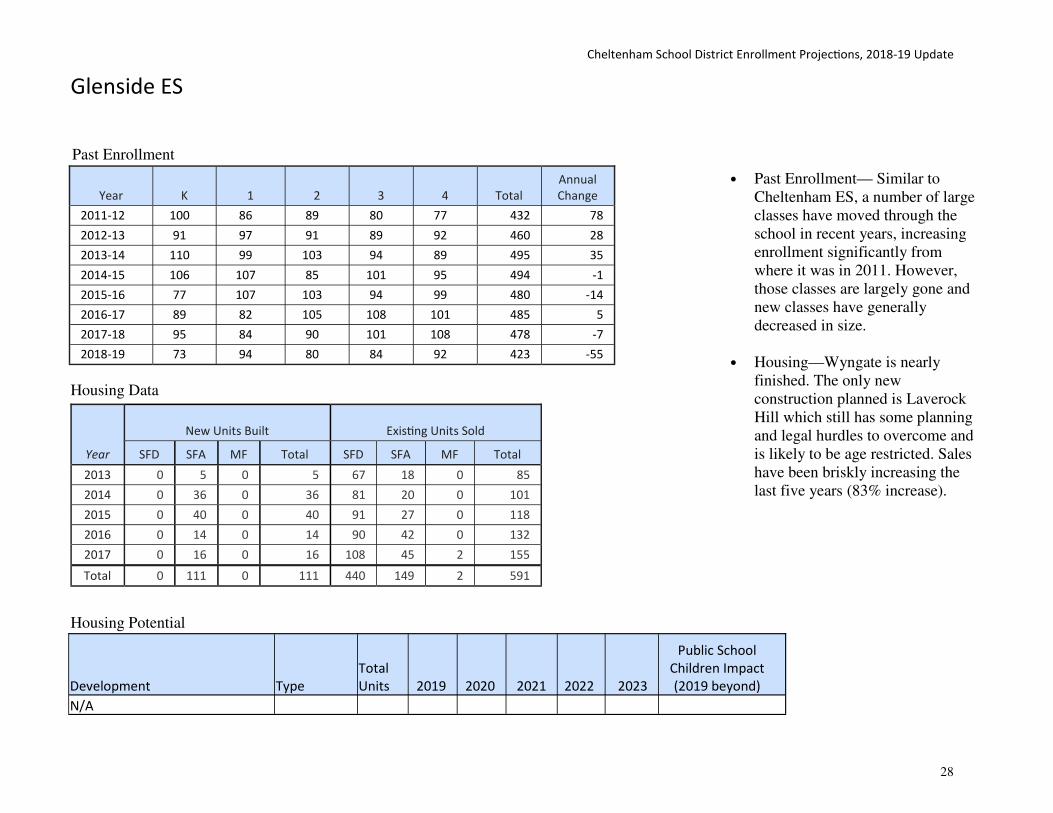
• Past Enrollment— Similar to
Cheltenham ES, a number of large
classes have moved through the
school in recent years, increasing
enrollment significantly from
where it was in 2011. However,
those classes are largely gone and
new classes have generally
decreased in size.
• Housing—Wyngate is nearly
finished. The only new
construction planned is Laverock
Hill which still has some planning
and legal hurdles to overcome and
is likely to be age restricted. Sales
have been briskly increasing the
last five years (83% increase).
Year K 1 2 3 4 Total
Annual
Change
2011-12 100 86 89 80 77 432 78
2012-13 91 97 91 89 92 460 28
2013-14 110 99 103 94 89 495 35
2014-15 106 107 85 101 95 494 -1
2015-16 77 107 103 94 99 480 -14
2016-17 89 82 105 108 101 485 5
2017-18 95 84 90 101 108 478 -7
2018-19 73 94 80 84 92 423 -55

Cheltenham School District Enrollment Projec�ons, 2018-19 Update
29
Myers ES
Year
New Units Built Exis�ng Units Sold
SFD SFA MF Total SFD SFA MF Total
2013 0 0 0 0 44 10 6 60
2014 0 0 0 0 69 15 9 93
2015 0 0 0 0 56 8 9 73
2016 0 0 0 0 65 15 7 87
2017 0 0 0 0 75 17 8 100
Total 0 0 0 0 309 65 39 413
Past Enrollment
Housing Data
• Past Enrollment— Enrollment has
remained relatively stable at Myers
ES. However, it has been slowly
decreasing for the last three school
years after peaking in 2015. Recent
KDG classes have been on the
smaller side.
• Housing—The only new
construction planned is Ashbourne
Meadows and an addition to the
Melrose Court Apartments.
Ashbourne Meadows has the
potential to be split between
Cheltenham and Myers. Sales have
been growing steadily the last three
years.
Year K 1 2 3 4 Total
Annual
Change
2011-12 77 65 66 72 79 359 0
2012-13 74 79 66 70 72 361 2
2013-14 65 65 81 61 74 346 -15
2014-15 70 66 66 76 62 340 -6
2015-16 73 80 71 70 85 379 39
2016-17 65 77 72 77 76 367 -12
2017-18 59 62 78 77 83 359 -8
2018-19 64 58 67 77 82 348 -11
Development Type
Total
Units 2019 2020 2021 2022 2023
Public School
Children Impact
(2019 beyond)
Ashbourne Meadows* SFD + SFA 166 56 55 55 94 Children
Melrose Court Apartments (Add.) MF 27 27 4 Children
Housing Potential
* Ashbourne Meadows may be split between Cheltenham ES & Myers ES.

Cheltenham School District Enrollment Projec�ons, 2018-19 Update
30
Wyncote ES
Year
New Units Built Exis�ng Units Sold
SFD SFA MF Total SFD SFA MF Total
2013 1 0 0 1 82 28 27 137
2014 0 0 55 55 85 33 25 143
2015 0 0 0 0 103 35 25 163
2016 0 24 0 24 107 35 33 175
2017 0 0 0 0 112 32 41 185
Total 1 24 55 80 489 163 151 803
Past Enrollment
Housing Data
• Past Enrollment— Enrollment
within Wyncote has been variable
since 2011—with some years
gaining and others losing.
However, losses have been larger
the last couple of years. 2018 is the
first year without a class over 90
students since 2011.
• Housing—Some homes that were
built in the Wyngate development
were districted to Wyncote ES. No
new housing is proposed within
this catchment. Sales have been
growing since 2013.
Year K 1 2 3 4 Total
Annual
Change
2011-12 73 84 86 87 89 419 -7
2012-13 76 77 91 88 84 416 -3
2013-14 91 84 82 86 81 424 8
2014-15 83 96 89 86 87 441 17
2015-16 64 78 102 82 93 419 -22
2016-17 68 72 80 97 81 398 -21
2017-18 86 70 72 84 96 408 10
2018-19 67 79 64 69 84 363 -45
Development Type
Total
Units 2019 2020 2021 2022 2023
Public School
Children Impact
(2019 beyond)
N/A N/A N/A
Housing Potential