Enrollment, Admissions, and Degrees Data Book · • The Fall 2016 data are based on the UMass...
42
Enrollment, Admissions, and Degrees Data Book Fall 2016 Office of Institutional Research and Assessment
Transcript of Enrollment, Admissions, and Degrees Data Book · • The Fall 2016 data are based on the UMass...

Enrollment, Admissions, and Degrees Data Book
Fall 2016
Office of Institutional Research and Assessment

Enrollment, Admissions, and Degrees Data Book
Fall 2016 Office of Institutional Research and Assessment Tammy A. Silva, Director Tel # 508-999-8486 Fax # 508-910-6528 Email: [email protected]
Office of Institutional Research and Assesment Data Book
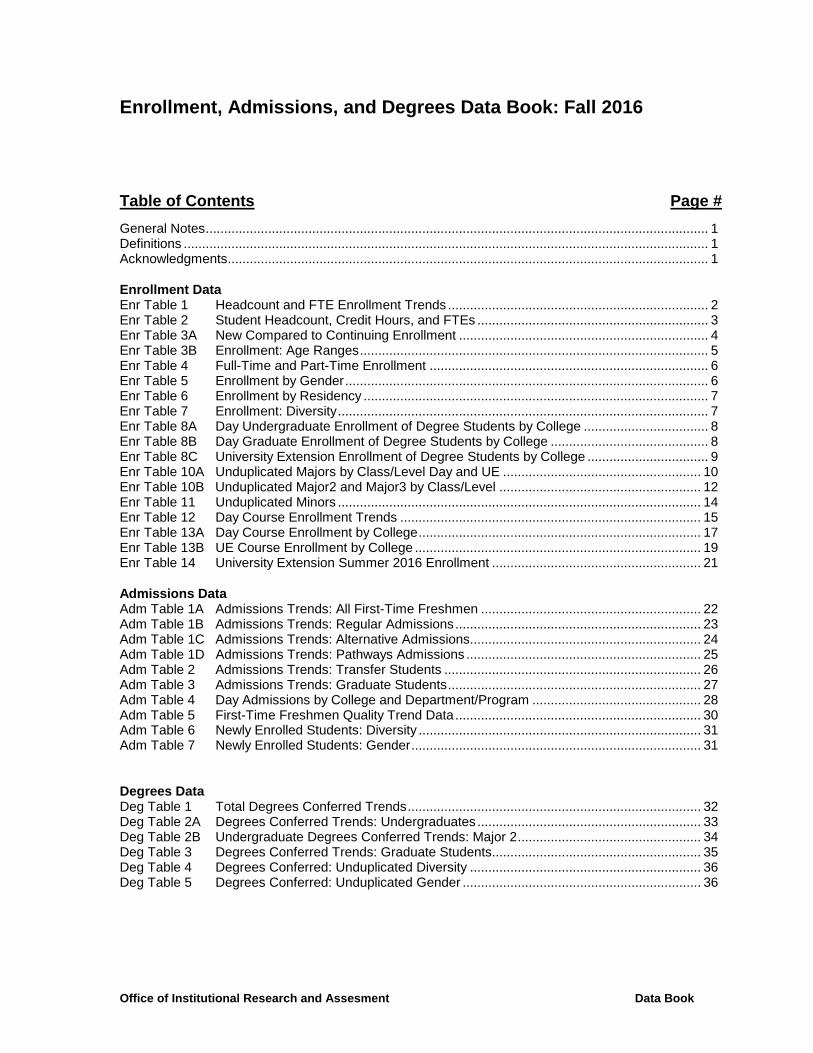
Enrollment, Admissions, and Degrees Data Book: Fall 2016 Table of Contents Page # General Notes ......................................................................................................................................... 1 Definitions ............................................................................................................................................... 1 Acknowledgments ................................................................................................................................... 1 Enrollment Data Enr Table 1 Headcount and FTE Enrollment Trends ....................................................................... 2 Enr Table 2 Student Headcount, Credit Hours, and FTEs ............................................................... 3 Enr Table 3A New Compared to Continuing Enrollment .................................................................... 4 Enr Table 3B Enrollment: Age Ranges ............................................................................................... 5 Enr Table 4 Full-Time and Part-Time Enrollment ............................................................................ 6 Enr Table 5 Enrollment by Gender ................................................................................................... 6 Enr Table 6 Enrollment by Residency .............................................................................................. 7 Enr Table 7 Enrollment: Diversity ..................................................................................................... 7 Enr Table 8A Day Undergraduate Enrollment of Degree Students by College .................................. 8 Enr Table 8B Day Graduate Enrollment of Degree Students by College ........................................... 8 Enr Table 8C University Extension Enrollment of Degree Students by College ................................. 9 Enr Table 10A Unduplicated Majors by Class/Level Day and UE ...................................................... 10 Enr Table 10B Unduplicated Major2 and Major3 by Class/Level ....................................................... 12 Enr Table 11 Unduplicated Minors ................................................................................................... 14 Enr Table 12 Day Course Enrollment Trends .................................................................................. 15 Enr Table 13A Day Course Enrollment by College ............................................................................. 17 Enr Table 13B UE Course Enrollment by College .............................................................................. 19 Enr Table 14 University Extension Summer 2016 Enrollment ......................................................... 21 Admissions Data Adm Table 1A Admissions Trends: All First-Time Freshmen ............................................................ 22 Adm Table 1B Admissions Trends: Regular Admissions ................................................................... 23 Adm Table 1C Admissions Trends: Alternative Admissions............................................................... 24 Adm Table 1D Admissions Trends: Pathways Admissions ................................................................ 25 Adm Table 2 Admissions Trends: Transfer Students ...................................................................... 26 Adm Table 3 Admissions Trends: Graduate Students ..................................................................... 27 Adm Table 4 Day Admissions by College and Department/Program .............................................. 28 Adm Table 5 First-Time Freshmen Quality Trend Data ................................................................... 30 Adm Table 6 Newly Enrolled Students: Diversity ............................................................................. 31 Adm Table 7 Newly Enrolled Students: Gender ............................................................................... 31 Degrees Data Deg Table 1 Total Degrees Conferred Trends ................................................................................ 32 Deg Table 2A Degrees Conferred Trends: Undergraduates ............................................................. 33 Deg Table 2B Undergraduate Degrees Conferred Trends: Major 2 .................................................. 34 Deg Table 3 Degrees Conferred Trends: Graduate Students......................................................... 35 Deg Table 4 Degrees Conferred: Unduplicated Diversity ............................................................... 36 Deg Table 5 Degrees Conferred: Unduplicated Gender ................................................................. 36

Office of Institutional Research and Assessment 1 Data Book
Enrollment, Admissions, and Degrees Data Book: Fall 2016 General Notes • The Fall 2016 data are based on the UMass Dartmouth computer database census files; these files
were “frozen” in time by the Central UITS office. The Office of Institutional Research and Assessment then extracts these files and uses them for standard internal and external reporting purposes.
• The enrollment data count current students registered for more than zero courses. • The UE enrollment data are for credit courses only. UE has additional students who are taking non-
credit courses shown on a separate table. Definitions • SCH represents Student Credit Hours attempted for the semester. • FTE represents Full-Time Equivalency, which is calculated from student credit hours (SCH); for
undergraduates and law students 15 SCHs are equal to 1 FTE and for graduates 9 SCHs are equal to 1 FTE. An undergraduate registered for one 3-credit course has 3 SCHs, which is equivalent to 0.2 FTE, and a graduate registered for 3 SCHs is equivalent to 0.33 FTE. ABA FTE is calculated by adding the full-time headcount and 2/3 of the part-time headcount.
• Full-Time/Part-Time status is calculated on credits attempted; full-time undergraduates and law students are taking 12 or more credits and full-time graduates are taking 9 or more credits.
• Unduplicated Total removes double counting of students enrolled both in Day and UE. • Counting Majors compared to Counting Enrollment: counting of majors is now being done from the
unduplicated datafile and gives the number of students in the whole university who are majoring in specific programs; Day and UE enrollment counts by college give the number of students from a specific program who are currently enrolled in Day/UE. These different perspectives explain the differences in numbers when looking at major counts as compared to enrollment counts.
Acknowledgments • The Office of Institutional Research and Assessment extends its appreciation to the offices that gather
and input the data that becomes the basis of IR reports. For this data book, these offices include the Admissions, Registrar’s, and UE Offices.

ENROLLMENT TABLES

Enr Table 1 Headcount and FTE Enrollment Trends Fall 2016
Office of Institutional Research and Assessment 2 Data Book
Undergraduate Graduate DAY Total University Ext. University TotalHC FTE HC FTE HC FTE HC FTE HC FTE
Fall 2016 6,328 5,861 1,179 920* 7,507 6,781 1,473 776 8,647 7,558*
Fall 2015 6,631 6,149 1,199 924* 7,830 7,073 1,366 693 8,916 7,766*
Fall 2014 6,824 6,279 1,270 952* 8,094 7,232 1,393 698 9,111 7,930*
Fall 2013 6,863 6,336 1,217 863* 8,080 7,199 1,324 666 9,053 7,865*
Fall 2012 6,979 6,455 1,179 882* 8,158 7,337 1,333 647 9,210 7,984*
Fall 2011 6,984 6,456 1,228 937* 8,212 7,393 1,244 587 9,225 7,980*
Fall 2010 7,098 6,623 1,192 929* 8,290 7,552 1,349 711 9,432 8,263*
Fall 2009 7,252 6,805 801 627 8,053 7,431 1,416 728 9,302 8,159
Fall 2008 7,298 6,793 731 548 8,029 7,340 1,345 649 9,155 7,990
Fall 2007 7,186 6,647 735 583 7,921 7,230 1,319 623 9,080 7,852
Fall 2006 6,881 6,393 778 600 7,659 6,993 1,420 603 8,756 7,596
Fall 2005 6,818 6,314 763 590 7,581 6,903 1,151 508 8,549 7,412
Fall 2004 6,535 5,977 726 543 7,261 6,520 1,407 560 8,299 7,080
Fall 2003 6,608 5,970 773 563 7,381 6,534 1,395 524 8,284 7,058
Fall 2002 6,452 5,865 766 595 7,218 6,460 1,193 478 8,122 6,938
Fall 2001 5,928 5,322 709 560 6,637 5,882 1,177 400 7,460 6,282
HC = Headcount.FTE = Full-Time Equivalency.University Total HC is unduplicated.Graduate Day FTEs include students enrolled for Thesis/project completion, counted as if 3 credit course.*University FTE is shown here which calculates Law FTE different than ABA FTE calculation.

Enr Table 2 Student Headcount, Credit Hours, and FTEs Fall 2016
Office of Institutional Research and Assessment 3 Data Book
Student
Head Count Student
Credit HoursFull Time
Equivalency
HC SCHs FTE DAY Total Day Students 7,507 97,144.0 6,781.4
Undergraduates 6,328 87,920.5 5,861.4 Freshmen 1,835 26,834.5 1,789.0 Sophomore 1,413 20,351.5 1,356.8 Junior 1,443 20,267.0 1,351.1 Senior 1,427 19,006.5 1,267.1
Non-Degree Undergrad 189 1,273.0 84.9Not Classified 21 188.0 12.5
Graduates 1,179 9,223.5 920.0Degree Graduate 690 4,983.5 553.7Degree Doctorate 276 1,787.0 198.6
Juris Doctorate 186 2,359.0 157.3 *Non-Degree Grad 27 94.0 10.4
UE Total UE Students 1,473 9,566.0 776.4
Undergraduate 867 6,426.0 428.4Graduate 606 3,140.0 348.0
UNIVERSITY TOTALS 8,647 106,704.0 7,557.7
Undergraduate 6,999 94,343.5 6,289.8Graduate 1,185 8,184.5 909.7Doctorate 277 1,796.0 199.6
Juris Doctorate 186 2,380.0 158.7 *
University headcount total is unduplicated.
*University FTE is shown here which calculates Law FTE different than ABA FTE calculation. Juris Doctorate includes 1 non degree visiting student.
Graduate Day FTEs include 101 (45 doctoral and 56 master level) students enrolled for Dissertation/ Thesis/Project completion, counted as if 3 credit course.

Enr Table 3A New Compared to Continuing Enrollment Fall 2016
Office of Institutional Research and Assessment 4 Data Book
New Continuing Readmits SubtotalsDAY Total Day Students 2,164 5,189 154 7,507
Undergraduates 1,784 4,406 138 6,328 First Time Freshmen 1,255 -- -- 1,255
Other Freshmen 76 486 18 580Sophomore 175 1,203 35 1,413
Junior 141 1,261 41 1,443 Senior 18 1,369 40 1,427
Non-Degree Undergrad 115 73 1 189Not Classified 4 14 3 21
Graduates 380 783 16 1,179Degree Graduate 245 434 11 690Degree Doctorate 48 223 5 276
Juris Doctorate 67 119 0 186Non-Degree Grad 20 7 0 27
UE Total UE Students 596 793 84 1,473 Undergraduates 286 508 73 867
Degree Undergrad 243 497 72 812Non-Degree Undergrad 43 11 1 55
Graduates 310 285 11 606Degree Graduate 224 268 9 501Non-Degree Grad 86 17 2 105
Unduplicated Total 2,684 5,733 230 8,647
Undergraduate 2,050 4,745 204 6,999Graduate 519 645 21 1,185Doctorate 48 224 5 277
Juris Doctorate 67 119 0 186
Other Freshmen, Sophomores, Juniors, or Seniors in the "New" column are incoming Transfer students, with class levels determined by amount of transfer credit accepted & include 2 new University Extension students.First-Time Freshmen had 6 students enter as sophomore due to college credit earned while in high school.Not Classified are undergraduate certificate students.
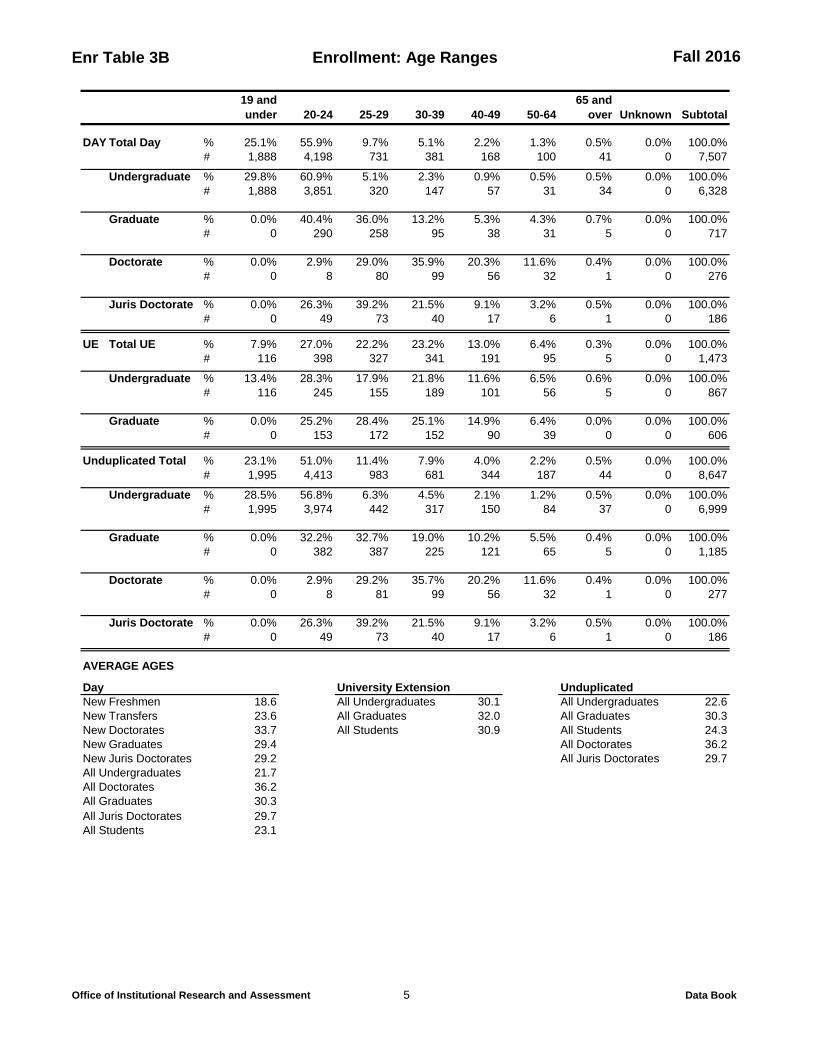
Enr Table 3B Enrollment: Age Ranges Fall 2016
Office of Institutional Research and Assessment 5 Data Book
19 and under 20-24 25-29 30-39 40-49 50-64
65 and over Unknown Subtotal
DAY Total Day % 25.1% 55.9% 9.7% 5.1% 2.2% 1.3% 0.5% 0.0% 100.0%# 1,888 4,198 731 381 168 100 41 0 7,507
Undergraduate % 29.8% 60.9% 5.1% 2.3% 0.9% 0.5% 0.5% 0.0% 100.0%# 1,888 3,851 320 147 57 31 34 0 6,328
Graduate % 0.0% 40.4% 36.0% 13.2% 5.3% 4.3% 0.7% 0.0% 100.0%# 0 290 258 95 38 31 5 0 717
Doctorate % 0.0% 2.9% 29.0% 35.9% 20.3% 11.6% 0.4% 0.0% 100.0%# 0 8 80 99 56 32 1 0 276
Juris Doctorate % 0.0% 26.3% 39.2% 21.5% 9.1% 3.2% 0.5% 0.0% 100.0%# 0 49 73 40 17 6 1 0 186
UE Total UE % 7.9% 27.0% 22.2% 23.2% 13.0% 6.4% 0.3% 0.0% 100.0%# 116 398 327 341 191 95 5 0 1,473
Undergraduate % 13.4% 28.3% 17.9% 21.8% 11.6% 6.5% 0.6% 0.0% 100.0%# 116 245 155 189 101 56 5 0 867
Graduate % 0.0% 25.2% 28.4% 25.1% 14.9% 6.4% 0.0% 0.0% 100.0%# 0 153 172 152 90 39 0 0 606
Unduplicated Total % 23.1% 51.0% 11.4% 7.9% 4.0% 2.2% 0.5% 0.0% 100.0%# 1,995 4,413 983 681 344 187 44 0 8,647
Undergraduate % 28.5% 56.8% 6.3% 4.5% 2.1% 1.2% 0.5% 0.0% 100.0%# 1,995 3,974 442 317 150 84 37 0 6,999
Graduate % 0.0% 32.2% 32.7% 19.0% 10.2% 5.5% 0.4% 0.0% 100.0%# 0 382 387 225 121 65 5 0 1,185
Doctorate % 0.0% 2.9% 29.2% 35.7% 20.2% 11.6% 0.4% 0.0% 100.0%# 0 8 81 99 56 32 1 0 277
Juris Doctorate % 0.0% 26.3% 39.2% 21.5% 9.1% 3.2% 0.5% 0.0% 100.0%# 0 49 73 40 17 6 1 0 186
AVERAGE AGES
Day University Extension UnduplicatedNew Freshmen 18.6 All Undergraduates 30.1 All Undergraduates 22.6New Transfers 23.6 All Graduates 32.0 All Graduates 30.3New Doctorates 33.7 All Students 30.9 All Students 24.3New Graduates 29.4 All Doctorates 36.2New Juris Doctorates 29.2 All Juris Doctorates 29.7All Undergraduates 21.7All Doctorates 36.2All Graduates 30.3All Juris Doctorates 29.7All Students 23.1

Office of Institutional Research and Assessment 6 Data Book
Enr Table 4 Full-Time and Part-Time Enrollment Fall 2016 Full-Time Part-Time Subtotal
# % # % #
DAY Total Day Students 6,263 83% 1,244 17% 7,507
Undergraduates 5,692 90% 636 10% 6,328
Freshmen 1,797 98% 38 2% 1,835 Sophomore 1,352 96% 61 4% 1,413 Junior 1,306 91% 137 9% 1,443 Senior 1,180 83% 247 17% 1,427
Non-Degree Undergrad 51 27% 138 73% 189Not Classified 6 29% 15 71% 21
Graduates 571 48% 608 52% 1,179
Graduate 353 51% 337 49% 690Doctorate 96 35% 180 65% 276
Juris Doctorate 121 65% 65 35% 186Non-Degree Grad 1 4% 26 96% 27
UE Total UE Students 285 19% 1,188 81% 1,473
Undergraduate 233 27% 634 73% 867Graduate 52 9% 554 91% 606
Unduplicated Total 6,754 78% 1,893 22% 8,647
Undergraduate 6,011 86% 988 14% 6,999Graduate 520 44% 665 56% 1,185Doctorate 98 35% 179 65% 277
Juris Doctorate 125 67% 61 33% 186
Enr Table 5 Enrollment by Gender Fall 2016 Subtotal
# % # % #DAY Total Day Students 3,911 52% 3,596 48% 7,507
Undergraduate 3,321 52% 3,007 48% 6,328
Freshmen 966 53% 869 47% 1,835 Sophomore 767 54% 646 46% 1,413 Junior 767 53% 676 47% 1,443 Senior 728 51% 699 49% 1,427
Non-Degree Undergrad 89 47% 100 53% 189Not Classified 4 19% 17 81% 21
Graduate 590 50% 589 50% 1,179
Graduate 390 57% 300 43% 690Doctorate 100 36% 176 64% 276
Juris Doctorate 84 45% 102 55% 186Non-Degree Grad 16 59% 11 41% 27
UE Total UE Students 597 41% 876 59% 1,473
Undergraduate 320 37% 547 63% 867Graduate 277 46% 329 54% 606
Unduplicated Total 4,337 50% 4,310 50% 8,647
Undergraduate 3,555 51% 3,444 49% 6,999Graduate 597 50% 588 50% 1,185Doctorate 101 36% 176 64% 277
Juris Doctorate 84 45% 102 55% 186
Men Women

Enr Table 6 Enrollment by Residency Fall 2016
Office of Institutional Research and Assessment 7 Data Book
Subtotal# % # % #
DAY Total Day Students 6,464 86% 1,043 14% 7,507
Undergraduate 5,822 92% 506 8% 6,328Graduate 351 49% 366 51% 717Doctorate 180 65% 96 35% 276Juris Doctorate 111 60% 75 40% 186
UE Total UE Students 1,125 76% 348 24% 1,473
Undergraduate 755 87% 112 13% 867Graduate 370 61% 236 39% 606
Unduplicated Total 7,351 85% 1,296 15% 8,647
Undergraduate 6,394 91% 605 9% 6,999Graduate 665 56% 520 44% 1,185Doctorate 181 65% 96 35% 277Juris Doctorate 111 60% 75 40% 186
Residence for DAY students derived from tuition based verified residence data field.Residence for UE students derived from residency code and permanent state.
Enr Table 7 Fall 2016
Tota
l Per
sons
of
Col
or
Cap
e Ve
rdea
n
Bla
ck
Am
. Ind
ian/
A
lask
an N
ativ
e
Asi
an
Haw
aiia
n/
Paci
fic Is
land
er
His
pani
c
Two
or m
ore
Rac
es
Whi
te
Rac
e/et
hnic
ity
Not
Spe
cifie
d
Non
-res
iden
t A
lien
Subt
otal
s
DAY Total Day % 33.3% 3.2% 12.0% 0.2% 4.2% 0.0% 9.7% 3.9% 66.7% — — —# 2,192 209 792 13 279 2 637 260 4,396 386 533 7,507
Undergraduate % 34.7% 3.4% 12.9% 0.2% 4.1% 0.0% 10.0% 4.0% 65.3% — — —# 2,013 200 749 11 240 1 582 230 3,786 360 169 6,328
Graduate % 21.4% 1.0% 4.2% 0.2% 6.2% 0.0% 5.5% 4.2% 78.6% — — —# 86 4 17 1 25 0 22 17 316 15 300 717
Doctorate % 20.6% 2.3% 4.7% 0.5% 2.3% 0.0% 7.0% 3.7% 79.4% — — —# 44 5 10 1 5 0 15 8 170 0 62 276
Juris Doctorate % 28.3% 0.0% 9.2% 0.0% 5.2% 0.6% 10.4% 2.9% 71.7% — — —# 49 0 16 0 9 1 18 5 124 11 2 186
UE Total UE % 24.0% 2.0% 8.1% 0.2% 2.7% 0.0% 8.2% 2.8% 76.0% — — —# 292 24 99 2 33 0 100 34 927 113 141 1,473
Undergraduate % 26.9% 2.8% 10.1% 0.3% 1.8% 0.0% 8.8% 3.1% 73.1% — — —# 210 22 79 2 14 0 69 24 572 77 8 867
Graduate % 18.8% 0.5% 4.6% 0.0% 4.3% 0.0% 7.1% 2.3% 81.2% — — —# 82 2 20 0 19 0 31 10 355 36 133 606
Unduplicated Total % 32.1% 3.0% 11.5% 0.2% 4.0% 0.0% 9.5% 3.9% 67.9% — — —# 2,427 227 871 15 303 2 717 292 5,145 484 591 8,647
Undergraduate % 34.1% 3.4% 12.7% 0.2% 3.9% 0.0% 9.9% 4.0% 65.9% — — —# 2,181 217 812 13 249 1 636 253 4,224 423 171 6,999
Graduate % 19.6% 0.6% 4.2% 0.1% 5.1% 0.0% 6.2% 3.3% 80.4% — — —# 153 5 33 1 40 0 48 26 626 50 356 1,185
Doctorate % 20.5% 2.3% 4.7% 0.5% 2.3% 0.0% 7.0% 3.7% 79.5% — — —# 44 5 10 1 5 0 15 8 171 0 62 277
Juris Doctorate % 28.3% 0.0% 9.2% 0.0% 5.2% 0.6% 10.4% 2.9% 71.7% — — —# 49 0 16 0 9 1 18 5 124 11 2 186
Percent ethnicity excludes "Race/Ethnicity Not specifed" and international students.
Enrollment: Diversity
In-State Out-of-State
Office of Institutional Research and Assessment 8 Data Book
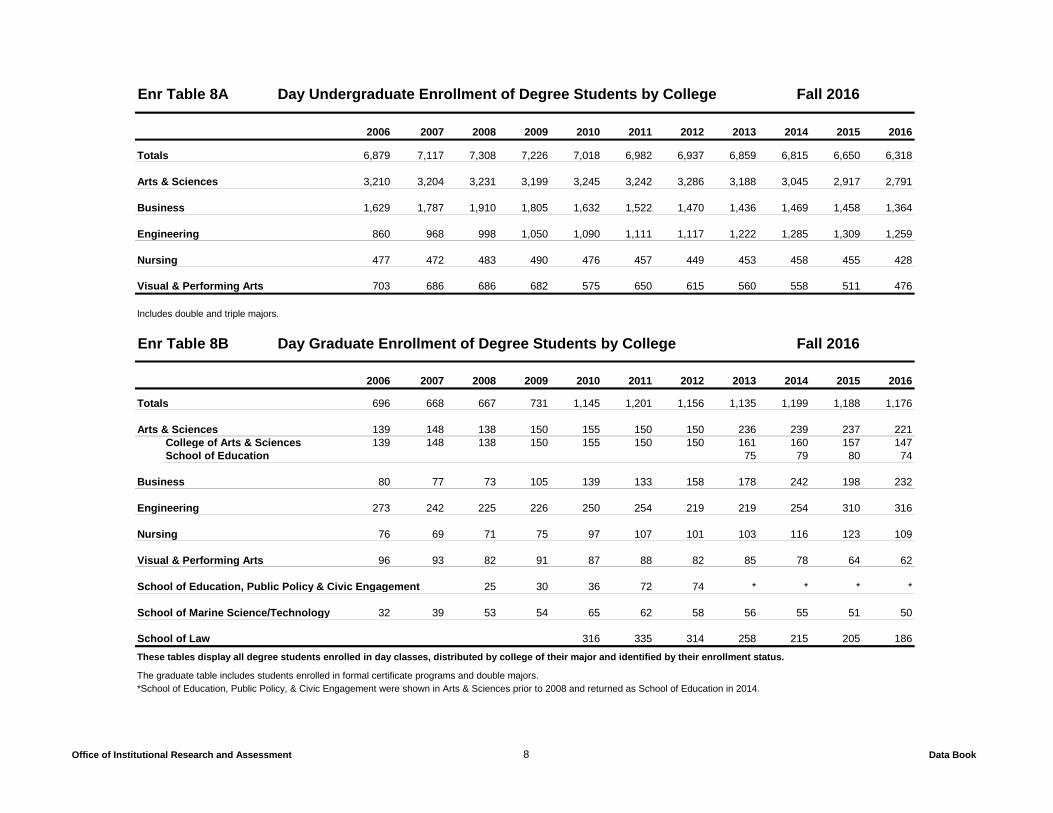
Enr Table 8A Day Undergraduate Enrollment of Degree Students by College Fall 2016
2006 2007 2008 2009 2010 2011 2012 2013 2014 2015 2016
Totals 6,879 7,117 7,308 7,226 7,018 6,982 6,937 6,859 6,815 6,650 6,318
Arts & Sciences 3,210 3,204 3,231 3,199 3,245 3,242 3,286 3,188 3,045 2,917 2,791
Business 1,629 1,787 1,910 1,805 1,632 1,522 1,470 1,436 1,469 1,458 1,364
Engineering 860 968 998 1,050 1,090 1,111 1,117 1,222 1,285 1,309 1,259
Nursing 477 472 483 490 476 457 449 453 458 455 428
Visual & Performing Arts 703 686 686 682 575 650 615 560 558 511 476
Includes double and triple majors.
Enr Table 8B Day Graduate Enrollment of Degree Students by College Fall 2016
2006 2007 2008 2009 2010 2011 2012 2013 2014 2015 2016
Totals 696 668 667 731 1,145 1,201 1,156 1,135 1,199 1,188 1,176
Arts & Sciences 139 148 138 150 155 150 150 236 239 237 221College of Arts & Sciences 139 148 138 150 155 150 150 161 160 157 147School of Education 75 79 80 74
Business 80 77 73 105 139 133 158 178 242 198 232
Engineering 273 242 225 226 250 254 219 219 254 310 316
Nursing 76 69 71 75 97 107 101 103 116 123 109
Visual & Performing Arts 96 93 82 91 87 88 82 85 78 64 62
School of Education, Public Policy & Civic Engagement 25 30 36 72 74 * * * *
School of Marine Science/Technology 32 39 53 54 65 62 58 56 55 51 50
School of Law 316 335 314 258 215 205 186
These tables display all degree students enrolled in day classes, distributed by college of their major and identified by their enrollment status. The graduate table includes students enrolled in formal certificate programs and double majors.*School of Education, Public Policy, & Civic Engagement were shown in Arts & Sciences prior to 2008 and returned as School of Education in 2014.

Enr Table 8C University Extension Enrollment of Degree Students by College Fall 2016
Office of Institutional Research and Assessment 9 Data Book
2006 2007 2008 2009 2010 2011 2012 2013 2014 2015 2016
Totals 1,094 1,046 777 863 1,177 1,062 1,128 1,125 1,171 1,173 1,328
Arts & Sciences 636 621 272 266 460 419 434 581 546 481 526College of Arts & Sciences 636 621 272 266 460 419 434 383 447 409 430School of Education 198 99 72 96
Business 323 309 234 252 314 309 327 381 411 461 524
Engineering 38 33 11 8 45 3 29 11 21 36 69
Nursing 70 72 80 63 58 67 88 125 161 172 185
Visual & Performing Arts 27 11 10 10 19 17 23 19 26 19 20
School of Educ, Pub. Policy, & Civic Engagement 170 256 272 243 225 * * * *
School of Marine Science/Technology 0 0 0 8 9 1 1 6 5 2 0
School of Law 3 1 2 1 2 4
Data include Undergraduate and Graduate enrollment together.Major data exclude non-degree students.*School of Education, Public Policy, & Civic Engagement were shown in Arts & Sciences prior to 2008 and returned as School of Education in 2014.Includes double/triple majors.
Office of Institutional Research and Assessment 10 Data Book
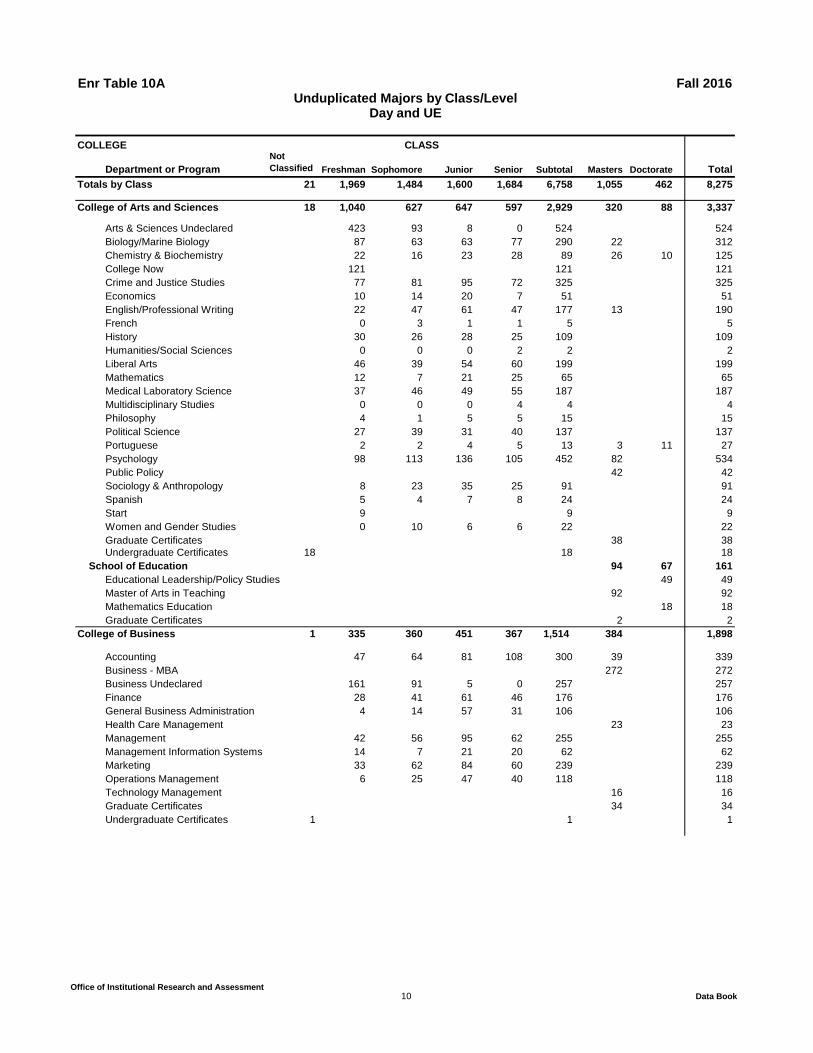
Enr Table 10A Fall 2016
COLLEGE
Department or ProgramNot Classified Freshman Sophomore Junior Senior Subtotal Masters Doctorate Total
Totals by Class 21 1,969 1,484 1,600 1,684 6,758 1,055 462 8,275
College of Arts and Sciences 18 1,040 627 647 597 2,929 320 88 3,337
Arts & Sciences Undeclared 423 93 8 0 524 524Biology/Marine Biology 87 63 63 77 290 22 312Chemistry & Biochemistry 22 16 23 28 89 26 10 125College Now 121 121 121Crime and Justice Studies 77 81 95 72 325 325Economics 10 14 20 7 51 51English/Professional Writing 22 47 61 47 177 13 190French 0 3 1 1 5 5History 30 26 28 25 109 109Humanities/Social Sciences 0 0 0 2 2 2Liberal Arts 46 39 54 60 199 199Mathematics 12 7 21 25 65 65Medical Laboratory Science 37 46 49 55 187 187Multidisciplinary Studies 0 0 0 4 4 4Philosophy 4 1 5 5 15 15Political Science 27 39 31 40 137 137Portuguese 2 2 4 5 13 3 11 27Psychology 98 113 136 105 452 82 534Public Policy 42 42Sociology & Anthropology 8 23 35 25 91 91Spanish 5 4 7 8 24 24Start 9 9 9Women and Gender Studies 0 10 6 6 22 22Graduate Certificates 38 38Undergraduate Certificates 18 18 18
School of Education 94 67 161Educational Leadership/Policy Studies 49 49Master of Arts in Teaching 92 92Mathematics Education 18 18Graduate Certificates 2 2
College of Business 1 335 360 451 367 1,514 384 1,898
Accounting 47 64 81 108 300 39 339Business - MBA 272 272Business Undeclared 161 91 5 0 257 257Finance 28 41 61 46 176 176General Business Administration 4 14 57 31 106 106Health Care Management 23 23Management 42 56 95 62 255 255Management Information Systems 14 7 21 20 62 62Marketing 33 62 84 60 239 239Operations Management 6 25 47 40 118 118Technology Management 16 16Graduate Certificates 34 34Undergraduate Certificates 1 1 1
CLASS
Unduplicated Majors by Class/LevelDay and UE

Office of Institutional Research and Assessment 11 Data Book
Enr Table 10A Fall 2016
COLLEGE
Department or ProgramNot Classified Freshman Sophomore Junior Senior Subtotal Masters Doctorate Total
CLASS
Unduplicated Majors by Class/LevelDay and UE
College of Engineering 361 270 278 352 1,261 243 78 1,582
Bioengineering 35 27 33 39 134 134BioMedical Engineering/BioTechnology 20 20Civil Engineering 30 37 33 50 150 9 159Computer Engineering 23 16 24 27 90 20 110Computer Science 108 58 65 70 301 122 423Data Science 2 3 3 2 10 11 21Electrical Engineering 21 30 42 49 142 29 27 198Engineering and Applied Sciences 31 31Engineering Undeclared 63 4 1 0 68 68Mechanical Engineering 73 88 66 107 334 30 364Physics 6 7 11 8 32 19 51Graduate Certificates 3 3
College of Nursing 123 125 119 238 605 20 87 712
Nursing 122 101 90 117 430 20 87 537Registered Nurse Program 1 24 29 121 175 175
College of Visual & Performing Arts 2 110 102 105 130 449 62 511
Art Education 4 14 7 11 36 20 56Art History 1 1 4 4 10 10Artisanry 3 7 7 4 21 13 34Fine Arts 12 12Foundation Undeclared 27 4 1 0 32 32Music 15 10 9 13 47 47Painting/2D 3 6 6 5 20 20Sculpture/3D 2 1 3 4 10 10Visual Design 55 59 68 89 271 11 282Graduate Certificates 6 6Undergraduate Certificates 2 2 2
School of Law 185 185
School of Marine Science & Technology 26 24 50
Doctorate counts include BioMedical Engineering/Biotechnology students in the following departments: 10 Biology, 4 Bioengineering, 4 Chemistry, and2 undeclared.Shown are counts of students in declared majors registered in Fall 2016.Students with double/triple majors are shown on next table. Non-degree students are not shown.Pathways are shown in colleges - CAS (67 Freshmen & 1 Sophomore); CCB (27 Freshmen & 1 Sophomore); CEGR (22 Freshmen & 1 Sophomore); CVPA (7 Freshmen)

Office of Institutional Research and Assessment 12 Data Book
Enr Table 10B Fall 2016
COLLEGE
Department or ProgramNot Classified Freshman Sophomore Junior Senior Subtotal Masters Doctorate Total
Totals by Class 9 8 31 53 79 180 20 6 206
College of Arts and Sciences 9 1 15 28 44 97 2 6 105
Arts & Sciences Undeclared 0 0 0 0 0 0Biology/Marine Biology 0 0 0 4 4 4Chemistry & Biochemistry 0 0 0 0 0 6 6Crime and Justice Studies 0 2 4 7 13 13Economics 0 0 0 2 2 2English/Professional Writing 0 4 5 4 13 13French 0 0 0 1 1 1History 0 1 1 3 5 5Humanities/Social Sciences 0 0 0 0 0 0Liberal Arts 0 0 0 0 0 0Mathematics 0 1 2 5 8 8Medical Laboratory Science 0 0 0 1 1 1Multidisciplinary Studies 0 0 0 0 0 0Philosophy 0 0 1 1 2 2Political Science 0 1 2 2 5 5Portuguese 0 1 0 1 2 2Psychology 0 3 9 6 18 18Public Policy 0 0Sociology & Anthropology 0 1 0 3 4 4Spanish 1 1 1 3 6 6Women and Gender Studies 0 0 3 1 4 4Graduate Certificates 0Undergraduate Certificates 9 9 9
School of Education 2 0 2Educational Leadership/Policy Studies 1 1Master of Arts in Teaching 1 1Mathematics Education 0Graduate Certificates
College of Business 0 1 2 15 7 25 13 38
Accounting 0 1 2 2 5 5Business - MBA 13 13Business Undeclared 0 0 0 0 0 0Finance 1 0 3 2 6 6General Business Administration 0 0 0 0 0 0Management 0 0 4 0 4 4Management Information Systems 0 0 2 2 4 4Marketing 0 1 1 0 2 2Operations Management 0 0 3 1 4 4Graduate Certificates 0 0Undergraduate Certificates 0 0 0
Unduplicated Major2 and Major3 by Class/LevelDay and UE
CLASS

Office of Institutional Research and Assessment 13 Data Book
Enr Table 10B Fall 2016
COLLEGE
Department or ProgramNot Classified Freshman Sophomore Junior Senior Subtotal Masters Doctorate Total
Unduplicated Major2 and Major3 by Class/LevelDay and UE
CLASS
College of Engineering 0 3 4 4 9 20 3 0 23
Bioengineering 0 0 0 0 0 0BioMedical Engineering/BioTechnology 1 1Civil Engineering 0 0 0 0 0 0Computer Engineering 0 2 1 5 8 8Computer Science 2 0 0 1 3 1 4Data Science 0 0 1 0 1 1Electrical Engineering 0 2 2 3 7 7Engineering and Applied Sciences 0 0 0 0 0 0Engineering Undeclared 1 0 0 0 1 1Mechanical Engineering 0 0 0 0 0 0Physics 0 0 0 0 0 1 1Graduate Certificates 0
College of Nursing 0 0 0 0 0 0 2 0 2
Nursing 0 0 0 0 0 2 2Registered Nurse Program 0 0 0 0 0 0Graduate Certificates 0
College of Visual & Performing Arts 0 3 10 6 19 38 0 38
Art Education 0 0 0 0 0 0Art History 0 0 0 0 0 0Artisanry 0 2 0 1 3 3Fine Arts 0Foundation Undeclared 0 0 0 0 0 0Music 0 0 0 0 0 0Painting/2D 1 0 0 0 1 1Sculpture/3D 0 0 0 1 1 1Visual Design 2 8 6 17 33 33Graduate Certificates 0 0Undergraduate Certificates 0 0 0
School of Law 0
School of Marine Science & Technology 0
Shown are counts of students in declared majors registered in Fall 2016.

Enr Table 11 Unduplicated Minors Fall 2016
Office of Institutional Research and Assessment 14 Data Book
COLLEGEDepartment or Program Freshman Sophomore Junior Senior Total
Total Minors 3 136 39 245 423
College of Arts and Sciences 2 95 33 143 273
Aging and Health 0 8 1 13 22Anthropology 0 1 1 4 6Biochemistry 0 2 0 3 5Black Studies 0 6 3 4 13Chemistry 0 0 0 0 0Communications 0 0 2 2 4Creative Writing 0 0 0 0 0Economics 0 4 1 6 11English: Literature 0 8 1 7 16English: Writing/Comm & Rhetoric 0 6 2 7 15French 0 1 0 2 3History 0 1 0 3 4Indic Studies 0 0 0 0 0Leadership & Civic Engagement 0 0 1 2 3Mathematics 0 3 1 7 11Philosophy 0 5 0 7 12Policy Studies 0 0 0 0 0Political Science 0 2 2 5 9Portuguese 0 1 3 1 5Psychology 0 0 0 0 0Religious Studies 1 4 2 12 19Sociology 0 8 2 11 21Spanish 1 7 3 8 19Sustainability 0 20 1 28 49Urban Studies 0 1 5 5 11Women's and Gender Studies 0 7 2 6 15
College of Business 1 34 2 75 112
Accounting 0 2 0 7 9Business Administration 1 11 0 22 34Finance 0 6 0 14 20Human Resource Management 0 0 0 0 0International Business 0 3 1 8 12Management 0 3 1 9 13Management Info Systems 0 6 0 9 15Marketing 0 1 0 0 1Operations Management 0 2 0 6 8
College of Engineering 0 1 2 7 10
Computer Science 0 1 2 2 5Computer Game Design 0 0 0 0 0Computer Engineering 0 0 0 0 0Electrical Engineering 0 0 0 1 1Environmental Physics 0 0 0 0 0Mechanical Engineering 0 0 0 1 1Mobile Application Development 0 0 0 0 0Physics 0 0 0 2 2Software Engineering 0 0 0 1 1System Software 0 0 0 0 0
College of Nursing 0 0 0 0 0
College of Visual and Performing Arts 0 6 2 20 28
Art History 0 2 0 2 4Ceramics 0 0 0 3 3Drawing 0 1 1 1 3Film and Media Studies 0 1 0 2 3Fine Arts 0 0 0 4 4Jewelry/Metals 0 0 0 1 1Music 0 1 0 1 2Painting 0 0 0 1 1Photography 0 0 0 5 5Sculpture 0 1 0 0 1Textile Design/Fiber Arts 0 0 1 0 1
Shown are counts of students in declared minors registered in Fall 2016.All available minors are shown.Students with double/triple minors are counted twice (count= 29).
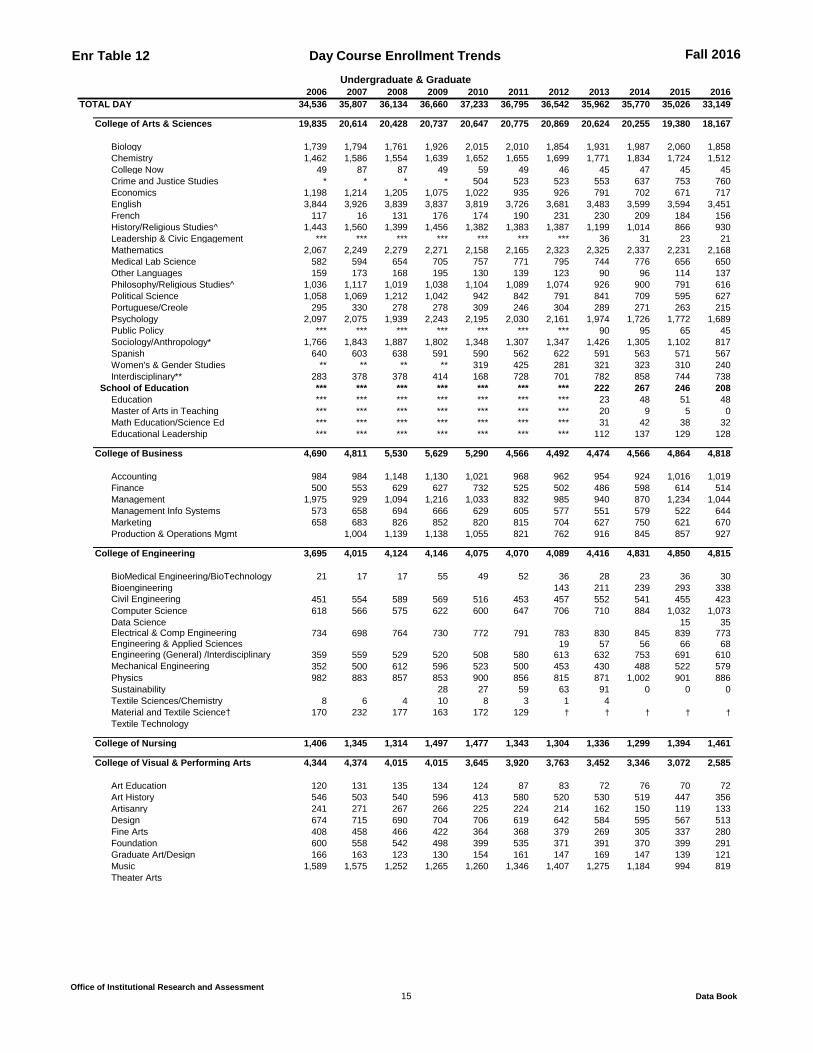
Enr Table 12 Day Course Enrollment Trends Fall 2016
Office of Institutional Research and Assessment 15 Data Book
Undergraduate & Graduate2006 2007 2008 2009 2010 2011 2012 2013 2014 2015 2016
TOTAL DAY 34,536 35,807 36,134 36,660 37,233 36,795 36,542 35,962 35,770 35,026 33,149
College of Arts & Sciences 19,835 20,614 20,428 20,737 20,647 20,775 20,869 20,624 20,255 19,380 18,167
Biology 1,739 1,794 1,761 1,926 2,015 2,010 1,854 1,931 1,987 2,060 1,858 Chemistry 1,462 1,586 1,554 1,639 1,652 1,655 1,699 1,771 1,834 1,724 1,512 College Now 49 87 87 49 59 49 46 45 47 45 45
Crime and Justice Studies * * * * 504 523 523 553 637 753 760Economics 1,198 1,214 1,205 1,075 1,022 935 926 791 702 671 717English 3,844 3,926 3,839 3,837 3,819 3,726 3,681 3,483 3,599 3,594 3,451French 117 16 131 176 174 190 231 230 209 184 156History/Religious Studies^ 1,443 1,560 1,399 1,456 1,382 1,383 1,387 1,199 1,014 866 930Leadership & Civic Engagement *** *** *** *** *** *** *** 36 31 23 21Mathematics 2,067 2,249 2,279 2,271 2,158 2,165 2,323 2,325 2,337 2,231 2,168Medical Lab Science 582 594 654 705 757 771 795 744 776 656 650Other Languages 159 173 168 195 130 139 123 90 96 114 137Philosophy/Religious Studies^ 1,036 1,117 1,019 1,038 1,104 1,089 1,074 926 900 791 616Political Science 1,058 1,069 1,212 1,042 942 842 791 841 709 595 627Portuguese/Creole 295 330 278 278 309 246 304 289 271 263 215Psychology 2,097 2,075 1,939 2,243 2,195 2,030 2,161 1,974 1,726 1,772 1,689Public Policy *** *** *** *** *** *** *** 90 95 65 45Sociology/Anthropology* 1,766 1,843 1,887 1,802 1,348 1,307 1,347 1,426 1,305 1,102 817Spanish 640 603 638 591 590 562 622 591 563 571 567Women's & Gender Studies ** ** ** ** 319 425 281 321 323 310 240Interdisciplinary** 283 378 378 414 168 728 701 782 858 744 738
School of Education *** *** *** *** *** *** *** 222 267 246 208Education *** *** *** *** *** *** *** 23 48 51 48Master of Arts in Teaching *** *** *** *** *** *** *** 20 9 5 0Math Education/Science Ed *** *** *** *** *** *** *** 31 42 38 32Educational Leadership *** *** *** *** *** *** *** 112 137 129 128
College of Business 4,690 4,811 5,530 5,629 5,290 4,566 4,492 4,474 4,566 4,864 4,818
Accounting 984 984 1,148 1,130 1,021 968 962 954 924 1,016 1,019Finance 500 553 629 627 732 525 502 486 598 614 514Management 1,975 929 1,094 1,216 1,033 832 985 940 870 1,234 1,044Management Info Systems 573 658 694 666 629 605 577 551 579 522 644Marketing 658 683 826 852 820 815 704 627 750 621 670Production & Operations Mgmt 1,004 1,139 1,138 1,055 821 762 916 845 857 927
College of Engineering 3,695 4,015 4,124 4,146 4,075 4,070 4,089 4,416 4,831 4,850 4,815
BioMedical Engineering/BioTechnology 21 17 17 55 49 52 36 28 23 36 30Bioengineering 143 211 239 293 338Civil Engineering 451 554 589 569 516 453 457 552 541 455 423Computer Science 618 566 575 622 600 647 706 710 884 1,032 1,073Data Science 15 35Electrical & Comp Engineering 734 698 764 730 772 791 783 830 845 839 773Engineering & Applied Sciences 19 57 56 66 68Engineering (General) /Interdisciplinary 359 559 529 520 508 580 613 632 753 691 610Mechanical Engineering 352 500 612 596 523 500 453 430 488 522 579Physics 982 883 857 853 900 856 815 871 1,002 901 886Sustainability 28 27 59 63 91 0 0 0Textile Sciences/Chemistry 8 6 4 10 8 3 1 4Material and Textile Science† 170 232 177 163 172 129 † † † † †Textile Technology
College of Nursing 1,406 1,345 1,314 1,497 1,477 1,343 1,304 1,336 1,299 1,394 1,461
College of Visual & Performing Arts 4,344 4,374 4,015 4,015 3,645 3,920 3,763 3,452 3,346 3,072 2,585
Art Education 120 131 135 134 124 87 83 72 76 70 72Art History 546 503 540 596 413 580 520 530 519 447 356Artisanry 241 271 267 266 225 224 214 162 150 119 133Design 674 715 690 704 706 619 642 584 595 567 513Fine Arts 408 458 466 422 364 368 379 269 305 337 280Foundation 600 558 542 498 399 535 371 391 370 399 291Graduate Art/Design 166 163 123 130 154 161 147 169 147 139 121Music 1,589 1,575 1,252 1,265 1,260 1,346 1,407 1,275 1,184 994 819Theater Arts
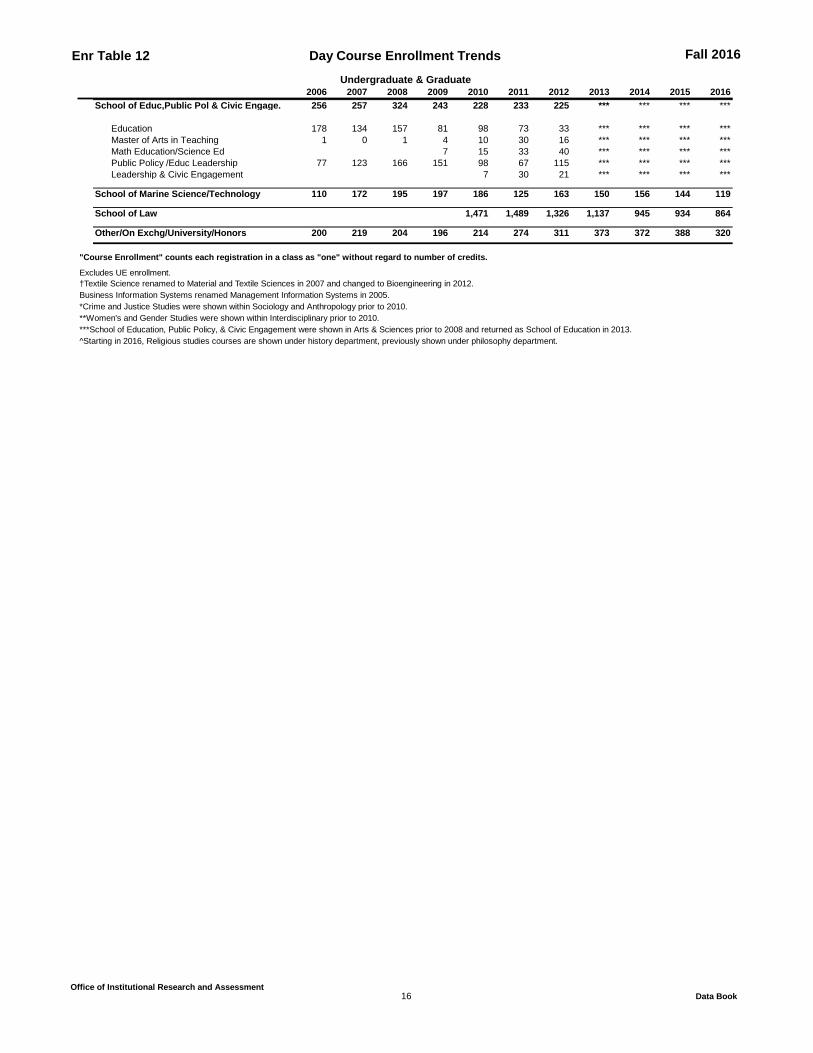
Enr Table 12 Day Course Enrollment Trends Fall 2016
Office of Institutional Research and Assessment 16 Data Book
Undergraduate & Graduate2006 2007 2008 2009 2010 2011 2012 2013 2014 2015 2016
School of Educ,Public Pol & Civic Engage. 256 257 324 243 228 233 225 *** *** *** ***
Education 178 134 157 81 98 73 33 *** *** *** ***Master of Arts in Teaching 1 0 1 4 10 30 16 *** *** *** ***Math Education/Science Ed 7 15 33 40 *** *** *** ***Public Policy /Educ Leadership 77 123 166 151 98 67 115 *** *** *** ***Leadership & Civic Engagement 7 30 21 *** *** *** ***
School of Marine Science/Technology 110 172 195 197 186 125 163 150 156 144 119
School of Law 1,471 1,489 1,326 1,137 945 934 864
Other/On Exchg/University/Honors 200 219 204 196 214 274 311 373 372 388 320
"Course Enrollment" counts each registration in a class as "one" without regard to number of credits.
Excludes UE enrollment.†Textile Science renamed to Material and Textile Sciences in 2007 and changed to Bioengineering in 2012.Business Information Systems renamed Management Information Systems in 2005.*Crime and Justice Studies were shown within Sociology and Anthropology prior to 2010.**Women's and Gender Studies were shown within Interdisciplinary prior to 2010.***School of Education, Public Policy, & Civic Engagement were shown in Arts & Sciences prior to 2008 and returned as School of Education in 2013.^Starting in 2016, Religious studies courses are shown under history department, previously shown under philosophy department.

Enr Table 13A Day Course Enrollment by College Fall 2016
Office of Institutional Research and Assessment 17 Data Book
COURSE ENROLLMENT Undergraduate Graduate Total
Reg
istr
atio
ns
Sect
ions
Reg
ular
Indi
vidu
aliz
ed
Ave
rage
Siz
e
Adj
uste
d A
vera
ge*
Reg
istr
atio
ns
Sect
ions
Reg
ular
Indi
vidu
aliz
ed
Ave
rage
Siz
eA
djus
ted
Ave
rage
*
All
Reg
istr
atio
ns
TOTAL DAY 29,865 1,364 1,164 200 22 25 3,284 566 199 367 6 14 33,149College of Arts & Sciences 17,565 723 650 73 24 27 602 156 50 106 4 9 18,167
Biology 1,809 63 56 7 29 32 49 24 3 21 2 7 1,858 Chemistry 1,396 70 60 10 20 23 116 33 9 24 4 8 1,512 College Now (BRF) 45 3 3 0 15 15 45
Crime and Justice Studies 760 29 28 1 26 27 760Economics 717 22 21 1 33 34 717English 3,409 147 138 9 23 25 42 11 5 6 4 7 3,451French 156 11 10 1 14 15 156History/Religious Studies^ 927 36 33 3 26 28 3 1 0 1 3 0 930Leadership & Civic Engagement 21 2 2 0 11 11 21Mathematics 2,146 79 69 10 27 31 22 6 2 4 4 7 2,168Medical Lab Science 649 19 19 0 34 34 1 1 0 1 1 0 650Other Languages 137 8 7 1 17 19 137Philosophy 616 20 19 1 31 32 616Political Science 627 24 21 3 26 30 627Portuguese/Creole 187 15 13 2 12 14 28 15 2 13 2 6 215Psychology 1,544 58 40 18 27 38 145 22 10 12 7 13 1,689Public Policy 45 2 2 0 23 23 45Sociology/Anthropology/Urban Studies 817 32 30 2 26 27 817Spanish 567 27 26 1 21 22 567Women's & Gender Studies 240 16 15 1 15 16 240Interdisciplinary 738 39 37 2 19 20 738
12 1 1 0 12 12 196 43 19 24 5 8 208Education 12 1 1 0 12 12 36 10 5 5 4 5 48Master of Arts in Teaching 0 0 0 0 0 0 0Math Education/Science Ed 32 15 1 14 2 6 32Educational Leadership 128 18 13 5 7 9 128
Charlton College of Business 4,276 140 129 11 31 33 542 41 25 16 13 21 4,818
Accounting 879 32 29 3 27 30 140 12 9 3 12 15 1,019Finance 458 15 14 1 31 33 56 4 2 2 14 26 514Management 949 33 33 0 29 29 95 7 4 3 14 23 1,044Management Info Systems 554 18 15 3 31 37 90 6 4 2 15 22 644Marketing 588 19 16 3 31 36 82 6 3 3 14 26 670Production & Operations Mgmt 848 23 22 1 37 39 79 6 3 3 13 25 927
College of Engineering 4,024 168 156 12 24 26 791 173 40 133 5 16 4,815
BioMedical Engineering/BioTechnology 30 22 2 20 1 5 30Bioengineering 330 17 17 0 19 19 8 2 1 1 4 5 338Civil Engineering 408 16 16 0 26 26 15 10 0 10 2 0 423Computer Science 732 27 25 2 27 29 341 24 13 11 14 25 1,073Data Science 24 2 2 0 12 12 11 3 1 2 4 8 35Electrical & Comp Engineering 580 28 26 2 21 22 193 52 10 42 4 14 773Engineering & Applied Sciences 68 27 4 23 3 11 68Engineering (General)/Interdisciplinary 609 21 19 2 29 32 1 1 0 1 1 0 610Mechanical Engineering 504 27 23 4 19 22 75 20 5 15 4 11 579Physics 837 30 28 2 28 30 49 12 4 8 4 10 886
School of Education**

Enr Table 13A Day Course Enrollment by College Fall 2016
Office of Institutional Research and Assessment 18 Data Book
COURSE ENROLLMENT Undergraduate Graduate Total
Reg
istr
atio
ns
Sect
ions
Reg
ular
Indi
vidu
aliz
ed
Ave
rage
Siz
e
Adj
uste
d A
vera
ge*
Reg
istr
atio
ns
Sect
ions
Reg
ular
Indi
vidu
aliz
ed
Ave
rage
Siz
eA
djus
ted
Ave
rage
*
All
Reg
istr
atio
ns
College of Nursing 1,243 72 71 1 17 17 218 28 19 9 8 10 1,461
College of Visual & Performing Arts 2,428 231 141 90 11 16 157 66 10 56 2 8 2,585
Art Education 46 7 6 1 7 7 26 10 3 7 3 5 72Art History 346 12 11 1 29 31 10 1 1 0 10 10 356Artisanry 133 20 13 7 7 10 133Design 513 42 38 4 12 13 513Fine Arts 280 25 20 5 11 14 280Foundation 291 15 13 2 19 22 291Graduate Art/Design 121 55 6 49 2 9 121Music 819 110 40 70 7 18 819
School of Marine Science/Technology 13 1 1 0 13 13 106 37 10 27 3 7 119
864 61 45 16 14 19 864
Honors 119 7 7 0 17 17 119Navitas 27 3 2 1 9 13 0 0 0 0 0 0 27University 130 5 5 0 26 26 130American Language & Cultures 21 2 2 0 11 11 21On Exchange / Military / Other UMass 19 12 0 12 2 0 4 4 0 4 1 0 23
"Course Enrollment" counts each registration in a class as "one" without regard to number of credits.
Excludes UE enrollment.*Adjusted average excludes individualized sections.^Religious studies courses are shown under history department, previously shown under philosophy department.**School of Education, Public Policy, & Civic Engagement were shown in Arts & Sciences prior to 2008 and returned as School of Education in 2013.
School of Law

Enr Table 13B UE Course Enrollment by College Fall 2016
Office of Institutional Research and Assessment 19 Data Book
COURSE ENROLLMENT Undergraduate Graduate Total
Reg
istr
atio
ns
Sect
ions
Reg
ular
Indi
vidu
aliz
ed
Ave
rage
Siz
e
Adj
uste
d A
vera
ge*
Reg
istr
atio
ns
Sect
ions
Reg
ular
Indi
vidu
aliz
ed
Ave
rage
Siz
e
Adj
uste
d A
vera
ge*
Reg
istr
atio
ns
TOTAL UE COURSES 2,192 197 140 57 11 15 1,062 93 72 21 11 14 3,254
College of Arts & Sciences 1,139 90 75 15 13 15 386 56 39 17 7 9 1,525
Biology 0 0 0 0 0 0 0Chemistry 0 0 0 0 0 0 0Crime and Justice Studies 69 7 5 2 10 13 69Economics 37 4 3 1 9 12 37English 221 15 14 1 15 16 33 4 4 0 8 8 254French 8 1 1 0 8 8 1 1 0 1 1 0 9History/Religious Studies^ 73 4 4 0 18 18 20 3 2 1 7 10 93Mathematics 178 15 13 2 12 13 178Medical Laboratory Science 14 2 2 0 7 7 14Other Languages 0 0 0 0 0 0 8 2 2 0 4 4 8Philosophy 69 4 4 0 17 17 69Political Science 144 9 8 1 16 18 144Portuguese/Creole 15 3 1 2 5 13 6 3 0 3 2 0 21Psychology 49 4 3 1 12 16 62 7 4 3 9 14 111Public Policy 135 14 12 2 10 11 135Sociology/Anthropology 117 8 7 1 15 17 117Spanish 60 6 4 2 10 15 2 1 0 1 2 0 62Women's & Gender Studies 48 4 4 0 12 12 48Interdisciplinary 37 4 2 2 9 17 37
119 21 15 6 6 7 119Education 96 16 12 4 6 7 96Master of Arts in Teaching 0 0 0 0 0 0 0Math Education/Science Ed 23 5 3 2 5 7 23Educational LeadershipLeadership & Civic Engagement 0 0 0 0 0 0 0
Charlton College of Business 427 29 23 6 15 18 569 28 27 1 20 21 996
Accounting 45 8 4 4 6 9 118 4 4 0 30 30 163Finance 101 5 5 0 20 20 135 6 6 0 23 23 236Management 82 5 4 1 16 20 109 5 5 0 22 22 191Management Info Systems 51 4 3 1 13 16 43 3 3 0 14 14 94Marketing 61 3 3 0 20 20 48 4 4 0 12 12 109Production & Operations Mgmt 87 4 4 0 22 22 116 6 5 1 19 23 203
College of Engineering 85 23 7 16 4 8 50 5 3 2 10 16 135
Civil Engineering 12 4 0 4 3 0 0 0 0 0 0 0 12Computer Science 33 10 3 7 3 6 43 2 2 0 22 22 76Electrical & Computer Engineering 8 2 2 0 4 4 5 1 1 0 5 5 13Engineering (General)/Interdisciplinary 1 1 0 1 1 0 1Engineering and Applied Science 1 1 0 1 1 0 1Mechanical Engineering 1 1 0 1 1 0 0 0 0 0 0 0 1Physics 30 5 2 3 6 14 1 1 0 1 1 0 31
School of Education**

Enr Table 13B UE Course Enrollment by College Fall 2016
Office of Institutional Research and Assessment 20 Data Book
COURSE ENROLLMENT Undergraduate Graduate Total
Reg
istr
atio
ns
Sect
ions
Reg
ular
Indi
vidu
aliz
ed
Ave
rage
Siz
e
Adj
uste
d A
vera
ge*
Reg
istr
atio
ns
Sect
ions
Reg
ular
Indi
vidu
aliz
ed
Ave
rage
Siz
e
Adj
uste
d A
vera
ge*
Reg
istr
atio
ns
College of Nursing 373 28 28 0 13 13 1 1 0 1 1 0 374
College of Visual & Performing Arts 52 12 3 9 4 13 0 0 0 0 0 0 52
Art Education 0 0 0 0 0 0 0Art History 34 2 2 0 17 17 34Foundation 14 7 1 6 2 6 14Design 4 3 0 3 1 0 0 0 0 0 0 0 4Music 0 0 0 0 0 0 0
School of Marine Science/Technology 0 0 0 0 0 0 0
University 106 5 4 1 21 26 0 0 0 0 0 0 106Honors 0 0 0 0 0 0 0 0 0 0 0 0 0American Language & Cultures 10 10 0 10 1 0 0 0 0 0 0 0 10Navitas 0 0 0 0 0 0 56 3 3 0 19 19 56On Exchange 0 0 0 0 0 0 0 0 0 0 0 0 0
"Course Enrollment" counts each registration in a class as "one" without regard to number of credits.
*Adjusted average excludes individualized sections.Individualized sections are determined as any section in which 1, 2, or 3 students are enrolled.**School of Education, Public Policy, & Civic Engagement were shown in Arts & Sciences prior to 2008 and returned as School of Education in 2013.^Religious studies courses are shown under history department, previously shown under philosophy department.

Enr Table 14 University Extension Summer 2016
Office of Institutional Research and Assessment 21 Data Book
Headcount 1,591 71.7% 628 28.3% 2,219FTE 515.8 63.1% 301.7 36.9% 817.5Registrations 2,654 73.1% 977 26.9% 3,631
Major by College (1)
Arts & Sciences 464 29.2% 67 10.7% 531 23.9%Business 324 20.4% 181 28.8% 505 22.8%Engineering 161 10.1% 28 4.5% 189 8.5%Nursing 99 6.2% 28 4.5% 127 5.7%Visual & Perf. Arts 50 3.1% 12 1.9% 62 2.8%Law - 62 9.9% 62 2.8%Education - 106 16.9% 106 4.8%SMAST - 1 0.2% 1 0.0%UE/Other 493 31.0% 143 22.8% 636 28.7%
GenderFemale 806 50.7% 368 58.6% 1,174 52.9%Male 726 45.6% 256 40.8% 982 44.3%Transgender 1 0.1% 0 0.0% 1 0.0%Unknown 58 3.6% 4 0.6% 62 2.8%
Permanent StateMassachusetts 1,330 83.6% 429 68.3% 1,759 79.3%Out-of-State 171 10.7% 97 15.4% 268 12.1%International 86 5.4% 99 15.8% 185 8.3%Unknown 4 0.3% 3 0.5% 7 0.3%
Diversity (2)
Students of Color 329 28.1% 97 20.0% 426 25.7%Cape Verdean 30 2.6% 8 1.6% 38 2.3%Black 127 10.8% 25 5.1% 152 9.2%AmIndian/Alaskan Native. 2 0.2% 1 0.2% 3 0.2%Asian 47 4.0% 21 4.3% 68 4.1%Hawaiian/Pacific Islander 0 0.0% 0 0.0% 0 0.0%Hispanic 83 7.1% 28 5.8% 111 6.7%Two or more races 40 3.4% 14 2.9% 54 3.3%
White 842 71.9% 389 80.0% 1,231 74.3%Not Specified 334 - 43 - 377 -Non Resident Alien 86 - 99 - 185 -
Enrollment StatusFull-Time 70 4.4% 39 6.2% 109 4.9%Part-Time 1,521 95.6% 589 93.8% 2,110 95.1%
Field of Study (3)
Area,Ethnic,Gender Studies 7 0.4% - 7 0.3%Computer Science 19 1.2% 9 1.4% 28 1.3%Education 7 0.4% 79 12.6% 86 3.9%Engineering 136 8.5% 14 2.2% 150 6.8%Foreign Language/Literature 3 0.2% 0 0.0% 3 0.1%English Language/Literature 35 2.2% 0 0.0% 35 1.6%Legal Prof & Studies - 62 9.9% 62 2.8%Liberal Arts and Science 65 4.1% - 65 2.9%Biological/Life Sciences 39 2.5% 1 0.2% 40 1.8%Mathematics 13 0.8% - 13 0.6%Multi/Interdisciplinary Studies 2 0.1% 6 1.0% 8 0.4%Philosophy 3 0.2% - 3 0.1%Physical Sciences 25 1.6% 1 0.2% 26 1.2%Psychology 66 4.1% 42 6.7% 108 4.9%Public Administration/Soc Srvc - 60 9.6% 60 2.7%Social Sciences 125 7.9% - 125 5.6%Visual and Performing Arts 43 2.7% 2 0.3% 45 2.0%Health Professions 142 8.9% 28 4.5% 170 7.7%Business 325 20.4% 181 28.8% 506 22.8%History 23 1.4% - 23 1.0%Liberal Arts Undeclared 21 1.3% - 21 0.9%Alternative Admissions 0 0.0% - 0 0.0%Non-Degree Students 492 30.9% 143 22.8% 635 28.6%
Data includes Maymester. (1) Non-degree included under Other.(2) Students of Color percentages do not include "not specified" or "non resident alien."(3) Field of study based on CIP code classification of student's first declared major. On Exchange, Continuations, and zero credit courses account for 56 students.
Undergrad Grad Total

ADMISSION TABLES

Adm Table 1A Admissions Trends: All First-Time Freshmen Fall 2016
Office of Institutional Research and Assessment 22 Data Book
#Applications %Accepted #Accepted %Denied #Denied %Yield #Enrolled
Fall 2016 8,211 76% 6,242 22% 1,795 22% 1,367
Fall 2015 7,591 76% 5,789 21% 1,579 25% 1,431
Fall 2014 7,472 77% 5,740 22% 1,646 26% 1,509
Fall 2013 8,496 76% 6,471 22% 1,838 23% 1,519
Fall 2012 8,574 74% 6,306 24% 2,070 25% 1,576
Fall 2011 8,631 68% 5,892 27% 2,339 27% 1,570
Fall 2010 8,585 74% 6,315 26% 2,196 27% 1,707
Fall 2009 7,910 71% 5,637 28% 2,176 32% 1,806
Fall 2008 8,214 67% 5,511 32% 2,593 32% 1,786
Fall 2007 8,004 69% 5,535 31% 2,454 35% 1,926
Fall 2006 7,527 69% 5,206 30% 2,248 34% 1,788
Fall 2005 6,933 75% 5,231 24% 1,643 33% 1,727
Fall 2004 6,483 70% 4,525 29% 1,880 33% 1,474
Fall 2003 6,423 72% 4,642 27% 1,719 33% 1,523
Fall 2002 6,605 72% 4,783 27% 1,799 36% 1,708
Yield = enrolled/accepted.Data include Alternative Admissions and Pathways/UE.
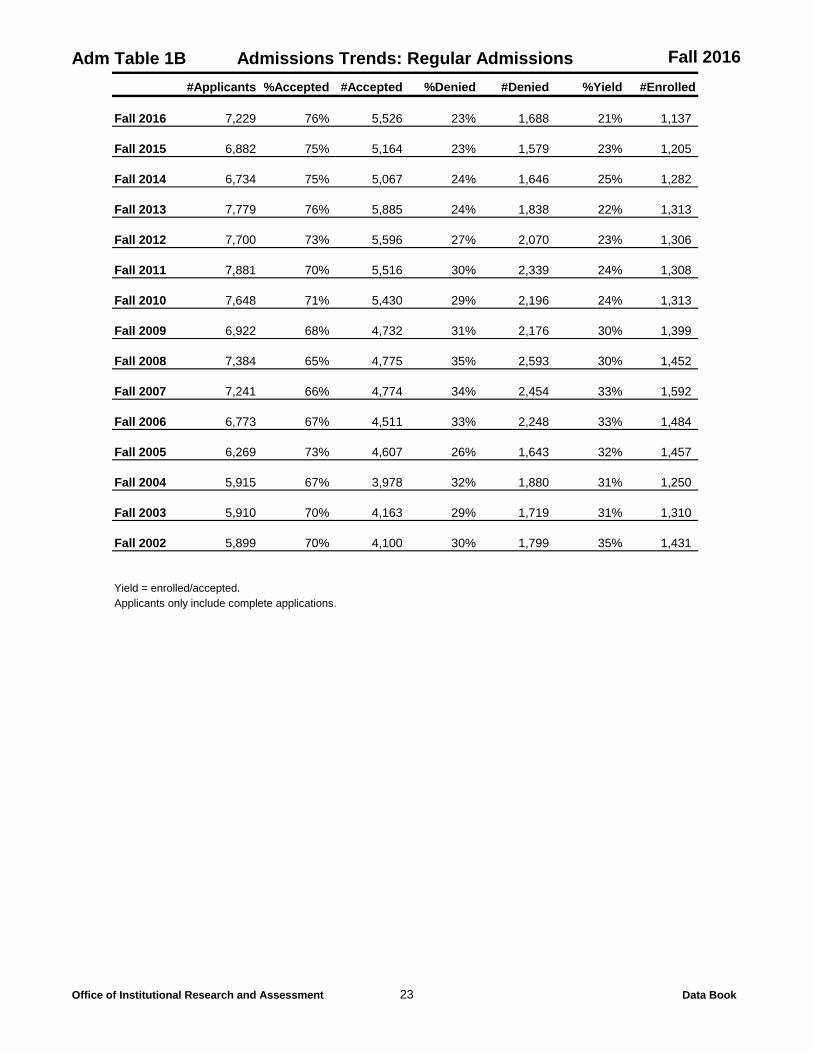
Adm Table 1B Admissions Trends: Regular Admissions Fall 2016
Office of Institutional Research and Assessment 23 Data Book
#Applicants %Accepted #Accepted %Denied #Denied %Yield #Enrolled
Fall 2016 7,229 76% 5,526 23% 1,688 21% 1,137
Fall 2015 6,882 75% 5,164 23% 1,579 23% 1,205
Fall 2014 6,734 75% 5,067 24% 1,646 25% 1,282
Fall 2013 7,779 76% 5,885 24% 1,838 22% 1,313
Fall 2012 7,700 73% 5,596 27% 2,070 23% 1,306
Fall 2011 7,881 70% 5,516 30% 2,339 24% 1,308
Fall 2010 7,648 71% 5,430 29% 2,196 24% 1,313
Fall 2009 6,922 68% 4,732 31% 2,176 30% 1,399
Fall 2008 7,384 65% 4,775 35% 2,593 30% 1,452
Fall 2007 7,241 66% 4,774 34% 2,454 33% 1,592
Fall 2006 6,773 67% 4,511 33% 2,248 33% 1,484
Fall 2005 6,269 73% 4,607 26% 1,643 32% 1,457
Fall 2004 5,915 67% 3,978 32% 1,880 31% 1,250
Fall 2003 5,910 70% 4,163 29% 1,719 31% 1,310
Fall 2002 5,899 70% 4,100 30% 1,799 35% 1,431
Yield = enrolled/accepted.Applicants only include complete applications.

Adm Table 1C Admissions Trends: Alternative Admissions Fall 2016
Office of Institutional Research and Assessment 24 Data Book
#Applications %Accepted #Accepted %Yield #Enrolled
Fall 2016 516 49% 255 50% 127
Fall 2015 326 74% 242 48% 116
Fall 2014 308 79% 244 52% 127
Fall 2013 340 61% 209 58% 122
Fall 2012 363 61% 220 62% 137
Fall 2011 283 69% 195 62% 121
Fall 2010 220 76% 168 76% 127
Fall 2009 227 63% 144 78% 112
Fall 2008 249 62% 155 67% 104
Fall 2007 147 99% 145 74% 108
Fall 2006 199 70% 140 77% 108
Fall 2005 163 75% 123 72% 88
Fall 2004 134 84% 113 71% 80
Fall 2003 139 76% 105 78% 82
Fall 2002 140 84% 117 82% 96
Yield = enrolled/accepted.Alternative admissions are included within the freshman counts in Table 1A.Alternative admissions include College Now and Start program students.Applicants only include complete applications.

Adm Table 1D Admissions Trends: Pathways/UE FY Admissions Fall 2016
Office of Institutional Research and Assessment 25 Data Book
#Applications %Accepted #Accepted %Yield #Enrolled
Fall 2016 466 99% 461 22% 103
Fall 2015 383 100% 383 29% 110
Fall 2014 430 100% 429 23% 100
Fall 2013 377 100% 377 22% 84
Fall 2012 511 96% 490 27% 133
Fall 2011 467 39% 181 78% 141
Fall 2010 717 100% 717 37% 267
Fall 2009 761 100% 761 39% 295
Fall 2008 581 100% 581 40% 230
Fall 2007 616 100% 616 37% 226
Fall 2006 555 100% 555 35% 196
Fall 2005 501 100% 501 36% 182
Fall 2004 434 100% 434 33% 144
Fall 2003 374 100% 374 35% 131
Fall 2002 566 100% 566 32% 181
Yield = enrolled/accepted.Pathways admissions are included within the freshman counts in Table 1A.Applicants only include complete applications.Starting Fall 16, University Extension began accepting freshmen other than Pathways and are included above.
Office of Institutional Research and Assessment 26 Data Book
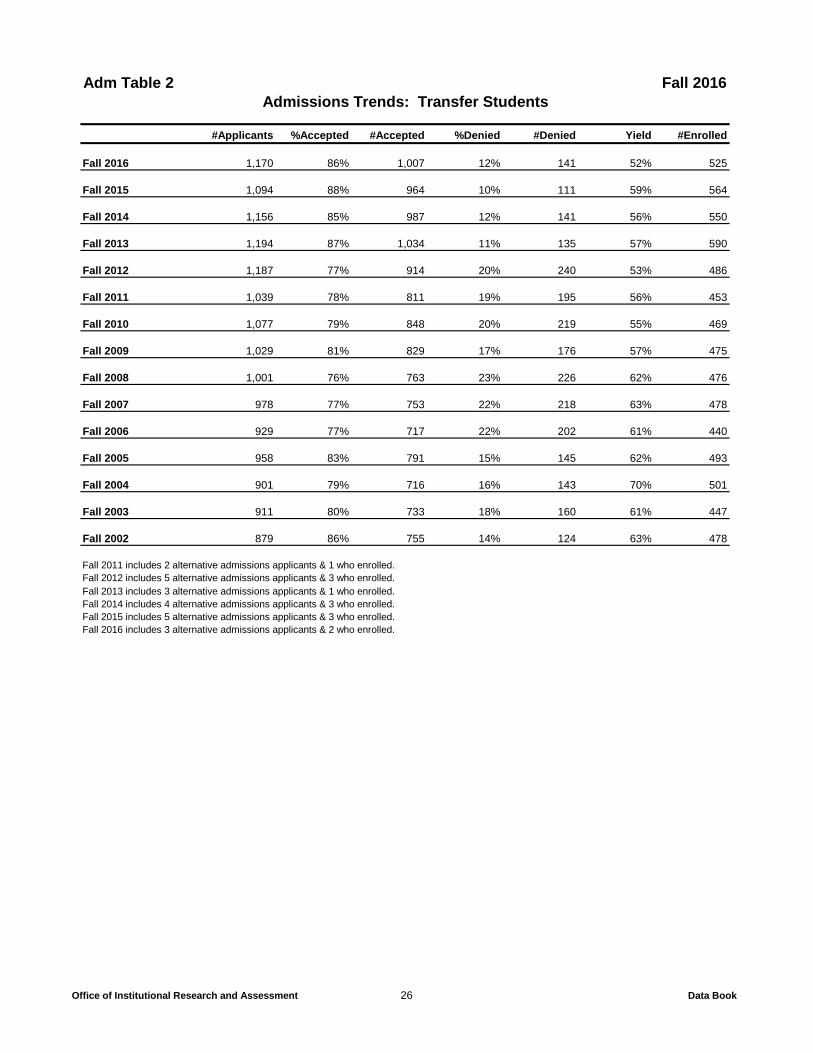
Adm Table 2 Fall 2016
#Applicants %Accepted #Accepted %Denied #Denied Yield #Enrolled
Fall 2016 1,170 86% 1,007 12% 141 52% 525
Fall 2015 1,094 88% 964 10% 111 59% 564
Fall 2014 1,156 85% 987 12% 141 56% 550
Fall 2013 1,194 87% 1,034 11% 135 57% 590
Fall 2012 1,187 77% 914 20% 240 53% 486
Fall 2011 1,039 78% 811 19% 195 56% 453
Fall 2010 1,077 79% 848 20% 219 55% 469
Fall 2009 1,029 81% 829 17% 176 57% 475
Fall 2008 1,001 76% 763 23% 226 62% 476
Fall 2007 978 77% 753 22% 218 63% 478
Fall 2006 929 77% 717 22% 202 61% 440
Fall 2005 958 83% 791 15% 145 62% 493
Fall 2004 901 79% 716 16% 143 70% 501
Fall 2003 911 80% 733 18% 160 61% 447
Fall 2002 879 86% 755 14% 124 63% 478
Fall 2011 includes 2 alternative admissions applicants & 1 who enrolled.Fall 2012 includes 5 alternative admissions applicants & 3 who enrolled.Fall 2013 includes 3 alternative admissions applicants & 1 who enrolled.Fall 2014 includes 4 alternative admissions applicants & 3 who enrolled.Fall 2015 includes 5 alternative admissions applicants & 3 who enrolled.Fall 2016 includes 3 alternative admissions applicants & 2 who enrolled.
Admissions Trends: Transfer Students
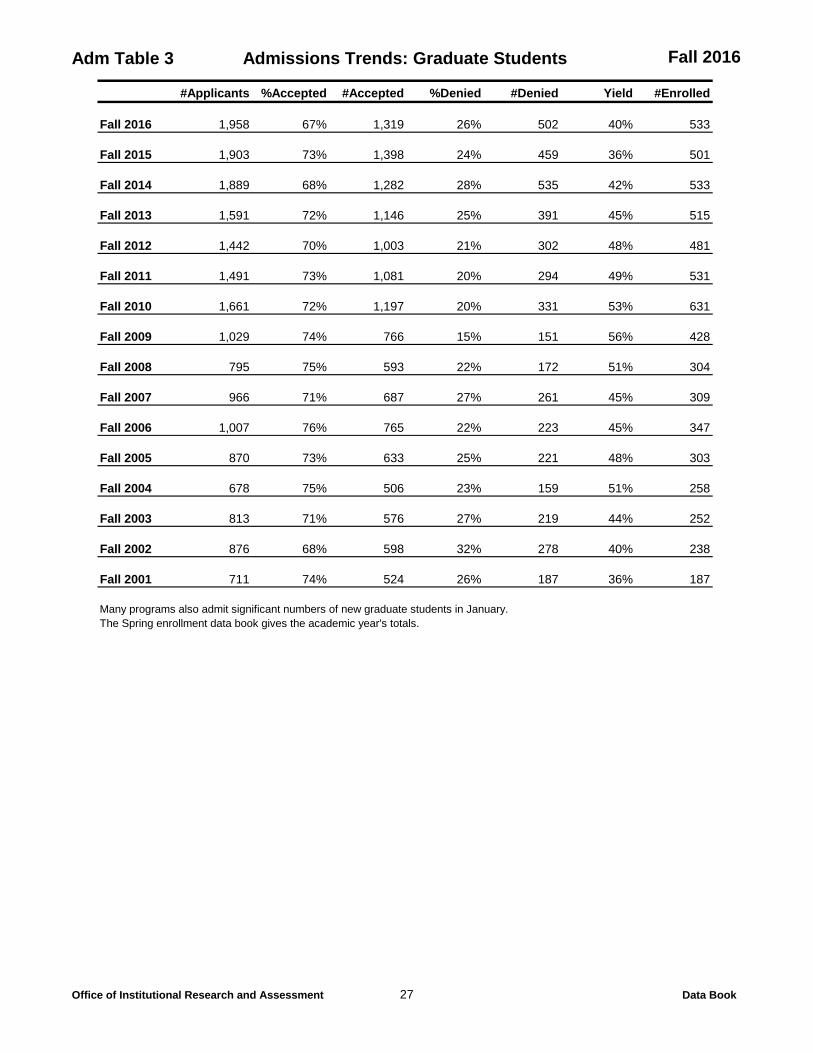
Adm Table 3 Admissions Trends: Graduate Students Fall 2016
Office of Institutional Research and Assessment 27 Data Book
#Applicants %Accepted #Accepted %Denied #Denied Yield #Enrolled
Fall 2016 1,958 67% 1,319 26% 502 40% 533
Fall 2015 1,903 73% 1,398 24% 459 36% 501
Fall 2014 1,889 68% 1,282 28% 535 42% 533
Fall 2013 1,591 72% 1,146 25% 391 45% 515
Fall 2012 1,442 70% 1,003 21% 302 48% 481
Fall 2011 1,491 73% 1,081 20% 294 49% 531
Fall 2010 1,661 72% 1,197 20% 331 53% 631
Fall 2009 1,029 74% 766 15% 151 56% 428
Fall 2008 795 75% 593 22% 172 51% 304
Fall 2007 966 71% 687 27% 261 45% 309
Fall 2006 1,007 76% 765 22% 223 45% 347
Fall 2005 870 73% 633 25% 221 48% 303
Fall 2004 678 75% 506 23% 159 51% 258
Fall 2003 813 71% 576 27% 219 44% 252
Fall 2002 876 68% 598 32% 278 40% 238
Fall 2001 711 74% 524 26% 187 36% 187
Many programs also admit significant numbers of new graduate students in January. The Spring enrollment data book gives the academic year's totals.

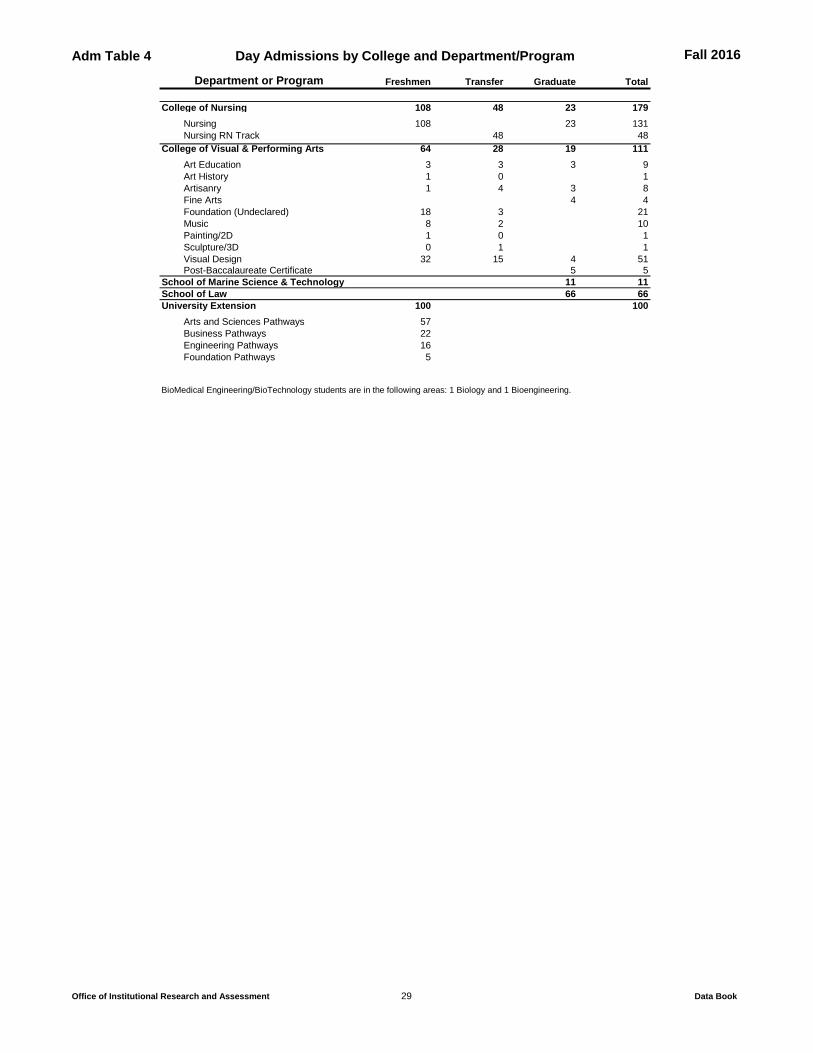
Adm Table 4 Day Admissions by College and Department/Program Fall 2016
Office of Institutional Research and Assessment 28 Data Book
Department or Program Freshmen Transfer Graduate Total
TOTAL NEW STUDENTS 1,367 525 533 2,425
College of Arts & Sciences 629 228 140 997Arts & Sciences Undeclared 194 13 207
Biology 62 25 7 94Chemistry 16 6 6 28College Now 118 2 120Crime & Justice Studies 38 14 52Economics 4 0 4English/Professional Writing 16 19 3 38French 0 1 1History 22 7 29Liberal Arts 27 32 59Mathematics 9 4 13Medical Laboratory Science 23 13 36Multidisciplinary Studies 0 0 0Philosophy 2 0 2Political Science 22 24 46Portuguese 1 2 1 4Psychology 60 48 30 138Public Policy 16 16Sociology & Anthropology 3 9 12Spanish 3 2 5Start 9 0 9Women's & Gender Studies 0 4 4Undergraduate Certificate 0 3 3Post-Baccalaureate Certificate 26 26Post-Master's Certificate 0
School of Education 51 51Educational Leadership 13 13Mathematics Education 2 2Teaching MAT 34 34Post-Baccalaureate Certificate 2 2
College of Business 201 157 171 529Accounting 30 33 20 83Business - MBA 108 108Business (Undeclared) 97 13 110Finance 21 14 35General Business Administration 2 31 33Health Care Management 13 13Management 23 24 47Management Inform. Systems 6 6 12Marketing 21 22 43Operations Management 1 13 14Technology Management 6 6Post-Baccalaureate Certificate 24 24Undergraduate Certificate 1 1
College of Engineering 265 64 103 432Bioengineering 28 4 32BioMedical Engineering/Technology 2 2Civil Engineering 24 8 5 37Computer Science 73 19 40 132Computer Engineering 21 3 9 33Data Science 1 1 5 7Engineering & Applied Science 7 7Electrical Engineering 14 9 14 37Engineering (Undeclared) 48 0 48Mechanical Engineering 51 17 11 79Physics 5 3 7 15Post-Baccalaureate Certificate 3 3
Adm Table 4 Day Admissions by College and Department/Program Fall 2016
Office of Institutional Research and Assessment 29 Data Book
Department or Program Freshmen Transfer Graduate Total
College of Nursing 108 48 23 179Nursing 108 23 131Nursing RN Track 48 48
College of Visual & Performing Arts 64 28 19 111Art Education 3 3 3 9Art History 1 0 1Artisanry 1 4 3 8Fine Arts 4 4Foundation (Undeclared) 18 3 21Music 8 2 10Painting/2D 1 0 1Sculpture/3D 0 1 1Visual Design 32 15 4 51Post-Baccalaureate Certificate 5 5
School of Marine Science & Technology 11 11School of Law 66 66University Extension 100 100
Arts and Sciences Pathways 57Business Pathways 22Engineering Pathways 16Foundation Pathways 5
BioMedical Engineering/BioTechnology students are in the following areas: 1 Biology and 1 Bioengineering.

Adm Table 5 First-Time Freshmen Quality Trend Data Fall 2016
Office of Institutional Research and Assessment 30 Data Book
2007 2008 2009 2010 2011 2012 2013 2014 2015 2016SATsAverage Total SAT 1075 1073 1077 1065 1069 1079 1076 1061 1065 1060
Math 548 546 548 543 545 550 547 539 539 536600+ 24% 23% 25% 25% 22% 26% 25% 22% 21% 21%
500-599 52% 54% 52% 48% 53% 54% 50% 51% 53% 51%400-499 23% 22% 22% 25% 24% 20% 24% 26% 24% 25%
below 400 1% 1% 1% 2% 1% 1% 1% 1% 2% 3%
Verbal 527 527 529 522 525 529 529 522 526 523600+ 16% 16% 17% 15% 17% 18% 19% 17% 17% 16%
500-599 52% 50% 51% 47% 47% 47% 45% 44% 47% 47%400-499 30% 33% 30% 34% 34% 33% 33% 36% 33% 33%
below 400 2% 1% 2% 3% 2% 2% 3% 3% 3% 4%
GPAAverage GPA 3.07 3.10 3.11 3.18 3.20 3.25 3.35 3.23 3.28 3.323.00 or above 53% 56% 56% 59% 62% 69% 69% 68% 72% 76%
2.75 to 2.99 18% 17% 17% 24% 16% 12% 14% 14% 12% 10%2.50 to 2.74 18% 19% 16% 15% 17% 13% 12% 13% 11% 9%Below 2.50 11% 9% 11% 8% 5% 6% 5% 5% 5% 5%%reporting 99% 99% 99% 99% 100% 100% 99% 97% 99% 100%
Data are for those freshman who actually enrolled in the Fall semester, excluding alternative admission students.SATs also exclude adult students three or more years out of high school, students with learning disabilities, and students with GED.Percentage may not add to 100% due to rounding.
2006 Average Total SAT with no exclusions would be 1046 and GPA would be 3.05.2007 Average Total SAT with no exclusions would be 1058 and GPA would be 3.04.2008 Average Total SAT with no exclusions would be 1057 and GPA would be 3.06.2009 Average Total SAT with no exclusions would be 1059 and GPA would be 3.08.2010 Average Total SAT with no exclusions would be 1042 and GPA would be 3.13.Starting in 2011, Pathways included in 'no exclusion' calculations.2011 Average Total SAT with no exclusions would be 1034 and GPA would be 3.13.2012 Average Total SAT with no exclusions would be 1045 and GPA would be 3.17.2013 Average Total SAT with no exclusions would be 1042 and GPA would be 3.29.2014 Average Total SAT with no exclusions would be 1029 and GPA would be 3.15.2015 Average Total SAT with no exclusions would be 1029 and GPA would be 3.20.2016 Average Total SAT with no exclusions would be 1022 and GPA would be 3.21.
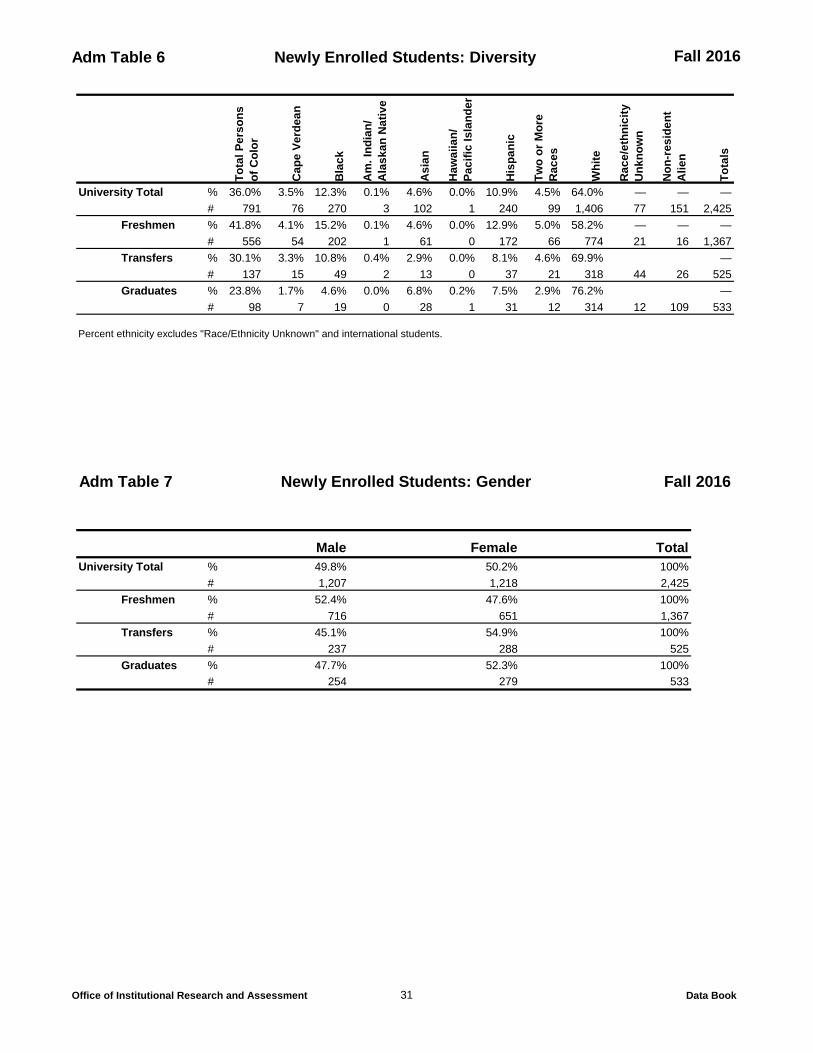
Adm Table 6 Newly Enrolled Students: Diversity Fall 2016
Office of Institutional Research and Assessment 31 Data Book
Tota
l Per
sons
of
Col
or
Cap
e Ve
rdea
n
Bla
ck
Am
. Ind
ian/
A
lask
an N
ativ
e
Asi
an
Haw
aiia
n/
Paci
fic Is
land
er
His
pani
c
Two
or M
ore
Rac
es
Whi
te
Rac
e/et
hnic
ity
Unk
now
n
Non
-res
iden
t A
lien
Tota
ls
University Total % 36.0% 3.5% 12.3% 0.1% 4.6% 0.0% 10.9% 4.5% 64.0% — — —# 791 76 270 3 102 1 240 99 1,406 77 151 2,425
Freshmen % 41.8% 4.1% 15.2% 0.1% 4.6% 0.0% 12.9% 5.0% 58.2% — — —# 556 54 202 1 61 0 172 66 774 21 16 1,367
Transfers % 30.1% 3.3% 10.8% 0.4% 2.9% 0.0% 8.1% 4.6% 69.9% —# 137 15 49 2 13 0 37 21 318 44 26 525
Graduates % 23.8% 1.7% 4.6% 0.0% 6.8% 0.2% 7.5% 2.9% 76.2% —# 98 7 19 0 28 1 31 12 314 12 109 533
Percent ethnicity excludes "Race/Ethnicity Unknown" and international students.
Adm Table 7 Fall 2016
Male Female TotalUniversity Total % 49.8% 50.2% 100%
# 1,207 1,218 2,425Freshmen % 52.4% 47.6% 100%
# 716 651 1,367Transfers % 45.1% 54.9% 100%
# 237 288 525Graduates % 47.7% 52.3% 100%
# 254 279 533
Newly Enrolled Students: Gender

DEGREE TABLES
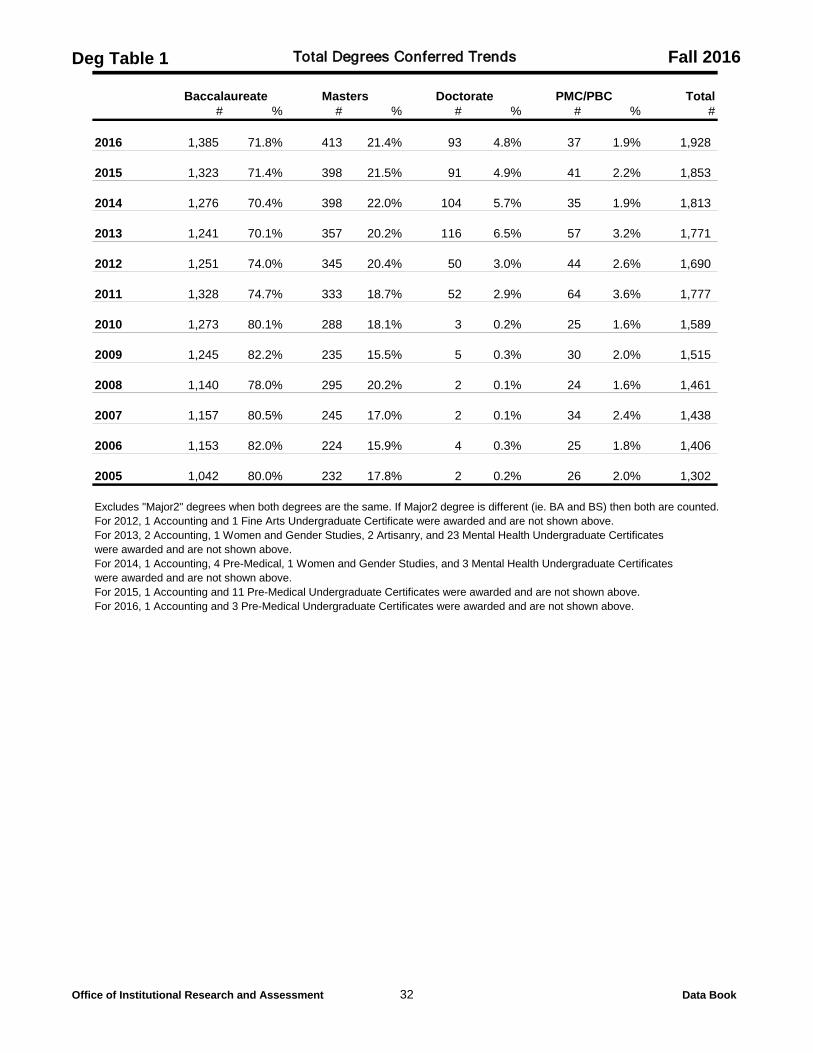
Deg Table 1 Total Degrees Conferred Trends Fall 2016
Office of Institutional Research and Assessment 32 Data Book
Baccalaureate Masters Doctorate PMC/PBC Total# % # % # % # % #
2016 1,385 71.8% 413 21.4% 93 4.8% 37 1.9% 1,928
2015 1,323 71.4% 398 21.5% 91 4.9% 41 2.2% 1,853
2014 1,276 70.4% 398 22.0% 104 5.7% 35 1.9% 1,813
2013 1,241 70.1% 357 20.2% 116 6.5% 57 3.2% 1,771
2012 1,251 74.0% 345 20.4% 50 3.0% 44 2.6% 1,690
2011 1,328 74.7% 333 18.7% 52 2.9% 64 3.6% 1,777
2010 1,273 80.1% 288 18.1% 3 0.2% 25 1.6% 1,589
2009 1,245 82.2% 235 15.5% 5 0.3% 30 2.0% 1,515
2008 1,140 78.0% 295 20.2% 2 0.1% 24 1.6% 1,461
2007 1,157 80.5% 245 17.0% 2 0.1% 34 2.4% 1,438
2006 1,153 82.0% 224 15.9% 4 0.3% 25 1.8% 1,406
2005 1,042 80.0% 232 17.8% 2 0.2% 26 2.0% 1,302
Excludes "Major2" degrees when both degrees are the same. If Major2 degree is different (ie. BA and BS) then both are counted.For 2012, 1 Accounting and 1 Fine Arts Undergraduate Certificate were awarded and are not shown above.For 2013, 2 Accounting, 1 Women and Gender Studies, 2 Artisanry, and 23 Mental Health Undergraduate Certificateswere awarded and are not shown above.For 2014, 1 Accounting, 4 Pre-Medical, 1 Women and Gender Studies, and 3 Mental Health Undergraduate Certificateswere awarded and are not shown above.For 2015, 1 Accounting and 11 Pre-Medical Undergraduate Certificates were awarded and are not shown above.For 2016, 1 Accounting and 3 Pre-Medical Undergraduate Certificates were awarded and are not shown above.

Deg Table 2A Degrees Conferred Trend: Undergraduates Fall 2016
Office of Institutional Research and Assessment 33 Data Book
2006 2007 2008 2009 2010 2011 2012 2013 2014 2015 2016
WHOLE UNIVERSITY 1,153 1,157 1,140 1,245 1,273 1,328 1,251 1,241 1,276 1,323 1,385
College of Arts & Sciences 492 476 477 472 472 500 441 483 563 518 524
Biology 43 44 51 43 49 51 52 56 46 73 63Chemistry 7 7 3 4 11 8 7 8 12 11 8Crime & Justice Studies 19 36 36 50 58 54 76 50 68Economics 16 15 22 21 11 16 9 14 17 13 9English 69 74 64 58 61 68 62 45 53 48 48French 1 1 3 1 2 2 2 1 1 2 2History 45 36 31 42 49 44 29 34 32 29 37Humanities/Social Sciences 59 52 60 45 26 9 4 7 3 1 1Liberal Arts 8 36 39 42 64 85 62 41Mathematics 6 7 12 8 10 11 12 4 13 11 16Medical Lab Science 16 20 19 22 28 19 23 35 30 42 34Multidisciplinary Studies 5 7 5 1 0 1 2 4 3 2 8Philosophy 2 4 5 7 2 3 5 10 10 3 1Political Science 22 31 21 28 19 21 13 28 20 24 25Portuguese 2 8 2 8 1 2 1 4 3 4 2Psychology 106 96 85 87 82 103 86 82 105 99 117Sociology 86 68 68 45 40 42 24 27 45 36 35Spanish 7 6 7 6 6 7 2 6 3 4 4Women's & Gender Studies 2 3 4 8 0 6 4 5
College of Business 324 344 330 434 410 415 413 375 340 357 415
Accounting 62 60 68 74 86 94 94 94 94 86 115Finance 43 57 44 75 55 70 66 59 48 45 62General Business Administration 3 5 6 11 14 13 19 16Human Resources Management 69 57 57 47 61 39 43 19 3 1Management 103 11 23 46 65Management Info. Systems 34 20 18 34 17 25 25 21 22 26 27Marketing 82 82 96 122 132 120 125 99 77 97 103Operations Management 45 47 69 68 39 53 45 44 35 26
College of Engineering 116 96 103 135 135 156 157 152 155 211 206
Bioengineering 1 2 6 1 3 3 5 1 4 21 22Civil Engineering 12 17 22 33 39 32 30 26 39 34 33Computer Engineering 14 11 5 10 14 15 15 16 18 15 13Computer Science 35 27 25 18 11 28 16 23 25 37 36Electrical Engineering 28 18 11 26 22 28 29 25 27 40 47Electrical Technology 0 0 1Mechanical Engineering 24 19 27 43 42 43 55 53 37 58 45Physics 2 2 6 4 4 7 7 8 5 6 10
College of Nursing 92 93 126 97 135 140 111 116 111 115 138
Nursing 76 82 112 81 110 113 103 97 98 89 102RN to BSN 16 11 14 16 25 27 8 19 13 26 36
College of Visual & Performing Arts 129 148 104 107 121 117 129 115 107 122 102
Art Education 7 14 12 9 7 13 13 13 7 6 8Art History 4 2 2 5 8 3 3 2 2 2 3Artisanry 5 14 6 11 6 10 4 6 11 4 7Music 13 11 11 7 8 10 14 9 16 19 7Painting/2D 9 8 10 10 10 4 9 9 5 5 7Sculpture/3D 7 7 5 6 2 7 5 3 2 5 4Visual Design 84 92 58 59 80 70 81 73 64 81 66
Excludes "Major2" degrees when both degrees are the same. If Major2 degree is different (ie. BA and BS) then both are counted.Starting in 2006, Artisanry moved from Visual Design.Starting in 2007, Management, Operations Management, and Human Resources Management are reported separately.Starting in 2011, Materials and Textiles Science became Bioengineering.For 2011, one Women and Gender Studies Undergraduate Certificate was awarded and is not shown above.For 2012, one Accounting and one Fine Arts Undergraduate Certificate were awarded and are not shown above.For 2013, two Accounting, 1 Women and Gender Studies, 2 Artisanry, and 23 Mental Health Undergraduate Certificates were awarded and are not shown above.For 2014, one Accounting, 1 Women and Gender Studies, 3 Mental Health and 4 Pre-Med Undergraduate Certificates were awarded and are not shown above.For 2015, one Accounting and 11 Pre-Medical Undergraduate Certificates were awarded and are not shown above.For 2016, one Accounting and 3 Pre-Medical Undergraduate Certificates were awarded and are not shown above.

Deg Table 2B Undergraduate Degrees Conferred Trends: Major2 Fall 2016
Office of Institutional Research and Assessment 34 Data Book
2006 2007 2008 2009 2010 2011 2012 2013 2014 2015 2016
WHOLE UNIVERSITY 28 32 31 37 26 36 41 26 53 58 78
College of Arts & Sciences 14 15 16 21 18 18 14 10 25 35 56
Biology 0 0 0 0 0 0 0 0 1 1 0Crime & Justice Studies 0 0 0 1 2 0 1 0 4 3 4Economics 0 1 1 2 1 2 0 1 0 0 2English 3 5 0 2 1 2 3 1 2 3 5French 0 1 0 1 0 0 1 1 2 1 1History 2 1 1 2 2 2 1 1 2 1 1Humanities/Social Sciences 0 0 0 0 0 0 0 0 0 0 0Mathematics 0 0 3 1 0 1 1 0 2 1 1Philosophy 0 1 1 2 2 3 1 1 0 0 0Political Science 1 1 0 2 2 0 0 1 0 2 1Portuguese 0 0 2 1 2 0 0 0 0 0 2Psychology 2 0 4 2 2 4 1 3 4 1 2Sociology 5 1 2 4 3 2 2 1 2 1 3Spanish 1 4 2 0 1 1 2 0 2 1 1Women's & Gender Studies 1 0 1 1 0 4 1 1Mental Health Certificates 19 32
College of Business 3 3 5 7 4 7 12 6 9 5 11
Accounting 2 0 2 3 0 1 2 3 3 3 2Finance 0 1 2 4 4 2 4 0 2 1 4Human Resources Management 0 0 2 2 2 0 1 0Management 2Management Info. Systems 1 1 0 0 0 1 2 0 2 0 1Marketing 0 1 1 0 0 1 0 1 1 0 1Operations Management 0 0 0 2 0 1 0 1
College of Engineering 3 3 0 3 1 5 2 4 10 4 4
Computer Engineering 0 1 0 1 0 3 1 1 6 1 3Computer Science 1 0 0 1 0 0 0 0 0 0 0Electrical Engineering 2 2 0 1 1 2 1 3 3 2 1Physics 0 0 0 0 0 0 0 0 1 1 0
College of Nursing 0 0 0 0 0 0 0 0 0 0 0
College of Visual & Performing Arts 8 11 10 6 3 6 13 6 9 14 7
Art Education 0 2 2 0 0 1 0 0 0 1 0Art History 0 0 0 1 0 0 0 0 0 0 0Music 0 1 0 0 0 0 0 0 0 0 0Painting/2D 0 1 2 1 0 0 2 0 1 0 0Sculpture/3D 0 0 0 0 0 0 0 2 0 1 0Visual Design 8 7 6 4 3 5 11 4 8 12 7
This table shows "Major 2" graduations of dual and double majors not shown in Deg Table 2A.Chronology, not substance, determines which major of a dual/double major is listed as "Major1."Programs not listed have had no dual/double majors during the period covered.

Deg Table 3 Degrees Conferred Trends: Graduate Students Fall 2016
Office of Institutional Research and Assessment 35 Data Book
2006 2007 2008 2009 2010 2011 2012 2013 2014 2015 2016
WHOLE UNIVERSITY 253 281 321 270 316 449 439 530 537 530 543
College of Arts & Sciences 37 40 42 24 38 43 55 51 182 181 162
Biology MS 7 1 3 3 6 3 4 9 6 5 2Chemistry MS 7 6 5 1 5 6 11 4 6 8 4Portuguese MA 3 1 2 5 1 3 3 2 2 2Portuguese PhD 2 2 1 2 1Professional Writing MA 11 8 9 9 8 10 7 13 5 12 5Psychology MA 10 15 18 7 14 20 21 20 26 21 25Public Policy MPP * * * * * 12 16 15Post-Baccalaureate Certificates 2 7 6 2 0 1 6 0 18 21 17Post-Master Certificates 2 1 0 0 0 2
School of Education 106 94 89Educational Leadership & Policy Studies MS 7 10Educational Leadership & Policy Studies PHD 7 12Mathematics Education MS 4 3 2Mathematics Education PhD 0 1 0Teaching MAT 100 76 65Post-Baccalaureate Certificates 2 0
College of Business 93 96 106 74 91 109 96 86 154 178 156Accounting MS 1Business Administration MBA 73 72 89 55 79 91 89 71 145 163 142Post-Baccalaureate Certificates 20 24 17 19 11 18 7 15 9 15 13Post-Master Certificates 1 0 0 0
College of Engineering 63 66 83 80 60 67 55 75 59 62 117
BioMed Engin/BioTechnology MS 2 0 1 4 0 4 2 2 1 2BioMed Engin/BioTechnology PhD 1 1 2 0 1 4 3 6Civil Engineering MS 2 1 1 2 2 3 0 4 5 4 5Computer Engineering MS 5 9 11 20 7 12 10 6 4 6 19Computer Science MS 25 16 31 25 19 25 10 24 15 21 57Electrical Engineering MS 17 17 20 14 10 5 10 9 5 9 6Electrical Engineering PhD 4 2 2 1 0 1 3 4 4 2 3Engineering & Applied Science PhD 1 1 0Mechanical Engineering MS 5 8 6 5 5 8 7 12 10 8 12Physics MS 2 8 8 4 7 5 7 4 7 4 4Textile Chemistry MS 1 3 1 3 1 1 1 1 0 1Textile Technology MS 1 0 3 1 3 5 0 2 1Post-Baccalaureate Certificates 1 0 0 3 1 0 3 6 1 2 3
College of Nursing 22 17 20 19 19 13 28 28 23 10 30
Nursing DNP 3 2 11Nursing MS 20 14 19 17 18 12 27 25 18 4 14Nursing PhD 0 0 1 1 2 4 5Post-Baccalaureate Certificates 2 2 0 2 0Post-Master Certificates 0 1 1 0 1 1 0 2 0 0
College of Visual & Performing Arts 17 17 28 21 26 28 29 36 26 27 19
Art Education MAE 5 2 14 4 9 9 5 9 5 6 0Artisanry MFA 5 7 5 9 9 4 6 6 7 9 6Fine Arts MFA 3 5 5 6 6 7 7 8 7 5 10Visual Design MFA 4 3 4 2 1 5 1 2 2 4 1Post-Baccalaureate Certificates 0 0 0 0 1 3 10 11 5 3 2
19 43 39 47 75 133 125 139 * *
Education PBC 4 7 28 9 13 * * *Mathematics Education MS 3 4 * * *Mathematics Education PhD 0 1 * * *Policy Studies PBC 3 11 8 10 * * *Public Policy MPP 9 10 6 10 15 * * *Teaching MAT 19 43 39 34 55 88 95 96 * * *
School of Marine Science & Technology 2 2 3 5 7 9 8 12 14 8 6
Coastal & Ocean Administration MS 1Marine Science MS 2 2 3 2 5 7 7 8 4 3 3Marine Science PhD 3 2 2 1 4 10 5 2
School of Law 47 43 103 79 64 53
Law JD 47 43 103 79 64 53
In 2013, there were 4 MBA major2 not included above.In 2014, there were 17 MBA major2 not included above.In 2015, there were 18 MBA major2/3, 1 Public Management PBC major2 and 1 Art Education MAE major2 not included above.Beginning with 2014 graduations, SEPPCE became School of Education within the College of Arts & Sciences. In 2016, 8 MBA major 2 and 1 Physics MS not included above.
School of Education, Public Policy, & Civic Engagement
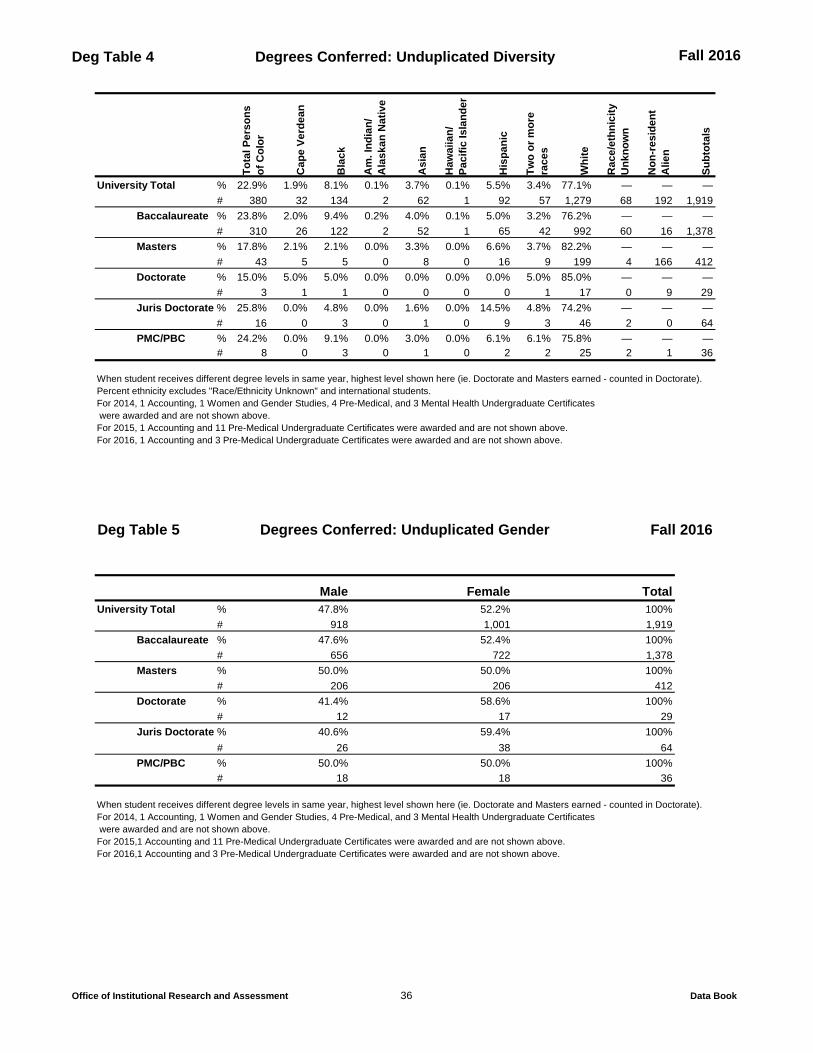
Deg Table 4 Degrees Conferred: Unduplicated Diversity Fall 2016
Office of Institutional Research and Assessment 36 Data Book
Tota
l Per
sons
of
Col
or
Cap
e Ve
rdea
n
Bla
ck
Am
. Ind
ian/
A
lask
an N
ativ
e
Asi
an
Haw
aiia
n/
Paci
fic Is
land
er
His
pani
c
Two
or m
ore
race
s
Whi
te
Rac
e/et
hnic
ity
Unk
now
n
Non
-res
iden
t A
lien
Subt
otal
s
University Total % 22.9% 1.9% 8.1% 0.1% 3.7% 0.1% 5.5% 3.4% 77.1% — — —# 380 32 134 2 62 1 92 57 1,279 68 192 1,919
Baccalaureate % 23.8% 2.0% 9.4% 0.2% 4.0% 0.1% 5.0% 3.2% 76.2% — — —# 310 26 122 2 52 1 65 42 992 60 16 1,378
Masters % 17.8% 2.1% 2.1% 0.0% 3.3% 0.0% 6.6% 3.7% 82.2% — — —# 43 5 5 0 8 0 16 9 199 4 166 412
Doctorate % 15.0% 5.0% 5.0% 0.0% 0.0% 0.0% 0.0% 5.0% 85.0% — — —# 3 1 1 0 0 0 0 1 17 0 9 29
Juris Doctorate % 25.8% 0.0% 4.8% 0.0% 1.6% 0.0% 14.5% 4.8% 74.2% — — —# 16 0 3 0 1 0 9 3 46 2 0 64
PMC/PBC % 24.2% 0.0% 9.1% 0.0% 3.0% 0.0% 6.1% 6.1% 75.8% — — —# 8 0 3 0 1 0 2 2 25 2 1 36
When student receives different degree levels in same year, highest level shown here (ie. Doctorate and Masters earned - counted in Doctorate). Percent ethnicity excludes "Race/Ethnicity Unknown" and international students.For 2014, 1 Accounting, 1 Women and Gender Studies, 4 Pre-Medical, and 3 Mental Health Undergraduate Certificates were awarded and are not shown above. For 2015, 1 Accounting and 11 Pre-Medical Undergraduate Certificates were awarded and are not shown above.For 2016, 1 Accounting and 3 Pre-Medical Undergraduate Certificates were awarded and are not shown above.
Deg Table 5 Fall 2016
Male Female TotalUniversity Total % 47.8% 52.2% 100%
# 918 1,001 1,919Baccalaureate % 47.6% 52.4% 100%
# 656 722 1,378Masters % 50.0% 50.0% 100%
# 206 206 412Doctorate % 41.4% 58.6% 100%
# 12 17 29Juris Doctorate % 40.6% 59.4% 100%
# 26 38 64PMC/PBC % 50.0% 50.0% 100%
# 18 18 36
When student receives different degree levels in same year, highest level shown here (ie. Doctorate and Masters earned - counted in Doctorate). For 2014, 1 Accounting, 1 Women and Gender Studies, 4 Pre-Medical, and 3 Mental Health Undergraduate Certificates were awarded and are not shown above.For 2015,1 Accounting and 11 Pre-Medical Undergraduate Certificates were awarded and are not shown above.For 2016,1 Accounting and 3 Pre-Medical Undergraduate Certificates were awarded and are not shown above.
Degrees Conferred: Unduplicated Gender