Enrichment of the phenotypic and genotypic Data Warehouse analysis using Question Answering systems...
26
Enrichment of the Phenotypic and Genotypic Data Warehouse analysis using Question Answering systems to facilitate the decision making process in cereal breeding programs Jes´ us Peral, Antonio Ferr´ andez, Elisa De Gregorio, Juan Trujillo, Ale- jandro Mat´ e, Luis Jos´ e Ferr´ andez PII: S1574-9541(14)00049-1 DOI: doi: 10.1016/j.ecoinf.2014.05.003 Reference: ECOINF 475 To appear in: Ecological Informatics Received date: 30 November 2013 Revised date: 16 April 2014 Accepted date: 7 May 2014 Please cite this article as: Peral, Jes´ us, Ferr´ andez, Antonio, De Gregorio, Elisa, Tru- jillo, Juan, Mat´ e, Alejandro, Ferr´ andez, Luis Jos´ e, Enrichment of the Phenotypic and Genotypic Data Warehouse analysis using Question Answering systems to facilitate the decision making process in cereal breeding programs, Ecological Informatics (2014), doi: 10.1016/j.ecoinf.2014.05.003 This is a PDF file of an unedited manuscript that has been accepted for publication. As a service to our customers we are providing this early version of the manuscript. The manuscript will undergo copyediting, typesetting, and review of the resulting proof before it is published in its final form. Please note that during the production process errors may be discovered which could affect the content, and all legal disclaimers that apply to the journal pertain.
Transcript of Enrichment of the phenotypic and genotypic Data Warehouse analysis using Question Answering systems...
�������� ����� ��
Enrichment of the Phenotypic and Genotypic Data Warehouse analysis usingQuestion Answering systems to facilitate the decision making process incereal breeding programs
Jesus Peral, Antonio Ferrandez, Elisa De Gregorio, Juan Trujillo, Ale-jandro Mate, Luis Jose Ferrandez
PII: S1574-9541(14)00049-1DOI: doi: 10.1016/j.ecoinf.2014.05.003Reference: ECOINF 475
To appear in: Ecological Informatics
Received date: 30 November 2013Revised date: 16 April 2014Accepted date: 7 May 2014
Please cite this article as: Peral, Jesus, Ferrandez, Antonio, De Gregorio, Elisa, Tru-jillo, Juan, Mate, Alejandro, Ferrandez, Luis Jose, Enrichment of the Phenotypic andGenotypic Data Warehouse analysis using Question Answering systems to facilitate thedecision making process in cereal breeding programs, Ecological Informatics (2014), doi:10.1016/j.ecoinf.2014.05.003
This is a PDF file of an unedited manuscript that has been accepted for publication.As a service to our customers we are providing this early version of the manuscript.The manuscript will undergo copyediting, typesetting, and review of the resulting proofbefore it is published in its final form. Please note that during the production processerrors may be discovered which could affect the content, and all legal disclaimers thatapply to the journal pertain.

ACC
EPTE
D M
ANU
SCR
IPT
ACCEPTED MANUSCRIPT
Enrichment of the Phenotypic and Genotypic Data Warehouse analysis using Question Answering systems
to facilitate the decision making process in cereal breeding programs
Jesús Peral, Antonio Ferrández, Elisa De Gregorio, Juan Trujillo, Alejandro Maté, Luis José
Ferrández Dept. Language and Information Systems. University of Alicante
Carretera San Vicente S/N - Alicante - 03080 - Spain
Phone number:+34-96-590-3400
[email protected], [email protected], [email protected], [email protected], [email protected], [email protected]
ABSTRACT
Currently there are an overwhelming number of
scientific publications in Life Sciences, especially in
Genetics and Biotechnology. This huge amount of
information is structured in corporate Data
Warehouses (DW) or in Biological Databases (e.g.
UniProt, RCSB Protein Data Bank, CEREALAB or
GenBank), whose main drawback is its cost of
updating that makes it obsolete easily. However, these
Databases are the main tool for enterprises when they
want to update their internal information, for example
when a plant breeder enterprise needs to enrich its
genetic information (internal structured Database)
with recently discovered genes related to specific
phenotypic traits (external unstructured data) in order
to choose the desired parentals for breeding programs.
In this paper, we propose to complement the internal
information with external data from the Web using
Question Answering (QA) techniques. We go a step
further by providing a complete framework for
integrating unstructured and structured information by
combining traditional Databases and DW
architectures with QA systems. The great advantage
of our framework is that decision makers can compare
instantaneously internal data with external data from
competitors, thereby allowing taking quick strategic
decisions based on richer data.
Keywords Business Intelligence, Data Warehouse, Question
Answering, Information Extraction, Information
Retrieval, Genetic Information.
1. INTRODUCTION AND MOTIVATION
According to the 2011 Gartner Group report (Gartner
Group report, 2011), worldwide information volume
is growing at a minimum rate of 59 percent annually.
Thus, the available information for a company is
progressively increasing. This information is
accessible from any computer, and comes from both
structured and unstructured sources of data. The
structured data is predetermined, well defined, and
usually managed by traditional Business Intelligence
(BI) applications, based on a Data Warehouse (DW),
which is a repository of historical data gathered from
the heterogeneous operational databases of an
organization (Inmon, 2005; Kimball & Ross, 2002).
The main benefit of a DW system is that it provides a
common data model for all the company data of
interest regardless of their source, in order to facilitate
the report and analysis of the internal data of an
organization. DW structures the data in terms of Facts
and Dimensions. A fact is the center of the analysis,
and typically represents a business activity. For
example, gene effects on a trait could be considered a
fact. In order to evaluate the performance of the
activity, a fact includes fact attributes, also called

ACC
EPTE
D M
ANU
SCR
IPT
ACCEPTED MANUSCRIPT
measures, which are represented as cells in an OLAP
cube. In our example, the influence degree of the gene
could be a measure. Furthermore, a fact can be
analyzed from different perspectives, which constitute
dimensions that provide contextual information for
the analysis, and are represented as axis in an OLAP
cube. For example, we could analyze gene effects by
looking at the trait associated or at the plant family
whose traits are being studied. Moreover, each
dimension may have its own structure, allowing us to
analyze the fact at different levels of aggregation, and
establishing relationships between levels. For
example, the hierarchy for the species dimension
could be species (lowest level), which can be
aggregated into families, and families can be
aggregated into classes.
However, there is a wide consensus in that the internal
data of organizations to take right decisions is not
enough, even more in current highly dynamic and
changing markets where information from
competitors and clients/users is extremely relevant for
these decisions. Thus, the main disadvantage of
traditional DW architectures is that they cannot deal
with unstructured data (Rieger, Kleber, & von Maur,
2000). Currently, these unstructured data are of a high
relevance in order to be able to make more accurate
decisions, since the BI applications would empower
their functionality by considering both data from
inside the company (e.g. the reports or emails from
the staff stored in the company intranet) and outside
(e.g. the Webs of the company competitors) (Trujillo
& Maté, 2012).
For example, let us consider a scenario where a plant
breeder enterprise needs to enrich its genetic
information (internal structured DW) with recently
discovered genes related to specific phenotypic traits
(external unstructured data obtained from the Web) in
order to choose the desired parentals for breeding
programs. The plant breeder enterprise will find that
there are an overwhelming number of scientific
publications in Life Sciences, specifically in Genetics
and Biotechnology (Matos et al., 2010). According to
the Medline database, about 2 scientific papers in Life
Sciences are incorporated per minute, and there are
more than 1.000 journals in Biology currently
published worldwide1. Moreover, increasing
bioinformatics work has resulted in a large amount of
information stored in Biological Databases (e.g.
UniProt, RCSB Protein Data Bank, GenBank,
CEREALAB, etc.) that remains uninterpreted. For
these reasons, current rate of scientific publications
requires search strategies that allow us to extract
biological information easily and efficiently (Jensen,
Saric, & Bork, 2006; Altman et al., 2008).
So far, many attempts to integrate a corporate DW of
structured data with unstructured data have been
reported (Badia, 2006; Henrich & Morgenroth, 2003;
McCabe et al., 2000; Pérez-Martínez, 2007; Pérez-
Martínez et al., 2008a, 2008b; Pérez-Martínez,
Berlanga, & Aramburu, 2009; Priebe & Pernul,
2003a, 2003b; Qu et al., 2007; Rieger, Kleber, & von
Maur, 2000). They are mainly based on systems that
use Natural Language Processing (NLP) techniques to
access the unstructured data in order to extract the
relevant information of them but they do not reach a
full integration of structured and unstructured data as
our proposal manages.
In this paper, we present a framework which
combines traditional DW architectures with Question
Answering (QA) systems. QA systems represent the
potential future of Web search engines because QA
returns specific answers as well as documents. It
supposes the combination of Information Retrieval
(IR) and Information Extraction (IE) techniques. IR is
the activity of obtaining information resources
relevant to an information need from a collection of
information resources. This activity is currently quite
popularized by the Web search engines as Google. On
the other hand, IE is the task of automatically
extracting specific structured information from
unstructured and/or semi-structured machine-readable
documents. A typical application of IE is to scan a set
of documents written in a natural language and
populate a database with the information extracted
(e.g. the name of products and their prices).
We start with a question or query in Natural Language
(NL) posed by the decision maker, who also identifies
the sources where to search the required information.
We distinguish between queries and questions in order
to highlight that a query refers to a request of data to
the DW system, whereas a question requests data to
the QA system. The former are likely to be much
more rich and complex than simple questions, which
may force to divide the query into several questions.
The questions are analyzed by the
Distributor/Integrator service of the framework and
are passed to the corresponding node (e.g. the QA
node to access external data or the DW node to access
internal data). Then, each node processes the question

ACC
EPTE
D M
ANU
SCR
IPT
ACCEPTED MANUSCRIPT
in an autonomous way on its corresponding sources.
Once the system receives all the results from the
nodes, like internal DW, Web services or API’s, it is
capable of integrating and showing a dashboard to the
user that allows him/her to take the right decision.
Finally, let us add that we also take advantage of our
unique well-checked hybrid method for building data
warehouses. Our method starts by analyzing user
requirements by means of interviews. Then, each
requirement is checked against the data sources to
ensure that the necessary data exists. Afterwards, the
data warehouse is built in order to support queries
from the presented approach. Therefore, we can
ensure that the query posed on the DW node will
return the correct data required by the decision maker
(Mazón & Trujillo, 2008; Mazón, Trujillo, &
Lechtenbörger, 2007).
The paper is structured as follows. In Section 2, we
summarize the most relevant related work regarding
combining traditional DWs with unstructured data. In
Section 3, we introduce our framework for analyzing
and integrating different data sources into a common
dashboard. In Section 4, and in order to clarify our
proposal, we introduce the case study that will be
evaluated in Section 5, where we provide detail on the
evaluation of the application of our proposal. We
conclude the paper with the summary of our main
contributions and our directions for future works.
2. RELATED WORK
Several attempts to integrate search of structured and
unstructured data have arisen, in which the structured
data is handled by a DW or a DB system, and the
unstructured data by an IR, IE or QA system. This
integration should meet certain requirements in order
to adequately provide integrated information for the
users. These requirements include the detection of
matching points between the structured and
unstructured data, the integration of the results
obtained by each system, and the preservation of high
quality sources of information, i.e. the DW. In other
words, the extraction of structured data from
unstructured data is required in order to provide links
with similar structured data. In this way, the user can
represent and integrate the unstructured data in all the
possible dimensions and hierarchies that a DW cube
can contain. As a result the information returned by
both systems could be perfectly integrated and
analysed together. However, these data cannot be
mixed, as that would result in potential decrease of the
accuracy of the data stored.
Regarding the connection between a DW and an IR
system, the work presented in (Rieger, Kleber, & von
Maur, 2000) and (Henrich & Morgenroth, 2003) can
be cited. However, as it is claimed in the work
presented in (McCabe et al., 2000), those efforts do
not take advantage of the hierarchical nature of
structured data nor of classification hierarchies in the
text, so they implement an IR system based on a
multidimensional database. Specifically, they focus
on the use of OLAP techniques as an approach to
multidimensional IR, where the document collection
is categorized by location and time. In this way, they
can handle more complex queries, like retrieving the
documents with the terms “financial crisis” published
during the first quarter of 1998 in New York, and then
drilling down to obtain those documents published in
July 1998.
In (Priebe & Pernul, 2003a, 2003b), authors propose
an architecture that introduces a communication bus
where both systems publish their output. Each system
picks up this output and uses it to show related
information. For example, the query context of a DW
access is used by an IR system in order to provide the
user with related documents found in the
organization’s document management system. In
order to solve the problem of the heterogeneity of
both systems, they propose to use ontological concept
mapping (e.g. the DW system uses “owner” for what
is called “author” within the document metadata).
They use an ontology for the integration, but it is only
oriented to communicate both applications in
enterprise knowledge portals. In this way, they handle
queries like “sales of certain audio electronics
products within the four quarters of 1998”.
In (LaBrie & St. Louis, 2005), an alternative
mechanism for IR (“dynamic hierarchies” based upon
a recognition paradigm) that overcome many of the
limitations inherent in traditional keyword searching
is proposed. This IR approach was used in BI
applications but no integration between both
applications was made.
In (Pérez-Martínez, 2007; Pérez-Martínez et al.,
2008a), authors provide a framework for the
integration of a corporate warehouse of structured
data with a warehouse of text-rich XML documents,
resulting in what authors call a contextualized
warehouse. These works are based on applying IR

ACC
EPTE
D M
ANU
SCR
IPT
ACCEPTED MANUSCRIPT
techniques to select the context of analysis from the
document warehouses. In (Pérez-Martínez, Berlanga,
& Aramburu, 2009), authors formalize a
multidimensional model containing a new dimension
for the returned documents. To the best of our
knowledge, these papers are the most complete ones
in combining and considering structured and
unstructured data in a common DW architecture.
Regarding IE, (Losiewicz, Oard, & Kostoff, 2000)
surveys applications of data mining techniques to
large text collections, including IR from text
collections, IE to obtain data from individual texts,
DW for the extracted data. In (Badia, 2006), different
IE-based (as well as IR) methods for integrating
documents and databases are discussed. Specifically,
the author proposes IE as the right technology to
substitute IR, which fills the slots of a set of
predefined templates that determines the information
that is searched in the collection of documents. In
(Bhide et al., 2008), authors claim that there exist BI
products like QL2 (QL2, 2013) and IBM Business
Insights Workbench (BIW) (IBM. Business insights
workbench, 2013) that try to derive context from the
unstructured data by using various IE and clustering
techniques. However, no business intelligence product
has tried to exploit context available in the structured
data of the enterprise in order to allow us a seamless
analysis of both structured and unstructured data fully
integrated, in a consolidated manner. They propose
the use of IE techniques to a specific task of linking
common entities in a relational database and
unstructured data.
With regard to work on the integration of DW and QA
systems, in (Qu et al., 2007), a scheme about a DW
design based on data mining techniques was put
forward in order to overcome the defects of current
Chinese QA systems. In (Roussinov & Robles-Flores,
2004), authors explored the feasibility of a completely
trainable approach to automated QA on the Web for
the purpose of business intelligence and other
practical applications. They introduce an entirely self-
learning approach based on patterns that do not
involve any linguistic resources. In (Lim et al., 2009),
the authors present a study of comparative and
evaluative queries in the domain of Business
Intelligence. These queries are conveniently processed
by using a semantic interpretation of comparative
expressions and converting them to quantifiable
criteria, in order to obtain better results in a QA
system for this domain. In our previous work of
(Ferrández & Peral, 2010), we analyzed the main
benefits of integrating QA systems with traditional
DW systems in order to be able to complete internal
data with precise returned answers from QA systems,
instead of returning whole documents provided by IR
systems.
Several work on NL questions to query the Semantic
Web have been carried out, like Aqualog (Lopez,
Pasin, & Motta, 2005), SQUALL (Ferré, 2012) or
FREyA (Damljanovic, Agatonovic, & Cunningham,
2012), which use SPARQL for querying knowledge
bases built in RDF. In PANTO (Wang et al., 2007)
and Querix (Kaufmann, Bernstein, & Zumstein,
2006), they accept generic NL questions and outputs
SPARQL queries.
Other works present the integration of structured and
unstructured data but they do not use IR, IE or QA
techniques. (Alqarni & Pardede, 2012) show the
integration of DWs and unstructured business
documents. They propose a multi-layer schema for
mapping structured data stored in a data warehouse
and unstructured data in business-related documents
(invoices, contracts and catalogs). A linguistic
matching mechanism using WordNet::Similarity (a
free open software package) to find possible
similarities between the elements has been used.
However, this mapping is carried out at the schema
level, and consequently, much information available
in the document is not taken into account and cannot
be incorporated into the DW. Furthermore, authors
study a well-defined type of document and, therefore,
a real enrichment of the DW with all the available
information in any business document is not
performed. In (Miller, Honavar, & Barta, 1997),
authors propose the design of a DW system that
allows the interaction of structured and unstructured
data. The system makes use of Object Oriented views
that define the construction, importation and
exportation of resources and services. Once the
materialized view is available in the DW, the user can
apply any of the data mining tools to these views, and
the obtained results can be stored in the knowledge
base of the DW. However, a minor drawback is that
authors do not fully explain the process and conclude
that the data mining techniques are just at the
beginning stages. Therefore, in these two proposals
the real integration and enrichment of structured data
together with unstructured data are not fully
achieved.

ACC
EPTE
D M
ANU
SCR
IPT
ACCEPTED MANUSCRIPT
Finally, in the field of Genetics and Biotechnology, as
mentioned in Section 1, current rate of scientific
publications requires search strategies that allow us to
extract biological information easily and efficiently
(Jensen, Saric, & Bork, 2006; Altman et al., 2008) to
enrich and update the available information. A real
application is the QTL (Quantitative Trait Locus)
analysis, object of our case study. Quantitative traits
refer to phenotypic characteristics that vary in degree
and can be attributed to polygenic effects, i.e., product
of two or more genes, and their environment.
QTL analysis is very useful in areas as diverse as
agriculture, biomedicine and evolutionary biology
(i.e. phylogeny) because allows us to relate a certain
phenotypic trait to specific regions of chromosomes,
which contains one or more genes involved in that
characteristics.
The aim of QTL methodology is to identify the action,
interaction, number, and precise location of the
chromosomal regions responsible of specific
phenotypic features (Falconer & Mackay, 1996;
Kearsey, 1998; Lynch & Walsh, 1998; Miles &
Wayne, 2008). However, the biological situation is
more complex. For example, there are polygenic traits
(such as eye and skin color in humans, wing
morphology in fruit fly, or kernel color in wheat)
which depends on several genes (sometimes located
in different chromosomes). This so-called
multifactorial inheritance makes very difficult to
understand the basis of many phenotypic
characteristics. Inversely, pleiotropy refers to the
phenomenon in which a single gen controls two or
more apparently unrelated phenotypic features
(Stearns, 2011). It is associated to evolution and
speciation processes (Latta & Gardner, 2009; Orr,
2000), human diseases (Wilkins, 2010) and aging
phenomenon (Moorad & Promislow, 2009). The
existence of polygenia and pleiotropy phenomena
makes necessary to enrich genetical databases with
recently discovered information (external data) in
order to update our knowledge about biological traits:
if they are controlled by several genes or if they are
related to other biological characteristics,
respectively.
For instance, a huge number of genetical disorders are
polygenic, including cancer, type-II diabetes,
Alzheimer disease, hypertension, Crohn disease,
autism and many others (Pharoah et al., 2002;
Pajović, 2007). For that reason, knowing the
individual role of the genes involved in the diseases is
essential to create new optimal therapies.
Furthermore, in genetic engineering it is very
important to take into account all the genes related to
interesting traits, in order to design newer and easier
working strategies, as there is not only one way of
improving a biological trait (i.e. production of human
insulin by recombinant DNA technology in E. coli, or
yield of the rice plant). Considerations about
pleiotropy could avoid undesired indirect effects in
the previous examples or could provide specific
benefits, depending on the proposed goal.
2.1. Contributions of our proposal to previous work
We overcome the data integration problems identified
in previous work through the following four
contributions. Contribution 1 is that we use QA in
order to access to the unstructured data. We consider
QA more suitable than only IR because the integration
of whole documents returned by IR is weaker and less
useful to the decision maker, since the information
provided by QA is much more specific, and thus, can
be integrated seamlessly into DW cubes. Moreover,
we consider QA more suitable than IE because of the
QA flexibility to afford any kind of question, and not
only a set of predefined templates.
With regard to contribution 2, we deal with the weak
point about the lack of full integration between
systems that access the unstructured data (e.g. QA),
whether it is external or internal, and the ones that
access the structured data (DW). In this way, we
allow the decision maker to compare both the internal
data of a DW and the data gathered from the Web.
This aim is managed by our proposed framework that
completes the whole flow of data.
In contribution 3, we have improved the interaction
with the user through: (i) the outputs of the nodes are
fully integrated and presented to the user in a friendly
dashboard (Eckerson, 2007), which allows the
decision maker to immediately compare internal data
of a company against external data; (ii) our NL
interface (Llopis & Ferrández, 2012) outdoes previous
work by its full portability to different DW systems;
and by its query-authoring services. These services
dramatically improve the system usability allowing
the decision maker to early detect errors in the
question by automatically distinguishing between
linguistic (e.g. when the grammar in the interface

ACC
EPTE
D M
ANU
SCR
IPT
ACCEPTED MANUSCRIPT
cannot parse a question) and conceptual (e.g. entity-
property mismatch, data type mismatch, etc.) failures.
Finally, in contribution 4, we have proved and
evaluated the feasibility of our approach on the case
scenario of a seed company that is interested in new
advances in Genetics in order to improve its cereal
breeding programs by obtaining new disease-resistant
and high-yielding grain varieties. These new advances
are obtained from the Web through the QA system.
Therefore, from the initial request of data of “What
QTLs are related to resistance to Fusarium in durum
wheat?”, our proposal can obtain the cube from the
enterprise's DW, and the QA database with the QTLs
extracted from the Web, where both results are
integrated into a dashboard that immediately allows
the user to analyze and compare them. Moreover, it
can transform the initial DW query into the set of
questions with information present in the DW scheme,
such as “What QTLs are related to frost tolerance in
durum wheat?”, which facilitates to focus only on the
traits stored in the DW.
3. OUR BUSINESS INTELLIGENCE
FRAMEWORK
In our framework (Figure 1), we can distinguish two
phases: (i) the system setup and (ii) the running phase,
which are detailed in the next two subsections.
The setup phase prepares the source nodes, where the
required information will be searched, by creating the
corresponding ontologies. It is important to emphasize
that several DW, Database, QA or Big Data source
nodes can be connected, each one with its own
implementation, model and domain (e.g. we can
connect a QA node specialized in Genetics domain as
well as a QA node specialized in legal domains), as
long as an interpreter for the NL query is built for that
type of node. In the case of different DBMS
technologies, this task can be avoided since most
OLAP servers already provide an interface to extract
data from multiple DBMS. Thus, the OLAP server
can be used as an intermediary for extracting the data.
These ontologies are created just the first time that the
source node is connected in our framework.
In the running phase, the user or decision maker (i)
poses a NL question through the GUI (Graphical User
Interface) element and (ii) selects the sources to be
searched (e.g. in a specific database or DW, or in a
specific QA domain). The GUI element passes the NL
question to the Distributor/Integrator element that also
sends it to the set of specialized nodes (e.g. the DW
and QA nodes). Each specialized node disposes of the
proper interface in order to process adequately the NL
question and to produce the suitable output
information. Then, the Distributor/Integrator
coordinates the running of each specialized node,
gathering the output of these nodes in order to send
the fused information to the GUI element. Finally, the
GUI is responsible for displaying the results as a
dashboard, which integrates both external and internal
data.
Figure 1. Framework to access/integrate structured/unstructured and internal/external data

ACC
EPTE
D M
ANU
SCR
IPT
ACCEPTED MANUSCRIPT
This paper complements our approach to access
different sources shown in (Maté, Llorens, & de
Gregorio, 2012) (i) by reaching the full integration of
unstructured and structured information through the
ontologies and (ii) by displaying the data integration
with a dashboard. In (Maté, Llorens, & de Gregorio,
2012) the authors describe an approach based on the
MapReduce strategy (Dean & Ghemawat, 2008)
where the query is divided and distributed to different
nodes and then it integrates the results; this approach
allows to maintain the internal structure of the
different nodes, allowing to add or remove the nodes
in a seamlessly way. A similar proposal is (Abelló,
Ferrarons, & Romero, 2011) where the authors
present a framework for create cubes using
MapReduce; this proposal differs from ours, where
we consider the cube with the OLAP server a single
node. For more information on theoretical foundation
see (Gray et al., 1997).
3.1. Setup phase
In this phase, the specialized source nodes, both DW
and QA, are prepared just the first time that they are
connected to our framework, in order to integrate
them in the global system. In each QA node, we
create (i) its QA integration model and (ii) its QA
ontology; whereas in each DW node we create its DW
ontology that describes the DW scheme, which will
allow its integration with the QA nodes through a
semi-automatic mapping process that detects
connections between the QA and DW ontologies.
Thus, a repository of ontologies is constructed just the
first time the corresponding node is connected to our
framework. Therefore, the following connection to the
node, our approach consults the catalog and schema in
order to check if it has been modified, in which case
the ontology is reconstructed, since the computational
cost is not significant and this phase is run off-line.
QA node. (i) The QA integration model contains
information about the answer that is returned to the
Distributor/Integrator element in order to be
integrated with the data returned by the DW node. For
example, Figure 2 depicts a QA integration model that
specifies the database schema in which the set of
answers extracted by the QA system will be stored. It
contains the answer (as a noun phrase and as a string
of fixed size), the expected answer type (e.g. the
“QTL” type for the question “What QTLs are related
to resistance to Fusarium in durum wheat?”), the
entities detected in the question (e.g. ”durum wheat”
as plant type), the URL or document that contains the
answer and the passage or answer context (i.e. the
surrounding text around the answer, with which the
user can decide whether the answer is correct for its
purposes without reading the whole document). The
QA integration model can vary in different QA
systems. For example, a QA system can return an
answer context of three sentences (such as the one
depicted in Figure 2), whereas other QA systems can
return only a fixed number of words around the
answer.
Figure 2. QA Integration Model
QA node. (ii) The QA ontology contains information
about the set of answer types considered in the QA
system. For example, Figure 3 depicts an excerpt of
an answer ontology, where a set of WordNet top
concepts (e.g. group or person) are used with some
extensions (e.g. phenotypic characteristic –used to
classify the entities that do not belong to any defined
type– or plant type in the object type).
Figure 3. QA Ontology
DW node. The DW ontology (Santoso, Haw, &
Abdul-Mehdi, 2010) is created, which will allow us to
analyze an integrated view of data. The ontology
relates the tables and attributes considered as the
internal data. In Figure 4, an excerpt of a DW
ontology is shown.

ACC
EPTE
D M
ANU
SCR
IPT
ACCEPTED MANUSCRIPT
Figure 4. DW Ontology
QA and DW ontology mapping. Finally, a semi-
automatic mapping process is carried out in order to
detect connections between the QA and DW
ontologies (Wang et al., 2007) (see Figure 5):
Figure 5. Mapping between subsets of QA ontology
and DW ontology
(a) We detect equivalent classes/properties in both
ontologies. Firstly, the exact matches between the two
ontologies are retrieved (e.g. in Figure 5 the
equivalent class “QTL” is detected since they appear
in Figure 3 and 4). After that, the remaining concepts
are matched using the information of the lexical-
semantic resources used in QA (WordNet, lexicons,
dictionaries, glossaries, etc.) and prompting the user
to confirm the match. For example, in Figure 5, the
equivalent property “Species” in DW vs. “Plant” in
QA is established due to the hyperonym relation
between “Plant Family” and “Species”;
(b) We add new subclasses –extracted from the DW
ontology– in the QA ontology (e.g. “Sub-Family”
which is added to the “Plant” type thanks to the
hyperonym relation between “Plant Family” and
“Sub-Family”);
(c) We enrich the lexical-semantic resources used in
QA with instances from the DW ontology (see Figure
6). In the Figure, the enrichment of WordNet can be
seen, where the instances of QTLs stored in the DW
(QFhs.pur.2D, QFhs.inra-3A, etc.) are added to the
lexical resource. In this way, questions about these
new instances can be treated by the system.
Figure 6. Enriching QA lexical-semantic resources
with knowledge from the DW
3.2. Running phase
The GUI element. Firstly, the GUI element receives
the NL request of data through our NL interface
(Llopis & Ferrández, 2012), which thanks to its
query-authoring services improves the system
usability allowing the decision maker to early detect
errors in questions by automatically distinguishing
between linguistic (e.g. errors due to lexical or
syntactic mistakes) and conceptual failures (e.g. errors
due to the lack of an specific relation between tables
in the DW). Secondly, the decision maker selects the
sources to be searched for the required information.
Then the Distributor/Integrator performs a
coordinator role by distributing the NL request of data
to each DW and QA node; and by receiving and
creating an integrated view of the data returned from
all nodes.
The DW node. The NL query is transformed into a
MultiDimensional eXpression (MDX), which can be
interpreted by the OLAP engine. This transformation
is performed by combining NL processing tasks with
schema matching techniques (Maté, Trujillo, &
Mylopoulos, 2012; Rahm & Bernstein, 2001).
First, the system analyzes the NL query and extracts
the main concepts involved in the query. For example,
consider the query “What QTLs are related to

ACC
EPTE
D M
ANU
SCR
IPT
ACCEPTED MANUSCRIPT
resistance to Fusarium in durum wheat?” The main
concepts extracted are “QTLs”, “resistance to
Fusarium” and “durum wheat”. Note that concepts
may not only refer to structures in the model, but also
to instances or conditions. For each concept, first we
retrieve the exact matches from a Genetics Dictionary
(Maté, Trujillo, & Mylopoulos, 2012). The Genetics
Dictionary returns a formalized version of the
concept, which includes mappings to the data
warehouse schema if the concept has been used
before. The remaining unknown concepts are matched
by means of the DW Ontology (Figure 4) and
WordNet (Figure 6). For example, “QTL” matches
with the level “QTL”, thus it is added along with the
mapping information to the dictionary. Next, “durum
wheat” is not matched against any element in the
Ontology, thus it is expanded by means of WordNet.
As a result of the expansion, “durum wheat” is
matched as an instance of the level “Species” of
plants. As in the previous case, the concept and its
mapping information are stored in the dictionary. If
any concept can be matched against multiple
candidates in the Ontology or it cannot be found, then
the user is prompted to disambiguate the concept. In
the case of concepts that are not found in the
Ontology, the user can directly specify the mapping
by means of a formal mapping. For example,
“resistance to Fusarium” cannot be matched to any
element in the schema, thus it is expanded by means
of WordNet. As no element matches are found, the
user is prompted for a match. Therefore, the user
introduces a formal translation for this concept as
“with Trait code equal to resistance to Fusarium”,
which is stored in the Genetics Dictionary for future
queries. Once all the concepts have been identified,
the query is reformulated as a valid controlled
language expression (Maté, Trujillo, & Mylopoulos,
2012). In our example, the posed query is transformed
into “Evidence of QTL and Trait with Trait code
equal to resistance to Fusarium and Species with
species equal to durum wheat”, where Evidence is
added to the query because most DW systems require
at least one measure to be queried to the system in
order to correctly retrieve the data. Finally, the
controlled language query is sent to the parser module
that processes the query and outputs a MDX query
understandable by OLAP engines.
Algorithm 1. Natural language query parsing
algorithm
In the event that the parser module can obtain
multiple MDX queries, i.e. the formal concepts have
multiple mappings to the DW schema and allow for
several valid queries, then the user is notified to select
the desired query to be posed to the DW system.
As a result, the DW node returns a cube which
contains the information specified by the NL query,
which can be navigated using the traditional OLAP
operations, such as roll-up or drill-down.
The QA node. The NL question is internally
processed through a set of NLP tools (e.g. POS-
taggers or partial parsing) in order to detect the type
of the answer to be searched (e.g. for the previously
mentioned question “What QTLs are related to
resistance to Fusarium in durum wheat?”, given the
“QTL” answer type, it supposes that the searched
information consists of a string followed or preceded
by the word QTL, or associated to –gene, allele, etc–),

ACC
EPTE
D M
ANU
SCR
IPT
ACCEPTED MANUSCRIPT
as well as the most salience entities in the question
(e.g. “durum wheat” as an entity of plant-object type).
After that, the processed answer is posed to an
Information Retrieval tool in order to obtain the set of
documents that is more likely to contain the answer.
These documents are analyzed in order to extract a set
of answers sorted by the probability of correction
certainty. The extraction process is specialized for
each answer type. For example, in the case of the
“QTL” type, for the previously mentioned question,
several patterns are used to extract the answer from
the NOUN Phrase answer. In the sentences a) “…the
QTL Qfhs.ndsu-3AS in order to develop durum wheat
plasm and cultivars with higher level of Fusarium
resistance.” and b) “…Fusarium resistance, especially
that mediated by Fhb1 gene.”, the syntactic patterns
allow flexibility in order to detect the solution noun
phrase “QTL Qfhs.ndsu-3AS” extracting the specific
QTL solution (“Qfhs.ndsu-3AS”); similarly with the
second solution (“Fhb1 gene”) that is extracted thanks
to the hyperonym relation between QTL and Gene.
Finally, the set of answers extracted by the QA system
is stored in a relational database (Stanojevic &
Vraneš, 2012; Kerui et al., 2011) with the structure
defined in the QA integration model (see Figure 2).
Subsequently, this database and the flattened DW
cube will be joined (through the union points) in a
resulting table as it is explained in detail in the
following step.
The integration of the results. Once the running of
each DW and QA node is finished, the
Distributor/Integrator element creates an integrated
view of the data returned from both nodes. In order to
integrate the results from both the QA and the DW
without storing the information directly into the DW,
a transformation must be made. DWs represent
information in a multidimensional manner, whereas
QA retrieves information in a table format. Therefore,
we apply the following process. First, we lower the
dimensionality of the DW information retrieved by
transforming the DW cube into a table (i.e. flattening
process). This process is formalized as follows:
Let C = {M, D} be a cube where M is a set of
measures represented by the cube and D is a set of
dimensions that determine the coordinates of the cube.
A Relation R containing the equivalent information
can be obtained by the following process. For each
level selected Lj in dimension di ∈ D, a column is
created in R. Afterwards, the columns corresponding
to the measures mn ∈ M are created. Finally, R is
populated by a set of tuples n1...nn where the domain
of each column cj = {Lj} for the columns
corresponding to the dimensions and cn = {mn} for the
columns corresponding to the measures. A similar
result can be obtained in current BI tools by pivoting
all dimensions to one side of the pivot table.
The information in the QA node is represented by an
ontology as the one shown in Figure 5. Let
QAont,DWont = {C,R} be the ontologies for the QA
system and the DW respectively, containing a set of
concepts C and a set of relationships R, and M is a set
of mappings from attributes in DWont concepts to Cn
∈ QAont, A minimal relation T from the QA system
containing only the minimum information can be
obtained by obtaining a set of tuples n1,…nn, by
extracting all Cn ∈ M from each result ni obtained by
the QA system. The domain of each column cj<n-1 ∈ T
is cj = {Cj} , and the domain of the last two columns is
cn-1 = {0..1} and cn={urls} respectively, where cn-1
represents the confidence in the result obtained and cn
contains the url where the result was obtained from.
As can be seen, T can be joined with R, as long as
both recover at least one concept Cn ∈ M.
After that, we have obtained a compatible
representation of the DW data and a set of union
points (that we have called connections and are
identified by means of the ontological mappings as it
is depicted in Figure 5). In the next step, the user
filters the QA results and selects those elements that
the decision maker considers relevant to be joined to
the flattened DW cube through the union points in a
resulting table created on the fly: DW⋈QA (where
the symbol ⋈ indicates the natural join between the
two tables). Therefore, the DW system is not altered
in any way, keeping the data clean and avoiding being
affected by inaccuracies in the information retrieved
by the QA system.
Finally, the dashboard (feeding on the mentioned
joined table) shows both data from inside the
company and outside. Moreover, these connections
points would allow the automatic generation of new
questions, such as the questions about the specific
traits stored in the DW (e.g. “What QTLs are related
to frost tolerance in durum wheat?”), which facilitates
to focus only on the new advances about the traits
present in the DW.
ACC
EPTE
D M
ANU
SCR
IPT
ACCEPTED MANUSCRIPT
Repository of questions. Our approach stores the QA
results in a persistent way through a new DW
repository. This repository is created from the QA
integration model (Figure 2) and a generic set of
dimensions. The logical design has four dimensions:
Date, contains the information about when the
question was made; Query, with the NL question;
Fields, with the QA integration model fields and the
union points; and one degenerated dimension with ID,
that links with the specific NL question and the QA
rows obtained in a concrete date. The fact table of this
repository has the elements retrieved after the
matching phase. The purpose of this repository is
double: on the one hand, the external data obtained
through the QA system are stored in a permanent way
in order to have a historical file with relevant data to
the different questions, overcoming the intrinsic
dynamic character of the external information –e.g.
the biomedical papers present in the MEDLINE
database returned by the search engine PubMed
(PubMed, 2013)–; on the other hand, a comparison of
the obtained results with different questions or even
the same question with different dates can be made.
Advantages of our proposal. The main advantages of
this integration of results are: (1) the decision maker
can browse all the information (passage, context,
precise answer, etc.) about every tuple of the QA
database so the user does not need to explore the
whole document; (2) the user can delete the incorrect
tuples returned by the QA node; (3) new questions
can be automatically generated from the instances
stored in the DW taking into account the ontology
integration and the detected question entities; and (4)
the connections between the QA and DW ontologies
have been detected in order to facilitate the data
integration.
Finally, it is important to emphasize the modularity
and scalability of our framework. It is independent of
the DW and the QA systems specifically used,
because the integration of these systems is carried out
by the detected connection points between the
respective ontologies, thereby having a more
integrated and scalable view of internal and external
data. Furthermore, several QA nodes can be used and,
subsequently, several QA databases are shown to the
user in the dashboard. Moreover, the user can easily
store different questions and results (DW cube and
QA database), allowing the user to save time in the
access and analysis of external information.
4. A CASE SCENARIO
4.1. The case scenario description
After introducing the system architecture, we
illustrate the application of our framework, and later
we will evaluate it through the following case
scenario: a plant breeder enterprise wants to carry out
new breeding programs experimenting with the new
advances in Genetics. An optimal breeding program
must consider all the current scientific knowledge to
obtain the maximum efficiency. As explained in
Section 1, the present rate of scientific publications on
ecological and biomedical sciences justifies the need
of developing efficient data mining approaches. The
data mining purpose is not only to facilitate the work
by gathering all the updated information about an area
of expertise, but also to create new biological
knowledge (Krallinger & Valencia, 2005). Therefore,
the decision maker of the breeding program can easily
access to external data about relevant agronomic traits
and draw up new molecular protocols to design
genetically modified crops in order to increase the
productivity of the seed industry. Further applications
of these enrichment techniques could include
scenarios of metabolic pathways (i.e. protein
networks).
The corresponding model for the mentioned scenario,
shown in Figure 7, is based on a UML profile for
modeling DWs presented in (Luján-Mora, Trujillo, &
Song, 2006). DW models structure data according to a
multidimensional space, where events of interest for
an analyst (e.g., sales, treatments of patients,
molecular markers…) are represented as facts which
are associated with cells or points in the
multidimensional space, and which are described in
terms of a set of measures. These measures can be
analyzed by means of dimensions which specify
different ways the data can be viewed, aggregated or
sorted (e.g. according to time, store, customer, plant
variety, etc.). Importantly, dimensions are organized
as hierarchies of levels, which are of paramount
importance in BI systems in order to empower data
analysis by aggregating data at different levels of
detail.
ACC
EPTE
D M
ANU
SCR
IPT
ACCEPTED MANUSCRIPT
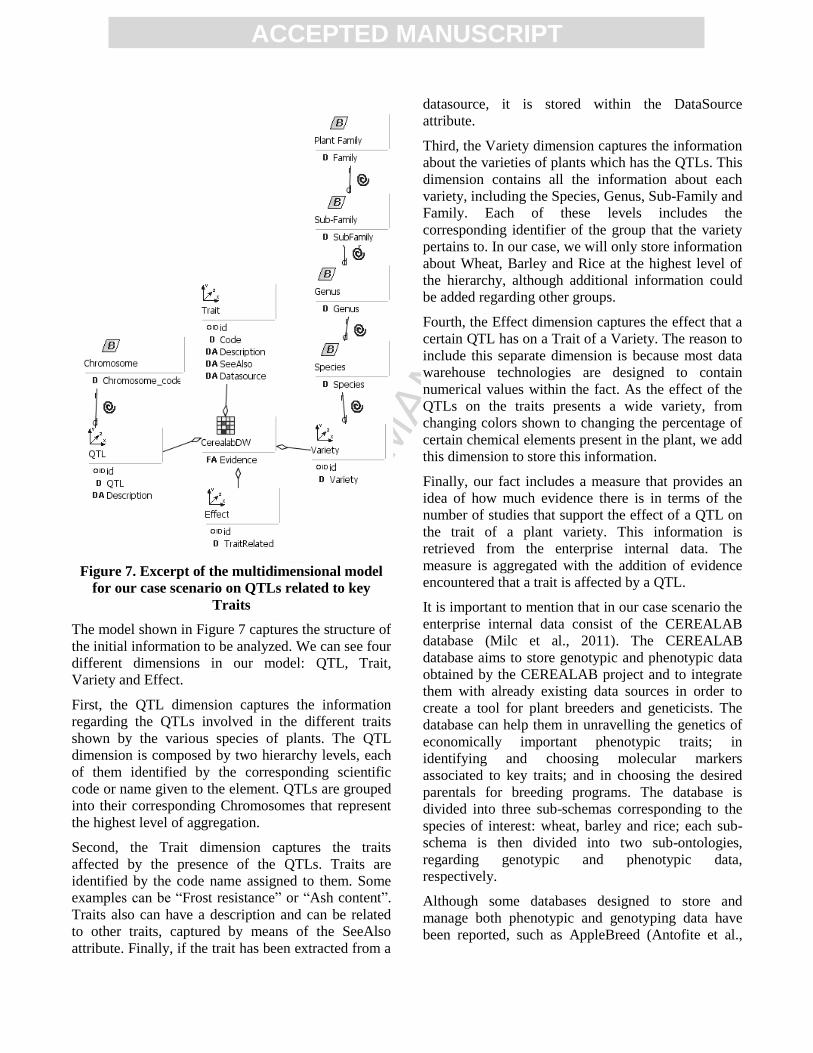
Figure 7. Excerpt of the multidimensional model
for our case scenario on QTLs related to key
Traits
The model shown in Figure 7 captures the structure of
the initial information to be analyzed. We can see four
different dimensions in our model: QTL, Trait,
Variety and Effect.
First, the QTL dimension captures the information
regarding the QTLs involved in the different traits
shown by the various species of plants. The QTL
dimension is composed by two hierarchy levels, each
of them identified by the corresponding scientific
code or name given to the element. QTLs are grouped
into their corresponding Chromosomes that represent
the highest level of aggregation.
Second, the Trait dimension captures the traits
affected by the presence of the QTLs. Traits are
identified by the code name assigned to them. Some
examples can be “Frost resistance” or “Ash content”.
Traits also can have a description and can be related
to other traits, captured by means of the SeeAlso
attribute. Finally, if the trait has been extracted from a
datasource, it is stored within the DataSource
attribute.
Third, the Variety dimension captures the information
about the varieties of plants which has the QTLs. This
dimension contains all the information about each
variety, including the Species, Genus, Sub-Family and
Family. Each of these levels includes the
corresponding identifier of the group that the variety
pertains to. In our case, we will only store information
about Wheat, Barley and Rice at the highest level of
the hierarchy, although additional information could
be added regarding other groups.
Fourth, the Effect dimension captures the effect that a
certain QTL has on a Trait of a Variety. The reason to
include this separate dimension is because most data
warehouse technologies are designed to contain
numerical values within the fact. As the effect of the
QTLs on the traits presents a wide variety, from
changing colors shown to changing the percentage of
certain chemical elements present in the plant, we add
this dimension to store this information.
Finally, our fact includes a measure that provides an
idea of how much evidence there is in terms of the
number of studies that support the effect of a QTL on
the trait of a plant variety. This information is
retrieved from the enterprise internal data. The
measure is aggregated with the addition of evidence
encountered that a trait is affected by a QTL.
It is important to mention that in our case scenario the
enterprise internal data consist of the CEREALAB
database (Milc et al., 2011). The CEREALAB
database aims to store genotypic and phenotypic data
obtained by the CEREALAB project and to integrate
them with already existing data sources in order to
create a tool for plant breeders and geneticists. The
database can help them in unravelling the genetics of
economically important phenotypic traits; in
identifying and choosing molecular markers
associated to key traits; and in choosing the desired
parentals for breeding programs. The database is
divided into three sub-schemas corresponding to the
species of interest: wheat, barley and rice; each sub-
schema is then divided into two sub-ontologies,
regarding genotypic and phenotypic data,
respectively.
Although some databases designed to store and
manage both phenotypic and genotyping data have
been reported, such as AppleBreed (Antofite et al.,
ACC
EPTE
D M
ANU
SCR
IPT
ACCEPTED MANUSCRIPT
2007) or PlantDB (Exner et al., 2008) among others,
we have decided to use CEREALAB because those
databases are often designed to store the experimental
data and the data available are generally restricted to
those implemented by the developers/users with no
possibility to take advantage of already available
information that resides in other data sources.
Moreover, CEREALAB is the first database specific
for breeding of wheat, barley and rice, fundamental
crops for the world agriculture (Milc et al., 2011).
In order to use the CEREALAB database, a
multidimensional repository (data mart) of the
information to be analyzed was created. There are two
main reasons for this approach: (i) multidimensional
databases are structured to optimize reading
operations, which is the main focus of our database,
and (ii) it is usually easier for the users to use
dimensions in order to filter the data and pose broad
questions than using tables directly.
With the UML model of Figure 7, users (the decision
makers) can request a set of queries to retrieve useful
information from the system. For instance, they are
probably interested in obtaining all the phenotypic
characteristics related to a specific QTL. Many other
queries can be similarly defined to support the
decision making process. However, the allowed
queries are constrained by the information contained
in the schema in such a way that other important
information may be missed. For example, the
following scenario is likely to happen: the company
wants to offer interesting new breeding programs
based on the last advances in Genetics. Normally, the
company has not any internal report about this
information; however, it is likely to obtain this
information from the Web.
4.2. The application of our proposal on the case
scenario
Let us apply our framework detailed in section 3 to
this case scenario supposing that the following user’s
NL request of data is formulated: “What QTLs are
related to resistance to Fusarium in durum wheat?”
Setup phase. QA and DW node. With regard to the
system setup phase, on the one hand, in the QA node,
the QA integration model and the QA ontology of
answer types are generated in Figure 2 and 3
respectively. As it can be seen in these Figures, the
QA integration model specifies: the answer type, the
entities detected in the question, the URL or
document identifier, the noun phrase and the passage
(formed by three sentences) that contains the answer.
On the other hand, in the DW node the DW ontology
is created (Figure 4).
Setup phase. QA and DW ontology mapping. Next,
the connections between the DW and QA ontologies
are detected. In Figure 5 and 6 can be seen: (a) one
equivalent class in both ontologies (QTL) and two
equivalent properties (Species.species vs. Plant and
Trait.code vs. Phenotypic characteristic); (b) four new
subclasses are added in the QA ontology: Sub-Family,
Genus, Species and Variety; (c) the lexical-semantic
resource used in QA is enriched with the set of
specific QTLs stored in the DW.
Running phase. The GUI and Distributor/Integrator
element. In the running phase, the GUI element
receives the NL request of data, which is distributed
to each specialized node by the Distributor/Integrator
element.
Running phase. The DW node. In the DW node, the
NL query is transformed into MDX as presented in
section 3.2., and the cube shown in Figure 8 is
returned. In this scenario the following MDX query is
obtained: with
set Trait_Filter as '{Filter([Trait].Children,
([Trait].CurrentMember.Name = "Resistance to
Fusarium"))}'
set Variety_Filter as
'{Filter([Variety].[Species].Members,
([Variety].[Species].CurrentMember.Name = "
durum wheat"))}'
select NON EMPTY {[Measures].[Evidence]} ON
COLUMNS,
NON EMPTY
Hierarchize(Union(Crossjoin([Trait_Filter],
Crossjoin([Variety_Filter],
[Chromosome].[Chromosome].Members)),
Crossjoin([Trait_Filter], Crossjoin([Variety_Filter],
[Chromosome].[QTL].Members)))) ON ROWS
from [CerealabDW]
Running phase. The QA node. In the QA node, the
NL question is processed, and its output is structured
as the QA integration model specifies. It returns
“QTL” type as the answer type according to the QA
ontology; the Question Entities “resistance to
Fusarium” as an entity of Phenotypic Characteristic

ACC
EPTE
D M
ANU
SCR
IPT
ACCEPTED MANUSCRIPT
type; and “durum wheat” as an entity of Plant type.
Both entities are used to trace and restrict possible
right entity solutions of QTL type (e.g. when the
document contains the noun phrase “durum wheat”).
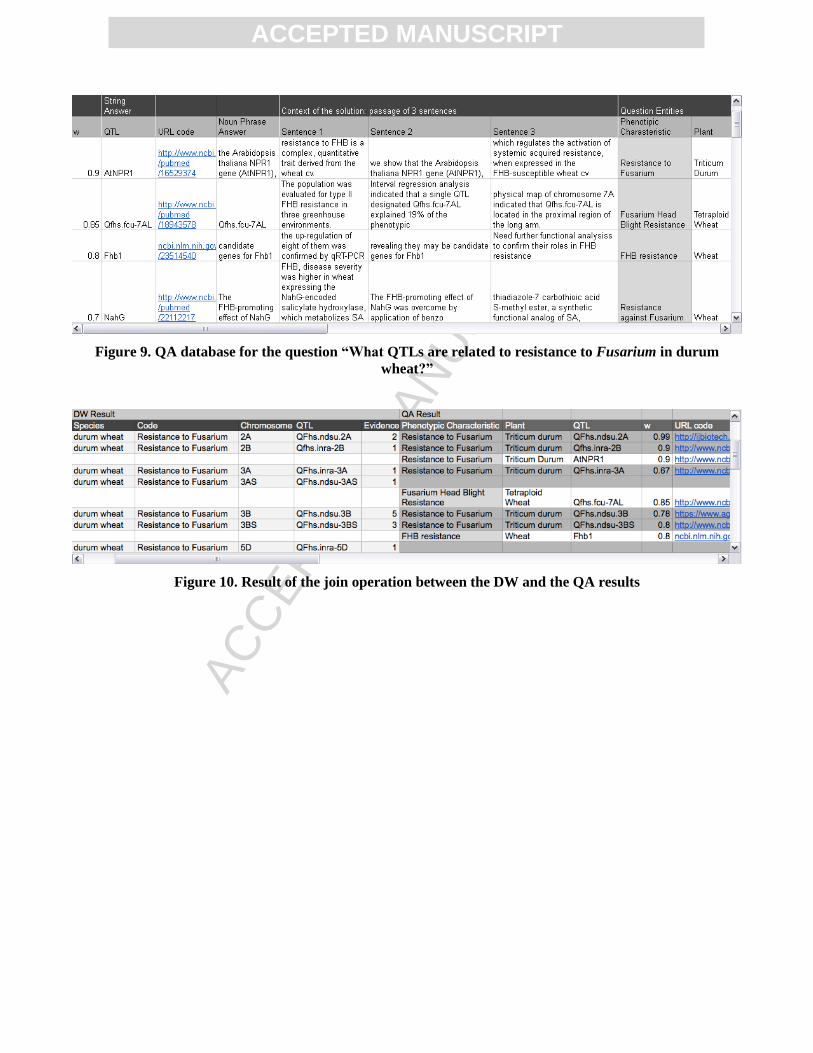
Then, the set of answers extracted by the QA system
is stored in the database shown in Figure 9, in which
the first column (“w”) means the confidence of the
QA system in this answer (this value ranges between
0 and 1); the second one means the string answer that
is extracted from the fourth column that means the
noun phrase that contains the answer (e.g. the
“AtNPR1” QTL entity is extracted from the noun
phrase solution in “the Arabidopsis thaliana NPR1
gene (AtNPR1)” thanks to the pattern
“QTL/gene/allele + QTL/gene/allele_Name” that
specifies the word “QTL” or
synonym/hyponym/hyperonym followed by a string
which denotes the QTL name); the third one means
the QA system internal code of the Web page; the
following three columns represent the passage in
which the solution appears. The passage is formed by
three sentences, where the sentence 2 contains the
answer. In this way, the user has a context to decide
whether the answer is right: the text around the
solution, as well as the link to the corresponding URL
to access the whole document. Therefore the user can
filter this QA database by deleting the wrong
extracted information. The last two columns mean the
question entities extracted in the document by means
of a name entity tagger, which can be used as
connection points in the integration phase. For
example, from the document with URL code
“www.ncbi.nlm.nih.gov/pubmed/18943578” the
following Question Entities are detected “Fusarium
Head Blight Resistance” as Phenotypic Characteristic
type and “Tetraploid Wheat” as Plant type; it is
important to mention the need of using lexical
resources and specialized dictionaries to identify
synonym/hyponym /hyperonym relations (for instance
“tetraploid wheat”, “durum wheat” and “triticum
durum” are synonyms). Moreover, the Noun Phrase
Answer is extracted from the three sentences that
contain the solution “a single QTL designated
Qfhs.fcu-7AL” and, consequently, the new QTL
Qfhs.fcu-7AL is obtained. This example is very
important in order to justify our approach due to the
QTL extracted from the mentioned PubMed paper –
dated May 2007– is not present in the CEREALAB
DW as QTL related to resistance to Fusarium in
durum wheat. Similarly, from the document with
URL code “www.ncbi.nlm.nih.gov/
pubmed/16529374” the Question Entities “resistance
to Fusarium head blight” and “wheat”, and the Noun
Phrase Answer “the Arabidopsis thaliana NPR1 gene
(AtNPR1)” are detected; consequently, the new Gene
AtNPR1 –not present in CEREALAB as gen related
to Fusarium resistance in wheat– is obtained. In this
way, these obtained data could be used in Genetic
Engineering approaches in order to improve the
resistance of the wheat.
Running phase. The integration of the results. The
DW cube and the QA database are sent to the
Distributor/Integrator element, which merges the
different results and sends them to the GUI element.
The merge is performed in our scenario as follows.
The results obtained from the DW node are obtained
in a cube (Figure 8) that is flattened, obtaining a set of
tuples that contain the relevant columns to the query
posed, including “Species”, “Trait”, “Chromosome”,
“QTL” and “Evidence”. Then, these results are joined
with the information recovered from the QA system
(Figure 9). Both results are joined by means of the
candidate union points identified in the ontology (see
Figure 5) and selected by the user –in this scenario the
union point “QTL” is only selected–. The result is a
table created on the fly (Figure 10) that contains the
natural join (⋈) between the flattened DW cube and
the QA result. By default, the natural join is only
carried out with the top twenty answers of the QA
database and this information is initially shown at the
dashboard.
For example, in Figure 10, using the connection
“QTL”, each DW row is joined with the QA result
whose QTL query entity matches. In the Figure, the
QTLs “QFhs.ndsu.2A” or “Qfhs.inra-2B” matches so
they are shown both the DW and the QA result. In
case of no matching between the union point, as
occurs in the QA results “AtNPR1”, ”Qfhs.fcu-7AL”
and “Fhb1”, our proposal shows these results to
emphasize that they are new data not present in the
DW. In the same way it should happen with the DW
results that do not match with the QA results.
If other connections were established, like “Trait”,
every “QTL” and “Trait” in the DW will be joined
with their equivalent QA results.
After creating the joined table, the integrated results
can be viewed in the dashboard (see Figure 11). At
the top of figure, two charts are shown: (1) “Final
results” that indicates the percentage of results
extracted from the web not present in the DW (in the

ACC
EPTE
D M
ANU
SCR
IPT
ACCEPTED MANUSCRIPT
figure, 9.1% represent the new QTLs not considered
in the DW); (2) “QA Performance” that denotes the
QA total results (correct answers) vs. QA filtered
results (incorrect answers).
After the charts, the previous mentioned join table is
presented. In this table, the user can select the rows to
analyze. Additionally, the dashboard allows the user
configure how many QA results will be joined (by
default, the top twenty answers).
At last, a chart shows the answer evidence in both the
DW and the QA results. This evidence denotes the
number of the papers/passages that contains the
answer (obtained from the information stored in the
DW and the QA results). In the example, it is
important to note the new QTLs extracted from the
web (“AtNPR1”, ”Qfhs.fcu-7AL” and “Fhb1”) that
can be seen in the chart.
Repository of questions. The QA database is stored in
a persistent way through the new DW repository as
well as the date when the question was made, and the
NL question. In order to avoid information
redundancy, the DW extracted cube is not stored
because this information would be easily extracted
again whenever the decision maker runs the same
query. That is to say, we only stores in the repository
of questions, the dynamic external information.
Figure 8. Cube retrieved from the DW
ACC
EPTE
D M
ANU
SCR
IPT
ACCEPTED MANUSCRIPT
Figure 9. QA database for the question “What QTLs are related to resistance to Fusarium in durum
wheat?”
Figure 10. Result of the join operation between the DW and the QA results

ACC
EPTE
D M
ANU
SCR
IPT
ACCEPTED MANUSCRIPT
Figure 11. Dashboard presented to the user

ACC
EPTE
D M
ANU
SCR
IPT
ACCEPTED MANUSCRIPT
5. EVALUATION
5.1. Description of the QA system
The QA system used for this experiment is called
AliQAn, with which we have participated in several
CLEF2 competitions in both monolingual (Roger et
al., 2009) and cross-lingual tasks (Ferrández et al.,
2009). AliQAn consists of two phases: the indexation
and the search phase. The first one is carried out in an
off-line mode previous to the search phase, where its
main aim is to prepare all the information required for
the subsequent phase, in order to speed up as much as
possible the searching process. There are two
independent indexations, one for the QA process, and
another for the IR process. The first indexation
involves Natural Language Processing tools in order
to reach a better understanding of the documents (e.g.
a morphological analyzer such as Maco+3 or
TreeTagger4, a shallow parser such as SUPAR
(Ferrández, Palomar, & Moreno, 1999) and a Word
Sense Disambiguation, WSD, algorithm (Ferrández et
al., 2006) that is applied on WordNet/EuroWordNet5,
EWN). The second indexation is used for the IR tool
that filters the quantity of text on which the QA
process is applied (AliQAn uses the IR-n system
(Llopis, Vicedo, & Ferrández, 2003)).
With regard to the search phase, it is accomplished in
three sequential modules: (1) Question Analysis (2)
Selection of relevant passages (3) Extraction of the
answer. Module 1 uses the same NLP tools as in the
indexation phase (Maco+, SUPAR, WSD and EWN)
with the aim of reaching a syntactic analysis of the
question, and eliciting its Syntactic Blocks (SBs).
These SBs are matched with a set of syntactic-
semantic question patterns designed for the detection
of the expected answer type and the identification of
the main SBs of the question. The answer type is
classified into a taxonomy based on WordNet Based-
Types and EuroWordNet Top-Concepts. AliQAn’s
taxonomy consists of the following categories:
person, profession, group, object, place city, place
country, place capital, place, abbreviation, event,
numerical economic, numerical age, numerical
measure, numerical period, numerical percentage,
numerical quantity, temporal year, temporal month,
temporal date and definition. Each taxonomy class
stands for the type of information that the answer
needs to contain in order to become a candidate
answer (e.g. for the “person” type, a proper noun will
be required, or for the “temporal” type, a date will be
required). The main SBs of the question are used in
Module 2 in order to extract the passages6 of text on
which Module 3 will search for the answer. For
example, the CLEF 2006 question “Which country
did Iraq invade in 1990?” is matched by the pattern
“[WHICH] [synonym of COUNTRY] [...]”, where the
“place” answer-type is assigned, so a proper noun is
required in the answer, with a semantic preference to
the hyponyms of “country” in WordNet. Finally, the
following SBs are used in Module 2: “[Iraq] [to
invade] [in 1990]”, in order to select the most relevant
passages between all the documents. You can notice
that the SB “country” is not used in Module 2 because
it is not usual to find a country description in the form
of “the country of Kuwait”. Module 3 also uses a set
of syntactic-semantic answer patterns to search for the
correct answer. For example, for the question “What
is the brightest star visible in the universe?”, AliQAn
extracts “Sirius” from the following sentence: “All
stars shine but none do it like Sirius, the brightest star
in the night sky”, although a complete matching is not
reached between the SBs of the question and those of
the sentence.
5.2. Experiment Results on the Case Scenario
This experiment is run on the case scenario previously
detailed. The DW server in our experiment is
configured to use the open-source BI platform called
Pentaho. Pentaho provides the necessary OLAP
capabilities by means of the Mondrian OLAP server.
The OLAP server is connected to a MySQL Server
5.6 DBMS that stores the data for the analysis. Since
our approach transforms the input into a MDX query,
it can be sent directly to the OLAP server, without
performing modifications in the platform.
In respect of the ontologies, they have been
formalized using the Web Ontology Language (OWL)
following W3C Recommendations (Dean &
Schreiber, 2004; Patel-Schneider, Hayes, & Horrocks,
2004). We have used Protégé 4 (ontology editing
environment) to create the ontologies
(http://protege.stanford.edu/).
With regard to the information extracted from the
Web, the following URLs corpus is crawled:
PubMed (www.ncbi.nlm.nih.gov/pubmed)
PLoS ONE (www.plosone.org)

ACC
EPTE
D M
ANU
SCR
IPT
ACCEPTED MANUSCRIPT
The Cuban Journal of Agricultural Science or RCCA
(http://www.ciencia-animal.org/cuban-journal-of-
agricultural-science/)
The initial NL request of data is “What QTLs are
related to resistance to Fusarium in durum wheat?”,
which is classified by AliQAn as “QTL” type.
With regard to the results obtained on the previously
mentioned corpus, our framework obtained a Mean
Reciprocal Rank (MRR7) of 0.23. In the previous
participations of AliQAn in CLEF between 2003 and
2008, there were 76 questions of group type (the
hyperonym of QTL), where AliQAn obtained a MRR
of 0.32. This lower MRR obtained on this corpus is
due to a number of reasons. Firstly, the conversion of
the Web pages into text should be improved, mainly
in the process of tables in order to link each
dimension of the table. Secondly, the AliQAn system
has been designed for the CLEF competitions, but it
requires a deeper adaptation to the case scenario,
through the inclusion of new domain resources (e.g.
an ontology of QTLs/genes/alleles), and the
adaptation of the patterns to extract an answer in this
domain.
An excerpt of the results extracted is shown in Figure
9, in which it is observed a high confidence in each
answer (see column 1).
In respect of time and space performances for all the
phases of our approach, the system setup phase is run
off-line so the time efficiency is not so critical. The
QA integration model and the QA ontology
construction does not involve a great computational
cost (both in time and space) because the range of QA
systems and question types are not so broad.
Moreover, most QA systems already use ontologies,
which facilitate the construction of the QA ontology.
Regarding the construction of the DW ontology, it is
run by analysing the DW catalog and schema in order
to build the ontology that captures the domain entities,
properties, relationships and constraints. In order to
build the DW ontology, and keep the system within a
manageable range of data volume, only the minimal
information needed from the DW is stored into the
ontology. Concretely, entity names, properties and
value types are mapped from the DW into the
ontology, while the actual data is not. Therefore, the
DW ontology mapping is not computationally costly,
for example as the one performed by the OWLminer’s
approach (Santoso, Haw, & Abdul-Mehdi, 2010),
which consists on implementing the algorithm known
as Feature and Relation Selection, FARS (Hu et al.,
2008).
Finally, in order to reduce the computational cost of
this phase, a repository of these ontologies is
constructed in order to perform this phase just the first
time the corresponding node is connected to our
framework.
Regarding the running phase, the computational cost
is well known through the costs of standard DW and
QA systems. With reference to the integration of the
results, the relations returned by each of node are
sorted by the union points selected before performing
the join operation in order to optimize its
performance.
In the future, we wish to provide an in-depth analysis
adequately comparing the results of integrating an
increasing number of nodes, tuples per node, and
number of QA answers among other factors, although
due to its size and focus it is out of the scope of this
paper.
6. CONCLUSIONS AND FUTURE RESEARCH
Nowadays, DWs play a decisive role in BI
applications due to the fact that they can provide
many years of historical information in an accurate
way for the decision making process. It is widely
accepted that current BI solutions should incorporate
both structured and unstructured data for better
decisions. Unfortunately, research in this direction has
two main weak points: (i) the use of IR and IE
techniques instead of QA; (ii) the lack of full
integration between systems that access the
unstructured and structured data. Our proposal
overcomes these two points (see section 2.1.) by using
QA techniques, which allows a seamlessly integration
with structured information, and a high flexibility to
afford any kind of question, and not only a set of
predefined templates; and by using ontologies to
achieve the full integration between DW and QA. The
results are presented to the user by a dashboard, which
allows the decision maker to: (i) compare
immediately internal data of a company against
competitors; (ii) select the set of QA tuples without
exploring the whole document; (iii) store the results of
each question as QA DW; (iv) automatically generate
new questions from the instances stored in the DW
according to the ontology integration and the detected
question entities.

ACC
EPTE
D M
ANU
SCR
IPT
ACCEPTED MANUSCRIPT
Regarding to the full integration between unstructured
and structured data, just enumerate the main
contributions of our proposal to previous work: (i) the
use of ontologies for data integration; (ii) the
presentation of results by means of dashboards, which
allows a more integrated view of data; (iii) the
authoring services for the NL interface in order to
improve the system usability; (iv) the scalability of
the proposal since it is independent of the number or
types of QA/DW systems to integrate.
Our framework is based on well-checked steps that
are accomplished in a semi-automatic way, whose
application is illustrated through the case scenario of a
plant breeder enterprise. This is integrated and
evaluated by using the QA system called AliQAn,
with which we have participated in several CLEF
competitions both in monolingual and cross-lingual
tasks. AliQAn has successfully generated a structured
database with the information that can be
automatically processed by a BI system.
As future work, we will study how the different steps
of our framework can be better automated, for
example, the mapping process between QA and DW
ontologies. Another issue to improve in the future is
the question analysis in the Distributor/Integrator
element, in order to (i) automatically detect the
sources to be searched for the required information;
and (ii) automatically split the question to be passed
to each specific node (e.g. when a more complex
query is posed such as “What QTLs and alleles are
related to frost tolerance in barley?”, it must be split
into two QA questions such as “What QTLs are
related to frost tolerance in barley?” and “What alleles
are related to frost tolerance in barley?”). A medium-
term future work is to adapt this framework to a
NOSQL server (e.g. Hadoop) and take advantage
from the MapReduce algorithm to process more
complex data sources.
7. ACKNOWLEDGEMENTS
This paper has been partially supported by the
MESOLAP (TIN2010-14860) and GEODAS-BI
(TIN2012-37493-C03-03) projects from the Spanish
Ministry of Education and Competitivity. Alejandro
Maté is funded by the Generalitat Valenciana under
an ACIF grant (ACIF/2010/298).
We thank Domenico Beneventano and his research
group for the cession of the CEREALAB database for
academic purposes.
8. REFERENCES
Abelló, A., Ferrarons, J., & Romero, O. (2011).
Building cubes with MapReduce. In Proceedings
of the ACM 14th international workshop on Data
Warehousing and OLAP, pp. 17-24.
Alqarni, AA., & Pardede, E. (2012). Integration
of Data Warehouse and Unstructured Business
Documents. In Proceedings of the 15th
International Conference on Network-Based
Information Systems (NBiS 2012), pp.32-37.
Altman, R., Bergman, C., Blake, J., Blaschke, C.,
Cohen, A., Gannon, F., Grivell, L., Hahn, U.,
Hersh, W., Hirschman, L., Jensen, LJ., Krallinger,
M., Mons, B., O'Donoghue, SI., Peitsch, MC.,
Rebholz-Schuhmann, D., Shatkay, H., &
Valencia, A. (2008). Text mining for biology - the
way forward: opinions from leading scientists.
Genome Biology, 9 Suppl 2:S7.
Antofie, A., Lateur, M., Oger, R., Patocchi, A.,
Durel, C., & Van de Weg W. (2007). A new
versatile database created for geneticists and
breeders to link molecular and phenotypic data in
perennial crops: the AppleBreed DataBase.
Bioinformatics, 23(7), pp. 882-891.
Badia, A. (2006). Text warehousing: Present and
future. In Processing and Managing Complex
Data for Decision Support, J. Darmont and O.
Boussaïd, Eds. Idea Group Publishing, pp. 96-
121.
Bhide, M., Chakravarthy, V., Gupta, A., Gupta,
H., Mohania, M., Puniyani, K., Roy, P., Roy, S.,
& Sengar, V. (2008). Enhanced Business
Intelligence using EROCS. In Proceedings of
ICDE 2008, pp. 1616-1619.
Damljanovic, D., Agatonovic, M., &
Cunningham, H. (2012). FREyA: An interactive
way of querying Linked Data using natural
language. In The Semantic Web: ESWC 2011
Workshops, pp. 125-138.
Dean, J., & Ghemawat, S. (2008). MapReduce:
simplified data processing on large clusters.
Communications of the ACM, 51(1), pp. 107-113.

ACC
EPTE
D M
ANU
SCR
IPT
ACCEPTED MANUSCRIPT
Dean, M., & Schreiber, G. (2004). OWL Web
Ontology Language Reference. W3C
Recommendation, http://www.w3.org/TR/2004/
REC-owl-ref-20040210/ (visited on 24th of
March, 2013).
Eckerson, W. (2007). Dashboard or scorecard:
which should you use? [Online]. Available:
http://www.tdan.com/view-articles/4674 (visited
on 24th of March, 2013).
Exner, V., Hirsch-Hoffmann, M., Gruissem, W.,
& Hennig, L. (2008). PlantDB - a versatile
database for managing plant research. Plant
Methods, 4:1, doi:10.1186/1746-4811-4-1.
Falconer, DS., & Mackay, TFC. (1996).
Introduction to Quantitative Genetics, Ed 4.
Longmans Green.
Ferrández, A., Palomar, M., & Moreno, L. (1999).
An empirical approach to Spanish anaphora
resolution. Machine Translation, 14(3/4), pp. 191-
216.
Ferrández, A., & Peral, J. (2010). The benefits of
the interaction between data warehouses and
question answering. EDBT/ICDT Workshops
2010, Article No. 15, pp. 1-8.
Ferrández, S., Roger, S., Ferrández, A., & López-
Moreno, P. (2006). A New Proposal of Word
Sense Disambiguation for Nouns on a Question
Answering System. Advances in Natural
Language Processing. Research in Computing
Science, pp. 83-92.
Ferrández, S., Toral, A., Ferrández, O., Ferrández,
A., & Muñoz, R. (2009). Exploiting Wikipedia
and EuroWordNet to Solve Cross–Lingual
Question Answering. Information Sciences,
179(20), pp. 3473-3488.
Ferré, S. (2012). SQUALL: A Controlled Natural
Language for Querying and Updating RDF
Graphs. Controlled Natural Language, pp. 11-25.
Gartner Group report. (2011). Gartner Says
Solving 'Big Data' Challenge Involves More Than
Just Managing Volumes of Data. [Online].
Available:
http://web.archive.org/web/20110710043533/http:
//www.gartner.com/it/page.jsp?id=1731916
(visited on 24th of March, 2013).
Gray, J., Chaudhuri, S., Bosworth, A., Layman,
A., Reichart, D., Venkatrao, M., Pello, F., &
Pirahesh, H. (1997). Data cube: A relational
aggregation operator generalizing group-by,
cross-tab, and sub-totals. Data Mining and
Knowledge Discovery, 1(1), pp. 29-53.
Henrich, A., & Morgenroth, K. (2003).
Supporting Collaborative Software Development
by Context-Aware Information Retrieval
Facilities. In Proceedings of the DEXA 2003
Workshop on Web Based Collaboration (WBC
2003), pp. 249-253.
Hu, B., Liu, H., He, J. & Du, X. (2008). FARS: A
multi-relational feature and relation selection
approach for efficient classification. In
Proceedings of the Advance Data Mining and
Application Conference (ADMA’08), vol. 1, pp.
73-86.
IBM. Business insights workbench. [Online].
Available:
http://domino.watson.ibm.com/comm/research.nsf
/pages/r.servcomp.innovation2.html (visited on
24th of March, 2013).
Inmon, W. (2005). Building the data warehouse.
Ed: Wiley publishing.
Jensen, LJ., Saric, J., & Bork, P. (2006).
Literature mining for the biologist: from
information retrieval to biological discovery.
Nature Reviews Genetics, 7(2), pp. 119-129.
Kaufmann, E., Bernstein, A., & Zumstein, R.
(2006). Querix: A natural language interface to
query ontologies based on clarification dialogs. In
5th International Semantic Web Conference
(ISWC 2006), pp. 980-981.
Kearsey, MJ. (1998). The principles of QTL
analysis (a minimal mathematics approach).
Journal of Experimental Botany, 49(327), pp.
1619-1623.
Kerui, C., Wanli, Z., Fengling, H., Yongheng, C.,
& Ying, W. (2011). Data Extraction and
Annotation Based on Domain-specific Ontology
Evolution for Deep Web. Computer Science and
Information Systems, 8(3), pp. 673-692.
Kimball, R., & Ross, M. (2002). The data
warehouse toolkit: the complete guide to
dimensional modelling, Ed:Wiley publishing.

ACC
EPTE
D M
ANU
SCR
IPT
ACCEPTED MANUSCRIPT
Krallinger, M., & Valencia, A. (2005). Text-
mining and information-retrieval services for
molecular biology. Genome Biology, 6:224,
doi:10.1186/gb-2005-6-7-224.
LaBrie, R.C., & St. Louis, R.D. (2005). Dynamic
hierarchies for business intelligence Information
retrieval. International Journal of Internet and
Enterprise Management 2005, 3(1), pp. 3-23.
Latta, RG., & Gardner, KM. (2009). Natural
selection on pleiotropic quantitative trait loci
affecting a life-history trade-off in Avena Barbata.
Evolution, 63(8), pp. 2153-2163.
Lim, N.R.T., Saint-Dizier, P. Gay, B., & Roxas,
R.E. (2009). A preliminary study of comparative
and evaluative questions for business intelligence.
International Symposium on Natural Language
Processing, SNLP’09, pp. 35-41.
Llopis, M., & Ferrández, A. (2012). How to make
a Natural Language Interface to Query Databases
accessible to everyone: An example. Computer
Standards & Interfaces, doi:
10.1016/j.csi.2012.09.005.
Llopis, F., Vicedo, JL, & Ferrández, A., (2003).
IR-n System at CLEF-2002. LNCS 2785, pp. 291-
300.
Lopez, V., Pasin, M., & Motta, E. (2005).
Aqualog: An ontology-portable question
answering system for the semantic web. The
Semantic Web: Research and Applications,
pp.135-166.
Losiewicz, P., Oard, D., & Kostoff, R. (2000).
Textual Data Mining to Support Science and
Technology Management. Journal of Intelligent
Information Systems, 15(2), pp. 99-119.
Luján-Mora, S., Trujillo, J., & Song, I. (2006). A
UML profile for multidimensional modeling in
data warehouses. Data and Knowledge
Engineering, 59 (3), pp. 725-769.
Lynch, M., & Walsh, B. (1998). Genetics and
Analysis of Quantitative Traits, Sunderland, MA:
Sinauer Associates, Inc.
Maté, A., Llorens, H., & de Gregorio, E. (2012).
An Integrated Multidimensional Modeling
Approach to Access Big Data in Business
Intelligence Platforms. ER'12 Proceedings of the
2012 international conference on Advances in
Conceptual Modeling, pp.111-120.
Maté, A., Trujillo, J., & Mylopoulos, J. (2012).
Conceptualizing and specifying key performance
indicators in business strategy models. 31st
International Conference on Conceptual Modeling
(ER), pp. 282-291.
Matos, S., Arrais, JP., Maia-Rodrigues, J., &
Oliveira, JL. (2010). Concept-based query
expansion for retrieving gene related publications
from MEDLINE. BMC Bioinformatics, 11:212,
doi:10.1186/1471-2105-11-212.
Mazón, J.N., & Trujillo, J. (2008). An MDA
approach for the development of data warehouses.
Decision Support Systems, 45(1), pp. 41-58.
Mazón, J.N., Trujillo, J., & Lechtenbörger, J.
(2007). Reconciling requirement-driven data
warehouses with data sources via
multidimensional normal forms. Data and
Knowledge Engineering, 63(3), pp. 725-751.
McCabe, M. C., Lee, J., Chowdhury, A.,
Grossman, D., & Frieder, O. (2000). On the
design and evaluation of a multi-dimensional
approach to information retrieval. In Proceedings
of the 23rd annual international ACM SIGIR
conference on Research and development in
information retrieval, pp. 363-365.
Milc, J., Sala, A., Bergamaschi, S., & Pecchioni,
N. (2011). A genotypic and phenotypic
information source for marker-assisted selection
of cereals: the CEREALAB database. Database,
2011.
Miles, C. & Wayne, M. (2008). Quantitative Trait
Locus (QTL) analysis. Nature Education,
1(1):208.
Miller, L., Honavar, V., & Barta, TA. (1997).
Warehousing Structured and Unstructured Data
for Data Mining. In Proceedings of the ASIST
Annual Meeting. Vol. 34, pp. 215-224.
Moorad, JA., & Promislow, DEL. (2009). What
can genetic variation tell us about the evolution of
senescence? Proceedings the Royal Society B,
276(1665), pp. 2271-2278.
Orr, HA. (2000). Adaptation and the cost of
complexity. Evolution 54(1), pp. 13-20.

ACC
EPTE
D M
ANU
SCR
IPT
ACCEPTED MANUSCRIPT
Pajović, SB. (2007). Polygenic and multifactorial
disorders. Genetika, 39(2), pp. 283-290.
Patel-Schneider, PF., Hayes, P., & Horrocks, I.
(2004). OWL Web Ontology Language Semantics
and Abstract Syntax. W3C Recommendation,
http://www.w3.org/TR/2004/REC-owl-semantics-
20040210/ (visited on 24th of March, 2013).
Pérez-Martínez, J.M. (2007). Contextualizing a
Data Warehouse with Documents. Ph. D. Thesis.
Pérez-Martínez, J.M., Berlanga, R., & Aramburu,
M.J. (2009). A relevance model for a data
warehouse contextualized with documents.
Information Processing Management, 45(3), pp.
356-367.
Pérez-Martínez, J.M., Berlanga, R., Aramburu,
M.J., & Pedersen, T.B. (2008a). Contextualizing
data warehouses with documents. Decision
Support Systems, 45(1), pp. 77-94.
Pérez-Martínez, J.M., Berlanga, R., Aramburu,
M.J., & Pedersen, T.B. (2008b). Integrating Data
Warehouses with Web Data: A Survey. IEEE
Transactions on Knowledge Data Engineering,
20(7), pp. 940-955.
Pharoah, PDP., Antoniou, A., Bobrow, M.,
Zimmern, RL., Easton, DF., & Ponder, BAJ.
(2002). Polygenic susceptibility to breast cancer
and implications for prevention. Nature Genetics,
31, pp. 33-36.
Priebe, T., & Pernul, G. (2003a). Towards
integrative enterprise knowledge portals. In
Proceedings of the 12th International Conference
on Information and Knowledge Management
(CIKM’03), pp. 216-223.
Priebe, T., & Pernul, G. (2003b). Ontology-based
Integration of OLAP and Information Retrieval.
In Proceedings of the 14th International
Workshop on Database and Expert Systems
Applications (DEXA'03), pp. 610-614.
PubMed. [Online]. Available:
http://www.ncbi.nlm.nih.gov/pubmed (visited on
24th of March, 2013).
QL2. Real-time web data solutions for better
business intelligence. [Online]. Available:
http://www.ql2.com/ (visited on 24th of March,
2013).
Qu, S., Wang, Q., Liu, K., & Zou, Y. (2007). Data
Warehouse Design for Chinese Intelligent
Question Answering System Based on Data
Mining. In Proceedings of the 2nd International
Conference on Innovative Computing,
Information and Control (ICICIC 2007), pp. 180-
183.
Rahm, E., & Bernstein, P.(2001). A survey of
approaches to automatic schema matching. The
VLDB Journal, 10(4), pp. 334-350.
Rieger, B., Kleber, A., & von Maur, E. (2000).
Metadatabased Integration of Qualitative and
Quantitative Information Resources Approaching
Knowledge Management. In Proceedings of the
8th European Conference of Information Systems,
pp. 372-378.
Roger, S., Vila, K., Ferrández, A., Pardiño, M.,
Gómez, J.M., Puchol-Blasco, M., & Peral, J.
(2009). Using AliQAn in Monolingual
QA@CLEF 2008. LNCS 5706, pp. 333-336.
Roussinov, D., & Robles-Flores, J.A. (2004).
Web Question Answering: Technology and
Business Applications. In Proceedings of the
Tenth Americas Conference on Information
Systems, 3(1), pp. 46-62.
Santoso, H., Haw, S., & Abdul-Mehdi, Z.T.
(2010). Ontology Extraction from Relational
Database: Concept Hierarchy as Background
Knowledge, Knowledge-Based Systems, 24(3),
pp. 457-464.
Stanojevic, M., & Vraneš, S. (2012).
Representation of Texts in Structured Form.
Computer Science and Information Systems, 9(1),
pp. 23-47.
Stearns, FW. (2010). One hundred years of
pleiotropy: a retrospective. Genetics, 186(3), pp.
767-773.
Trujillo, J., & Maté, A. (2012). Business
Intelligence 2.0: A General Overview. Lecture
Notes in Business Information Processing, 96(1),
pp. 98-116.
Wang, C., Xiong, M., Zhou, Q., & Yu, Y. (2007).
Panto: A portable natural language interface to
ontologies. In Proceedings of the 4th European
Semantic Web Conference, pp.473-487.
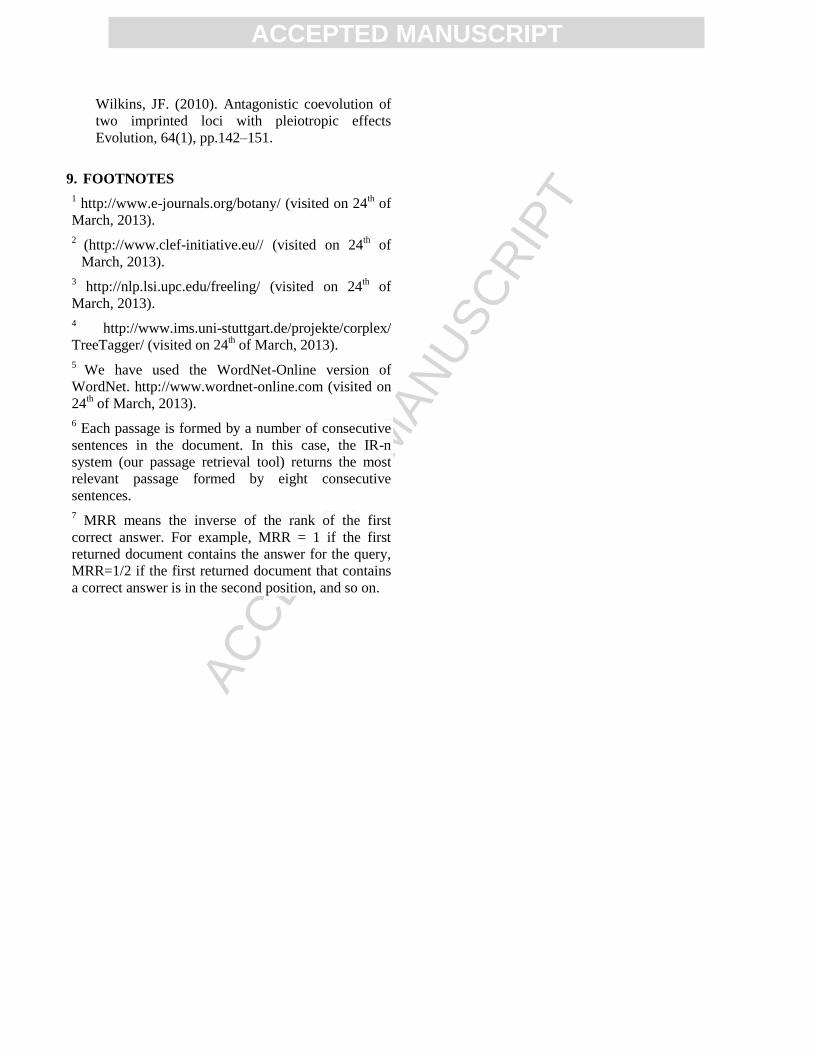
ACC
EPTE
D M
ANU
SCR
IPT
ACCEPTED MANUSCRIPT
Wilkins, JF. (2010). Antagonistic coevolution of
two imprinted loci with pleiotropic effects
Evolution, 64(1), pp.142–151.
9. FOOTNOTES
1 http://www.e-journals.org/botany/ (visited on 24
th of
March, 2013).
2 (http://www.clef-initiative.eu// (visited on 24
th of
March, 2013).
3 http://nlp.lsi.upc.edu/freeling/ (visited on 24
th of
March, 2013).
4 http://www.ims.uni-stuttgart.de/projekte/corplex/
TreeTagger/ (visited on 24th of March, 2013).
5 We have used the WordNet-Online version of
WordNet. http://www.wordnet-online.com (visited on
24th of March, 2013).
6 Each passage is formed by a number of consecutive
sentences in the document. In this case, the IR-n
system (our passage retrieval tool) returns the most
relevant passage formed by eight consecutive
sentences.
7 MRR means the inverse of the rank of the first
correct answer. For example, MRR = 1 if the first
returned document contains the answer for the query,
MRR=1/2 if the first returned document that contains
a correct answer is in the second position, and so on.

ACC
EPTE
D M
ANU
SCR
IPT
ACCEPTED MANUSCRIPT
“Enrichment of the Phenotypic and
Genotypic Data Warehouse analysis
using Question Answering systems to
facilitate the decision making process in
cereal breeding programs.” (Submission
ECOINF-D-13-00131)
Bullet points
- Enterprise information is integrated with external
data from the web using Question Answering.
- Unstructured and structured data is combined
through Data Warehouse and Question Answering.
- Ontologies have been used to achieve the full
integration.
- The case scenario: a plant breeder enterprise
develops new programs with the advances in
Genetics.
- A dashboard is shown to the user: it integrates both
external and internal data.