ENR Market Outlook September 2018 Executive Summary
15
September 2018 ENR Market Outlook Executive Summary: • As we progress into September, statistically the worst month of the year for stocks, markets are increasingly on edge amid emerging market currency turmoil, a sell-off in social media stocks and fresh tariffs aimed at China; • Year-to-date, the MSCI World Index has rallied 1.86% while the S&P 500 Index has gained 7.6%. The MSCI EAFE Index is down 6.77% and the MSCI Emerging Markets Index has officially touched bear market territory, shedding 12.71% in 2018 but off 21% from its January all-time high; • The MSCI World Index posted another gain in August, just 2% short of its late January all-time high. The global benchmark for major market equities continues to rally, courtesy of its 62% exposure to U.S. equities while international stocks falter. Foreign major market stocks, as measured by the MSCI EAFE Index, declined more than 2% and the MSCI Emerging Markets Index logged a 2.9% loss; • The U.S. dominates world stock markets in 2018; along with Norway and India, it holds the distinction of hitting all-time highs this summer while most international markets decline in both USD and local currency terms; • In August, the United States officially recorded its longest equity bull market in history, surpassing the 1990s. Since its March 9, 2009 bear market low, the S&P 500 Index has gained a cumulative 352%, including dividends; • Since late August, technology leadership has begun to wane as a shift among investors favors defensive sectors, including utilities, consumer staples, healthcare and discretionary consumer companies. Still, technology stocks in the S&P 500 Index remain up 18% in 2018, by far the best-performing group in the broader market. Through August 22, Amazon.com, Netflix, Microsoft and Apple are responsible for 40% of the broader market’s advance; • The crisis in emerging markets (EM) is spreading contagion across the asset class as several countries struggle under the weight of high interest rates, rising inflation, a surging USD and plunging currencies. Triggered by Argentina earlier this spring, Turkish, Brazilian, South African and Indonesian currencies all face selling pressure. Like the 1997-1998 Asian financial crisis, there’s a real threat of spillover to the major markets, including the United States. The odds of some sort of major financial dislocation occurring continues to rise, especially if the Fed is determined to tighten monetary policy further this fall; • The rise in the American dollar since April has exacerbated troubles in several EM economies where notional levels of dollar-denominated debt has more than doubled to $3.7 trillion dollars over the past ten years, according to the Bank for International Settlements; • By the end of September, the world’s two largest economies, the United States and China, are likely to have imposed punitive tariffs on manufactured goods and commodities worth $360 billion dollars or the equivalent of 60% of their bilateral trade. Thus far, Chinese stocks have suffered the most from the trade fallout, shedding almost 20% this year; • The Trump administration continues to work with Canada to negotiate a bilateral trade deal, extending a recent deadline. In August, the United States concluded a trade agreement with Mexico. Though still requiring Congressional approval, the Trump administration is proposing its passage without Canada’s inclusion. The odds of a successful conclusion to the American-Canadian trade stand-off is high, considering both sides have much to lose in the event of a collapse. In the United States, 33 out of 50 states count Canada as their largest trading partner. And without a trade agreement, Canada would probably slip into recession;
Transcript of ENR Market Outlook September 2018 Executive Summary
September 2018 ENR Market Outlook
Executive Summary:
• As we progress into September, statistically the worst month of the year for stocks, markets are increasingly on
edge amid emerging market currency turmoil, a sell-off in social media stocks and fresh tariffs aimed at China;
• Year-to-date, the MSCI World Index has rallied 1.86% while the S&P 500 Index has gained 7.6%. The MSCI EAFE
Index is down 6.77% and the MSCI Emerging Markets Index has officially touched bear market territory, shedding
12.71% in 2018 but off 21% from its January all-time high;
• The MSCI World Index posted another gain in August, just 2% short of its late January all-time high. The global
benchmark for major market equities continues to rally, courtesy of its 62% exposure to U.S. equities while
international stocks falter. Foreign major market stocks, as measured by the MSCI EAFE Index, declined more than
2% and the MSCI Emerging Markets Index logged a 2.9% loss;
• The U.S. dominates world stock markets in 2018; along with Norway and India, it holds the distinction of hitting
all-time highs this summer while most international markets decline in both USD and local currency terms;
• In August, the United States officially recorded its longest equity bull market in history, surpassing the 1990s. Since
its March 9, 2009 bear market low, the S&P 500 Index has gained a cumulative 352%, including dividends;
• Since late August, technology leadership has begun to wane as a shift among investors favors defensive sectors,
including utilities, consumer staples, healthcare and discretionary consumer companies. Still, technology stocks in
the S&P 500 Index remain up 18% in 2018, by far the best-performing group in the broader market. Through
August 22, Amazon.com, Netflix, Microsoft and Apple are responsible for 40% of the broader market’s advance;
• The crisis in emerging markets (EM) is spreading contagion across the asset class as several countries struggle
under the weight of high interest rates, rising inflation, a surging USD and plunging currencies. Triggered by
Argentina earlier this spring, Turkish, Brazilian, South African and Indonesian currencies all face selling pressure.
Like the 1997-1998 Asian financial crisis, there’s a real threat of spillover to the major markets, including the
United States. The odds of some sort of major financial dislocation occurring continues to rise, especially if the
Fed is determined to tighten monetary policy further this fall;
• The rise in the American dollar since April has exacerbated troubles in several EM economies where notional levels
of dollar-denominated debt has more than doubled to $3.7 trillion dollars over the past ten years, according to
the Bank for International Settlements;
• By the end of September, the world’s two largest economies, the United States and China, are likely to have
imposed punitive tariffs on manufactured goods and commodities worth $360 billion dollars or the equivalent of
60% of their bilateral trade. Thus far, Chinese stocks have suffered the most from the trade fallout, shedding
almost 20% this year;
• The Trump administration continues to work with Canada to negotiate a bilateral trade deal, extending a recent
deadline. In August, the United States concluded a trade agreement with Mexico. Though still requiring
Congressional approval, the Trump administration is proposing its passage without Canada’s inclusion. The odds
of a successful conclusion to the American-Canadian trade stand-off is high, considering both sides have much to
lose in the event of a collapse. In the United States, 33 out of 50 states count Canada as their largest trading
partner. And without a trade agreement, Canada would probably slip into recession;

ENR Asset Management Inc. • 1 Westmount Square, Suite 1400 • Westmount, Quebec • H3Z 2P9 Canada Phone 1-514-989-8027 • Fax 1-514-989-7060 • Toll free 1-877-989-8027 • www.enrassetmanagement.com
2 ENR Market Outlook
• Despite strong consumer spending, the lowest unemployment rate since the late 1960s and healthy
manufacturing data recently, the housing market is sending alarm signals in the United States. Sales of previously
owned homes continued their longest downward slide in five years in July as rising prices and higher mortgage
rates kept more potential buyers out of the market. The July drop marked the fourth straight month of declines.
Housing is responsible for approximately 10-12% of GDP;
• Later in September, Germany’s largest banks, Deutsche Bank AG and Commerzbank AG, will drop out of the
widely followed Euro Stoxx 50 Index due to the collapse of shareholder values. Deutsche Bank has crashed 83%
over the past decade and Commerzbank has tanked 95%; their combined stock-market capitalization values are
just $35 billion dollars, or roughly 10% of J.P. Morgan Chase’s stock-market cap of $333 billion dollars. The Stoxx
600 Banks Index is still down more than 50% since the start of 2008 as investors suffer through the tribulations of
shareholder destruction, despite a series of capital raising or new equity issuance. According to the ECB and The
Financial Times, there remains €880 billion ($1 trillion) in non-performing loans held by European banks;
• U.S. consumer spending remains buoyant. The retail industry’s late-summer rally is spreading beyond
Amazon.com. In August, Target Corp. reported its best quarter since 2005 with comparable sales rising 6.5% and
revenue climbing 6.9%. Wal-Mart Stores also reported a strong quarter recently, making inroads in online sales;
• Bitcoin, all the rage late in 2017, has now crashed a cumulative 68% since peaking at $20,000 before Christmas.
Bitcoin remains under pressure this summer following an announcement by Goldman Sachs to ditch a planned
crypto currency trading desk;
• The bull market, now in its ninth year, ranks as the oldest in history. But with duration comes risk. The percentage
of U.S. household financial assets (stocks, bonds and cash) that is allocated to equities hit 56.3% this summer,
more than ten percentage points higher than its historical average of 45.3%, according to Ned Davis Research and
the Fed. At the top of the bull market in October 2007, it stood at 56.8%;
• Our message from last month and indeed the last several months is unchanged: Despite expensive valuations for
most U.S. stocks and an ageing bull market, risk assets have not corrected since early February. The last meaningful
correction greater than 15% occurred way back in the fall of 2011. Investor sentiment remains exuberant; the
mania in technology stocks is reminiscent of the late 1990s and interest rates are still rising, threatening equities.
The crash of several emerging markets poses new threats to the bull market, but beyond a severe correction,
won’t trigger a secular bear market in the event of contagion spreading to major markets. The sharp downturn in
lumber prices and the slump in housing sales are red flags for the economy. Risk is rising;
• Our preference to overweight U.S. stocks over foreign equities remains unchanged heading into September.
Overseas volatility might ultimately spread to U.S. markets but should serve much less downside due to corporate
tax cuts, massive shareholder buybacks and increased global purchases of U.S. Treasury’s and USDs amid market
mayhem abroad. Also, despite being vulnerable this month, stocks should recover heading into U.S. midterm
elections in November as seasonal strength commences;
• Small-caps are overvalued. If the dollar begins to decline, investors will benefit from owning U.S. blue-chip
multinationals;
• Investors should focus on value-based equities both in the United States and overseas as we edge closer to a peak
in operating margins. Value-based stocks are cheap. Most value indices in the United States and overseas trade at
about 1 times price-to-book value ratio compared to almost 3 times book for growth strategies;

ENR Asset Management Inc. • 1 Westmount Square, Suite 1400 • Westmount, Quebec • H3Z 2P9 Canada Phone 1-514-989-8027 • Fax 1-514-989-7060 • Toll free 1-877-989-8027 • www.enrassetmanagement.com
3 ENR Market Outlook
• Large-cap European pharmaceuticals trade at a big discount to U.S. majors based on relative P/E multiples, price-
to-book and dividends. They also offer potentially defensive exposure in a late-cycle economic environment.
Switzerland’s Novartis ADR (NYSE-NVS) and France’s Sanofi ADR (NYSE-SNY) provide excellent value at current
price levels;
• Growth portfolios should continue to own Japanese yen, long-term Treasury bonds and cash (T-bills) to help offset
rising equity risk premiums. The Swiss franc, after suffering a steep summer decline versus the dollar, has started
to recover and should be accumulated.
Global Equities
International Stocks Pummeled in 2018: The Best Values Now in Smart Beta Investing Rob Arnott is perhaps best known as the Father of Smart Beta. Many investors have already read about Jack Bogle, founder
and former chairman of Vanguard Group – the Grandfather of indexing. But Mr. Arnott, founder of Research Affiliates,
isn’t as widely followed in some circles. But for me, he’s far more insightful as an investor because of the great work he’s
done uncovering hidden myths about indexing and how to boost ETF returns using Smart Beta.
There’s no doubting that indexing beats active money-managers over almost every investment time frame. The argument
of low fees and low trading costs tied to portfolio turnover is compelling. I can’t argue. And in most years, I can’t beat the
market. BUT, active managers like us are paid to be exactly that – active. We try to protect capital, indexing doesn’t. And
depending on when you buy an index, you can easily suffer losses over the long-term, if you buy at a market peak. Also,
indexing is no panacea; though stocks have skyrocketed over the past decade because of massive central bank intervention
and earnings growth, there’s no guarantee central banks will come to the rescue again when the next recession or financial
crisis arrives.
Investors should pay an active manager to hedge portfolio risk. Unfortunately, most active managers don’t do this or don’t
know how to protect portfolio downside. This includes hedge funds, which really don’t hedge at all. Hedge funds are one
of the biggest rip-offs in the investment world, charging excessive fees, including incentive fees of 20%, giving the investor
poor liquidity and under extreme markets, can gate your money so you’re stuck in that Fund for months or years. They
leverage for sure, but most don’t hedge. The median hedge fund crashed almost 20% in the 2008 financial crisis as the
MSCI World Index collapsed 40%. That’s not successful hedging. Some great hedge funds trade today (e.g. David Tepper,
D.E. Shaw, Paul Tudor Jones, Renaissance) but for the most part, they stink. They can’t beat the market and can’t protect
your capital when the market sinks. In my eyes, most hedge funds will be relegated to the dinosaur eventually.
We do things differently, depending on which investment strategy you choose. Our managed-accounts in Europe declined
an average 4.9% after fees in 2008 and earned net profits of 3.6% in the fourth quarter of that year compared to a 22%
loss for the MSCI World Index. That’s because we hedge! In October 2008, our European private banking managed-
accounts gained an average 1% compared to a 19% crash for the MSCI World Index. So, although I won’t beat the market

ENR Asset Management Inc. • 1 Westmount Square, Suite 1400 • Westmount, Quebec • H3Z 2P9 Canada Phone 1-514-989-8027 • Fax 1-514-989-7060 • Toll free 1-877-989-8027 • www.enrassetmanagement.com
4 ENR Market Outlook
in bull market years, I promise to do my utmost to preserve your capital in an ugly market environment. Nobody, including
myself, can afford to lose 40% or 50% of his or her wealth in a bear market.
In my opinion, traditional money-managers or actively-managed mutual funds, don’t do enough to protect portfolios in a
down market. Some are closet index-huggers and others just have no idea how to offset risk. If you’re an active manager
charging 1% or more for fees, then you should be offering something outside of the traditional mutual fund or index fund
box; portfolio managers should learn more about hedging and how portfolio insurance is important, especially as we
progress into the longest bull market in history in late 2018.
Who says indexing is risk free? Who says the next bear market will be swift and see stocks recover quickly again? Where
is it written that stocks have to rise after central bank intervention? There are no guarantees in the market.
Let’s go back to Mr. Arnott. The Father of Smart Beta, an alternative style of indexing that invests based on factors other
than company size, has some important advice. His theory is that traditional market-capitalization-weighted indexes, like
the S&P 500 Index, load up on companies with the biggest recent price gains, leaving them vulnerable to asset bubbles.
‘Most index-fund managers are far more interested in reducing tracking error than in adding value, according to Arnott in
a June Wall Street Journal interview (see Words to the Wise for Index Funds, June 12, 2018). His report in June to clients
was entitled “Buy High and Sell Low with Index Funds!”
There’s no doubt in my mind that indexing today, particularly those strategies embracing a ‘growth’ formula will be
subjected to severe losses when this bull market ends. I also think U.S. stocks will fall the hardest, mainly technology and
other fast-growing companies trading at astronomical values only because they’ve dominated this bull market. But value
indexes are still cheap. Overseas, value investing is really a bargain following a dismal year in 2018.
It’s no secret that value-based equities in the United States and overseas have lagged their growth cousins since 2009. It’s
unusual for value to lag growth this long (see above chart). Based on the study findings from Bank of America/Merrill
ENR Asset Management Inc. • 1 Westmount Square, Suite 1400 • Westmount, Quebec • H3Z 2P9 Canada Phone 1-514-989-8027 • Fax 1-514-989-7060 • Toll free 1-877-989-8027 • www.enrassetmanagement.com
5 ENR Market Outlook
Lynch over a 90-year period, growth stocks returned an average of 12.6% annually since 1926. However, value stocks
generated an average return of 17% per year over the same timeframe. So why has value so badly trailed growth in this
cycle? Investors have embraced growth because of accelerated earnings and growing revenues in sectors of the market
that continue to lead the charge in this bull market: technology.
iShares Edge MSCI International Value Factor ETF
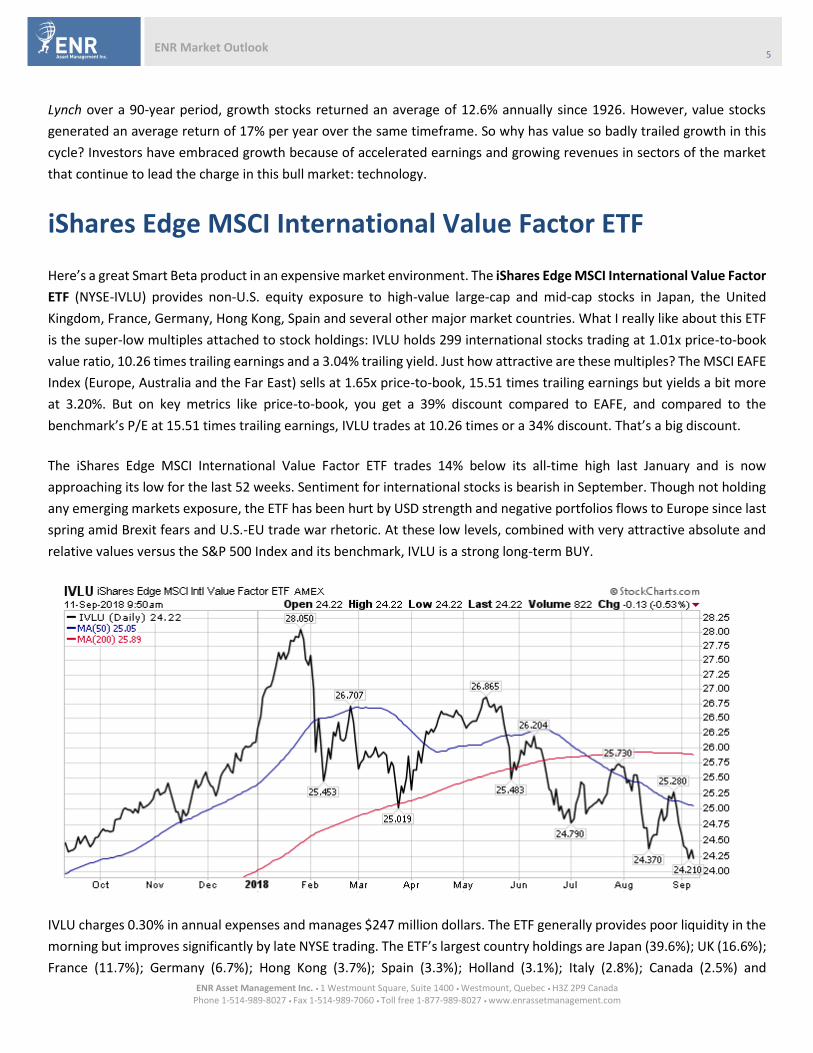
Here’s a great Smart Beta product in an expensive market environment. The iShares Edge MSCI International Value Factor
ETF (NYSE-IVLU) provides non-U.S. equity exposure to high-value large-cap and mid-cap stocks in Japan, the United
Kingdom, France, Germany, Hong Kong, Spain and several other major market countries. What I really like about this ETF
is the super-low multiples attached to stock holdings: IVLU holds 299 international stocks trading at 1.01x price-to-book
value ratio, 10.26 times trailing earnings and a 3.04% trailing yield. Just how attractive are these multiples? The MSCI EAFE
Index (Europe, Australia and the Far East) sells at 1.65x price-to-book, 15.51 times trailing earnings but yields a bit more
at 3.20%. But on key metrics like price-to-book, you get a 39% discount compared to EAFE, and compared to the
benchmark’s P/E at 15.51 times trailing earnings, IVLU trades at 10.26 times or a 34% discount. That’s a big discount.
The iShares Edge MSCI International Value Factor ETF trades 14% below its all-time high last January and is now
approaching its low for the last 52 weeks. Sentiment for international stocks is bearish in September. Though not holding
any emerging markets exposure, the ETF has been hurt by USD strength and negative portfolios flows to Europe since last
spring amid Brexit fears and U.S.-EU trade war rhetoric. At these low levels, combined with very attractive absolute and
relative values versus the S&P 500 Index and its benchmark, IVLU is a strong long-term BUY.
IVLU charges 0.30% in annual expenses and manages $247 million dollars. The ETF generally provides poor liquidity in the
morning but improves significantly by late NYSE trading. The ETF’s largest country holdings are Japan (39.6%); UK (16.6%);
France (11.7%); Germany (6.7%); Hong Kong (3.7%); Spain (3.3%); Holland (3.1%); Italy (2.8%); Canada (2.5%) and

ENR Asset Management Inc. • 1 Westmount Square, Suite 1400 • Westmount, Quebec • H3Z 2P9 Canada Phone 1-514-989-8027 • Fax 1-514-989-7060 • Toll free 1-877-989-8027 • www.enrassetmanagement.com
6 ENR Market Outlook
Switzerland (2.3%). I also like the heavy exposure to non-U.S. financials – heavily distressed – at a combined 21.6%
followed by industrials at 13.8%, consumer discretionary 11.4%, consumer staples 10.7% and healthcare at 10.5%. The
top five holdings include Sanofi, Toyota Motor Co., Shire PLC, Total and Dehaize. BUY the iShares Edge MSCI International
Value Factor ETF (NYSE-IVLU) at market up to $25.50. Place a 20% stop-loss on your entry price.
Apple Soars to New Highs
ENR Market Outlook Portfolio The ENR Market Outlook Portfolio logged mostly gains in August as world markets climbed higher led by the United
States. However, September is proving much tougher as emerging market contagion spreads and investment sentiment
is soured after a strong rally in the United States. Foreign stocks, despite offering terrific values, remain depressed. Only
Norway and India have followed New York to all-time highs recently. The rest of the world is languishing.
From a universe of 20 open positions as of September 7, nine are international. This month, however, we’re selling the
iShares China Large-Cap ETF (NYSE-FXI) at a small loss and the Global X MSCI Greece ETF (NYSE-GREK). Both markets are
among many abroad that are trading lower on poor sentiment and a strong dollar. Sell them.
Since the bear market low in 2009, international stocks have badly trailed U.S. equities. The divergence continues to widen
in 2018 as global money-flows flood U.S. markets seeking gains dominated by technology stocks. The S&P 500 Index now
holds 26% of its constituent benchmark in tech stocks – the largest weighting since 1999. Foreign markets, lacking this
significant representation in tech stocks, have lagged American benchmarks.
ENR Asset Management Inc. • 1 Westmount Square, Suite 1400 • Westmount, Quebec • H3Z 2P9 Canada Phone 1-514-989-8027 • Fax 1-514-989-7060 • Toll free 1-877-989-8027 • www.enrassetmanagement.com
7 ENR Market Outlook
We recommended avoiding emerging markets heading into 2018 and that advice remains the same now. This has been a
dreadful year for emerging markets. Investors have barely made money in this asset class over the past 20 years, adjusted
for inflation, and even in nominal terms. Though I don’t advocate trading a portfolio, knowing when to be in and out of
emerging markets has been critical to delivering positive returns since the early 1990s or at the very least, avoiding
significant capital losses.
EM equities have declined 11% this year. Contagion continues to threaten this asset class with a toxic combination of
tighter U.S. monetary policy, a strong dollar and trade conflicts hurting the sector as investors flee in droves. China is the
largest emerging market usually accounting for at least 31% to 35% of global benchmarks for stocks. A bear market in both
major bourses in Shanghai and Shenzhen has already chipped off almost 20% of equity values this year, triggered in part
by U.S. import tariffs and a slowing Chinese economy.
Problems in China pale compared to the carnage in Argentina and Turkey. For the second time since 2001, Argentina has
requested International Monetary Fund (IMF) assistance as the peso crashes 50% against the USD in 2018 and interest
rates top 60%. Turkey is also a mess, though its external trade balance isn’t chronic, unlike Argentina. Turkey is home to
growing GDP and a robust consumer. The problem lies in dollar-based financing for many companies and the government,
made much more expensive since June amid a dollar resurgence. In August, Turkish inflation hit an annualized 17.9%. And
Indonesia is now in the firing line after the rupiah weakened to a three-year low on August 31, just above its lowest levels
since the 1998 Asian financial crisis. Weak trade data and external debt levels compared to its trading partners has tilted
the rupiah to losses. A strengthening American dollar has raised concerns over developing countries’ ability to pay off their
dollar-denominated debt.
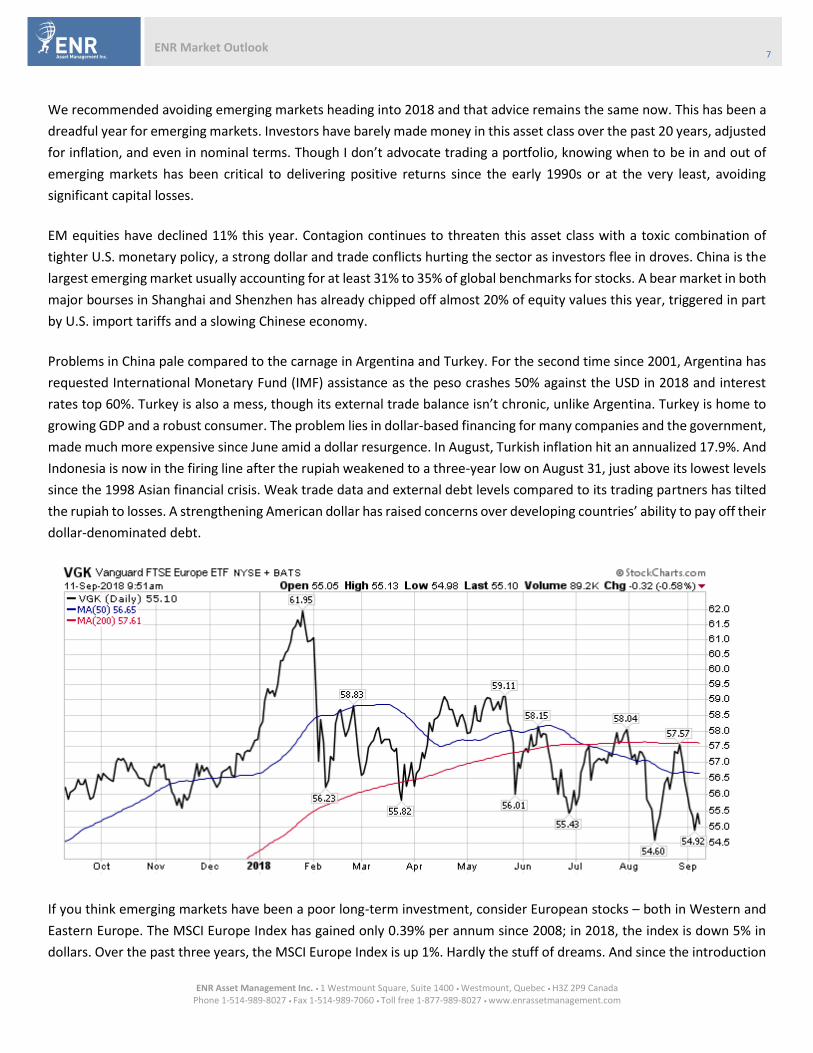
If you think emerging markets have been a poor long-term investment, consider European stocks – both in Western and
Eastern Europe. The MSCI Europe Index has gained only 0.39% per annum since 2008; in 2018, the index is down 5% in
dollars. Over the past three years, the MSCI Europe Index is up 1%. Hardly the stuff of dreams. And since the introduction

ENR Asset Management Inc. • 1 Westmount Square, Suite 1400 • Westmount, Quebec • H3Z 2P9 Canada Phone 1-514-989-8027 • Fax 1-514-989-7060 • Toll free 1-877-989-8027 • www.enrassetmanagement.com
8 ENR Market Outlook
of the EUR in 1999, the FTSE-Eurofirst 300 Index has trailed the S&P 500 Index by 49% -- the worst relative performance
on record.
The faster-growing Eastern European EMs are growing much faster than their Western peers. Poland has led the way with
the strongest GDP over the past decade followed by the Czech Republic and Romania. Yet the MSCI Eastern Europe Index
has shed 7% this year and has declined 5.4% per year since 2008. Returns in local currency haven’t been that much better.
Meanwhile, nerves are tense in Europe ahead of Brexit in March 2019 and the Italian government’s new budget
announcement this fall. The yield gap between Italian and German debt reached a five-year high in August, a bearish
development. Yields on 10-year Italian bonds have climbed above 3% to their highest levels since 2014. Fund flows into
Europe have been negative for 25 straight weeks, according to EPFR Global.
The United States ranks as one of the top-performing markets in the world since 2009. Not too many markets come close.
We suspect, at some point, international stocks will enjoy a long period of outperformance. For now, it’s all USA.
Midterm Elections Bullish for S&P 500
Despite our ongoing concern over expensive valuations, a slowing housing market, rising interest rates and a thinning U.S.
yield-curve, stocks are approaching seasonal strength once September (the worst month of the stock market calendar)
and October have passed. Combined with U.S. midterm elections in November, stocks might be poised for another blast
higher.
According to research from UBS Group, between August and March of the last 17 midterm elections since 1950, the S&P
500 Index rallied 14.5% on average. In non-election years, returns during this same window averaged 6%. Stocks tend to
pull back 1.4% from the end of August

ENR Asset Management Inc. • 1 Westmount Square, Suite 1400 • Westmount, Quebec • H3Z 2P9 Canada Phone 1-514-989-8027 • Fax 1-514-989-7060 • Toll free 1-877-989-8027 • www.enrassetmanagement.com
9 ENR Market Outlook
Our best performers over the past month are Apple Inc. (NASDAQ-AAPL), US Global JETS ETF (NYSE-JETS) and Huntington
Ingalls Industries (NYSE-HII). Apple has been on ‘fire,’ up 9% since our last update. JETS and HII are also both up over 5%
over the same period with most of our other holdings in the United States either up slightly or flat. Overseas, weakness
pervades with Dollarama (Toronto-DOL), Diageo ADR (NYSE-DEO) and Nestlé (Zurich-NESN) all pulling back.
This month, we’re going long high value overseas by means of the iShares Edge MSCI International Value Factor ETF
(NYSE-IVLU). Also, Flughafen Wien AG (Vienna-FLU) and US Global Jets ETF remain a BUY as we focus on airport services
and a recovery in U.S. airline stocks. The PowerShares Buyback Achievers (NASDAQ-PKW) remains in the ‘buy zone’ and
provides a great vehicle to ride historically market-beating returns in share buyback stocks. In Toronto, Canada’s largest
telecom and media concern, BCE Inc. (Toronto-BCE) trades at a 52-week low and yielding 5.68%.
Market Outlook Stock Portfolio:
Security Listed Symbol Entry Price
Date Current Yield
Current Price
Gain/ Loss
Advice
iShares Edge MSCI Intl Value Factor
NYSE IVLU $24.34 Sep 10/18 2.70% $24.34 New BUY
Flughafen Wien AG Vienna FLU € 32.00 Aug 7/18 2.00% € 34.05 6.52% BUY
Vanguard Mid-Cap Value ETF
NYSE VOE $110.74 Jul 5/18 1.85% $114.18 3.11% BUY
US Global Jets ETF NYSE JETS $30.67 Jun 12/18 0.44% $32.07 4.56% BUY
PowerShares Buyback Achievers
NASDAQ PKW $59.30 Mar 6/18 1.39% $60.67 3.66% BUY
iShares Russell Top 200 Value Index
NYSE IWX $52.46 Jan 2/18 2.30% $53.60 3.31% BUY
BCE, Inc.⁴ TSE BCE CAD 57.97 Mar 8/17 5.70% CAD 52.93 1.44% BUY
iShares China Large-Cap ETF
NYSE FXI $46.40 May 7/18 2.96% $40.53 -11.35% SELL
Global X MSCI Greece ETF
NYSE GREK $9.41 Nov 2/17 2.66% $8.48 -9.88% SELL
Verizon Communications
NYSE VZ $47.93 Apr 5/18 4.41% $54.11 14.12% HOLD
BAE Systems plc OTC BAESY $30.25 Dec 4/17 2.89% $32.54 9.97% HOLD
Invesco KBW Regional Banking ETF
NASDAQ KBWR $53.35 Jun 28/17 1.68% $59.51 12.69% HOLD
Huntington Ingalls Industries⁵
NYSE HII $193.55 May 30/17 1.16% $248.16 30.01% HOLD
PayPal Holdings NASDAQ PYPL $40.10 Jan 3/17 0.00% $89.14 122.29% HOLD
Pfizer Inc.³ NYSE PFE $32.92 Jan 3/17 3.58% $42.68 36.63% HOLD
Nestlé SA² VTX NESN CHF 65.15 Dec 7/16 2.89% CHF 81.28 30.10% HOLD
Diageo ADR NYSE DEO $113.71 Jul 4/16 3.07% $139.95 30.73% HOLD
Apple Inc¹ NASDAQ AAPL $92.79 May 9/16 1.32% $217.29 140.31% HOLD

ENR Asset Management Inc. • 1 Westmount Square, Suite 1400 • Westmount, Quebec • H3Z 2P9 Canada Phone 1-514-989-8027 • Fax 1-514-989-7060 • Toll free 1-877-989-8027 • www.enrassetmanagement.com
10 ENR Market Outlook
General Dynamics NYSE GD $131.37 Mar 31/16 1.91% $195.83 55.36% HOLD
Dollarama Inc TSE DOL CAD 23.87 Feb 12/16 0.32% CAD 50.20 122.88% HOLD
Disclaimer: The ENR Global Contrarian Portfolio owns Invesco KBW Regional Banking ETF, Nestlé and Apple Inc. ENR Medium Risk Portfolio owns Apple Inc., iShares Edge MSCI International Value Factor, and Pfizer. ENR Aggressive Growth Portfolio owns Invesco KBW Regional Banking ETF, Apple Inc. and PayPal Holdings.
Fixed-Income
Why the BoJ Holds Key to Treasury Bonds An excellent editorial in The Financial Times (August 8, ‘Why Japan is the Unexpected Threat to Financial Stability’) by John
Plender makes a strong argument for a liquidity crisis once the European Central Bank (ECB) and the Bank of Japan finally
conclude asset purchases or quantitative easing. According to Plender, the high real interest rates still available on U.S.
Treasury securities remains a huge draw to Japanese institutional investors. Benchmark ten-year Japanese government
bonds yield just 0.08%, ‘bread crumbs’ compared to the juicy yield available on U.S. ten-year T-bonds, now around 3%.
Interesting how Japan’s stock market and real estate collapse starting in 1990 was mostly an insular event; Japanese savers
have historically helped fund the Japanese government’s borrowing by virtue of a significant savings rate. ‘With the growth
of Japan’s capital exports and the Japanese banks’ shift into foreign markets, the country has become a factor not only in
U.S. and European monetary policy but a potential threat to financial stability’ says Plender. Japanese banks and other
institutions like Japan Post Bank, the largest depositor of client funds on the planet, have made big investments into non-
Japanese markets. Between 2007 and the end of March 2018, its holdings of Japanese government bonds declined from
88% of its overall portfolio to just over 30%. Other institutions have followed a similar course. According to Plender: ‘From
a U.S. perspective, the key point is that the pattern of Treasury yields is heavily distorted. When the great central banking
experiments in Europe and Japan come to an end, investors in U.S. Treasuries will surely be burnt.’

ENR Asset Management Inc. • 1 Westmount Square, Suite 1400 • Westmount, Quebec • H3Z 2P9 Canada Phone 1-514-989-8027 • Fax 1-514-989-7060 • Toll free 1-877-989-8027 • www.enrassetmanagement.com
11 ENR Market Outlook
Investors and speculators have been calling an end to the bond market for several years, but to no avail. Though I would
argue the bond bull market ended in the summer of 2016 (see UST 10-year yield chart on previous page) with the T-bond
landing to yield 1.37%, the market hasn’t really suffered a gut-wrenching decline similar to 1994. Even with the Federal
Reserve hiking interest rates since December 2015, the bond market hasn’t been crushed, just jolted. The much talked
about yield-curve refuses to give a clear signal that the economy is on a sound footing – even after strong 4.2% second
quarter GDP, the biggest jump in manufacturing activity in 14 years and the lowest unemployment rate since Nixon. Plus,
let’s not forget a robust American consumer.
It’ll be interesting to see what happens to bond prices once the Japanese and the Europeans start cutting back asset
purchases. And I wonder, will the Japanese really ever stop printing money? It’s hard to see interest rates really back up
after years of falling inflation, the destruction of credit in 2008 and the massive, uncontrollable accumulation of global
debt since the financial crisis. To me, it seems the forces of deflation and inflation continue to struggle with the former
holding an edge. T-bonds aren’t good value, to be sure. But they remain a place to hide if markets collide.
I urge every investor to watch the yield-curve. Every recession of the past sixty years has been preceded by an inverted
yield curve, according to research from the San Francisco Federal Reserve. Curve inversions have “correctly signaled all
nine recessions since 1955 and had only one false positive, in the mid-1960s, when an inversion was followed by an
economic slowdown but not an official recession,” according to the Fed. The gap between two-and-ten-year T-bonds in
the third quarter hit its narrowest in more than a decade.
Currently, the difference between both notes is just 21 basis points (0.21%) compared to 52 basis points on January 1st
and 78 basis points in February. If the curve keeps flattening while the Fed is still tightening, an accident will happen,
probably triggering a recession. The Federal Reserve has usually been responsible for tipping the economy into recession
almost every time it tightens liquidity since its creation in 1913.

ENR Asset Management Inc. • 1 Westmount Square, Suite 1400 • Westmount, Quebec • H3Z 2P9 Canada Phone 1-514-989-8027 • Fax 1-514-989-7060 • Toll free 1-877-989-8027 • www.enrassetmanagement.com
12 ENR Market Outlook
Market Outlook Bond Portfolio:
Security Listed Symbol Entry Price
Date Current Yield
Current Price
Gain/ Loss
Advice
iShares TIPS NYSE TIP $113.53 Dec 7/16 4.16% $111.26 2.09% HOLD
iShares Floating Rate
NYSE FLOT $50.69 Oct 5/16 2.67% $50.95 3.78% HOLD
Disclaimer: The ENR Low Risk Portfolio holds the iShares TIPS Bond Fund and the iShares Floating Rate Bond ETF. The ENR Medium Risk Portfolio holds the iShares Floating Rate Bond Fund.
Foreign Exchange
USD Slams most Foreign Currencies in 2018 Emerging markets (EM) continue to get slammed since last spring from growing contagion, including recession risk. South
Africa’s economy slipped into economic recession in the second quarter and Turkey, a much larger economy, is expected
to witness a contraction in GDP before the end of the year. The American dollars’ surge since April has effectively acted
as an additional monetary tightening for the emerging markets – further draining liquidity as the Federal Reserve hikes
interest rates. Risks are growing that more EM countries will enter recession before the year is over, possibly spreading
contagion to major economies in 2019.
A primary concern among investors is the dollar’s strength and how it will affect USD-denominated debt-financing and
debt-servicing for the most indebted EM corporations and governments.

ENR Asset Management Inc. • 1 Westmount Square, Suite 1400 • Westmount, Quebec • H3Z 2P9 Canada Phone 1-514-989-8027 • Fax 1-514-989-7060 • Toll free 1-877-989-8027 • www.enrassetmanagement.com
13 ENR Market Outlook
Foreign currency turmoil is severe: Argentina, Turkey, South Africa, Russia, India, Indonesia, Brazil, Uruguay and even Chile
– the benchmark model for economic stability in Latin America since the late 80s – have all suffered big double-digit
currency losses against the USD. And Venezuela, a basket-case economy in the midst of a migration crisis and
hyperinflation, has introduced a new currency to replace the bolivar.
The Indonesian rupiah weakened to a three-year low on August 31, taking it within a whisker of its lowest levels since the
1998 Asian financial crisis and prompting the central bank to boost intervention efforts in the bond and FX markets.
Even among major market currencies, the damage has been surprisingly severe. Sweden, one of the best-managed
economies in Europe, has seen the krona dive almost 11% this year. The EUR and the Swiss franc, however, have held up
relatively well vis-à-vis the USD in 2018; the EUR is down just 3.5% and the CHF is flat. But East European currencies have
been stung, including Hungary (-8.2%) and Poland (-7%). In the Indian sub-continent, the Indian rupee has declined almost
14% this year and the Pakistan rupee is off 11.4%. The rest of Asia is down across the board, except the Japanese yen, the
best-performing major currency in the world outside of the dollar, up 1.4% this year.
Until the Fed signals an end to tightening, we’d avoid most EM currencies and only dollar-cost-average among the best-
managed currencies, including the yen, CHF, NOK, SGD and gold. The dollar remains mighty strong at a time of growing
macroeconomic uncertainty. We’d view a successful conclusion to U.S.-Chinese trade wars and U.S.-Canadian trade talks
as a bullish development for world markets and bearish for the USD.
Strong USD Hits FX
USD Assault Continues, Spreads to Canada and Gold
The ENR Global Currency Sandwich, including gold, has declined 3.76% in 2018 and logged another loss of 0.21% since
our last update. Based on negative performance attribution, gold and the Canadian dollar are responsible for most of our
losses since the start of August.
2018 ENR Global Currency Sandwich (Equally-Weighted):
Objective: The ENR Global Currency Sandwich attempts to buy-and-hold currencies with the best upside potential against
the American dollar over the long-term, including gold.
• Gold Bullion (-8.67%)
• EUR (-3.5%)
• Canadian dollar (4.7%)
• Polish zloty (-7.0%)
• Swiss franc (-0.1%)
• Japanese yen (+1.4%)

ENR Asset Management Inc. • 1 Westmount Square, Suite 1400 • Westmount, Quebec • H3Z 2P9 Canada Phone 1-514-989-8027 • Fax 1-514-989-7060 • Toll free 1-877-989-8027 • www.enrassetmanagement.com
14 ENR Market Outlook
Commodities
Oil Stocks Crater; Copper Sends Bearish Signal
Since January 1st, spot copper prices have declined a cumulative 20% and now trading in bear market territory. The metal,
used to make pipes, wiring and electronics, has fallen 20% since hitting a multiyear peak earlier in June. Copper isn’t
threatened or targeted with tariffs, though over 50% of the red metal is consumed by China, making it especially sensitive
to any slowdown in the world’s second-largest economy. Also, a strong USD is hurting many commodities, priced in dollars.
Other raw materials are also struggling with some like soybeans in the thick of the U.S.-China trade war and especially
hard hit since this summer following fresh tariffs. Aluminum and steel have also been targeted since last spring.
Oil prices on both sides of the Atlantic have also declined sharply since June. West Texas Intermediate crude has corrected
more than 7% since June and has triggered broad-based selling across the stock market space, hitting energy firms.
Unfortunately, we were stopped-out of Baytex Energy (Toronto-BTE) last week following a new low for Canadian oil-sand
(western Canadian select) oil in the mid C$30s. Sell BTE.
However, we remain bullish on Pioneer Natural Resources Co. (NYSE-PXD) and oil, in general. We view the current
pullback in WTIC as a buying opportunity for PXD, SLB and GSG or the iShares S&P GSCI Commodity Index. The global
economy is certainly under stress as we approach the fourth quarter, hurting commodities. Currency turmoil adds to
growth fears as more nations possibly slip into recession in 2019. However, ahead of U.S. mid-term elections in November,
we think China and the United States will strike a trade deal to avert a greater showdown. China at this time can ill-afford
to suffer another drop in economic output, threatening President Xi’s power and economic agenda so soon after his self-
declared ‘term for life’ presidency.

ENR Asset Management Inc. • 1 Westmount Square, Suite 1400 • Westmount, Quebec • H3Z 2P9 Canada Phone 1-514-989-8027 • Fax 1-514-989-7060 • Toll free 1-877-989-8027 • www.enrassetmanagement.com
15 ENR Market Outlook
Market Outlook Commodity Portfolio:
Security Listed Symbol Entry Price
Date Current Yield
Current Price
Gain/ Loss
Advice
iShares S&P GSCI Commodity Trust
NYSE GSG $16.34 Jan 2/18 0.00% $17.22 5.39% BUY
Baytex Energy⁷ TSE BTE CAD 4.15 Aug 7/18 0.00% CAD 3.53 -15.92% SELL
Pioneer Natural Resources Co.⁶
NYSE PXD $170.17 Mar 8/18 0.20% $162.98 -4.13% HOLD
Newmont Mining NYSE NEM $17.99 Dec 31/15 1.86% $29.88 69.73% HOLD
Schlumberger NYSE SLB $69.75 Dec 31/15 3.30% $60.49 -5.39% HOLD
Shareholder Disclaimer:
1. ENR or its employees or its access persons own shares of Apple Inc. 2. ENR or its employees or its access persons own shares of Nestlé
3. ENR or its employees or its access persons own shares of Pfizer Inc.
4. ENR or its employees or its access persons own shares of BCE Inc.
5. ENR or its employees or its access persons own shares of Huntington Ingalls Industries
6. ENR or its employees or its access persons own shares of Pioneer Natural Resources Co.
Eric N Roseman September 11, 2018 Montréal, Canada