Enquête campus II
82
The 2011 EPFL Campus Survey - 1- Campus 2011 P. Dillenbourg – CRAFT / VPAA Version 25.04.2012
-
Upload
albertine-kolendowska -
Category
Documents
-
view
214 -
download
0
description
enquête de l'EPFL sur la vie, les études à l'EPFL
Transcript of Enquête campus II

The 2011 EPFL Campus Survey
- 1-
Campus 2011
P. Dillenbourg – CRAFT / VPAA
Version 25.04.2012

The 2011 EPFL Campus Survey
- 2-
Summary 1. The respondents appreciate very much EPFL education. The ratio of unsatisfied respondents is below 3%
in all sections. Their satisfaction is significantly higher than in 2004. It does not mean that everything is perfect but rather that our students tend to believe that, despite the various problems described hereafter, education is globally very good at EPFL.
Curricula
2. The criticisms of curricula are surprisingly more frequent at the master level. Students would like more consistency between courses and closer links to the professional world.
3. About 20% of bachelor students, including second and third year students, are not certain that they have chosen the right section, or would have preferred choosing their section after the first year. This supports the idea of facilitating section moves after the 1st year.
4. How much maths and physics in the 1st year? 2/3 are satisfied with the current situation while 1/3 ask for more section specific courses. Among the few who responded ‘more maths/physics’, half of them do or did hesitate about choosing their section.
5. Only one third (31%) of the respondent approves the idea of a common exam in maths and physics. 6. Do they find internships useful? Yes, for 94% of those who have an opinion. 7. Do they find SHS courses valuable? Only 51% answer ‘yes’, less than in 2004 . 8. In some sections, 75% of those who joined EPFL at the master level intend to do a PhD. These intentions
not confirmed by their actual choices at the end of the master.
Teaching & Learning
9. Students appreciate the labs (‘travaux pratiques’) but, in some sections, more than half of them consider there are not enough of them ( Discovery Bridge).
10. Respondents declare a workload of 52 hours/week, higher than in 2004. 11. Language problems obstruct the understanding of 1/3 of respondents. They do less question their own
skills than their teachers’ skills. Asian students report more difficulties. 12. Respondents massively (88%) consider that the ‘tutorat’ helps them to understand the exercises (88%)
and that it prompts them to go to the exercises sessions (80%). Students from 2nd and 3rd year of bachelor ask for more teaching assistants. The tutors / teaching assistants consider their role as a positive experience (95%) and that it helped them to better understand the domain (87%).
13. Do they appreciate the teaching evaluation system? Yes, only 1% of the respondents dislike it. 14. The students are quite critical about medium size (> 50 seats) lecture rooms and theaters.
Life & Campus
15. “Victime de son succès”: Students appreciate the RLC but they massively complain that there is not enough working space in the Rolex Learning Center and on the campus.
16. The ‘guichet aux étudiants’, created after criticisms about SAC expressed in the 2004 survey, is now highly appreciated.
17. Printing is the main IT problem: students ask for more printers, which work, with higher quotas. They would like both more desktops in computer labs and more services for their laptops. The capacity of computer labs has not been adapted to the growth of the student population.
18. Only half of the respondents consider that AGEPOLY represent them well. 19. Less than half of the respondents know their ‘conseiller d’études’. 20. The events organized by EPFL to attract students (open doors, fairs, …) have an impact: they are cited by
25% of students as a reason for having chosen EPFL.

The 2011 EPFL Campus Survey
- 3-
Summary .......................................................................................................................... 2
1 Introduction ................................................................................................................ 4
2 Main picture ............................................................................................................... 6
3 Curriculum .................................................................................................................. 7 3.1 Globally ................................................................................................................................................................ ....... 7 3.2 Maths and physics? ................................................................................................................................................ 9 3.3 Internships ............................................................................................................................................................. 10 3.4 Granularity of the curriculum ........................................................................................................................ 11 3.5 Section specific issues ........................................................................................................................................ 11 3.6 The SHS program ................................................................................................................................................. 12 3.7 Elective courses .................................................................................................................................................... 13 3.8 Minors and specializations .............................................................................................................................. 14 4 Teaching methods ..................................................................................................... 14
5 Teaching assistants ................................................................................................... 15
6 Teaching language ..................................................................................................... 18
7 Workload .................................................................................................................. 19
8 Assessment ............................................................................................................... 20 8.1 Exams ................................................................................................................................................................ ....... 20 8.2 ‘Contrôle continu’ ................................................................................................................................................ 21 8.3 Common exams at the ‘propédeutique’ level ........................................................................................... 21 8.4 Exam periods ......................................................................................................................................................... 22 9 Teaching evaluation .................................................................................................. 23
10 The EPFL system ...................................................................................................... 23 10.1 Services .................................................................................................................................................................. 23 10.2 EPFL Web Site ..................................................................................................................................................... 25 10.3 IT ................................................................................................................................................................ ............... 25 10.4 Agepoly .................................................................................................................................................................. 26 10.5 Interlocutors ........................................................................................................................................................ 27 11 Education paths ...................................................................................................... 28 11.1 Why did they choose EPFL? .......................................................................................................................... 28 11.2 When did students choose their section? ................................................................................................ 32 11.3 Experience at the CMS ..................................................................................................................................... 34 11.4 First year on campus ........................................................................................................................................ 34 11.5 Bachelor-master transition ........................................................................................................................... 36 11.6 After the master ................................................................................................................................................. 39 12 Campus ................................................................................................................... 42 12.1 Teaching rooms .................................................................................................................................................. 42 12.2 The Rolex Learning Center ............................................................................................................................ 43 12.3 Safety ................................................................................................................................................................ ...... 48 12.4 Social Life .............................................................................................................................................................. 48 12.5 How to improve the campus? ....................................................................................................................... 49 The Questionnaire .......................................................................................................... 51
Appendix (detailed results) ............................................................................................. 66

The 2011 EPFL Campus Survey
- 4-
1 Introduction
Goals. How do students live and study at EPFL? To answer this question, a survey was conducted in 2004 and specific surveys (transport, food, libraries) since then. The 2011 survey aimed:
• To find out the positive and negative aspects of students’ experience in order to consolidate the former and reduce the latter.
• To verify if the decisions taken as an outcome of the 2004 survey have reached the expected results. • To collect the student’s opinions with respect to some projects under development such as the
‘tutorat’, the new curriculum for the bachelor or the ’discovery bridge’. • To provide data to decision makers at every level of EPFL: units, sections, faculties and the board.
This survey is part of a larger program through which opinions of PhD students and EPFL staff will also be collected in 2012. It is only one instrument to be integrated with the other quality management tools used at EPFL such as the teaching evaluation scheme, the accreditation processes and the faculty audits.
Method. The questionnaire has been developed in collaboration with students, the ‘assemblée d’école’, some section directors and the central services. We avoided asking questions on issues that are already well known (e.g. housing), that we can’t solve or that have been asked in specific surveys. The final number of questions is high, but many were only asked to a subset of students: on average, each student answered 48 questions. A few questions from the previous survey have been kept verbatim to enable comparisons. The questionnaire also includes 11 open questions1 aimed at discovering issues that we were not looking for.
Response rate. Students had two weeks to complete the questionnaire. After two reminders, 2583 students responded, which represents a response rate of 44%. This rate is lower than in 2004, but sufficient to predict the opinions of the whole EPFL population with a good accuracy2. Moreover, the different categories of respondents correspond to their important within the population of EPFL students. The women are 29% among the respondents and 27% in the population: the difference is not significant3. The ratio of students in ‘propédeutique’ (1st year), bachelor cycle (2nd and 3rd year) and master (4th – 5th year) is respectively 34% / 38% / 28% in the sample versus 36% / 35% / 29% in the population: the difference is not significant. The number of respondents per section is not perfectly proportional to the number of students per section, as illustrated below. The architects are under-represented (12% versus 16%). The other discrepancies vary between -1% and +2%.
Response rate per section (in parentheses, the raw number of respondents)
Given these robust data, results may consider the population (EPFL) opinions as very close to our sample results and use the sample opinions as reliable predictors of the opinions of the whole EPFL population. We do not analyze data from sections MTE, EME and IF since they only got 9, 12 and 15 respondents, respectively4.
1 The responses to open question were limited to 2014 characters. 2 Suppose that, for a given question, p is the % of responses “I agree” in an sample of n subjects, there are 95% chances that the interval [p-1.96*sqrt(p*(1-p)/n); p+1.96*sqrt(p*(1-p)/n)] covers the unknown true proportion of “I agree” in the population. For instance, if 73% of 2583 respondents selected the response “I agree”, we have 95% chances that the interval [71.3% - 74.7%] covers the true proportion of students who “agree” in the EPFL population. 3 The 95%-confidence interval (27% -31%) based on the ratio of women in the sample covers the true ratio of women (29%) in the population. 4 These students are nonetheless taken into account when counting data on a broader scale.
16%
6% 5%
0%
9% 8%
1%
9%
6% 8%
1%
4%
8% 5% 6%
9%
12%
6% 5%
0%
8% 7%
1%
10%
7% 8%
0%
4%
10%
6% 7%
10%
0%
5%
10%
15%
20%
AR CGC EL EME GC GM IF IN MA MT MTE MX PH SC SIE SV
Population Sample

The 2011 EPFL Campus Survey
- 5-
Timing. The survey was conducted on the last week of October, i.e. on the 7th week on campus for new students. Their responses have hence to be taken as perceptions of ‘landing at EPFL’, while responses from second-year students provide an account of the whole first-year experience.
Analyses. In general, students’ responses are very positive. For many of the questions, over 75% of students express positive opinions. In this context, questions where smaller majorities (50% to 75%) express positive opinions may be regarded as reflecting less optimal situations. We often analyze students’ responses section per section. Comparing opinions across sections is, in some ways, dangerous because sections have different cultures: for instance, SIE students are, on average, more critical than their peers. We also have to keep in mind that a student from section X that complains about education may actually be referring to the courses provided by section Y. These cross-sections analyses do not aim to establish any ranking between sections. Simply, sections are the best level of granularity to analyze most educational issues. We therefore do not use statistical test for comparing sections; we simply show data so that section directors can see what their students responded. Many specific analyses could be conducted: specific analyses can be performed upon request of EPFL structures (sections, deans,…).
Open questions. Our students provided 7923 comments to the open questions, which indicates their need to voice their opinions. These comments have been classified into categories by D. Bréchet, I. Le Duc, J.-L. Ricci, N. Stainier and R. Tormey (CRAFT). Of course, they are rather unstructured: for instance, in the general question about ‘how to improve education at EPFL’, students criticize SHS, printers or the Rolex while there were subsequent questions specifically addressing these points. It is difficult to account for the diversity comments. For instance, while many students ask to suppress the SHS, a few ask for strengthening it. We tried to synthesize the thousands comments in the most objective way..
Finally, it worth stressing that a survey only measures opinions, as subjective as they are. In a few cases only, we had the possibility to compare what students declare with what they have actually decided on campus and there are divergences. Conducting a survey does not mean that EPFL will follow students’ opinions, but will consider them in decision-making.
This document uses the standard EPFL acronyms:
AR Architecture MA Mathematics CGC Chemistry and Chemical Engineering MT Microengineering (Microtechnique) EL Electrical Engineering MTE Management of Technology EME EPFL Middle East MX Material engineering GC Civil Engineering PH Physics GM Mechanical Engineering SC Communication Sciences IF Financial Engineering SIE Environmental Engineering IN Computer Science SV Life Sciences
Acknowledgments. We would like to thank the 2583 students who invested a significant amount of time answering this survey, the members of the OGIF team and from the sections who provided additional information, CRAFT members who analyzed open questions as well as the members of the project team.

The 2011 EPFL Campus Survey
- 6-
2 Main picture
We kept two general questions from the 2004 survey, in order to measure the evolution of students’ opinions. Their image of EPFL is extremely positive: 93% agree5 with the statement ”I am proud to be a student at the EPFL” while only 3% disagree (4% have no opinion). These results are close to those obtained in 2004 (91% positive) but with a significant6 increase of those who fully agree. The agreement varies across sections from 87% to 96% (see appendix). Higher pride is expressed by students from the first 2 years (95% and 93%) but this ratio remains above 90% for the subsequent years (see appendix). The students who entered EPFL at the master level are slightly more positive than those who did their bachelor here (71% versus 66% of ‘fully agree)’, but, since these new master students only constitute 9% of the respondents, their influence is not sufficient to explain the 2004-2011 difference.
Question 50: “I am proud to be a student at the EPFL”
Moreover, 76% of the respondents consider EPFL education as very good or excellent7. This represents a significant8 increase since 2004, when only 43% expressed these positive opinions. These results are great but do not constitute a proof of improvement of our education: student’s opinions may have evolved because the quality of education improved, but also for other reasons, such as EPFL’s communication strategy. Therefore, we correlated their answers to Q50 (image of EPFL) and to Q51. The Spearman’s Rho is 0.34: there is a relationship (p<.0001) but opinions on Q50 only partly explain responses on Q51, and vice-versa (see appendix).
Question 51: “The overall quality of the education is….”
The satisfaction varies significantly across sections (see below): the ratio of unsatisfied students is always low, but the intensity of satisfaction varies since the rate of responses ‘very good’ and ‘excellent’ ranged from 66% to 81%. It is important to stress that these results are based on the sections in which a student is registered, while his/her courses are provided by several sections, especially during the first years.
5 There are 95% chances that the true proportion in the EPFL population is in the interval |92% ;94%] 6 X-SQUARED = 301.145 ; df= 3, p-value < .0001 7 There are 95% chances that the true proportion in the EPFL population is in the interval [74.4% ; 77,7%] 8 X-SQUARED = 723,871; df= 4, p-value < .0001. Because of unfortunate changes in the available responses, the categories ‘bonne’ and ‘plutôt bonne’ have been merged as well as the categories ‘mauvaise’, ‘plutôt mauvaise’ » et ‘très mauvais’ which had anyway a very low score.
54% 73%
37% 20%
0% 10% 20% 30% 40% 50% 60% 70% 80% 90%
100%
2004 2011
No opinion
Disagree
Disagree Slightly
Agree slightly
Agree
6% 19%
37%
57%
50%
21%
0% 10% 20% 30% 40% 50% 60% 70% 80% 90%
100%
2004 2011
Non opinion
Bad
Good
Very good
Excellent

The 2011 EPFL Campus Survey
- 7-
Question 51: “The overall quality of the education is….”(sections ranked per ratio of ‘very good’ + ‘excellent’)
We expected that older students would appreciate more their education since it is closer to their interests. Actually, the percentage of very positive opinions (‘excellent’ + ‘very good’) significantly9 changes: it decreases with the semester, from 81% to 69%. Nonetheless, the number of unsatisfied students remains very low, between 0% and 3%. Is the satisfaction decrease due to the newcomers entering EPFL at the master level? Partly. The students who did their bachelor at EPFL and those who entered EPFL at the master level (see appendix) both express 71% of very positive opinions (‘excellent’ + ‘very good’), but the ratio of ‘excellent’ is lower (15% versus 24%) for those who joined EPFL at the master level. There is no honeymoon effect for newcomers at the master level, but we cannot speak about disappointment since they are still largely positive (97% good to excellent). We will see that this decrease is probably due to the students complaints about the master curricula (see section 3.1).
Question 51: “The overall quality of the education is….” (per study year)
3 Curriculum
3.1 Globally
No less than 91% of respondents10 agree with the statement ‘My study program meets my expectations’. This is an improvement with 2004 where the agreement was 86%. It is positive to report that there is a large increase of percentage of full agreement: from 33% in 2004 to 53% in 2011!
9 X-SQUARED = 75; DF= 20 ; p-value < .0001 10 The 95% interval is [90% ; 92%]
14% 12% 13% 21% 19% 22%
15% 16% 27% 20% 21% 21% 26%
52% 56% 60% 53% 57% 55%
63% 62% 52% 60% 60% 60% 55%
27% 28% 24% 25% 22% 21% 17% 20% 16% 19% 17% 17% 15%
0%
10%
20%
30%
40%
50%
60%
70%
80%
90%
100%
SIE CGC AR GM IN SV MX GC EL SC PH MT MA
No opinion
Very bad
Bad
Good
Very good
Excellent
23% 18% 16% 19% 12%
59% 61% 56% 53%
57%
16% 20% 25% 27% 28%
0%
10%
20%
30%
40%
50%
60%
70%
80%
90%
100%
Bachelor 1 Bachelor 2 Bachelor 3 Master 1 Master 2
No opinion
Very bad
Bad
Good
Very good
Excellent

The 2011 EPFL Campus Survey
- 8-
Question 14: “My study program meets my expectations”.
The opinions about the curriculum vary per section and per cycle. The next figure indicates the percentage of students who disagreed partly or completely to the statement ‘My study program meets my expectations’. The surprise is that the satisfaction is lower for master curricula (whereas most EPFL efforts currently focus on the improvement of the bachelor). This may explain the decay of satisfaction across study years at EPFL revealed by question 51 (quality of education). We must interpret these data carefully: at master level, we got between 32 and 96 respondents per section and hence the responses from a few individuals have much influence. Therefore the raw number of unsatisfied students is indicated in the figure below.
Question 14: Rate of disagreement with the statement “My study program meets my expectations”.
In parentheses, raw number of students who “disagree”, respectively at the bachelor and master level.
Another question concerned the intelligibility of the study plans. On average, 84% of our respondents agree or slightly agree with the statement “I understand the organisation of the study plan and the requirements to pass” (Q19). These results are similar across the cycles and across sections, with the exception for the ‘propédeutique’ in architecture where the rate of agreement falls to 63%. Students who joined EPFL at the master level have about the same opinion as those who completed their bachelor here.
Students had the possibility to make suggestions about how to improve EPFL education. They provided 1469 comments, often expressed as criticisms, but translated below as suggestions for change. Some items will be addressed later in this report: teaching rooms, SHS, printing, exams and language issues. The main criticisms concern the core of education: the curricula, the pedagogy and the ratio of teaching assistants.
33% 53%
53%
38%
12% 7%
0% 10% 20% 30% 40% 50% 60% 70% 80% 90%
100%
2004 2011
No opinion
Disagree
Disagree Slightly
Agree slightly
Agree
6% 6% 6%
3%
10%
4% 4%
8%
12%
5% 8%
4% 6%
3% 3% 4% 5% 7%
11% 12%
15% 16% 17% 17% 19%
25%
0%
5%
10%
15%
20%
25%
30%
MA (8,1)
EL (5,1)
MT (9,2)
GC (4,2)
GM (15,3)
PH (7,6)
SC (4,5)
SV (16,9)
CGC (14,7)
IN (9,16)
AR (19,15)
MX (3,6)
SIE (7,15)
Bachelor
Master

The 2011 EPFL Campus Survey
- 9-
Question 55: “What should the EPFL do to improve the quality of the education?”
(1469 comments, some of them addressing several topics)
With respect to the curriculum, students criticize the consistency, complexity and rigidity of study plans. They suggest:
• To improve the linkages between courses within a study plan, in general, and in particular to better connect maths and physics to the other courses.
• To strengthen the relationship between theoretical courses and labs, as well as between theoretical courses and projects.
• To improve the continuity of the curricula across study years, especially between 1st and 2nd year. • To suppress courses they do not consider as relevant, not only SHS courses, but also many other
courses. • To reduce the number of courses with few credits in favor of courses providing a global vision of the
field (see also section 3.4). • To have more fairness across courses between the number of credits and the actual workload. • To reduce the number of compulsory courses and to increase the number of elective courses, but at
the same time, without having timetable overlaps. • Some students criticize the fact that the 1st year selection is based only on maths and physics.
As in 2004, they ask to make education more practical (164 comments), which pave the road for the ‘discovery bridge’ project, and closer to their future profession (112 comments): earlier internships, more contacts with professionals, more teachers with professional experience: “maybe more contacts with professionists [sic] and people who work in the field you're studying”.
The quality of teaching and the teachers’ pedagogical skills correspond to one third of their criticisms (299 + 277). The students complain – and often express it with a certain strength- that teachers are recruited on the basis of their scientific expertise and not on the basis of their teaching skills. Many students are bitter to be taught by professors who do not express any passion for what they teach. They complain about the lack of motivation for courses that are not directly connected to the teacher’s research topics. With regard to exercises, students ask for more: more exercises and more teaching assistants. They also question the criteria for recruiting teaching assistants. Spontaneously, 57 students ask for extending the ‘tutorat’ scheme: some of them suggest to extend it to all 1st year courses, some to the second year.
3.2 Maths and physics?
We asked students how they perceive the ‘polytechnique’ component of their education:
Question 22: What do you think of the distribution of courses in the first and the second year? ☐ I would have preferred more courses about my subject and less maths and physics ☐ It is balanced ☐ I would have preferred less courses about my subject and more maths and physics
301
299
275
227
164
141
114
112
93
93
83
57
52
0 50 100 150 200 250 300 350
Improve study plans
Improve teachers' pedagogical skills
More/Better teaching assistants
Improve teaching quality
More practice, more exercices
Improve teaching rooms and working spaces
Improve teaching resources: lecture notes, printing, Moodle,…
Make education closer to professions
Fix language problems
Address problems with exams, more 'contrôle continu'
Reduce worklad and teaching hours ('no time for thinking')
Offer "Tutorat" to all students
Improve/Supress SHS

The 2011 EPFL Campus Survey
- 10-
We did not ask this question to students in mathematics and physics (for whom the question makes no sense) and removed from the data those who did not do their bachelor at EPFL. Globally, one third (34%) of the students demand to have more courses specific to their sections, while the majority (62%) appreciates the current balance. This picture is stable across study years (see appendix), which means that there is no ‘veteran effect’ among our students (‘I suffered to pass the first years, youngsters should suffer too’): first years student are fewer to ask ‘more math’ (1%) than older bachelor students (6%) but master students are only 5%. Of course, opinions vary across sections. The histogram below must be interpreted carefully: for instance, architects are the most satisfied with the situation, probably because there they get less maths than any other section. The section of chemistry is facing the largest divergence of opinions among its students: the ‘more math’ opinions being expressed by 11% of their students. Actually, half of those are in favor of ‘more maths and physics’ hesitated about the section they have chosen (Section 11.2). We also asked students: “If you chose ‘more maths and physics’ in the previous question, which courses would you move to the second or third year?” (Q23). They made (only) 36 suggestions, listed in appendix. We should have asked the same question to those who requested more subject-specific courses on Q22.
Question 22: “What do you think of the distribution of courses in the first and the second year?”
3.3 Internships
All EPFL engineering curricula have to include an internship to be accredited. Question 15 was formulated in such a way that students who have done an internship and those who will do an internship both had the possibility to give their opinion: “The professional internship was or will be useful for the start of my career”.
Among those who have an opinion, 94% of the students11 approve internships. This is not a surprise: in 2004, 93% of students declared this would add value to their career12. This result is however interesting since many colleagues were against this initiative. Internships have been progressively developed over the last years, but not yet fully implemented, hence a high rate of ‘no opinion’. Along study years, this rate decreases and the ratio of negative opinions remains marginal.
Question 15: “The professional internship was or will be useful for the start of my career”.
11 62% of respondents agree and 4% disagree. If we consider only those who have an opinion, 94% of agree and 6% disagree. 12 The question requires students to anticipate how the internship may influence their career. It should be asked in the alumni survey.
24% 29% 30% 30% 34% 37% 37% 38%
44% 44% 46%
72%
61% 68%
63% 62% 61% 60% 60% 53% 55%
51%
4% 11%
2% 6% 4% 2% 3% 2% 3% 1% 4%
0%
10%
20%
30%
40%
50%
60%
70%
80%
AR CGC GC SC EL MT SV GM IN MX SIE
More specific courses It's ok More math & phys
40% 46% 56% 53% 57%
12% 14%
17% 18% 17% 47% 38%
21% 19% 21%
0%
20%
40%
60%
80%
100%
BA 1 BA 2 BA 3 MA 1 MA 2
No opinion
Disagree
Disagree Slightly
Agree slightly
Agree

The 2011 EPFL Campus Survey
- 11-
Let us focus on master students for whom this question is timelier. Their responses vary a lot across sections. However, comparing sections is risky: the format of the internship13 is not the same everywhere, nor is the degree of implementation14. For instance, architecture students do a 1-year long out-of-curriculum internship while most sections have an 8- or 14-week-long internship. Another example is that IN and SC had an internship program running for many years, while this is still a work-in-progress in other sections. Nonetheless, the figure below provides section directors with a specific feedback.
Question 15: “The professional internship was or will be useful for the start of my career”.
3.4 Granularity of the curriculum
Curricula are like farm fields: with time, they tend to become fragmented into multiple courses with few credits each. To reverse this natural evolution, an EPFL project is to re-organize courses into larger units. We asked students to choose among 3 levels of granularity. The majority (60%) prefers medium granularity (2 X 3). The preference for fewer, larger courses increases with study years and reaches one-third (35%) at the master level. There are minor differences between sections (see appendix).
Question 34. “ If the contents were the same, I would prefer …”, per cycle.
3.5 Section specific issues
Several sections proposed questions from which they expected to get answers. Some of these questions occurred to be interesting to all and have hence been integrated in the rest of this report. We analyze here questions that only concerned some sections.
I&C wanted to get some feedback on the main project that students have to complete during the second semester of their first year. We asked them if they agreed with the statement: ‘The “ITP” project in the first year is useful for my education’ (question 18). The response is clear: 92% of respondents agree, with a higher conviction among IN students than among SC students.15
ENAC wanted to get feedback on the ‘ENAC courses’: this refers to 3 courses offered across the sections of architecture, civil engineering and environmental engineering16. Students from the third bachelor year17 are
13 Sections and student can choose to make longer or shorter internships, combined or not with their master theses. 14 How many students per section do an internship; how many companies offer internships,… 15 We discarded first year students who haven’t done this project yet as well as the students who answered ’no opinion or not concerned’, since they probably haven’t done this project. 16 There is an ‘ENAC’ week in the 2nd year of the bachelor, a teaching unit ‘ENAC’ in the third year and an ‘ENAC’ project at the master level. 17 We did not count 2nd year bachelor students since their ENAC courses is in the spring semester and this survey was in the fall semester.
20% 24% 36% 37% 38% 42%
51% 61% 65% 68% 70% 75%
90%
10% 8%
14% 28%
6% 19%
18% 12% 6%
15% 14% 13%
8%
66% 61% 49%
27%
56% 35%
24% 22% 27% 16% 16%
6% 0%
0% 10% 20% 30% 40% 50% 60% 70% 80% 90%
100%
PH MA MX SV CGC MT GM SIE EL SC IN GC AR No opinion Disagree Disagree Slightly Agree slightly Agree
37% 24%
8%
57% 65%
57%
6% 12% 35%
0%
20%
40%
60%
80%
100%
Propé Bachelor Master
1 course at 6 credits
2 courses at 3 credits each
3 courses of 2 credits each

The 2011 EPFL Campus Survey
- 12-
positive about these projects, SIE students being the most positive ones. At the master level, students are more critical towards their optional ‘ENAC’ project, with between 27% (AR) and 46% (GC) of students stating favorable opinions (see appendix).
Question 17: “The ‘ENAC’ course is valuable” (responses from 3rd year bachelors)
Since the sample size is small, we provide here raw numbers.
The chemistry section wanted to get feedback on the timing of the choice between chemistry and chemical engineering. The majority of students18 are in favor of the status quo. Those in favor of making an earlier choice increase at the master level, where 39% of the students in chemical engineering believe they should have preferred an earlier choice19, but the number of respondents is too low to draw hard conclusions.
Question 25: “The first 2 years of the Bachelors’ in chemistry are in common, then students split into
chemistry or chemical engineering”. (raw number of respondents)
The chemistry section also asked to its students “Which are the strengths and weaknesses you see with your Masters?” (Q26). We only got 35 answers. Students appreciate the diversity of courses and the broad coverage of their discipline. Ten students complain that the course level is not challenging enough and that there are too many constraints on course selection. Their comments will be provided to the section.
3.6 The SHS program
The ratio of students who agree with the statement that ‘The SHS course is valuable’ went down from 59% in 2004 to 51% in 2011, while the general satisfaction about education has increased. The 2011 distribution of responses is significantly20 different from distribution of 2004. Since the overall rate of satisfaction21 is now around 90%, this result reveals that SHS remains a controversy.
18 We removed from the sample the master students who did not do their bachelor at EPFL 20 X-squared = 112.795, df = 4, p-value < 0.0001 21 Question 51 « The quality of education is… » has 76% of very satisfied (‘excellent’ + ‘very good’) or 97% of quite satisfied (adding the ‘good’). Question 14 about the curriculum has 91% positive opinions.
16 15
16
23
8 4 5
2 3 6 1
0%
20%
40%
60%
80%
100%
AR GC SIE
No opinion
Disagree
Disagree Slightly
Agree slightly
Agree
4 19
9
4
31 52
13
31
2 6 1 2
0% 10% 20% 30% 40% 50% 60% 70% 80% 90%
100%
Propé (37) Bachelor (77) Master Chemical Engineering Master Chemistry
The specialisation should start later
This organisation is appropriate
The specialisation should start earlier
The 2011 EPFL Campus Survey
- 13-
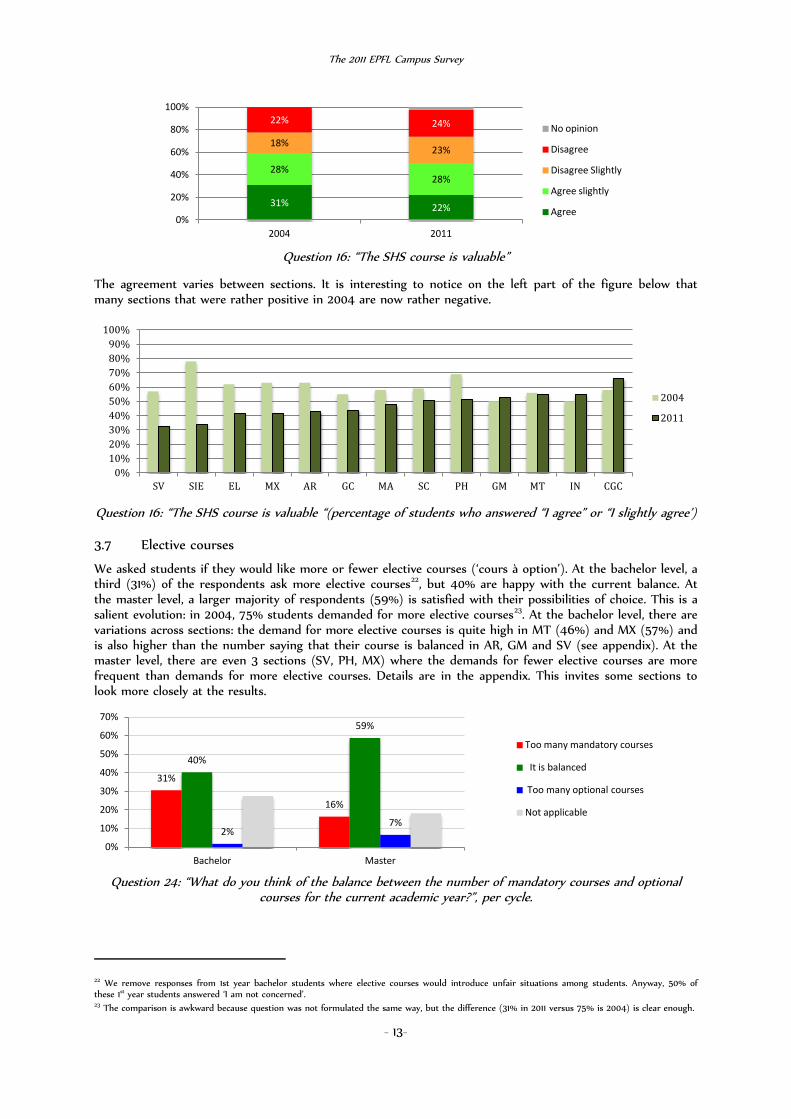
Question 16: “The SHS course is valuable”
The agreement varies between sections. It is interesting to notice on the left part of the figure below that many sections that were rather positive in 2004 are now rather negative.
Question 16: “The SHS course is valuable “(percentage of students who answered “I agree” or “I slightly agree’)
3.7 Elective courses
We asked students if they would like more or fewer elective courses (‘cours à option’). At the bachelor level, a third (31%) of the respondents ask more elective courses22, but 40% are happy with the current balance. At the master level, a larger majority of respondents (59%) is satisfied with their possibilities of choice. This is a salient evolution: in 2004, 75% students demanded for more elective courses23. At the bachelor level, there are variations across sections: the demand for more elective courses is quite high in MT (46%) and MX (57%) and is also higher than the number saying that their course is balanced in AR, GM and SV (see appendix). At the master level, there are even 3 sections (SV, PH, MX) where the demands for fewer elective courses are more frequent than demands for more elective courses. Details are in the appendix. This invites some sections to look more closely at the results.
Question 24: “What do you think of the balance between the number of mandatory courses and optional
courses for the current academic year?”, per cycle.
22 We remove responses from 1st year bachelor students where elective courses would introduce unfair situations among students. Anyway, 50% of these 1st year students answered ‘I am not concerned’. 23 The comparison is awkward because question was not formulated the same way, but the difference (31% in 2011 versus 75% is 2004) is clear enough.
31% 22%
28% 28%
18% 23%
22% 24%
0%
20%
40%
60%
80%
100%
2004 2011
No opinion
Disagree
Disagree Slightly
Agree slightly
Agree
0% 10% 20% 30% 40% 50% 60% 70% 80% 90%
100%
SV SIE EL MX AR GC MA SC PH GM MT IN CGC
2004
2011
31%
16%
40%
59%
2% 7%
0%
10%
20%
30%
40%
50%
60%
70%
Bachelor Master
Too many mandatory courses
It is balanced
Too many optional courses
Not applicable

The 2011 EPFL Campus Survey
- 14-
An EPFL project aims at producing ‘trailers’ for elective courses, i.e. short video recordings (10-30 min) that would provide the content that the professor usually presents in his first lecture. This project aims at optimizing our system: anticipating the number of teaching assistants; selecting lecture rooms based on class size, etc. This idea divides students: a small majority agrees (46%), 37% disagree and 17% have no opinion. Details are in the appendix.
3.8 Minors and specializations
What do students think about specializations and minors24 ? The respondents are very positive: 87% consider that specializations have an added value, 77% for minors within their sections and 88% for minors in other sections. Of course, the question is biased: students do not choose a specialization or minor randomly, but precisely because they expect some added value25. In this context, it is quite disappointing to discover that 23% dislike their minor. Our hypothesis is that this is not due to the concept of minor per se, but reflects their lack of satisfaction with specific minors26.
4 Teaching methods
A curriculum is made of lectures, exercises27, labs and projects. How do students value them? For all methods but exercises the rate of agreement increases every semester (details in appendix) proportionally to the decrease of ‘no opinion / not concerned’ responses, but the rate of disagreement is small and constant:
• 76% appreciate ex-cathedra lectures, from 62% for the first semester to 92% at the end; • 95% appreciate exercises, and this is stable across all study years; • 70% appreciate project-oriented courses, from 57% to 86% across study years.
24 The questions were phrased in a way that only students who were doing a specialization or minor should answer, but it was asked to all master students. We therefore have respectively 58%, 85% and 78% of ‘no opinion’ for these 3 questions. We only analyze the data from those that gave their opinion. 25 The vote that students made ‘with their feet’, by registering or not, provides a better measure of their interests in minors and specializations. 26 We don’t have the information about the minor or specialization made by the respondents. 27 Recitation sections
61% 51%
69%
27%
26%
19%
6% 9%
4% 7% 14% 8%
0%
10%
20%
30%
40%
50%
60%
70%
80%
90%
100%
Q52. I am doing a specialisation in my section and this adds value to my
education (295 respondents)
Q53. I am doing a minor in my section and this adds value to my education
(109 respondents)
Q54. I am doing a minor offered by another section and this adds value to
my education (160 respondents)
Agree Agree slightly Disagree Slightly Disagree

The 2011 EPFL Campus Survey
- 15-
In the context of the ‘discovery bridge’ project, we dissociated two questions on labs: whether there are enough of them (Q29) and whether they actually help connecting theory and practice (Q30). Yes, students consider labs as useful. Only 9% disagree with the usefulness of labs: the rate agreement increases from 57% to 86% as the rate of ‘no opinion’ responses decrease. Respondents are more critical about the number of labs: 21% at bachelor level and 31% at master level consider the number of labs as too low. Depending upon the section, the demand for more labs is higher at the bachelor level (GC, MX), at the master level (SC, SV) or at both levels (GM, SIE).
Question 29: Percentage of students (in parentheses, raw number) who disagree with the statement
“There is a sufficient amount of practical and laboratory work in my course”
Besides project-oriented courses, students have the possibility to do semester projects28. The large majority29 (79%) of our students appreciate these projects while 11% dislike them. There are large discrepancies between sections, but none of them are below 60% positive responses (see appendix).
5 Teaching assistants
EPFL has engaged considerable efforts to provide more assistants to the exercises sessions, not only within the ‘tutorat’ programme30 but also through creation of ‘pools’ of assistants. To measure the effect of these efforts, we asked if students consider the number of teaching assistants (TAs) as sufficient. A small majority of students (61%) agree, which is much lower than the other opinions we collected through other questions. Across sections, there are variations of 10% above or below this average (see appendix). The agreement is much lower at the second-year (43%) and third-year of bachelor (54%), while most recent efforts have been devoted to the first year.
28 The format varies across sections, but it is around 1 day per week of work in an EPFL lab. 29 We analyzed only responses from master students because the responses of BA3 students include a high rate of ‘No opinion’ that probably reflects the fact that they had no experience with doing semester projects. 30 In first-year courses in maths and physics, groups of 8 students are assigned the same tutor every week. The tutor is a third-year bachelor or master student, sometimes a PhD student.
37%
41%
36%
72%
42%
33%
31%
25%
23%
34%
0% 20% 40% 60% 80% 100%
Q31. The courses that include a project are valuable
Q30. The practical exercises and laboratory work help me to link theory and practice
Q29. There is a sufficient amount of practical and laboratory work in my course
Q28. The exercises help me absorb the course work
Q27. The courses in form of lectures are valuable
Agree Agree slightly Disagree Slightly Disagree No opinion
22%
5% 4% 6%
26%
16%
43%
13%
36%
49%
25%
63%
21%
14% 14% 16% 16% 17% 21%
25% 29% 30%
37%
51%
58%
65%
0%
10%
20%
30%
40%
50%
60%
70%
EL (9,5) AR (6,12) PH (4,9) MA (4,6) IN (22,26) MT (14,11( MX (15,8) CGC (10,13) GC (23,13) GM (44,15) SC (17,21) SIE (38,33) SV (22,39)
Bachelor
Master

The 2011 EPFL Campus Survey
- 16-
Question 36: “The number of assistants for the exercises is adapted to the number of students present”
The next graph shows that a majority of respondents considers the number of TA’s as insufficient in 9 sections in the second year and 5 sections in the third year. These ratios are very high in several sections.
Question 36: Percentage of BA2/3 students who (slightly) disagree with “The number of assistants for the exercises is adapted to the number of students present”. Raw numbers in parentheses.
Do students consider that the TA’s actually helped them to understand the course material? Yes, 82% of students agree, a percentage that is stable per year and per section (see appendix), except in architecture (68% agree). In I&C, there is a problem at the master level where one-third of the respondents (31%) find the TA’s not helpful.
Students massively appreciate the ‘tutorat’: 88% agree31 with “The tutorial helps to understand the exercises (Q38)”. This ratio is quite stable32 across the 3 study years of the bachelor (see appendix). Across sections, it varies from 80% in MA and PH to near-unanimity in some sections.
31 The question was conditioned by “If you took part in the tutorial in the first year…” since this programme is not yet implemented in architecture and part of chemistry. In civil engineering, it has only been implemented this semester. We hence removed these 3 sections. Globally, 31% students replied ‘no opinion or not concerned’. The percentage reported are based on the students (2015) who gave another response than ‘no opinion’. The confidence interval at 95% is [86% ; 90%] 32 X-squared = 12.1157, df = 6, p-value = 0.05944
25% 8% 16%
30% 29%
42%
35% 39%
38% 44%
22%
36% 29%
20% 15%
10% 17% 13% 5% 6%
0% 10% 20% 30% 40% 50% 60% 70% 80% 90%
100%
BA1 BA2 BA3 MA1 MA2
No opinion Disagree Disagree Slightly Agree slightly Agree
30%
42% 50%
34%
45% 54%
65% 58% 58%
69%
57%
68% 75%
20%
35% 28%
56% 47%
39% 30%
44% 52%
43%
56% 56%
74%
0% 10% 20% 30% 40% 50% 60% 70% 80% 90%
100%
AR (16.10) PH (22,12) EL(9,5) MA (10,18) MT (20,17) CGC(19,16) GM (35,9) SV (33,21) GC (19,14) SC (24,12) IN (24,19) MX (17,5) SIE (27,17)
BA2
BA3

The 2011 EPFL Campus Survey
- 17-
Question 38: “The tutorial helps to understand the exercises”
Does the ‘tutorat’ also sustain higher participation in exercises sessions, as teachers have reported to us? Yes, 80% agree with the statement “The tutorial prompted me to go to the exercise lessons (Q39)”. This ratio varies from 68% to 91% across sections (see appendix). Students from different sections have different views. For instance, ‘only’ 80% of physics students agree that the ‘tutorat’ helps understanding but 91% agree that it prompts them attending the sessions. Conversely, in micro-engineering (MT), 93% of students agree on the first question, but only 68% on the second one.33
Question 39: “The tutorial prompted me to go to the exercise lessons”
In questions 40 and 41, we asked the opinion of the teaching assistants, i.e. our bachelor/master students who act as TAs, either for the ‘tutorat’ program or for any other course. The ‘no opinion/not concerned’ rate reaches respectively 63% and 66%, which indicates that about one-third of our respondents actually work as TA. The results are clear: 95% of the TAs appreciate being a TA. This is true for all sections; some even reach 100%. Only 10 TA’s disagree and 12 slightly disagree out of 400 respondents. There is a problem in SC where 6 of the 31 master students who acted as TAs are critical (See appendix).
Question 41 aimed at verifying the ‘learning by teaching’ effect, i.e. that fact that TAs gain knowledge by explaining to other students, providing feedback, etc.34: 87% of TAs confirm that being a TA helped them to better understand the field. Sections details are in appendix.
33 The difference between Q38 and Q39 indicates that students do not simply approve or reject the ‘tutorat’ but carefully read the questions. 34 This effect has been established through experimental educational research
56% 52% 40%
53% 62% 65% 67% 72% 66% 78%
24% 28% 44%
31% 27% 27% 25% 21% 28%
20%
0% 10% 20% 30% 40% 50% 60% 70% 80% 90%
100%
MA PH EL GM IN SC SV MT SIE MX
Disagree Disagree Slightly Agree slightly Agree
54% 45% 47% 54% 44% 62% 64% 60% 60%
77%
14% 26% 29% 25% 36% 21% 19% 24% 25%
14% 14% 15% 14% 13% 13% 7% 6% 10% 7% 2% 18% 14% 10% 8% 7% 10% 11% 5% 8% 7%
0%
20%
40%
60%
80%
100%
MT SC MA IN GM EL MX SIE SV PH
83% 71% 73% 62% 50% 57%
13% 23% 20%
26% 35%
33%
0% 10% 20% 30% 40% 50% 60% 70% 80% 90%
100%
BA3 MA1 MA2 BA3 MA1 MA2
Question 40. The role of tutor or assistant was valuable for me
Question 41. My role as a tutor or student-assistant helped me to understand the material
that I was teaching better
Disagree
Disagree Slightly
Agree slightly
Agree

The 2011 EPFL Campus Survey
- 18-
6 Teaching language
Question 35: Does the teaching language obstruct your understanding of the course?35 a) No 69% b) Yes, I have difficulties understanding French 2% c) Yes, I have difficulties understanding English 8% d) The French that some teachers use is difficult to understand 17% e) The English that some teachers use is difficult to understand 26%
Globally, 31% of students face language difficulties (i.e. did not choose option ‘a’ in Q35). This is a large number considering that these language difficulties add to the intrinsic difficulties of our studies. Table 1 analyzes difficulties by comparing responses b to e. For the respondents, the ‘problem’ is mostly due to teachers. Even those who declare no language difficulty are critical with respect to their teachers’ language skills. However, the question referred to “the language that some teachers use”, which means that if a single teacher per section speaks poor French/English, the student could select this response. These criticisms vary across sections: comparing sections is risky since the percentage of complaints also reflects how much English is actually spoken in that section, but section directors should look at their specific data in the appendix. Surprisingly, these language problems are rarely reflected in teaching evaluations36.
Students who responded Yes, I have difficulties understanding French
Yes, I have difficulties understanding English
The French that some teachers use is difficult to understand
The English that some teachers use is difficult to understand
No difficulty: selected a 0 0 169 190 Some difficulty didn’t select a) 58 221 265 482
Table 1. Language difficulties (responses b,c,d,e in Q35) whether or not students selected option a. Raw numbers
Some students nonetheless mention personal language difficulties. We analyze them in Table 2, which reveals some inconsistencies: English difficulties are higher at bachelor level, when courses are mostly taught in French, and French difficulties are higher at the Master level, when courses are taught in English. This inconsistency can be explained by different hypotheses:
• The EPFL language policy is not rigorously applied, i.e. the number of courses taught in English at the bachelor or in French at the master is higher than what could be considered as exceptions
• Students over-estimate they own skills. In the English test that freshmen undertake every year, 44%37 of the 2010 freshmen did not reach the B2 level in oral understanding38.
• The percentages correspond to few individuals and should not be over-interpreted.
Cycle Teaching Language
Personal language difficulties Response b) Yes, I have difficulties understanding French
Response c) Yes, I have difficulties understanding English
BA1 French 1% (0% - 3% per section) 8% (2% - 17% per section) BA2–BA3 French39 2% (0% - 4% per section) 10% (7% - 16% per section) MA1 MA2 English40 4% (12% in GM; 19% in MX)41 7% (3% –15% per section)
Table 2: Personal language problems
Good news is that students who don’t speak French are almost as comfortable as French speakers (65% versus 70%) and less sensitive that French speakers about the quality of English spoken by teachers. However, Asian students reported more difficulties: 57% of the Chinese speaking, 70% of those speaking Hindi and 88% of those speaking Farsi42. Details are provided in the appendix.
35 The sum is above 100% since multiple responses were allowed. Students could answer a) and b) for instance, which makes no sense. 36 An analysis of students comments during teaching evaluation will be published soon 37 The exam is conducted by the UNIL-EPL Centre de Langues and the data have been computed by OGIF/EPFL. 38 EPFL considers C1 to be the level required for master students while B2 corresponds to the Swiss maturity exam.. 39 With a few (1-3) courses in English 40 Except architecture 41 This represents only 5 (GM) and 6 (MMX) respondents 42 These data must be interpreted carefully since we only got 21, 10 and 16 respondents respectively for these 3 countries. This also explains why they have a low impact on the whole-EPFL statistics.

The 2011 EPFL Campus Survey
- 19-
Question 35: “Does the teaching language obstruct your understanding of the course?” 43
Beyond details, the lesson is that, in addition to the intrinsic challenge of EPFL studies, almost one-third of our students face language difficulties. Further analyses should be conducted both on the students’ side and on the teachers’ side.
7 Workload
Estimating one’s own workload is difficult: it’s hard to realize how much time one spends on weekly tasks. There is a risk that students over-estimate their workload, perhaps for influencing EPFL, but it is the only source we have. The 2011 responses differ significantly44 from the 2004 responses.
Question 42. “ On average I spend about… for my studies (courses + individual work)”
If we translate these categories into values45, the average working load of the respondents is 52 hours per week. It is an approximation, but it enables comparisons with 2004 (47.8 hours) and with data collected46 in 2009 by the Federal Office of Statistics (44 hours). These differences can be partly explained by the higher workload of architects (see hereafter), who were fewer at EPFL in 2004 and were not part of the OFS study. However, without the architects, the average workload is still 50.4 hours/week in 2011 (versus 47.04 in 2004) and the difference remains significant47. Students’ declared workload does not vary much along the study years: between 51.2 and 52.6 hours per week. The first year (propé) does not constitute a peak. As in 2004, women declare working more than men, respectively 54.6 hours per week and 51.2 hours per week (see appendix).
43 The numbers sum up above 100 since student could provide multiple answers 44 X-squared = 184.3121, df = 3, p-value < 2.2e-16; the 2004 survey did not include the >70 response, hence we did not consider it in the test. 45 As an approximation, we compute for instance that all students who responded ’40-50’ work 45 hours per week. 46 They obtained 1357 responses. 47 X-squared = 134.0644, df = 3, p-value < 2.2e-16
70%
0% 10% 16%
28%
65%
10% 6% 22% 19%
0% 10% 20% 30% 40% 50% 60% 70% 80%
No (difficulty) Yes, I have difficulties understanding French
Yes, I have difficulties understanding English
The French that some teachers use is difficult
to understand
The English that some teachers use is difficult
to understand
French speakers Others
7% 10% 14%
28%
33%
41%
34%
20% 12%
0% 10% 20% 30% 40% 50% 60% 70% 80% 90%
100%
2004 2011
< 40 hours
40 - 50 hours
50-60 hours
60 -70 hours
> 70 hours

The 2011 EPFL Campus Survey
- 20-
Question 42: “ On average I spend about… for my studies (courses + individual work)” per study year
There are differences between sections: students in architecture declare that they work on average 14 hours more per week (64 h/w) than students from any other section (50 h/w). The details are provided in the appendix. Besides architecture, the following graph shows that we should be careful about interpretations. Besides the fancy convergence on BA3 (except EL48), there is “more noise than signal”. For every pair (sectioni, yearj), the standard deviation is around 10 hours/week. The divergence of workload at MA2 is partly related to master theses49. Another lesson is not that there are divergences between sections but that there exist huge divergences of workload within sections.
Question 42: “ On average I spend about… for my studies (courses + individual work)” per section & year
8 Assessment
8.1 Exams
Any quality management scheme has to include a feedback on exams since they constitute a key component of the educational system. We don’t ask students to judge if an exam was too easy or too difficult, but whether the questions measured the skills to be acquired, as announced at the beginning of the course. We did not ask this question to 1st year students since they haven’t passed any exam yet. The majority (76%50) of respondents consider their exam as relevant. This ratio is quite good for such a sensitive and subjective question and similar to 2004 (73% agreement). It is nonetheless lower than other satisfaction indices collected in this survey. Only 20% of students fully agree that ‘The exam procedures and questions are a good measure of the competences I acquired’. This percentage is stable over study years51. The results concern the 1st year ‘propédeutique’ exam, since BA2 students passed it a few months before this survey. In their opinions, it as
48 In 3rd year bachelor in EL, 6 of the 18 respondents said they work less than 40 hours per week. 49 In the master programs with 90 credits, students do their thesis in the fall semester of the second year, when this survey was conducted. 50 The 95% confidence interval is [74% ; 78%] 51 The increase of ‘no opinion’ responses in MA1 is due to new master students who haven’t passed any EPFL exam yet.
13% 8% 13% 10% 15%
37% 36% 29% 32%
32%
31% 35% 33% 33% 30%
13% 13% 16% 16% 13%
0% 10% 20% 30% 40% 50% 60% 70% 80% 90%
100%
BA1 BA2 BA3 MA1 MA2
> 70
60-70
50-60
40-50
< 40
40
45
50
55
60
65
70
BA1 BA2 BA3 MA1 MA2
AR
CGC
EL
GC
GM
IN
MA
MT
MX
PH
SC
SIE
SV
The 2011 EPFL Campus Survey
- 21-
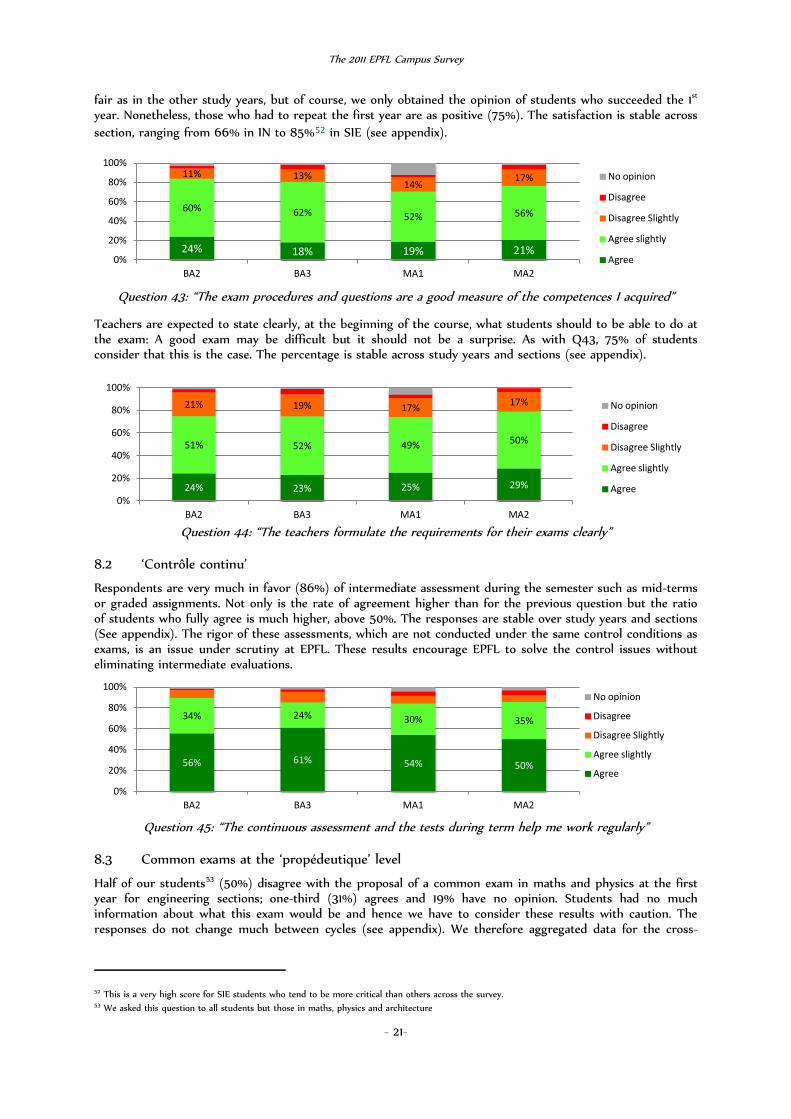
fair as in the other study years, but of course, we only obtained the opinion of students who succeeded the 1st year. Nonetheless, those who had to repeat the first year are as positive (75%). The satisfaction is stable across section, ranging from 66% in IN to 85%52 in SIE (see appendix).
Question 43: “The exam procedures and questions are a good measure of the competences I acquired”
Teachers are expected to state clearly, at the beginning of the course, what students should to be able to do at the exam: A good exam may be difficult but it should not be a surprise. As with Q43, 75% of students consider that this is the case. The percentage is stable across study years and sections (see appendix).
Question 44: “The teachers formulate the requirements for their exams clearly”
8.2 ‘Contrôle continu’
Respondents are very much in favor (86%) of intermediate assessment during the semester such as mid-terms or graded assignments. Not only is the rate of agreement higher than for the previous question but the ratio of students who fully agree is much higher, above 50%. The responses are stable over study years and sections (See appendix). The rigor of these assessments, which are not conducted under the same control conditions as exams, is an issue under scrutiny at EPFL. These results encourage EPFL to solve the control issues without eliminating intermediate evaluations.
Question 45: “The continuous assessment and the tests during term help me work regularly”
8.3 Common exams at the ‘propédeutique’ level
Half of our students53 (50%) disagree with the proposal of a common exam in maths and physics at the first year for engineering sections; one-third (31%) agrees and 19% have no opinion. Students had no much information about what this exam would be and hence we have to consider these results with caution. The responses do not change much between cycles (see appendix). We therefore aggregated data for the cross-
52 This is a very high score for SIE students who tend to be more critical than others across the survey. 53 We asked this question to all students but those in maths, physics and architecture
24% 18% 19% 21%
60% 62% 52% 56%
11% 13% 14%
17%
0%
20%
40%
60%
80%
100%
BA2 BA3 MA1 MA2
No opinion
Disagree
Disagree Slightly
Agree slightly
Agree
24% 23% 25% 29%
51% 52% 49% 50%
21% 19% 17% 17%
0%
20%
40%
60%
80%
100%
BA2 BA3 MA1 MA2
No opinion
Disagree
Disagree Slightly
Agree slightly
Agree
56% 61% 54% 50%
34% 24% 30% 35%
0%
20%
40%
60%
80%
100%
BA2 BA3 MA1 MA2
No opinion
Disagree
Disagree Slightly
Agree slightly
Agree

The 2011 EPFL Campus Survey
- 22-
section analysis54. In electrical engineering, a majority of students favor a common exam. The other sections of STI (school of engineering) also have a higher degree of agreement than the rest of EPFL.
Question 46: “In the first year the maths and physics exams should be identical for all engineering sections”
There is no strong correlation55 between the answers of individuals to this question and their answers to Q22 regarding the equilibrium between the section specific courses and the maths/physics courses. Those who would like to reduce the number of courses in maths/physics (left column in figure below) disagree significantly56 more with the idea of a common exam. But the main difference comes from the fact that those who suggest more courses in maths and physics are largely (72%) in favor of a common exam.
Horizontally Q22 (math-physics / section specific) X Vertically Q46 (common exams in maths & physics).
8.4 Exam periods
We asked students if they would prefer to schedule exams after holidays, like in ETHZ, which would spoil their summer break but could increase their chances to pass. The answer is NO at 89%, across study years and sections. We show one graph just for the sake of having some red in this report.
Question 47: “The exams should take place at the end of August and mid-February, just before the beginning
of term (instead of the current periods)”
54 We did not keep responses from 1st year students since the survey was conducted before any exam. 55 Spearman’s Rho = 0.10 ; N = 1837 56 X-SQUARED = 66.4 ; DF=6 ; p<.0001
13% 29%
18% 26% 26% 28% 30% 43%
29% 39%
25%
17% 31% 23% 27% 29% 27% 18%
32% 25% 24%
19% 15% 13% 17% 17% 14% 11% 16% 13%
28% 18% 20% 27% 16% 12% 20% 13% 13% 14%
9% 18% 16% 11% 14% 14% 9% 15% 10% 10%
0% 10% 20% 30% 40% 50% 60% 70% 80% 90%
100%
EL MT GM MX SV SIE CGC SC GC IN
No opinion Agree Agree slightly Disagree Slightly Disagree
40% 31% 19%
31% 30%
9%
14% 18%
11%
15% 21%
61%
0%
20%
40%
60%
80%
100%
More specific courses It's ok More math & phys
Agree
Agree slightly
Disagree Slightly
Disagree
71% 91% 89% 80%
0%
20%
40%
60%
80%
100%
BA2 BA3 MA1 MA2
No opinion
Disagree
Disagree Slightly
Agree slightly
Agree

The 2011 EPFL Campus Survey
- 23-
9 Teaching evaluation
Every EPFL course is evaluated on-line every semester. This system obtains the highest approval rating: 96% agree, 1% disagrees and 3% have no opinion57. This result is constant across study years and sections. This score is useful to defend a system that is under constant attack, but we must be acknowledge that the question was formulated in a very broad way, while the criticisms concern specific points.
Question 48: “I appreciate the opportunity to voice my opinion in the course evaluation”
In 2004, the students also appreciated the teaching evaluation, but, in their open comments, many of them criticized the lack of remediation actions for insufficient courses. In 2011, 79% of the students consider that their opinion is taken into account. This probably over-positive perception is influenced by two factors introduced after 2004: 1) Teachers have to discuss in class the results of the first evaluation; 2) Students understand that a paper-based in-depth evaluation at the end of the semester is the follow-up of an non-sufficient rating on the on-line evaluation. These two steps seem to be visible enough to convince our students about the fact that insufficient courses are followed-up, even if they don’t necessarily know what changes the teacher applied for the next year course.
Question 49: “It is worth the effort of evaluating the courses as my opinion is taken into account”
10 The EPFL system
10.1 Services
Respondents are very positive about the units they interact with: only 3% to 5% disagree with the statement “I feel welcome at the following services”. We have to stress the great improvement of the registrars’ office (SAC): in 2004, 40% criticized it, therefore EPFL created the ‘guichet aux étudiants’. Today, only 4% of the respondents are critical about SAC, despite the fact that it has sometimes to enforce unpopular rules.
57 Master students who did their bachelor outside EPFL had no opportunity to do the teaching evaluation, which occurred after the survey.
84% 78% 79% 79%
12% 19% 16% 17%
0%
50%
100%
BA2 BA3 MA1 MA2
No opinion
Disagree
Disagree Slightly
Agree slightly
Agree
51% 42% 46% 41%
32% 33% 35%
33%
10% 13% 9% 15%
0%
20%
40%
60%
80%
100%
BA2 BA3 MA1 MA2
No opinion
Disagree
Disagree Slightly
Agree slightly
Agree

The 2011 EPFL Campus Survey
- 24-
Questions 79 – 85: “I feel welcome at the following services: …”
The real information in the figure above is the ratio of respondents who have no experience of these services (the rate of non-satisfaction being constant). It is for instance normal that the majority of students have no opinion about the student affairs department, which concerns a minority of them. The ratio of students who ignore the career center decreases with study years, but remains high in the final master year.
Questions 82: “I feel welcome at the following services… The Career Center”
The language center is appreciated by French-speaking students and others:
Questions 83: “I feel welcome at the following services… The Language Center”
Regarding to the sport center, there is only a minor difference between women and men, but this difference is interesting because it does not follow existing clichés: women are slightly more positive than men. The high rate of ‘no opinion’ shows that sport is not prominent at EPFL, and confirms some requests from students (Section 12.5) to develop some sport activities in the middle of the EPFL campus.
51%
25%
37%
10%
28%
57%
40%
24%
14%
17%
9%
20%
23%
20%
21%
58%
42%
78%
47%
15%
35%
0% 10% 20% 30% 40% 50% 60% 70% 80% 90% 100%
The academic service (SAC) and the ‘students service’ counter
The student affairs department (Social and mobility services- SAE)
The section secretariats
The Careers Centre
The Language Centre
The Central Library (at the RLC)
The sports centre
Agree
Agree slightly
Disagree Slightly
Disagree
No opinion
8% 8% 12% 13% 12% 7% 8% 8% 9% 14%
83% 80% 76% 75% 68%
0%
20%
40%
60%
80%
100%
BA1 BA2 BA3 MA1 MA2
No opinion
Disagree
Disagree Slightly
Agree slightly
Agree
26% 34% 20%
20%
50% 38%
0% 20% 40% 60% 80%
100%
French Speaking Non French Speaking
No opinion
Disagree
Disagree Slightly
Agree slightly
Agree

The 2011 EPFL Campus Survey
- 25-
Questions 85: “I feel welcome at the following services… The Sport Center”
10.2 EPFL Web Site We asked students if EPFL web sites provided the information they need for their studies. On average, 72% agree, which is lower than in 2004 (89% agreement). It may be that the level of expectations with respect to on-line information has increased. There are strong variations among sections, which are invited to look at the data in the appendix. In 2004, the survey revealed a demand to have a web site that was more bilingual. Today, there is no difference between the opinion of students who speak French and those who don’t.
Q 21: “The websites of EPFL and of my section allow me to easily find information I need for my studies”
10.3 IT
The majority of the respondents appreciate the 6 aspects of IT we considered through several multiple-choice questions (61-66) and one open question (67).
Questions 61-66: “The IT infrastructure meets my needs … “
The main IT problem today is printing. Not only is this the least positive response on questions 61-66, but it is also a spontaneous complaint of 420 students in the open question. The most frequently cited problems are the number of printers, their maintenance (too many don’t work), their availability all over the campus and the quota of pages per student. The EPFL initiative for ubiquitous printing on campus seems to be too slow to respond their demand.
45% 37%
18% 21%
33% 36%
0%
20%
40%
60%
80%
100%
Women Men
No opinion
Disagree
Disagree Slightly
Agree slightly
Agree
29% 32%
43% 41%
20% 18%
0%
20%
40%
60%
80%
100%
French speaking Other languages
No opinion
Disagree
Disagree Slightly
Agree slightly
Agree
62%
52%
41%
37%
78%
52%
31%
21%
33%
31%
14%
29%
5%
4%
11%
17%
4%
10%
0% 10% 20% 30% 40% 50% 60% 70% 80% 90% 100%
(Q66) IS-Academia allows me to manage my education easily
(Q65)The offer and service of Poseidon
(Q64) The available software
(Q63) For printing documents
(Q62) The wifi network
(Q61) The IT rooms
Agree Agree slightly Disagree Slightly Disagree No opinion

The 2011 EPFL Campus Survey
- 26-
Question 67: “What should the EPFL do to improve its teaching and IT facilities?”
Students like very much the computer labs (81% in Q61) but they ask for more computers per lab and more labs (198 requests in the open question). The two sections that are most negative about their computer labs are PH (23%) and SIE (22%) – see appendix. At the same time, Poseidon (the laptop program) is highly appreciated58 (73%) and the students ask for more electrical plugs in computer labs as well as richer software on their laptops (49 comments in the open question). In summary, students want both: desktops in computer labs and laptops everywhere. The 2004-2009 policy at EPFL has been to reduce computers, unless they fulfilled needs that laptops do not fulfill59. After this decrease, we have probably neglected the fact that a constant number of desktops divided by a growing number of students actually deteriorates the computer-per-student ratio.
In general, the software available at EPFL is appreciated by 74% the respondents. The sections where disagreement is expressed are AR (21%), probably because of Photoshop, and CGC (19%). However, in the open question, students ask for more software, both on desktops (92) and on laptops (49). A frequent concern is Matlab but the decision has recently been taken to buy an EPFL-wide license.
IS Academia60, is appreciated by 93% of the users, probably because of the recent improvement of its interface. The WiFi network is also very much appreciated although 58 students ask for more stability (with Linux) and a broader campus coverage.
Since many teachers put their lecture notes on Moodle, we asked students to evaluate this statement: “I prefer getting one copy of all the documents at the beginning of the semester to having to go online to print a PDF every week”61. The vast majority (81%) prefers to get the standard lecture notes, from the ‘reprographie’ unit, which does not prevent teachers to provide additional resources on-line. In computers science (see appendix), a quarter of the students are nonetheless ready to abandon the ‘polycopié’. These opinions are rather stable across the 3 cycles. One issue behind this point is to know who pays for the lecture notes, the teachers or the students.
10.4 Agepoly
Do students feel that their union, AGEPOLY, represents their interest well? Half of them (50%) responded positively62, one-third has no opinion (34%) and the rest (15%) disagree. The differences across sections reach 20%, with for instance 42% in IN and SC versus 61% in MX (see appendix). Surprisingly, the percentage of students who feel represented by AGEPOLY slightly decreases with study years, which constitutes food for thought for this association.
58 Very few students (5%) dislike it, but surprisingly a quarter of them have no opinion about it, not only in 1st year (25% no opinion) but also at the bachelor cycle (19%) and master (22%). 59Namely the need for high computational power, for specific hardware and for expensive software licences. 60 IS Academia is the system that manages course registrations, grades, timetables, etc. 61 The way this opinion is stated is slightly biased towards continuing to distribute ‘polycopiés’. 62 In 2004, the rate of agreement was 84%, but only two responses were proposed to the same question, yes and no. In 2011, the positive answers represent 77% of those who responded something other that ‘no opinion’.
420
198
118
92
58
49
48
0 50 100 150 200 250 300 350 400 450
More printers, which work, higher printing quota
More computers in computer labs
Upgrade computer labs, with better maintenance
Enrich the software in computer labs (Matlab,…)
More stable wifi (for Linux) all over the campus
Enrich the software available on personal laptops (Matlab,…)
More electrical plugs in computer labs

The 2011 EPFL Campus Survey
- 27-
Question 76: “The AGEPOLY represents my interests as a student well.”
In question 78, we asked students what EPFL should be doing to improve the campus. Many answers concern the freedom left by EPFL (1) to create new associations and (2) overall, for existing associations, to hold more events. There is also a demand for associations devoted to one sport (basketball,…).
10.5 Interlocutors Most students are familiar with their class delegate (85%) and section director (79%), but not necessarily the dean of their school (77%), which is normal. The situation of ‘conseiller aux études’ is more problematic: 57% of students don’t know him or her. The situation was already an issue in 2004, with 34% negative responses, but it has even deteriorated.
Questions 86-89: “Do you know these people …”
The situation varies a lot across sections. We don’t provide these data because they concern individuals, but only the size of variations:
• Two section directors are known by almost all students (92% and 93%) while two others are known by only half of their students.
• Some class delegates are known by most of their peers (97%), but the least known delegates are nonetheless known by two-thirds (67%) of their peer.
• The best /worst sections on the first item (section directors) are also the best/worst sections on the second item (class delegates), which might indicate that the results reflect less the popularity of individuals than the organization of the section.
• The ratio of students who know their ‘conseiller d’études’ ranges from 24% to 57%. • The ratio of students who know their faculty dean vary, per section, from 30% to 70%. Actually,
there are up to 21% differences between sections from the same school for the cases where the dean is predominantly associated with one of the sections in the school.
The numbers above are aggregated over 5 years, but there is fortunately a steady increase of positive responses over study years as illustrated below. The down movement on MA1 is due to the arrival of master students from outside. In appendix, we put the same graph but restricted to the responses “Yes, I have interacted with him/her”).
25% 24% 18% 15% 14%
28% 30% 31%
28% 32%
6% 8% 10% 13% 12%
3% 5% 10% 10% 12%
38% 32% 30% 33% 30%
0% 10% 20% 30% 40% 50% 60% 70% 80% 90%
100%
BA1 BA2 BA3 MA1 MA2
No opinion
Disagree
Disagree Slightly
Agree slightly
Agree
36% 20%
61%
12%
44%
23%
24%
36%
21%
57%
15%
53%
0% 10% 20% 30% 40% 50% 60% 70% 80% 90%
100%
The director of my department (or
his/her co-director)
My study advisor ('conseiller aux
études')
My class delegate ('délégué de classe')
The dean of my faculty
No
Yes, I know him/her, but I have never interacted with him/her
Yes, I have interacted with him/her

The 2011 EPFL Campus Survey
- 28-
Q86-89:“Do you know these people?” (Responses ‘yes but never met him/her’+‘I have interacted with him/her’)
11 Education paths
11.1 Why did they choose EPFL?
The students’ motivations to join EPFL are very similar to those they mentioned in 200463. In the 4 most popular factors, we find the same ones as in 2004 plus one added in 2011, the general interest for science.
Question 1: “Which of these elements had an influence on your decision to enrol at the EPFL?” The results cumulate above 100% since students could select as many answers as they wanted.
There are only few differences between the responses provided by men and those provided by women. Details are in the appendix.
Since students selected several answers, it is interesting to analyze which answers were paired. Concerning their interest for science in general and for their subject of study in particular:
• 22% mentioned their subject of study but not science in general (in blue hereafter) • 23% mentioned science in general but not their subject (in yellow hereafter) • 47% mentioned both science in general and their specific subject (in green hereafter)
63 We do not show quantitative comparison between 2004 and 2010 because in 2011 students provided on average 4.1 answers to this question while in 2004 they were limited to 3 answers.
0%
20%
40%
60%
80%
100%
BA1 BA2 BA3 MA1 MA2
The director of my department (or his/her co-director)
My study advisor
My class delegate
The dean of my faculty
70% 68%
67% 52%
29% 24% 24%
20%
14% 14%
13% 9%
5%
0% 10% 20% 30% 40% 50% 60% 70% 80%
your interest in the subject of your studies (Civil … your interest in science
the reputation of the EPFL the professional perspectives
its international character and the fact that the courses are … it is close to your home
the information days about the school (salons, open days…) your family
the big projects (Alinghi, Solar Impulse,…) your friends
Switzerland’s charm your former professors
the website and social networking sites

The 2011 EPFL Campus Survey
- 29-
Question 1: “Which of these elements had an influence on your decision to enrol at the EPFL?” (expl. above)
The ratio between a general interest for science and a specific interest for the subject they have chosen varies across sections. In the figure above, the sections are sorted from left to right by increasing ratio of students with section-specific motivations versus students with general science motivations. For students in architecture, the architecture-specific motivation is dominating, while for students in physics, the discrimination between these two answers is difficult. But for the other sections, this ratio provides an indication of the identity of students with respect to their domain of study.
Their third-ranked motivational factor is ‘the reputation of EPFL’. Globally, two-third of the respondents (67%) mentioned this choice, compared to only 45%64 in 2004. However, it is almost always chosen in association with other factors: only 1.5% of students selected EPFL’s reputation as their only reason to come. These data vary from below 60% (GM, SIE) to above 70% (IN, SC). These results must be compared to another possible response related to EPFL’s image, the ‘big projects’ such as Alinghi or Solar Impulse: this response has only been selected by 14% of students. This low ratio could be interpreted as an indication that, when students chose the response ‘reputation’, they refer more to the academic excellence than to EPFL’s presence in the media, much related to the ‘big projects’.
Question 1: “Which of these elements had an influence on your decision to enrol at the EPFL?”
Percentage of students who selected the response “the reputation of EPFL”, per section
Their fourth-ranked motivational factor is ‘the professional perspectives’, which was selected by 52% of the students versus 41% in 200465. There are large variations of this percentage across sections, with obviously higher rates for sections that have a strong engineering flavor.
64 But in 2004, they selected fewer responses to the same question. 65 Idem
4% 13% 12% 13% 15% 14% 16% 18% 22% 27% 23% 26%
68% 63% 47% 53% 51% 43% 57% 55% 52% 47% 42% 49% 48%
16% 28%
33% 28% 29% 31%
24% 23% 21% 21% 25% 17% 15% 5%
5% 7% 7% 7% 11% 5% 6% 8% 10% 6% 11% 10% 11%
0% 10% 20% 30% 40% 50% 60% 70% 80% 90%
100%
PH EL MX MT GM SV CGC MA SC SIE IN GC AR
None Science only Both subject and discipline Subject only
58% 59% 62% 63% 66% 66% 68% 69% 70% 71% 72% 74% 78%
0%
20%
40%
60%
80%
100%
GM SIE SV AR MX CGC MA EL GC MT PH IN SC
41% 46% 46% 48% 50% 50% 52% 53% 54% 55% 57% 62% 69%
0%
50%
100%
PH MA AR EL SIE CGC GM SV SC IN GC MT MX

The 2011 EPFL Campus Survey
- 30-
Question 1: “Which of these elements had an influence on your decision to enrol at the EPFL?” Percentage of students who selected the response “the professional perspective”, per section
Another interesting result is that 25% of students selected the response ‘the information days about the school (salons, open days…)’. This can be interpreted as a reward for EPFL’s effort to set up these events. Conversely, the number of students who have been convinced by their former teachers remains very low, 9% (4% in 2004) despite all EPFL efforts to collaborate with secondary schools. In summary, our campaigns seems to have an effect on their first target, future students, but not much through their second target, teachers.
Question 1: “Which of these elements had an influence on your decision to enrol at the EPFL?”
Comparison of responses from master students who did (blue lines) or not (orange) do their BA at EPFL.
The motivations are different for students who joined EPFL at the master level. In the figure above, we compare the factors selected by those who did and those who did not do their bachelor at EPFL. We refer to them respectively as ‘internal’ and ‘newcomers’.
• The reputation of EPFL is the main motivation for 76% for newcomers versus 60% for internals. • The international perspective and the fact that teaching is in English reach 36% for newcomers. This
is twice more than internals (18%), but less than what we could have expected. No student mentioned this motivation as a unique answer.
• The attraction for Switzerland is almost as high (28%) as the international dimension of EPFL. • Our web sites (8%) did not constitute a reason for choosing EPFL. This is less dramatic that it may
seem: it is one way to find information about EPFL, but not a motivation that can be compared to the other criteria.
An open question allowed them to explain why they have chosen their specific section or profession. The 1937 responses partly match the categories analyzed before:
• Their discipline: 1095 students cite their interest for that discipline (which is not really a response since it was the question). Some answer that it was their dream as children (47 responses).
• General interest for science or research: 205 students (only) cite their general interest for science and research, which is a reason to choose EPFL, rather than for choosing among sections.
• 558 students mention job opportunities. • The ‘big projects’ à la Alinghi, again, seem to play a minor motivational role.
0% 10% 20% 30% 40% 50% 60% 70% 80%
the reputation of the EPFL
your interest in the subject of your studies (Civil …
your interest in science
the professional perspectives
its international character and the fact that the …
Switzerland’s charm
the big projects (Alinghi, Solar Impulse,…)
your friends
your former professors
your family
it is close to your home
the website and social networking sites
the information days about the school (salons, open …
BA at EPFL
BA outside EPFL

The 2011 EPFL Campus Survey
- 31-
Question 4. “Why did you choose this subject or profession? “
Beside these reasons, we discover other factors that did not appear in previous analyses:
• Interdisciplinarity is the second most cited motivation. It is a paradox to cite interdisciplinarity as a reason to choose a specific discipline. However, this motivation is mostly cited in sections that embrace more than one discipline: among the 308 respondents, there are 99 AR, 71 MT, 33 SV and 29 MX. This supports the idea of generic bachelors in engineering and sciences.
• ‘Strategic reasons’ refers to a variety of choices made by considering previous studies or further choices such as: “Attiré d'abord par la médecine, j'ai changé d'avis pour me tourner plutôt vers les sciences de la vie qui ouvre de nombreuses portes.”; “Le programme est unique, en Europe comme aux Etats-Unis (d'où je viens).” “It is the perfect tradeoff between something interesting, something to earn money with and something easy.”, “Parce que c'est avant tout une formation de base qui me permet de me lancer dans plusieurs domaines après la fin de mes études”, “Because it was a generalist section/profession. Many doors remain open.” These motivations are very diverse, difficult to summarize, but the breadth of subsequent choices is often cited. The category ‘by eliminating other choices’ refers also to some strategic choice, although not the most interesting one.
• The category ‘societal impact’ refers of course to environmental challenges and energy concerns. Among the 152 responses, 48 are from SIE. But, besides environment, this category also includes respondents who believe their discipline will shape the future: “envie de créer le futur", “Parce que les mathématiques sont à mon sens les choses les plus utiles à la construction du futur.”, “Physic shapes the future, doesn’t it?”, “It is time to build logical framework in social sciences and solve economic crises. We cannot do it without mathematics”, “Le génie civil offre de grandes responsabilités au sein de la société. Cette activité permet de contribuer à la construction et à l'évolution de la société et ceux qui l'exercent ont un rôle de grande envergure.”, “To help people, work in international public health, challenge of the 21st century”.
• ‘My background’ refers to student who did some studies in the same domain before or appreciated this domain when taught at secondary school.
• The ‘legacy’ category refers to students who mentioned a ‘family tradition’ or ‘my father’s job66’.
The section material sciences asked students if their program ‘parrainage des travaux de maturité par des enseignants EPFL’ was known or even influential among students: only 3 students declared this program influenced their choice. The details are in appendix.
To understand the meaning of ‘professional perspective’, the section of mathematics asked students what this would be: 27% of the respondents envisaged theoretical mathematics as their career. The comparison of answers per cycle (see appendix) shows that about 30% of the maths bachelors could be interested by the master in financial engineering or the orientation “Statistics and financial mathematics” in the master in mathematics.
Question 2: Which of these future career options motivated you to enrol in Mathematics? (1 response)
66 Only one student mentions his mother’s job.
1095
308
279
270
205
146
106
91
58
47
34
23
0 200 400 600 800 1000 1200
My interest for this discipline
Pluridisciplinarity
Job opportunities
Strategical reasons
My interest for science and research
Societal impact
My background
The concrete skills to be acquired
By eliminating other choices
The dream of a child
Big' projects
Legacy
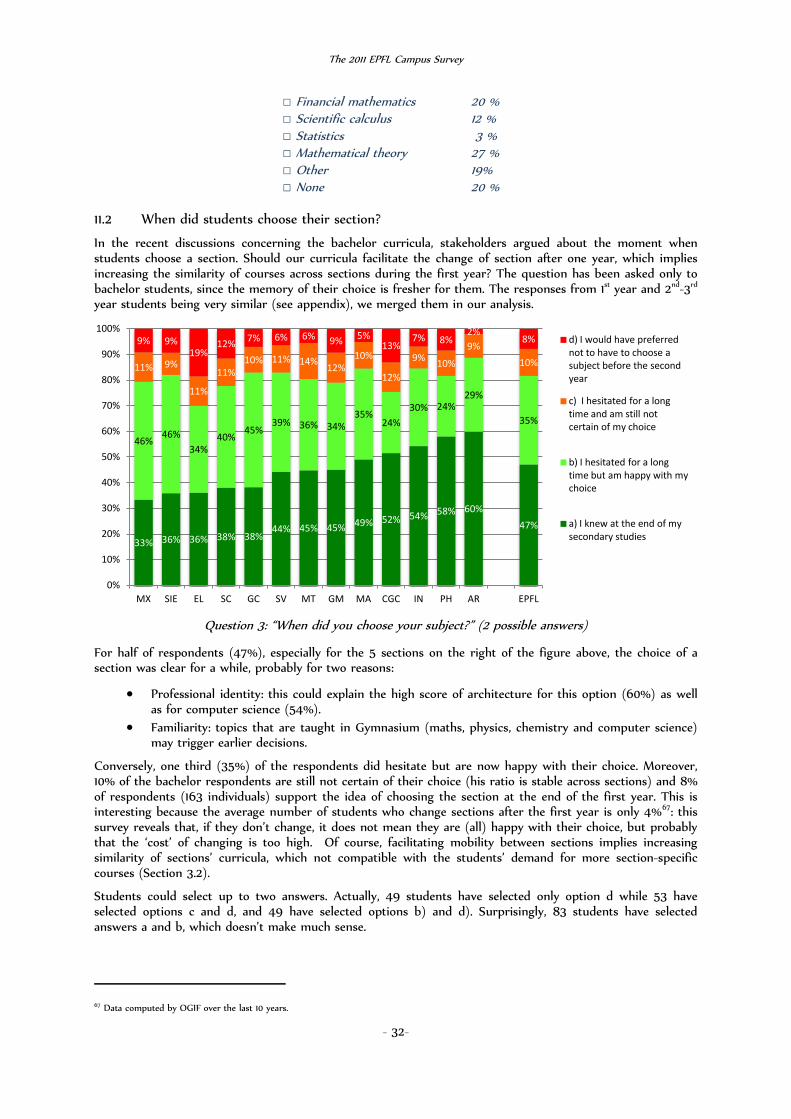
The 2011 EPFL Campus Survey
- 32-
□ Financial mathematics 20 % □ Scientific calculus 12 % □ Statistics 3 % □ Mathematical theory 27 % □ Other 19% □ None 20 %
11.2 When did students choose their section?
In the recent discussions concerning the bachelor curricula, stakeholders argued about the moment when students choose a section. Should our curricula facilitate the change of section after one year, which implies increasing the similarity of courses across sections during the first year? The question has been asked only to bachelor students, since the memory of their choice is fresher for them. The responses from 1st year and 2nd-3rd year students being very similar (see appendix), we merged them in our analysis.
Question 3: “When did you choose your subject?” (2 possible answers)
For half of respondents (47%), especially for the 5 sections on the right of the figure above, the choice of a section was clear for a while, probably for two reasons:
• Professional identity: this could explain the high score of architecture for this option (60%) as well as for computer science (54%).
• Familiarity: topics that are taught in Gymnasium (maths, physics, chemistry and computer science) may trigger earlier decisions.
Conversely, one third (35%) of the respondents did hesitate but are now happy with their choice. Moreover, 10% of the bachelor respondents are still not certain of their choice (his ratio is stable across sections) and 8% of respondents (163 individuals) support the idea of choosing the section at the end of the first year. This is interesting because the average number of students who change sections after the first year is only 4%67: this survey reveals that, if they don’t change, it does not mean they are (all) happy with their choice, but probably that the ‘cost’ of changing is too high. Of course, facilitating mobility between sections implies increasing similarity of sections’ curricula, which not compatible with the students’ demand for more section-specific courses (Section 3.2).
Students could select up to two answers. Actually, 49 students have selected only option d while 53 have selected options c and d, and 49 have selected options b) and d). Surprisingly, 83 students have selected answers a and b, which doesn’t make much sense.
67 Data computed by OGIF over the last 10 years.
33% 36% 36% 38% 38% 44% 45% 45% 49% 52% 54% 58% 60%
47%
46% 46%
34% 40%
45% 39% 36% 34%
35% 24%
30% 24% 29%
35%
11% 9%
11%
11% 10% 11% 14% 12%
10%
12%
9% 10%
9% 10%
9% 9% 19%
12% 7% 6% 6% 9% 5% 13%
7% 8% 2%
8%
0%
10%
20%
30%
40%
50%
60%
70%
80%
90%
100%
MX SIE EL SC GC SV MT GM MA CGC IN PH AR EPFL
d) I would have preferred not to have to choose a subject before the second year
c) I hesitated for a long time and am still not certain of my choice
b) I hesitated for a long time but am happy with my choice
a) I knew at the end of my secondary studies

The 2011 EPFL Campus Survey
- 33-
There is no evidence that hesitating is detrimental to academic performance. We cannot correlate the responses to this anonymous survey with academic grades, but the graph below indicates that students who have failed the first year (and repeated it68) do not express many more hesitations (+3% of student who would have preferred to choose their subject later on).
Responses to “When did you choose your subject?” for students who repeat(ed) or not the propé.
The next figure shows that responses to question 22 “What do you think of the distribution of courses in the first and the second year?” vary with the degree of hesitation: left to right, the more they ‘hesitate’, the more they responded ‘more maths & physics’ to question 22. Those in favor of choosing a section in the second year are the most favorable to ‘more maths’ but are only 12%. However, if we rotate the two axes (next figure), half of those who desire more maths & physics are ‘hesitators’ (responses c and d).
Horizontally, responses to Q3 “When did you choose your subject?” and vertically responses to Q22 “What do
you think of the distribution of courses in the first and the second year? (raw numbers)
68 We do not have the data for students who left EPFL.
46% 50% 47% 48%
34% 30% 36% 37%
12% 9% 11% 7% 8% 11% 6% 9%
0% 10% 20% 30% 40% 50% 60% 70% 80% 90%
100%
No repeating Repeating Have not repeated 1st year
Have repeated 1st year
Propédeutique year Bachelor Cycle
d) I would have preferred not to have to choose a subject before the second year
c) I hesitated for a long time and am still not certain of my choice
b) I hesitated for a long time but am happy with my choice
a) I knew at the end of my secondary studies
292 191 65 44
464 401 96 76
19 18 19 17
0% 10% 20% 30% 40% 50% 60% 70% 80% 90%
100%
a) I knew at the end of my secondary studies
b) I hesitated for a long time but am happy with
my choice
c) I hesitated for a long time and am still not certain of my choice
d) I would have preferred not to have to
choose a subject before the second year
More math & phys
It's ok
More specific courses

The 2011 EPFL Campus Survey
- 34-
Vertically, responses to Q3 “When did you choose your subject?” and horizontally responses to Q22 “What do
you think of the distribution of courses in the first and the second year?” (raw numbers)
11.3 Experience at the CMS
The CMS is a program that prepares students who do not fulfill the conditions for entering EPFL. We asked bachelor students if they agree with “The CMS course prepared me well for the first year at the EPFL”. The response is positive at 60% (47% fully agree + 13% slightly agree). Of course, students who failed to enter EPFL after the CMS were not part of this survey. Swiss students (n=161; 15% unsatisfied) are less satisfied that those from France (n=44, 7% unsatisfied) or from North Africa (n=18; 6% unsatisfied). These students do not have the same conditions for entering EPFL. We don’t further investigate these differences since the rules for entering the CMS have changed while we were conducting this survey.
Question 5: “The CMS prepared me well for the 1st year at EPFL” (raw number of respondents in parentheses)
The bachelor students who have passed through the CMS consider its organization as appropriate, with 56% having positive opinions, 11% negative but again a surprising 33% of student without opinion.
I agree 39% I agree slightly 17% I slightly disagree 6% I disagree 5% No opinion or Not concerned 33% Question 5: “The structure of the CMS (time management, no class from week 8, selection and supervision) is
appropriate to its aim”
11.4 First year on campus
We asked to bachelor students how they experienced their arrival on campus. Their 1319 responses combine positive and negative elements.
292 464 19
191 401
18
65 96
19
44 76 17
0% 10% 20% 30% 40% 50% 60% 70% 80% 90%
100%
More specific courses It's ok More math & phys
d) I would have preferred not to have to choose a subject before the second year c) I hesitated for a long time and am still not certain of my choice b) I hesitated for a long time but am happy with my choice
a) I knew at the end of my secondary studies
72% 64%
36%
17% 14%
12%
6% 16%
38%
0%
20%
40%
60%
80%
100%
North Africa (18) France (44) Suisse (161)
No opinion
Disagree
Disagree Slightly
Agree slightly
Agree

The 2011 EPFL Campus Survey
- 35-
Question 10: “How did your first year at the EPFL go, or how is it going? (welcome/admission, difficulties,….)? “ (Bachelor students only – positive comments in green, negative ones in orange); several possible responses.
We asked the same question to the new master students (who have done their BA elsewhere): their comments are mostly positive, besides the well-known housing problem. A few students mentioned that the welcoming event should be specific to them. We also asked the master students who did their BA at EPFL how they perceive the arrival of new students at the master level. Among the 364 responses, 210 mention that newcomers bring a lot to their master. There are very few complaints (9) or problems.
Question 11: “How did your arrival at the EPFL for the Masters’ studies go? (welcome/admission,
difficulties,…)?” (only for master students who did not do their BA at EPFL)
Question 74: “I feel well integrated in my class” (master students only; raw numbers in parentheses)
Most students (88%) agree with the statement: “I feel well-integrated in my class (Question 74)”. The rate of agreement ranges from 81 to 93% across sections. Of course, master students who did not do their bachelor at EPFL feel less integrated (76%) than those who did their bachelor at EPFL (92%). The sections IN and SC get many master students who did their bachelor outside, which explains a higher rate of disagreement, 16%
39
55
114
180
192
320
333
476
543
0 100 200 300 400 500 600
Polymath/CMS helped me to succeed
Campus is too complex (registrations, locations, printer, is-academia, etc)
I appreciate the support: tutorat, assistants and teachers.
A big ordeal (motivation, stress, competition, overload)
So far, so good (we'll see at exams)
It is challenging, especially maths and physics
It went (very) well no further comments)
It was difficult to adapt to the rythm
Good welcome (coaches, integration day, information)
14
12
22
35
54
115
0 20 40 60 80 100 120 140
Language problems
Challenging start: level of course, lack of pre-requisites,…
Campus is too complex (registrations, locations, printer, …
Housing problems
Good welcome (coaches, integration day, information)
Well or very well (without further comments)
42%
68%
33%
25%
0% 10% 20% 30% 40% 50% 60% 70% 80% 90%
100%
Master students with a BA from outisde (222)
Master students with a BA from EPFL (503)
No opinion
Disagree
Disagree Slightly
Agree slightly
Agree

The 2011 EPFL Campus Survey
- 36-
and 17%. The feeling of integration does not vary along study years, besides the effect of newcomers at MA1: it remains around 90%.
A few weeks before entering the bachelor, students receive by post a book that explains the mathematical skills recommended to succeed their first year at EPFL. We evaluate the impact of this operation with the 2011 freshmen. The goal was that students did the book exercises before the semester: this case for one-third of the respondents (36%), which is not high, but nonetheless rather good since these students have just come back from holidays. Half of the respondents (48%) only browsed through the book, which won’t have any other effect than making them aware that mathematics should be their primary concern. Nonetheless, 27% declared they use it when they need, i.e. as help during their current studies. Only 71 students (11%) declare they never opened the book or did not receive it69, namely in architecture.70
I did not receive it or did not open it 11% I leafed through it without doing the exercises 48% I did the exercises before the beginning of term 36% I use it when I need it 27%
Question 9. “Did you receive a book on Mathematics just before the beginning of term? “ (The sum is above 100% since students could provide up to 2 responses)
We asked 645 students who failed the first year, how they explain their failure. As in 2004, they respond quite honestly: responses that put responsibility on their shoulders (‘not enough work’ =56%; ‘bad organization’ =39%) reach higher scores than responses that partly offload the responsibility from them (‘unlucky’ =9%; ‘not enough feedback’ =5%). The fact that 16% complain they didn’t know the requirements for the exams is a point that can be improved when elaborating the common exams in maths and physics. As in 2004, women refer to insufficient work less often than men (43% versus 62%).
Question 8: “You repeated the first year. What do you think the reason for this is?” (max 2 responses)
The sum is above 100% since students could provide 2 responses
11.5 Bachelor-master transition
What do second- and third-year bachelor students intend to do after their bachelor? Questions about the future need to be treated with more precaution that questions about what they experienced. The gave however some rough indicators:
• 74% intend to stay: they intend to do a master at EPFL in the same section (69%) or in another section (5%). This percentage varies from 53% in SIE to 86% in MX.
• 14% intend to leave: 132 respondents intend to go elsewhere for their master. This percentage varies from 7% in SC and MT to 18% in CGC and SIE and 21% in GM. This ratio is influenced by factors that we analyze below but also by the master degrees offered elsewhere (e.g. there is no SC or MT master elsewhere).
• 12% intend to ‘escape’: 120 respondents have other goals: to enter into professional life (1%), to have a break (7%) or to do something else (5%). This category represents 28% of SIE students.
69 Given the cost per book and the response rate, if they actually received it but did not open it, this represents a waste of about 2’000 CHF per year. 70 The situation is different in architecture where the majority only browsed through the book (60%) or did not open it (13%). Since this is a large section, the book could be distributed on demand to these students: giving to 25% of 400 students would spare about 4'000 CHF per year.
0% 10% 20% 30% 40% 50% 60% 70%
I didn’t work hard enough
I was not able to organise myself
I didn’t have the level
I had personal or financial problems
I didn’t know enough about the requirements for the exams
Other or no opinion
I was unlucky in the exams
I didn’t get enough feedback from the professors / tutors Women Men

The 2011 EPFL Campus Survey
- 37-
Question 91: “After my Bachelors’, I am thinking of…” (raw numbers of respondents)
There is no major difference between the intentions of BA2 and BA3 students, except that those who intend to do their master in another university move from 16% to 11%. These are the same numbers as in 2004 (75%, 16%, 9%). These data would represent about 300 departures per year71. However, the OGIF data72 show that only 8% to 11% actually leave EPFL after their bachelor.
It is risky to use our data to guess what motivates students to leave EPFL, since we did not ask them explicitly. We nonetheless explore 3 factors that may influence their choices.
The first factor that motivates their departure could be that they did not choose the section that, retrospectively, they should have chosen. The figure below relates their response to question 91 (what after the BA?) with question 3 (when did you choose your section?). Not surprisingly, the lowest uncertainty of section choice is expressed by students who intend to continue their master in the same theme as their bachelor. Conversely, the students who had more doubts about their section choice are more willing to move: half of those who will change master within EPFL and one third of those who will do a master elsewhere have expressed doubts about their choice of a section. Let us carefully repeat that a correlation does not necessarily indicate a causal link.
Crossing question 91 (“After my Bachelors’, I am thinking of…”) with question 3 (“When did you choose your
subject?). Numbers indicate raw number of responses.
71 Given the response rate of 44%, the number of students who might leave for a master elsewhere could be 300 and those leaving for something else could be 272. This makes about 600 students, divided by two (we asked to 2nd and 3rd year students), which makes about 300 departures per year. 72 « Tableaux de bord statistiques de la formation », VPAA/OGIF, Novembre 2011
32 53 50 61 28 44 58 75 79 52 49 66 29
5 4 10 3 4 4 7
6 1 3 1
11
19 14 11 5 8 9 16
15
5 8 7
4
11
9 5 6 3 4 5 4
7 2 4 6
0%
10%
20%
30%
40%
50%
60%
70%
80%
90%
100%
SIE GM CGC PH EL MA IN SV AR SC GC MT MX
Doing a Masters’ at the EPFL in the same area Doing a Masters’ at the EPFL in another area
Doing a Masters’ at another university Starting a career
Having a break Other
377
15 61
4 31 23
267
15
42 1 18 18
47
16
30 2 15
9
48
16 22 1 8
2
0%
10%
20%
30%
40%
50%
60%
70%
80%
90%
100%
Doing a Masters’ at the EPFL in the same area
Doing a Masters’ at the EPFL in another area
Doing a Masters’ at another university
Starting a career Having a break Other
I would have preferred not to have to choose a subject before the second year
I hesitated for a long time and am still not certain of my choice
I hesitated for a long time but am happy with my choice
I knew at the end of my secondary studies (A-Levels, high school…)

The 2011 EPFL Campus Survey
- 38-
A second factor for leaving EPFL could simply be that they are not happy with EPFL education. The figure below shows that those who intend to stay have a higher degree of satisfaction that those who intend to leave, the difference being significant73.
Intentions after the bachelor (Q91) crossed with their opinion about the ‘overall quality of education’ (Q51)
A third factor predicting their departure from EPFL could be that they encountered relationship problems, possibly leading to some ill-feeling towards EPFL. The data of some categories are too small to draw conclusions: students who encountered problems are over-represented among those leaving EPFL, but the majority of those who had problems nonetheless intend to stay.
What do students intend to do after the bachelor (Q91) crossed with their relationship problems (Q90). Raw
numbers of respondents.
For the students who intend to do a master at EPFL, there is a huge demand for specialization:
• 60% of students intend to do a specialization (51%) or a minor (9%) in their own section; • 10% of students intend to do a minor in another section; • 1% explicitly rejects any specialization and 30% have no opinion yet.
The large difference of percentage between a specialization and an intra-section minor reflects the current options available for master students but also their culture: we hypothesize that the notion of ‘minor’ is still not fully assimilated.
73 We had to regroup categories to meet the X-squared conditions: X-squared = 42.2473, df = 8, p-value = 1.217e-06
20% 8% 10%
60% 55% 58%
19% 34% 26%
0%
20%
40%
60%
80%
100%
STAY LEAVE ESCAPE
Bad
Good
Very good
Excellent
17 7 5 103
29 31
604 96 84
0%
20%
40%
60%
80%
100%
STAY LEAVE ESCAPE
No Problem
Minor problems
Major problems

The 2011 EPFL Campus Survey
- 39-
Question 92: “If you are thinking of doing a Masters’ at the EPFL, do you plan to choose” (raw numbers)
The bachelor-master transition can also be analyzed from the side of master students. Globally, 88% of the respondents think their bachelor prepared them well for their master. As shown below, 19% of the respondents who did their bachelor elsewhere selected ‘no opinion’ or ‘not concerned’. An hypothesis is that they believed the question was only about the EPFL bachelor. If we remove these ‘no opinion’, the master students coming from outside are as satisfied as the homegrown master students. These opinions are consistent with the performance data: students with a bachelor from EPFL do not succeed better than those with another bachelor: they drop out less often but the time required to finish the master and the average grade are the same74. Concretely, there are between 1 and 6 respondents per section who are not happy with their bachelor75.
Question 7: “The Bachelors’ programme I followed prepared me well for my studies towards a Masters’
degree”
11.6 After the master What the respondents intend to do after their master has not changed much since 2004. About a quarter has not yet decided or want to take a break or do something else. We analyse the data for the main categories: to get a job in a company, to do a PhD or to create a company.
74 Tableaux de bord statistiques de la formation, VPAA/OGIF, Novembre 2011 75 The 6 architecture students who are not satisfied by their bachelor all did their bachelor at EPFL.
38 34 18 31 35 37 32
33 17 34 27
25 47
8
3 2 3 10 5 18 4
5 5
3
7
5 5 6 3
5 6 3
11 8
2
10 1
2
1 1
1 1 33
11 4 10 10 19
10 12 6 20 17
2 18
0%
20%
40%
60%
80%
100%
AR CGC EL GC GM IN MA MT MX PH SC SIE SV
One of the specialisations offered by the department where I will do my Masters’
One of the minors offered by the department where I will do my Masters’
One of the minors offered in another department
Neither minor, nor specialisation
I don’t know
50% 71%
24%
24%
0%
20%
40%
60%
80%
100%
BA out EPFL BA in EPFL
No opinion
Disagree
Disagree Slightly
Agree slightly
Agree

The 2011 EPFL Campus Survey
- 40-
Question 93: “Within 5 years of the end of my Masters, I plan to…” (2 answers possible)
The responses of men and women are rather similar, but fewer women intend to create a company (5% women versus 16% men) and more women hesitate (24% versus 20%).
Gender difference on Q93 “Within 5 years of the end of my Masters, I plan to…”
The majority (62%) aims to join a company (54% in 2004) either in Switzerland or abroad. Half of them (47%) exclusively want to work in Switzerland, 26% only want to work abroad and 27% are open to both national and international jobs. Actually, the ratio of students who want to get a job in Switzerland is stable across sections; what varies is the percentage of respondents ready to leave the country.
Question 93: “Within 5 years of the end of my Masters’ I plan to… “
If they selected ‘working in a company’, where do they intend to work?
The ratio of students who want to work in Switzerland or abroad is the same for men and women. What is interesting is that the intention to stay in Switzerland does not reflect some attachment to home that would be influence the choice of Swiss students, but it actually concerns all students:
51%
36%
26%
21%
13%
7%
3%
0% 10% 20% 30% 40% 50% 60%
Work for a company in Switzerland
Work for a company outside of Switzerland
Do a phD
I’m not sure
Create a start-up / work independently
Have a break
Other
23%
52%
39%
6% 7%
24%
3%
27%
50%
35%
16%
7%
20%
3%
0%
10%
20%
30%
40%
50%
60%
Write a thesis Work for a company in Switzerland
Work for a company outside of
Switzerland
Create a start-up / work
independently
Have a break I’m not sure Other
Women Men
0%
20%
40%
60%
80%
100%
SV PH MX SIE SC EL GM MT IN CGC AR MA GC
none
Abroad
Both
In Switzerland

The 2011 EPFL Campus Survey
- 41-
Question 93: “Within 5 years of the end of my Masters’ I plan to…”
If they selected ‘working in a company’, where do they intend to work?
With respect to these jobs, 13% of the respondents have ‘very little’ idea of the career opportunities in their field. The percentage of those who know these opportunities ‘quite well’ is 37% at BA1, but it does not go higher than 51% at MA2, just before leaving the school.
Question 94: “Do you know the different career opportunities for graduates in your field?”
Back to the other responses to question 83, the ratio of respondents intending to do a PhD is 26%, versus 21% in 2004, but this average hides very different realities across sections. The ratio of students who actually decide to do a PhD at EPFL is 17%76. The difference of 10% includes those who do a PhD elsewhere, those who are not accepted by the doctoral school and those who change their mind. Actually, 50% of the students who responded ‘doing a PhD’ also selected ‘working for a company’ (18% in Switzerland and 32% abroad).
The ratio of potential PhD students is 23% among women and 27% among men. If we consider only master students, the ratio is 29% of the internal masters and 44% for those who joined EPFL at the master level. In some sections, the majority of external masters aim to do a PhD: 73% in CGC, 75% in PH and 79% in MX. Recruiting master students could mean recruiting PhD students. However, actual data show this is not the case: only 16% of new masters end up doing a PhD versus 17% for masters with an EPFL bachelor. This huge difference may be explained by the delay: data from actual choices concern students from 2007-2009 (since it takes a few years to see if they are accepted at the doctoral level). It may be that the situation has evolved in 2 years, but not that much.
Question 93: “Within 5 years of the end of my Masters’ I plan to…”
76 « Tableaux de bord statistiques de la formation », VPAA/OGIF, Novembre 2011
22% 37% 24%
22% 18%
19%
27% 13% 23%
29% 32% 34%
0%
20%
40%
60%
80%
100%
French students Swiss students Oher students
None
Outside Switzerland
Both
In Switzerland
16% 25% 25% 29% 31% 32% 37% 39% 43% 43% 47% 47% 62%
63% 55% 56% 59% 62% 58% 48% 50% 44% 49% 44% 43% 32%
0%
20%
40%
60%
80%
100%
SV PH SIE MX SC MA EL IN GM MT CGC GC AR
Yes, quite well Vaguely Very little
8% 11% 12% 13% 13% 21%
25% 25% 30% 32%
41% 44%
59%
0%
10%
20%
30%
40%
50%
60%
70%
AR (24) GC (21) SC (17) SIE (22) GM (25) IN(56) MT (50) EL (30) MX (31) MA (58) CGC (65) SV (113) PH(145)

The 2011 EPFL Campus Survey
- 42-
Ratio of students who responded ‘to do a PhD’. Raw numbers of responses ‘to do a PhD’ in parentheses.
Creating a company is the aim of 13% of our respondents, versus 9% in 2004. In 2004, this ratio was going down from 16% to 4% from the beginning to the end of their studies. In 2011, this ratio is still 14% in the last year, when students have a better grasp of what it means to create a company. The ratio varies across sections, 3 sections are above 20%. The notion of start-up is of course not the same across sections, for instance this question has a special meaning for architects. Only 6% of the women who responded (46 persons) intend to create a company while 16% of the men do (288 persons). These intentions are rather similar for Swiss students (13%), French students (11%) and the other nationalities (15%). These students could select two answers. Among those who wanted to create a company, 9% also consider doing a PhD elsewhere and 20% consider entering a company. Of course, there is a long road from the intention to create a company to the actual creation of it. However even if only a part of the 324 respondents who intend to create a company do so, this may still lead to the birth of dozen of companies.
Question 93: “Within 5 years of the end of my Masters’ I plan to…”
Ratio of students who responded ‘to create a start-up / work independently’. (raw numbers in parentheses)
12 Campus
12.1 Teaching rooms
The majority of students consider the various teaching rooms as appropriate. The rate of satisfaction varies mostly with the rate of ‘no opinion’ while the rate of unsatisfied students ranges between 6% for small teaching rooms to 18% for large rooms. The rate of satisfaction is stable across sections. Basically, only the rate of ‘no opinion’ varies, for instance mathematicians having no practical work in labs.
Questions 56 – 60: “The teaching facilities are adequate for teaching”
What is more interesting is the comparison between cycles. This data confirm the fact that large lecture rooms, including auditoriums, are somewhat problematic, but reveal that it is not only the case at the ‘propédeutique’ but even more at the bachelor and master levels.
4% 4% 5% 7% 8% 10% 11%
13% 15% 18% 20% 21%
24%
0% 5%
10% 15% 20% 25% 30% 35% 40%
SIE (7) GC (8) CGC (89 MA (13) PH (19) SV (26) MX (11) EL (16) GM (29) AR (58) IN(51) MT(43) SC (35)
41%
51%
49%
37%
44%
24%
34%
25%
30%
35%
8%
9%
5%
13%
14%
23%
3%
21%
16%
3%
0% 10% 20% 30% 40% 50% 60% 70% 80% 90% 100%
(Q60) … the laboratory and practical work
(Q59) … the exercises
(Q58) … small classes (< 50 students)
(Q57) … big classes (> 50 students)
(Q56) … courses in an auditorium (>100 students)
Agree Agree slightly Disagree Slightly Disagree No opinion
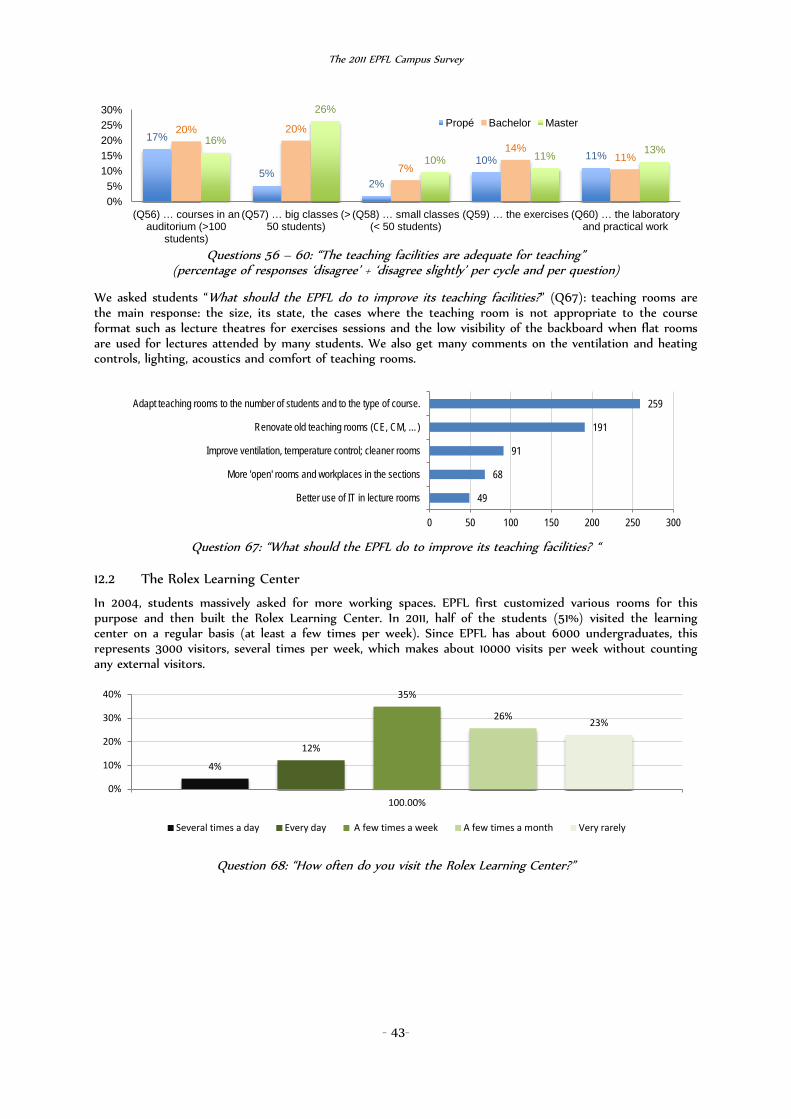
The 2011 EPFL Campus Survey
- 43-
Questions 56 – 60: “The teaching facilities are adequate for teaching”
(percentage of responses ‘disagree’ + ‘disagree slightly’ per cycle and per question)
We asked students “What should the EPFL do to improve its teaching facilities?” (Q67): teaching rooms are the main response: the size, its state, the cases where the teaching room is not appropriate to the course format such as lecture theatres for exercises sessions and the low visibility of the backboard when flat rooms are used for lectures attended by many students. We also get many comments on the ventilation and heating controls, lighting, acoustics and comfort of teaching rooms.
Question 67: “What should the EPFL do to improve its teaching facilities? “
12.2 The Rolex Learning Center
In 2004, students massively asked for more working spaces. EPFL first customized various rooms for this purpose and then built the Rolex Learning Center. In 2011, half of the students (51%) visited the learning center on a regular basis (at least a few times per week). Since EPFL has about 6000 undergraduates, this represents 3000 visitors, several times per week, which makes about 10000 visits per week without counting any external visitors.
Question 68: “How often do you visit the Rolex Learning Center?”
17%
5% 2%
10% 11%
20% 20%
7%
14% 11%
16%
26%
10% 11% 13%
0% 5%
10% 15% 20% 25% 30%
(Q56) … courses in an auditorium (>100
students)
(Q57) … big classes (> 50 students)
(Q58) … small classes (< 50 students)
(Q59) … the exercises (Q60) … the laboratory and practical work
Propé Bachelor Master
49
68
91
191
259
0 50 100 150 200 250 300
Better use of IT in lecture rooms
More 'open' rooms and workplaces in the sections
Improve ventilation, temperature control; cleaner rooms
Renovate old teaching rooms (CE, CM, …)
Adapt teaching rooms to the number of students and to the type of course.
4%
12%
35%
26% 23%
0%
10%
20%
30%
40%
100.00%
Several times a day Every day A few times a week A few times a month Very rarely

The 2011 EPFL Campus Survey
- 44-
Question 68: “How often do you visit the Rolex Learning Center?”
The percentage of regular visitors ranges from 33% to 64% across sections. The least frequent visitors are students in architecture, with only 33% regular visitors. The explanation is not some kind of corporate jealousy but the fact that students in architecture spend many hours in their workshops. The differences between sections cannot be explained by the distance from their home base and the RLC: for instance sections such as IN and SC that share the same building on the west end of the campus nonetheless have different ratios of regular visitors: 48% in IN and 60% in SC. Differences are partly due to the constraints of the curriculum, i.e. how many hours per week students have no course. However, within the same section/curriculum, we find both frequent and rare visitors. Hence, the main factor probably is social: friends tend to work in the same place.
First-year students visit more often the RLC, with 69% of them being regular visitors, more than other bachelors (45%) and master students (38%). Of course, master students are less often on campus since they do both an internship and a master thesis.77
Question 68: How often do you visit the Rolex Learning Center?
There is relationship78 between their declared working load (Q42) and the frequency of their visits, as illustrated below, even though we did not ask them how long they usually stay at the RLC per visit79.
77 Students who do their master thesis at EPFL usually get a working space within a lab. 78 A correlation between A and B does not imply a causal link between A and B or B and A. 79 We should have asked this question.
2% 9% 11%
13% 9%
17% 15% 12% 15% 9% 13% 16%
17% 31% 26% 28%
30% 37% 28% 30% 43%
43% 45% 45% 43% 35%
39% 28% 20% 25% 30% 26% 31% 30% 21% 17% 20% 20% 20%
27% 35% 39% 28% 21% 24% 18% 16% 19% 23% 17% 16% 16%
0% 10% 20% 30% 40% 50% 60% 70% 80% 90%
100%
AR CGC SIE IN MT MA SV MX EL SC PH GC GM
Several times a day Every day A few times a week A few times a month Very rarely
17% 10% 9%
46%
32% 26%
21%
29% 27%
10% 26% 35%
0%
20%
40%
60%
80%
100%
Propé Bachelor Master
Very rarely
A few times a month
A few times a week
Every day
Several times a day

The 2011 EPFL Campus Survey
- 45-
Relationship between the number of working hours per week (vertically) and frequency of RLC visits
(horizontally).
Why do they come to the RLC? More precisely, we asked “I mainly visit the RLC for…”. They could choose 3 answers among the 6 propositions80. Three of them are reasons to go to the learning center, but not to stay there for long:
• The bookshop81 is cited by 58% of the students as one of their reasons to go to the RLC, more often than the restaurants. This response is even selected by 65% for students who visit the RLC only a few times per month and 72% of those who go rarely there. For 241 students (9% of the respondents), it is even the only reason for visiting the RLC !
• The career centre has only been selected by 11 students (0.4%), which is normal: even if students take appointment at this centre, they are not supposed to visit it on a regular basis.
• Access to the bank was cited by 3%, as one of their ‘main’ reasons82.
The other answers are reasons to stay longer at the RLC: the library, the food places and the open spaces where students use the large cushions. The library is mostly a working space83, the café and restaurants as leisure places and the other spaces as mixed-function areas. A useful result is to know is that 28% of the RLC visitors84 do not come for work.
Question 70: “I mainly visit the RLC for…”
(The sum is above 100% since students could provide multiple responses) The next figure reveals that patterns of usage vary according to the frequency of visits:
• Surprisingly, 13% of the respondents (in black in the figure below) have chosen none of these 3 responses: they come to the RLC neither for the library, nor for eating, nor for relaxing. Most of them belong to the category that does not often visit the RLC.
• One third (32%) comes for the library and for nothing else, neither food, nor relaxing. This percentage decreases with frequency of visits, but still a quarter of daily visitors only come for working.
• Only 5% of students come only for the bar and restaurants. • Only 3% cite the open spaces without citing also the library or the restaurants.
80 ‘The meeting rooms (‘bubbles’)’ was not proposed as a response. This was a mistake. 81 This shop sells not only books but also non-paper products and complements the ‘Négoce’, the two only shops in a city of 12000 people, until the opening of the new convention center. 82 Before the opening of the conference center, this is one of the 2 points on campus with cash machines. 83 The round tables are not exclusively used for work: students do also read novels, play computer games or watch movies, skype…. 84 Still talking only about our students.
51.5
52.5 51.8
52.9
55.3
49.0
50.0
51.0
52.0
53.0
54.0
55.0
56.0
Very rarely A few times a month A few times a week Every day Several times a day
72% 58%
35% 36%
0%
20%
40%
60%
80%
The library The book shop The café and restaurant The open spaces (where you can lie on the cushions)

The 2011 EPFL Campus Survey
- 46-
• The more often students come to the RLC, the more they combine the 3 functions, work, food and relaxation.
Question 70: “I mainly visit the RLC for…” Reponses patterns according to the frequency of visits to the RLC
The pattern of usage is not the same for every cycle: the RLC appears more as a working space for the master students and as a social space for the first year bachelor students.
Question 70: “I mainly visit the RLC for… Reponses patterns according to the cycle”
About half of the respondents encounter occasional (34%) or frequent (21%) seating difficulties. The RLC is often fully occupied. The space problem is confirmed by their responses to the two open questions that allowed students to report what they like (1818 responses!) and what they dislike (1673 responses!) about the RLC. On the negative side, about half of the criticisms concern the space issue (598 comments) and its possible cause, i.e. the number of non-EPFL students and visitors (354 comments). Over 300 students pointed out the need to improve restaurant and cafe services, especially the price (which is perceived to be higher than elsewhere on campus) and the quality, politeness and speed of food service. Noise is a concern for 204 students85. The criticisms also include comments on the cost of the building and on the centralization of libraries.
85 As an anecdote, I liked this one: “I prefer to work outside of the library as there is "too much" silence in the library. I need a minimum level of noise to be able to concentrate.”
1% 5% 12% 18% 26%
36%
36%
27% 28% 22%
0% 10% 20% 30% 40% 50% 60% 70% 80% 90%
100%
Very rarely A few times a month A few times a week Every day Several times a day
ALL Food only Food and Open Space Library & Food
Open Space only Library & Open Space Library only None
13% 6% 8%
15% 17% 12%
20%
35% 41%
0%
10%
20%
30%
40%
50%
60%
70%
80%
90%
100%
Propé Bachelor Master
ALL Food only Food and Open Space Library & Food Open Space only Library & Open Space Library only None

The 2011 EPFL Campus Survey
- 47-
Question 69: “Does it ever happen that you cannot find a place to work at?”
On the positive side, several points actually correspond to the very idea of the RLC (openness, opening on week-ends, all-in-one-place,… ) and to the architectural choices (bright, calm, pleasant,…). As one student wrote, “On s'y sent tout simplement bien pour travailler”. The availability of bean bags (‘poufs’) is stressed by 383 students.
In summary, the RLC is victim of its own success: besides the usual criticisms on the RLC as a symbol, the main criticism is the lack of space.
Q72: “What could be done to improve the Rolex Learning Centre?” (A response may belong to several
categories)
17%
28% 34%
21%
0%
10%
20%
30%
40%
Never Rarely Sometimes Often
95
96
100
101
101
113
114
128
129
151
204
354
598
0 100 200 300 400 500 600 700
Increase/ improve group spaces (soundproof bubbles)
Change configuration or restrict access at peak study …
Increase eating space and facilities (microwaves, taps)
Reduce food prices
Improve layout (external surface, access from outside …
More (less fragile) plug points, printers, and PCs
Improve quality, politeness and speed of food service
Improve maintenance, cleaning and heating/ ventilation
More poufs/social spaces
Segregate spaces more (offices from library, food …
Reduce noise
Limit access for non EPFL students, for those who take …
Increase and improve workspaces/ Use space optimally

The 2011 EPFL Campus Survey
- 48-
Q73. “What could be done to improve the Rolex Learning Centre?” (A response may belong to several
categories)
12.3 Safety
The respondents agree massively (97%) with “I feel safe on the EPFL campus at day- and night time (Q73)”, both men and women. We also asked if they encountered problems with some staff members:
Question 90: Have you experienced problems with any staff members? (teachers, administrative personnel, technicians, security personnel, ...) ?
Yes, serious problems. Yes, but not serious problems. No
Two percent of respondents encountered serious problems and 15% minor problems. The 2% represent 56 students, with the same ratio of men and women as among all respondents. More surprising, 18 of these 56 cases are reported by architecture students. Architects are also over-represented among those expressing moderate problems. There is a need to look more closely at these results.
These relationship problems do not generate a feeling of insecurity (Q73): only 3 of the 56 who report serious problems and 13 of those expressing moderate problems said they don’t feel safe on campus. Even if they represent less than 1% of our respondents, these are nonetheless 16 persons who must have encountered a bad experience on campus. Half of those who report minor or moderate problems (respectively 50% and 52% of them), replied ‘no opinion or not concerned’ when we asked if they feel welcome in the ‘service des affaires estudiantines (SAE)’. There is certainly more promotion to be done there. Those who have expressed serious/moderate relationship problems and have an opinion are positive about the SAE (respectively 79% and 89%), which is great. However, in terms of persons, this leaves 27 students who both faced relationship problems and probably did not find any support.
12.4 Social Life
Respondents agree (85%) with the statement: “I value campus life (participating in clubs / societies, shows, social events)”. Women (90%) are more positive than men (83%). Surprisingly, the degree of satisfaction decreases with progression through their studies, as illustrated below, even if the lowest remains at 80%.
73
74
116
135
180
215
255
332
355
383
407
529
0 100 200 300 400 500 600 700
Good bookshop
Good to have power outlets, printing facilities and computer …
Convenience of having all you need in same space
Good eating facilities, good food quality, open at weekends
Pleasant, warm and welcoming ambiance
Nothing much
Good library facilities, staff and range of resorces
Good sense of quiet and calm
Brightness, openness, space and view
Valuable space for relaxation (with poufs)
Attractive architecture and design
Good range of work space and work ambiance

The 2011 EPFL Campus Survey
- 49-
Question 75: “I value campus life (participating in clubs/ societies, shows, social events).”
What they like to do or would like to add to their campus life is pretty standard: drinks (81%), sports (65%) and music (46%) have their preference, followed by more cultural activities. Students could select as many responses as they wanted: on average they gave 3 to 4 answers and 100 students simply selected all answers. The students who do not feel well integrated on campus (i.e. negative response on Q77) have demands similar to those who feel integrated (see appendix). The students could also suggest new activities (Q 78), their responses are detailed in the next section.
Question 77: “Which activities (would) make you stay on campus after your courses have finished?86”
12.5 How to improve the campus?
Their main request for improvement concerns shops and restaurants. About shops, they simply ask more of them, all over the campus (new shops will be in the convention center). About restaurants, students suggest:
• Adding more seats or creating more restaurants (to reduce waiting time). Some students suggest adapting course timetables to avoid the 12:15 rush for food.
• Extending the open hours in the evening and week-ends (they specifx ‘not only at RLC’) • Cheaper meals and drinks • Supermarket • Installing many microwave ovens, or even mini-kitchens.
These requests are more or less the same as in 2004, despite all changes made since then to match their expectations. One explanation could be that the improvement of food capacities has been ‘neutralized’ by the increase of the number of students.
86 The same comment from a student may belong to several categories.
61% 62% 57% 49% 46%
27% 27% 27% 31% 34%
0%
20%
40%
60%
80%
100%
BA1 BA2 BA3 MA1 MA2
No opinion
Disagree
Disagree Slightly
Agree slightly
Agree
2094
1682
1200
1147
835
781
623
421
313
0 500 1000 1500 2000 2500
Having a drink with friends
Sports
Listening to a concert
Listening to a conference with an external speaker
Taking part in activities organised by clubs/ associations
Watching a film at the cinema
Watching a play at the theatre
Taking part in debates
Other (please mention in the following question

The 2011 EPFL Campus Survey
- 50-
Question 78: “What could be improved on the EPFL campus?”
The ‘maintenance /renovation’ issues mostly suggest that EPFL should not neglect its older buildings (CE, CM,…), for instance by refreshing the paintings, improving the ventilation in toilets, etc. What are their other suggestions?
• The most frequent comment is that the bar ‘Satellite’ is too small. Students ask for a larger Satellite or a second Satellite elsewhere on campus.
• More relaxation spaces: many students ask for sofas where they can relax and sleep: ‘canapé’ is the second most frequent word after ‘Satellite’.
• More events: many aggressive comments concern the current limitation of the number of events that can be organized on campus (3 per week), divided by the number of associations, makes it very hard to set up events. The possibility to finish events much later and to set up a shuttle after M2 closing time is often mentioned.
• More music: places to play music and places to participate into music events. • More sport: students ask to create sport facilities in the EPFL campus, duplicating those in the sport
center. The most cited ones are a climbing wall and a swimming pool. • More seminars: students ask why they are not informed of the talks given by visitors. • Security: students concerned by security simply ask for more light on campus, as in 2004, as well as
secure place to park bicycles. There are also voices that complain about the presence and behavior of private security guards: ‘Reprenez en main vos sécuritas’.
0 50 100 150 200 250 300 350 400 450
Better restaurants & shops
Better spaces for relaxation and animation
Better maintenance and renovation of campus area
Mobility and parking
Better working spaces
More sport & leisure
More green space, sustainable campus
More housing ON campus

- 51-
The Questionnaire
Since the questions in English are mentionned in the report, we present here the questions in French. Students could choose the language.

- 52-
Chapitre 1 : Vos débuts à l’EPFL (2-12 questions)
1. Quels éléments ont influencé votre décision d’entrer à l’EPFL ? (plusieurs choix possibles)
☐ votre intérêt pour les matières scientifiques ☐ l’intérêt pour la branche choisie (génie civil, chimie…) ☐ l’attrait de la Suisse ☐ la notoriété de l’EPFL ☐ les grands projets (Alinghi, Solar Impulse,…) ☐ vos amis ☐ votre famille ☐ vos professeurs précédents ☐ la proximité de votre domicile ☐ les perspectives professionnelles ☐ le caractère international et le bilinguisme français-anglais des cours ☐ les journées d’information sur l’école (salons, journées de visite sur le campus…) ☐ le site web et les réseaux sociaux
2. Quel débouché professionnel a motivé votre inscription en mathématiques? (1 ! réponse, uniquement pour les étudiants en maths) □ Aucun □ Les mathématiques financières □ Le calcul scientifique □ Les statistiques □ Les mathématiques théoriques □ Autre 3. A quel moment avez-vous choisi votre section ? (2 réponses possibles, seul ét. Bachelor)
☐ Le choix était clair à la fin de mes études secondaires (gymnase, lycée,…) ☐ J’ai longtemps hésité mais je suis content(e) de mon choix ☐ J’ai longtemps hésité et je ne suis toujours pas sûr(e) de mon choix. ☐ J’aurais préféré ne pas devoir choisir une section avant la deuxième année
4. Pourquoi avez-vous choisi cette section ou cette profession ?

- 53-
Pas d
’acc
ord
Plut
ôt
pas
d’ac
cord
Plut
ôt d
’acc
ord
D’ac
cord
Pas
d’av
is ou
pa
s con
cern
é
5 LE CMS m’a bien préparé(e) à la première année de l’EPFL seulement les étudiants bachelors qui sont passés au CMS
☐ ☐ ☐ ☐ ☐
6 La structure du CMS (déroulement temporel, congé de la semaine 8, contrôles et sélection) est adaptée à sa mission seulement les étudiants bachelors qui sont passés au CMS
☐ ☐ ☐ ☐ ☐
7 La formation que j’ai suivie au bachelor m’a bien préparé(e) à mes études au niveau master seulement étudiants masters
☐ ☐ ☐ ☐ ☐
8. Vous avez redoublé la première année. A quoi en attribuez vous la cause ? (maximum 2 choix possibles) (seulement pour redoublants )
☐ Je n’avais pas le niveau ☐ Je n’ai pas assez travaillé ☐ Je n’ai pas su m’organiser ☐ J’ai manqué de feedback des enseignants ☐ Je connaissais mal les exigences des examens ☐ Je n’ai pas eu de chance aux examens ☐ J’ai eu des problèmes familiaux, personnels ou financiers ☐ Autre ou sans avis
9. Juste avant la rentrée, vous avez reçu un livre de math. ? (max 2 choix possibles) (seul pour étudiants de première année qui ne sont pas redoublants) ☐ Je ne l’ai pas reçu ou je ne l’ai pas ouvert ☐ Je l’ai parcouru sans faire les exercices ☐ J’ai fait des exercices avant la rentrée ☐ Je l’utilise quand j’en ai besoin

- 54-
10. Comment se passe ou s’est passée votre première année à l’EPFL (accueil, difficultés,….)? seulement étudiants. bachelors 11. Comment se passe ou s’est passée votre arrivée au master à l’EPFL (accueil, difficultés,…)? seulement étudiants. masters externes 12. Comment ressentez-vous l’arrivée au master d’étudiant(e)s qui n’ont pas fait leur bachelor à l’EPFL ? seulement étudiants Masters internes 13. Avez-vous entendu parler du parrainage des travaux de maturité par les enseignants de matériaux ? 1 ! choix possible, seulement étudiants BA en matériaux
☐ Non, je n’en ai pas entendu parler ☐ Oui, par d’autres personnes et cela a influencé mon choix ☐ Oui, j’ai personellement bénéficié de ce parrainage et cela a influencé mon choix. ☐ Oui, personnellement ou indirectement, mais cela n’a pas influencé mon choix

- 55-
Chapitre 2: Votre programme de formation (11-16 questions)
Pas d
’acc
ord
Plut
ôt p
as
d’ac
cord
Plut
ôt
d’ac
cord
D’ac
cord
Pas d
’avi
s ou
pa
s con
cern
é
14 Mon programme de formation correspond à mes attentes ☐ ☐ ☐ ☐ ☐
15 Le stage en milieu professionnel a été ou sera utile à mon insertion professionnelle ☐ ☐ ☐ ☐ ☐
16 J’apprécie les cours SHS ☐ ☐ ☐ ☐ ☐
17 J’apprécie le « cours ENAC » seulement étudiants ENAC ☐ ☐ ☐ ☐ ☐
18 Le projet “ITP” en 1ère année est utile pour ma formation seulement étudiants I&C ☐ ☐ ☐ ☐ ☐
19 Je comprends bien l’organisation du plan d’études et les conditions de réussite ☐ ☐ ☐ ☐ ☐
20 Une présentation vidéo des cours à option serait suffisante pour choisir mes cours avant la rentrée ☐ ☐ ☐ ☐ ☐
21 Les sites WEB de l’EPFL et de ma section me permettent de trouver aisément les informations utiles pour ma formation
☐ ☐ ☐ ☐ ☐
22 Comment jugez-vous la répartition des cours en 1ère et 2ème année? 1 seule réponse, Tous sauf étudiants de maths et phys
☐ J’aurais préféré davantage de cours spécifiques à ma section et moins de cours de maths/physique ☐ C’est bien équilibré ☐ J’aurais préféré moins de cours spécifiques à ma section et davantage de cours de maths/physique

- 56-
23. Si vous avez choisi « davantage de maths /phyique » à la question précédente, quels cours déplaceriez vous en 2ème ou 3ème année ?Tous sauf étudiants de math et phys
24. Pour l’année académique en cours, que pensez-vous du rapport entre le nombre de cours obligatoires et le nombre de cours à option? 1 ! réponse
☐ Trop de cours obligatoires ☐ C’est bien équilibré ☐ Trop de cours à options ☐ Ne suis pas concerné 25. Les deux premières années du bachelor en chimie forment un tronc commun. La troisième année comporte une orientation vers la chimie ou le génie chimique : 1 ! réponse Uniquement pour les étudiants en chime
□ L’orientation devrait intervenir plus tôt □ Cette organisation est adéquate □ L’orientation devrait intervenir plus tard 26. Quelles sont les forces et faiblesses que vous constatez dans votre master ? (uniquement pour les éudiantst en master de chimie )

- 57-
Chapitre 3: Le format des cours (8-9 questions)
Pas d
’acc
ord
Plut
ôt p
as
d’ac
cord
Plut
ôt d
’acc
ord
D’ac
cord
Pas d
’avi
s ou
pa
s con
cern
é
27 J’apprécie les cours ex-cathedra ☐ ☐ ☐ ☐ ☐
28 Les exercices m’aident à assimiler la matière du cours ☐ ☐ ☐ ☐ ☐
29 Le nombre de travaux pratiques et laboratoires dans ma section est suffisant ☐ ☐ ☐ ☐ ☐
30 Les travaux pratiques et laboratoires me permettent de faire le lien entre théorie et pratique
☐ ☐ ☐ ☐ ☐
31 J’apprécie les cours qui comportent un projet ☐ ☐ ☐ ☐ ☐
32 J’apprécie les projets de semestre (seulement étudiants étudiants de 3ème bachelor ou master) ☐ ☐ ☐ ☐ ☐
33 Je préfère un polycopié en début de semestre plutôt que des documents PDF à imprimer en ligne chaque semaine
☐ ☐ ☐ ☐ ☐
34. A contenu équivalent, je préfèrerais suivre 1 ! réponse
☐ 3 cours de 2 crédits chacun ☐ 2 cours à 3 crédits chacun ☐ 1 cours à 6 crédits
35. La langue d’enseignement nuit-elle à votre compréhension de cours ? (plusieurs réponses possibles) ☐ Non ☐ Oui j’ai des difficultés à comprendre le français ☐ Oui j’ai des difficultés à comprendre l’anglais. ☐ Le français utilisé par certains enseignants est difficile à comprendre ☐ L’anglais utilisé par certains enseignants est difficile à comprendre

- 58-
Chapitre 4: L’encadrement (5 – 7 questions)
Pas d
’acc
ord
Plut
ôt
pas
d’ac
cord
Pl
utôt
d’a
ccor
d
D’ac
cord
Pas
d’av
is ou
pa
s con
cern
é
36 Le nombre d’assistants pour les exercices est adapté aux nombre d’étudiants présents ☐ ☐ ☐ ☐ ☐ 37 Les assistants m’ont aidé à comprendre la matière du cours ☐ ☐ ☐ ☐ ☐
SI vous avez participé au tutorat en première année (seulement étudiants bachelors
38 Le tutorat contribue à une meilleure compréhension des exercices. ☐ ☐ ☐ ☐ ☐ 39 Le tutorat m’incite ou m’a incité à venir aux séances d’exercices ☐ ☐ ☐ ☐ ☐
SI vous avez participé au tutorat en tant que tuteur ou si vous avez été assistant-étudiant (seulement étudiants de 3ème et au-delà )
40 J’ai apprécié mon rôle de tuteur ou d’assistant ☐ ☐ ☐ ☐ ☐ 41 Mon rôle de tuteur ou d’assistant-étudiant m’a permis de mieux comprendre la matière que
j’enseignais ☐ ☐ ☐ ☐ ☐
42. Je consacre en moyenne par semaine pour mes études (cours + travail personnel) 1 ! réponse
☐< 40 heures ☐ 40 – 50 heures ☐ 50 – 60 heures ☐60-70heures ☐>70 heures

- 59-
Chapitre 5: Les évaluations (3-7 questions)
Pas d
’acc
ord
Plut
ôt p
as
d’ac
cord
Plut
ôt d
’acc
ord
D’ac
cord
Pas d
’avi
s ou
pa
s con
cern
é
A propos des examens : 43 La procédure et les questions d’examen mesurent bien les compétences que j’ai
acquises (pas pour les étudiants en 1ère année,) ☐ ☐ ☐ ☐ ☐
44 Les enseignant(e)s formulent clairement leurs exigences pour l’examen(pas pour les étudiants en 1ère année,)
☐ ☐ ☐ ☐ ☐
45 Le contrôle continu et les épreuves en cours de semestre m’aident à travailler régulièrement (pas pour les étudiants en 1ère année)
☐ ☐ ☐ ☐ ☐
46 En 1ère année, les examens de maths et de physique devraient être identiques pour toutes les sections d’ingénieur (tous SAUF pour les étudiants en maths, physique et archi )
☐ ☐ ☐ ☐ ☐
47 Les sessions d’examen devraient avoir lieu fin août, juste avant la rentrée, et mi- février, juste avant la reprise (au lieu des périodes actuelles)
☐ ☐ ☐ ☐ ☐
Votre évaluation de l’enseignement:
48 J’apprécie de pouvoir faire part de mon opinion dans le cadre de l’évaluation des cours (pas pour les étudiants en 1ère année)
☐ ☐ ☐ ☐ ☐
49 Cela vaut la peine d’évaluer les cours car mon opinion est prise en compte (pas pour les étudiants en 1ère année)
☐ ☐ ☐ ☐ ☐

The 2011 EPFL Campus Survey
Chapitre 6. Votre opinion générale (3-5 questions) 50 Je suis fier/fière d’étudier à l’EPFL 1 ! réponse
☐ D’accord ☐ Plutôt d’accord ☐ Plutôt pas d’accord ☐ Pas d’accord ☐ Sans avis 51. Globalement, la qualité de la formation est 1 ! réponse
☐ Excellente ☐ Très bonne ☐ Bonnee ☐ Mauvaise ☐ Très mauvaise ☐ Sans avis
Pas d
’acc
ord
Plut
ôt p
as
d’ac
cord
Plut
ôt d
’acc
ord
D’ac
cord
Pas d
’avi
s ou
pas
co
ncer
né
Si vous faites actuellement une spécialisation ou un mineur, merci de nous donner votre opinion (uniquement pour les étudiants en master)
52 Je fais une spécialisation dans ma section et ceci apporte une valeur ajoutée à ma formation (uniquement pour les étudiants en master)
☐ ☐ ☐ ☐ ☐
53 Je fais un mineur dans ma section et ceci apporte une valeur ajoutée à ma formation (uniquement pour les étudiants en master )
☐ ☐ ☐ ☐ ☐
54 Je fais un mineur proposé par une autre section et ceci apporte une valeur ajoutée à ma formation (uniquement pour les étudiants en master)
☐ ☐ ☐ ☐ ☐
55. Que devrait faire l’EPFL pour améliorer la qualité de la formation ?

The 2011 EPFL Campus Survey
Chapitre 7: Les infrastructures (11 questions)
Pas d
’acc
ord
Plut
ôt p
as d
’acc
ord
Plut
ôt d
’acc
ord
D’ac
cord
Pas d
’avi
s ou
pas
co
ncer
né
Les locaux d’enseignement sont adaptés à l’enseignement 56. …pour les cours en auditoire (>100 étudiants) ☐ ☐ ☐ ☐ ☐ 57. … pour les grands cours (> 50 étudiants) ☐ ☐ ☐ ☐ ☐ 58. … pour les petits cours (< 50 étudiants) ☐ ☐ ☐ ☐ ☐ 59. … pour les exercices ☐ ☐ ☐ ☐ ☐ 60. … pour les labos et travaux pratiques ☐ ☐ ☐ ☐ ☐
L’infrastructure informatique correspond à mes besoins :
61. Pour les salles informatiques ☐ ☐ ☐ ☐ ☐ 62. Pour le réseau wifi ☐ ☐ ☐ ☐ ☐ 63. Pour l’impression de documents ☐ ☐ ☐ ☐ ☐ 64. Pour les logiciels disponibles ☐ ☐ ☐ ☐ ☐ 65. Pour l’offre et le service Poseidon ☐ ☐ ☐ ☐ ☐ 66 IS-Academia me permet de gérer facilement ma formation ☐ ☐ ☐ ☐ ☐
67. Que devrait améliorer l’EPFL pour les salles d’enseignement et l’informatique?

The 2011 EPFL Campus Survey
-62 -
Chapitre 8 : Le Rolex Learning Center (5 questions)
68. A quelle fréquence allez-vous au Rolex Learning Center:
☐ Très rarement ☐ Quelques fois par mois ☐ Quelques fois par semaine ☐ Chaque jour ☐ Plusieurs fois par jour
69. Vous arrive-t-il de ne pas trouver de place de travail ? ☐ Jamais ☐ Rarement ☐ Parfois ☐ Souvent
70. Je fréquente le RLC principalement pour (3 réponses possibles) : ☐ La bibliothèque ☐ La librairie ☐ La cafétéria et restaurant ☐ Le centre de carrière ☐ La banque ☐ Les espaces libres (là où on s’allonge sur les « poufs »)
71. Qu’appréciez-vous dans le Rolex Learning Center ?
72. Que devrait-on améliorer dans le Rolex Learning Center ?

The 2011 EPFL Campus Survey
-63 -
Chapitre 9 : Le campus (17 questions)
Pas d
’acc
ord
Plut
ôt p
as d
’acc
ord
Plut
ôt d
’acc
ord
D’ac
cord
Pas
d’av
is ou
pas
co
ncer
n
73 Je me sens en sécurité sur le campus de l’EPFL de jour comme de nuit ☐ ☐ ☐ ☐ ☐
74 Je me sens bien intégré(e) dans ma classe ☐ ☐ ☐ ☐ ☐ 75. J’apprécie la vie sur le campus (vie associative, spectacles, soirées,…) ☐ ☐ ☐ ☐ ☐ 76. L’AGEPoly représente bien mes intérêts d’étudiant(e) ☐ ☐ ☐ ☐ ☐
77. Quelles activités vous font/feraient rester sur le campus après les cours ? (plusieurs réponses possibles)
☐ Pratiquer du sport ☐ Boire un verre avec des amis ☐ Assister à une séance de cinéma ☐ Ecouter un concert ☐ Assister à une pièce de théâtre ☐ Participer à des activités associatives ☐ Assister à une conférence d’un orateur extérieur ☐Assister à un débat ☐ Autres (précisez dans la question suivante)
78. Que devrait-on améliorer sur le Campus EPFL ?

-64 -
Pas d
’acc
ord
Plut
ôt p
as d
’acc
ord
Plut
ôt d
’acc
ord
D’ac
cord
Pas d
’avi
s ou
pa
s con
cern
é
Je me sens le/la bienvenu(e) dans les services suivants
79 Le service académique (SAC) et le guichet ‘services aux étudiant-e-s’ ☐ ☐ ☐ ☐ ☐ 80 Le service des affaires estudiantines (Service sociale et de la mobilité- SAE) ☐ ☐ ☐ ☐ ☐ 81 Le secrétariat des sections ☐ ☐ ☐ ☐ ☐ 82 Le Centre de Carrière ☐ ☐ ☐ ☐ ☐ 83 Le Centre de Langues ☐ ☐ ☐ ☐ ☐ 84 La bibliothèque centrale (au RLC) ☐ ☐ ☐ ☐ ☐ 85 Le centre sportif ☐ ☐ ☐ ☐ ☐
Non Oui, je le connais
mais je n’ai jamais interagit avec elle
Oui, j’ai déjà interagit avec elle
Connaissez-vous les personnes ci-dessous 86 Mon/ma directeur/rice de section ou son adjoint(e) ☐ ☐ ☐ 87 Mon/ma conseiller/ère d’études ☐ ☐ ☐ 88 Mon/ma délégué(e) de classe ☐ ☐ ☐ 89 Le doyen de ma faculté ☐ ☐ ☐
90. Avez-vous éprouvé des problèmes relationnels avec certains membres du personnel (enseignants, administratifs, techniques, sécurité, ...) ? 1 ! réponse ☐ Oui des problèmes graves. ☐ Oui, mais sans conséquence. ☐ Non
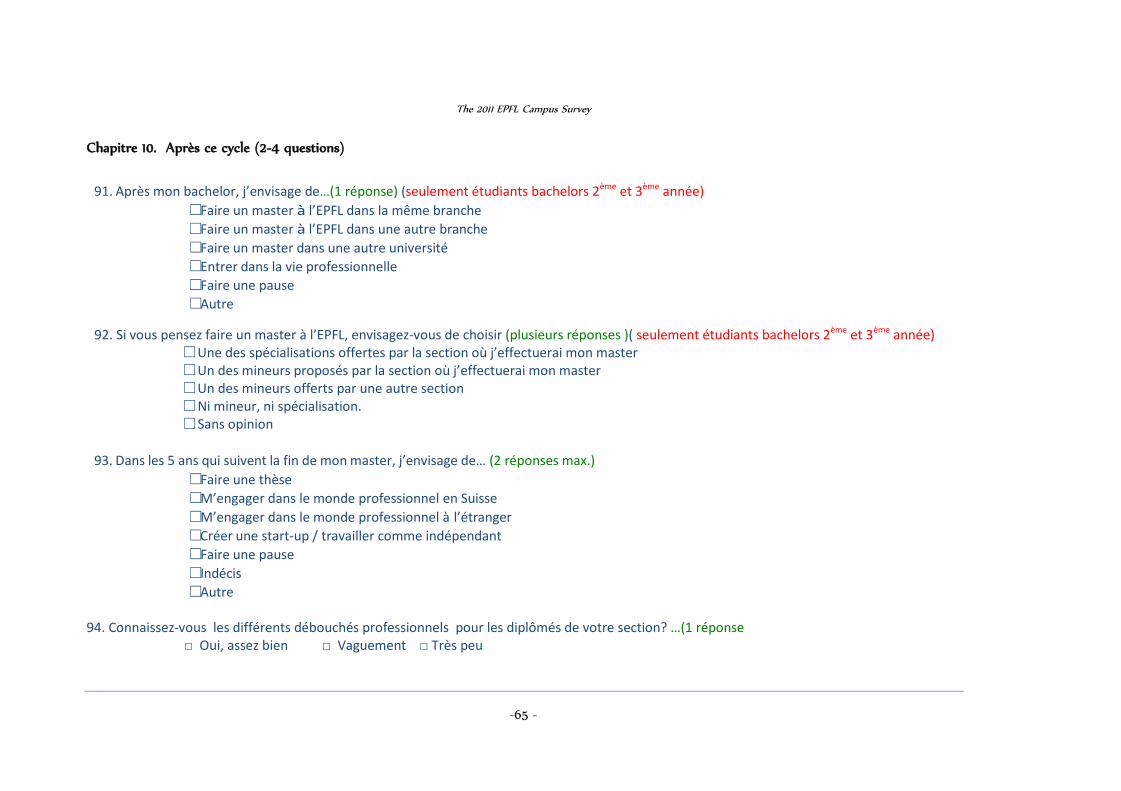
The 2011 EPFL Campus Survey
-65 -
Chapitre 10. Après ce cycle (2-4 questions)
91. Après mon bachelor, j’envisage de…(1 réponse) (seulement étudiants bachelors 2ème et 3ème année)
☐ Faire un master à l’EPFL dans la même branche ☐ Faire un master à l’EPFL dans une autre branche ☐ Faire un master dans une autre université ☐ Entrer dans la vie professionnelle ☐ Faire une pause ☐ Autre
92. Si vous pensez faire un master à l’EPFL, envisagez-vous de choisir (plusieurs réponses )( seulement étudiants bachelors 2ème et 3ème année)
☐ Une des spécialisations offertes par la section où j’effectuerai mon master ☐ Un des mineurs proposés par la section où j’effectuerai mon master ☐ Un des mineurs offerts par une autre section ☐ Ni mineur, ni spécialisation. ☐ Sans opinion
93. Dans les 5 ans qui suivent la fin de mon master, j’envisage de… (2 réponses max.)
☐ Faire une thèse ☐ M’engager dans le monde professionnel en Suisse ☐ M’engager dans le monde professionnel à l’étranger ☐ Créer une start-up / travailler comme indépendant ☐ Faire une pause ☐ Indécis ☐ Autre
94. Connaissez-vous les différents débouchés professionnels pour les diplômés de votre section? …(1 réponse □ Oui, assez bien □ Vaguement □ Très peu
The 2011 EPFL Campus Survey
-66 -
Appendix
Detailed results, sorted by question number.

The 2011 EPFL Campus Survey
-67 -
Question 1: “Which of these elements had an influence on your decision to enrol at the EPFL?” Differences between men and women (men gave in general a few more answers than women) The results cumulate above 100% since students could select as many answers as they wanted.
Question 2: “Which of these future career options motivated you to enrol in Mathematics?” (1 response)
70%
69%
14%
68%
16%
16%
19%
9%
26%
52%
28%
23%
5%
63%
73%
12%
64%
10%
10%
21%
8%
21%
51%
32%
27%
5%
0% 10% 20% 30% 40% 50% 60% 70% 80%
your interest in science
your interest in the subject of your studies (Civil Engineering, Chemistry…)
Switzerland’s charm
the reputation of the EPFL
the big projects (Alinghi, Solar Impulse,…)
your friends
your family
your former professors
it is close to your home
the professional perspectives
its international character and the fact that the courses are bilingual: French-English
the information days about the school (salons, open days…)
the website and social networking sites
Women Men
20% 28%
5% 20%
6%
11%
24% 12%
28% 25% 27% 27%
25% 13% 19% 19%
17% 23% 19% 20%
0%
10%
20%
30%
40%
50%
60%
70%
80%
90%
100%
Propé Bachelor Master TOTAL
None
Other
Mathematical theory
Statistics
Scientific calculus
Financial mathematics

The 2011 EPFL Campus Survey
-68 -
Question 3: “When did you choose your subject?” (2 possible answers), per section.
Question 3: “When did you choose your subject?” (2 possible answers), per cycle.
Question 13: “Have you heard of the mentoring programme for the ‘travaux de maturité’?” (MX students only)
MX SIE EL SC GC SV MT GM MA CGC IN PH AR EPFL
a) I knew at the end of my secondary studies 33% 36% 36% 38% 38% 44% 45% 45% 49% 52% 54% 58% 60% 47%
b) I hesitated for a long time but am happy with my choice 46% 46% 34% 40% 45% 39% 36% 34% 35% 24% 30% 24% 29% 35%
c) I hesitated for a long time and am still not certain of my choice 11% 9% 11% 11% 10% 11% 14% 12% 10% 12% 9% 10% 9% 10%
d) I would have preferred not to have to choose a subject before the second
year 9% 9% 19% 12% 7% 6% 6% 9% 5% 13% 7% 8% 2% 8%
0%
10%
20%
30%
40%
50%
60%
70%
47%
36%
10% 7%
47%
33%
11% 9%
0%
5%
10%
15%
20%
25%
30%
35%
40%
45%
50%
a) I knew at the end of my secondary studies
b) I hesitated for a long time but am happy with
my choice
c) I hesitated for a long time and am still not certain of my choice
d) I would have preferred not to have to choose a
subject before the second year
Propé
Bachelor
1%
3%
17%
79%
0% 10% 20% 30% 40% 50% 60% 70% 80% 90%
Yes, I had heard of it from others and this had an influence on my choice
Yes, I took part in this program and this had an influence on my choice
Yes, personally or indirectly, but this did not have an influence on my choice
No, I had never heard of it

The 2011 EPFL Campus Survey
-69 -
Question 16: “The SHS course is valuable”, per section.
Question 16: “The SHS course is valuable”, per cycle.
Question 17: “The ‘ENAC course’ is valuable” (responses from ENAC master students only)
Question 18: “The ‘ITP’ project in the first year is useful for my education” (IC students only)
13% 16% 22% 16% 16% 23% 21% 21% 26% 21% 21% 36% 31%
20% 25%
20% 27% 30% 25% 29% 32% 27% 34% 36%
30% 36% 31% 23% 27% 22% 23%
32% 27% 24% 20% 24% 17% 18% 17%
35% 32% 27% 31% 28% 19% 20% 20% 23% 17% 24%
16% 16%
0% 10% 20% 30% 40% 50% 60% 70% 80% 90%
100%
CGC IN MT GM PH SC MA GC AR EL MX SIE SV
No opinion Disagree Disagree Slightly Agree slightly Agree
21% 24% 22%
29% 28% 27%
26% 20% 24%
24% 23% 25%
0%
20%
40%
60%
80%
100%
Propé Bachelor Master
No opinion
Disagree
Disagree Slightly
Agree slightly
Agree
7% 19% 12%
20%
27% 33% 27%
31% 30% 22%
8% 15% 24% 15% 9%
0% 10% 20% 30% 40% 50% 60% 70% 80% 90%
100%
AR GC SIE
No opinion
Disagree
Disagree Slightly
Agree slightly
Agree
66% 56%
27% 33%
6% 9%
0% 10% 20% 30% 40% 50% 60% 70% 80% 90%
100%
IN SC
Disagree
Slightly Disagree
Slightly agree
Agree

The 2011 EPFL Campus Survey
-70 -
Question 19: “I understand the organisation of the study plan and the requirements to pass”, per cycle.
Question 19: “I understand the organisation of the study plan and the requirements to pass”, per section.
Question 20: “A video presentation of the optional courses would be enough for me to be able to choose my
courses before the start of term”
Q 21: “The websites of EPFL and of my section allow me to easily find information I need for my studies”
38% 43% 49%
44% 38% 38%
13% 14% 10%
0%
20%
40%
60%
80%
100%
Propé Bachelor Master
No opinion
Disagree
Disagree Slightly
Agree slightly
Agree
32% 38% 40% 42% 42% 43% 45% 46% 46% 47% 47% 48% 52%
40% 44% 39%
47% 44% 38% 43% 40% 38% 40% 42% 35%
39%
23% 16% 18%
9% 11% 15% 10% 10% 10% 10% 9%
10% 8%
0%
10%
20%
30%
40%
50%
60%
70%
80%
90%
100%
AR SIE GC MX SV SC PH MA MT GM CGC IN EL
No opinion Disagree Disagree Slightly Agree slightly Agree
17%
29%
23%
14% 17%
0%
20%
40%
60%
80%
100%
1
No opinion
Disagree
Disagree Slightly
Agree slightly
Agree
18% 26% 29% 30% 31% 28% 28% 36% 37% 38% 35% 31% 36%
46% 40% 38% 37% 39% 43% 46%
40% 38% 42% 45% 49% 47%
24% 27% 18% 20% 23% 24% 19% 17% 20% 15% 14% 12% 12%
0% 10% 20% 30% 40% 50% 60% 70% 80% 90%
100%
AR GC SV PH MT SIE IN MX MA EL CGC GM SC No opinion Disagree Disagree Slightly Agree slightly Agree
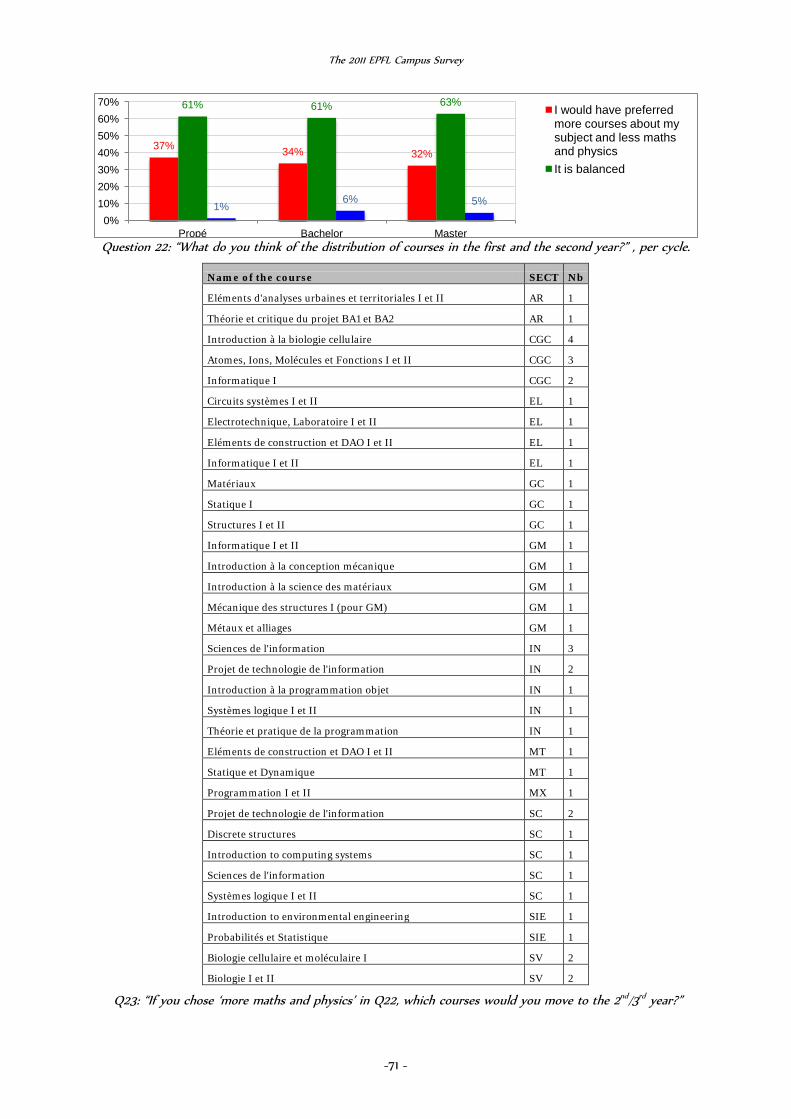
The 2011 EPFL Campus Survey
-71 -
Question 22: “What do you think of the distribution of courses in the first and the second year?” , per cycle.
Name of the course SECT Nb
Eléments d'analyses urbaines et territoriales I et II AR 1
Théorie et critique du projet BA1 et BA2 AR 1
Introduction à la biologie cellulaire CGC 4
Atomes, Ions, Molécules et Fonctions I et II CGC 3
Informatique I CGC 2
Circuits systèmes I et II EL 1
Electrotechnique, Laboratoire I et II EL 1
Eléments de construction et DAO I et II EL 1
Informatique I et II EL 1
Matériaux GC 1
Statique I GC 1
Structures I et II GC 1
Informatique I et II GM 1
Introduction à la conception mécanique GM 1
Introduction à la science des matériaux GM 1
Mécanique des structures I (pour GM) GM 1
Métaux et alliages GM 1
Sciences de l'information IN 3
Projet de technologie de l'information IN 2
Introduction à la programmation objet IN 1
Systèmes logique I et II IN 1
Théorie et pratique de la programmation IN 1
Eléments de construction et DAO I et II MT 1
Statique et Dynamique MT 1
Programmation I et II MX 1
Projet de technologie de l'information SC 2
Discrete structures SC 1
Introduction to computing systems SC 1
Sciences de l'information SC 1
Systèmes logique I et II SC 1
Introduction to environmental engineering SIE 1
Probabilités et Statistique SIE 1
Biologie cellulaire et moléculaire I SV 2
Biologie I et II SV 2
Q23: “If you chose ‘more maths and physics’ in Q22, which courses would you move to the 2nd/3rd year?”
37% 34% 32%
61% 61% 63%
1% 6% 5%
0% 10% 20% 30% 40% 50% 60% 70%
Propé Bachelor Master
I would have preferred more courses about my subject and less maths and physics It is balanced

The 2011 EPFL Campus Survey
-72 -
Question 24: “What do you think of the balance between the number of mandatory courses and optional
courses for the current academic year?” Only 2nd and 3rd year bachelor students, without the ‘not concerned’ answers
Question 24: “What do you think of the balance between the number of mandatory courses and optional courses for the current academic year?” Only from MASTER students; without the ‘not concerned answers
Question 27: “The courses in form of lectures are valuable”, per cycle
35%
25% 29%
23%
35%
24% 19%
46%
57%
25% 19%
30% 35%
27%
48% 46% 44%
28%
68%
38%
8%
20%
54%
69%
50%
30%
1% 0% 2% 3% 0% 2% 3% 0% 0% 0%
9%
0% 3%
0%
10%
20%
30%
40%
50%
60%
70%
80%
�AR �CGC �EL �GC �GM �IN �MA �MT �MX �PH �SC �SIE �SV
Too many mandatory courses It is balanced Too many optional courses
10%
22%
14% 14% 7%
23%
11% 13% 13% 7%
29% 31%
10%
65%
73%
59% 63%
46%
67%
49%
66%
50% 53% 51% 54% 60%
8% 2% 5%
0% 5% 4%
0% 6%
16% 12% 10% 3%
15%
0
0.1
0.2
0.3
0.4
0.5
0.6
0.7
0.8
�AR �CGC �EL �GC �GM �IN �MA �MT �MX �PH �SC �SIE �SV
Too many mandatory courses It is balanced Too many optional courses
33% 39% 43% 53% 58%
29%
37% 37% 36% 34%
6%
8% 8%
6% 5% 30%
14% 8% 3% 2%
0%
10%
20%
30%
40%
50%
60%
70%
80%
90%
100%
BA1 BA2 BA3 MA1 MA2
No opinion
Disagree
Disagree Slightly
Agree slightly
Agree

The 2011 EPFL Campus Survey
-73 -
Question 28: “The exercises help me absorb the course work”, per cycle.
Question 29: “There is a sufficient amount of practical and laboratory work in my course”, per cycle.
Question 30: “The practical exercises and laboratory work help me to link theory and practice”, per cycle.
Question 31: “The courses that include a project are valuable”, per cycle
76% 82% 71% 63% 58%
72%
20% 16% 25%
28% 34% 23%
0% 10% 20% 30% 40% 50% 60% 70% 80% 90%
100%
BA1 BA2 BA3 MA1 MA2 ALL
No opinion
Disagree
Disagree Slightly
Agree slightly
Agree
27% 42% 44% 42% 34%
23%
25% 29% 23% 32%
15%
19% 19%
19% 24% 27%
9% 4% 7% 3%
0% 10% 20% 30% 40% 50% 60% 70% 80% 90%
100%
BA1 BA2 BA3 MA1 MA2
No opinion
Disagree
Disagree Slightly
Agree slightly
Agree
33% 44% 46% 47% 43%
24%
32% 37% 35% 39% 7%
7% 8% 6% 9%
35% 14% 6% 10% 7%
0% 10% 20% 30% 40% 50% 60% 70% 80% 90%
100%
BA1 BA2 BA3 MA1 MA2
No opinion
Disagree
Disagree Slightly
Agree slightly
Agree
30% 38% 38% 40% 52%
27% 34% 36% 39%
34% 9%
11% 17% 10% 9%
31% 13% 6% 8% 3%
0% 10% 20% 30% 40% 50% 60% 70% 80% 90%
100%
BA1 BA2 BA3 MA1 MA2
No opinion
Disagree
Disagree Slightly
Agree slightly
Agree

The 2011 EPFL Campus Survey
-74 -
Question 32: “The semester projects are valuable” (responses from master students only), per section
Question 33: “I prefer getting one copy of all the documents at the beginning of the semester to having to go
online to print a PDF every week”, per section
Question 34: “ If the contents were the same, I would prefer”
☐ 3 courses of 2 credits each ☐ 2 courses at 3 credits each ☐ one 6-credit course
27% 40% 44% 46% 50% 55% 57% 58% 63% 65% 65% 66% 72%
38%
33% 18%
30% 32%
29% 23% 18% 19% 15%
28% 27% 4% 16%
13% 23%
5% 5%
11% 14% 8%
11% 6%
5% 5%
0%
14% 15% 13% 14% 12% 5% 15% 15%
24%
0%
10%
20%
30%
40%
50%
60%
70%
80%
90%
100%
SIE PH CGC SC SV GM MT IN MX MA GC AR EL
No opinion Disagree Disagree Slightly Agree slightly Agree
70% 69% 75% 58%
68% 57%
75% 74% 72% 77% 60% 59% 60%
14% 11% 10%
19% 16%
12%
13% 10% 17% 12%
16% 16% 14%
0%
10%
20%
30%
40%
50%
60%
70%
80%
90%
100%
AR CGC EL GC GM IN MA MT MX PH SC SIE SV
No opinion Disagree Disagree Slightly Agree slightly Agree
23% 33%
18% 24% 20% 19% 27% 28% 25% 23% 16%
28% 30%
58%
59%
55%
65% 61%
52%
56% 66% 67%
62%
55%
67% 61%
19% 8%
26% 11% 19%
30% 17%
6% 8% 16%
28%
6% 9%
0%
10%
20%
30%
40%
50%
60%
70%
80%
90%
100%
AR CGC EL GC GM IN MA MT MX PH SC SIE SV
1 X 6
2 X 3
3 X 2

The 2011 EPFL Campus Survey
-75 -
Question 35: “Does the teaching language obstruct your understanding of the courses?”
Percentage of students who did not reply ‘no difficulty’, depending upon their main language.
Question 35: “Does the teaching language obstruct your understanding of the course?”, per section
Question 36: “The number of assistants for the exercises is adapted to the number of students present” (the section is the one where the student is registered not the section that provides the courses evaluated here)
28% 30% 30% 33% 33% 33% 35%
57% 70%
88%
0% 10% 20% 30% 40% 50% 60% 70% 80% 90%
100%
Else Spanish French Italian Arabic Enlish German Chinese Hindi Farsi
7% 10%
18% 19% 19% 17%
30%
13%
5%
18% 25%
21% 17%
12%
22% 16% 17%
24% 28%
16%
34%
45%
34% 29%
38% 43%
0%
10%
20%
30%
40%
50%
60%
70%
80%
90%
100%
MA IN PH AR EL GC GM SC SIE MT SV CGC MX
The French that some teachers use is difficult to understand
18% 18% 14% 22% 22%
16% 21% 19% 21% 25% 28% 31% 27%
35% 36% 41% 36% 36%
44% 40% 43% 44% 40% 38% 36% 44%
31% 30% 34% 27% 28% 21% 24% 26% 20% 17% 19% 21% 23%
14% 14% 11% 14% 11% 12%
13% 11% 11% 9% 9% 10% 4%
0%
10%
20%
30%
40%
50%
60%
70%
80%
90%
100%
SIE MA SV GC PH MX SC GM EL AR CGC IN MT
No opinion Disagree Disagree Slightly Agree slightly Agree

The 2011 EPFL Campus Survey
-76 -
Question 37: “The assistants helped me to understand the course material”, per section.
Question 38: “The tutorial helps to understand the exercises” (we do not show the ‘no-opinion’ responses)
Question 39: “The tutorial prompted me to go to the exercise lessons”, per section
Question 40: “The role of tutor or assistant was valuable for me”, per section.
25% 35% 39% 42%
51% 35% 38% 46% 48% 45% 36%
45% 54%
43%
45% 44% 46% 35%
40% 45%
41% 40% 40% 40%
45% 34% 18%
9% 11% 8% 7%
15% 10% 8% 5% 11%
14% 8% 6%
0% 10% 20% 30% 40% 50% 60% 70% 80% 90%
100%
AR CGC EL GC GM IN MA MT MX PH SC SIE SV No opinion Disagree Disagree Slightly Agree slightly Agree
61% 60% 51%
30% 27% 33%
7% 8% 8% 3% 5% 7%
0% 10% 20% 30% 40% 50% 60% 70% 80% 90%
100%
BA1 BA2 BA3
Disagree
Disagree Slightly
Agree slightly
Agree
54% 45% 47% 54%
44% 54% 60% 62% 64% 60% 60%
77%
14% 26% 29% 25%
36% 26% 21% 21% 19% 24% 25%
14% 14% 15%
14% 13% 13% 9% 11% 7% 6% 10% 7% 2%
0% 10% 20% 30% 40% 50% 60% 70% 80% 90%
100%
MA PH GM GC EL IN SC CGC MT SIE SV MX
Agree Agree slightly Disagree Slightly Disagree
58% 62% 65% 65% 76% 80% 80% 81% 85% 86% 88% 90%
42% 24% 16%
35% 14% 10% 14% 19% 15% 10% 9% 10%
0%
20%
40%
60%
80%
100%
CGC SV SC GM IN MX PH EL MT GC MA SIE
Disagree Disagree Slightly Agree slightly Agree

The 2011 EPFL Campus Survey
-77 -
Q 41: “My role as a tutor or student-assistant helped me to understand the material that I was teaching
better”
Question 42: “ On average I spend about… for my studies (courses + individual work)”, per section.
Question 42: “ On average I spend about… for my studies (courses + individual work)”, per gender.
39% 45% 50% 54% 54% 55% 56% 56% 58% 58% 64% 77%
88%
50% 31% 32%
46%
15%
41% 37% 28% 28% 32% 29%
23% 13% 11%
14% 14%
27%
7% 12% 13%
0% 10% 20% 30% 40% 50% 60% 70% 80% 90%
100%
GC IN GM AR SC CGC MT PH MA SV EL SIE MX
Disagree Disagree Slightly Agree slightly Agree
15% 18% 17% 14% 15% 11% 10% 11% 11% 12% 13% 9%
55% 40% 37% 39% 38% 41% 43% 40% 36% 35% 35%
33%
6%
19% 31% 37% 33% 31% 34% 33%
30% 38% 33% 36% 40%
24%
8% 8% 8% 12% 12% 11% 10% 15% 13%
15% 7% 15%
34%
33%
0%
10%
20%
30%
40%
50%
60%
70%
80%
90%
100%
MX CGC GC SC MA GM MT SIE PH IN EL SV AR
6% 14%
29% 36%
36%
31%
19% 13%
9% 6%
0% 10% 20% 30% 40% 50% 60% 70% 80% 90%
100%
Women Men
> 70
60-70
50-60
40-50
< 40

The 2011 EPFL Campus Survey
-78 -
Question 43: “The exam procedures and questions are a good measure of the competences I acquired”, per
section
Question 44: “The teachers formulate the requirements for their exams clearly”, per section.
Question 45: “The continuous supervision and the tests during term help me work regularly”, per section.
Question 46: “In the first year, the maths and physics exams should be identical for all engineering sections”
12% 14% 14% 16% 17% 17% 21% 22% 23% 24% 25% 29% 36%
54% 60% 71% 66%
53% 56% 51% 58% 56% 49% 55% 50% 43%
20% 18%
10% 12% 12% 13% 14%
12% 14% 3%
14% 11% 12%
0% 10% 20% 30% 40% 50% 60% 70% 80% 90%
100%
IN SC SIE SV MA PH MT GM AR EL CGC GC MX
No opinion Disagree Disagree Slightly Agree slightly Agree
19% 19% 20% 21% 21% 24% 25% 28% 29% 29% 30% 30% 30%
49% 49% 53% 57% 49% 48% 52% 47% 51% 42% 46% 49% 52%
25% 24% 21% 15% 24% 19% 14% 20% 13% 15%
19% 16% 16%
0% 10% 20% 30% 40% 50% 60% 70% 80% 90%
100%
SC SV AR MA CGC IN MT GM PH EL MX GC SIE
No opinion Disagree Disagree Slightly Agree slightly Agree
43% 44% 47% 52% 52% 57% 58% 58% 59% 59% 62% 62% 69%
38% 30% 28% 37% 32% 31% 34% 26% 28% 28%
33% 26% 23% 13%
11% 11%
7% 9% 9% 6% 7% 6% 8%
3% 7% 5%
0% 10% 20% 30% 40% 50% 60% 70% 80% 90%
100%
AR PH MA MX GM MT GC CGC SC EL SIE IN SV
No opinion Disagree Disagree Slightly Agree slightly Agree
14% 18% 20%
18% 13% 16%
26% 30% 28%
26% 25% 26%
16% 13% 9%
0% 10% 20% 30% 40% 50% 60% 70% 80% 90%
100%
Propé Bachelor Master
No opinion
Disagree Slightly
Disagree
Agree slightly
Agree

The 2011 EPFL Campus Survey
-79 -
Question 46: “In the first year, the maths and physics exams should be identical for all engineering sections”
Question 48: “I appreciate the opportunity to voice my opinion in the course evaluation”, per section
Question 49: “It is worth the effort of evaluating the courses as my opinion is taken into account”, per section.
Question 50: “I am proud to be a student at the EPFL”, per section
13% 29% 18% 26% 26% 28% 30%
43% 29% 39% 25%
17% 31% 23% 27% 29% 27% 18%
32% 25% 24% 19% 15% 13% 17% 17% 14% 11% 16% 13%
28% 18% 20% 27% 16% 12% 20% 13% 13% 14% 9% 18% 16% 11% 14% 14% 9% 15% 10% 10%
0% 10% 20% 30% 40% 50% 60% 70% 80% 90%
100%
EL MT GM MX SV SIE CGC SC GC IN
Disagree Disagree Slightly Agree slightly Agree No opinion
69% 70% 71% 76% 78% 78% 81% 82% 84% 85% 86% 88% 90%
24% 25% 21% 19% 20% 17% 15% 15% 13% 9% 9% 9% 8%
0% 10% 20% 30% 40% 50% 60% 70% 80% 90%
100%
EL AR MA GM GC PH IN MT CGC SC SIE MX SV
No opinion Disagree Disagree Slightly Agree slightly Agree
39% 46% 44% 40% 50% 49% 37% 43%
55% 41%
55% 45% 51%
36% 32% 37% 34% 27% 30%
33% 34%
28% 37%
28% 38% 30%
11% 10% 9% 19% 12% 7% 12%
14% 6% 11% 9% 9% 14%
0% 10% 20% 30% 40% 50% 60% 70% 80% 90%
100%
AR CGC EL GC GM IN MA MT MX PH SC SIE SV
Agree Agree slightly Disagree Slightly Disagree No opinion
59% 65% 70% 72% 72% 73% 74% 75% 76% 76% 79% 82% 84%
28% 28% 25% 20% 19% 20% 19% 21% 18% 16% 14% 12% 12%
0%
20%
40%
60%
80%
100%
SIE AR CGC MX IN GM PH GC SV MA EL SC MT
Agree Agree slightly Disagree Slightly Disagree No opinion

The 2011 EPFL Campus Survey
-80 -
Question 50:” I am proud to be a student at the EPFL”, per study year.
Question 51: “The overall quality of the education is….” (Per section) These data are based on the section in
which the student is registered, while this student takes courses from several sections (especially in first year).
Question 51: “The overall quality of the education is….” : opinions of the respondents at the master level who
did their bachelor at EPFL (left) compared to students who joined EPFL at the master level.
Horizontally Q50: % of students who agree with ‘Proud to study at EPFL’ in section X. Vertically Q51: % of students who answer ‘excellent or very good’ on Q93 ‘Overall quality of education is…’ in section X.
80% 75% 66% 68% 67%
15% 18% 27% 22% 24%
0% 10% 20% 30% 40% 50% 60% 70% 80% 90%
100%
Bachelor 1 Bachelor 2 Bachelor 3 Master 1 Master 2
No opinion
Disagree
Disagree Slightly
Agree slightly
Agree
14% 12% 13% 21% 19% 22% 15% 16% 27% 20% 21% 21% 26%
52% 56% 60% 53% 57% 55% 63% 62% 52% 60% 60% 60% 55%
27% 28% 24% 25% 22% 21% 17% 20% 16% 19% 17% 17% 15%
0% 10% 20% 30% 40% 50% 60% 70% 80% 90%
100%
SIE CGC AR GM IN SV MX GC EL SC PH MT MA
Excellent Very good Good Bad Very bad Non opinion
24% 15%
47% 56%
27% 26%
0% 10% 20% 30% 40% 50% 60% 70% 80% 90%
100%
BA inside BA outside
No opinion
Very bad
Bad
Good
Very good
Excellent
AR
CGC
EL GC
GM
IN
MA MT
MX
PH SC
SIE
SV
65%
67%
69%
71%
73%
75%
77%
79%
81%
83%
86% 88% 90% 92% 94% 96%
Q51
(exc
elle
nt +
ver
y go
od)
Q50(agree+slightly agree)

The 2011 EPFL Campus Survey
-81 -
Question 61: “The IT infrastructure meets my needs - IT rooms”, per section
Question 64: “The IT infrastructure meets my needs- The available software”, per section.
Question 76: “The AGEPoly represents my interests as a student well”
43% 49% 54% 50% 46% 44% 51% 57% 55% 55% 63% 64% 53%
24% 26% 22% 29% 34% 36% 33% 27% 30% 31% 25% 26% 37% 15% 11% 14% 12% 9% 13% 9% 8% 11% 8% 5% 7% 9%
0%
20%
40%
60%
80%
100%
PH MA SIE MX GC SV GM CGC MT IN AR EL SC
Agree Agree slightly Disagree Slightly Disagree No opinion
35% 32% 40% 41% 42% 41% 35%
44% 36%
51% 47% 44% 51%
30% 37% 29% 29% 28% 29% 37%
31% 42% 28% 34% 39%
32% 13% 10% 7% 10% 14% 15% 13% 7% 10% 7% 11% 10% 11%
0%
10%
20%
30%
40%
50%
60%
70%
80%
90%
100%
PH SV GC MA MX AR CGC IN SC SIE EL MT GM
Agree Agree slightly Disagree Slightly Disagree No opinion
16% 17% 20% 20% 24% 18% 20% 19% 20% 24% 21%
26% 37%
26% 25% 26% 27% 24%
30% 30% 34% 36% 32% 37% 34%
24% 11% 11% 8% 5% 12% 9% 8%
12% 8% 9% 9% 5% 8% 12% 10%
4% 3%
7% 6% 7%
7% 5% 5% 7% 6%
6%
35% 36% 42% 45%
33% 37% 35% 29% 32% 31% 27% 28% 25%
0%
10%
20%
30%
40%
50%
60%
70%
80%
90%
100%
SC IN AR MA MT PH SIE EL GC SV GM CGC MX
Agree Agree slightly Disagree Slightly Disagree No opinion
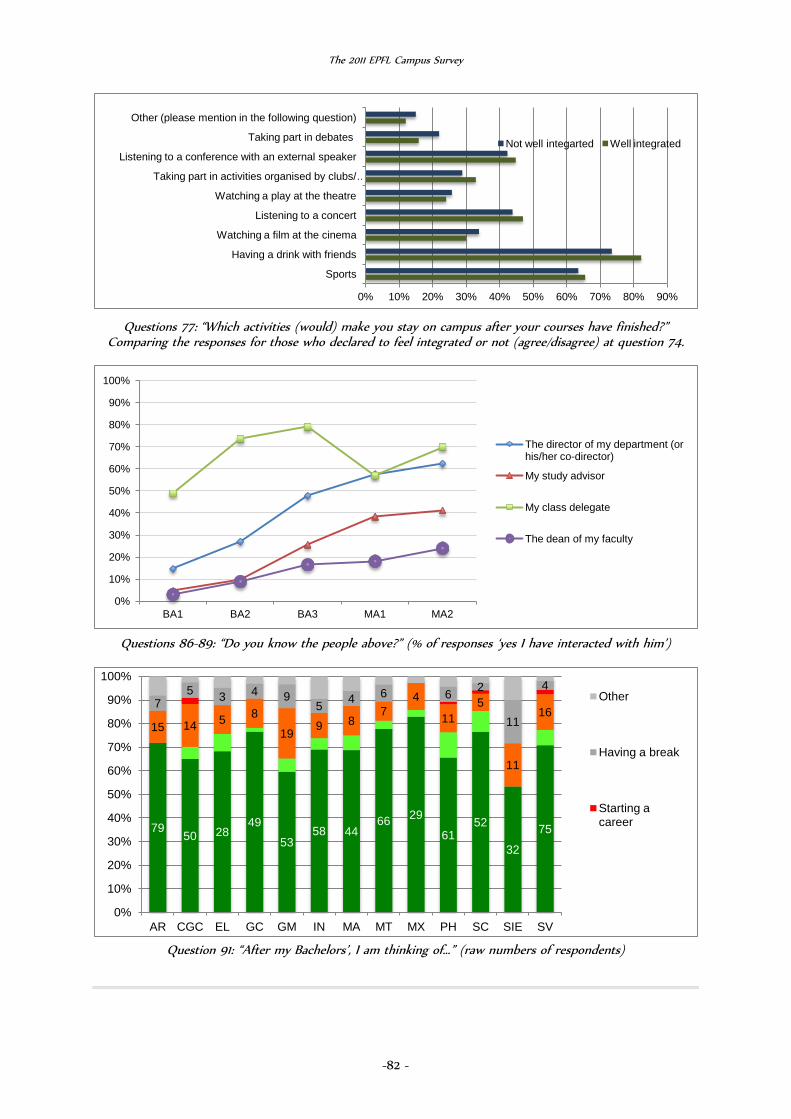
The 2011 EPFL Campus Survey
-82 -
Questions 77: “Which activities (would) make you stay on campus after your courses have finished?”
Comparing the responses for those who declared to feel integrated or not (agree/disagree) at question 74.
Questions 86-89: “Do you know the people above?” (% of responses ‘yes I have interacted with him’)
Question 91: “After my Bachelors’, I am thinking of…” (raw numbers of respondents)
0% 10% 20% 30% 40% 50% 60% 70% 80% 90%
Sports
Having a drink with friends
Watching a film at the cinema
Listening to a concert
Watching a play at the theatre
Taking part in activities organised by clubs/ …
Listening to a conference with an external speaker
Taking part in debates
Other (please mention in the following question)
Not well integarted Well integrated
0%
10%
20%
30%
40%
50%
60%
70%
80%
90%
100%
BA1 BA2 BA3 MA1 MA2
The director of my department (or his/her co-director)
My study advisor
My class delegate
The dean of my faculty
79 50 28
49
53 58 44
66 29
61 52
32
75
15 14 5 8
19 9 8 7
4
11 5
11
16 7
5 3 4 9 5 4 6 6 2
11
4
0%
10%
20%
30%
40%
50%
60%
70%
80%
90%
100%
AR CGC EL GC GM IN MA MT MX PH SC SIE SV
Other
Having a break
Starting a career