ENIRONMENT AND NATURAL RESOURCES High-resolution …
40
PAPER JUNE 2018 ENVIRONMENT AND NATURAL RESOURCES High-resolution Carbon Emissions Data for Chinese Cities Zhu Liu Bofeng Cai
Transcript of ENIRONMENT AND NATURAL RESOURCES High-resolution …

PA P E R
J U N E 2 0 1 8
E N V I R O N M E N T A N D N AT U R A L R E S O U R C E S
High-resolution Carbon Emissions Data for Chinese CitiesZhu Liu
Bofeng Cai

Environment and Natural Resources Program
Belfer Center for Science and International Affairs
Harvard Kennedy School
79 JFK Street
Cambridge, MA 02138
www.belfercenter.org/ENRP
The authors of this report invites use of this information for educational purposes, requiring only
that the reproduced material clearly cite the full source: Liu, Zhu and Cai, Bofeng “High-resolution
Emission Data for Chinese Cities.” Belfer Center for Science and International Affairs, Cambridge,
Mass: Harvard University, June 2018
Statements and views expressed in this report are solely those of the authors and do not imply
endorsement by Harvard University, the Harvard Kennedy School, or the Belfer Center for Science
and International Affairs.
Design and layout by Andrew Facini
Cover photo: Smoke rises above the skyline of Beijing on a moderately polluted day, Saturday,
Aug. 26, 2017. (AP Photo/Mark Schiefelbein)
Copyright 2018, President and Fellows of Harvard College
Printed in the United States of America
E N V I R O N M E N T A N D N AT U R A L R E S O U R C E S
PA P E R
J U N E 2 0 1 8
High-resolution Carbon Emissions Data for Chinese CitiesZhu Liu
Bofeng Cai

ii High-resolution Carbon Emissions Data for Chinese Cities
About the Project
The Environment and Natural Resources Program at the Belfer Center for Science and International Affairs is at the center of the Harvard Kennedy School’s research and outreach on public policy that affects global environ-ment quality and natural resource management. Its mandate is to conduct policy-relevant research at the regional, national, international, and global level, and through its outreach initiatives to make its products available to decision-makers, scholars, and interested citizens.
More information can be found on ENRP’s web site at www.belfercenter.org/enrp or from assistant director, Amanda Sardonis ([email protected]) at ENRP, Harvard Kennedy School, 79 JFK Street, Cam-bridge, MA 02138 USA.
Acknowledgements
This research was primarily conducted while the author was an Associate in the Environment and Natural Resources Program and the Energy Tech-nology Innovation Policy Research Group of the Belfer Center for Science and International Affairs at the Harvard Kennedy School. Support from the Jassim Jaidah Director’s Fund gratefully acknowledged. The authors also thank Zhenyu Wang for helping with editing the figures.
The authors thank Senior Lecturer Henry Lee for providing support, guid-ance, and advice and Wei Peng for her comments on earlier drafts.

iiiBelfer Center for Science and International Affairs | Harvard Kennedy School
About the Authors
Dr. Zhu Liu is an Associate at the Environment and Natural Resources Program at the Belfer Center for Science and International Affairs. His research focuses on global sustainability accounting and low carbon energy transition. Zhu is contributing to collaborative work with the Initiative on Sustainable Energy Development in China led by Senior Lecturer in Public Policy Henry Lee. He conducted his Doctoral study in Ecology at the Chinese Academy of Sciences (CAS) and graduated with CAS highest honor (CAS Presidential Special Award). Zhu received his Ph.D. from CAS (2013) with joint training by the University of Cambridge (2012). He holds a Bachelor’s degree in Geology from Northwest University (2007) and a Master’s degree in Ecology from China Agricultural University (2009). His research on energy and climate has been published in Nature, Nature Cli-mate Change, PNAS, and other professional journals.
Dr. Bofeng Cai has special expertise in the GHG emissions inventory of energy use, Industrial Processes and Product Use (IPPU) and landfill, waste water treatment, etc. He was one of the Lead Authors of IPCC 2013 Sup-plementary Methods and Good Practice Guidance Arising from the Kyoto Protocol in 2012, and one of the Coordinating Lead Author (CLA) of IPCC 2019 Refinement to the 2006 IPCC Guidelines for National Greenhouse Gas Inventories. Dr. Cai is mainly focused on city carbon emissions and high-res-olution carbon dioxide emission gridded data of China.


vBelfer Center for Science and International Affairs | Harvard Kennedy School
Table of Contents
Executive Summary ...........................................................................1
1. Background of CO2 emissions data from Chinese cities .......... 2
2. Data Sources ................................................................................. 5
3. Results ........................................................................................... 7
4. Discussion and Policy Suggestions .......................................... 14
5. Methodology ...............................................................................17
5.1 Emissions categories and inventory scopes .......................................17
5.2 Scope 1 emissions calculation .............................................................17
5.3 Scope 2 emissions calculation ............................................................ 19
6. Carbon emissions data from 288 Chinese cities ....................20
References ............................................................................................................28
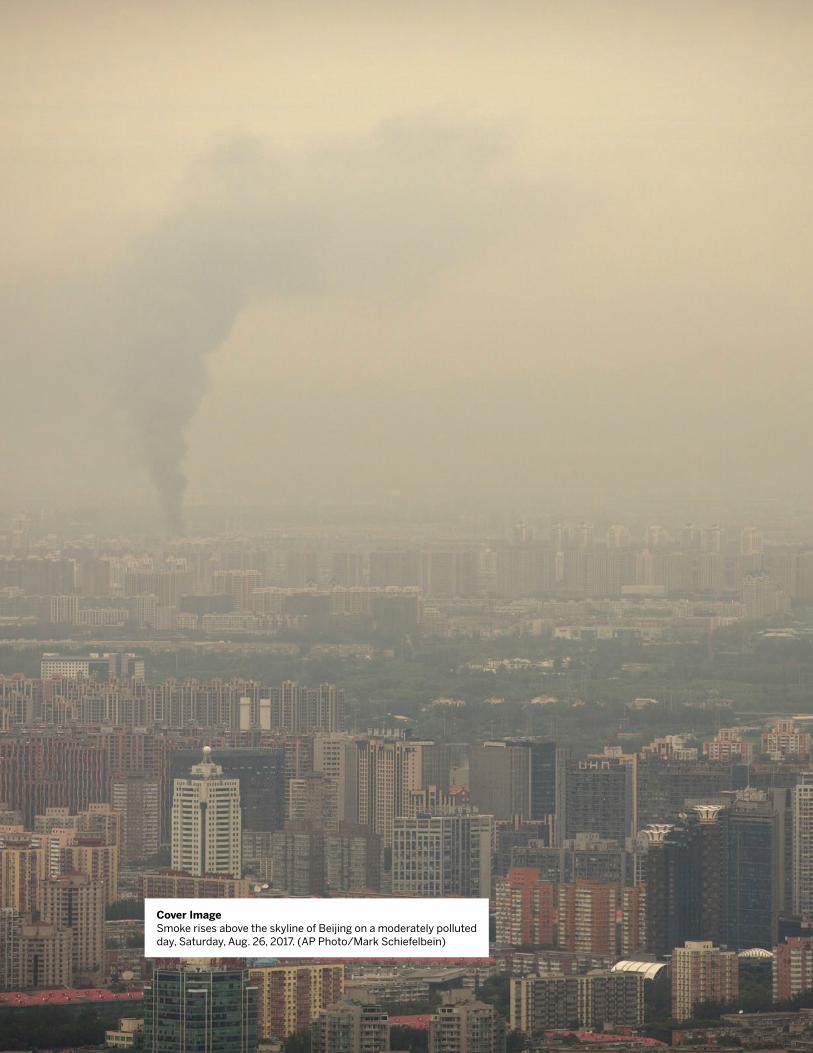
Cover ImageSmoke rises above the skyline of Beijing on a moderately polluted day, Saturday, Aug. 26, 2017. (AP Photo/Mark Schiefelbein)

1Belfer Center for Science and International Affairs | Harvard Kennedy School
Executive Summary
China is currently the world’s largest energy consumer and CO2 emitter, and its cities contribute 85% of the total CO2 emissions in China. Given the magnitude and growth rate of Chinese cities’ carbon emissions, cities are considered to be the key areas for implement-ing policies designed to adapt to climate change and mitigate CO2 emissions.
In this research, we used high-resolution CO2 emissions data (data from China High-Resolution Emission Gridded Database (CHRED) at 1 km spatial resolution) from 288 Chinese cities. There were, in total, 9,723 million metric tons (MMT) CO2 produced in 2012 from the 288 cities. The results show that the 288 cities had variable per capita emissions and emission intensities; both low-carbon and carbon intensive cities exist in urban China. The CO2 per capita for these 288 cities was 11 tCO2/person, which is lower than the US average, but higher than that of the European Union. The per capita CO2 emissions were weakly related with the per capita GDP in the 288 cities, indicat-ing that there was no environmental Kuznets pattern for the carbon emissions related to a city’s level of economic development in China. The research implies that urbanization may be low-carbon or carbon intensive for China. Thus, promoting a low-carbon transition for Chi-nese cities is critical for global greenhouse gas mitigation.

2 High-resolution Carbon Emissions Data for Chinese Cities
1. Background of CO2 emissions data from Chinese cities
The urbanization process in China and technology developments in the United States are considered to be the main forces shaping the world in the 21st century. City development is the major driver of China’s economy, with 50% of China’s GDP growth in the past 10 years contributed by infra-structure investments associated with the urbanization process. Presently, cities account for 75% of China’s total GDP and 80% of its national energy consumption. The urbanization rate in China is expected to reach 75% in 2030, which is considered by some scholars to be the main driving force for China’s leadership in the world, after the United States, in terms of total economic volume. Urbanization in China reallocated approximately 200 million people into urban areas, and these processes are expected to relo-cate more than 300 million people to China’s cities over the next 15 years. Nearly 70% of the population will live in urban areas by 2035. It is expected that in the next 20 years, China will build approximately 50,000 new sky-scrapers in its urban areas, which will require considerable infrastructure development and energy consumption in urban China.
The urbanization process in China is critical for protecting the global environment. China has already become the world’s top fossil fuel energy consumer and CO2 emitter and has performed intensive studies on the features, characteristics and driving factors of its carbon emissions and mitigation actions. As the world’s largest developing country, with unprec-edented urbanization, industrialization and poverty elimination processes, China has been and will continue to be the major force behind anthropo-genic carbon emissions and their mitigation.
Concrete emission inventories are considered to be the cornerstone for emissions research and mitigation strategies for cities. However, challenges remain in regard to presenting comprehensive carbon emission inventories at the city level; to measuring, reporting and verifying inventories; and to minimizing the associated uncertainties. This is particularly difficult in a large country with significant geographical and social-economic diver-sity, such as China, because producing comprehensive carbon emission

3Belfer Center for Science and International Affairs | Harvard Kennedy School
inventories requires very detailed carbon accounting for each city as well as a comprehensive understanding of local climate strategies. The method-ology and associated inventories for CO2 emissions have been developed at the national scale. Compared with nation states, cities have various defi-nitions regarding their boundaries and non-centralized statistics as well as large discrepancies regarding the definitions of their economic develop-ment levels, which produce uncertainty for carbon emissions accounting, especially in developing countries, such as China. For example, in China, the city is the second level of an administration area (the province is the first level) and not only includes urban areas but also vast rural areas; there are 286 administration cities in China. Thus, the administrative boundary of a Chinese city is larger than that of a city in developed countries, where only urban areas are included in a city’s boundary.
In addition, cities have various definitions of the boundaries regarding emissions accounting and non-centralized statistics as well as large discrep-ancies in regard to defining the levels of economic development, producing uncertainty for carbon emission accounting. System scope boundaries sig-nificantly affect regional emission inventories. Researchers have generally assumed a closed system boundary when conducting regional emission inventories; however, the reality is that regions have intensive interactions across calculated boundaries (administrative boundaries), such as domestic and international transportation and purchased power supply, (generated outside the boundary). These cross-boundary activities can dramatically affect emission estimates and the distribution of associated mitigation responsibilities. The academic literature has defined the territorial direct emission boundary as scope 1, the boundary of the emission caused by purchased electricity produced outside the boundary as scope 2, and the boundary of the emission embodied in imported products and services as scope 3. By further balancing the emissions embodied in imports and exports, the emission inventory boundary, which is considered to be the emissions embodied in imports but to exclude that of exports, is defined as consumption emissions. Whether such embodied emissions are taken into account will dramatically affect the emissions inventory at the city level.
Finally, but most importantly, as a developing country, China’s statistics system is not as comprehensive as that of developed countries. Regional

4 High-resolution Carbon Emissions Data for Chinese Cities
statistics have comparatively more uncertainty than those at the national level and lack sectoral information, making it more difficult to conduct China’s cities’ CO2 inventories. There are a few main studies that have con-ducted a “bottom-up” (see methods) CO2 emission inventory in Chinese cities; however the number of studies and sectoral information is limited.
High-resolution emission data contribute to solving such challenges. Carbon accounting from high-resolution emission data is a key research direction in the field of climate change. There is a focus on analyzing the extent, as well as the causes and effects, of CO2 emissions at a fine scale. Understanding emissions at the city and regional levels according to high spatial resolution CO2 emissions data has been highlighted in the carbon management literature.
In this study, we established a comprehensive and systematic city-level CO2 emission data system in China based on the China High-Resolution Emis-sion Gridded Database (CHRED) (1 km spatial resolution), and we further analyzed the characteristics of the total and per capita city emissions. We focused on prefecture-level cities and municipalities that are directly under China’s central government. According to the “2013 China Statistical Year-book”, there were 285 prefecture-level cities and 4 municipalities in China in 2012. The CHRED database does not include Sansha City (founded in 2012). Therefore, this study included 288 cities covering 284 prefec-ture-level cities and 4 municipalities.
5Belfer Center for Science and International Affairs | Harvard Kennedy School
2. Data Sources
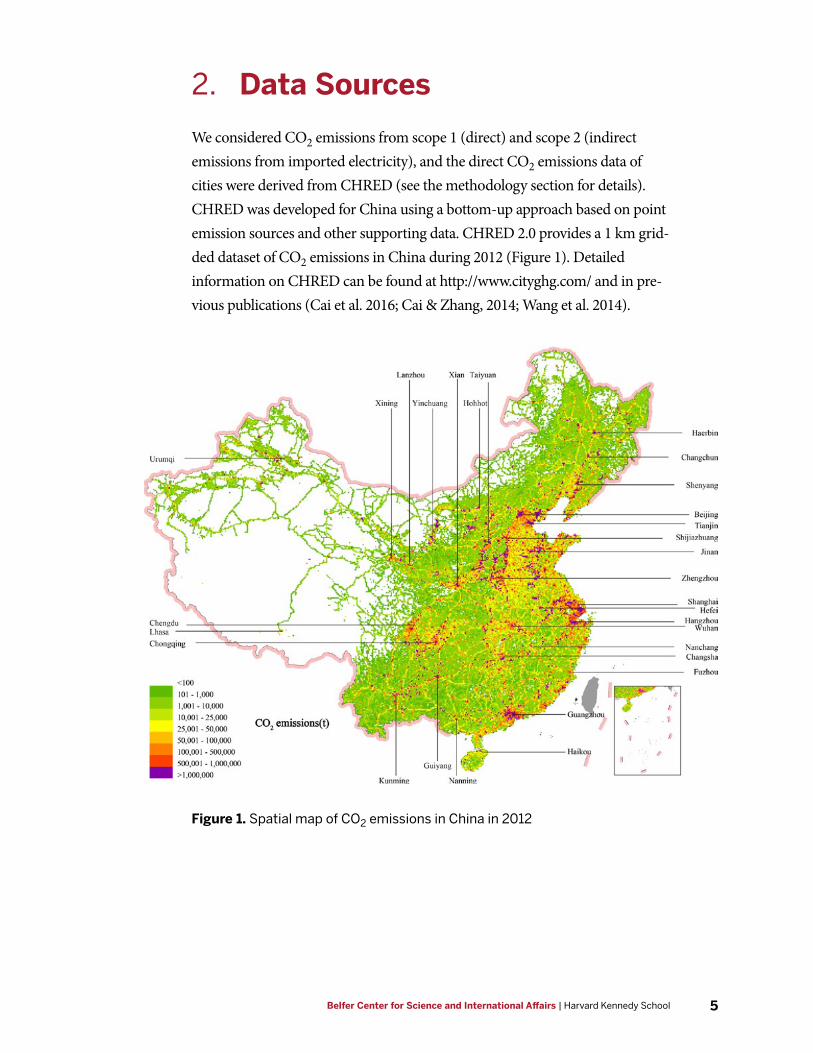
We considered CO2 emissions from scope 1 (direct) and scope 2 (indirect emissions from imported electricity), and the direct CO2 emissions data of cities were derived from CHRED (see the methodology section for details). CHRED was developed for China using a bottom-up approach based on point emission sources and other supporting data. CHRED 2.0 provides a 1 km grid-ded dataset of CO2 emissions in China during 2012 (Figure 1). Detailed information on CHRED can be found at http://www.cityghg.com/ and in pre-vious publications (Cai et al. 2016; Cai & Zhang, 2014; Wang et al. 2014).
Figure 1. Spatial map of CO2 emissions in China in 2012

6 High-resolution Carbon Emissions Data for Chinese Cities
The indirect emissions of a city are calculated by multiplying the volume of imported electricity by the emission factor of the city (see the methodology section for details). Electricity generation data from fossil fuel power plants for each city were obtained from CHRED. Data regarding electricity gen-eration from non-fossil fuel power plants for each city were from the 2012 Power Industry Statistics (China Electricity Council, 2016). Total electricity consumption data for each city were obtained from the China City Statisti-cal Yearbook (Department of Urban Socioeconomic Investigation, 2014).

7Belfer Center for Science and International Affairs | Harvard Kennedy School
3. Results
Calculating the carbon emissions from 288 Chinese cities (Figure 2) based on the bottom-up carbon emission inventories, the total emissions from 288 cities is 9,723 MMT CO2 for administrative boundary scope 1 emis-sions and 933 MMT CO2 for scope 2 emissions. The aggregated CO2 emissions from 288 cities is even higher than the total emissions from the United States (the second largest emitter) and is equivalent to China’s total carbon emissions. The results show that 288 cities have varied per capita emissions and emission intensities. Cities could have high levels of emis-sions per capita and low levels of GDP per capita, and vice versa. The results indicate that both low-carbon and carbon-intensive pathways exist in China’s urbanization process. The per capita CO2 is not related to the per capita GDP.
Figure 2. CO2 emissions from 288 Chinese Cities

8 High-resolution Carbon Emissions Data for Chinese Cities
The majority of cities (272 cities, 94%) have emissions below 100 MMT, and most cities (223 cities, 77%) have emissions below 50 MMT (Figure 3). There are 37 cities with emissions below 10 MMT. Two cities, Shanghai and Tangshan, have emissions exceeding 200 MMT. Nineteen cities have emis-sions of over 100 MMT. Most cities have emissions ranging between 15 and 20 MMT.
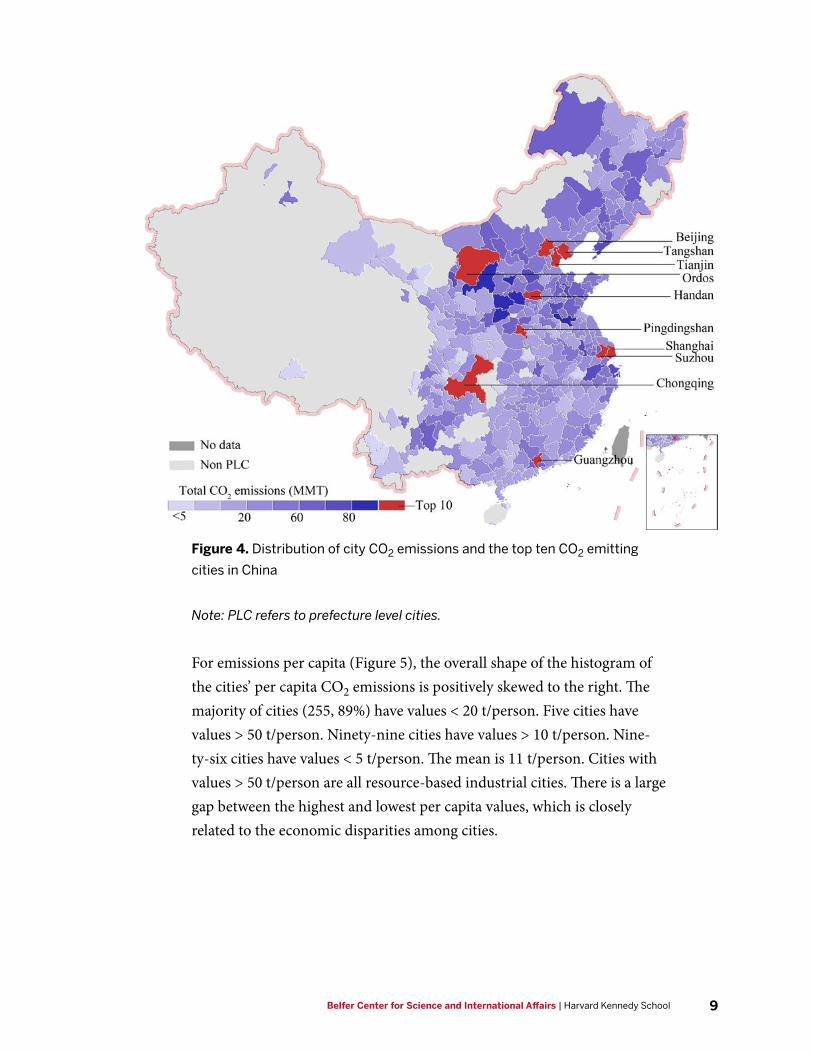
On average, the CO2 emissions of Chinese cities were approximately 36 MMT in 2012. Cities with high CO2 emissions are generally located in the north, northeast and coastal areas of China (Figure 4). For example, the cities with the highest CO2 emissions are Beijing, Tianjin, Tangshan, Ordos, Shanghai and Suzhou, which exceeded 150 MMT annually in 2012. Low CO2 emission cities are generally located in less developed regions, such as the south, southwest and northwest of China. The exception is Chongqing, which emits 192 MMT CO2, ranking as the third highest CO2 emitter in China.
Figure 3. Histogram of the total emissions of cities
Total emissions (MMT)
Num
ber o
f citi
es
0 50 100 150 200 2500
10
20
30
40
50
Mean = 37 MMTMedian = 26 MMT
9Belfer Center for Science and International Affairs | Harvard Kennedy School
Figure 4. Distribution of city CO2 emissions and the top ten CO2 emitting
cities in China
Note: PLC refers to prefecture level cities.
For emissions per capita (Figure 5), the overall shape of the histogram of the cities’ per capita CO2 emissions is positively skewed to the right. The majority of cities (255, 89%) have values < 20 t/person. Five cities have values > 50 t/person. Ninety-nine cities have values > 10 t/person. Nine-ty-six cities have values < 5 t/person. The mean is 11 t/person. Cities with values > 50 t/person are all resource-based industrial cities. There is a large gap between the highest and lowest per capita values, which is closely related to the economic disparities among cities.
10 High-resolution Carbon Emissions Data for Chinese Cities
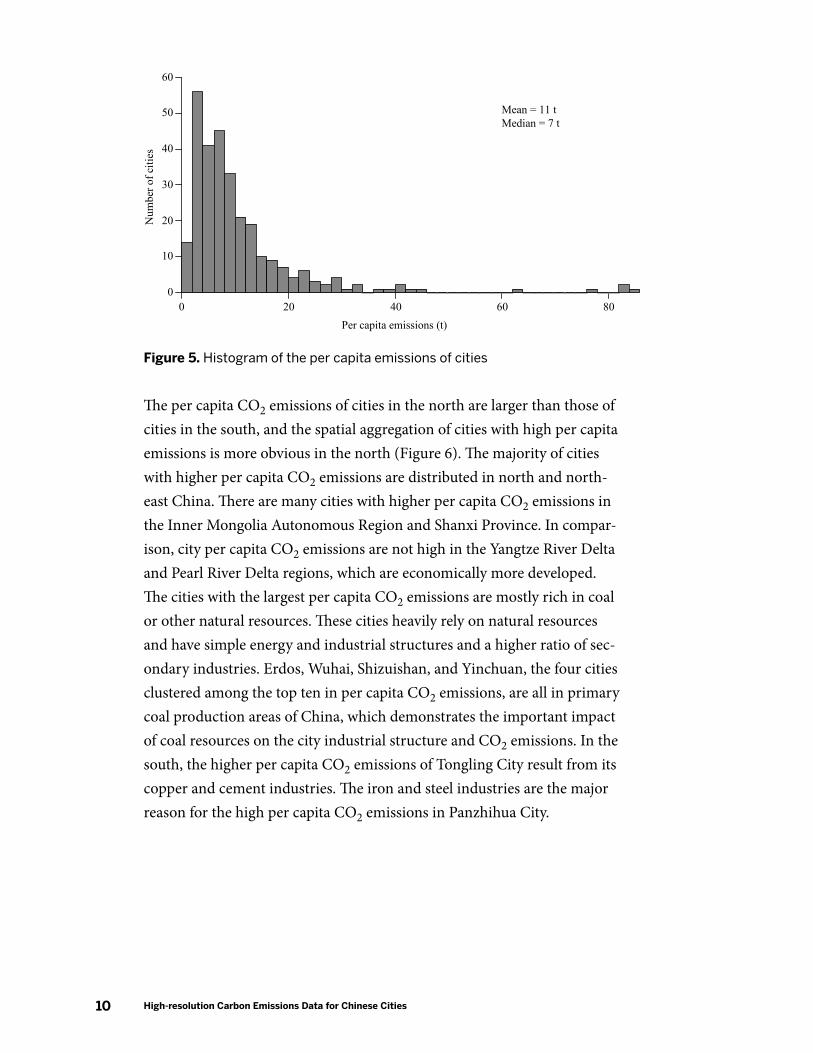
Figure 5. Histogram of the per capita emissions of cities
The per capita CO2 emissions of cities in the north are larger than those of cities in the south, and the spatial aggregation of cities with high per capita emissions is more obvious in the north (Figure 6). The majority of cities with higher per capita CO2 emissions are distributed in north and north-east China. There are many cities with higher per capita CO2 emissions in the Inner Mongolia Autonomous Region and Shanxi Province. In compar-ison, city per capita CO2 emissions are not high in the Yangtze River Delta and Pearl River Delta regions, which are economically more developed. The cities with the largest per capita CO2 emissions are mostly rich in coal or other natural resources. These cities heavily rely on natural resources and have simple energy and industrial structures and a higher ratio of sec-ondary industries. Erdos, Wuhai, Shizuishan, and Yinchuan, the four cities clustered among the top ten in per capita CO2 emissions, are all in primary coal production areas of China, which demonstrates the important impact of coal resources on the city industrial structure and CO2 emissions. In the south, the higher per capita CO2 emissions of Tongling City result from its copper and cement industries. The iron and steel industries are the major reason for the high per capita CO2 emissions in Panzhihua City.
0 20 40 60 800
10
20
30
40
50
60
Per capita emissions (t)
Num
ber o
f citi
es
Mean = 11 tMedian = 7 t

11Belfer Center for Science and International Affairs | Harvard Kennedy School
Figure 6. Distribution of the city per capita CO2 emissions, and the top ten
CO2 emitting cities in China
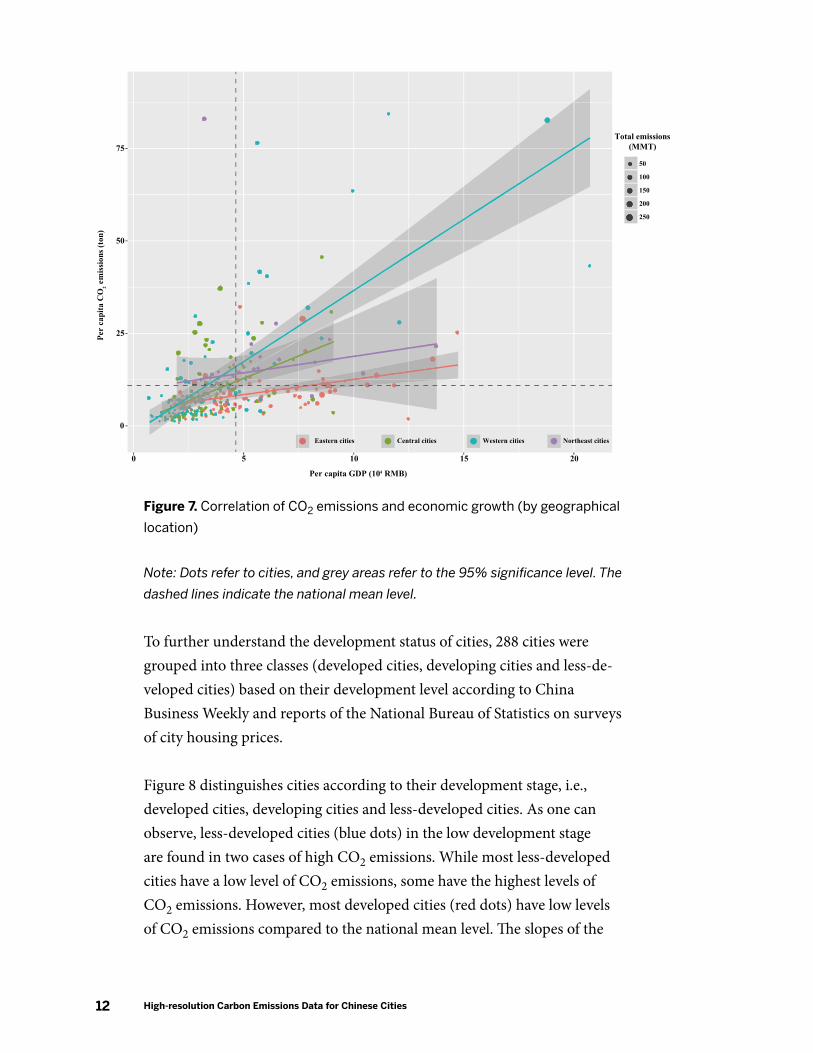
Figure 7 distinguishes cities by their geographical location, i.e., eastern, central, western and northeastern China. We find that cities in western China (blue dots) have low levels of economic development, whereas the CO2 emissions in some western cities are high compared to the national mean level. Cities in the center and northeast areas have intermediate levels of economic development and CO2 emissions. Although cities in the east of China (red dots) have advanced economic development relative to the national mean level, they also include cities with the lowest CO2 emissions. The pattern of fitted lines is in line with the previous graphical patterns. In China, most eastern cities are developed cities, and the service industry is much important there. Therefore, these two driving forces may explain the low carbon development in eastern cities.
12 High-resolution Carbon Emissions Data for Chinese Cities
Figure 7. Correlation of CO2 emissions and economic growth (by geographical
location)
Note: Dots refer to cities, and grey areas refer to the 95% significance level. The
dashed lines indicate the national mean level.
To further understand the development status of cities, 288 cities were grouped into three classes (developed cities, developing cities and less-de-veloped cities) based on their development level according to China Business Weekly and reports of the National Bureau of Statistics on surveys of city housing prices.
Figure 8 distinguishes cities according to their development stage, i.e., developed cities, developing cities and less-developed cities. As one can observe, less-developed cities (blue dots) in the low development stage are found in two cases of high CO2 emissions. While most less-developed cities have a low level of CO2 emissions, some have the highest levels of CO2 emissions. However, most developed cities (red dots) have low levels of CO2 emissions compared to the national mean level. The slopes of the
●●
●
●
●
●●
●
●
●
●
●
●
● ●
●
●
●
●
●
●
●
●
●●●
●
●●
●
● ●
●
●●
●
●●
●
●
●
●● ●● ●
●
●●● ●
●
●
●
●
●●
●
●●
●●
●
●●● ●
●
●
●
●
●
●● ●
●●
●
●●●
●
●●
●
●
●
●●
●
●
●
●●
●
●
●
●●
●●
●
●
●
●
●●
●
●
●
●
●●
●
●
●
●
●●
●
●●
●
●●
●●●
●●●
●
●
●●
●● ●
● ●
●
●
●●
●
●
●
●
●● ●
●
● ●● ●●
●
●●●●
●●●
●
●
●
●●
●
●
●
●
●
●
●
●
●
●
●
●●●
●
●
●
●
● ●
●
●● ●●● ●●●●●●●●
●●●●●●●●●● ●● ●●
●●●●●● ●●●●●●
●●●●●●●●●●●●
●●●●●●
●●●●●●●●●●●●●●●● ●●●●●●
●●●●●●●●●●●●●●●●●●●●●●●●●●
●
●
●
●
● ●
●
●●●●●●●●●
●●●
●
●
●
●●
●●●●● ●
●●● ●●●
●●●●●●
●
●●●●●●●●●●●● ●
●●●●●●●●●●●●● ●●●●●●●●●●● ● ●●●
●
●●
●
●●●● ●
●
●●●
●●● ●●●●●●●
●
●●●●●●●
●●
●●●●
● ●●
●
●●●
●
●●●●●●●●●●
●
●
●●●●●●
●●●●●●●●●●●●●●
●
●●
●
●
●●
●●●
0
25
50
75
0 5 10 15 20
Per
capi
ta C
O2 e
miss
ions
(ton
)
Per capita GDP (104 RMB)
Total emissions(MMT)
●●
●●●●●●●●
50
100
150
200
250
Eastern cities Western citiesCentral cities Northeast cities

13Belfer Center for Science and International Affairs | Harvard Kennedy School
fitted lines decrease as the level of development increases, i.e., developed cities have the flattest fitted line and greatest potential for low-carbon eco-nomic development, which is partially explained by the outsourcing of heavy industries to the less-developed neighboring regions.
Figure 8. Correlation of CO2 emissions and economic growth (by the city’s
development stage; 288 cities were grouped into three classes (developed
cities, developing cities and less-developed cities) based on their development
level according to China Business Weekly and reports of the National Bureau
of Statistics on surveys of city housing prices.)
Note: Dots refer to cities, and grey areas refer to the 95% significance level. The
dashed lines indicate the national mean level.
●●
●
●●
●●
●●
●
●
●
●
●
●
●
●
●
●
●
●
●
●
●
●
●
●
●●●
●
●●
● ●
●
●
●
●
●
●
●
●
●
●
●● ●● ●
●
●●
●
● ●●
●●
●●
●
●●●
●
●
●
●
●
●
●
●
●
●
●
●
●
●
●●
●
●
●●
●
●
●
●●
●
●
●
●
●
●
●
●●
●
●
●
●●●
●
●
●●
●
●
●●
●● ●
●
●
●● ●
●
● ●
●
●
● ●●
●
●
●
●
●
●
●
●
●
●
●
●●
●
●
●
●
● ●
●
●●●●
●●●●●●●●●●
●●●● ●●●●●●●●●●●●●●
●●●●●
●
●●●●●●●●●●
●● ●●●●●●●●●●
●●●●●●●●●●●●●●●●●●●●●●●●●●●●●●●●●●●●●● ●●
●● ● ●●
● ●●●●●●●●●●●●●●●●●●●●● ●●
●
● ●●●●●●●●●●●
●
●
●●●●●●●●●●●●●●
●●●
●●●●●●●●●●●●●●●●●●●●●●●●●●
●●
●
●●
●
●●●●●●●●●●●●●●●●
●
●
●
●
●
●
●
●
●●●●●
●●●●●●●●●●●●●
●
●
●●
●●●
●●●●●●●●●●
●●●●●●●●●●●
● ●●●●●● ● ●●●●
●
●●●●●●●●●
●●●●●●●●●●●●●●●●●●●●●●●●●●●●●
0
25
50
75
0 5 10 15 20
Per
capi
ta C
O2 e
miss
ions
(ton
)
Per capita GDP (104 RMB)
Total emissions(MMT)
●●
●●●●●●●●
50
100
150
200
250
Developed cities Less developed citiesDeveloping cities

14 High-resolution Carbon Emissions Data for Chinese Cities
4. Discussion and Policy Suggestions
Urbanization is considered to be one of the main drivers accelerating economic growth and related CO2 emissions in China. The processes of industrialization and urbanization will continue for decades and will continue to be a great challenge for Chinese cities to respond to climate change. From our observations, we suggest that city-level CO2 emissions inventory data in China should be strengthened, especially for prefecture level cities. The inadequate energy census capacities of cities have hindered the development of an inventory system of city-level CO2 emissions that covers all prefecture-level cities, which constrains the low carbon devel-opment of cities. The availability and quality of city-level CO2 emissions data directly influences scientific research on city carbon emissions, for-mulation of low carbon strategies, and public monitoring and participation in low-carbon development at the city level. It is imperative to establish a comprehensive energy statistical system at the level of prefecture cities. Therefore, an inventory database of city CO2/greenhouse gas emissions should be established. Standardization of the determination of city-level carbon emissions and public access to data could also be accelerated. How-ever, within the context of the current inadequate energy data, it is feasible to establish an inventory of city-level CO2 emissions based on CHRED to support research on city-level carbon emissions and to aid local govern-ment decision-making for low-carbon development.
Furthermore, an individual city’s responsibility for emissions reduction and the portion of the national goal for emissions reduction should be established using a bottom-up approach based on specific CO2 emission levels and the potential for emission reductions within each city. China submitted the Intended Nationally Determined Contribution (INDC) document to the secretariat of the United Nations Framework Convention on Climate Change in June 2015. In this document, China established a goal of reaching peak CO2 emissions by 2030 or earlier and a 60% to 65% reduction of CO2 emissions/per GDP from the 2005 levels. The national carbon emissions goal will be assigned to provinces and, eventually, to pre-fecture-level cities. Prefecture-level cities will become important units for

15Belfer Center for Science and International Affairs | Harvard Kennedy School
achieving the carbon emission control goals. However, carbon emission reduction involves many components, such as fairness, justice, rationality, and efficiency. China is in a period of rapid economic development, and regions are developing at different rates. There are large differences among cities in terms of the total amount and intensity of emissions. A simple top-down assignment approach (national goal →provincial goal →city goal) may cause inequality among regions and cities and hinder the achievement of the maximum efficiency of emission reduction. Focusing on regions or cities with more emissions reduction potential and lower costs would be more productive. Therefore, we recommend that the emissions reduction potential for each city should be measured via analysis and comparison. This process should consider city emission inventories and social and eco-nomic development levels. City emission goals should be determined using a comparative analysis among cities. The province goals should be deter-mined based on the affiliated city goals. Furthermore, the province goals should be compared with the national goal, and any identified gaps can be reconciled with the cities. The national goal will ultimately be achieved using a bottom-up approach (city goal→ provincial goal →national goal) through multiple analyses and optimizations. This approach will result in reasonable and fair assignment of cities’ responsibilities for emissions reduction.
Finally, comparative and benchmarking research on city CO2 emissions should be conducted, and a Top Runner system of city CO2 emissions reduction should be established. A Top Runner system is a set of carbon emission efficiency standards that takes into account the lowest per capita emission or lowest emission per GDP in cities. Carbon emission efficiency targets are set to be achieved within a given number of years on the basis of the most efficient model on the market (the ‘Top Runner’). Due to the lack of a city-level CO2 emissions inventory system, it is difficult for cities to determine their specific and attainable low-carbon development goals through valid comparison and consultation. It is also difficult for cities to establish their own positions among other cities in China as well as in their city category (such as categories based on similar industrial struc-tures, populations, or economic development). Cities need to set targets based on national or provincial targets or by using international cities as references. We recommend that horizontal comparisons and evaluations

16 High-resolution Carbon Emissions Data for Chinese Cities
of CO2 emissions be made among different categories of cities using the city CO2 emissions inventories based on CHRED. We also recommend establishing a city-level Top Runner system for CO2 emissions reduction. The system will promote comparison and competition between cities for the determination of low-carbon development goals as well as in the application of low-carbon development strategies. Superior organizations, such as the local and central governments, should implement policies that provide awards to the Top Runner cities that achieve the largest reduction and to motivate information sharing. In the meantime, we recommended enhancing local government and public concerns about city-level CO2 emissions. We also encourage public involvement in the monitoring and management of city-level CO2 emissions and the enhancement of low-car-bon development.
17Belfer Center for Science and International Affairs | Harvard Kennedy School
5. Methodology
5.1 Emissions categories and inventory scopes
Anthropogenic CO2 emissions mainly come from six major sources: fossil fuel combustion, industrial processes, waste treatment, land use change and deforestation. This study calculates CO2 emissions from fossil fuel combustion and cement production, which is consistent with the methods used by international agencies for establishing carbon emission inventories.
Cross-boundary exchange of energy supplies, goods and materials make regional emissions inventories variable across different system boundaries. On the basis of the academic literature and previous studies, we establish two types of scopes for emission inventories. Scope 1 emissions include direct carbon emissions within the territorial boundary caused by the direct use of primary energy through industrial activity. Scope 2 emissions include emissions from purchased electricity, where the emissions are gen-erated by upstream power plants outside of the territorial boundary.
5.2 Scope 1 emissions calculation
Scope 1 emissions calculations are widely used for national emission inventories. The IPCC guidelines for greenhouse gas emission inventories proposed two tiers of methodology for calculating scope 1 emissions, the “top-down” reference approach and the “bottom-up” sectoral approach. The main difference between these two tiers is the collection of energy consumption as activity data, in which the reference approach uses the total energy consumption data, which includes estimated energy produc-tion, stock, imports and exports. The sectoral approach uses the energy consumption of individual sectors. For the sectoral approach, sectoral level emission factors should also be used.
18 High-resolution Carbon Emissions Data for Chinese Cities
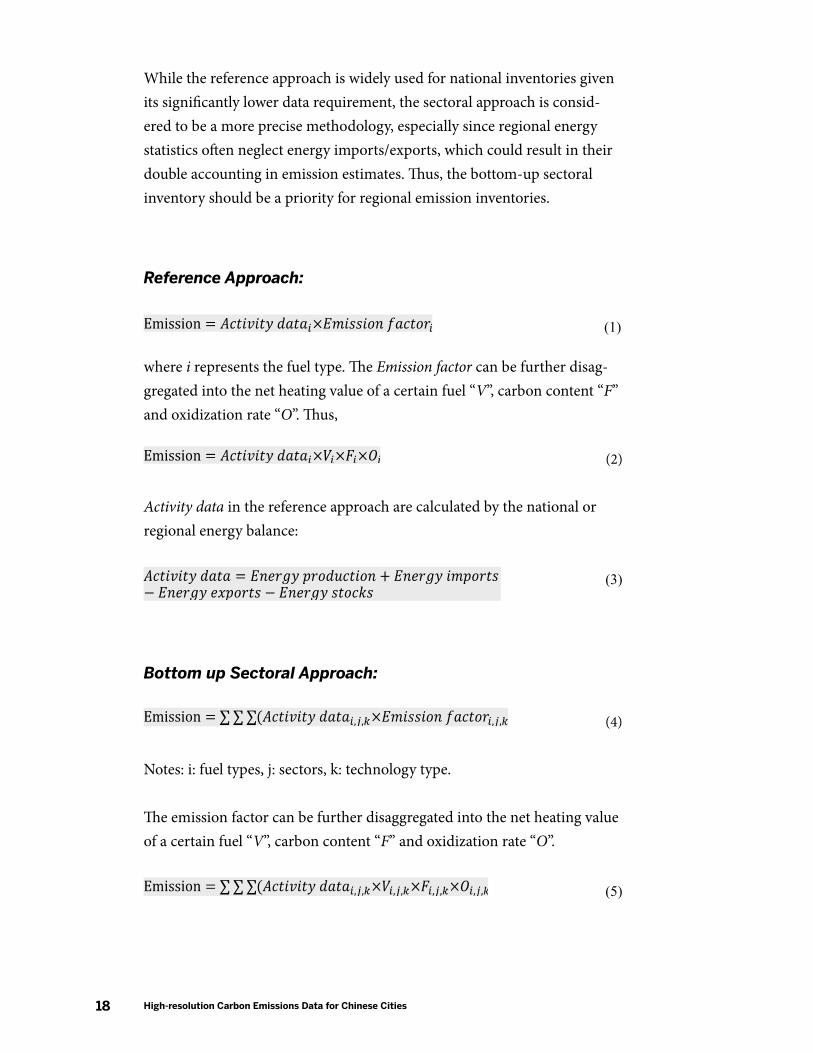
While the reference approach is widely used for national inventories given its significantly lower data requirement, the sectoral approach is consid-ered to be a more precise methodology, especially since regional energy statistics often neglect energy imports/exports, which could result in their double accounting in emission estimates. Thus, the bottom-up sectoral inventory should be a priority for regional emission inventories.
Reference Approach:
(1)
where i represents the fuel type. The Emission factor can be further disag-gregated into the net heating value of a certain fuel “V”, carbon content “F” and oxidization rate “O”. Thus,
(2)
Activity data in the reference approach are calculated by the national or regional energy balance:
(3)
Bottom up Sectoral Approach:
(4)
Notes: i: fuel types, j: sectors, k: technology type.
The emission factor can be further disaggregated into the net heating value of a certain fuel “V”, carbon content “F” and oxidization rate “O”.
(5)

19Belfer Center for Science and International Affairs | Harvard Kennedy School
5.3 Scope 2 emissions calculation
Scope 2 emissions include emissions from power generation of pur-chased electricity; the emission factor for purchased electricity needs to be calculated by considered the corresponding direct emissions of power gen-eration. For China’s power supply system, electricity is supplied by regional grids; currently six grids cover the 30 mainland provinces. Thus, the emis-sion factors of electricity supplied by each grid can be calculated as:
(6)
where Emissionl represents the emissions of electricity for l gird. Emissionl can be calculated by the aggregate of the emissions from provinces that the l state grid serves. El is the total electricity supply for l state grid, which contains the electricity from power plants, renewable energy and other sources.
Electricity generation data from fossil fuel power plants in each city were obtained from CHRED. Data for electricity generation from non-fossil fuel power plants in each city were from the 2012 Power Industry Statistics (China Electricity Council, 2016). Total electricity consumption data for each city were obtained from the China city statistical Yearbook (Depart-ment of Urban Socioeconomic Investigation, 2014).
20 High-resolution Carbon Emissions Data for Chinese Cities
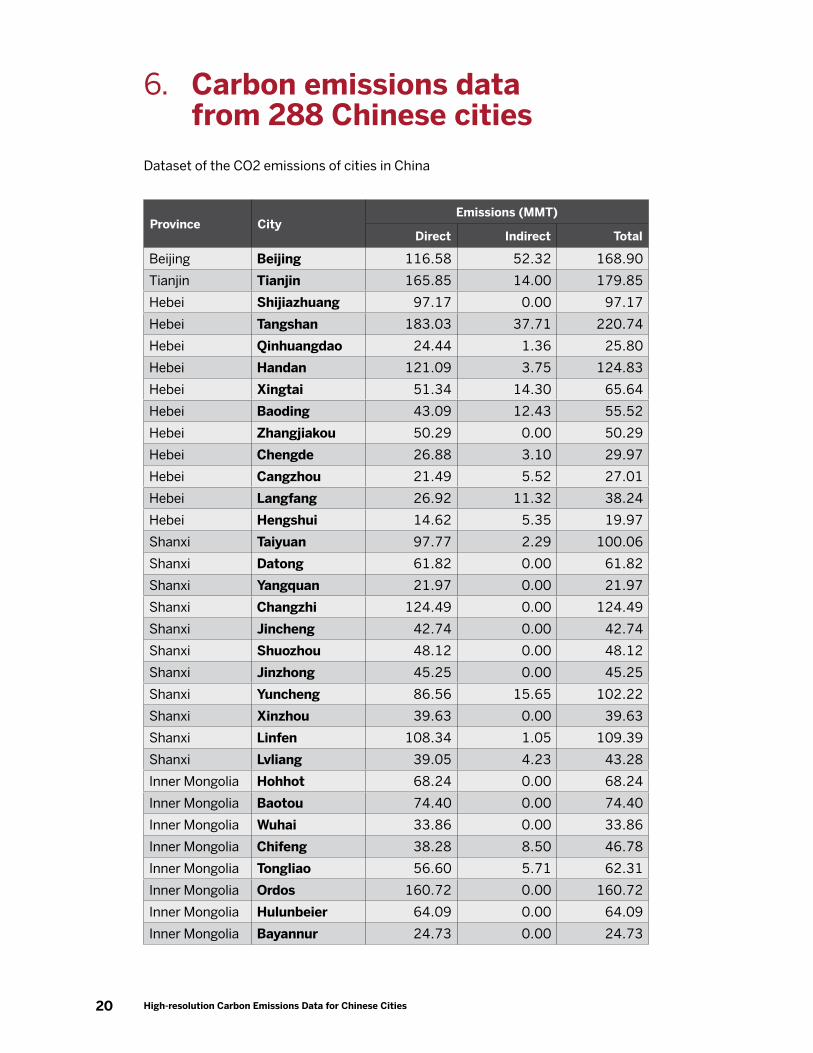
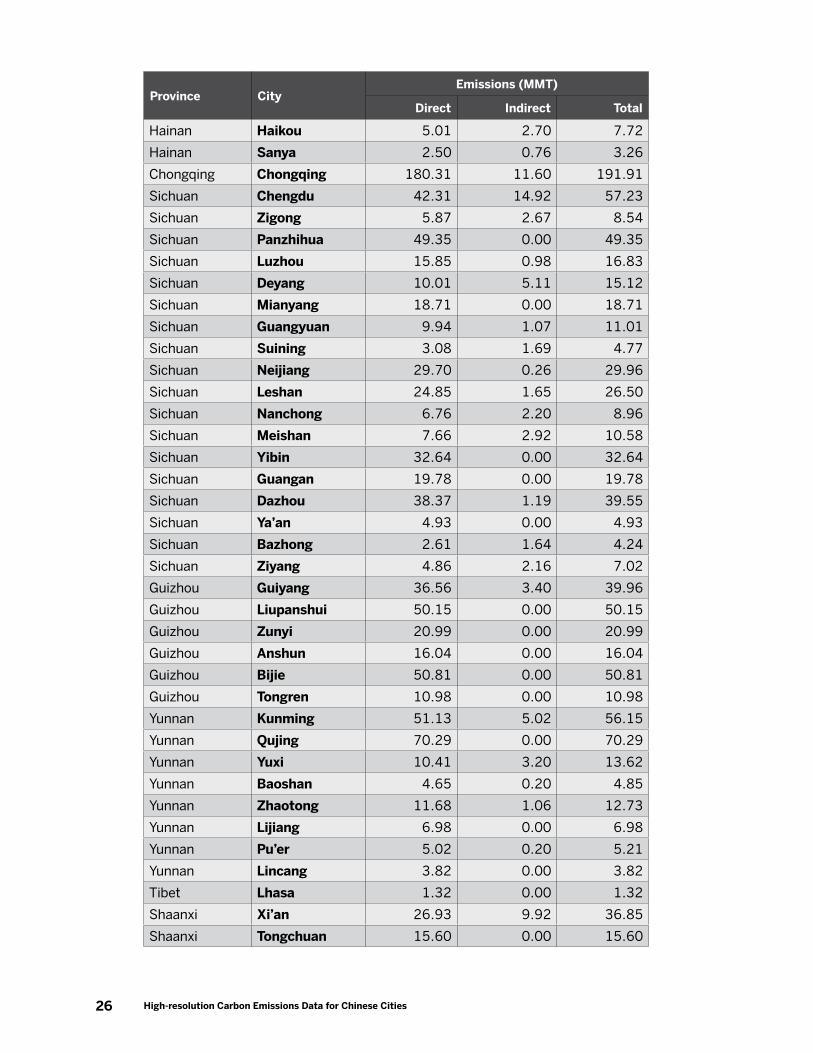
6. Carbon emissions data from 288 Chinese cities
Dataset of the CO2 emissions of cities in China
Province CityEmissions (MMT)
Direct Indirect Total
Beijing Beijing 116.58 52.32 168.90
Tianjin Tianjin 165.85 14.00 179.85
Hebei Shijiazhuang 97.17 0.00 97.17
Hebei Tangshan 183.03 37.71 220.74
Hebei Qinhuangdao 24.44 1.36 25.80
Hebei Handan 121.09 3.75 124.83
Hebei Xingtai 51.34 14.30 65.64
Hebei Baoding 43.09 12.43 55.52
Hebei Zhangjiakou 50.29 0.00 50.29
Hebei Chengde 26.88 3.10 29.97
Hebei Cangzhou 21.49 5.52 27.01
Hebei Langfang 26.92 11.32 38.24
Hebei Hengshui 14.62 5.35 19.97
Shanxi Taiyuan 97.77 2.29 100.06
Shanxi Datong 61.82 0.00 61.82
Shanxi Yangquan 21.97 0.00 21.97
Shanxi Changzhi 124.49 0.00 124.49
Shanxi Jincheng 42.74 0.00 42.74
Shanxi Shuozhou 48.12 0.00 48.12
Shanxi Jinzhong 45.25 0.00 45.25
Shanxi Yuncheng 86.56 15.65 102.22
Shanxi Xinzhou 39.63 0.00 39.63
Shanxi Linfen 108.34 1.05 109.39
Shanxi Lvliang 39.05 4.23 43.28
Inner Mongolia Hohhot 68.24 0.00 68.24
Inner Mongolia Baotou 74.40 0.00 74.40
Inner Mongolia Wuhai 33.86 0.00 33.86
Inner Mongolia Chifeng 38.28 8.50 46.78
Inner Mongolia Tongliao 56.60 5.71 62.31
Inner Mongolia Ordos 160.72 0.00 160.72
Inner Mongolia Hulunbeier 64.09 0.00 64.09
Inner Mongolia Bayannur 24.73 0.00 24.73
21Belfer Center for Science and International Affairs | Harvard Kennedy School
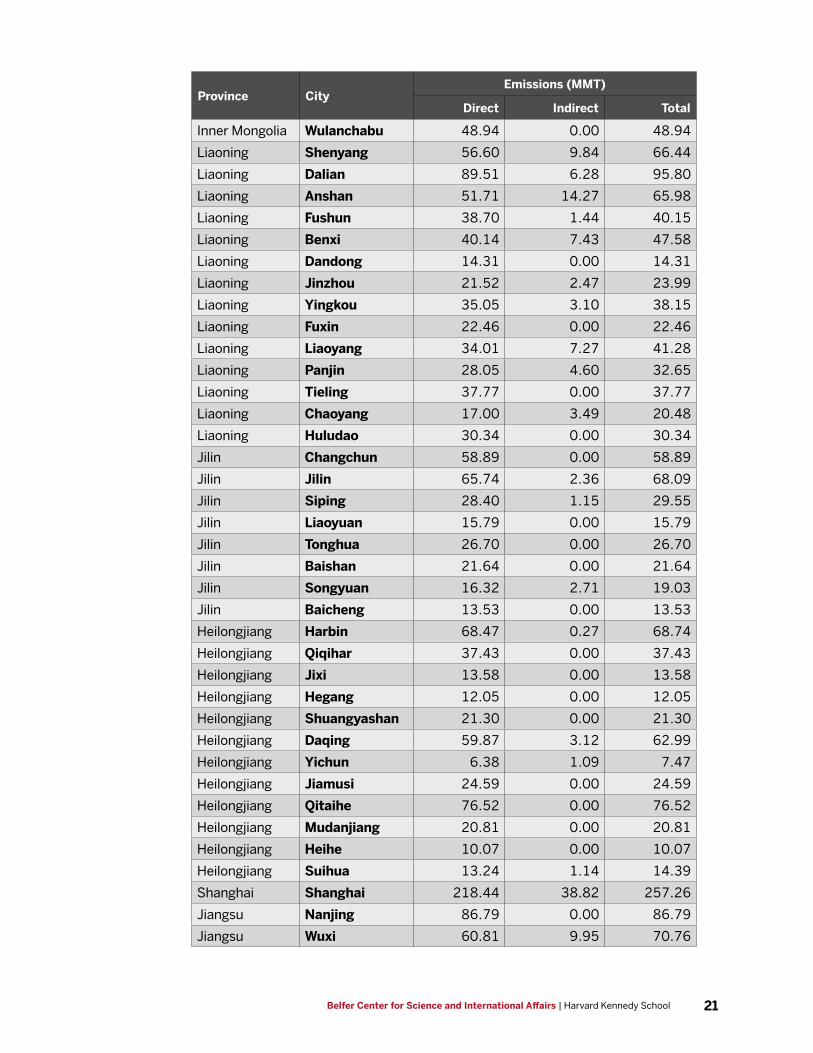
Province CityEmissions (MMT)
Direct Indirect Total
Inner Mongolia Wulanchabu 48.94 0.00 48.94
Liaoning Shenyang 56.60 9.84 66.44
Liaoning Dalian 89.51 6.28 95.80
Liaoning Anshan 51.71 14.27 65.98
Liaoning Fushun 38.70 1.44 40.15
Liaoning Benxi 40.14 7.43 47.58
Liaoning Dandong 14.31 0.00 14.31
Liaoning Jinzhou 21.52 2.47 23.99
Liaoning Yingkou 35.05 3.10 38.15
Liaoning Fuxin 22.46 0.00 22.46
Liaoning Liaoyang 34.01 7.27 41.28
Liaoning Panjin 28.05 4.60 32.65
Liaoning Tieling 37.77 0.00 37.77
Liaoning Chaoyang 17.00 3.49 20.48
Liaoning Huludao 30.34 0.00 30.34
Jilin Changchun 58.89 0.00 58.89
Jilin Jilin 65.74 2.36 68.09
Jilin Siping 28.40 1.15 29.55
Jilin Liaoyuan 15.79 0.00 15.79
Jilin Tonghua 26.70 0.00 26.70
Jilin Baishan 21.64 0.00 21.64
Jilin Songyuan 16.32 2.71 19.03
Jilin Baicheng 13.53 0.00 13.53
Heilongjiang Harbin 68.47 0.27 68.74
Heilongjiang Qiqihar 37.43 0.00 37.43
Heilongjiang Jixi 13.58 0.00 13.58
Heilongjiang Hegang 12.05 0.00 12.05
Heilongjiang Shuangyashan 21.30 0.00 21.30
Heilongjiang Daqing 59.87 3.12 62.99
Heilongjiang Yichun 6.38 1.09 7.47
Heilongjiang Jiamusi 24.59 0.00 24.59
Heilongjiang Qitaihe 76.52 0.00 76.52
Heilongjiang Mudanjiang 20.81 0.00 20.81
Heilongjiang Heihe 10.07 0.00 10.07
Heilongjiang Suihua 13.24 1.14 14.39
Shanghai Shanghai 218.44 38.82 257.26
Jiangsu Nanjing 86.79 0.00 86.79
Jiangsu Wuxi 60.81 9.95 70.76

22 High-resolution Carbon Emissions Data for Chinese Cities
Province CityEmissions (MMT)
Direct Indirect Total
Jiangsu Xuzhou 105.20 0.00 105.20
Jiangsu Changzhou 40.17 18.70 58.87
Jiangsu Suzhou 136.94 23.51 160.45
Jiangsu Nantong 39.54 0.00 39.54
Jiangsu Lianyungang 13.75 0.00 13.75
Jiangsu Huai’an 23.44 2.30 25.74
Jiangsu Yancheng 23.84 9.52 33.36
Jiangsu Yangzhou 33.06 0.00 33.06
Jiangsu Zhenjiang 46.61 0.00 46.61
Jiangsu Taizhou 31.69 5.58 37.27
Jiangsu Suqian 8.11 12.67 20.78
Zhejiang Hangzhou 52.23 29.40 81.62
Zhejiang Ningbo 87.72 0.00 87.72
Zhejiang Wenzhou 28.52 13.62 42.14
Zhejiang Jiaxing 44.22 0.00 44.22
Zhejiang Huzhou 31.39 4.31 35.70
Zhejiang Shaoxing 36.51 13.27 49.78
Zhejiang Jinhua 30.48 9.70 40.18
Zhejiang Quzhou 28.86 6.49 35.36
Zhejiang Zhoushan 4.82 0.70 5.53
Zhejiang Taizhou 31.95 0.00 31.95
Zhejiang Lishui 6.67 5.33 12.00
Anhui Hefei 49.37 3.03 52.41
Anhui Wuhu 39.24 0.00 39.24
Anhui Bengbu 12.95 0.00 12.95
Anhui Huainan 54.49 0.00 54.49
Anhui Ma’anshan 42.38 0.00 42.38
Anhui Huaibei 19.05 0.00 19.05
Anhui Tongling 33.10 0.00 33.10
Anhui Anqing 23.43 4.34 27.77
Anhui Huangshan 2.15 1.86 4.01
Anhui Chuzhou 11.62 4.05 15.67
Anhui Fuyang 16.61 4.32 20.92
Anhui Suzhou 14.19 0.00 14.19
Anhui Lu’an 15.44 4.92 20.36
Anhui Bozhou 4.65 5.09 9.74
Anhui Chizhou 19.39 0.30 19.68
Anhui Xuancheng 19.29 1.17 20.47

23Belfer Center for Science and International Affairs | Harvard Kennedy School
Province CityEmissions (MMT)
Direct Indirect Total
Fujian Fuzhou 23.96 0.00 23.96
Fujian Xiamen 15.80 6.70 22.50
Fujian Putian 9.15 1.81 10.96
Fujian Sanming 30.18 3.15 33.33
Fujian Quanzhou 40.80 16.30 57.10
Fujian Zhangzhou 26.92 0.00 26.92
Fujian Nanping 11.62 4.82 16.43
Fujian Longyan 33.00 1.19 34.19
Fujian Ningde 16.29 0.00 16.29
Jiangxi Nanchang 13.55 4.74 18.29
Jiangxi Jingdezhen 14.85 0.00 14.85
Jiangxi Pingxiang 16.06 2.89 18.95
Jiangxi Jiujiang 21.92 1.59 23.52
Jiangxi Xinyu 19.22 1.27 20.49
Jiangxi Yingtan 8.06 0.00 8.06
Jiangxi Ganzhou 15.12 3.48 18.60
Jiangxi Ji’an 12.86 0.00 12.86
Jiangxi Yichun 29.05 0.00 29.05
Jiangxi Fuzhou 5.00 2.39 7.39
Jiangxi Shangrao 18.29 1.68 19.98
Shandong Jinan 52.83 11.94 64.76
Shandong Qingdao 41.03 12.87 53.90
Shandong Zibo 90.68 1.67 92.35
Shandong Zaozhuang 50.91 0.00 50.91
Shandong Dongying 46.65 5.13 51.78
Shandong Yantai 47.80 7.38 55.18
Shandong Weifang 61.22 15.93 77.15
Shandong Jining 90.93 0.00 90.93
Shandong Tai’an 32.87 0.00 32.87
Shandong Weihai 28.20 0.00 28.20
Shandong Rizhao 37.48 3.63 41.12
Shandong Laiwu 42.09 0.00 42.09
Shandong Linyi 61.34 16.92 78.26
Shandong Dezhou 42.00 0.53 42.54
Shandong Liaocheng 36.63 0.39 37.02
Shandong Binzhou 43.19 0.00 43.19
Shandong Heze 35.59 5.81 41.40
Henan Zhengzhou 78.94 0.00 78.94

24 High-resolution Carbon Emissions Data for Chinese Cities
Province CityEmissions (MMT)
Direct Indirect Total
Henan Kaifeng 13.91 4.41 18.31
Henan Luoyang 64.25 0.00 64.25
Henan Pingdingshan 136.63 0.00 136.63
Henan Anyang 33.10 7.51 40.61
Henan Hebi 32.50 0.00 32.50
Henan Xinxiang 33.76 3.41 37.17
Henan Jiaozuo 32.84 5.95 38.79
Henan Puyang 8.46 2.94 11.40
Henan Xuchang 27.64 0.00 27.64
Henan Luohe 9.33 0.52 9.85
Henan Sanmenxia 35.74 0.00 35.74
Henan Nanyang 30.55 0.85 31.39
Henan Shangqiu 52.44 6.74 59.18
Henan Xinyang 15.42 0.00 15.42
Henan Zhoukou 9.78 4.54 14.31
Henan Zhumadian 19.90 0.00 19.90
Hubei Wuhan 63.44 7.73 71.17
Hubei Huangshi 26.91 1.19 28.10
Hubei Shiyan 9.80 0.00 9.80
Hubei Yichang 33.44 0.00 33.44
Hubei Xiangyang 25.31 0.00 25.31
Hubei Ezhou 18.44 0.00 18.44
Hubei Jingmen 22.32 0.00 22.32
Hubei Xiaogan 17.18 0.22 17.40
Hubei Jingzhou 12.01 1.50 13.50
Hubei Huanggang 18.83 0.00 18.83
Hubei Xianning 10.03 0.00 10.03
Hubei Suizhou 3.04 0.81 3.85
Hunan Changsha 17.32 6.61 23.93
Hunan Zhuzhou 17.70 0.12 17.82
Hunan Xiangtan 22.85 2.25 25.10
Hunan Hengyang 16.53 4.69 21.22
Hunan Shaoyang 15.15 2.19 17.34
Hunan Yueyang 23.96 1.42 25.38
Hunan Changde 19.83 0.00 19.83
Hunan Zhangjiajie 3.62 0.00 3.62
Hunan Yiyang 13.45 0.00 13.45
Hunan Chenzhou 23.38 0.00 23.38

25Belfer Center for Science and International Affairs | Harvard Kennedy School
Province CityEmissions (MMT)
Direct Indirect Total
Hunan Yongzhou 9.74 2.45 12.19
Hunan Huaihua 10.39 0.00 10.39
Hunan Loudi 34.54 0.57 35.11
Guangdong Guangzhou 123.54 19.73 143.27
Guangdong Shaoguan 24.82 0.16 24.98
Guangdong Shenzhen 19.15 1.48 20.63
Guangdong Zhuhai 19.05 0.00 19.05
Guangdong Shantou 23.61 0.00 23.61
Guangdong Foshan 52.80 17.49 70.29
Guangdong Jiangmen 18.58 0.00 18.58
Guangdong Zhanjiang 14.98 0.00 14.98
Guangdong Maoming 12.78 3.41 16.19
Guangdong Zhaoqing 18.33 7.59 25.93
Guangdong Huizhou 34.65 0.00 34.65
Guangdong Meizhou 30.23 0.00 30.23
Guangdong Shanwei 2.30 0.00 2.30
Guangdong Heyuan 9.85 0.54 10.39
Guangdong Yangjiang 10.92 0.00 10.92
Guangdong Qingyuan 37.73 5.96 43.69
Guangdong Dongguan 59.64 18.25 77.88
Guangdong Zhongshan 10.91 7.51 18.42
Guangdong Chaozhou 19.42 0.00 19.42
Guangdong Jieyang 7.06 4.33 11.39
Guangdong Yunfu 19.53 0.00 19.53
Guangxi Nanning 21.57 0.00 21.57
Guangxi Liuzhou 31.37 3.65 35.02
Guangxi Guilin 13.60 1.99 15.59
Guangxi Wuzhou 3.68 1.40 5.08
Guangxi Beihai 3.25 0.44 3.69
Guangxi Fangchenggang 10.95 0.00 10.95
Guangxi Qinzhou 14.25 0.79 15.04
Guangxi Guigang 28.88 0.00 28.88
Guangxi Yulin 12.01 4.90 16.92
Guangxi Baise 22.75 0.00 22.75
Guangxi Hezhou 6.90 0.84 7.75
Guangxi Hechi 5.72 0.00 5.72
Guangxi Laibin 16.33 0.00 16.33
Guangxi Chongzuo 6.70 2.03 8.74
26 High-resolution Carbon Emissions Data for Chinese Cities
Province CityEmissions (MMT)
Direct Indirect Total
Hainan Haikou 5.01 2.70 7.72
Hainan Sanya 2.50 0.76 3.26
Chongqing Chongqing 180.31 11.60 191.91
Sichuan Chengdu 42.31 14.92 57.23
Sichuan Zigong 5.87 2.67 8.54
Sichuan Panzhihua 49.35 0.00 49.35
Sichuan Luzhou 15.85 0.98 16.83
Sichuan Deyang 10.01 5.11 15.12
Sichuan Mianyang 18.71 0.00 18.71
Sichuan Guangyuan 9.94 1.07 11.01
Sichuan Suining 3.08 1.69 4.77
Sichuan Neijiang 29.70 0.26 29.96
Sichuan Leshan 24.85 1.65 26.50
Sichuan Nanchong 6.76 2.20 8.96
Sichuan Meishan 7.66 2.92 10.58
Sichuan Yibin 32.64 0.00 32.64
Sichuan Guangan 19.78 0.00 19.78
Sichuan Dazhou 38.37 1.19 39.55
Sichuan Ya’an 4.93 0.00 4.93
Sichuan Bazhong 2.61 1.64 4.24
Sichuan Ziyang 4.86 2.16 7.02
Guizhou Guiyang 36.56 3.40 39.96
Guizhou Liupanshui 50.15 0.00 50.15
Guizhou Zunyi 20.99 0.00 20.99
Guizhou Anshun 16.04 0.00 16.04
Guizhou Bijie 50.81 0.00 50.81
Guizhou Tongren 10.98 0.00 10.98
Yunnan Kunming 51.13 5.02 56.15
Yunnan Qujing 70.29 0.00 70.29
Yunnan Yuxi 10.41 3.20 13.62
Yunnan Baoshan 4.65 0.20 4.85
Yunnan Zhaotong 11.68 1.06 12.73
Yunnan Lijiang 6.98 0.00 6.98
Yunnan Pu’er 5.02 0.20 5.21
Yunnan Lincang 3.82 0.00 3.82
Tibet Lhasa 1.32 0.00 1.32
Shaanxi Xi’an 26.93 9.92 36.85
Shaanxi Tongchuan 15.60 0.00 15.60

27Belfer Center for Science and International Affairs | Harvard Kennedy School
Province CityEmissions (MMT)
Direct Indirect Total
Shaanxi Baoji 25.65 0.00 25.65
Shaanxi Xianyang 33.31 0.00 33.31
Shaanxi Weinan 69.21 0.00 69.21
Shaanxi Yan’an 12.11 3.90 16.00
Shaanxi Hanzhong 11.24 6.08 17.32
Shaanxi Yulin 107.70 0.00 107.70
Shaanxi Ankang 5.47 0.64 6.11
Shaanxi Shangluo 4.66 3.70 8.36
Gansu Lanzhou 36.20 0.54 36.74
Gansu Jiayuguan 16.85 2.72 19.57
Gansu Jinchang 17.94 0.00 17.94
Gansu Baiyin 19.87 0.00 19.87
Gansu Tianshui 7.35 4.07 11.42
Gansu Wuwei 3.89 0.31 4.21
Gansu Zhangye 7.64 0.00 7.64
Gansu Pingliang 31.84 0.00 31.84
Gansu Jiuquan 7.71 0.00 7.71
Gansu Qingyang 3.80 3.87 7.67
Gansu Dingxi 3.70 4.30 8.00
Gansu Longnan 4.74 2.18 6.92
Qinghai Xining 22.43 5.64 28.06
Ningxia Yinchuan 83.23 0.00 83.23
Ningxia Shizuishan 55.64 0.00 55.64
Ningxia Wuzhong 33.14 0.00 33.14
Ningxia Guyuan 7.98 2.04 10.02
Ningxia Zhongwei 12.95 6.26 19.21
Xinjiang Urumqi 52.87 0.00 52.87
Xinjiang Karamay 14.99 1.96 16.95
28 High-resolution Carbon Emissions Data for Chinese Cities
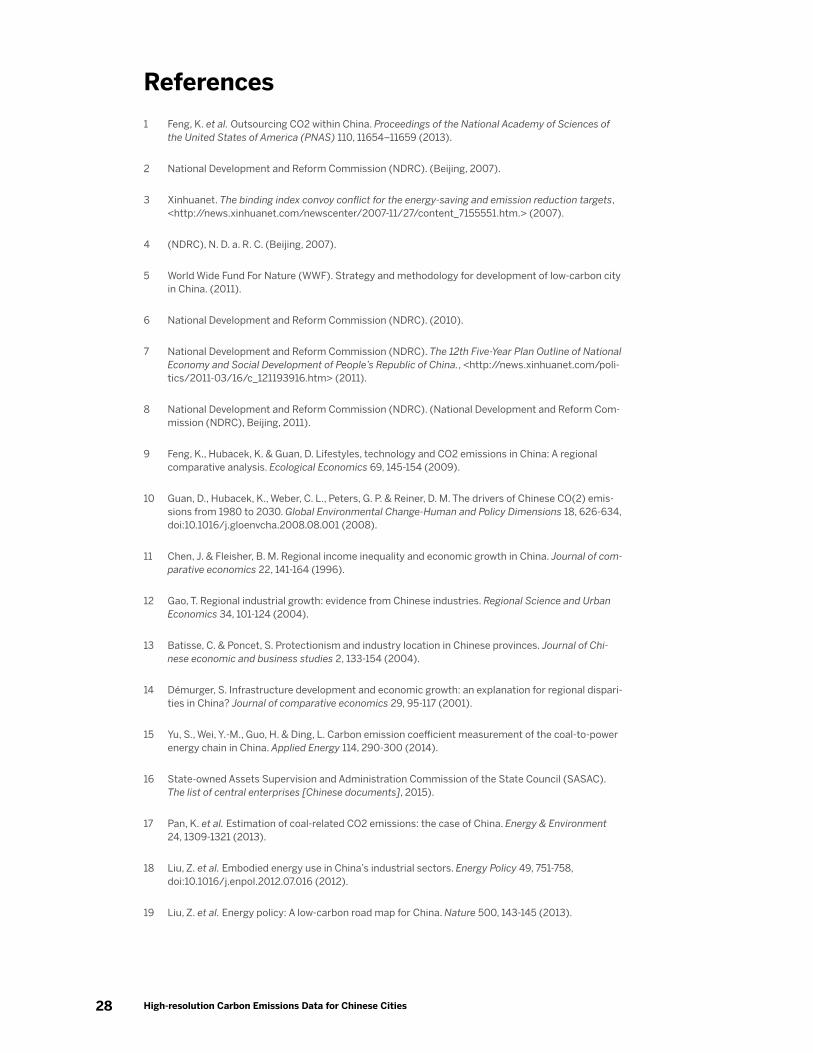
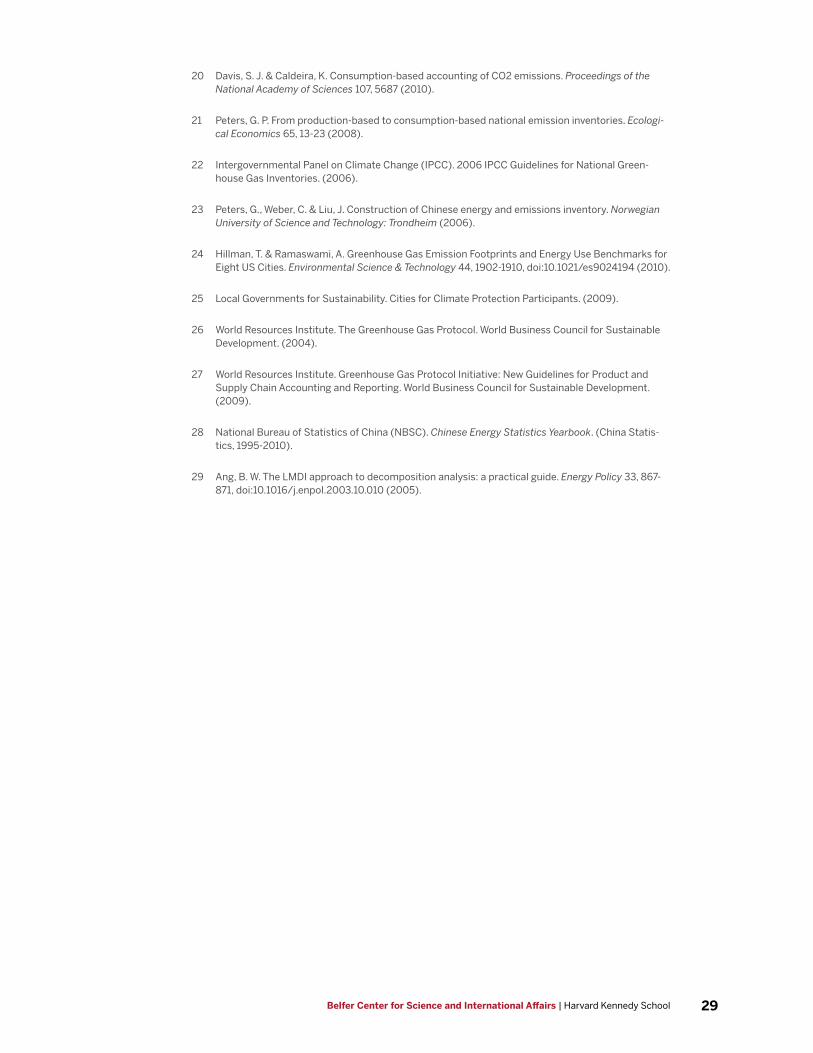
References
1 Feng, K. et al. Outsourcing CO2 within China. Proceedings of the National Academy of Sciences of the United States of America (PNAS) 110, 11654–11659 (2013).
2 National Development and Reform Commission (NDRC). (Beijing, 2007).
3 Xinhuanet. The binding index convoy conflict for the energy-saving and emission reduction targets, <http://news.xinhuanet.com/newscenter/2007-11/27/content_7155551.htm.> (2007).
4 (NDRC), N. D. a. R. C. (Beijing, 2007).
5 World Wide Fund For Nature (WWF). Strategy and methodology for development of low-carbon city in China. (2011).
6 National Development and Reform Commission (NDRC). (2010).
7 National Development and Reform Commission (NDRC). The 12th Five-Year Plan Outline of National Economy and Social Development of People’s Republic of China., <http://news.xinhuanet.com/poli-tics/2011-03/16/c_121193916.htm> (2011).
8 National Development and Reform Commission (NDRC). (National Development and Reform Com-mission (NDRC), Beijing, 2011).
9 Feng, K., Hubacek, K. & Guan, D. Lifestyles, technology and CO2 emissions in China: A regional comparative analysis. Ecological Economics 69, 145-154 (2009).
10 Guan, D., Hubacek, K., Weber, C. L., Peters, G. P. & Reiner, D. M. The drivers of Chinese CO(2) emis-sions from 1980 to 2030. Global Environmental Change-Human and Policy Dimensions 18, 626-634, doi:10.1016/j.gloenvcha.2008.08.001 (2008).
11 Chen, J. & Fleisher, B. M. Regional income inequality and economic growth in China. Journal of com-parative economics 22, 141-164 (1996).
12 Gao, T. Regional industrial growth: evidence from Chinese industries. Regional Science and Urban Economics 34, 101-124 (2004).
13 Batisse, C. & Poncet, S. Protectionism and industry location in Chinese provinces. Journal of Chi-nese economic and business studies 2, 133-154 (2004).
14 Démurger, S. Infrastructure development and economic growth: an explanation for regional dispari-ties in China? Journal of comparative economics 29, 95-117 (2001).
15 Yu, S., Wei, Y.-M., Guo, H. & Ding, L. Carbon emission coefficient measurement of the coal-to-power energy chain in China. Applied Energy 114, 290-300 (2014).
16 State-owned Assets Supervision and Administration Commission of the State Council (SASAC). The list of central enterprises [Chinese documents], 2015).
17 Pan, K. et al. Estimation of coal-related CO2 emissions: the case of China. Energy & Environment 24, 1309-1321 (2013).
18 Liu, Z. et al. Embodied energy use in China’s industrial sectors. Energy Policy 49, 751-758, doi:10.1016/j.enpol.2012.07.016 (2012).
19 Liu, Z. et al. Energy policy: A low-carbon road map for China. Nature 500, 143-145 (2013).
29Belfer Center for Science and International Affairs | Harvard Kennedy School
20 Davis, S. J. & Caldeira, K. Consumption-based accounting of CO2 emissions. Proceedings of the National Academy of Sciences 107, 5687 (2010).
21 Peters, G. P. From production-based to consumption-based national emission inventories. Ecologi-cal Economics 65, 13-23 (2008).
22 Intergovernmental Panel on Climate Change (IPCC). 2006 IPCC Guidelines for National Green-house Gas Inventories. (2006).
23 Peters, G., Weber, C. & Liu, J. Construction of Chinese energy and emissions inventory. Norwegian University of Science and Technology: Trondheim (2006).
24 Hillman, T. & Ramaswami, A. Greenhouse Gas Emission Footprints and Energy Use Benchmarks for Eight US Cities. Environmental Science & Technology 44, 1902-1910, doi:10.1021/es9024194 (2010).
25 Local Governments for Sustainability. Cities for Climate Protection Participants. (2009).
26 World Resources Institute. The Greenhouse Gas Protocol. World Business Council for Sustainable Development. (2004).
27 World Resources Institute. Greenhouse Gas Protocol Initiative: New Guidelines for Product and Supply Chain Accounting and Reporting. World Business Council for Sustainable Development. (2009).
28 National Bureau of Statistics of China (NBSC). Chinese Energy Statistics Yearbook. (China Statis-tics, 1995-2010).
29 Ang, B. W. The LMDI approach to decomposition analysis: a practical guide. Energy Policy 33, 867-871, doi:10.1016/j.enpol.2003.10.010 (2005).


Environment and Natural Resources
Belfer Center for Science and International Affairs
Harvard Kennedy School
79 John F. Kennedy Street
Cambridge, MA 02138
www.belfercenter.org/ENRP
Copyright 2018, President and Fellows of Harvard College
Printed in the United States of America