Enhancing Shareholder Value at Imation Corp. - SEC.gov · return andvalue will fluctuate andpast...
69
Globally Diversified Investment Institution Specializing In Alternative Investment Strategies This presentation shall not constitute an offer to sell or the solicitation of an offer to buy any securities. Information contained herein is based on data obtained from recognized statistical services, issuer reports or communications, or other sources, believed to be reliable. However, we have not verified such information and we do not make any representations as to its accuracy or completeness. Any statements non-factual in nature constitute only current opinions, which are subject to change. No part of this report may be reproduced in any manner without the prior permission of Clinton Group, Inc. All return figures are net of fees. Total return and value will fluctuate and past performance is no guarantee of future results. The information set forth here should not be construed as an investment recommendation. This presentation should be read in conjunction with important disclosures included with this booklet. CCO Approved 6/1/14 © Clinton Group, Inc. All rights reserved 2014 Enhancing Shareholder Value at Imation Corp. April 2015
Transcript of Enhancing Shareholder Value at Imation Corp. - SEC.gov · return andvalue will fluctuate andpast...
Globally Diversified Investment Institution Specializing In
Alternative Investment Strategies
This presentation shall not constitute an offer to sell or the solicitation of an offer to buy any securities. Information contained herein is based on data obtained from recognized statistical services, issuer reports or communications, or other sources, believed to be reliable. However, we have not verified such information andwe do not make any representations as to its accuracy or completeness. Any statements non-factual in nature constitute only current opinions, which are subject to change. No part of this report may be reproduced in any manner without the prior permission of Clinton Group, Inc. All return figures are net of fees. Totalreturn and value will fluctuate and past performance is no guarantee of future results. The information set forth here should not be construed as an investment recommendation. This presentation should be read in conjunction with important disclosures included with this booklet. CCO Approved 6/1/14
© Clinton Group, Inc. All rights reserved 2014
Enhancing Shareholder Value at Imation Corp.
April 2015
Globally Diversified Investment Institution Specializing In Alternative Investment Strategies Page 2
Important Information About This Solicitation
CLINTON RELATIONAL OPPORTUNITY MASTER FUND, L.P., CLINTON RELATIONAL OPPORTUNITY, LLC, CLINTON GROUP, INC., GEH CAPITAL, INC. AND GEORGE E. HALL (COLLECTIVELY, "CLINTON") AND JOSEPH A. DE PERIO, ROBERT B. FERNANDER AND BARRY L. KASOFF (TOGETHER WITH CLINTON, THE "PARTICIPANTS") INTEND TO FILE WITH THE SECURITIES AND EXCHANGE COMMISSION (THE "SEC") A DEFINITIVE PROXY STATEMENT AND ACCOMPANYING FORM OF PROXY CARD TO BE USED IN CONNECTION WITH THE PARTICIPANTS' SOLICITATION OF PROXIES FROM THE STOCKHOLDERS OF IMATION CORP. (THE "COMPANY") FOR USE AT THE COMPANY'S 2015 ANNUAL MEETING OF STOCKHOLDERS (THE "PROXY SOLICITATION"). ALL STOCKHOLDERS OF THE COMPANY ARE ADVISED TO READ THE DEFINITIVE PROXY STATEMENT AND OTHER DOCUMENTS RELATED TO THE PROXY SOLICITATION, WHEN THEY BECOME AVAILABLE, BECAUSE THEY WILL CONTAIN IMPORTANT INFORMATION, INCLUDING ADDITIONAL INFORMATION RELATED TO THE PARTICIPANTS. WHEN COMPLETED, THE DEFINITIVE PROXY STATEMENT AND AN ACCOMPANYING PROXY CARD WILL BE FURNISHED TO SOME OR ALL OF THE COMPANY'S STOCKHOLDERS AND WILL BE, ALONG WITH OTHER RELEVANT DOCUMENTS, AVAILABLE AT NO CHARGE ON THE SEC'S WEBSITE AT HTTP://WWW.SEC.GOV/.
IN ADDITION, OKAPI PARTNERS LLC, CLINTON'S PROXY SOLICITOR, WILL PROVIDE COPIES OF THE DEFINITIVEPROXY STATEMENT AND ACCOMPANYING PROXY CARD WITHOUT CHARGE UPON REQUEST BY CALLING (212) 297-0720 OR TOLL-FREE AT (855) 305-0857.
INFORMATION ABOUT THE PARTICIPANTS AND A DESCRIPTION OF THEIR DIRECT OR INDIRECT INTERESTS BYSECURITY HOLDINGS IS CONTAINED IN THE REVISED PRELIMINARY PROXY STATEMENT ON SCHEDULE 14A FILEDBY CLINTON WITH THE SEC ON APRIL 13, 2015. THIS DOCUMENT CAN BE OBTAINED FREE OF CHARGE FROM THESOURCES INDICATED ABOVE.

Globally Diversified Investment Institution Specializing In Alternative Investment Strategies Page 3
I Executive Summary
II History of Value Destruction at Imation
III Current Compensation Practices
IV The Path Forward
IV Conclusion
Globally Diversified Investment Institution Specializing In Alternative Investment Strategies Page 4
Infrastructure Agility ExpertiseInfrastructure
With twenty-four years of history, we have developed a seasoned
infrastructure capable of supporting a multitude of investment programs as well as the needs of our clients
Agility
With both time-tested quantitative methodologies and flexible,
fundamental research, we are able to capitalize on the most attractive
investment opportunities at any given time and match most
risk/reward profiles to meet each investors unique needs
Expertise
Our senior investment professionals span a wide range of investment and trading disciplines, bringing diverse expertise to bear in our
investment strategies
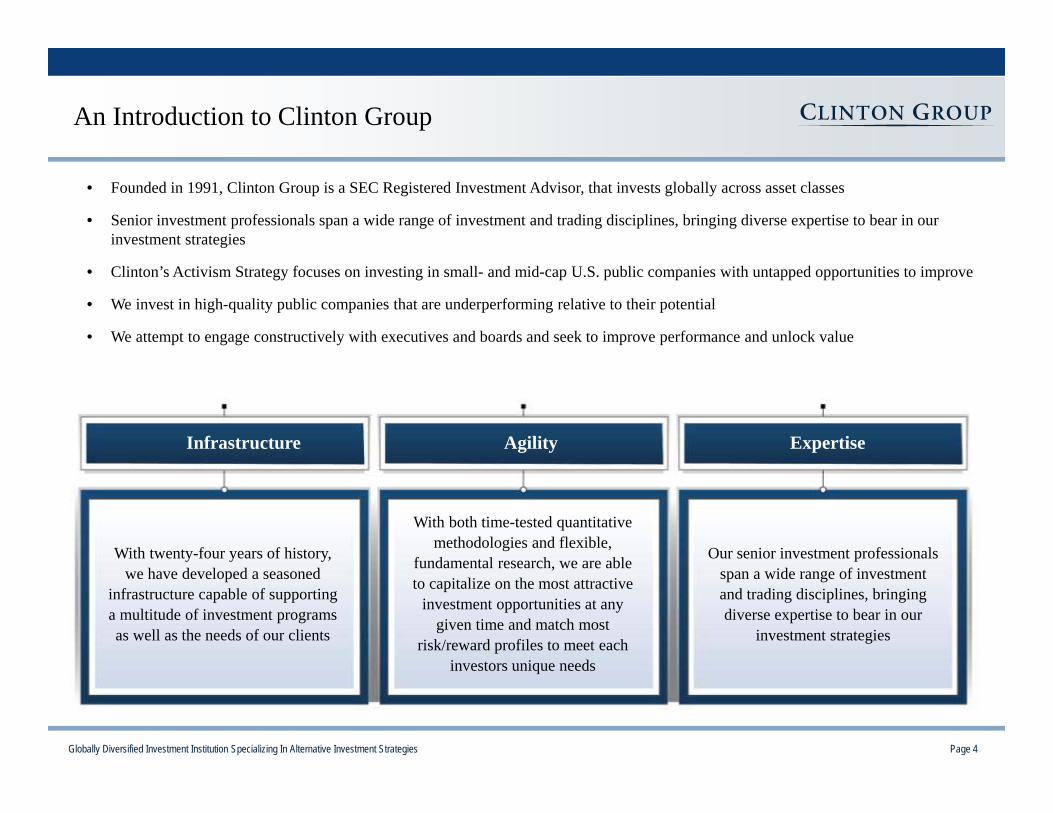
• Founded in 1991, Clinton Group is a SEC Registered Investment Advisor, that invests globally across asset classes
• Senior investment professionals span a wide range of investment and trading disciplines, bringing diverse expertise to bear in our investment strategies
• Clinton’s Activism Strategy focuses on investing in small- and mid-cap U.S. public companies with untapped opportunities to improve
• We invest in high-quality public companies that are underperforming relative to their potential
• We attempt to engage constructively with executives and boards and seek to improve performance and unlock value
An Introduction to Clinton Group
Globally Diversified Investment Institution Specializing In Alternative Investment Strategies Page 5
Overview of Imation Corp.
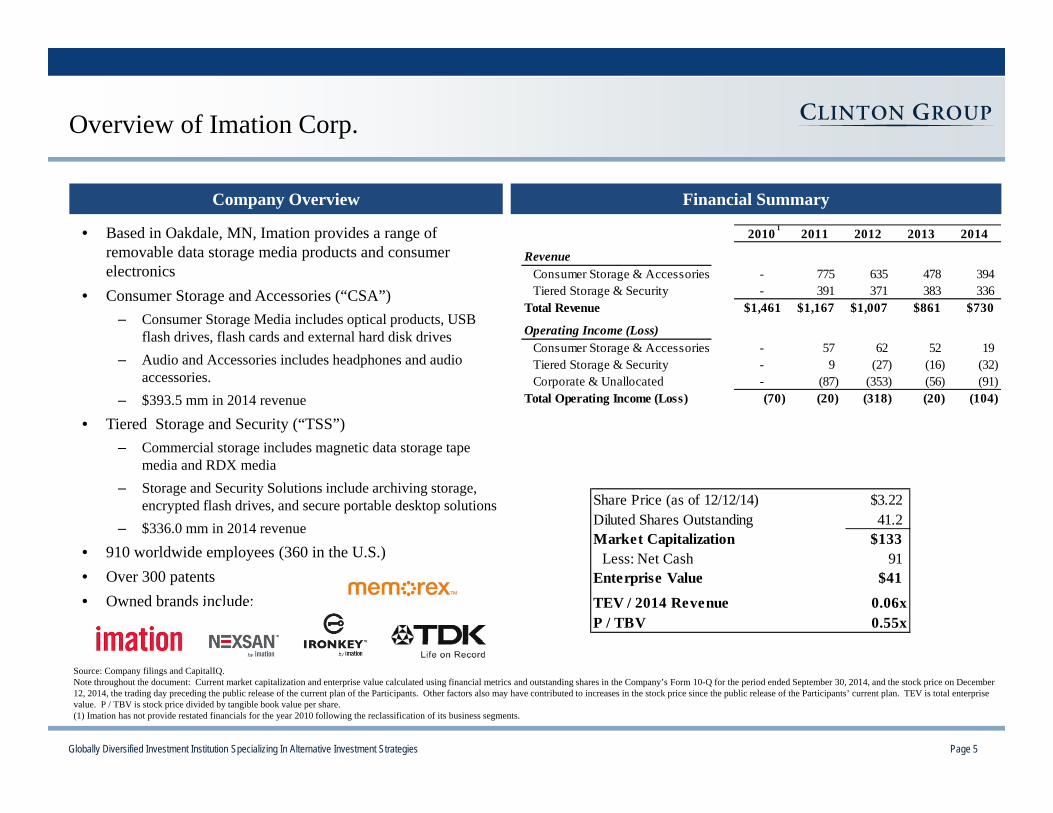
• Based in Oakdale, MN, Imation provides a range of removable data storage media products and consumer electronics
• Consumer Storage and Accessories (“CSA”) – Consumer Storage Media includes optical products, USB
flash drives, flash cards and external hard disk drives– Audio and Accessories includes headphones and audio
accessories.– $393.5 mm in 2014 revenue
• Tiered Storage and Security (“TSS”) – Commercial storage includes magnetic data storage tape
media and RDX media– Storage and Security Solutions include archiving storage,
encrypted flash drives, and secure portable desktop solutions – $336.0 mm in 2014 revenue
• 910 worldwide employees (360 in the U.S.)• Over 300 patents• Owned brands include:
Company Overview Capitalization
Valuation and Financial Considerations
Financial SummaryCompany Overview
2010 2011 2012 2013 2014
RevenueConsumer Storage & Accessories - 775 635 478 394 Tiered Storage & Security - 391 371 383 336
Total Revenue $1,461 $1,167 $1,007 $861 $730
Operating Income (Loss)Consumer Storage & Accessories - 57 62 52 19 Tiered Storage & Security - 9 (27) (16) (32) Corporate & Unallocated - (87) (353) (56) (91)
Total Operating Income (Loss) (70) (20) (318) (20) (104)
EBITDA (28) 16 (283) 4 (82) Net Income (159) (47) (341) (44) (115) Net Cash $305 $223 $89 $113 $96
Share Price (as of 12/12/14) $3.22Diluted Shares Outstanding 41.2 Market Capitalization $133
Less: Net Cash 91 Enterprise Value $41
TEV / 2014 Revenue 0.06xP / TBV 0.55x
Source: Company filings and CapitalIQ.Note throughout the document: Current market capitalization and enterprise value calculated using financial metrics and outstanding shares in the Company’s Form 10-Q for the period ended September 30, 2014, and the stock price on December 12, 2014, the trading day preceding the public release of the current plan of the Participants. Other factors also may have contributed to increases in the stock price since the public release of the Participants’ current plan. TEV is total enterprisevalue. P / TBV is stock price divided by tangible book value per share. (1) Imation has not provide restated financials for the year 2010 following the reclassification of its business segments.
1
Globally Diversified Investment Institution Specializing In Alternative Investment Strategies Page 6
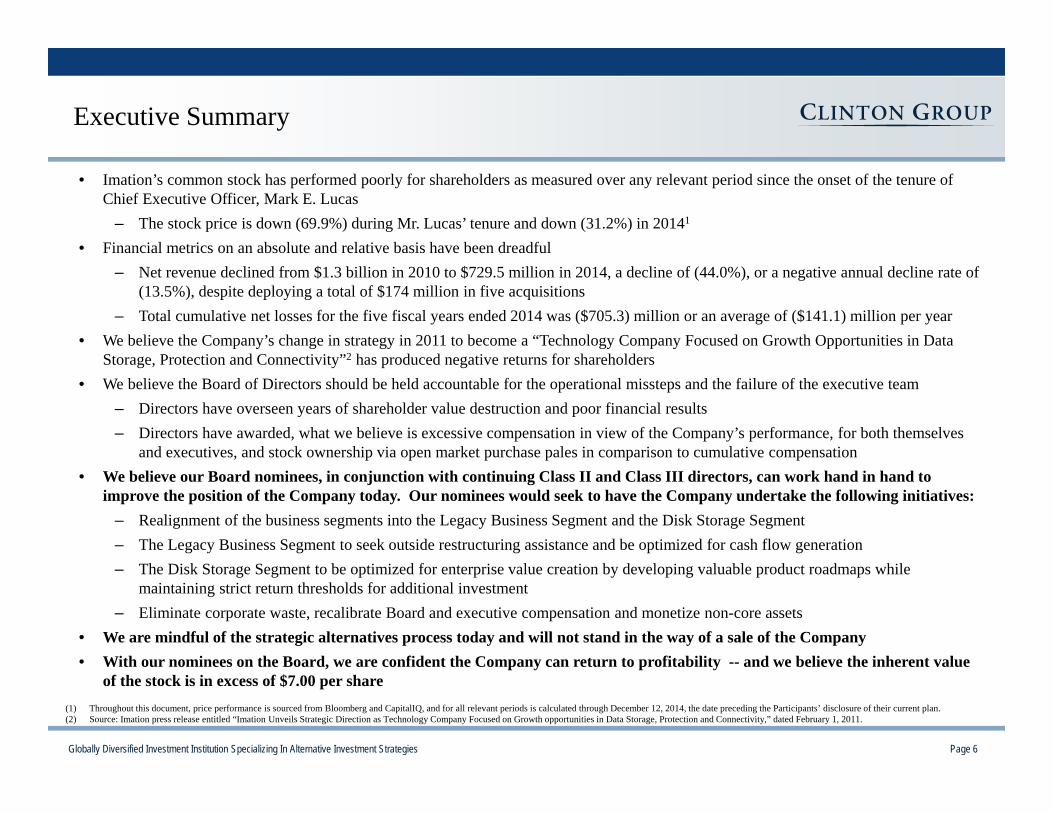
• Imation’s common stock has performed poorly for shareholders as measured over any relevant period since the onset of the tenure of Chief Executive Officer, Mark E. Lucas
– The stock price is down (69.9%) during Mr. Lucas’ tenure and down (31.2%) in 20141
• Financial metrics on an absolute and relative basis have been dreadful– Net revenue declined from $1.3 billion in 2010 to $729.5 million in 2014, a decline of (44.0%), or a negative annual decline rate of
(13.5%), despite deploying a total of $174 million in five acquisitions– Total cumulative net losses for the five fiscal years ended 2014 was ($705.3) million or an average of ($141.1) million per year
• We believe the Company’s change in strategy in 2011 to become a “Technology Company Focused on Growth Opportunities in Data Storage, Protection and Connectivity”2 has produced negative returns for shareholders
• We believe the Board of Directors should be held accountable for the operational missteps and the failure of the executive team– Directors have overseen years of shareholder value destruction and poor financial results– Directors have awarded, what we believe is excessive compensation in view of the Company’s performance, for both themselves
and executives, and stock ownership via open market purchase pales in comparison to cumulative compensation• We believe our Board nominees, in conjunction with continuing Class II and Class III directors, can work hand in hand to
improve the position of the Company today. Our nominees would seek to have the Company undertake the following initiatives:– Realignment of the business segments into the Legacy Business Segment and the Disk Storage Segment– The Legacy Business Segment to seek outside restructuring assistance and be optimized for cash flow generation – The Disk Storage Segment to be optimized for enterprise value creation by developing valuable product roadmaps while
maintaining strict return thresholds for additional investment– Eliminate corporate waste, recalibrate Board and executive compensation and monetize non-core assets
• We are mindful of the strategic alternatives process today and will not stand in the way of a sale of the Company• With our nominees on the Board, we are confident the Company can return to profitability -- and we believe the inherent value
of the stock is in excess of $7.00 per share
Executive Summary
(1) Throughout this document, price performance is sourced from Bloomberg and CapitalIQ, and for all relevant periods is calculated through December 12, 2014, the date preceding the Participants’ disclosure of their current plan.(2) Source: Imation press release entitled “Imation Unveils Strategic Direction as Technology Company Focused on Growth opportunities in Data Storage, Protection and Connectivity,” dated February 1, 2011.

Globally Diversified Investment Institution Specializing In Alternative Investment Strategies Page 7
Imation Has Significantly Underperformed Its Peers
Imation Has Continually Destroyed Shareholder Value Over Mark Lucas’ Tenure
Stock Price 5-Yr CAGR 5-Year Revenue Growth
-100%-80%-60%-40%-20%
0%20%40%60%80%
100%120%
Mar-10 Aug-10 Jan-11 Jun-11 Nov-11 Apr-12 Sep-12 Feb-13 Jul-13 Dec-13 May-14 Oct-14IMN '15 Peer Group '14 Peer Group S&P MidCap 400 Index S&P SmallCap 600 Index
Return: 27%
Return: 90%
Return: 81%
Return: (70%)
Return: 94%
-22%
5%
IMN '15 Peer Index-14%
35%
IMN '15 Peer Index-14%
-4%
IMN '15 Peer Index-48%
-13%
IMN '15 Peer IndexNotes throughout this document:“’15 Peers” is defined as the peer group of companies listed in the Company’s 2015 Proxy Statement. “’14 Peers” is defined as the peer group of companies listed in the Company’s 2014 Proxy Statement.Peer group stock price performance is a market value weighted index, adjusted for dividends.LTM is for the twelve months ended December 31, 2014. Trailing 5 Years is the period between the fiscal years ended December 31, 2000 to December 31, 2014.
LTM EBIT Margin LTM Return on Equity
Globally Diversified Investment Institution Specializing In Alternative Investment Strategies Page 8
Issues Under Current Leadership
Board Responsibility Results
Corporate Leadership
Overseeing Operations and Efficiency
Capital Allocation
Corporate Governance
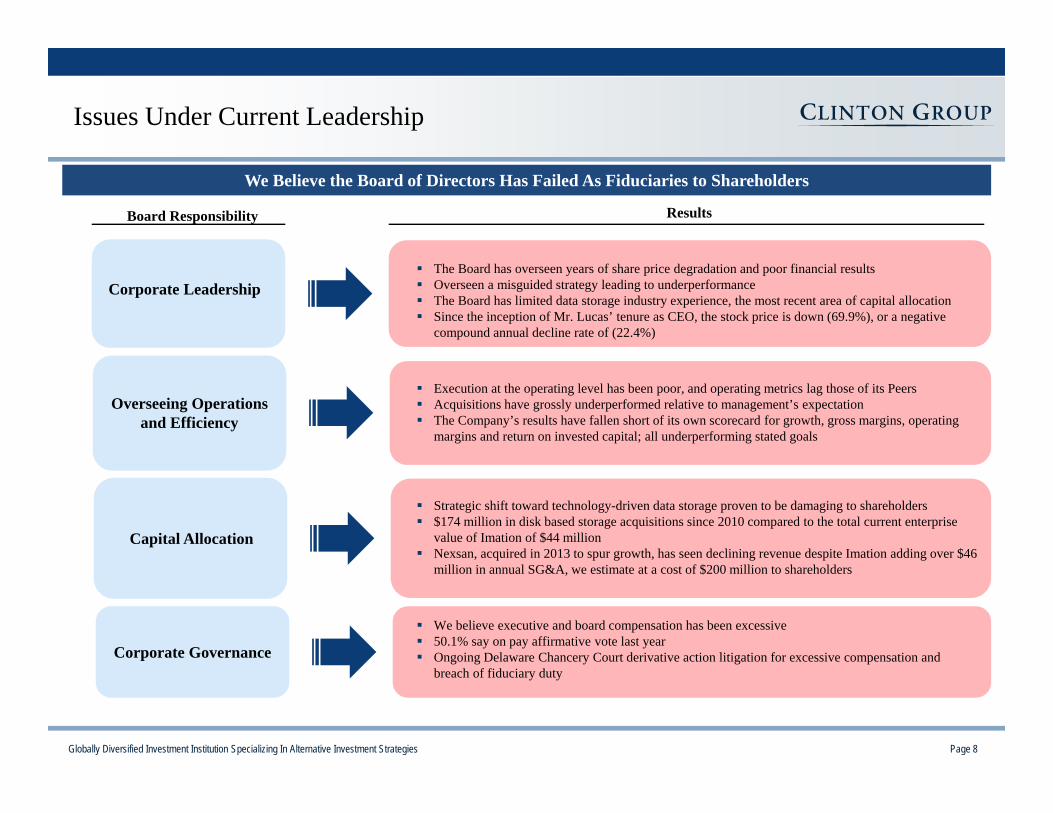
We Believe the Board of Directors Has Failed As Fiduciaries to Shareholders
The Board has overseen years of share price degradation and poor financial results Overseen a misguided strategy leading to underperformance The Board has limited data storage industry experience, the most recent area of capital allocation Since the inception of Mr. Lucas’ tenure as CEO, the stock price is down (69.9%), or a negative
compound annual decline rate of (22.4%)
Execution at the operating level has been poor, and operating metrics lag those of its Peers Acquisitions have grossly underperformed relative to management’s expectation The Company’s results have fallen short of its own scorecard for growth, gross margins, operating
margins and return on invested capital; all underperforming stated goals
Strategic shift toward technology-driven data storage proven to be damaging to shareholders $174 million in disk based storage acquisitions since 2010 compared to the total current enterprise
value of Imation of $44 million Nexsan, acquired in 2013 to spur growth, has seen declining revenue despite Imation adding over $46
million in annual SG&A, we estimate at a cost of $200 million to shareholders
We believe executive and board compensation has been excessive 50.1% say on pay affirmative vote last year Ongoing Delaware Chancery Court derivative action litigation for excessive compensation and
breach of fiduciary duty
Globally Diversified Investment Institution Specializing In Alternative Investment Strategies Page 9
The Path Forward
Board Responsibility Plans for the Future1
Corporate Leadership
Overseeing Operations and Efficiency
Capital Allocation
Corporate Governance
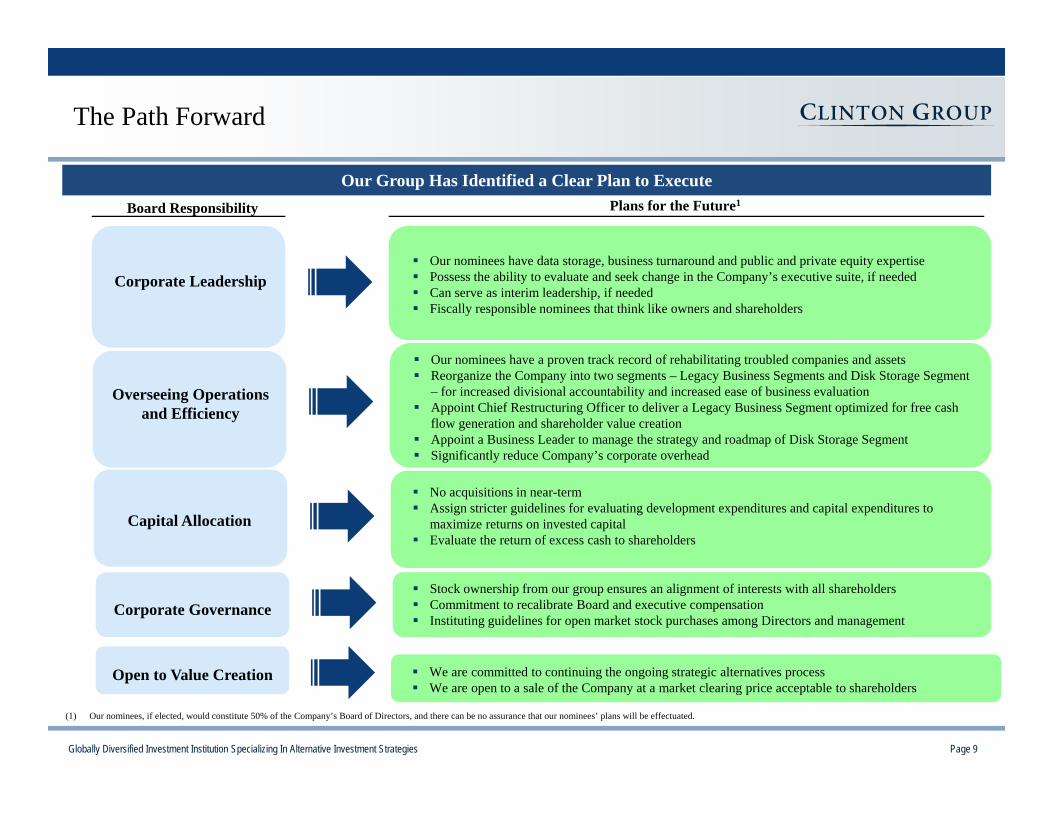
Our Group Has Identified a Clear Plan to Execute
Our nominees have data storage, business turnaround and public and private equity expertise Possess the ability to evaluate and seek change in the Company’s executive suite, if needed Can serve as interim leadership, if needed Fiscally responsible nominees that think like owners and shareholders
Our nominees have a proven track record of rehabilitating troubled companies and assets Reorganize the Company into two segments – Legacy Business Segments and Disk Storage Segment
– for increased divisional accountability and increased ease of business evaluation Appoint Chief Restructuring Officer to deliver a Legacy Business Segment optimized for free cash
flow generation and shareholder value creation Appoint a Business Leader to manage the strategy and roadmap of Disk Storage Segment Significantly reduce Company’s corporate overhead
No acquisitions in near-term Assign stricter guidelines for evaluating development expenditures and capital expenditures to
maximize returns on invested capital Evaluate the return of excess cash to shareholders
Stock ownership from our group ensures an alignment of interests with all shareholders Commitment to recalibrate Board and executive compensation Instituting guidelines for open market stock purchases among Directors and management
We are committed to continuing the ongoing strategic alternatives process We are open to a sale of the Company at a market clearing price acceptable to shareholders
Open to Value Creation
(1) Our nominees, if elected, would constitute 50% of the Company’s Board of Directors, and there can be no assurance that our nominees’ plans will be effectuated.

Globally Diversified Investment Institution Specializing In Alternative Investment Strategies Page 10
A Reconstituted Board of Directors
Our Vision for a New Board of Directors
Clinton Group Nominees
William G. LaPerch
President, LaPerch Consulting
Former CEO, President and Director, AboveNet Inc.
Data Networking
Public CEO Experience
Consulting
Public Board Experience
Geoff S. Barrall
CEO and Director, Connected Data
Former Chief Technology Officer, Overland Storage
Former Director, NexsanCorporation
Anthony T. Brausen
SVP and Chief Financial Officer, The Mosaic
Company
Former VP and Chief Financial Officer at Tennant
Company
Robert B. Fernander
Former CRO and Director, Datagres Technologies
Former CEO and Director, Gnodal Limited
Former CEO, Pivot3 Inc.
Former CEO, Stored IQ, Inc.
Barry L. Kasoff
President, Realization Services, Inc.
Chief Restructuring Officer, Numerous Entities
General Manager, Takarajimasha
Joseph A. De Perio
Senior Portfolio Manager, Public Equity and Private
Equity, Clinton Group
Imation Class II and Class III Directors
Technology Start-ups
Data Storage
Audit Committee
Public Accounting
CFO Experience
Data Storage
CEO Experience
Cloud Storage
Data Networking
Sales & Marketing
Management Consulting
Restructuring Experience
Manufacturing / Procurement
Public Board Experience
Private Equity
Investment Management
Technology Investing
Risk Management
Public Board Experience

Globally Diversified Investment Institution Specializing In Alternative Investment Strategies Page 11
I Executive Summary
II History of Value Destruction at Imation
III Current Compensation Practices
IV The Path Forward
IV Conclusion
Globally Diversified Investment Institution Specializing In Alternative Investment Strategies Page 12
Industry Growth Should Have Provided a Tailwind
Source: International Data Corporation (“IDC”).
The Digital Universe: 5x Growth, 2010-2014
0
1,000
2,000
3,000
4,000
5,000
6,000
7,000
2010 2011 2012 2013 2014
Exa
bye
The Digital Universe: 450x Growth, 2000-2014
0
1,000
2,000
3,000
4,000
5,000
6,000
7,000
2000 2002 2004 2006 2008 2010 2012 2014
Exa
byte
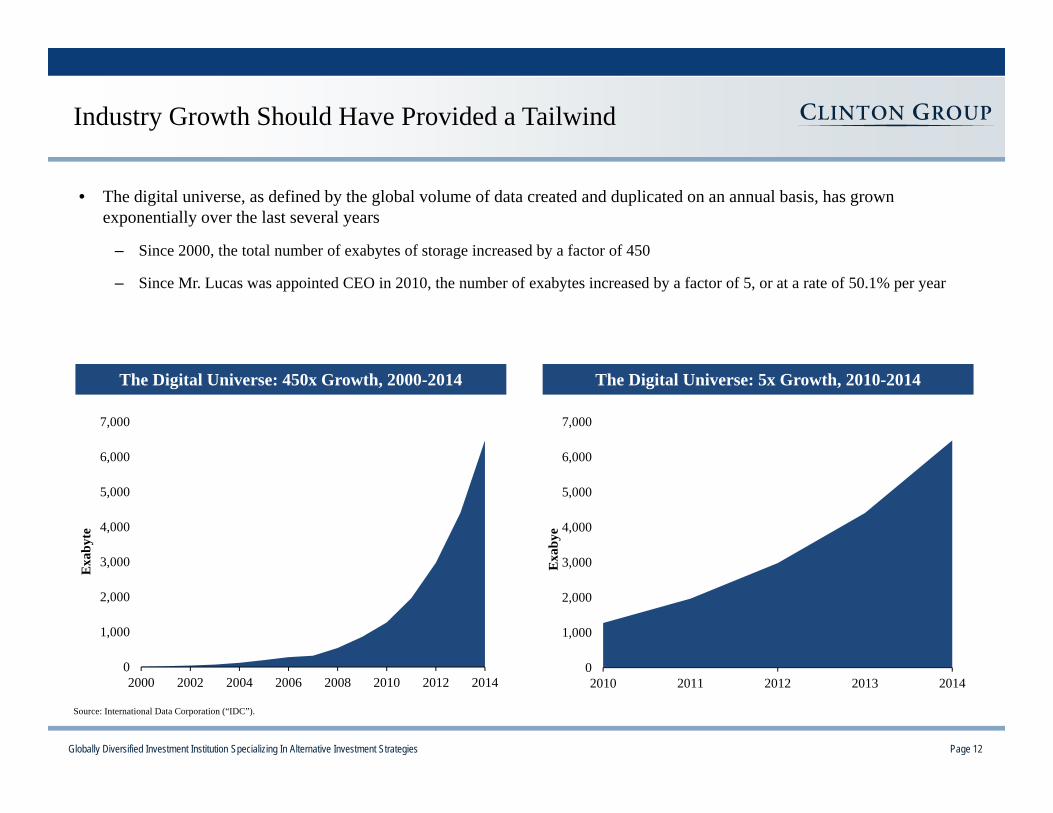
• The digital universe, as defined by the global volume of data created and duplicated on an annual basis, has grown exponentially over the last several years
– Since 2000, the total number of exabytes of storage increased by a factor of 450
– Since Mr. Lucas was appointed CEO in 2010, the number of exabytes increased by a factor of 5, or at a rate of 50.1% per year

Globally Diversified Investment Institution Specializing In Alternative Investment Strategies Page 13
Global Data Storage Industry Forecasts Continued Growth
$0
$15
$30
$45
$60
2011 2012 2013 2014 2015 2016 2017
$ B
illio
n
Cloud Professional Services Apps & AnalyticsNoSQL SQL Infrastructure Software
Sources: Research and Markets Report (Big Data Vendor Revenue and Market Forecast 2013-2017); IDC HDD and SSD (Worldwide Hard Disk Drive 2013-2018 Forecast & Worldwide Solid State Storage 2013-2018 Forecast and Analysis); Western Digital Analysis, and IDC.
Big Data Market Forecast by Sub-Type, 2011-2017
$36B $38B$42B
$46B $49B $52B
$0
$15
$30
$45
$60
2013 2014 2015 2016 2017 2018
$ B
illio
n
HDD Enterprise SSD
0
800
1,600
2,400
3,200
2012 2013 2014 2015 2016 2017 2018 2019 2020
Exa
byte
Shi
pmen
t
Enterprise Storage Other CE Personal Storage
Rapid Data Growth Drives Storage DemandThe Digital Universe: 50x Growth, 2010-2020
HDD and Enterprise SSD Revenue Forecast
0
10,000
20,000
30,000
40,000
2009 2010 2011 2012 2013 2014 2015 2016 2017 2018 2019 2020
Exa
byte
s

Globally Diversified Investment Institution Specializing In Alternative Investment Strategies Page 14
$0
$10
$20
$30
$40
$50
Jun-96 Nov-97 May-99 Oct-00 Mar-02 Aug-03 Jan-05 Jun-06 Dec-07 May-09 Oct-10 Mar-12 Aug-13
Monahan Henderson Hart MatthewsChairman /
Lead Director:
CEO: LucasRussomannoHendersonMonahan
Value Destruction: Stock Price Since the Spinoff from 3M
Source: Company filings and Capital IQ/
Since the inception of Imation as a public company, shareholders have seen over $1 billion or 87% of value disappear
Announces Acquisition of Memorex in
January 2006
Acquisition of NEXSAN in
Dec 2012
Restructuring of corporate strategy
in Feb 2011
Divested Medical Imaging Business to Kodak in Nov 1998
Divested Photo Color Systems to Schroder
Venturesin August 1999
Mark Lucas joins Board in April
2007
White Matthews joins Board in February 2003
Announces Acquisition of TDK
in April 2007
White Matthews named Chairman
in May 2011
Mark Lucas named CEO in
March 2010
Globally Diversified Investment Institution Specializing In Alternative Investment Strategies Page 15
$0
$10
$20
$30
$40
$50
$60
Jul-96 Jan-98 Jul-99 Feb-01 Aug-02 Mar-04 Sep-05 Apr-07 Oct-08 May-10 Nov-11 May-13 Dec-14
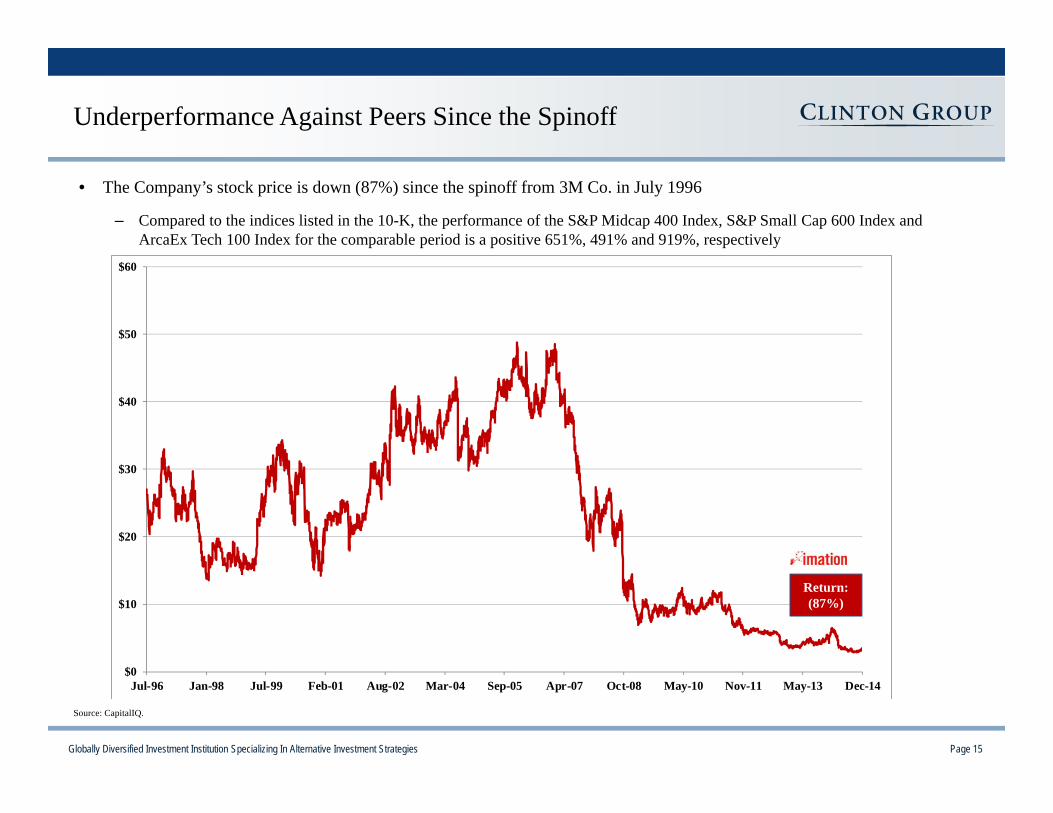
Underperformance Against Peers Since the Spinoff
Return: (87%)
• The Company’s stock price is down (87%) since the spinoff from 3M Co. in July 1996
– Compared to the indices listed in the 10-K, the performance of the S&P Midcap 400 Index, S&P Small Cap 600 Index and ArcaEx Tech 100 Index for the comparable period is a positive 651%, 491% and 919%, respectively
Source: CapitalIQ.
Globally Diversified Investment Institution Specializing In Alternative Investment Strategies Page 16
$0
$10
$20
$30
$40
$50
Mar-04 Aug-05 Jan-07 Jun-08 Nov-09 Apr-11 Sep-12 Mar-14
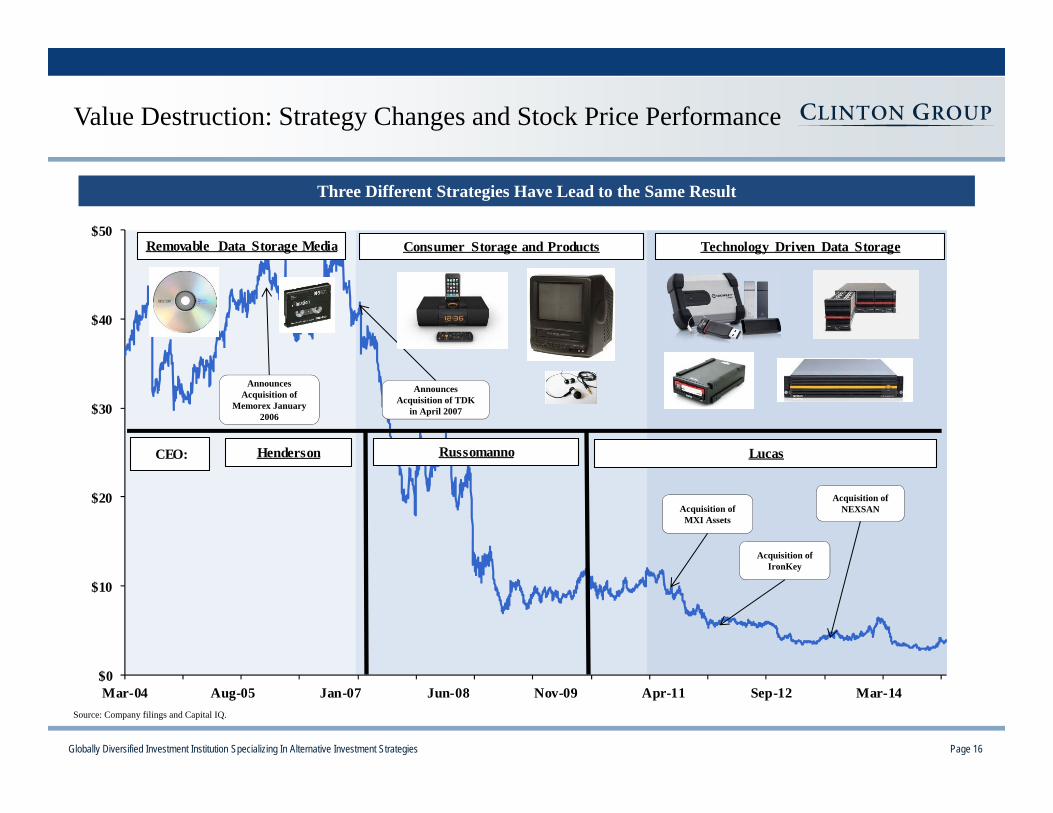
Removable Data Storage Media Consumer Storage and Products Technology Driven Data Storage
CEO: LucasRussomannoHenderson
Value Destruction: Strategy Changes and Stock Price Performance
Source: Company filings and Capital IQ.
Three Different Strategies Have Lead to the Same Result
Announces Acquisition of TDK
in April 2007
Acquisition of NEXSANAcquisition of
MXI Assets
Announces Acquisition of
Memorex January 2006
Acquisition of IronKey

Globally Diversified Investment Institution Specializing In Alternative Investment Strategies Page 17
Historical Strategy: “Removable Data Storage Media”CEO: Bruce Henderson (May ‘04 – April ‘07)
Brief History• Bruce Henderson was named CEO in May 2004
• The Company had a leadership position in removable data storage media
• Imation spent $650 million in three acquisitions to solidify its base in removable storage
• Q4 2012 non cash charges of $261 million related to Memorex and TDK acquisitions due to accelerated secular declines in optical media
Stated Corporate Strategy
• "Our offerings span magnetic, optical, solid state flash and removable hard drives -- the four pillars of storage. No other company has such a broad offering of media across major market sectors, technology platforms, and applications.” (Bruce Henderson, Analyst Day, November 15, 2005)
• “We also will continue to invest in developing the technologies necessary to meet future demand for storage media across business and consumer applications.” (Bruce Henderson, Analyst Day, November 15, 2005)
Track Record
Source: 2006 10-k
Imation increased its exposure to removable storage, essentially betting additional investor capital in an
industry in secular decline.
Our Take:
($ in mm, except stock price) 2004 2007 ChangeYear End Stock Price $35.37 $22.55 (36%)
Market Cap $1,203 $851 (29%)Enterprise Value $788 $748 (5%)
Revenue $1,174 $2,062 76%EBITDA $116 $141 22%
Net Income $37 ($56) NM
Globally Diversified Investment Institution Specializing In Alternative Investment Strategies Page 18
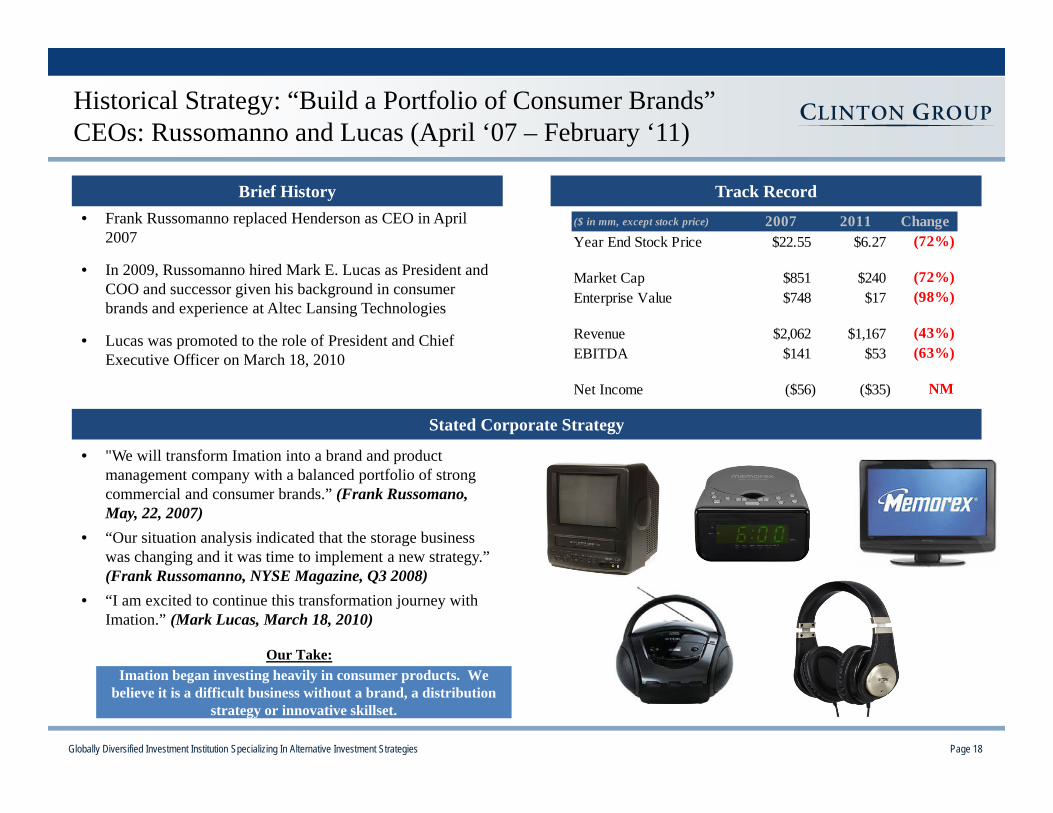
Historical Strategy: “Build a Portfolio of Consumer Brands”CEOs: Russomanno and Lucas (April ‘07 – February ‘11)
Brief History• Frank Russomanno replaced Henderson as CEO in April
2007
• In 2009, Russomanno hired Mark E. Lucas as President and COO and successor given his background in consumer brands and experience at Altec Lansing Technologies
• Lucas was promoted to the role of President and Chief Executive Officer on March 18, 2010
Stated Corporate Strategy
• "We will transform Imation into a brand and product management company with a balanced portfolio of strong commercial and consumer brands.” (Frank Russomano, May, 22, 2007)
• “Our situation analysis indicated that the storage business was changing and it was time to implement a new strategy.” (Frank Russomanno, NYSE Magazine, Q3 2008)
• “I am excited to continue this transformation journey with Imation.” (Mark Lucas, March 18, 2010)
Track Record
Imation began investing heavily in consumer products. We believe it is a difficult business without a brand, a distribution
strategy or innovative skillset.
Our Take:
($ in mm, except stock price) 2007 2011 ChangeYear End Stock Price $22.55 $6.27 (72%)
Market Cap $851 $240 (72%)Enterprise Value $748 $17 (98%)
Revenue $2,062 $1,167 (43%)EBITDA $141 $53 (63%)
Net Income ($56) ($35) NM
Globally Diversified Investment Institution Specializing In Alternative Investment Strategies Page 19
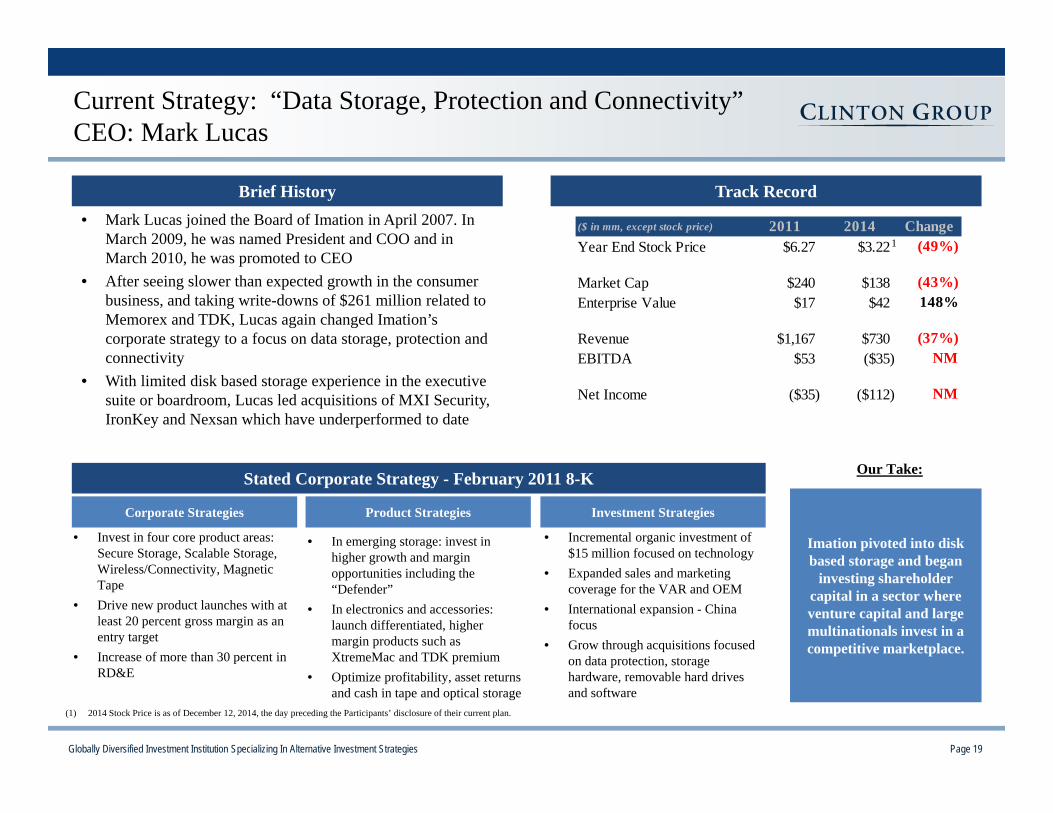
($ in mm, except stock price) 2011 2014 ChangeYear End Stock Price $6.27 $3.22 (49%)
Market Cap $240 $138 (43%)Enterprise Value $17 $42 148%
Revenue $1,167 $730 (37%)EBITDA $53 ($35) NM
Net Income ($35) ($112) NM
Current Strategy: “Data Storage, Protection and Connectivity”CEO: Mark Lucas
• Mark Lucas joined the Board of Imation in April 2007. In March 2009, he was named President and COO and in March 2010, he was promoted to CEO
• After seeing slower than expected growth in the consumer business, and taking write-downs of $261 million related to Memorex and TDK, Lucas again changed Imation’s corporate strategy to a focus on data storage, protection and connectivity
• With limited disk based storage experience in the executive suite or boardroom, Lucas led acquisitions of MXI Security, IronKey and Nexsan which have underperformed to date
Stated Corporate Strategy - February 2011 8-K
Corporate Strategies
Brief History Track Record
Product Strategies Investment Strategies
• Invest in four core product areas: Secure Storage, Scalable Storage, Wireless/Connectivity, Magnetic Tape
• Drive new product launches with at least 20 percent gross margin as an entry target
• Increase of more than 30 percent in RD&E
1
• Incremental organic investment of $15 million focused on technology
• Expanded sales and marketing coverage for the VAR and OEM
• International expansion - China focus
• Grow through acquisitions focused on data protection, storage hardware, removable hard drives and software
(1) 2014 Stock Price is as of December 12, 2014, the day preceding the Participants’ disclosure of their current plan.
Imation pivoted into disk based storage and began
investing shareholder capital in a sector where venture capital and large multinationals invest in a competitive marketplace.
Our Take:
• In emerging storage: invest in higher growth and margin opportunities including the “Defender”
• In electronics and accessories: launch differentiated, higher margin products such as XtremeMac and TDK premium
• Optimize profitability, asset returns and cash in tape and optical storage
Globally Diversified Investment Institution Specializing In Alternative Investment Strategies Page 20
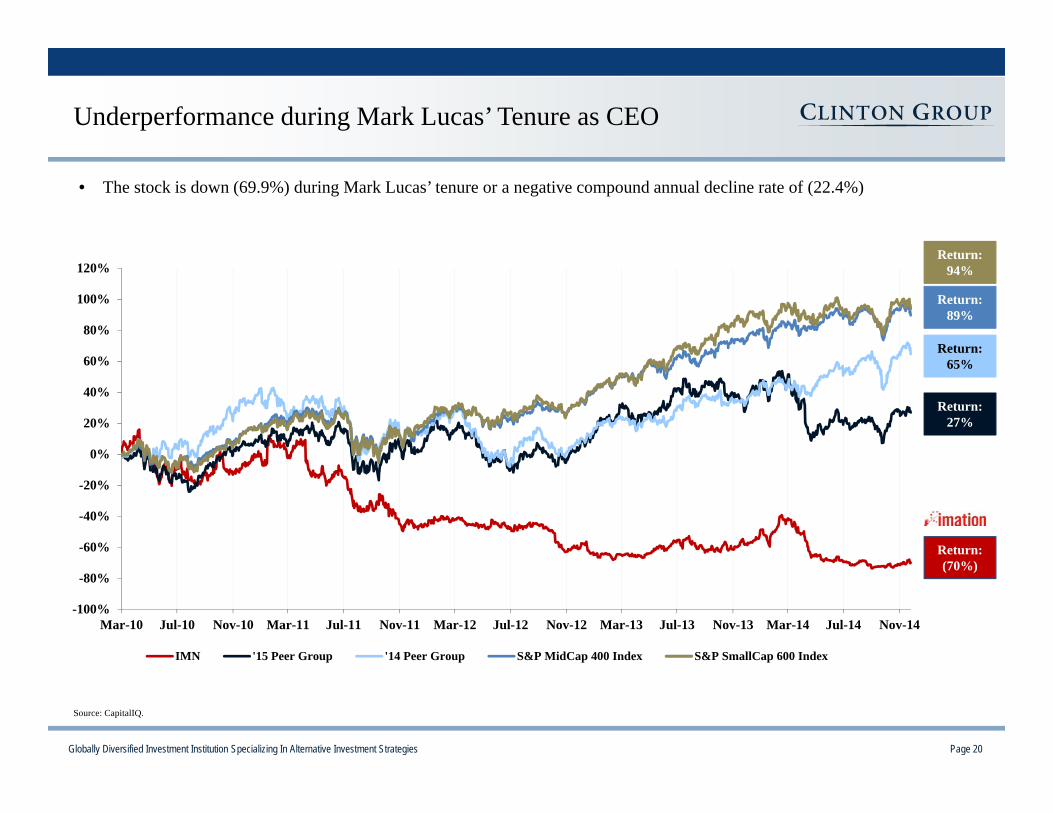
Underperformance during Mark Lucas’ Tenure as CEO
Return: 27%
Return: 89%
Return: 65%
Return: (70%)
• The stock is down (69.9%) during Mark Lucas’ tenure or a negative compound annual decline rate of (22.4%)
-100%
-80%
-60%
-40%
-20%
0%
20%
40%
60%
80%
100%
120%
Mar-10 Jul-10 Nov-10 Mar-11 Jul-11 Nov-11 Mar-12 Jul-12 Nov-12 Mar-13 Jul-13 Nov-13 Mar-14 Jul-14 Nov-14
IMN '15 Peer Group '14 Peer Group S&P MidCap 400 Index S&P SmallCap 600 Index
Return: 94%
Source: CapitalIQ.
Globally Diversified Investment Institution Specializing In Alternative Investment Strategies Page 21
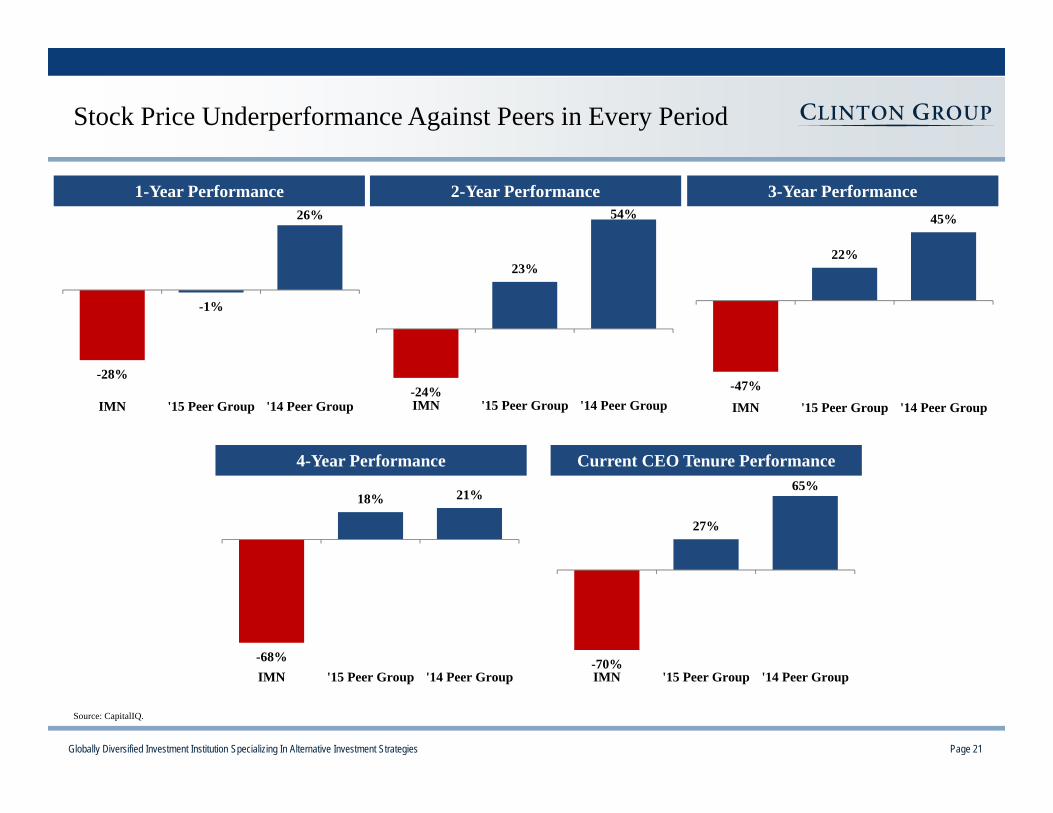
Stock Price Underperformance Against Peers in Every Period
1-Year Performance 3-Year Performance2-Year Performance
4-Year Performance
Source: CapitalIQ.
Current CEO Tenure Performance
-28%
-1%
26%
IMN '15 Peer Group '14 Peer Group-24%
23%
54%
IMN '15 Peer Group '14 Peer Group-47%
22%
45%
IMN '15 Peer Group '14 Peer Group
-68%
18% 21%
IMN '15 Peer Group '14 Peer Group-70%
27%
65%
IMN '15 Peer Group '14 Peer Group
Globally Diversified Investment Institution Specializing In Alternative Investment Strategies Page 22
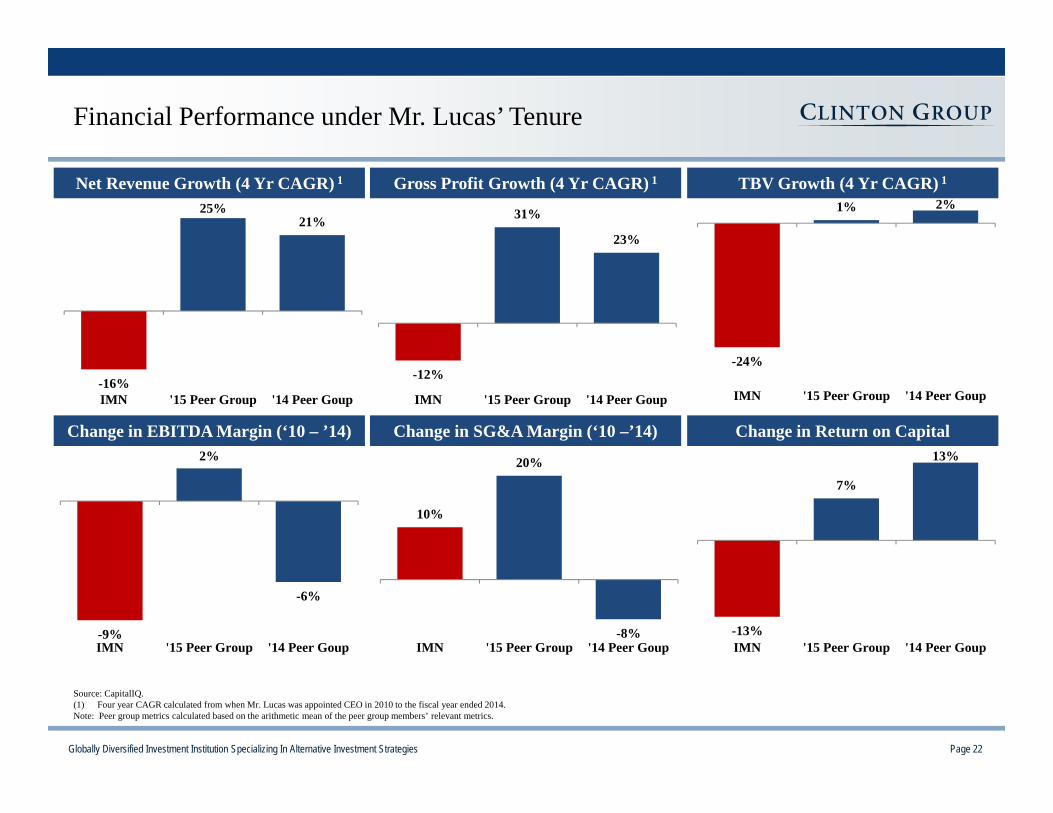
Financial Performance under Mr. Lucas’ Tenure
Net Revenue Growth (4 Yr CAGR) 1 TBV Growth (4 Yr CAGR) 1Gross Profit Growth (4 Yr CAGR) 1
Source: CapitalIQ.(1) Four year CAGR calculated from when Mr. Lucas was appointed CEO in 2010 to the fiscal year ended 2014.Note: Peer group metrics calculated based on the arithmetic mean of the peer group members’ relevant metrics.
Change in EBITDA Margin (‘10 – ’14) Change in Return on CapitalChange in SG&A Margin (‘10 –’14)
-16%
25%21%
IMN '15 Peer Group '14 Peer Goup
-12%
31%
23%
IMN '15 Peer Group '14 Peer Goup
-9%
2%
-6%
IMN '15 Peer Group '14 Peer Goup
10%
20%
-8%IMN '15 Peer Group '14 Peer Goup
-13%
7%
13%
IMN '15 Peer Group '14 Peer Goup
-24%
1% 2%
IMN '15 Peer Group '14 Peer Goup

Globally Diversified Investment Institution Specializing In Alternative Investment Strategies Page 23
The Last Two Years Have Deteriorated
Net Revenue Growth (2 Yr CAGR) 1 TBV Growth ( 2 Yr CAGR) 1Gross Profit Growth (2 Yr CAGR) 1
2014 EBITDA Margin 2014 Return on Capital2014 SG&A Margin (% of Revenue)
Source: CapitalIQ.(1) 2 year CAGR calculated from 2012 to 2014.Note: Peer group metrics calculated based on the arithmetic mean of the peer group members’ relevant metrics.
-5% -4%
12%
IMN '15 Peer Group '14 Peer Goup
24%
40%
28%
IMN '15 Peer Group '14 Peer Goup
-11%
-15%
7%
IMN '15 Peer Group '14 Peer Goup
-15%
10%
16%
IMN '15 Peer Group '14 Peer Goup
-14%
31%
18%
IMN '15 Peer Group '14 Peer Goup-23%
15%
3%
IMN '15 Peer Group '14 Peer Goup

Globally Diversified Investment Institution Specializing In Alternative Investment Strategies Page 24
• Since the onset of Mr. Lucas’ tenure, revenue has declined by a nearly (16%) compound annual decline rate since 2010, despitesignificant investment in R&D and acquisitions
Performance has Deteriorated Since Mr. Lucas Became CEO
Revenue Operating Income Return on Equity
$1,461
$1,167
$1,007
$861 $730
2010 2011 2012 2013 2014
Source: CapitalIQ.Note: Dollars in millions.
$22$16
-$23 -$20
-$57
2010 2011 2012 2013 2014 -18.5%
-4.7%
-57.8%
-6.3%
-36.6%
2010 2011 2012 2013 2014
Globally Diversified Investment Institution Specializing In Alternative Investment Strategies Page 25
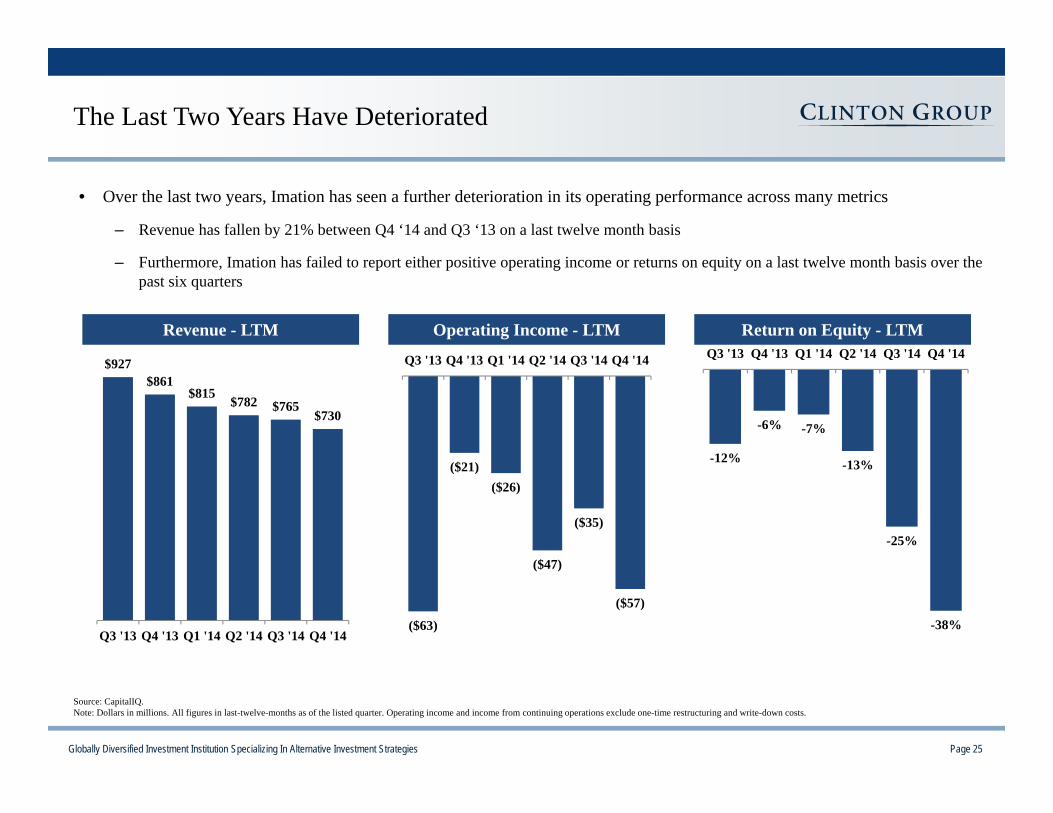
• Over the last two years, Imation has seen a further deterioration in its operating performance across many metrics
– Revenue has fallen by 21% between Q4 ‘14 and Q3 ‘13 on a last twelve month basis
– Furthermore, Imation has failed to report either positive operating income or returns on equity on a last twelve month basis over the past six quarters
The Last Two Years Have Deteriorated
Revenue - LTM Operating Income - LTM Return on Equity - LTM
Source: CapitalIQ.Note: Dollars in millions. All figures in last-twelve-months as of the listed quarter. Operating income and income from continuing operations exclude one-time restructuring and write-down costs.
$927 $861
$815 $782 $765 $730
Q3 '13 Q4 '13 Q1 '14 Q2 '14 Q3 '14 Q4 '14
-12%
-6% -7%
-13%
-25%
-38%
Q3 '13 Q4 '13 Q1 '14 Q2 '14 Q3 '14 Q4 '14
($63)
($21)($26)
($47)
($35)
($57)
Q3 '13 Q4 '13 Q1 '14 Q2 '14 Q3 '14 Q4 '14

Globally Diversified Investment Institution Specializing In Alternative Investment Strategies Page 26
Costs Are Bloated; Historical Cost Reductions are Unobservable
SG&A as % of Revenue
13.9%15.6%
19.0%21.1%
23.9%22.2% 22.2%
23.9%
12.0%14.0%16.0%18.0%20.0%22.0%24.0%26.0%
2010 2011 2012 2013 2014 LTMQ2 '14
LTMQ3 '14
LTMQ4 '14
1.1%
1.6%
2.0% 2.1%
2.6%2.2% 2.3%
2.6%
1.0%
1.5%
2.0%
2.5%
3.0%
2010 2011 2012 2013 2014 LTMQ2 '14
LTMQ3 '14
LTMQ4 '14
$87 $114
$419 $432 $477
$0$100
$200$300
$400$500
$600
2010 2011 2012 2013 2014
Cumulative Restructuring Expenses / Impairments ($ mm)
R&D as % of Revenue
Our Take:
• SG&A should be reduced to keep pace with expected revenue declines
• Trend has worsened Q3 to Q4 ‘14
Result:
• SG&A increased 1,000 basis points from 2010 to 2014
• R&D should have a payback manifesting in revenue growth
• Trend has worsened Q3 to Q4 ‘14
• Imation’s R&D is up 15% on an absolute basis since 2010 with unobservable impact to revenue
• Restructuring should be one-time and yet it occurs annually
• The impairments are an indictment of the historical acquisition strategy
• Imation has averaged $14.0 million per year in restructuring expenses
• “we embarked on a restructuring program that has taken out over $100 million in legacy costs…” (Imation’s 2015 Preliminary Proxy)
Globally Diversified Investment Institution Specializing In Alternative Investment Strategies Page 27
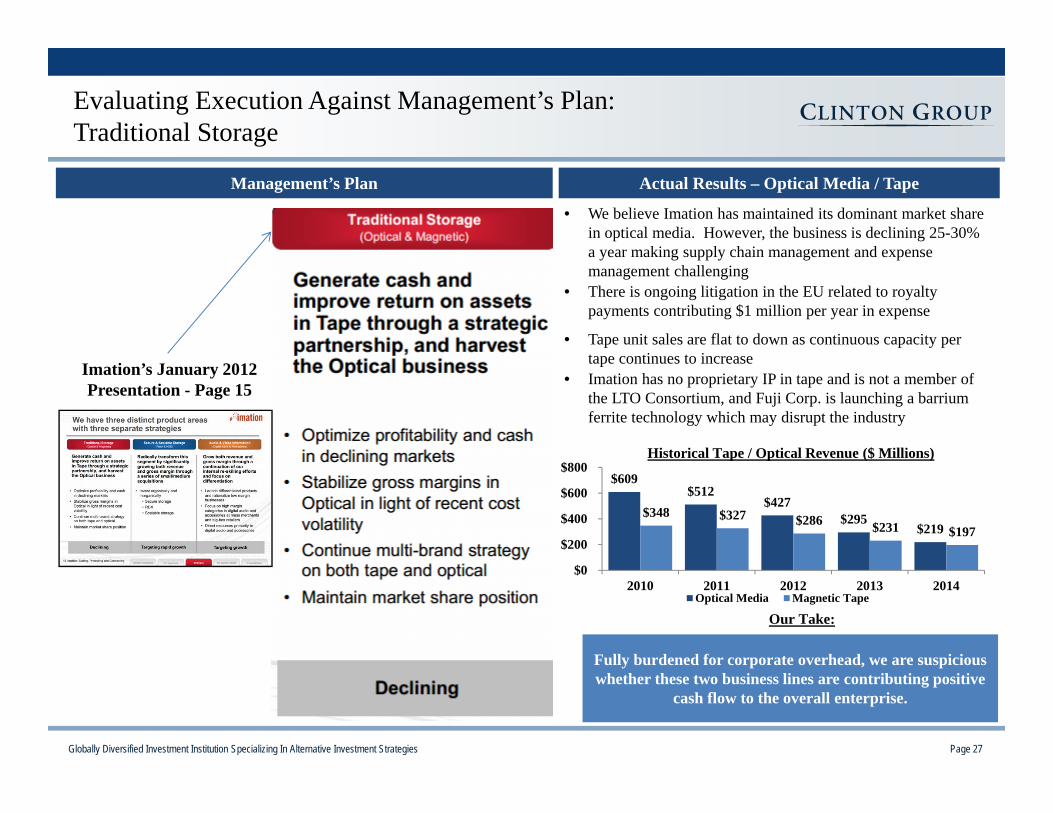
Evaluating Execution Against Management’s Plan:Traditional Storage
Imation’s January 2012 Presentation - Page 15
Management’s Plan Actual Results – Optical Media / Tape
• We believe Imation has maintained its dominant market share in optical media. However, the business is declining 25-30% a year making supply chain management and expense management challenging
• There is ongoing litigation in the EU related to royalty payments contributing $1 million per year in expense
• Tape unit sales are flat to down as continuous capacity per tape continues to increase
• Imation has no proprietary IP in tape and is not a member of the LTO Consortium, and Fuji Corp. is launching a barriumferrite technology which may disrupt the industry
Fully burdened for corporate overhead, we are suspicious whether these two business lines are contributing positive
cash flow to the overall enterprise.
$609 $512
$427 $295
$219 $348 $327 $286 $231 $197
$0
$200
$400
$600
$800
2010 2011 2012 2013 2014Optical Media Magnetic Tape
Historical Tape / Optical Revenue ($ Millions)
Our Take:

Globally Diversified Investment Institution Specializing In Alternative Investment Strategies Page 28
Evaluating Execution Against Management’s Plan: Audio / Video Information
Imation’s January 2012 Presentation - Page 15
Management’s Plan Actual Results
• Management has backed away from the consumer business
• The audio group has experienced recent growth due to interest in the Company’s bluetooth products
• Imation is reliant on the TDK brand, and management has attempted to develop their owned Trek brand
It took the Board and Management several years to determine what most outsiders thought –
developing a low margin consumer business, without brand equity, IP or a distribution
advantage is difficult.
$224 $193
$161
$43 $51
$0
$50
$100
$150
$200
$250
2010 2011 2012 2013 2014
Audio/Video
Audio/Video Revenue ($ Millions)
Our Take:

Globally Diversified Investment Institution Specializing In Alternative Investment Strategies Page 29
• Acquisitions have been unsuccessful, and it is unclear to us what Imation’s product roadmap is that combines the acquired technology into a cohesive and exciting technology
• RDX appears to be a loser. Iron Key/Windows to Go has been below expectations. What’s the future of Nexsan?
Evaluating Execution Against Management’s Plan: Secure and Scalable Storage
Management’s Plan Actual Results
Imation’s January 2012 Presentation - Page 15
Company Product / Feature Set
Measuring Success
Acquisitions
• Stealth Zone platform for secure environments
• $8 million impairment of Mobile Security in Q2 2014
• Secure mobile data and workspaces
• Growth has not matched initial expectations
• Disk-based storage systems
• $35 million goodwill impairment charge
• Management turnover
• Encryption and software security solutions
• Growth has not matched initial expectations

Globally Diversified Investment Institution Specializing In Alternative Investment Strategies Page 30
• “Well, we have recruiters and both internally, externally working right now where we are looking at expanding the domestic sales force.” (Scott Robinson, Q1 2014 Earnings Call on April 30, 2014)
• “In late 2013, we started investing in Nexsan by aggressively hiring technical support and sales talent, introducing new products and promoting Nexsan solutions globally.” (Mark Lucas, Q4 2013 Earnings Call on February 7, 2014)
• “As we said previously, since we purchased Nexsan just a year ago, we have started investing in sales and channel initiatives. Specifically in this first quarter, we hired over 30 new sales, engineering and support professionals including new sales management in key geographies.” (Mark Lucas, Q3 2014 Earnings Call on November 4, 2014).
• Provide an optimal entry point for mid-sized organizations with a multi-tiered, scalable architecture that can expand with the customers' requirements
• Offer enterprise-class reliability, accessibility, integrity and security of stored data
• Provide industry-leading densities, which reduce the overall storage footprint and the total cost of ownership
• Provide products through global channel network
Most Recent Example of Poor Capital Allocation
• Nexsan is a provider of disk-based storage systems for mid-sized organizations
• After Nexsan’s failed IPO attempt, Imation acquired the Company in January 2013
• Purchase Price: $120 million, including $105 million in cash
• Valuation: ~1.5x revenue
• Venture capital backed
What Should Have Been “Plug and Play” Has Cost MoreWhat We Believe Imation’s Lofty Goals Were
Transaction Summary Nexsan’s Strategy from their S-1 (March 2011)
• We believe Imation intended on buying a standalone disk based storage company which they could “plug and play” into their existing enterprise and benefit from its organic growth
• We believe Imation’s management believed that Nexsan was cutting-edge technology that would differentiate itself by its feature set, performance and capability
• We believe Imation’s management believed that Nexsan would command a premium multiple like companies such as Violin Memory and Nimble Storage
Nexsan Has Underperformed, Cost More Money than Expected and Led to a $35 million Writedown

Globally Diversified Investment Institution Specializing In Alternative Investment Strategies Page 31
• Flawed “go-to market” strategy• Imation’s salesforce did not match direct
sales and channel assist model required for success
Optimism for Nexsan Met with Poor Execution
What Management Said Results
• “Imation’s acquisition of Nexsan is an exciting next step in our strategic transformation, which includes investing in growth platforms in data storage and security solutions, where we are targeting markets with strong growthrates.” (Mark Lucas, 1/2/13, Press Release, emphasis added)
• “they’re a healthy, growing company.” (Paul Zeller, 1/2/13, Minnesota Star Tribune report, emphasis added)
• 2013 Nexsan revenue declined (12.6%) from 2012• 2014 Storage and Security Solutions revenue
declined (6.8)% from 2013• “While Nexsan is not yet achieving this anticipated
growth rate, we know that customers are faced with managing an ever growing amount of data” (Mark Lucas, Q3 2014 earnings call )
• “the combination of Nexsan’s products, technologies, and talented teams with Imation’s global reach and infrastructure will be an excellent accelerator for our growth strategy in storage solution” (Mark Lucas, 1/2/13, Press Release)
• “Nexsan is already generating positive cash flow, and we expect to enhance that. Nexsan will improve our results in terms of top-line trajectory and profitability.” (Paul Zeller, 1/2/13, Minnesota Star Tribune report)
• Nexsan had a loss from continuing operations of ($9.4) and ($3.7) million in 2011 and 2012, respectively
• Imation added $35.1 million and $11.3 million in SG&A in each of 2013 and 2014, respectively
What We Believe Went Wrong
• Limited storage experience on the Board of Directors
• CEO has little data storage experience required to lead an identification and due diligence process
• Management thought it was a “plug and play” addition
• CEO allowed Nexsan’s management to operate independently1
(1) Source: Q1 2014 Earnings Call on April 30, 2014. “We pretty much let Nexsan operate independently through the majority of 2013 and towards the end, we worked with Philip Black to put in an investment scenario where we’re adding a lot of people across the organization which we started doing at the end of Q4 and really got into it heavily in Q1,” said Mr. Lucas.
Globally Diversified Investment Institution Specializing In Alternative Investment Strategies Page 32
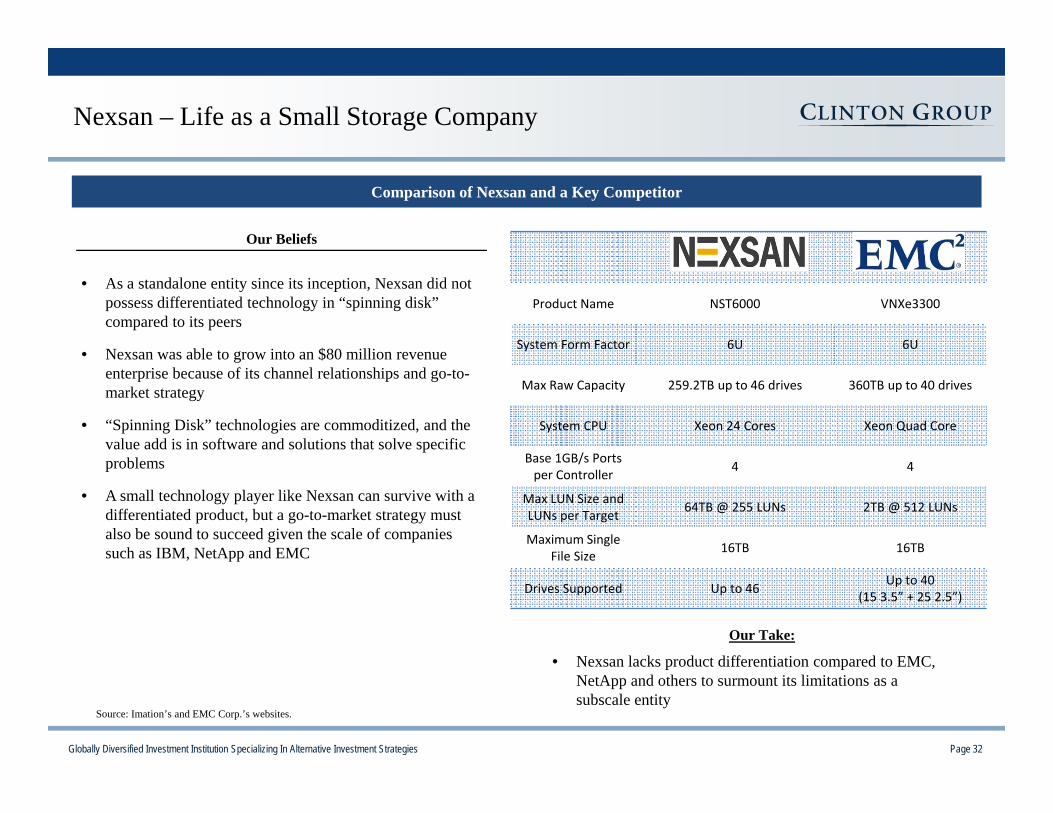
Product Name NST6000 VNXe3300
System Form Factor 6U 6U
Max Raw Capacity 259.2TB up to 46 drives 360TB up to 40 drives
System CPU Xeon 24 Cores Xeon Quad Core
Base 1GB/s Ports per Controller 4 4
Max LUN Size and LUNs per Target 64TB @ 255 LUNs 2TB @ 512 LUNs
Maximum Single File Size 16TB 16TB
Drives Supported Up to 46 Up to 40 (15 3.5” + 25 2.5”)
Source: Imation’s and EMC Corp.’s websites.
Comparison of Nexsan and a Key Competitor
• As a standalone entity since its inception, Nexsan did not possess differentiated technology in “spinning disk” compared to its peers
• Nexsan was able to grow into an $80 million revenue enterprise because of its channel relationships and go-to-market strategy
• “Spinning Disk” technologies are commoditized, and the value add is in software and solutions that solve specific problems
• A small technology player like Nexsan can survive with a differentiated product, but a go-to-market strategy must also be sound to succeed given the scale of companies such as IBM, NetApp and EMC
Nexsan – Life as a Small Storage Company
Our Beliefs
Our Take:
• Nexsan lacks product differentiation compared to EMC, NetApp and others to surmount its limitations as a subscale entity

Globally Diversified Investment Institution Specializing In Alternative Investment Strategies Page 33
• “We have not yet achieved our previously forecasted year-over-year growth.- Scott Robinson, Q3 '14 Earnings Call
• “We have been somewhat disappointed that we have not been able to grow year-over-year and that while we're growing sequentially, the year-over-year growth has not yet come… we noted that our global growth was a little bit slower than we originally anticipated" - Scott Robinson, Q3 '14 Earnings Call
• “Nexsan is not yet achieving its anticipated growth rate." – Mark Lucas, Q3 '14 Earnings Call
Recent Performance vs. Analyst Estimates
Imation Performance vs. Analyst Estimates
Source: CapitalIQ.
Analysts Pessimistic About Management CapabilityManagement Acknowledges Underperformance
• “We believe the announcement of the adviser engagement was part show and part pragmatism.” - Lake Street Capital Advisors, 2/10/15
• “Our BUY rating is based less on the hope of a rapid return to profitability and more on the salvage value of this $130 million market cap company.” - Lake Street Capital Advisors, 7/31/14
Q1 2014 Q2 2014 Q3 2014 Q4 2014 2014Normalized EPSActual -$0.36 -$0.35 -$0.42 -$0.30 -$1.43Consensus -$0.32 -$0.30 -$0.35 -$0.21 -$1.31
Actual vs Consensus -$0.04 -$0.05 -$0.07 -$0.09 -$0.12

Globally Diversified Investment Institution Specializing In Alternative Investment Strategies Page 34
10%
1%
-2% -3%
-11%
2012 Goal 2011 2012 2013 2014
Management’s Goals and Results On Its Own Scorecard
Four Years Later – Management’s 2011 Goals Have Not Been AchievedLong Term Goals Status as of 2014 Achieved
20%+ Gross Margins Gross margins were 19.0% in 2014 XOperating Margins 4-5% Negative Operating Margins in 2012, 2013 and 2014 XReturn on Invested Capital of 10%+ Negative Return on Invested Capital in 2012, 2013 and 2014 X
Mid Term Goals
Return to top-line growth by the end of 2012 Negative revenue growth in 2012, 2013 and 2014 X
• Imation has meaningfully missed almost all of the financial performance goals laid out in its strategic plan from February 2011
Revenue Growth Operating Loss Margins Return on Invested Capital
Source: Capital IQ and Company Filings.
0%
-20%
-14% -14% -15%
2012Goal 2011 2012 2013 2014
5%1%
-2% -2%
-8%
2012Goal 2011 2012 2013 2014

Globally Diversified Investment Institution Specializing In Alternative Investment Strategies Page 35
Mr. Lucas’ Assessment on the Turnaround
CEO’s Declaration SourcePositive Stock Performance
Since?
Return to Revenue Growth?
Return BeatPeers?
“In the short term, the [stock] market probably doesn’t like what we’re doing. But we have new investors coming in who are very excited.”
Twin Cities Business Journal,1/1/12
No No No
“We are mid-way through this transformation and we continue to execute on the initiatives we laid out in 2011. The actions we are taking are designed to build a platform for long-term growth and improved operating margins.”
Q1 2012 Earnings Call No No No
“We’ve planned that 2012 would be a year of transition for us building a platform for long-term growth and improved operating margins. We’re making steady progress on our strategy as reflected in our gross margin improvement. We’re seeing good traction in our strategic growth products. And we remain very focused on our goal of returning Imation to a revenue growth as we exit 2012.”
Q2 2012 Earnings Call No No No
“Given the softness in our business and the macroeconomic headwinds, it is now not likely that Imation will return to total company revenue growth in the near term. However, I don’t want a tough quarter to mask the progress we’ve made in developing and launching higher margin products.”
Q3 2012 Earnings Call No No No
“We are making dramatic changes in this company.” Q4 2012 Earnings Call No No No
“Clearly we are on the right track.” Q1 2013 Earnings Call No No No
“I am optimistic about the Company’s long-term prospects.” Q2 2013 Earnings Call No No No
“While this is encouraging, we have not yet reached an inflection point in our transformation, as sales in our growth products have not yet offset secular revenue decreases in our legacy businesses.”
Q1 2014Earnings Call No No No

Globally Diversified Investment Institution Specializing In Alternative Investment Strategies Page 36
Board Decisions Have Destroyed Value
Board Responsibility Decision Made Consequences for Stockholders
Data Storage, Protection and Connectivity Strategic
Plan in 2011
Setting Strategy -63% shareholder returns since January 2011
$326 million in write-downs, impairments and restructuring charges since 2012
Memorex, TDK Life on Record, MXI, NexsanApproving Acquisitions
The Board has reiterated its support for Mark
Lucas
Ensuring Overseeing Operations and
Efficiency
Negative revenue growth in 2012, 2013 and 2014
Negative Operating Margins in 2012, 2013 and 2014
Driving Capital Allocation Decisions
Acquisitions and investments in operating
losses
Balance sheet has worsened under the Lucas tenure
Negative ROIC in 2012, 2013 and 2014

Globally Diversified Investment Institution Specializing In Alternative Investment Strategies Page 37
Is the Current Board Equipped to Evaluate Corporate Strategy?
Director Business ExperienceTraditional
Storage
Secure & Scalable Storage
Audio & Video
Information
Geoff Barrall CEO, Connected Data, Inc.
Anthony Brausen SVP, Finance, The Mosaic Company X X X
William LaPerch President, LaPerch Consulting, LLC X X X
Mark E. Lucas President and CEO, Imation Corp.
L. White Matthews, III Former EVP and CFO of Ecolab, Inc. and Union Pacific Corporation X X X
David B. Stevens Former CTO and VP, Corporate DevelopmentBrocade Communications Systems, Inc.
• While the Directors may be fine executives in their fields, we believe a majority of the independent directors lack the expertise in the Company’s industry of focus, which is necessary to address the current problems of Imation
Globally Diversified Investment Institution Specializing In Alternative Investment Strategies Page 38
I Executive Summary
II History of Value Destruction at Imation
III Current Compensation Practices
IV The Path Forward
IV Conclusion
Globally Diversified Investment Institution Specializing In Alternative Investment Strategies Page 39
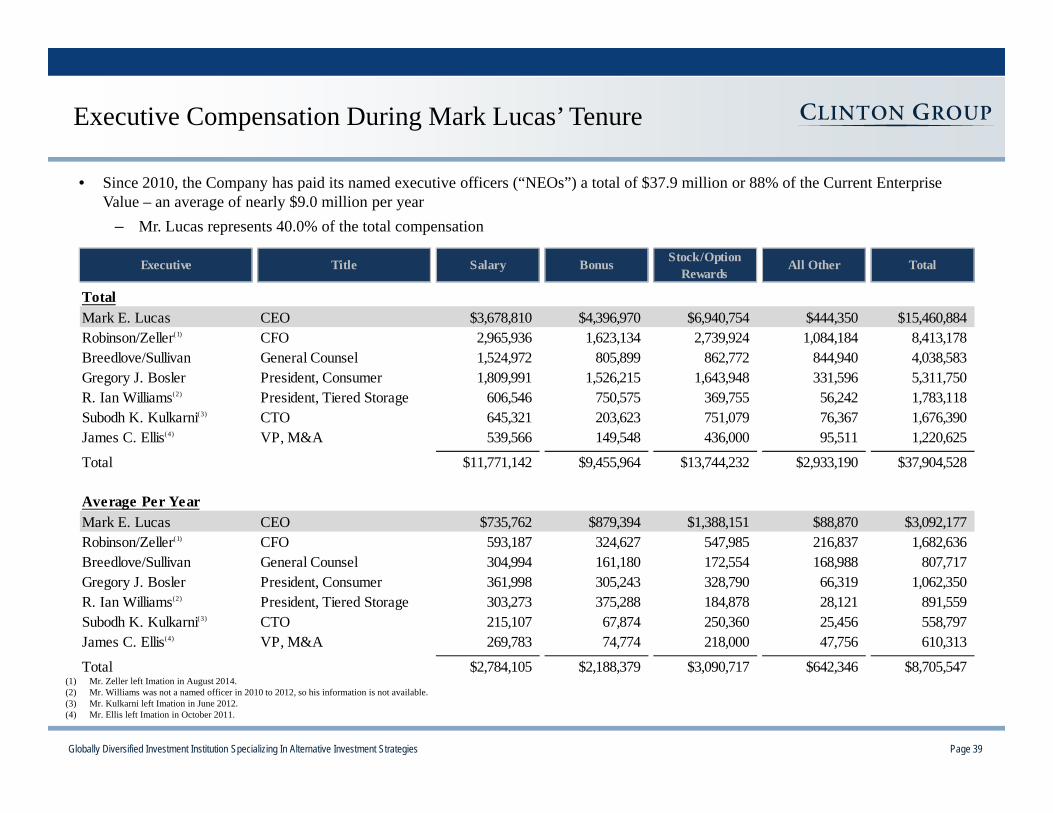
• Since 2010, the Company has paid its named executive officers (“NEOs”) a total of $37.9 million or 88% of the Current EnterpriseValue – an average of nearly $9.0 million per year
– Mr. Lucas represents 40.0% of the total compensation
Executive Compensation During Mark Lucas’ Tenure
(1) Mr. Zeller left Imation in August 2014.(2) Mr. Williams was not a named officer in 2010 to 2012, so his information is not available.(3) Mr. Kulkarni left Imation in June 2012.(4) Mr. Ellis left Imation in October 2011.
Executive Title Salary Bonus Stock/Option Rewards
All Other Total
TotalMark E. Lucas CEO $3,678,810 $4,396,970 $6,940,754 $444,350 $15,460,884Robinson/Zeller(1) CFO 2,965,936 1,623,134 2,739,924 1,084,184 8,413,178 Breedlove/Sullivan General Counsel 1,524,972 805,899 862,772 844,940 4,038,583 Gregory J. Bosler President, Consumer 1,809,991 1,526,215 1,643,948 331,596 5,311,750 R. Ian Williams(2) President, Tiered Storage 606,546 750,575 369,755 56,242 1,783,118 Subodh K. Kulkarni(3) CTO 645,321 203,623 751,079 76,367 1,676,390 James C. Ellis(4) VP, M&A 539,566 149,548 436,000 95,511 1,220,625
Total $11,771,142 $9,455,964 $13,744,232 $2,933,190 $37,904,528
Average Per YearMark E. Lucas CEO $735,762 $879,394 $1,388,151 $88,870 $3,092,177Robinson/Zeller(1) CFO 593,187 324,627 547,985 216,837 1,682,636 Breedlove/Sullivan General Counsel 304,994 161,180 172,554 168,988 807,717 Gregory J. Bosler President, Consumer 361,998 305,243 328,790 66,319 1,062,350 R. Ian Williams(2) President, Tiered Storage 303,273 375,288 184,878 28,121 891,559 Subodh K. Kulkarni(3) CTO 215,107 67,874 250,360 25,456 558,797 James C. Ellis(4) VP, M&A 269,783 74,774 218,000 47,756 610,313
Total $2,784,105 $2,188,379 $3,090,717 $642,346 $8,705,547
Globally Diversified Investment Institution Specializing In Alternative Investment Strategies Page 40
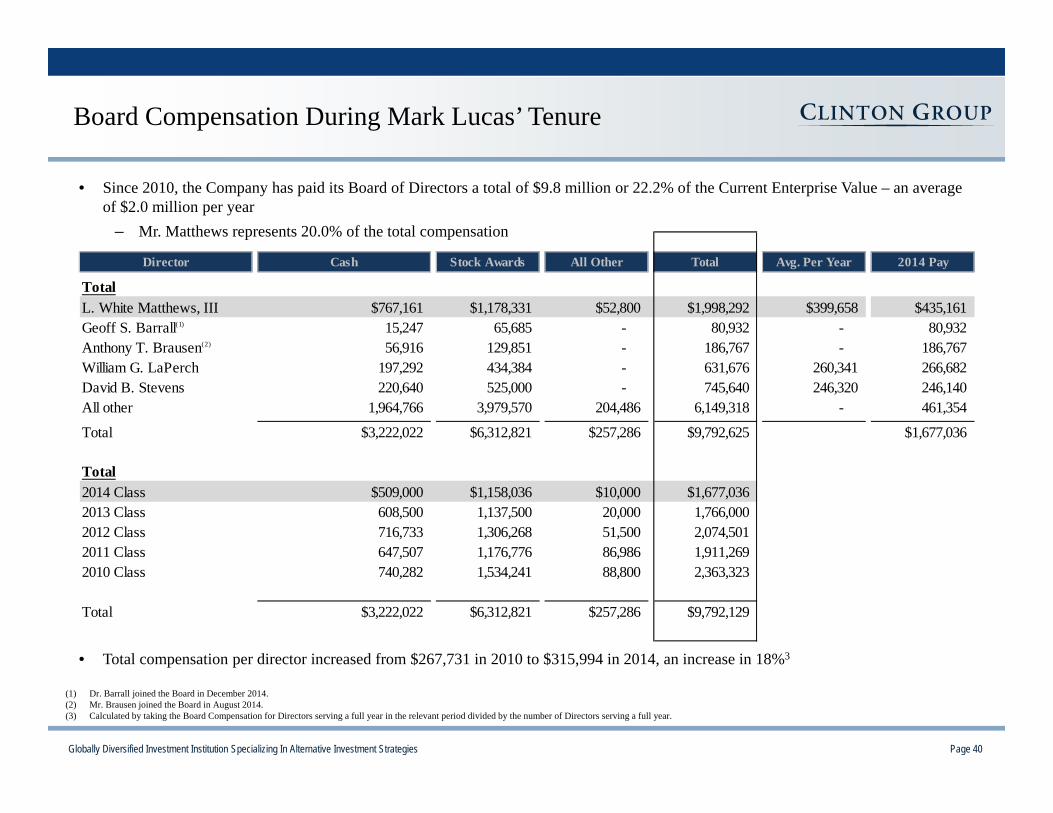
• Since 2010, the Company has paid its Board of Directors a total of $9.8 million or 22.2% of the Current Enterprise Value – an average of $2.0 million per year
– Mr. Matthews represents 20.0% of the total compensation
• Total compensation per director increased from $267,731 in 2010 to $315,994 in 2014, an increase in 18%3
Board Compensation During Mark Lucas’ Tenure
(1) Dr. Barrall joined the Board in December 2014.(2) Mr. Brausen joined the Board in August 2014.(3) Calculated by taking the Board Compensation for Directors serving a full year in the relevant period divided by the number of Directors serving a full year.
Director Cash Stock Awards All Other Total Avg. Per Year 2014 Pay
TotalL. White Matthews, III $767,161 $1,178,331 $52,800 $1,998,292 $399,658 $435,161Geoff S. Barrall(1) 15,247 65,685 - 80,932 - 80,932 Anthony T. Brausen(2) 56,916 129,851 - 186,767 - 186,767 William G. LaPerch 197,292 434,384 - 631,676 260,341 266,682 David B. Stevens 220,640 525,000 - 745,640 246,320 246,140 All other 1,964,766 3,979,570 204,486 6,149,318 - 461,354
Total $3,222,022 $6,312,821 $257,286 $9,792,625 $1,677,036
Total2014 Class $509,000 $1,158,036 $10,000 $1,677,0362013 Class 608,500 1,137,500 20,000 1,766,000 2012 Class 716,733 1,306,268 51,500 2,074,501 2011 Class 647,507 1,176,776 86,986 1,911,269 2010 Class 740,282 1,534,241 88,800 2,363,323
Total $3,222,022 $6,312,821 $257,286 $9,792,129
Globally Diversified Investment Institution Specializing In Alternative Investment Strategies Page 41
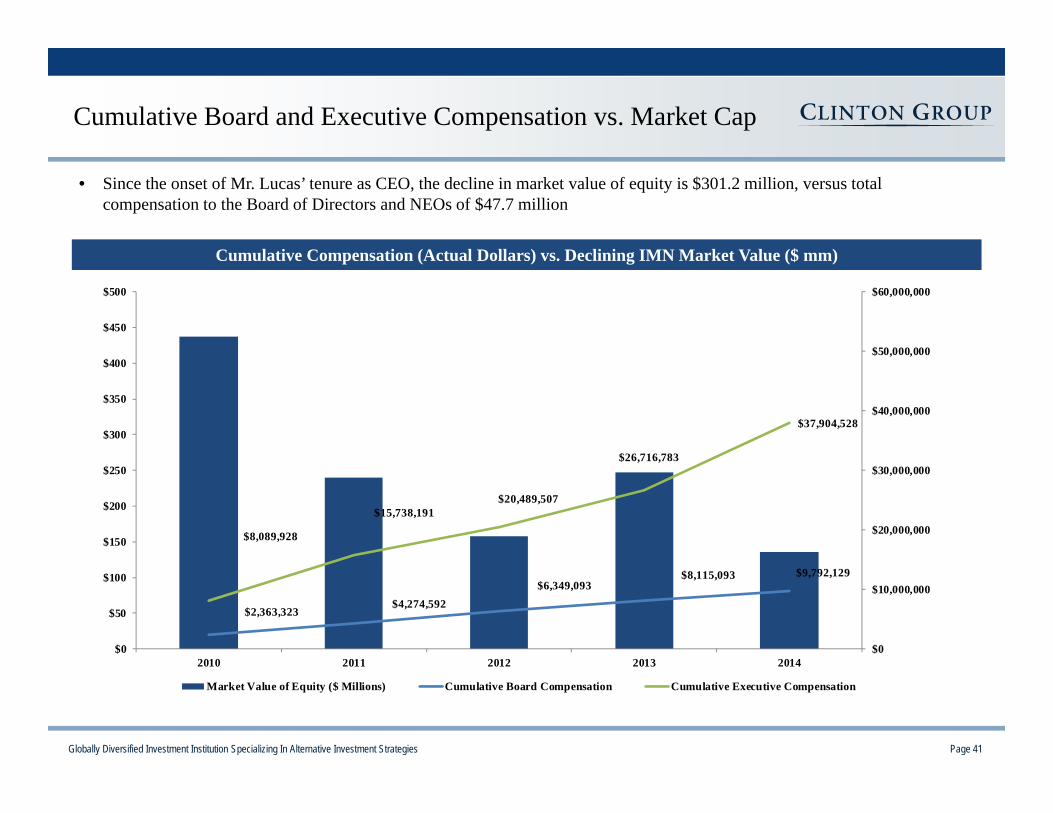
• Since the onset of Mr. Lucas’ tenure as CEO, the decline in market value of equity is $301.2 million, versus total compensation to the Board of Directors and NEOs of $47.7 million
Cumulative Board and Executive Compensation vs. Market Cap
Cumulative Compensation (Actual Dollars) vs. Declining IMN Market Value ($ mm)
$2,363,323$4,274,592
$6,349,093$8,115,093 $9,792,129
$8,089,928
$15,738,191 $20,489,507
$26,716,783
$37,904,528
$0
$10,000,000
$20,000,000
$30,000,000
$40,000,000
$50,000,000
$60,000,000
$0
$50
$100
$150
$200
$250
$300
$350
$400
$450
$500
2010 2011 2012 2013 2014
Market Value of Equity ($ Millions) Cumulative Board Compensation Cumulative Executive Compensation

Globally Diversified Investment Institution Specializing In Alternative Investment Strategies Page 42
The Board’s Views on Bonus Payments
Our Take:• Imation’s stock price was down (19.0%) in 2014 or a
reduction in market capitalization of $38.2 million• Imation’s revenue declined 15.3% year over year• According to CapitalIQ, EBITDA decreased from $3.5 million
in 2013 to ($35.0) million in 2014• For 2014, CapitalIQ and Bloomberg calculate EBITDA of
($35.0) million and ($39.9) million, respectively, versus the amount used to calculate the payout – ($20.6) million
• Imation should not be rewarding its executives for free cash flow including working capital as working capital produces cash in a declining business
• The sum of Consumer and Tiered Storage EBITDA do not take into account corporate allocations
2014 Bonus Compensation Does Not Seem to Match Shareholder Value Creation – Payouts over 100%++ of Base
2014 Executive Comments Suggest Another Outcome:• “Storage and Security Solutions, however, also declined by
23%.... Our revenues were impacted by general softness in IT spending. We had fewer larger deals, especially compared to the first quarter of 2013 and saw some continuing softness in Fed business.” (Mark Lucas, Q1 2014 Earnings Call on April 30, 2014)
• “While Nexsan is not yet achieving its anticipated growth rate, we know that customers are faced with managing an ever-growing amount of data.” (Mark Lucas, Q3 2014 Earnings Call on November 4, 2014).
• “…Nexsan revenues did not match year-ago levels.” (Scott Robinson, Q3 2014 Earnings Call on November 4, 2014)
(1) Mr. Zeller left Imation in August 2014.
Executive Title Bonus Target Payout as % of Base
TotalMark E. Lucas CEO $2,340,785 EBITDA ($36.5) million; Payout 126%; Robinson/Zeller(1) CFO 692,684 FCF ($38.3 million); Above target for EBITDA: Actual ($20.6) millionJohn P. Breedlove General Counsel 390,556 Certain portion of TSS Revenue $105.6 million Above target for FCF: Actual ($4.1) million
Gregory J. Bosler President, Consumer 802,494 EBITDA of $16.7 million, FCF of $21.7 million Payout 185%; Above target in bothR. Ian Williams President, Tiered Storage 432,925 EBITDA of ($27.5) million, other revenue Payout 104%; Above target in EBITDA, missed
other targetsTotal $4,659,444
Globally Diversified Investment Institution Specializing In Alternative Investment Strategies Page 43
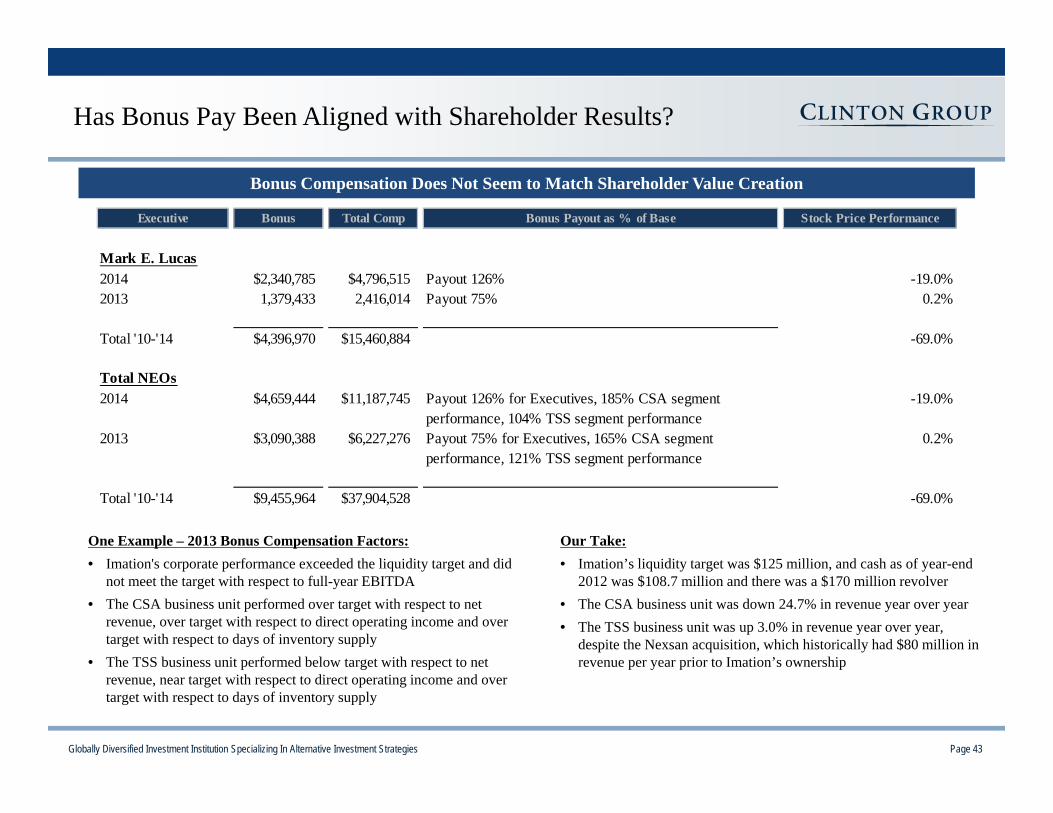
Has Bonus Pay Been Aligned with Shareholder Results?
Bonus Compensation Does Not Seem to Match Shareholder Value Creation
One Example – 2013 Bonus Compensation Factors:• Imation's corporate performance exceeded the liquidity target and did
not meet the target with respect to full-year EBITDA• The CSA business unit performed over target with respect to net
revenue, over target with respect to direct operating income and over target with respect to days of inventory supply
• The TSS business unit performed below target with respect to net revenue, near target with respect to direct operating income and over target with respect to days of inventory supply
Our Take:• Imation’s liquidity target was $125 million, and cash as of year-end
2012 was $108.7 million and there was a $170 million revolver• The CSA business unit was down 24.7% in revenue year over year• The TSS business unit was up 3.0% in revenue year over year,
despite the Nexsan acquisition, which historically had $80 million in revenue per year prior to Imation’s ownership
Executive Bonus Total Comp Bonus Payout as % of Base Stock Price Performance
Mark E. Lucas2014 $2,340,785 $4,796,515 Payout 126% -19.0%2013 1,379,433 2,416,014 Payout 75% 0.2%
Total '10-'14 $4,396,970 $15,460,884 -69.0%
Total NEOs2014 $4,659,444 $11,187,745 Payout 126% for Executives, 185% CSA segment
performance, 104% TSS segment performance -19.0%
2013 $3,090,388 $6,227,276 Payout 75% for Executives, 165% CSA segment performance, 121% TSS segment performance
0.2%
Total '10-'14 $9,455,964 $37,904,528 -69.0%
Globally Diversified Investment Institution Specializing In Alternative Investment Strategies Page 44
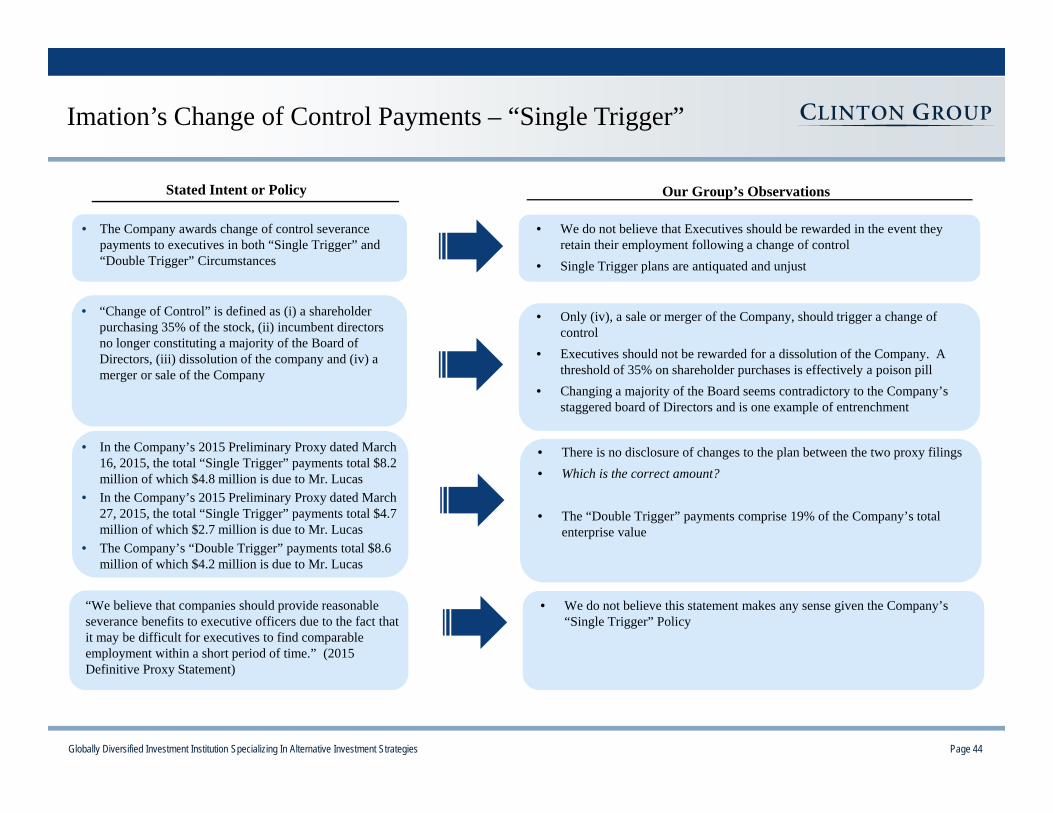
Imation’s Change of Control Payments – “Single Trigger”
Stated Intent or Policy Our Group’s Observations
• The Company awards change of control severance payments to executives in both “Single Trigger” and “Double Trigger” Circumstances
• We do not believe that Executives should be rewarded in the event they retain their employment following a change of control
• Single Trigger plans are antiquated and unjust
• “Change of Control” is defined as (i) a shareholder purchasing 35% of the stock, (ii) incumbent directors no longer constituting a majority of the Board of Directors, (iii) dissolution of the company and (iv) a merger or sale of the Company
• Only (iv), a sale or merger of the Company, should trigger a change of control
• Executives should not be rewarded for a dissolution of the Company. A threshold of 35% on shareholder purchases is effectively a poison pill
• Changing a majority of the Board seems contradictory to the Company’s staggered board of Directors and is one example of entrenchment
• In the Company’s 2015 Preliminary Proxy dated March 16, 2015, the total “Single Trigger” payments total $8.2 million of which $4.8 million is due to Mr. Lucas
• In the Company’s 2015 Preliminary Proxy dated March 27, 2015, the total “Single Trigger” payments total $4.7 million of which $2.7 million is due to Mr. Lucas
• The Company’s “Double Trigger” payments total $8.6 million of which $4.2 million is due to Mr. Lucas
• There is no disclosure of changes to the plan between the two proxy filings• Which is the correct amount?
• The “Double Trigger” payments comprise 19% of the Company’s total enterprise value
“We believe that companies should provide reasonable severance benefits to executive officers due to the fact that it may be difficult for executives to find comparable employment within a short period of time.” (2015 Definitive Proxy Statement)
• We do not believe this statement makes any sense given the Company’s “Single Trigger” Policy

Globally Diversified Investment Institution Specializing In Alternative Investment Strategies Page 45
Mkt Cap2 2014 Return DuringCompany Ticker 12/12/2014 Revenue2 Cash Non-Cash Total Lucas Tenure
Plantronics, Inc. PLT $2,219 $873 $74 $127 $201 96%VOXX International Corporation VOXX 196 775 71 1 72 21%Electronics for Imaging, Inc. EFII 2,051 790 57 250 307 276%CommVault Systems, Inc. CVLT 2,191 614 72 533 606 126%Quantum Corporation QTM 432 533 62 116 177 (34%)Silicon Graphics International Corp. SGI 325 516 66 133 200 17%Cray Inc. CRAY 1,319 562 59 83 142 619%iRobot Corporation IRBT 1,006 557 47 110 157 115%QLogic Corp. QLGC 1,048 503 76 136 212 (31%)Emulex Corporation ELX 376 424 60 127 187 (53%)Dot Hill Systems Corp. HILL 258 218 81 48 128 158%Nimble Storage, Inc. NMBL 2,021 228 56 110 165 NMViolin Memory, Inc. VMEM 424 79 16 535 551 NMCarbonite, Inc. CARB 369 123 25 123 148 NMFalconstor Software Inc. FALC 59 46 37 15 52 (62%)
Peer Group Median $432 $516 $60 $123 $177 58%
2014 Avg. Director Comp. 3
Peer Comparison
• Imation’s Compensation Committee repopulated its peer group for 2015
• 2015 Proxy peers have a market cap and an annual revenue of $432 million and $516 million, on average; and 2014 Proxy peers have a market cap and an annual revenue of $9.4 billion and $4.9 billion, on average
• Average total director pay for directors serving a full year at Imation totaled $315,994 in 2014, far in excess of the average for the 2015 peer group
*Source: Company filings.Note: For consistency, average compensation figures exclude board members whose tenures fall below 50% of the fiscal year. All dollars in millions.(1) Companies denoted have yet to file their 2015 proxy statements containing 2014 Director compensation, therefore 2013 Director compensation figures were used in calculating average compensation.(2) Dollars in millions.(3) Dollars in thousands.
1
1
1
1
• Excluding the Mr. Matthews’ compensation in 2014, directors serving a full year totaled $256,411
• In the peer comparison group, for companies with market capitalizations under $300 million, the average total director compensation for 2014 was $84,128

Globally Diversified Investment Institution Specializing In Alternative Investment Strategies Page 46
Our Take:• The guidelines for stock ownership should only be related
to open market purchases• The guidelines should also apply to Directors• Since the onset of Mr. Lucas’ tenure as CEO, there have
been a total of $323,192 worth of open market purchases compared to total compensation of $47.7 million
• No independent director has purchased shares in the open market in the last five years
Imation’s Policy:• NEOs have five years to meet their ownership guidelines
of a multiple of base pay• CEO - 3x, CFO - 2x, SVPs and VPs - 1x• There are no guidelines for Board Members• Ownership includes vested restricted stock
Stock Ownership Among Directors and NEOs
The Current Board’s Open Market Share Purchases (Actual Dollars) vs. Declining IMN Market Value ($ mm)
$13,498
$111,080
$16,394
$113,799 $75,200
$437
$240
$158
$247
$135
$0
$50
$100
$150
$200
$250
$300
$350
$400
$450
$500
$0
$50,000
$100,000
$150,000
$200,000
$250,000
$300,000
$350,000
$400,000
$450,000
$500,000
2010 2011 2012 2013 2014
Open Market Purchases Market Value of Equity ($ Millions)
Globally Diversified Investment Institution Specializing In Alternative Investment Strategies Page 47
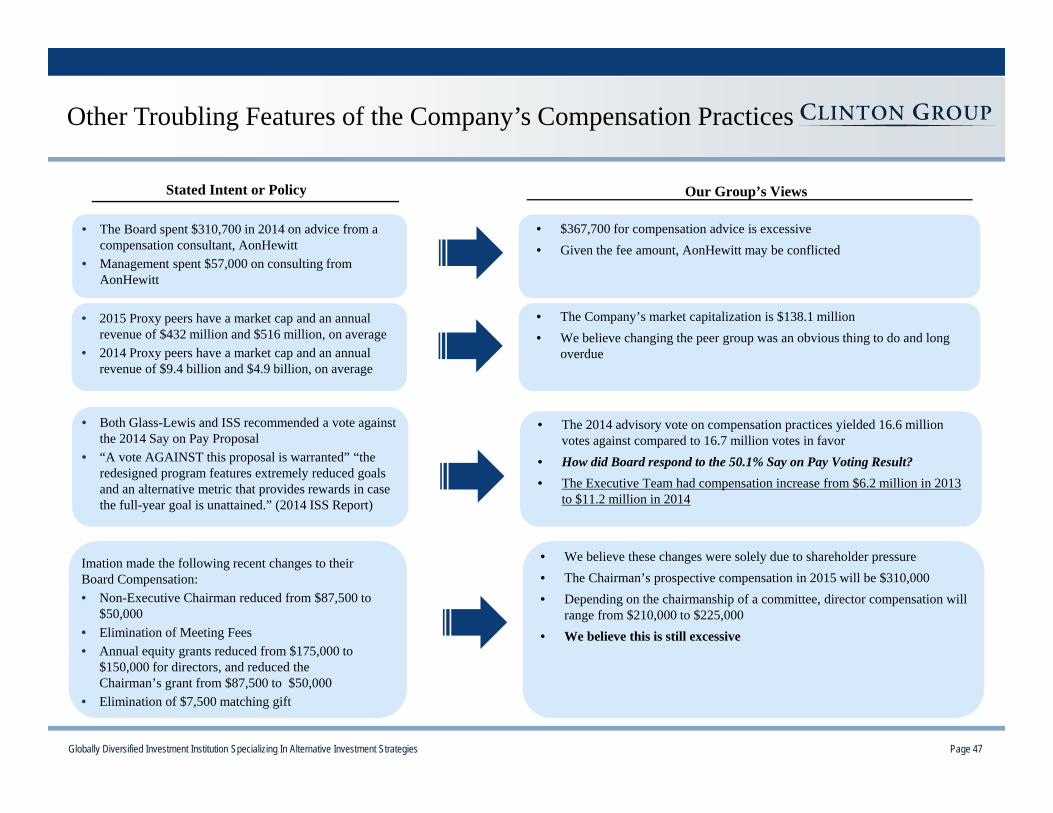
Other Troubling Features of the Company’s Compensation Practices
Stated Intent or Policy Our Group’s Views
• The Board spent $310,700 in 2014 on advice from a compensation consultant, AonHewitt
• Management spent $57,000 on consulting from AonHewitt
• $367,700 for compensation advice is excessive• Given the fee amount, AonHewitt may be conflicted
• 2015 Proxy peers have a market cap and an annual revenue of $432 million and $516 million, on average
• 2014 Proxy peers have a market cap and an annual revenue of $9.4 billion and $4.9 billion, on average
• The Company’s market capitalization is $138.1 million• We believe changing the peer group was an obvious thing to do and long
overdue
• Both Glass-Lewis and ISS recommended a vote against the 2014 Say on Pay Proposal
• “A vote AGAINST this proposal is warranted” “the redesigned program features extremely reduced goals and an alternative metric that provides rewards in case the full-year goal is unattained.” (2014 ISS Report)
• The 2014 advisory vote on compensation practices yielded 16.6 million votes against compared to 16.7 million votes in favor
• How did Board respond to the 50.1% Say on Pay Voting Result?• The Executive Team had compensation increase from $6.2 million in 2013
to $11.2 million in 2014
Imation made the following recent changes to their Board Compensation:• Non-Executive Chairman reduced from $87,500 to
$50,000• Elimination of Meeting Fees• Annual equity grants reduced from $175,000 to
$150,000 for directors, and reduced the Chairman’s grant from $87,500 to $50,000
• Elimination of $7,500 matching gift
• We believe these changes were solely due to shareholder pressure• The Chairman’s prospective compensation in 2015 will be $310,000• Depending on the chairmanship of a committee, director compensation will
range from $210,000 to $225,000• We believe this is still excessive

Globally Diversified Investment Institution Specializing In Alternative Investment Strategies Page 48
• According to the Company’s 2014 Form 10-K Filing, Spear Point Capital and its affiliates have filed a complaint in Delaware Chancery Court alleging:
– Breach of Fiduciary Duty
– Waste of Corporate Assets
– Unjust Enrichment
• The Defendants are the Board Members of the Company
Derivative Action in Delaware Chancery Court
“The Board grossly overcompensates its members in relation to companies of comparable market capitalization…”
“Plaintiffs bring this action, inter alia, to halt defendants’ illegal self-dealing and breaches of fiduciary duty.”
“Plaintiffs bring this action to recoup the excessive compensation the Director Defendants (as defined herein) awarded themselves and impose meaningful corporate governance reforms...”

Globally Diversified Investment Institution Specializing In Alternative Investment Strategies Page 49
I Executive Summary
II History of Value Destruction at Imation
III Current Compensation Practices
IV The Path Forward
IV Conclusion
Globally Diversified Investment Institution Specializing In Alternative Investment Strategies Page 50
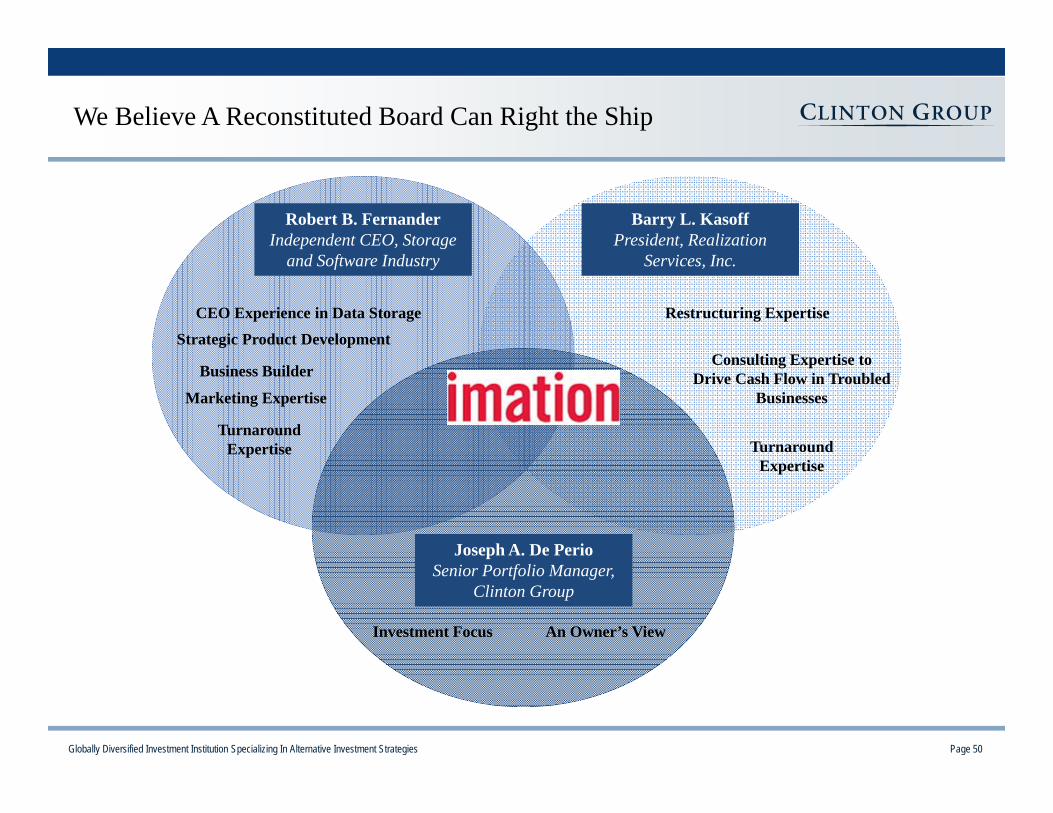
We Believe A Reconstituted Board Can Right the Ship
Restructuring Expertise
Joseph A. De PerioSenior Portfolio Manager,
Clinton Group
Barry L. KasoffPresident, Realization
Services, Inc.
Robert B. FernanderIndependent CEO, Storage
and Software Industry
Turnaround Expertise
CEO Experience in Data Storage
Strategic Product Development
Business Builder
Marketing Expertise
Investment Focus An Owner’s View
Consulting Expertise to Drive Cash Flow in Troubled
Businesses
Turnaround Expertise

Globally Diversified Investment Institution Specializing In Alternative Investment Strategies Page 51
Plan Going Forward
No additional acquisitions Additional capital required to sustain recent
acquisitions will have high ROIC thresholds All additional development or capital
expenditure projects must have a one year payback
Board Responsibility Previous Decisions The New Direction(1)
Rehab the overall product strategy and development of Nexsan
Evaluate cash flow generation
Eliminate wasteful spending Re-examine all business lines on a fully
burdened basis Recalibrate compensation
Evaluate all options to realize value on the Company’s real estate and patent portfolio; optimize working capital
Acquired IronKey, MXI, and Encryptx to improve Security
Solutions division
Purchased Nexsan and invested heavily to build Tiered Storage and Solutions division
Investing in Data Storage and Security Solutions
Introducing new, secure and scalable storage products
Increases in executive pay, and steady marketing expenses in
the face of falling sales
Setting Strategy
Approving Acquisitions
Overseeing Operations and Efficiency
Value Creation to Shareholders
An evaluation of a strategic alternatives process was
launched after our group went public with its proxy contest
(1) Plans which our nominees will seek to cause the Company to pursue. Our nominees, if elected, will exercise their fiduciary judgment to determine the best course for the Company. Our nominees, if elected, would constitute 50% of the Company’s Board of Directors, and there can be no assurance that our nominees’ plans will be effectuated.
We believe the new Board of Directors will correct previous mistakes
Globally Diversified Investment Institution Specializing In Alternative Investment Strategies Page 52
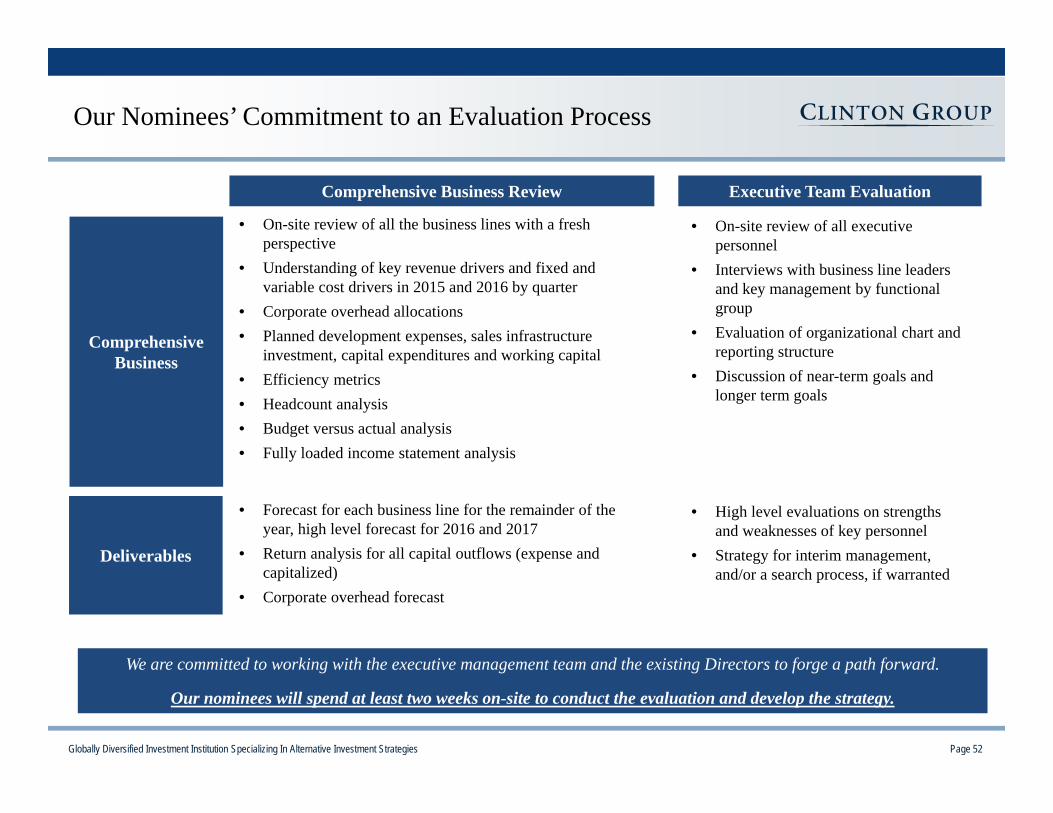
Our Nominees’ Commitment to an Evaluation Process
Comprehensive Business Review Executive Team Evaluation
• On-site review of all the business lines with a fresh perspective
• Understanding of key revenue drivers and fixed and variable cost drivers in 2015 and 2016 by quarter
• Corporate overhead allocations• Planned development expenses, sales infrastructure
investment, capital expenditures and working capital• Efficiency metrics• Headcount analysis• Budget versus actual analysis• Fully loaded income statement analysis
Comprehensive Business
Deliverables
We are committed to working with the executive management team and the existing Directors to forge a path forward.
Our nominees will spend at least two weeks on-site to conduct the evaluation and develop the strategy.
• Forecast for each business line for the remainder of the year, high level forecast for 2016 and 2017
• Return analysis for all capital outflows (expense and capitalized)
• Corporate overhead forecast
• On-site review of all executive personnel
• Interviews with business line leaders and key management by functional group
• Evaluation of organizational chart and reporting structure
• Discussion of near-term goals and longer term goals
• High level evaluations on strengths and weaknesses of key personnel
• Strategy for interim management, and/or a search process, if warranted
Globally Diversified Investment Institution Specializing In Alternative Investment Strategies Page 53
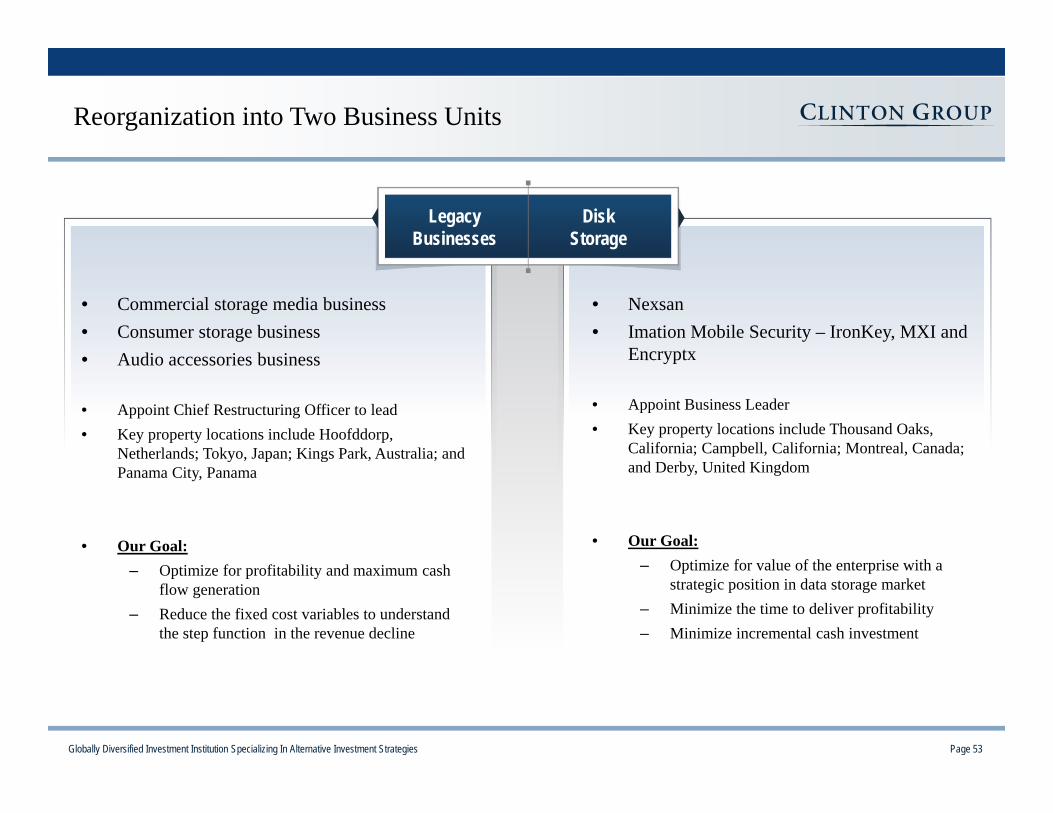
Reorganization into Two Business Units
Legacy Businesses
Disk Storage
• Commercial storage media business• Consumer storage business • Audio accessories business
• Appoint Chief Restructuring Officer to lead• Key property locations include Hoofddorp,
Netherlands; Tokyo, Japan; Kings Park, Australia; and Panama City, Panama
• Our Goal: – Optimize for profitability and maximum cash
flow generation– Reduce the fixed cost variables to understand
the step function in the revenue decline
• Nexsan• Imation Mobile Security – IronKey, MXI and
Encryptx
• Appoint Business Leader• Key property locations include Thousand Oaks,
California; Campbell, California; Montreal, Canada; and Derby, United Kingdom
• Our Goal: – Optimize for value of the enterprise with a
strategic position in data storage market– Minimize the time to deliver profitability– Minimize incremental cash investment
Globally Diversified Investment Institution Specializing In Alternative Investment Strategies Page 54
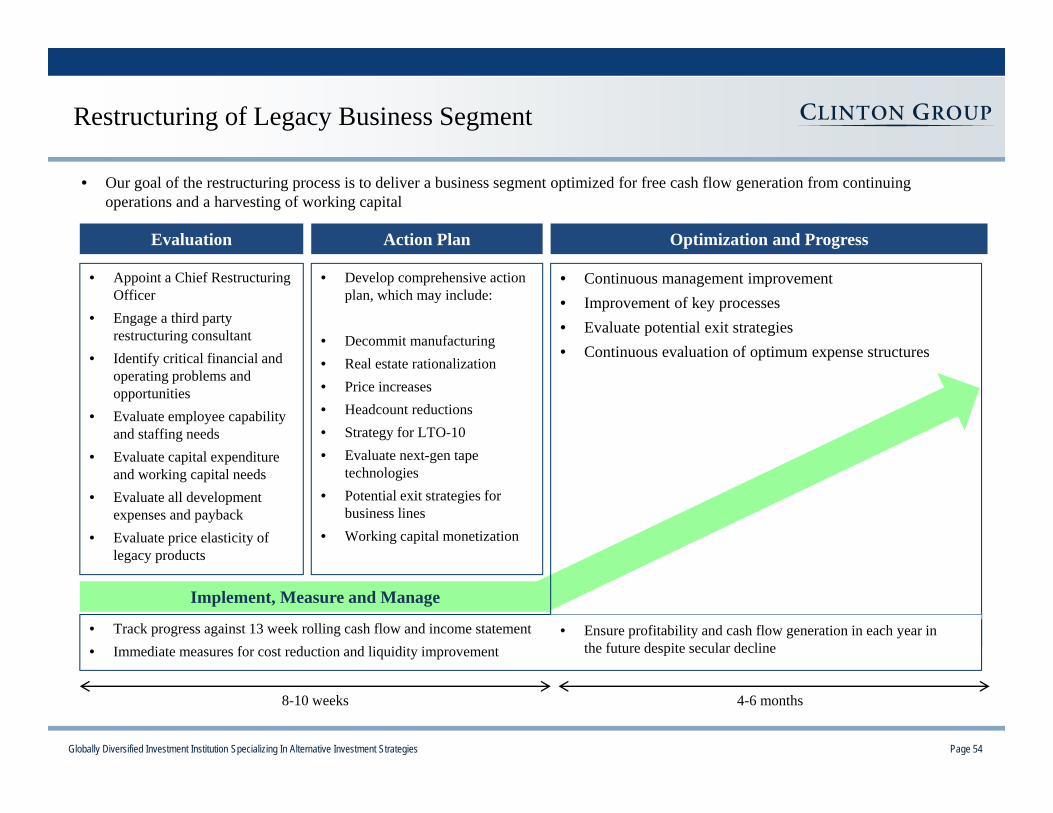
Restructuring of Legacy Business Segment
Evaluation Optimization and Progress
• Appoint a Chief Restructuring Officer
• Engage a third party restructuring consultant
• Identify critical financial and operating problems and opportunities
• Evaluate employee capability and staffing needs
• Evaluate capital expenditure and working capital needs
• Evaluate all development expenses and payback
• Evaluate price elasticity of legacy products
Action Plan
Implement, Measure and Manage
• Develop comprehensive action plan, which may include:
• Decommit manufacturing• Real estate rationalization• Price increases• Headcount reductions• Strategy for LTO-10• Evaluate next-gen tape
technologies• Potential exit strategies for
business lines• Working capital monetization
• Continuous management improvement• Improvement of key processes• Evaluate potential exit strategies• Continuous evaluation of optimum expense structures
• Track progress against 13 week rolling cash flow and income statement• Immediate measures for cost reduction and liquidity improvement
• Ensure profitability and cash flow generation in each year in the future despite secular decline
8-10 weeks 4-6 months
• Our goal of the restructuring process is to deliver a business segment optimized for free cash flow generation from continuing operations and a harvesting of working capital
Globally Diversified Investment Institution Specializing In Alternative Investment Strategies Page 55
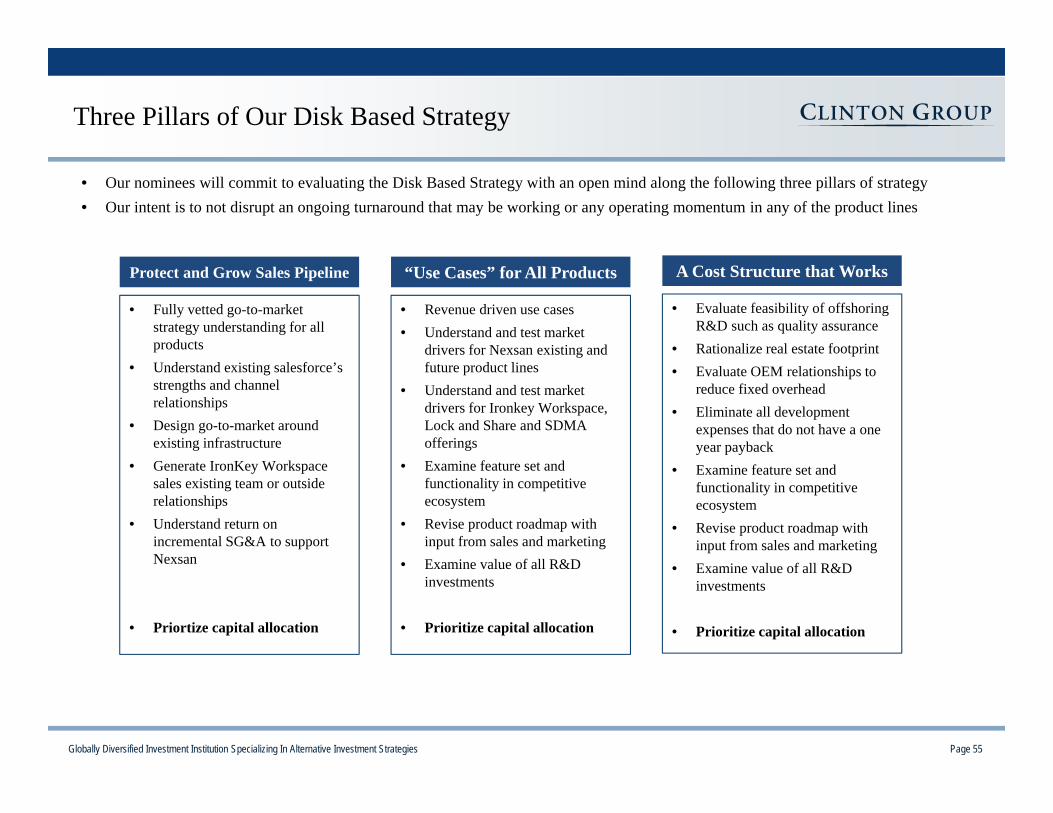
Three Pillars of Our Disk Based Strategy
Protect and Grow Sales Pipeline
• Fully vetted go-to-market strategy understanding for all products
• Understand existing salesforce’s strengths and channel relationships
• Design go-to-market around existing infrastructure
• Generate IronKey Workspace sales existing team or outside relationships
• Understand return on incremental SG&A to support Nexsan
• Priortize capital allocation
• Our nominees will commit to evaluating the Disk Based Strategy with an open mind along the following three pillars of strategy• Our intent is to not disrupt an ongoing turnaround that may be working or any operating momentum in any of the product lines
“Use Cases” for All Products
• Revenue driven use cases• Understand and test market
drivers for Nexsan existing and future product lines
• Understand and test market drivers for Ironkey Workspace, Lock and Share and SDMA offerings
• Examine feature set and functionality in competitive ecosystem
• Revise product roadmap with input from sales and marketing
• Examine value of all R&D investments
• Prioritize capital allocation
A Cost Structure that Works
• Evaluate feasibility of offshoring R&D such as quality assurance
• Rationalize real estate footprint• Evaluate OEM relationships to
reduce fixed overhead• Eliminate all development
expenses that do not have a one year payback
• Examine feature set and functionality in competitive ecosystem
• Revise product roadmap with input from sales and marketing
• Examine value of all R&D investments
• Prioritize capital allocation
Globally Diversified Investment Institution Specializing In Alternative Investment Strategies Page 56
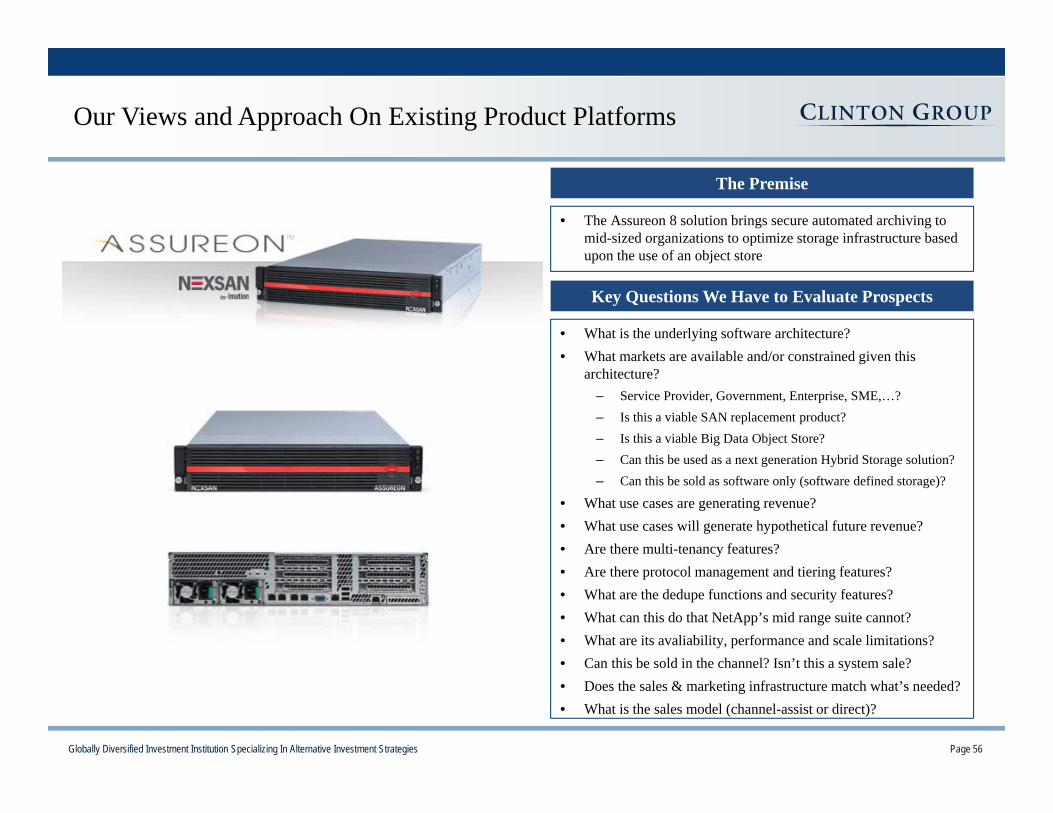
Our Views and Approach On Existing Product Platforms
Key Questions We Have to Evaluate Prospects
• What is the underlying software architecture?• What markets are available and/or constrained given this
architecture? – Service Provider, Government, Enterprise, SME,…?– Is this a viable SAN replacement product?– Is this a viable Big Data Object Store?– Can this be used as a next generation Hybrid Storage solution?– Can this be sold as software only (software defined storage)?
• What use cases are generating revenue?• What use cases will generate hypothetical future revenue?• Are there multi-tenancy features?• Are there protocol management and tiering features?• What are the dedupe functions and security features?• What can this do that NetApp’s mid range suite cannot?• What are its avaliability, performance and scale limitations?• Can this be sold in the channel? Isn’t this a system sale? • Does the sales & marketing infrastructure match what’s needed?• What is the sales model (channel-assist or direct)?
The Premise
• The Assureon 8 solution brings secure automated archiving to mid-sized organizations to optimize storage infrastructure based upon the use of an object store

Globally Diversified Investment Institution Specializing In Alternative Investment Strategies Page 57
Our Views and Approach On Existing/Future Product Platforms
Key Questions We Have to Evaluate Prospects
• Is this a vision or a product?• If it is a product, when will it be complete and available?• What is the underlying software/hardware architecture?• What markets are available and/or constrained given this
architecture (Service Provider, Government, Enterprise, SME,…)?
• What use cases will generate hypothetical future revenue?• Is this a solution sale that requires high touch into the SME?• Is this a channel sale?• What is the sales cycle?• Are we forcing SMEs to pick a remote access device?• How does this compete with other virtualized desktop
infrastructure platforms and server based computing?• Is it limited to just Windows-based O/S?• Does this rely on the expansion of Windows 10?• How does this product platform co-exist with the trend towards
“Bring Your Own Device?”
The Premise
• SDMA proposes a method to manage high-value data files and protect them from tampering, destruction, loss or leakage. SDMA provides policy management for the protection of high value data
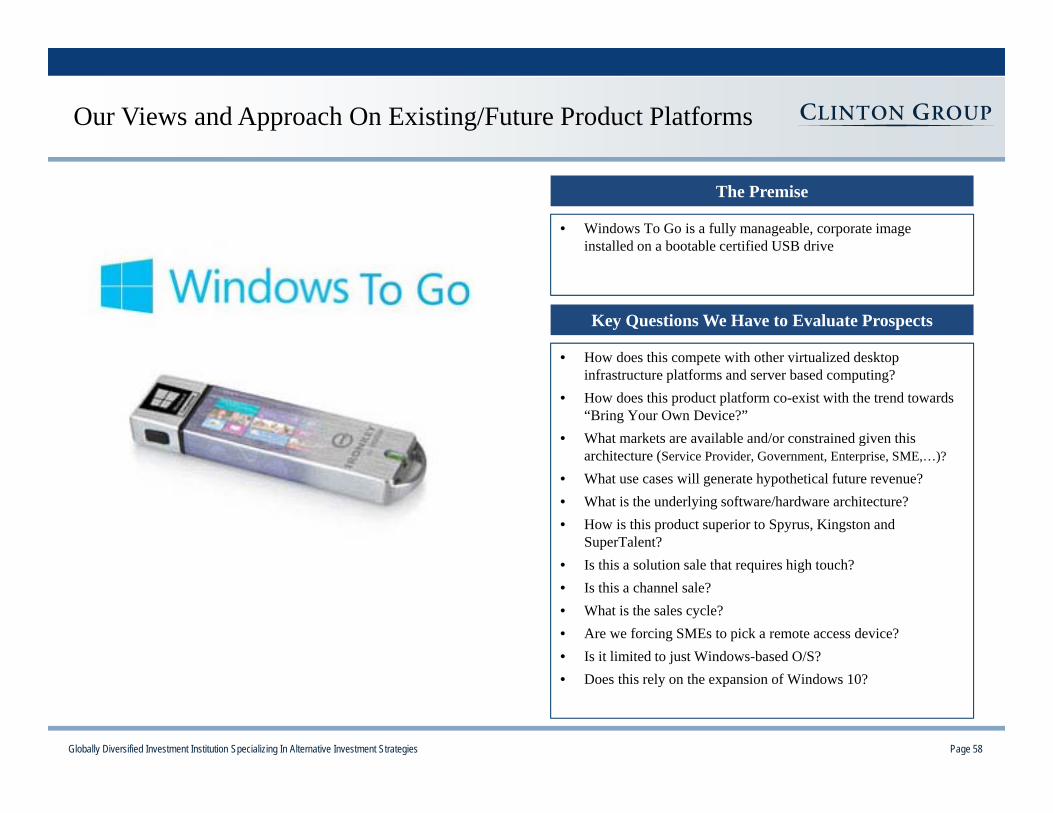
Globally Diversified Investment Institution Specializing In Alternative Investment Strategies Page 58
Our Views and Approach On Existing/Future Product Platforms
Key Questions We Have to Evaluate Prospects
• How does this compete with other virtualized desktop infrastructure platforms and server based computing?
• How does this product platform co-exist with the trend towards “Bring Your Own Device?”
• What markets are available and/or constrained given this architecture (Service Provider, Government, Enterprise, SME,…)?
• What use cases will generate hypothetical future revenue?• What is the underlying software/hardware architecture?• How is this product superior to Spyrus, Kingston and
SuperTalent?• Is this a solution sale that requires high touch?• Is this a channel sale?• What is the sales cycle?• Are we forcing SMEs to pick a remote access device?• Is it limited to just Windows-based O/S?• Does this rely on the expansion of Windows 10?
The Premise
• Windows To Go is a fully manageable, corporate image installed on a bootable certified USB drive

Globally Diversified Investment Institution Specializing In Alternative Investment Strategies Page 59
Corporate Overhead Rationalization
• Evaluating the consolidation of the Company’s satellite locations
• Rationalization of all critical functions within corporate including finance, legal and investor relations
• The sale or sale/leaseback of the Company’s headquarters and relocation within the area to a more moderately sized facility
• Monetization or licensing of the Company’s patent portfolio
• Rationalization of the Company’s real estate footprint that house sales, R&D and administrative functions
• Elimination of all wasteful spending and reduce perquisites
• Re-examine all expense projects and capital expenditure projects with a threshold of a one year payback
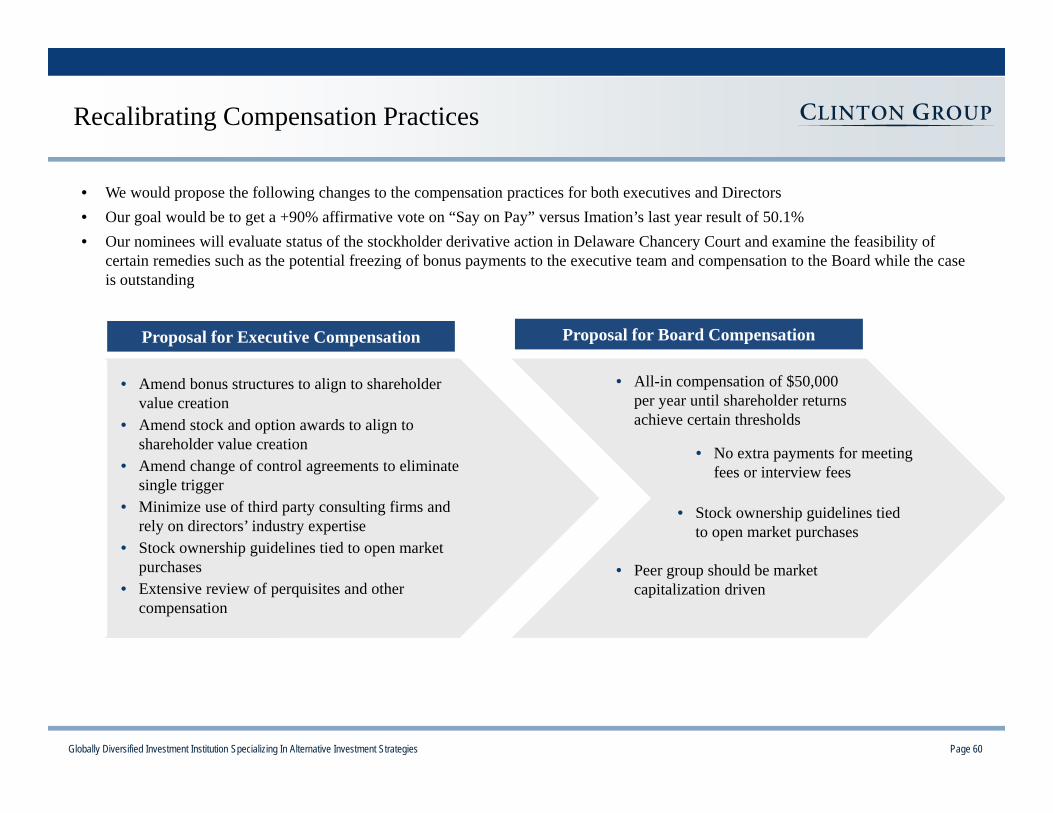
Globally Diversified Investment Institution Specializing In Alternative Investment Strategies Page 60
Recalibrating Compensation Practices
Proposal for Board Compensation
• We would propose the following changes to the compensation practices for both executives and Directors• Our goal would be to get a +90% affirmative vote on “Say on Pay” versus Imation’s last year result of 50.1%• Our nominees will evaluate status of the stockholder derivative action in Delaware Chancery Court and examine the feasibility of
certain remedies such as the potential freezing of bonus payments to the executive team and compensation to the Board while the case is outstanding
Proposal for Executive Compensation
• Amend bonus structures to align to shareholder value creation
• Amend stock and option awards to align to shareholder value creation
• Amend change of control agreements to eliminate single trigger
• Minimize use of third party consulting firms and rely on directors’ industry expertise
• Stock ownership guidelines tied to open market purchases
• Extensive review of perquisites and other compensation
• All-in compensation of $50,000 per year until shareholder returns achieve certain thresholds
• No extra payments for meeting fees or interview fees
• Stock ownership guidelines tied to open market purchases
• Peer group should be market capitalization driven
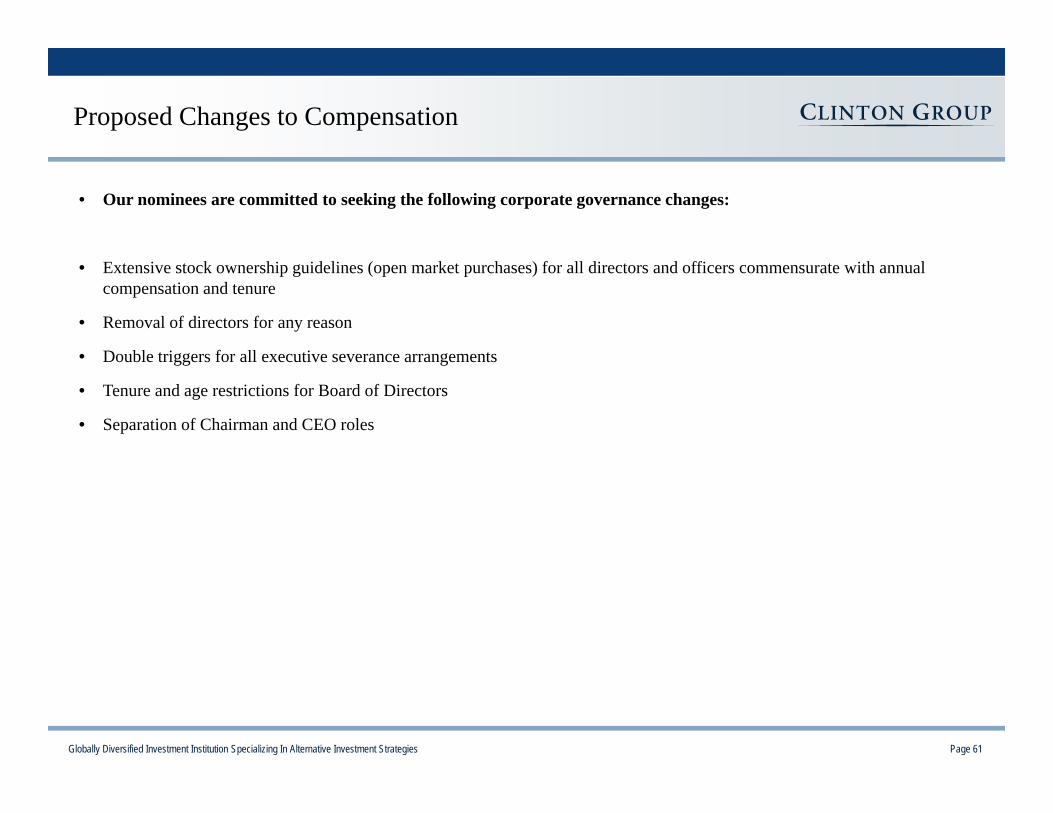
Globally Diversified Investment Institution Specializing In Alternative Investment Strategies Page 61
Proposed Changes to Compensation
• Our nominees are committed to seeking the following corporate governance changes:
• Extensive stock ownership guidelines (open market purchases) for all directors and officers commensurate with annual compensation and tenure
• Removal of directors for any reason
• Double triggers for all executive severance arrangements
• Tenure and age restrictions for Board of Directors
• Separation of Chairman and CEO roles
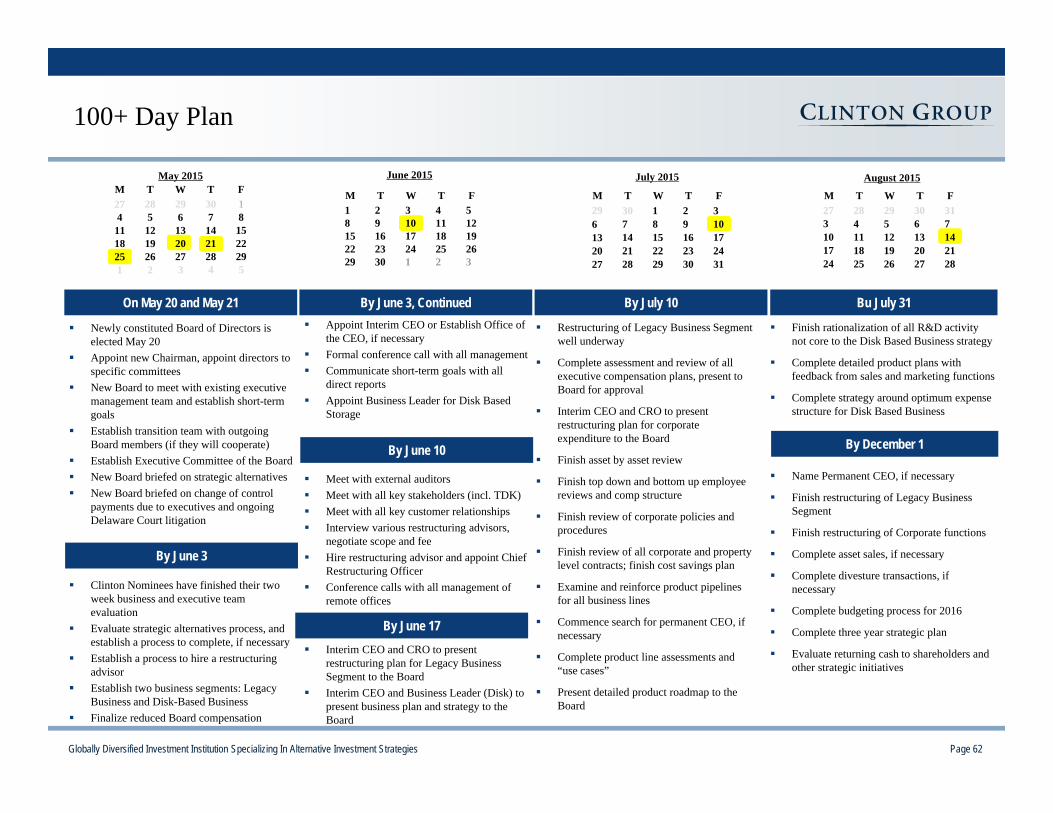
Globally Diversified Investment Institution Specializing In Alternative Investment Strategies Page 62
Appoint Interim CEO or Establish Office of the CEO, if necessary
Formal conference call with all management Communicate short-term goals with all
direct reports Appoint Business Leader for Disk Based
Storage
Meet with external auditors Meet with all key stakeholders (incl. TDK) Meet with all key customer relationships Interview various restructuring advisors,
negotiate scope and fee Hire restructuring advisor and appoint Chief
Restructuring Officer Conference calls with all management of
remote offices
Interim CEO and CRO to present restructuring plan for Legacy Business Segment to the Board
Interim CEO and Business Leader (Disk) to present business plan and strategy to the Board
100+ Day Plan
Newly constituted Board of Directors is elected May 20
Appoint new Chairman, appoint directors to specific committees
New Board to meet with existing executive management team and establish short-term goals
Establish transition team with outgoing Board members (if they will cooperate)
Establish Executive Committee of the Board New Board briefed on strategic alternatives New Board briefed on change of control
payments due to executives and ongoing Delaware Court litigation
Clinton Nominees have finished their two week business and executive team evaluation
Evaluate strategic alternatives process, and establish a process to complete, if necessary
Establish a process to hire a restructuring advisor
Establish two business segments: Legacy Business and Disk-Based Business
Finalize reduced Board compensation
Finish rationalization of all R&D activity not core to the Disk Based Business strategy
Complete detailed product plans with feedback from sales and marketing functions
Complete strategy around optimum expense structure for Disk Based Business
Name Permanent CEO, if necessary
Finish restructuring of Legacy Business Segment
Finish restructuring of Corporate functions
Complete asset sales, if necessary
Complete divesture transactions, if necessary
Complete budgeting process for 2016
Complete three year strategic plan
Evaluate returning cash to shareholders and other strategic initiatives
On May 20 and May 21
Restructuring of Legacy Business Segment well underway
Complete assessment and review of all executive compensation plans, present to Board for approval
Interim CEO and CRO to present restructuring plan for corporate expenditure to the Board
Finish asset by asset review
Finish top down and bottom up employee reviews and comp structure
Finish review of corporate policies and procedures
Finish review of all corporate and property level contracts; finish cost savings plan
Examine and reinforce product pipelines for all business lines
Commence search for permanent CEO, if necessary
Complete product line assessments and “use cases”
Present detailed product roadmap to the Board
By June 3, Continued By July 10 Bu July 31
By June 3
By December 1By June 10
FTWTMMay 2015
302928
129282726252221201918151413121187654127
5432
July 2015
FTWTM
302928272423222120171615141310987632130
31
29
June 2015
FTWTM
3029262524232219181716151211109854321
21 3
August 2015
FTWTM30292827
2827262524212019181714131211107654331
By June 17
Globally Diversified Investment Institution Specializing In Alternative Investment Strategies Page 63
I Executive Summary
II History of Value Destruction at Imation
III Current Compensation Practices
IV The Path Forward
IV Conclusion

Globally Diversified Investment Institution Specializing In Alternative Investment Strategies Page 64
• We have read the Company’s definitive proxy dated April 10, 2015
• The document is in total 77 pages (including annexes), 62% of which contains discussion on executive and director compensation
– Pages 15-20 are devoted to a discussion on director compensation
– Pages 28-71 are devoted to a discussion on executive compensation
• The highlighted portion to the left is the section entitled, “Background to the Board’s Recommendation in Favor of Imation’s Nominees”
– It is the only portion of the document that describes why shareholders should vote to maintain the status quo
The Company’s Proxy – What We Are Asked to Believe
“We believe that each of our three nominees has professional experience in areas that are highly relevant to our strategy and operations and offers valuable leadership skills and diverse insight as we proceed through our strategic transformation.”
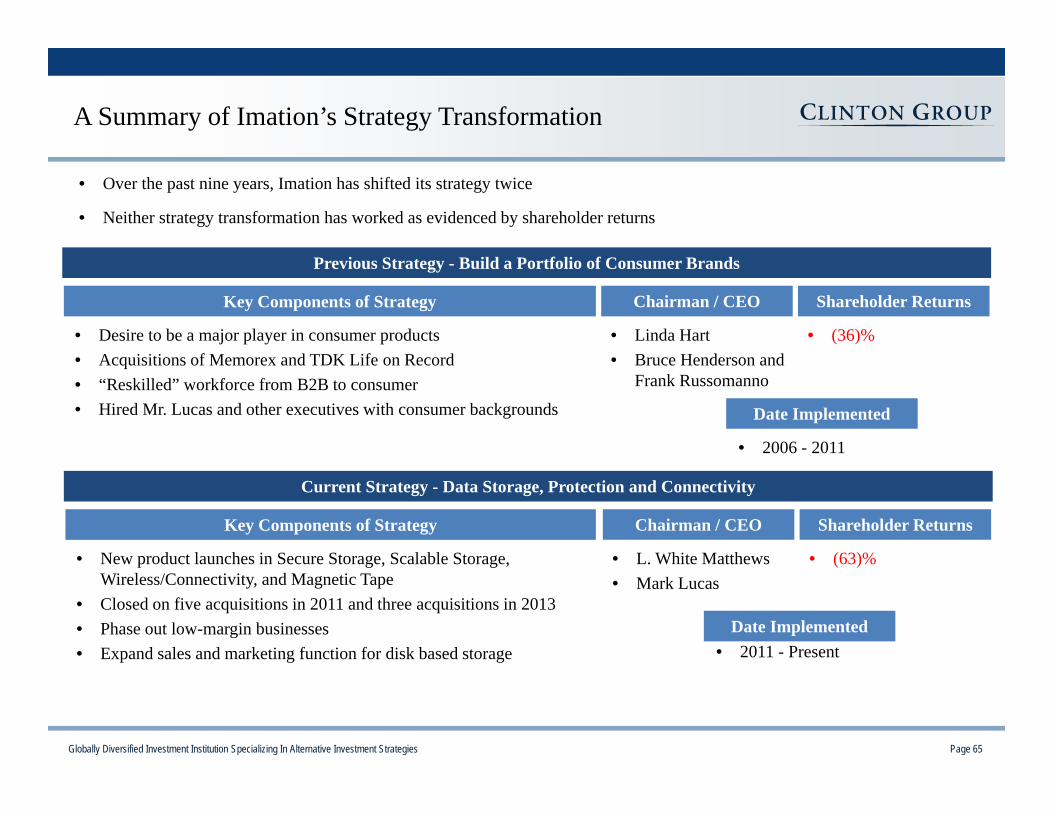
Globally Diversified Investment Institution Specializing In Alternative Investment Strategies Page 65
A Summary of Imation’s Strategy Transformation
• Over the past nine years, Imation has shifted its strategy twice
• Neither strategy transformation has worked as evidenced by shareholder returns
Key Components of Strategy
• Desire to be a major player in consumer products• Acquisitions of Memorex and TDK Life on Record • “Reskilled” workforce from B2B to consumer • Hired Mr. Lucas and other executives with consumer backgrounds Date Implemented
Chairman / CEO Shareholder Returns
• Linda Hart • Bruce Henderson and
Frank Russomanno
• 2006 - 2011
• (36)%
Previous Strategy - Build a Portfolio of Consumer Brands
Key Components of Strategy
• New product launches in Secure Storage, Scalable Storage, Wireless/Connectivity, and Magnetic Tape
• Closed on five acquisitions in 2011 and three acquisitions in 2013 • Phase out low-margin businesses • Expand sales and marketing function for disk based storage
Date Implemented
Chairman / CEO Shareholder Returns
• L. White Matthews • Mark Lucas
• 2011 - Present
• (63)%
Current Strategy - Data Storage, Protection and Connectivity
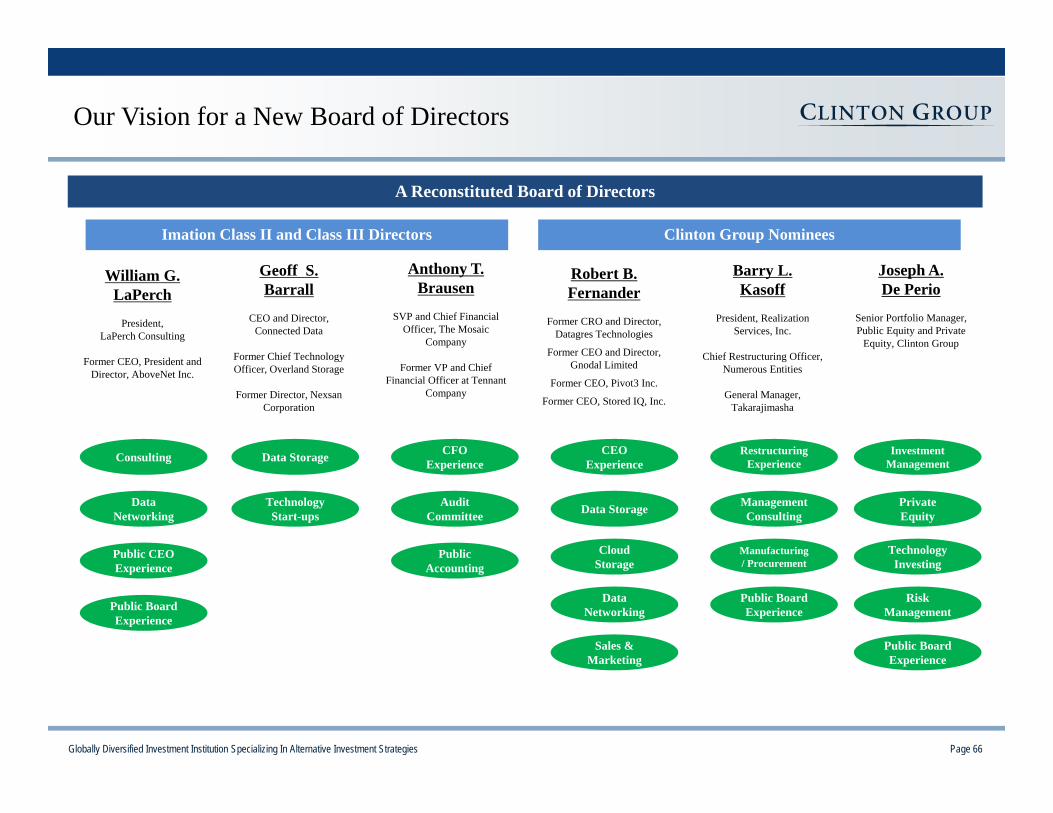
Globally Diversified Investment Institution Specializing In Alternative Investment Strategies Page 66
A Reconstituted Board of Directors
Our Vision for a New Board of Directors
Clinton Group Nominees
William G. LaPerch
President, LaPerch Consulting
Former CEO, President and Director, AboveNet Inc.
Data Networking
Public CEO Experience
Consulting
Public Board Experience
Geoff S. Barrall
CEO and Director, Connected Data
Former Chief Technology Officer, Overland Storage
Former Director, NexsanCorporation
Anthony T. Brausen
SVP and Chief Financial Officer, The Mosaic
Company
Former VP and Chief Financial Officer at Tennant
Company
Robert B. Fernander
Former CRO and Director, Datagres Technologies
Former CEO and Director, Gnodal Limited
Former CEO, Pivot3 Inc.
Former CEO, Stored IQ, Inc.
Barry L. Kasoff
President, Realization Services, Inc.
Chief Restructuring Officer, Numerous Entities
General Manager, Takarajimasha
Joseph A. De Perio
Senior Portfolio Manager, Public Equity and Private
Equity, Clinton Group
Imation Class II and Class III Directors
Technology Start-ups
Data Storage
Audit Committee
Public Accounting
CFO Experience
Data Storage
CEO Experience
Cloud Storage
Data Networking
Sales & Marketing
Management Consulting
Restructuring Experience
Manufacturing / Procurement
Public Board Experience
Private Equity
Investment Management
Technology Investing
Risk Management
Public Board Experience

Globally Diversified Investment Institution Specializing In Alternative Investment Strategies Page 67
• Our nominees plan to continue the ongoing strategic alternatives process without prejudice
Our Nominees will be Fiduciaries to All Shareholders
Strategy Change from Consumer Products to Disk
Based Storage
Aggressively Deploy Capital in Acquisitions
Failure to Integrate Effectively
Existing Paradigm
Company Underperforms on a variety of fronts
Turnaround stalls
Board Faces Proxy Contest
Strategic Alternatives, i.e.
“Sell the Company”
New Paradigm
Short-Term and Medium-Term Plan
Maximize cash flow generation of Legacy Business Segment
Reduce all Discretionary Expenditure and Overhead
Stabilize Trajectory of Disk BasedStorage Business
Medium-Term and Long-Term Plan
Exit or Divest Businesses in Secular DeclinePosition Disk Based Storage Business for SaleRe-Invest Capital to Take Advantage of Net
Operating Losses
Constant Evaluation of All Strategic Alternatives
Continue Sale Process, Examine a Return of Cash to Shareholders
Our nominees are committed to an ongoing evaluation of shareholder value creation.
Globally Diversified Investment Institution Specializing In Alternative Investment Strategies Page 68
• In the boardroom, the Company’s fiduciaries appear to believe they are truly doing what is right for stockholders, but financial results and stock price performance have been dismal
• In the executive suite, the Company’s fiduciaries believe that they are the athletes on the field that can launch the comeback after creating the deficit that the financial scoreboard would indicate
• Both the Board and the executives have been compensated at a level that we believe is inappropriate for the results to date
• Simply put, we believe our nominees, together with continuing Class II and Class II Directors, would constitute a better Board of Directors, and we believe our plans outlined will create a stable enterprise and lasting value to shareholders
• Our nominees are capable, poised and excited about taking on a turnaround at Imation
• We believe new thinking and new people are required to fix old problems
Conclusion
Page 69Globally Diversified Investment Institution Specializing In Alternative Investment Strategies
Contact Information
Clinton Group
601 Lexington Avenue
51st Floor
New York, New York 10022
Joseph A. De Perio, Senior Portfolio Manager
Tel: +1 (212) 825 0400
Okapi Partners
437 Madison Avenue
28th Floor
New York, New York 10022
Bruce Goldfarb, President and CEO
Tel: +1 (212) 297 0720