Enhancing produce and dairy, processed foods such as confectionery, snack foods, coffee and ready...
140
Enhancing the consumer experience. Focusing on leading the industry. Shaping the future. Polyplex Corporation Limited 31 st Annual Report 2015-16
Transcript of Enhancing produce and dairy, processed foods such as confectionery, snack foods, coffee and ready...

Enhancingthe consumer experience.
Focusingon leading the industry.
Shapingthe future.
Polyplex Corporation Limited 31st Annual Report 2015-16
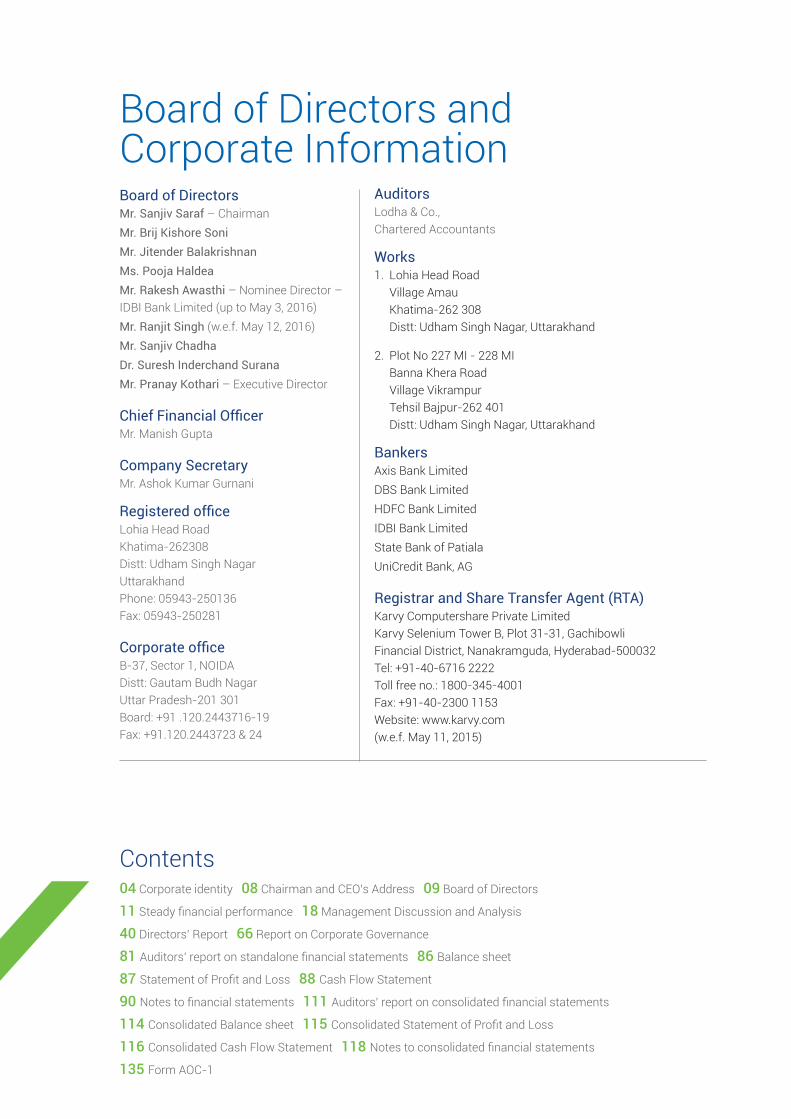
04 08 09
11 18
40 66
81 86
87 88
90 111
114 115
116 118
135
Board of DirectorsMr. Sanjiv Saraf
Mr. Brij Kishore Soni
Mr. Jitender Balakrishnan
Ms. Pooja Haldea
Mr. Rakesh Awasthi
Mr. Ranjit Singh
Mr. Sanjiv Chadha
Dr. Suresh Inderchand Surana
Mr. Pranay Kothari
Company Secretary
Auditors
Works
Bankers
Registrar and Share Transfer Agent (RTA)

For more than three decades, Polyplex Corporation Limited focused on the interplay of three drivers.
The result has been the ability to overcome commodity cycles and enhance value for stakeholders.
Going ahead, we believe that our commitment to these three drivers will enhance business sustainability.
Passion. Discipline. Long-term.

that we use in our everyday life.
The shampoo sachet that you snip The cheese cubes top lid that you peel offThe milk carton that you sipThe tea pack that retains the freshness of your morning cuppa The chips pack from which you snack out of
PolyplexCorporation Ltd.002

non-substitutable substrate for the respective end use.
The credit card that you swipe to buy that prized Pokémon Go character The laptop screen that you see every day The instant photo that you click for a sudden visa requirement
your cherished wedding photograph is printed on
AnnualReport 0032015-16

One of the world’s largest thin
packaging solutions provider. Riding industry volatility and challenges resulting in business sustainability.
Our products
portfolio includes polyethylene
biaxially-oriented polypropylene
of-the-art manufacturing plants in India, Thailand, Turkey and the US, complemented with distribution facilities in China, Turkey and the Netherlands.
The manufacturing plants are equipped with integrated downstream capabilities like metallizing, silicone coating, offline chemical coating and extrusion coating to deliver value-added products.
Our product applications Packaging:
flexible pouches, peel-able seals, lids,
and vacuum insulation panels.
Industrial and specialties: Hot
tapes, plastic cards (including ‘smart’ cards), labels, lamination
(computer screens), solar/ safety
among others.
Electrical: Motor wire and cable,
capacitors, thermal printing tapes, membrane touch switches (computer and calculator keyboards) and flexible
Imaging:
instant photos, business graphics and wide format displays.
Magnetics: Videotape, audio cassette tape and advanced high-density computer storage media.
End markets We supply a wide range of products to the food, beverage, healthcare and other packaging end markets. This
bread, produce and dairy, processed foods such as confectionery, snack foods, coffee and ready meals as well as folding cartons, high value-added resin-based packaging for industrial, hospital, pharmaceutical, home and personal care markets.
Polyplex Corporation Limited
004 PolyplexCorporation Ltd.

Our growth drivers Demand catalyzed by growth in
emerging markets
Manufacturing and quality excellence
Wide global footprint
High customer responsiveness
Focus on product innovation
Strategic locations and marketing platforms
Relatively advantaged cost positions
Extension into specialized packaging and industrial use
2015-16 AnnualReport 005

OUR GLOBAL FOOTPRINT
Polyplex enjoys a global manufacturing
presence across 5 locations in 4 countries.
Polyplex caters to around 1,600 customers
across 86 countries.
These customers are spread across the Indian sub-continent, Europe, Americas, Far East,
Middle East.
1,600Customers around
the world
1,850Global
employee base
Equity stock listing Polyplex is listed both on the National Stock Exchange of India Ltd (NSE) and BSE Ltd (BSE). Besides, Polyplex (Thailand) Plc, a subsidiary of Polyplex Corporation Limited, is listed on The Stock Exchange of Thailand.
006 PolyplexCorporation Ltd.

The Company’s core values are enunciated via the acronym ‘S.C.O.R.E.’ Seamlessness: Leveraging synergies across hierarchies, functions and locations.
Care: Valuing people and remaining committed to their development. Taking a long-term approach when it comes to relationships.
Ownership and responsibility: Honoring commitments made to internal and external stakeholders.
Excellence: Constantly pursuing newer and better ideas, processes, products and practices.
VALUES
Polyplex is promoted by Mr. Sanjiv Saraf, who has over 30 years of rich experience in
group holds 50.03% of the Company’s equity (as on 31 March 2016).
007AnnualReport2015-16

Dear shareholders,Over the last couple of years, the Company has concentrated its efforts and resources on consolidation and
progress has been made on all fronts during the year under review. The
reflect the impact of these actions as
operational and non-cash charges towards foreign exchange fluctuation losses on loans in the overseas subsidiaries as well as a one-time impairment provision and deferred tax
of sustained initiatives towards cost optimization, broadening of product range and customer engagement together with stabilization of new capacities built in the last 3 years will
despite persistently tough market conditions.
Improvement in operational cash flows has resulted in a rapid decline in debt levels and net leverage levels at the year-end are negligible after accounting for the cash reserves. A
flexibility to access any growth opportunities.
Sales and Other Income were flat at INR 32.1 billion with the increase in the sales volume from better utilization of capacities being more than offset by decline in selling prices resulting from steep fall in raw material prices.
items) at the consolidated level is also similar at INR 1.30 billion as compared
to the previous year. There is an exceptional loss of INR 0.66 billion on account of impairment provision on the US operations based on prudent accounting standards.
integrated manufacturing operations, a range of products for the packaging and industrial markets which continue to grow globally, an emphasis on new products development and application and a strong and stable management team are strengths portending a positive outlook for the business. There continues to be excess capacity in most product lines and we have a clear strategy to address this concern.
We recognize apprehensions around environmental impact of plastics. We have set up a recycling plant in Thailand for processing different kinds of plastic waste – with few precedents in the industry. Public concerns are also being addressed by ensuring a balanced approach in evaluating impact of different kinds of packaging materials.
On behalf of the Board, we would like to thank all the shareholders and other stakeholders including business partners and the employees of the Company for their continued support
and hard work.
Pranay Kothari,
Sanjiv Saraf,
Sanjiv Saraf,
Pranay Kothari,
Chairman and CEO’s Address
008 PolyplexCorporation Ltd.

Board of Directors
Mr. Sanjiv Saraf Mr. Pranay Kothari Mr. Sanjiv Chadha
Mr. Jitender Balakrishnan
Mr. Ranjit Singh
Dr. Suresh Inderchand Surana Mr. Brij Kishore Soni
Ms. Pooja Haldea
009AnnualReport2015-16

010 PolyplexCorporation Ltd.

impacted by volatile commodity raw material (crude) prices on the one hand and a highly competitive industry landscape
reported a 5% CAGR in topline over the period, reflecting our consistent ability to hold on to our customer relationships and even grow our customer base while expanding business from existing clients.
2011-12 2,48,063
2,59,827
3,20,930
3,32,207
3,21,377
2013-14
2012-13
2014-15
2015-16
Revenues (D in lacs)
2011-12 9
3
(2)
3
1
2013-14
2012-13
2014-15
2015-16
ROE (%)
2011-12 -
0.25
0.40
0.21
0.05
2013-14
2012-13
2014-15
2015-16
Debt-equity ratio (times)
2011-12 19
10
4
12
12
2013-14
2012-13
2014-15
2015-16
EBIDTA margin (%)
2011-12 1,62,933
2,66,553
3,14,689
2,57,260
2,40,556
2013-14
2012-13
2014-15
2015-16
(D in lacs)
2011-12 29.38
6.64
(2.14)
11.86
9.08
2013-14
2012-13
2014-15
2015-16
Earnings per share (D)
Notes:1. Revenues = Total Revenue including other income2. EBITDA Margin as % of Sales & Other Income3. ROE (%) = PAT (Pre -Minority interest) as % to average equity incl. Minorities4. Net Fixed Assets includes Capital Work in Progress5. Net Debt includes Long Term Debt + Short Term Debt + Current Portion of Long Term Debt – Cash & Bank Balances6. Equity includes Shareholders’ Funds + Minority Interest
011AnnualReport2015-16

012 PolyplexCorporation Ltd.

Enhancingthe consumer experience.
AT POLYPLEX, WE PROVIDE OUR INTERMEDIARIES, CUSTOMERS AND THEIR CONSUMERS INNOVATIVE SOLUTIONS ADDRESSING THEIR EVERYDAY NEEDS.
What makes us different is the passion that we bring
customers better through enhanced solutions.
Polyplex is focused on product innovation to address growing customer demands and cost-effectiveness from brand owners seeking to enhance product performance, enhance sales and reduce costs.
With a view to remain proactive, we work collaboratively and proactively with our customers. Today, our customers comprise some of the world’s largest and most respected packaging conglomerates and leaders in several industrial end-use markets.
Some of the popular, everyday consumer goods that our global-class packaging keeps safe, fresh, hygienic and cost-effective include milk, tea, coffee, potato chips, butter cubes, shampoo, toothpaste, cookies etc. Most of our products are ‘food safe’,
23%2015-16 revenues
derived from top 10 customers
013AnnualReport2015-16
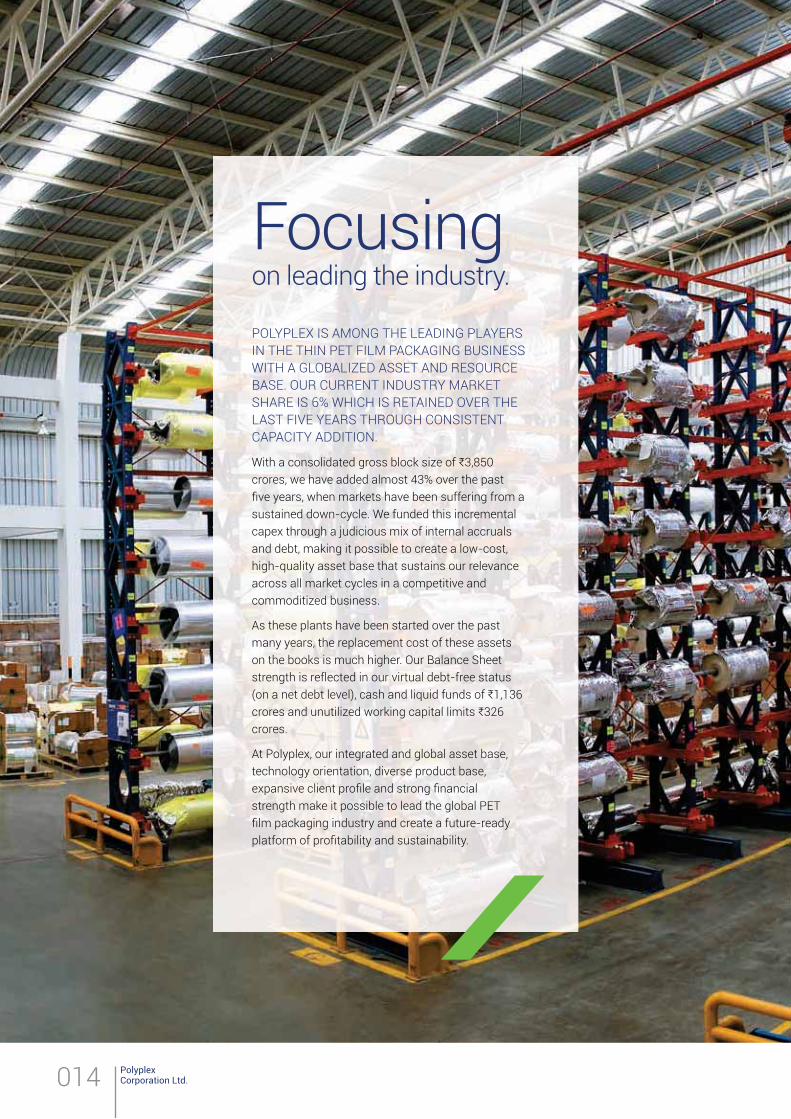
Focusingon leading the industry.
POLYPLEX IS AMONG THE LEADING PLAYERS IN THE THIN PET FILM PACKAGING BUSINESS WITH A GLOBALIZED ASSET AND RESOURCE BASE. OUR CURRENT INDUSTRY MARKET SHARE IS 6% WHICH IS RETAINED OVER THE LAST FIVE YEARS THROUGH CONSISTENT CAPACITY ADDITION.
With a consolidated gross block size of C3,850 crores, we have added almost 43% over the past
sustained down-cycle. We funded this incremental capex through a judicious mix of internal accruals and debt, making it possible to create a low-cost, high-quality asset base that sustains our relevance across all market cycles in a competitive and commoditized business.
As these plants have been started over the past many years, the replacement cost of these assets on the books is much higher. Our Balance Sheet strength is reflected in our virtual debt-free status (on a net debt level), cash and liquid funds of C1,136 crores and unutilized working capital limits C326 crores.
At Polyplex, our integrated and global asset base, technology orientation, diverse product base,
strength make it possible to lead the global PET
014 PolyplexCorporation Ltd.

015AnnualReport2015-16
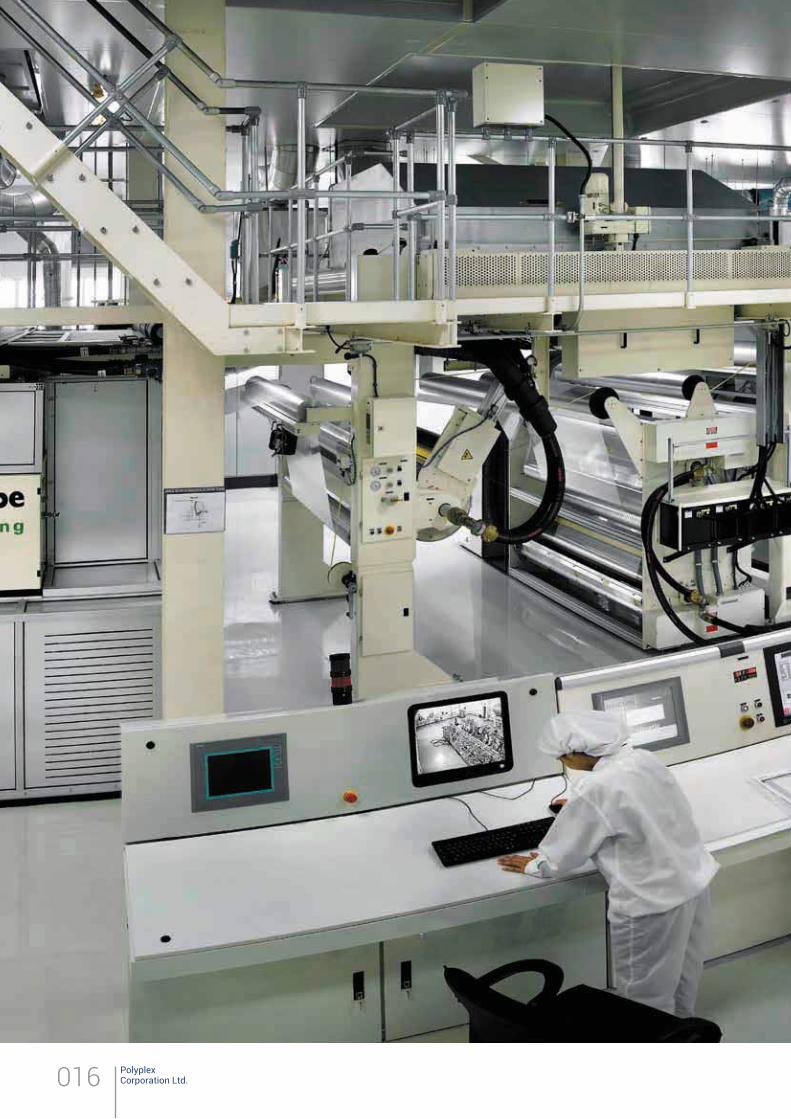
016 PolyplexCorporation Ltd.

Shapingthe future.
Our vision starts and ends with the customer. In a typical lifecycle engagement process with a customer,
philosophy which enhances contract and business sustainability.
Even as we are domiciled in India, we have commissioned facilities and distribution points the world over
business. We pioneered globalization
line in Thailand, a strategic growth market. Thereafter, we deployed our steady cash flows generated out of the business to set up modern plants across other key regional markets that enabled us to move closer to customers, effectively service their demand and stay close to their innovation cycles.
This ‘on-shoring’ model has emerged as a global quality asset base
one PP (polypropylene) line comprising a range of products manufactured across thickness and sizes. Besides, a truly globalized presence enables
us to draw best practices, leverage a common pool of intellectual capital and serve a wider number of global customer locations through our large asset base spread across continents. This large geographic presence helps mitigate geographic/ location risks in terms of demand and customer retention.
While a large number of industry players continued to focus on the commodity end of the business, we extended to value-added products to remain ahead of the competitive curve and generate value-added margins.
In line with this objective, we incorporated metallizing, offline coating and silicone coating capacities to create technology-driven differentiation while addressing
Saraprint, an innovative non-tearable
designed especially for the digital print media segment, proved to be industry-leading and poised to transform the photographic surface industry on account of its detailed attention to detail, durability, longevity and high-gloss.
AT POLYPLEX, OUR BUSINESS IS WIRED AROUND CUSTOMER RESPONSIVENESS AND EXPANDING OUR PRODUCT RANGE. WE COLLABORATE CLOSELY WITH OUR CUSTOMERS TO DESIGN AND DEVELOP PACKAGING PRODUCTS THAT PROVIDE PROFITABILITY-ENHANCING SOLUTIONS.
017AnnualReport2015-16

Management Discussion and Analysis
Corporate overview In this document, the terms ‘Company’, ‘Polyplex’ and ‘Group’ refer to the consolidated operations of Polyplex Corporation Ltd.
Polyplex is one of the leading global integrated producers of thin polyester
part of our everyday lives – when we
we shop, among others. The largest
flexible packaging. Better packaging not only improves the shelf lives of products but also enhances product
appeal in a competitive consumer goods industry.
Polyplex also offers other substrates (BOPP, CPP and Blown PP/PE) used in the flexible packaging industry.
used in packaging besides certain industrial applications like tapes, labels and thermal laminations. Flexible packaging companies supply laminates to consumer product companies for packaging food products, household goods, personal care products, among others.
Corporation Ltd.Polyplex018

Company entered into the manufacture
of industrial applications including imaging and graphics, photovoltaics and flat panel displays.
In the past few years, the Company ventured into downstream businesses like metallising, silicone coating, extrusion coating and offline chemical coating. This has enabled Polyplex to offer products for a variety of applications – general packaging,
specialty packaging, electrical, liners,
applications like hot stamping foils, flexible air conditioning ducts, book laminations, yarns, among others. The blown PP line in Thailand has expanded the product line of
also introduced an innovative non-
designed especially for digital print media segment for photo albums, commercial printing, promotional and customised digital printing, label and
flexible packaging applications.
The Company’s other ventures comprised a recycling unit in Thailand to provide sustainable solutions for
(chips), which in turn is produced
and MEG (mono ethylene glycol). The Company produces its own PET resin.
The value chain for the Company’s main businesses is depicted below:
NATURAL RESOURCES
Natural gas
Coatings
Metallising applications
PP resin
INDUSTRIAL BUYERS AND CONVERTERS
Film grade PET resin
Oil
BASIC PETROCHEMICALS
Polyplex’s area of operations
RAW MATERIALS
END PRODUCTS
PLASTICS AND INTERMEDIATE
PRODUCTS
Ethylene
Paraxylene
PTA
Polypropylene
MEG
019AnnualReport2015-16

Polyplex had predominantly operated
accounts for three-fourths of the
growth in flexible packaging has gradually shifted the production and
Company’s relevant segments of packaging, industrial and electrical
demand. The high-end segments like magnetic and media printing and imaging segments constitute less than 1% of the total consumption of thin
This has enabled Polyplex to straddle the entire spectrum of end-users by
accessing the traditional industrial and
The Company is also targeting several new and promising applications in optical and photovoltaic segments.
revamped in December 2011 to produce intermediate thicknesses as
to the Company growth.
Global operations Polyplex has attained leadership
manufacturing and distribution operations in six countries (India, Thailand, Turkey, the US, China and the Netherlands), along with warehouses in Poland, Spain, Germany, Italy and Mexico.
Polyplex has attained leadership in the thin
manufacturing and distribution operations in six countries
POLYPLEX GROUP- STRUCTURE (As on 01st August 2016)
Polyplex Corporation Limited (PCL / Polyplex India) INDIA
Polyplex (Asia) Pte. Ltd(PAPL / Polyplex Asia) SINGAPORE
Peninsula Beverages & Foods Company Private Ltd.(PBF) INDIA
Polyplex (Thailand) Public Co. Ltd.(PTL / Polyplex Thailand) THAILAND
EcoBlue Ltd THAILAND
Private Investor
100%
100%
100%
100%
100%
100%
100%
100%
100%
36.89% 17.19%
45.92%
66.50%33.50%
Polyplex (Singapore) Pte. Ltd. (PSPL / Polyplex Singapore)
SINGAPORE
Public/ Institutional Shareholder
Polyplex America Holdings Inc. (PAH) USA
Polyplex USA LLC(PU / Polyplex USA) USA
Investment and trading and distribution
Provision of shared services
Outside interest
Investment company
Manufacturing company
Trading and distribution
FMCG
Polyplex Trading (Shenzhen) Co. Ltd. (PTSL / Polyplex China)
CHINA
Polyplex Europe B.V. (PEBV / Polyplex Netherlands)
THE NETHERLANDS
Polyplex Europa Polyester Film Sanayi ve Ticaret Anonim Sirketi
(PE / Polyplex Europa) TURKEY
Polyplex� Paketleme Çözümleri Sanayi ve Ticaret Anonim Şirketi
(PP / Polyplex Turkey) TURKEY
PAR LLC (PAR) USA
020 PolyplexCorporation Ltd.

Polyplex (Asia) Pte. Ltd. (PAPL)PAPL was established as a 100%-subsidiary of PCL in July 2004. The shareholding of PAPL in PTL stands at 36.89% as of 30th June 2016 post the rights issue. PAPL is alia engaged in trading various plastic products. The issued and paid-up capital of PAPL as of March 31, 2016 is USD 1.13 million.
Peninsula Beverages & Foods Company Private Ltd. (PBF)PAPL acquired 99.90% shares in PBF in February 2013. In May 2013, PBF, which is in the business of trading packaged beverages and food products, became a wholly-owned subsidiary of PAPL. The issued and paid-up capital of PBF as of March 31, 2016 was C987.44 lacs.
PAR LLC (PAR)PAR LLC is an US-based limited liability company incorporated in Texas in May 2011. The Company is 100%-owned by PAPL. The Company was set up for providing shared services. The issued and paid-up capital of PAR LLC as of March 31, 2016 was USD 2.2 million.
Polyplex (Thailand) Public Co. Ltd. (PTL)PTL was incorporated as a private company in March 2002 to
In August 2004, the Company became a public company and subsequently listed on the Stock Exchange of Thailand (SET) in December 2004.
In June 2016, PTL increased its share capital through a rights offering of 100 million ordinary shares in the ratio of one new share for every eight existing shares, at an issue price of THB 6.40 per share. As a result, PCL’s stake in the Company increased from 51% to 54.08% through direct and indirect shareholding and the balance 45.92% is held by the general public. The
issued and paid up capital of PTL as of March 31, 2016 was THB 800 million which subsequently increased to THB 900 million in June 2016.
Polyplex (Singapore) Pte. Ltd. (PSPL)PSPL was established in July 2004 as a wholly-owned subsidiary of PTL, which invested in Polyplex Europa Polyester Film Sanayi Ve Ticaret
paid-up capital of PSPL (including preference share capital) as of March 31, 2016 was 9.14 million euros.
Polyplex Europa Polyester Film
(PE)PSPL incorporated a 100% owned subsidiary Company, PE in Turkey
and other proximate markets. The commercial operations started in December 2005 with the start-up of
and paid-up capital of PE, including additional contribution from PSPL as of March 31, 2016, was 8.83 million euros.
Polyplex Trading (Shenzhen) Co. Ltd (PTSL)In September 2009, PTL invested in setting up a wholly-owned trading company in Shenzhen, China, through PSPL. The decision to invest in the setting up a trading company in China was a strategic initiative to establish the Company’s presence in China, which is one of the largest and the fastest-growing market in this industry. The issued and paid-up capital of PTSL as at March 31, 2016 was USD 0.4 million.
Polyplex America Holdings Inc (PAH)In August 2011, PTL invested in setting up a 100%-investment and trading & distribution company in the US named
PAH. PAH further invested in Polyplex (USA) LLC, the manufacturing/distribution entity. The issued and paid-up capital of PAH (including the additional paid-in capital) as on March 31, 2016 was USD 36.62 million.
Polyplex USA LLC (PU)Polyplex USA LLC was established in July 2011 as a 100% subsidiary of PAH. PU was incorporated to expand the global manufacturing footprint into North America by setting up a thin PET
chips plant and metallising capacity. The members’ contribution, which represents the paid-up capital of PU, was USD 29.5 million as on March 31, 2016.
EcoBlue Ltd. (EL)EcoBlue Ltd. was established as a subsidiary of PTL in October 2012 in Thailand to provide end-of-life
waste. As of 1st July 2016, PTL held 66.5% in EcoBlue Ltd. The paid-up capital of EcoBlue Ltd as at March 31, 2016 was THB 10.65 million.
Polyplex Europe B.V. (PEBV)PEBV was established in the Netherlands in April 2013 as a 100% owned distribution subsidiary of PTL to service EU customers. The paid up capital of PEBV as at March 31, 2016 was 0.2 million euros.
Polyplex Paketleme Çözümleri
(PP)In September 2013, PE established a Company in Turkey, named Polyplex Paketleme Çözümleri Sanayi ve Ticaret
its share capital for trading PET Film, PET chips and other products. The registered and fully paid up share capital of this Company was 100,000 Turkish liras as of March 31, 2016.
021AnnualReport2015-16

Production capacitiesManufacturing capacities across various locations: The traditional segmentation of PET
based on distinct applications and lack of supply side substitutability.
with a thickness range of 50-350
50 microns are characterised as
intermediate thickness (23-150 microns) lines have also been
seen various structural changes over the years, with Asian countries now dominating production and consumption.
The largest application of thin PET
accounts for 74% of the total thin
plays a key role in source reduction based on the principle of ‘use-
place’. This resulted in higher-than-GDP growth in the global flexible
a preferred high-end substrate
Polyplex Group capacity
PET-Thin
Blown PP
Basefilm
PETfilm
resin
India Thailand
METfilm
Coatedfilm
Basefilm
PETfilm
resin
METfilm
Coatedfilm
Turkey US
Basefilm
PETfilm
resin
METfilm
Coatedfilm
Basefilm
PETfilm
resin
METfilm
PET-Thick
PET film resin
BOPP
Metalliser
CPP
Coated films
1,0002,25,000MT Mn Sqm
55,00042,000
80,50058,000
31,000
77,60057,600 57,600
28,50021,700 17,700 8,700
28,800
10,0004,645
270
865
146
35,000
1,50,000
75,000
-
900
800
700
600
500
400
300
200
100
Polyplex Group capacity – segment-wise
Metallisedfilm
PET filmresin
Coatedfilm
Mn Sqm
Metric tonnes
Basefilm
PET-Thin PET-Thick BOPP CPP Blown PP PET film resin Metallised film Coated film
200 400 600 800 1,000 1,200 1,400-
50,000 1,00,000 1,50,000 2,00,000 2,50,000 3,00,000-
1,281 Mn Sqm
76,600
2,64,445 1,86,000
2,73,300
28,800 35,000
10,0004,645
022 PolyplexCorporation Ltd.

within the packaging segments, has grown more rapidly than other substrates, averaging around 7-9% per annum. Packaging demand is resilient as it is driven by the consumption of food products and consumer staples, which are non-discretionary in consumption. This packaging segment characteristic has resulted in steady demand growth, despite the prevailing economic slowdown.
An increase in purchasing power in developing countries was accompanied by a rise in per capita packaging material consumption. The key demand growth drivers in these regions comprised an increase in organised sector share in retailing, increasing consumerism, population growth and lifestyle changes arising out of higher disposable incomes, need for brand differentiation, environmental awareness, continuous product innovation, health awareness, favorable demographics and a need for convenient packaging. However, when compared with mature markets, per capita packaging material consumption in the developing countries is still low.
Asia is the largest market for thin
than three quarters of global consumption. Within Asia, India and China are the largest consumers.
A similar trend is also evident on the supply-side with most new capacities being added in low-cost developing countries. A large proportion of the new capacity is focused on the packaging segment, with an emphasis on productivity and cost management. This impacted traditional large
with high cost structures, who chose to concentrate on niche
solar panels, touch screens and
within packaging. While trade defense measures like anti-dumping and countervailing duties were invoked in the past, they were unable to address the problems
oversupply due to excessive
capacity creation following
exceptionally high margins. The
overhang is expected to continue.
expected at about 7-8% for the next
other Asian countries is growing at
9-10%. Companies with consistent
portfolio, access to international
customers, focus on cost
optimization and stronger supply
chains stand a better chance of
participating in market growth and
strengthening margins above the
industry average.
The global capacity utilisation for
Between 2006 and 2012, global
average capacity utilisation of
the range of 80-90% of rated or
nameplate capacity. Since the year
2013 utilisation rates had declined
sharply and reached to the level
of 67-68% due to excess capacity
build-up in the industry, which is
expected to gradually improve
over the next 2-3 years. The levels
of 80-90% are considered close
to full capacity. In practice, some
producers produce lower than the
nameplate capacity due to the long
use and hence the poor condition
of machinery while some produce
with capacity utilisations even
higher than 100% of the nameplate
capacity using new and modern
machinery and based on their long-
time expertise and experience.
by end users
2015 - 3,217 KMT
Other industrial Electrical
Magnetic media and imaging
2010 - 2,166 KMT
17%
20%8%
6%1%
74%
73%
1%
2015 - 3,217 KMT
2010 - 2,166 KMT
10%
9%3%3%
10%12%
16%
13%
60%64%
Other Asian countries India
RoW Europe Americas
2015 - 4,734 KMT
Other Asian countries India
RoW Europe Americas
12%8%4%
11%5%9%
10%11%
67%
63%
2010 - 2,365 KMT
023AnnualReport2015-16

5,000
4,500
4,000
3,500
3,000
2,500
2,000
1,500
1,000
500
–
KMT
90%
95%
81%
86%89%
87%
92%
88%
83%
2006 2007 2008 2009 2010 2011 2012 2013 2014 2015
85%
80%
75%
70%
65%
60%
55%
50%
75%
67% 68%
Demand Capacity Capacity utilisation
is concentrated in Central and Eastern Asia, which accounts for around 75% of the global consumption. Electrical and industrial are the key end-use
industry. The demand of thick
about 6 to 7% over the past ten years. Global growth has been apparent in all end-user sectors with the exception of medical/other (x-ray) applications. Over the past few years, China emerged as the largest market for thick PET
Innovative applications in like flat screen panels and photovoltaic panels among others are helping the industry grow at a CAGR of about 5% over the medium-term.
has been in China, South Korea and Japan. Producers in Europe and the US constitute around 23% of global capacity.
2015 - 883 KMT
2010 - 713 KMT
12%
11%
16%4%
4%
0%
0%
14%
73%
66%
India
RoW
Europe Americas
Other Asian countries India
RoW
Europe Americas
Other Asian countries
2015 - 1,624 KMT5%
11%
22%
11%
76%
61%
5%
2%
3%
4%
2010 - 820 KMT
Magnetic Media & Imaging
Other Industries
Electrical
2010 - 713 KMT
8%
11%
12%
14%
22%8%
58%
2015 - 883 KMT
67%
024 PolyplexCorporation Ltd.

Demand Capacity Capacity utilisation
2,000.00 90%
75%77%
79%
83%
87%86%
76%
2006 2007 2008 2009 2010 2011 2012 2013 2014 2015
85%
80%
75%
70%
65%
60%
55%
50%
1,500.00
1,000.00
500.00
–
64%
57%
54%
KMT
Till 2011, global average demand increased at a CAGR of 8% whereas capacity increased at a CAGR of 5%, strengthening
demand increased only at 4-5%, resulting in excess supply.
for green energy and decreasing cost of PV module. The Company supplies to all major PV back sheet manufacturers and has initiated trials in the optical segment.
Population growth Urbanisation Improved quality of life
Increasing environmental awareness Increasing consumerism
025AnnualReport2015-16

Population growth: According to a UN report, global population (currently 7.4 billion) is expected to reach 8.5 billion by 2030, 9.7 billion in 2050 and 11.2 billion in 2100.
Urbanisation: Urban population will continue to rise at nearly twice the pace of total population growth between 2012 and 2030, accounting for 60% of the world’s population by 2030.
Improved quality of life: With improving life quality, consumers are expected to move towards packaged product consumption. The projected growth for 2030 tells world per capita GDP growing to around $14,000 from $10,000 in 2016.
Increasing environmental awareness: Owing to increasing global
will gain popularity owing to their lower environmental impact (recyclable, emitting lower amounts of green house gases and lightweightedness).
Increasing consumerism: The income growth has led to an increase in global consumer spends, boosting the PET
Indian flexible packaging market India is one of the world’s biggest and fastest-growing flexible packaging
size in India was estimated at around 310,000 tonnes for FY 2015-16. During FY 2016-17, growth of 10-11% is expected, with similar growth in the flexible packaging industry. The total
about 560,000 tonnes per annum with some of the surplus being exported. The Indian BOPP market is estimated at about 290,000 tonnes per annum with a capacity of 610,000 tonnes. Demand is expected to grow at around 10-11% annually.
by markets and areas of the world that historically were considered ‘developing nations’. Similar dynamics were also seen in the CPP business.
Growth in Asia (China and India) has been strong and expected to continue. These businesses are regional in nature and regional demand-supply balances been relevant. The long-term fundamentals of these investments continue to be good.
Silicone coating and extrusion coating businesses The silicone coating business produces release liner, which is used for carrying adhesive labels until these are removed from the release liner
Applications of siliconised polyester release liners include release liners for adhesive tapes, cast polymer materials for electronic applications,
Company had expanded its capacity by commissioning a second coating plant in Thailand in March 2012.
PTL has also commissioned a blown PP/PE line in October 2013. This new product enabled better use of the silicone coating facility with a broadening of the product range (including the ‘peel and stick’ liner
North America and Europe).
The extrusion coating business involves a combination of PET/BOPP
surface of another item (like paper) to improve durability and aesthetics. The principal uses comprise teaching
cards, book covers, cartons, reflective insulation and food packaging. PTL added a second extrusion coating line at the existing facility in Thailand (started commercial production in June 2013).
The US and the EU are the principal markets for the products from these businesses even as growth rates are expected to be higher in Asia.
Offline coating business With the objective of strengthening the product portfolio, the Company
in March 2014 and September 2014, respectively. Following the enhanced capability of value-added products, the Company widened its product portfolio into following segments:
CAGR +15%
Cumulative capacities
662654647637
474461443
290249242
184
2006 2007 2008 2009 2010 2011 2012 2013 2014 2015 2016
700
600
500
400
300
200
100
0
Resins Coating
’000 MT
026 PolyplexCorporation Ltd.

These products have various applications in food packaging, lidding, textile and industrial sectors. These products helped the Company enhance margins and reduce
StrategyPolyplex seeks to maximise long-term returns following a differentiated approach that responds proactively to business and environmental changes. The key elements of this strategy are as comprised:
Manufacturing or distribution presence in key regional markets (India, Thailand, Turkey and the US) and distribution operations in two countries (China and the Netherlands). The warehouses in Poland, Spain, Germany, Mexico and Italy and representative
have strengthened global delivery capabilities.
establish itself as a complete packaging substrate provider. The commissioning of a CPP line, thick
Thailand and BOPP line in India were decisive steps in this direction.
The Company accelerated investments in niche downstream products to exploit synergies, broadbase the portfolio and provide a scalable platform. The setting up of extrusion coating lines in Thailand, silicone coating lines in India and Thailand, offline coaters in Turkey and India and sheeting facility in India for the digital print media segment comprised downstream investments.
The manufacturing facilities were integrated around high productivity assets to enhance competitiveness.
Continuous improvements (productivity and cost optimisation)
were made through the use of rice husk boiler for heating instead of expensive furnace oil, packing and
casting, quality improvements and waste reduction, standardisation of business processes, among others.
Systems were created and strengthened to enhance cross-learning and sharing best practices/benchmarking across various units and business of the Group to enhance
Technical services and new products were developed by leveraging in-house R&D capabilities.
A liquid and strong Balance Sheet enhanced flexibility to address growth opportunities.
A plant in Thailand for recycling in-house and sourced plastic waste addressing growing concerns and directional need for the PET business.
The results of this strategy resulted in successful growth – CAGR of 15% in terms of capacity between 2006 and 2016.
Business process excellence (BPE)To enhance our competitive advantage and differentiation, the Company invested in business process improvement and excellence. The objective of BPE is to:
1. Establish and standardise business processes
2. Identify and execute improvement initiatives aimed at generating saving and/or delivering value to business partners (vendors and customers)
3. Leverage process and technology expertise with the objective to deploy across all locations
The BPE (business process excellence) team, formed two years back has undertaken several Group-level initiatives for optimising costs in the areas of freight, packaging and inventory management, electrical and thermal energy consumption and indigenisation of spares.
Region-wise breakup of sales
25%
24%24%
20%
7%
Other Asian countries
RoW
Europe
India
America
Operating company-wise breakup of sales
27%
23%
5%
20%
25%
Polyplex Europa
Other trading operations (China, Singapore, EcoBlue and PBF)
Polyplex India Polyplex Thailand
Polyplex USA
Application-wise breakup of sales
71%
1%
28% Packaging
Industrial
Electrical
CPP
Other sales
OPP
Business segment-wise breakup of sales
65%
11%
5% 4%
11%
2%2%
Chips
027AnnualReport2015-16

PET/OPP/CPP/Blown PP Film Production and Capacity Utilisation
25095% ’000 MT
90
85
80
75
70
65
60
55
5011-12 12-13 13-14 14-15 15-16
200
150
100
50
0
PET/OPP/CPP/Blown PP CUF (%)
86% 88%
77%79%
170 177 194 211 231
86%
Financial performance A snapshot of the income statement for the last two years is given below:
2015-16 2014-15 Change (y-o-y)
(D in lacs) % of total expenses
(D in lacs) % of total expenses
Sales and other income 3,21,377 100% 3,32,207 100% -3%
Manufacturing expenses 2,19,261 68% 68% 2,35,315 71% 74%
Operating and other expenses 63,430 20% 21% 56,684 17% 18%
EBITDA 38,686 12% 40,207 12% -4%
4,808 1% 2% 5,588 2% 2%
Depreciation and amortisation 20,896 7% 7% 21,576 6% 7%
Income before income tax 12,982 4% 13,044 4% 0%
Exceptional gain / (loss) (6,566) -2% (4,775) -1%
Provision for income tax 4,792 1% 494 0%
Net Income (before minority interest) 1,625 1% 7,775 2% -79%
Minority interest (1,279) 0% 3,980 1%
Net income (after minority interest) 2,904 1% 3,795 1% -23%
During FY2015-16, there has been a
Customer Relationship Management (CRM) and customer complaint handling.
Projects The Company is in the process of installing a new metalliser in India with an annual capacity of 8,100 metric tonnes to widen the portfolio
production expected to begin from Q2 FY 2016-17).
Performance during the year All discussion here is in the context of
the consolidated performance of the Company.
Sales and operationsThe Company possesses a visible international presence with active sales in all major regional markets/countries. The Company has an extensive base of about 1,600 customers with low customer concentration. Its top-10 customers contributed 23% of
Company’s revenues were from PET
the total sales of the Group, 48% was accounted by end-users. The breakup of the Company’s revenues from
various regions, operating companies, business segment and applications wise are given on the previous page.
During the year under review, there
Thailand (which had started operations during the cyclical downturn). The trend in production and utilisation
Blown PP) is as under:
During the year under review, capacity utilisation was higher in both PET
028 PolyplexCorporation Ltd.

contribution from the value-added
However there was a loss mainly on account of unrealised foreign exchange fluctuation losses amounting to C6,095 lacs during the current year, in comparison to unrealised foreign exchange fluctuation gains worth C5,743 lacs during the previous year. This was on account of foreign exchange difference arising as a result of reinstatement of long-term
Account in overseas entities as per local accounting regulations. This has resulted in net decrease in EBITDA by 4%.
During the year under review, based
per prudent accounting principles, provisions have been made for impairment losses affecting manufacturing assets held by Polyplex USA (PU) and the same has been reported as an exceptional item.
Tax expenses during the current year were largely a result of the reversal of the deferred tax assets created earlier in a US subsidiary based on future
Sales and other incomeA marginal decrease in topline during the year under review was mainly due to a decline in the selling price of the
prices. This was offset by an increase in sales volumes.
Other incomes during the year declined due to forex gains (net) during the previous year, as against forex losses (net) during the year under review. These forex losses are grouped under other expenses. Other income also included interest income generated through deployment of surplus cash in
deposits.
The break-up of sales reveals that 70% of the overall revenues are
in FY 2014-15), 2% from PET chips (4% in FY 2014-15), 11% from coating businesses (11% in FY 2014-15), 11%
in FY 2014-15).
Manufacturing expensesEven after increase in sales volume, manufacturing expenses declined by 7% in absolute terms due to fall in raw material prices. Furthermore, power and fuel costs reduced marginally due to lowered crude prices which was in turn partially offset by increased volumes.
Other manufacturing costs like packaging costs increased due to higher sales volumes. Store and spares and repair and maintenance costs have increased due to lumpy expenses arising from scheduled repair and maintenance activity.
Operating and other expensesOperating and other expenses in absolute term have increased by 12%. Other expenses during the year under review include foreign exchange fluctuation loss (net) as compared to gain in the previous year.
Operating and other expenses like personal expenses, and selling expenses are higher – reflecting the impact of inflation and increase in sales volume. Administrative expenses are lower due to saving measures undertaken by the Company.
029AnnualReport2015-16

Sales and other income
2015-16 (D in lacs) 2014-15 (D in lacs) Change (y-o-y)
Sales 3,17,045 3,20,101 -1%
Other income 4,332 12,106 -64%
Total 3,21,377 3,32,207 -3%
Manufacturing expenses
2015-16 (D in lacs) 2014-15 (D in lacs) Change (y-o-y)
Raw materials consumed (Including stock accretion/decretion)
1,75,468 1,93,924 -10%
Power and fuel 20,049 21,736 -8%
Packing material consumed 13,044 11,689 12%
Stores and spares consumed 7,718 5,916 30%
Repairs and maintenance 2,983 2,051 45%
Total manufacturing expenses 2,19,261 2,35,315 -7%
Manufacturing expenses as a percentage of sales and other income
68% 71%
Operating and other expenses
2015-16 (D in lacs) 2014-15 (D in lacs) Change (y-o-y)
Personnel expenses 29,515 26,746 10%
Administrative expenses 11,162 13,656 -18%
Selling expenses 16,739 16,079 4%
Other expenses 6,014 204 2847%
Total operating and other expenses 63,430 56,684 12%
Operating and other expenses as a percentage of sales and other income
20% 17%
Financial expenses are lower than the previous year due to repayment/prepayment of term loan during the year under review.
2015-16 (D in lacs) 2014-15 (D in lacs) Change (y-o-y)
Interest expense 4,604 5,274 -13%
204 313 -35%
4,808 5,588 -14%
percentage of sales and other income
1.5% 1.7%
030 PolyplexCorporation Ltd.

Liquidity and capital resources The Company ensures access to
costs to meet its business needs
business cycles. The Company relies on cash from operations and short-term/long-term debt for meeting its requirements. The Company continues to maintain adequate liquidity for its operations with a close watch on the debt service and leveraging ratios. Cash and equivalents together with undrawn credit lines (excluding project
aggregated to more than C1,46,208 lacs (including unutilised working capital limits of C32,625 lacs and liquid investment of C83 lacs) as at the end of the reporting period.
Cash flow from operations For the year under review, cash flow from operating activities has increased to C41,404 lacs on account of better margins, expanded scale of operations and realisation of net working capital invested in business, which is partly offset by marginal higher operating costs.
Cash flow from investing activitiesThe cash generated was used in
tune of C5,186 lacs in FY 2015-16 (C15,688 lacs in FY 2014-15), mainly towards smaller investments in various locations. Interest and dividend income during the year is C2 245 lacs (C1,988 lacs in FY 2014-15).
During the year a net amount of C41,629 lacs was repaid/prepaid
(after accounting for fresh borrowing) against long-term and short-term debt (C17,067 lacs net borrowing in 2014-15). Interest paid during the year was C4,868 lacs (C5,726 lacs in 2014-15). The Company paid dividend of C802 lacs in FY 2015-16 (C639 lacs in 2014-15).
Total debt as on March 31, 2016 is C129,404 lacs, a decrease of C36,040 lacs over previous year (C165,444 lacs). This is mainly due to scheduled principal repayments and some prepayments in Group companies.
1,50,000
1,00,000
50,000
(50,000)
Net Cash flow from Operating activities
(1,00,000)
(1,50,000)
1,00,40489,956 93,270
1,07,437 1,13,500
–
in C lac
Net Cash flow from Investing activities
Net Cash flow from Financing activities
Total Cash & Cash equivalent at the end of the year
FY2011-12 FY2012-13 FY2013-14 FY2014-15 FY2015-16
Net cash flow from operating activities
46,254 7,178 11,353 37,601 41,404
Net cash flow from investing activities
(33,563) (1,04,914) (57,696) 8,433 (2,044)
activities (10,258) 86,214 31,060 (23,431) (47,299)
Total cash and cash equivalent at the end of the year
1,00,404 89,956 93,270 1,07,437 1,13,500
90,000
Total debt -currency wise
Cash and cash equivalent as on 31st March, 2016
D113,500 lac
% oftotal
80,000
70,000
60,000
50,000
40,000
30,000
20,000
10,000
2016-17
8,389
26,173
22,396
14,930
7,913 79,801-
2017-18 2018-19 2019-20 2020-21 2021 onwards Total-
INR USD THB Euro
10%100%
80%
60%
40%
20%
0% 0%
24%
66%
Term loan repayment schedule (D in lacs)
031AnnualReport2015-16

Sustainability Polyplex is committed towards sustainability and aims to be a total packaging solution provider for the customers while providing the highest standards of health and safety to the workforce, and developing products with minimal environmental impact. As an organisation, the Company continually strives to:
Improve production and operational
consumption of resources like electricity, water and raw materials.
Minimise the impact on the environment by reducing emission levels of industrial waste and effluents.
Improve safety and health standards by continuously improving working conditions, minimising workplace
hazards and raising awareness through involvement, participation and continuous training of the shopfloor workforce.
Engage with stakeholders to promote sustainable business practices.
Polyplex has undertaken the following decisive initiatives in the realm of environmental conservation:
Operationalised latest technologies to save power across plants locations which resulted in substantial improvements in terms of energy
Embraced environment-friendly technologies to save substantial amounts of energy and reduced waste generation through the use of process
trims and feed the waste directly to the extruder.
Reduced greenhouse gas generation
Indian facilities
Monitored carbon footprints across manufacturing locations stringently.
Operationalised a special recycling unit for processing waste, which was earlier rendered unusable.
Switched to LED lighting across plants.
The Company has been following best practices relating to environment, health and safety and has been diligently following the guidelines been set out as per the following
ISO 9001:2008 Quality management system
1996 2010 2004 2006
ISO 14001: 2004 Environment management system
2002 2010 2004 2009
OHSAS 18001:2007
Occupational health and safety management system
2004 2012 2008 2009
ISO 22000: 2005 Food safety management system
2008 2012 2009NA
BRC-IOP Food safety management system
NA NA NA2006
ISO 50001:2011 Energy management system
2013 2013Under implementation 2014
Polyplex is committed towards sustainability and aims to be a total packaging solution provider for the customers while providing the highest standards of health and safety to the workforce, and developing products with minimal environmental impact.
032 PolyplexCorporation Ltd.

Corporate social responsibility
Cognisant of its presence in an industry that can potentially cause irreparable harm to the environment, Polyplex has undertaken several corporate responsibility initiatives towards minimising its carbon footprint. Responsibility towards stakeholders and external agencies has been encouraged in order to foster a holistic corporate culture. Through its R&D initiatives, Polyplex has pioneered the use of bio-based renewable raw materials and energy sources for the manufacture of
Company has been running a school for the past two decades. The school provides over 1,600 students with best-in-class educational facilities. Under a PPP model at Bajpur and Khatima, Polyplex has adopted two local schools and provides them with the necessary infrastructure. Polyplex also offers a slew of sports and educational sponsorships as well as full scholarships to the school-going children of deceased employees. Polyplex promotes religious harmony through its even-handed support to local religious
activities and celebrations. Polyplex has also contributed to the Rekhta
organisation established to promote and disseminate Urdu literature among the masses. In line with the requirements of Companies Act, 2013, the Company has also constituted a CSR Committee with a keen emphasis on delivering a positive impact across social, economic and environmental parameters. A detailed report on CSR expenditure is provided in the Director’s Report.
033AnnualReport2015-16

Innovation
Polyplex’s innovation centre (R&D) has adopted a ‘lean innovation model’ in order to create enduring value for the customers. It aims to provide more than a new product or a substrate. Polyplex’s innovation centre has introduced value-added products in the
gas barriers ALOX coated packaging
shrink sleeves and labels as well as specialty product coating technologies.
customer engagement process to align innovations with customer requirements. The Company also focuses on developing applications and replacing existing products with alternative solutions.
Commitment to open innovation: Polyplex leverages the concept of co-creation while working on various innovation programmes with its stakeholders – customers, brand owners, packaging designers, suppliers and adhesive manufacturers. On the
engagement initiatives as V+ (value plus), W2 (win–win) and P1 (power of one).
Polyplex’s innovation model revolves
around devising new products and applications and embracing new technologies which cover not only the existing but also the new growth segments.
Product and application development programmes: The purpose of this programme is to continuously come up with differentiated products and applications. Innovations in this area are mainly based on developing new functional surfaces and properties for PET and PP-based products based on future needs of the customers.
The Company offers innovative solutions to its partners. Consequently, Polyplex has successfully adopted the 3R (reduce, reuse and recycle) concept while coming up with new-age packaging solutions. The Company has taken various initiatives to recycle waste, save energy and use clean technology to reassert its environmental commitment. Polyplex continually strives to manufacture sustainable products which gain global acceptance for example green candy
transparent, chlorine-free, high-barrier
Polyplex has made a name for itself by routinely introducing specialty products with various innovative applications and uses. Recent examples include
appliances, easy-to-tear packaging
metallic surfaces, transparent barrier
digital printable and UV inks, among others. The Company’s photographic
high-end printing machines. These
non-tearable, environment-friendly and capable of reproducing better colours. The Company also develops
in greenhouses. Polyplex created a
energy bars and successfully launched it during the year under review.
Going ahead, the Company intends
media substrates suitable for Laser, ink-jet printing, back-lit applications
Polyplex has attained leadership in the thin
manufacturing and distribution operations in six countries
034 PolyplexCorporation Ltd.

Human resources
Polyplex Group employs approximately 1,850 people across the globe. The Company has a manufacturing presence in India, Thailand, Turkey and the US. The Company closely monitors employee performances and accordingly creates career progression paths. The Company employs top-notch students from various premier institutions in the country. The Company has also focused on rotating job responsibilities. Under this the key executives are rotated inside the organisation which brings lots of inter-departmental experience and created the organisation a better place to work for.
The Company during the year gone by, has laid a keen emphasis
on manpower rationalisation and localisation (mainly in the overseas units) through the following initiatives:
Manpower costs have been brought under control and inter-unit deployments of critical resources have been undertaken to support the businesses.
Functional integration and vertical compression of hierarchy has synergised operations and improved cost competitiveness.
A keen emphasis has been laid in the NPD, R&D and technical services areas. To strengthen the R&D team and prepare a talent pipeline, M. Tech and M.Sc. students have been hired from premier institutes.
Attrition levels are under control.
Effective implementation of the HRIS (human resource information system) has improved visibility and access to accurate information thereby quickening decision-making on people-related issues at the Group-level. Polyplex continues to incorporate user-friendly plug-ins and upgrade the system so as to empower its employees adequately.
An agreement over the wage was settled amicably between the management and the workers’ union at the Khatima plant. Industrial relations remained cordial at all the other units too. The next few years will be spent on consolidating the HR base of the Company in a bid to enhance per employee productivity.
Information technology
During the year under review, the Company continued to implement IT enablement initiatives for automatising and optimising processes. The Company started developing an integrated application platform to replace standalone business
applications. The Company also worked on deploying customised tools to empower the marketing and technical service teams better. The Company also worked towards expanding the coverage of web-based training and development
portal for employees. The Company upgraded networks and infrastructure components to improve system performance. The Company utilised the hybrid cloud model to provide better communication and HR infrastructure to its global users.
Internal control systems and their adequacy
The internal controls are commensurate with the size and the nature of the nature of the operations of the Company. These controls have been designed to provide a reasonable assurance with regard to maintaining proper accounting controls, monitoring of operations, safeguarding of resources and utilising them to the maximum, promoting operational
regulations and ensuring reliability of
an internal audit process that reviews the in-system checks and regularly
The audit reports, submitted by the internal auditors, are reviewed by the audit committee. Any suggestions for improvements submitted to the
committee are considered and the implementation of corrective actions, wherever required, is followed up. Statutory and internal auditors are also invited to the audit committee meetings to ascertain their views on the adequacy of internal control systems. Periodically, the Board of Directors is informed of the same.
Outlook and planned investments
Exceptionally high margins during FY2010-11 had attracted a lot of
As such, over the next 24 months, it is expected that growth in demand and supply would compensate each other and the existing surplus
scenario would persist for another couple of years. However, demand-supply balance in Asia is expected to tilt more in buyers’ favour as supply growth is expected to outstrip growth in demand. The Company believes that its well-distributed manufacturing
product portfolio, quality consistency,
supply chain and a conservative Balance Sheet should allow it to grow
volatilities.
035AnnualReport2015-16

Polyplex’s integrated risk management approach comprises compliance with prudential norms, structured reporting and effective controls. A combination of centrally-issued policies and locally sensitised procedures has helped enhance process robustness, ensuring that business risks are effectively addressed.
prices and raw material (PTA and MEG) prices. Whenever the demand-supply balance favours the suppliers,
material prices widens and encourages manufacturers to increase production by expanding capacities. On the
market demand, prices drop, thereby
and raw material prices. This cyclical nature inevitably affects every sectoral player. Post the FY2010-11 aberration, a lot of capacity addition took place in
demand-supply scenario and impacted margins. This surplus scenario expected to persist atleast for the next couple of years.
Risk mitigation The Company’s business model is designed to moderate volatility in earnings and build long-term competitiveness. Its modern manufacturing assets lend it the ability to service key regional markets while minimising logistics costs. A well-distributed manufacturing presence provides better access to global markets and
the Company from demand-supply volatilities.
1
Liquidity implies the ability of a corporate to meet its debt obligations
A less than optimal debt-equity ratio could limit the investment capacity of a corporate. Generally, if the cost of debt is lower than the return on
leverage, a corporate can enhance return on equity. However, since there
and principal repayments, volatile cash flows could strain the liquidity of a corporate. Also, higher debts could
limit the ability of the Company to
Risk mitigation Notwithstanding net repayments and prepayments of C703,95 lacs over the past two years, the Company has
net debt-equity ratio to remain at 0.05. Cash and equivalents together with undrawn credit lines (excluding project
aggregated to more than C1,46,208 lacs. The Company had divested its
grade PET resin plant in Turkey which has also contributed towards maintaining the cash balance and improving the debt-equity ratio. The Company periodically undertakes ‘stress tests’ to evaluate the potential impact of an adverse economic and industry environment. Free cash flows along with large unutilised credit lines available at Polyplex’s disposal are expected be quite adequate to deal with unforeseen contingencies.
2
Credit risk refers to the risk of non-payment by debtors. This risk increases in case of unsecured or open payment terms.
Risk mitigation
robust internal credit management system to monitor unsecured sales. During FY2015-16, the Company had 1,600 customers and 23% of the total revenues were contributed by the top 10 customers. A strong internal
credit risk management policy has enabled Polyplex to manage credit risk prudently even when credit risks were high. The average credit period of during FY 2015-16 stood at 46 days compared to 45 days in FY2014-15.
3
2011-12 2012-13 2013-14 2014-15 2015-16
80% 72%
28% 29%31% 31%
69% 69%71%
60%
40%
20%
0%
31%
69%
036 PolyplexCorporation Ltd.

The basic raw material for production
is produced from PTA and MEG. The cost of resin is thus the single-largest component of the total production costs. Hence, any adverse fluctuations in the cost of PET resin can impact the Company’s operating margins depending upon the Company’s ability to pass on cost increases to its customers. As selling prices are usually negotiated on a monthly/quarterly basis, in a balanced demand supply situation, the Company is able to adjust the selling prices following any changes in PET resin costs. Although the pace of capacity addition
industry continued to witness a surplus scenario, contracting margins.
continuous fall in raw material prices in the FY 2015-16 due to the fall in crude prices globally, which were passed on to the customer given the supply overhang. Analysis of historical data shows strong links between PTA/
Risk mitigation The Company monitors global and local input price trends carefully and determines its procurement plans accordingly. Moreover, unpredictable price movements of raw materials affect all industry participants and thus does not put Polyplex in a materially advantageous or disadvantageous position vis-à-vis its competitors. The
less susceptible to changes in raw material prices and thus reduce the Company’s vulnerability in the face of volatile resin costs
4
Any delay in implementation, cost overrun, inability to stabilise production from the new investment and failure to meet the target investment objectives
Risk mitigation The risks are mitigated by forming a dedicated project management team, corporate management oversight, management commitment and suitable protection clauses in contractual arrangements and
appropriate insurance products. Although the Company takes into consideration various regulatory aspects at the project feasibility stage but subsequent changes during implementation phase may lead to project delays.
Regulatory compliance is a key consideration for the PET industry. In order to ensure the safety of food that is packaged and consumed, extensive
regulations have been put in place by various regulatory bodies like the USFDA, the EEC, among others.
Risk mitigation The Company stringently conforms to the relevant FDA and EEC directives for food packaging applications.
5
6
PTA MEG Value addition over PTA and MEG
2000 2001 2002 2003 2004 2005 2006 2007 2008 2009 2010 2011 2012 2013 2014 2015
(12 microns Corona)
1.76 1.83 1.94 2.15 2.07 1.98 1.88 2.06 2.54 2.13 3.08 2.61 1.99 1.95 1.92 1.42
PTA 0.57 0.49 0.53 0.59 0.75 0.81 0.90 0.88 0.91 0.84 0.97 1.27 1.10 1.10 0.94 0.66
MEG 0.58 0.50 0.46 0.67 0.93 0.92 0.91 1.08 1.15 0.69 0.97 1.30 1.18 1.21 1.03 0.84
RM for PET 0.71 0.61 0.64 0.76 1.00 1.04 1.13 1.17 1.21 0.99 1.20 1.59 1.40 1.40 1.20 0.89
Value addition over PTA and MEG
1.05 1.22 1.31 1.39 1.07 0.94 0.75 0.89 1.33 1.14 1.87 1.02 0.60 0.55 0.71 0.53
5.00
4.50
4.00
3.50
3.00
2.50
2.00
1.50
1.00
US
D/k
g
0.50
0.00
037AnnualReport2015-16

subject to trade defense measures for more than two decades through the imposition of anti-dumping duties and countervailing duties. Anti-dumping duty can be imposed on imports if the ex-factory prices of such imported products are proved to be lower than the local selling prices of the similar products in the countries of the exporters. The important markets adopting this measure are the EU, the US and Brazil. Countervailing duties are tariffs levied on imported products to offset the impact of subsidies applicable for exporters in those nations. Such tariff measures increase prices of imported products, usually rendering exporters uncompetitive.
The Company undertakes all safeguards to insulate itself against risks arising out of anti-dumping actions and other trade barriers imposed by importing countries.
presence and an end-to-end product portfolio also helps mitigate fallouts emanating from such actions.
In the last US anti-dumping petition of 2007 against producers of PET
and the UAE, duties were imposed against China, the UAE and Brazil but
exports from Thailand were found to be not causing any injury to the US domestic industry. This had led to non-imposition of any special duties on exports from Thailand to the US. In the last sunset review conducted by the US Department of Commerce, AD duty on Brazil has been revoked, though duties on China and the UAE would continue to prevail. As per the last administrative review, the AD duties on China and the UAE are in the range of 4.44% to 76.72%.
administrative review conducted by the US Department of Commerce for the review period 2013-14, exports from Polyplex India to US are subject to Anti Dumping rate of 0.59% and CVD rate of 6.09%. However, with the thin
service customers in USA through local production. The Anti Dumping duty on other Indian producers is in the range of 0% - 5.71% and CVD rate is in the range of 2.11% - 65.59%. Over the last few years, AD and CVD duties imposed by EU on imports from India have been eliminated.
Since March 2012, Brazil has imposed
from Turkey, UAE and Mexico in the range of USD 67.44 per metric tonne to USD 1,013.98 per metric tonne, with
duty on exports from Polyplex Turkey to Brazil being the lowest. However, as sales from Polyplex Turkey to Brazil are limited, the impact of AD duty is minimal. As per the recent anti dumping investigation by Brazil
Egypt and India, the injury to domestic industry has been determined and anti dumping duties have been imposed. The AD duty on Polyplex India is USD 255.5 per metric tonne. The duties imposed on China, Egypt and India are in the range of USD 222.15 per metric tonne to 946.36 per metric tonne. Brazil has also imposed CVD
USD 0 – USD 689.66 per metric tonne. The CVD on Polyplex India is USD 4.24 per metric tonne.
In 2014, Indonesia initiated a dumping investigation against imports of PET
Thailand has exposure to Indonesian market, they have cooperated in the investigation and have submitted the required information to the Indonesian investigating authorities. As per the
Polyplex Thailand has been imposed a duty of 2.2% which is the lowest among all the exporters.
7
The packaging industry is prone to certain environmental and sustainability risks. For instance, in
before National Green Tribunal against the use of BOPP/PET-based packaging material. This application seeks to impose an outright ban on the usage of such packaging materials. Also, the new Plastic Waste Management Rules, 2016 have restricted the manufacture and use of plastic carry bags and has urged municipal authorities to set up of
a plastic waste management system. The concerned ministry has come out with these new rules which provide for certain stringent provisions related to usage of multi-layer plastic packaging.
that BOPP/PET-based packaging material is safe for food packaging and enhances the shelf-life of products. It offers properties like high barrier, high performance and low contamination
which keeps the product completely sealed off from the environment. It is also convenient for handling as it occupies lesser space and has lower weight compared to glass, tin and
not contain any hazardous chemicals and is compliant with EEC directives and FDA regulations. It offers various sustainability advantages like low raw material consumption being lightweight, low energy consumption etc.
8
038 PolyplexCorporation Ltd.

An overt dependence on a particular geography mat not bode well for the Company.
as well as downstream units is quite
evenly spread out among the four manufacturing country locations of India, Thailand, Turkey and the US. Based on the Company’s experience it would appear that the risks are not
problems have been faced in Thailand
and Turkey, they have had no
In the event these problems escalate, there may be some impact for a short duration. However, no adverse long-term impact is envisaged.
10
These risks arise on account of unanticipated changes in exchange rates. As the Company deals in multiple currencies due to its operations across different locations, the Company is exposed to risks on account of currency mismatches. Interest rate risk is the risk borne by interest bearing debt and investments, due to variability in interest rates. In
rates, as the interest rates changes cost of borrowing also changes, thus impacting cash flows.
Since the currency markets are highly volatile, the Company minimises such risks by adopting a farsighted hedging strategy. A natural hedge is created by choosing the right currencies for trading and taking loans. Thus, the
liability in order to match with the currency of operational surplus. The
remaining mismatched exposures are optimised by the Company by carefully identifying, measuring, monitoring and hedging the net exposures by using simple instruments like forwards. This ensures that the maximum potential
there is a natural hedge available for all long-term borrowings, the Company does not cover the exchange rate risk on these liabilities. Therefore, the foreign exchange translation gain/ loss on these liabilities, as reported in the
a corresponding impact on the cash flows of the Company as the payments for these loans are met via future receivables in the same currency. The forex risk is managed on a standalone basis to protect stakeholder interests by guaranteeing that cash flows are not transferable between Group entities.
The currencies used for borrowing by
the Company are US dollars, Euros, Rupees and Bahts. As the Company is net US dollar surplus, the maximum borrowings are in US dollars (66% of
borrowings in Thai Bahts (24%) and the balance is in Euros (10%). Any spike in dollar value has a negative impact on loan liabilities but with majority of the Company’s exports happening in dollar denomination, the impact on the Company is minimal.
There are various reasons for interest rate changes like economic growth, inflation expectations, and unemployment, among others. All these factors are external and uncontrollable. In order to have a more balanced loan portfolio and taking
the Company has shifted some of its
interest rate swaps.
9
Cautionary statement
‘intends,’ ‘projects,’ ‘estimates’ or other words of similar meaning. All statements that address expectations or projections about the future,
statements. Forward-looking statements are based on certain assumptions and expectations of future events. The Company cannot guarantee that these assumptions and expectations are accurate or will be realised.
039AnnualReport2015-16

Directors’ Report
Financial Highlights and Operations
a) Standalone (C in Lacs)
Particulars 2015-16 2014-15
–
–
b) Consolidated Working Results (Under Indian GAAP) (C in Lacs)
Particulars 2015-16 2014-15
C C) (Basic)
C C
PolyplexCorporation Ltd.

Year in Retrospect
C C
C
to C
C C
C
C
C
C
C
Dividend and Transfer to ReservesC
C
Change in the nature of business, if any
Material Changes and Commitments
Management Discussion and Analysis Report
Subsidiary Companies
Particulars of Loans, Guarantees and Investments
Deposits from public
Directors’ Responsibility Statement
AnnualReport2015-16

Directors and Key Managerial PersonnelIndependent Directors and Declaration by Independent Directors
Non-Independent Directors and Directors Retiring by Rotation
Key Managerial Personnel
Number of meetings of the Board
Policy on Directors Appointment and Remuneration
Board, Committees and Directors Evaluation
PolyplexCorporation Ltd.

Managerial Remuneration
Board Committees
Audit Committee
Corporate Social Responsibility (CSR) Initiatives
Corporate Governance
Whistle Blower Policy – Vigil Mechanism
AuditorsStatutory Auditors
Internal Auditors
Cost Auditors
AnnualReport2015-16

Secretarial Auditors
Other Statutory Information
Extract of Annual Return
Related Party Transactions
Risk Management
Internal Financial Control
Human Resources
Listing of Shares and Depository System
Acknowledgement
Sanjiv SarafChairman
PolyplexCorporation Ltd.

Statement showing particulars of employees of the Company required under Section 197 of the Companies Act, 2013 read with Rule 5 (2) and (3) of the Companies (Appointment and Remuneration of Managerial Personnel) Rules, 2014 and forming part of the Board of Directors Report for the year ended March 31, 2016.
Sr. No.
Name Designation Age (Years)
Date of Joining
Experience (Years)
Remuneration (D)
Last Employment
1
Director
Diploma
Ram
Plant)
Diploma
(Instrumentation)
Srivastava
Services9
Services)
Secretary
A. Employed for full year (C in Lacs)
AnnualReport2015-16

Notes:
Sr. No.
Name Designation Age (Years)
Date of Joining
Experience (Years)
Remuneration (D)
Last Employment
1
Saralam)
Business
B. Employed for part of the year (C in Lacs)
PolyplexCorporation Ltd.

Name of the person Ratio to Median Remuneration
Non-Executive Directors
Executive Director
Name of the person % Increase in remuneration
Non-Executive Directors
Executive Director
Key Managerial Personnel
C
C C
percentile increase in the managerial remuneration
Sanjiv SarafChairman
Particulars of Remuneration
AnnualReport2015-16

Report on Corporate Social Responsibility (CSR Report)
1. A brief outline of the Company’s CSR Policy, including the overview of Projects or Programs proposed to be undertaken and a reference to the web-link to the CSR Policy and Projects or Programs.
2. The Composition of the CSR Committee:
years: C
4. Prescribed CSR Expenditure (Two percent of the amount as in item 3 above).
C
C
NIL
6. Reasons for not spending the prescribed amount:
7. A responsibility statement of the CSR Committee that the implementation and monitoring of CSR Policy, is in compliance with CSR objectives and Policy of the Company:
Sanjiv SarafChairman of CSR Committee
PolyplexCorporation Ltd.

Annexure to CSR Report
S. No
CSR project or activity
Sector in which the Project is covered
Projects or programs (1) Local area or other (2) Specify the State and district where projects or programs was undertaken
Amount outlay (budget) project or programs wise
Amount spent on the projects or programs Sub-heads: (1) Direct expenditure on projects or programs. (2) Overheads:
Cumulative expenditure upto the reporting period
Amount spent: Direct or through implementing agency
(D) (D)
1 Promoting State – National Direct Implementing
Promoting Promoting
Singh Nagar
Direct Implementing
Society
Promoting Promoting Local area –
Singh Nagar
Direct Direct
Total 75,53,523 75,53,523
Sanjiv SarafChairman of CSR Committee
AnnualReport2015-16

FORM NO. MR-3
SECRETARIAL AUDIT REPORTFOR THE FINANCIAL YEAR ENDED ON 31ST MARCH, 2016
[Pursuant to Section 204(1) of the Companies Act, 2013 read with Rule No. 9 of the Companies (Appointment and Remuneration of Managerial Personnel) Rules, 2014
Polyplex Corporation Limited
PolyplexCorporation Ltd.

For RSM & CO. Company Secretaries
Ravi Sharma Partner
AnnualReport2015-16

Polyplex Corporation Limited
For RSM & CO. Company Secretaries
Ravi Sharma Partner
PolyplexCorporation Ltd.

Information under Section 134(3)(m) of the Companies Act, 2013 read with Companies (Accounts) Rules, 2014 and
forming part of the Directors’ Report.
(A) CONSERVATION OF ENERGY:
(B) TECHNOLOGY ABSORPTION:
C C
CNil (Previous Year – C
(C) FOREIGN EXCHANGE EARNINGS AND OUTGO: C C
C C
AnnualReport2015-16

FORM NO. MGT 9
EXTRACT OF ANNUAL RETURNAS ON THE FINANCIAL YEAR ENDED ON MARCH 31, 2016
[Pursuant to Section 92 (3) of the Companies Act, 2013 and Rule 12(1) of the Companies (Management and Administration) Rules, 2014]
I. REGISTRATION AND OTHER DETAILS:i
ii Registration Date
iii
iv
v
vi Yes
vii
II. PRINCIPAL BUSINESS ACTIVITIES OF THE COMPANY
SL No
Name & Description of main products/servicesNIC Code of the Product /
service% to total turnover
of the company1
III. PARTICULARS OF HOLDING, SUBSIDIARY & ASSOCIATE COMPANIES
Sr. No
Name and Address of the Company CIN/GLNHOLDING/ SUBSIDIARY/ ASSOCIATE
% OF SHARES HELD
APPLICABLE SECTION
1
PolyplexCorporation Ltd.

Sr. No
Name and Address of the Company CIN/GLNHOLDING/ SUBSIDIARY/ ASSOCIATE
% OF SHARES HELD
APPLICABLE SECTION
9
11
* Polyplex (Thailand) Public Company Limited has transferred 63,900 shares to the minority shareholder on 1st April, 2015, thereby reducing its shareholding from 80% to 74% in EcoBlue Limited.
IV. SHAREHOLDING PATTERN (Equity Share Capital Breakup as percentage of Total Equity)
i) Category-wise Shareholding
Category of Shareholders
No. of Shares held at the beginning of the year (As on 01.04.2015)
No. of Shares held at the end of the year (As on 31.03.2016)
% change during
the yearDemat Physical Total% of Total
SharesDemat Physical Total
% of Total Shares
A. Promoters (including Promoter Group)
(1) Indian
– – – – – – – – –
– – – – – – – – –
– – – – – – – – –
– –
– – – – – – – – –
their relative)– –
SUB TOTAL:(A) (1) 1,848,400 – 1,848,400 5.78 2,839,400 – 2,839,400 8.88 3.10
AnnualReport2015-16

Category of Shareholders
No. of Shares held at the beginning of the year (As on 01.04.2015)
No. of Shares held at the end of the year (As on 31.03.2016)
% change during
the yearDemat Physical Total% of Total
SharesDemat Physical Total
% of Total Shares
(2) Foreign
– – – – – – – – –
– –
Institutions– – – – – – – – –
their relatives) –
SUB TOTAL (A) (2) 13,162,134 13,162,134 41.15 13,162,134 13,162,134 41.15 –
Total Shareholding of Promoters
(A)= (A)(1)+(A)(2) 15,010,534 15,010,534 46.93 16,001,534 16,001,534 50.03 3.10
B. PUBLIC SHAREHOLDING
(1) Institutions
– – – – – – – – –
– – – – – – –
– – – – – – – – –
– – – – – – – – –
Investors
– – – – – – – – –
– – – – – – – – –
– – – – –
(2) Non Institutions
– – – – – – – – –
capital upto C1 lac
C1 lac
– –
(c-i) NRIs
– – –
PolyplexCorporation Ltd.

Category of Shareholders
No. of Shares held at the beginning of the year (As on 01.04.2015)
No. of Shares held at the end of the year (As on 31.03.2016)
% change during
the yearDemat Physical Total% of Total
SharesDemat Physical Total
% of Total Shares
Relatives– – –
– –
(c-v) Trusts – – – – –
– – – – –
– – – – –
SUB TOTAL (B)(2): 14,701,814 503,772 15,205,586 47.54 12,782,761 485,022 13,267,783 41.48 (6.06)
Total Public Shareholding
(B)= (B)(1)+(B)(2) 16,425,494 548,572 16,974,066 53.07 15,453,844 529,222 15,983,066 49.97 (3.10)
C. Shares held by Custodian for GDRs & ADRs
– – – – – – – – –
Grand Total (A+B+C) 31,436,028 548,572 31,984,600 100.00 31,455,378 529,222 31,984,600 100.00 –
(ii) Share Holding of Promoters (including Promoter Group)
Sr. No.
Shareholder’s Name Shareholding at the beginning of the year (As on April 01, 2015)
Shareholding at the end of the year (As on March 31, 2016)
% change in share holding
during the year
No. of shares
% of total shares of the
company
% of shares pledged
encumbered to total shares
No. of shares
% of total shares of the
company
% of shares pledged
encumbered to total shares
1 – – –
– – –
– – –
– – –
– –
– –
– –
– –
9 – – –
– – –
11 – – –
– – –
Total 15,010,534 46.93 – 16,001,534 50.03 – 3.10
AnnualReport2015-16

(iii) Change in Promoter’s Shareholding (including Promoter Group) (Please specify, if there is no change)
Sr. No.
Shareholder’s Name Shareholding at the beginning of the year (As on April 01, 2015)
Increase / Decrease in Shareholding
specifying the reasons for
increase / decrease (e.g. allotment /
transfer / bonus / sweat equity etc):
Shareholding at the end of the year
(As on March 31, 2016)
No. of Shares % of total shares of the
company
Date No. of Shares
No. of shares
% of total shares of the
company
1 – – –
Secure Investments – – –
Investments Private – – –
– – –
– –
– –
– –
9 – – –
– – –
11 – – –
– – –
Total 15,010,534 46.93 – 991,000 – 16,001,534 50.03
(iv) Shareholding Pattern of top ten Shareholders (other than Directors, Promoters and Holders of GDRs and ADRs):
Sr. No
Shareholding at the beginning of the year Date Increase / Decrease in Shareholding
specifying the reasons for increase / decrease (e.g. allotment / transfer / bonus / sweat equity etc):
Cumulative Shareholding during the year
Date No. of shares
% of total shares of the company
No. of shares
% of total shares of the company
1 IL & FS Trust Company Ltd ^
PolyplexCorporation Ltd.

Sr. No
Shareholding at the beginning of the year Date Increase / Decrease in Shareholding
specifying the reasons for increase / decrease (e.g. allotment / transfer / bonus / sweat equity etc):
Cumulative Shareholding during the year
Date No. of shares
% of total shares of the company
No. of shares
% of total shares of the company
^ Held in its name in trust for K2 Family Pvt. Trust.
AnnualReport2015-16

Sr. No
Shareholding at the beginning of the year Date Increase / Decrease in Shareholding
specifying the reasons for increase / decrease (e.g. allotment / transfer / bonus / sweat equity etc):
Cumulative Shareholding during the year
Date No. of shares
% of total shares of the company
No. of shares
% of total shares of the company
2 Ricky Ishwardas Kirpalani^^
– –
^^ Shares held in more than one demat account have been consolidated.
3 Keswani Haresh
– –
4 Reliance Capital Trustee Co Ltd-Reliance Small Cap Fund
– –
5 Aadi Financial Advisors LLP*
6 Akash Bhanshali*
7 ICICI Prudential Tax Plan*
PolyplexCorporation Ltd.

Sr. No
Shareholding at the beginning of the year Date Increase / Decrease in Shareholding
specifying the reasons for increase / decrease (e.g. allotment / transfer / bonus / sweat equity etc):
Cumulative Shareholding during the year
Date No. of shares
% of total shares of the company
No. of shares
% of total shares of the company
8 Niche Financial Services Pvt. Ltd.*
9 Kiran Chulani
– –
10 Star Finvest Pvt Ltd*
– –
11 DSP Blackrock Small and Mid Cap Fund**
– –
AnnualReport2015-16

Sr. No
Shareholding at the beginning of the year Date Increase / Decrease in Shareholding
specifying the reasons for increase / decrease (e.g. allotment / transfer / bonus / sweat equity etc):
Cumulative Shareholding during the year
Date No. of shares
% of total shares of the company
No. of shares
% of total shares of the company
12 Citrine Fund Limited**
– –
13 Mahavir L Mehta**
14 Ashmavir Financial Consultants Private Limited**
– –
15 Poonam I Kirpalani **
PolyplexCorporation Ltd.

(v) Shareholding of Directors and Key Managerial Personnel :
Sr. No.
Shareholder’s Name
Shareholding at the beginning of the year (as on April 01, 2015)
Increase / Decrease in Shareholding
specifying the reasons
for increase / decrease (e.g.
allotment / transfer / bonus / sweat equity etc):
Shareholding at the end of the year
(as on March 31, 2016)
No. of Shares% of total
shares of the company
Date No. of Shares No. of shares% of total
shares of the company
A DIRECTORS:
1
– – – – – – –
– – –
Soni – – – – – – –
– – –
– – – – – – –
– – – – – – –
– – – – – – –
B. KEY MANAGERIAL PERSONNEL (KMPs) OTHER THAN WHOLE TIME DIRECTOR:
1 – – – –
Secretary)
V. INDEBTEDNESS
C
Particulars Secured Loans excluding Deposits
Unsecured Loan
Deposits Total Indebtedness
– –
– – – –
– –
Total (i+ii+iii) 3,237,704,119 – – 3,237,704,119
– –
– –
– –
– –
– – – –
– –
Total (i+ii+iii) 1,797,985,774 – – 1,797,985,774
AnnualReport2015-16

VI. REMUNERATION OF DIRECTORS AND KEY MANAGERIAL PERSONNELA. Remuneration to Managing Director, Whole time directors and/or Manager: (In C)
Sr. No
Particulars of Remuneration Name of the MD/WTD/Manager
Mr. Pranay Kothari (Whole Time Director & Key Managerial Personnel)
1 Gross salary
–
–
–
–
Total (A) 14,854,708
Ceiling as per the Companies Act 14,160,789
C
C
C
C
B. Remuneration to other directors:1. Independent Directors (In C)
Sl. No
Particulars of RemunerationName of the Director
Total AmountDr. Suresh
Inderchand SuranaMr. Brij Kishore Soni
Mr. Jitender Balakrishnan
Ms. Pooja Haldea
1
1 – – – –
1 – – – –
Total B (1) 350,000 670,000 180,000 360,000 1,560,000
2. Other Non Executive Directors (In C)
Sl. No
Particulars of Remuneration Name of the Directors Total AmountMr. Sanjiv Saraf Mr. Sanjiv Chadha Mr. Rakesh Awasthi*
– –
– – – –
Total B(2) 3,020,000 120,000 240,000 3,380,000
Total (B)=(B1+B2) 4,940,000
Total Managerial Remuneration (A+B) 19,794,708
Overall Ceiling as per the Act # 16,992,946
* Sitting fees paid to IDBI Bank Ltd. nominating bank
# The above overall ceiling shall be exclusive of any fees payable to Directors by way of fee for attending meetings of the Board or Committee thereof or for any other purpose whatsoever as may be decided by the Board as per Section 197.
PolyplexCorporation Ltd.

C. Remuneration to Key Managerial Personnel other than MD/Manager/WTD (In C)
Sr. No.
Particulars of RemunerationKey Managerial Personnel
Total AmountMr. Manish Gupta Mr. Ashok Kumar Gurnani,
Company Secretary
1
– – –
– – –
– – –
– – –
– – –
– – –
Total 1,85,23,101 52,53,370 2,37,76,471
VII. PENALTIES/PUNISHMENT/COMPOUNDING OF OFFENCESType Section of the
Companies ActBrief
DescriptionDetails of Penalty/
Punishment/Compounding fees imposed
Authority (RD/NCLT/
Court)
Appeal made if any (give details)
A. COMPANY
Penalty
Punishment
B. DIRECTORS
Penalty
Punishment
C. OTHER OFFICERS IN DEFAULT
Penalty
Punishment
NIL
AnnualReport2015-16

Report on
1. Company’s philosophy on Code of Governance
2. Board of Directorsa) Composition:
b) Board Meetings
PolyplexCorporation Ltd.

Name of Director and DIN Category of Directorship
No. of Board Meetings Attended
Attendance at the last
AGM
No. of Other Directorships**
Other Committee Memberships***
Member Chairman
A. Non-Executive DirectorsA.1 Promoters Category
No 1 1
No Nil Nil Nil
A.2 Independent Directors No Nil Nil Nil
No Nil Nil Nil
No 9
No Nil Nil Nil
A.3 Others – Non-Independent Yes Nil Nil Nil
B. Executive Director No 1 Nil
* Mr. Rakesh Awasthi ceased to be director w.e.f. May 3, 2016 consequent upon withdrawal of nomination by IDBI Bank Ltd.
** Only Indian Public Limited Companies are considered.
*** For determining the chairmanship/membership of Committees only Audit Committee and Stakeholders’ Relationship Committee have been considered.
d) Details of shares held by the Directors in the Company are as follows:
S. No.
Name of Director No. of shares held as on March 31, 2016
Surana
e) Information placed before the Board includes :
f) Review of Compliance Report:
AnnualReport2015-16

g) Code of Conduct:
3. Audit Committeea) Composition:
b) Meetings of the Audit Committee :
Name of Member Meetings attended
c) Powers and Role of the Audit Committee :
PolyplexCorporation Ltd.

d) Review of information by the Audit Committee:
4. Nomination and Remuneration Committee and Remuneration to Directorsa) Composition:
Name of Member Meetings attended
b) Terms of reference:
AnnualReport2015-16

c) Details of Remuneration and other terms of appointment of Directors:
i. Executive Director
Mr. Pranay Kothari :
C
C
Total C
C
C
C
C
ii. Non-Executive Directors
C
C C
S. No.
Name of Non-Executive Directors
Sitting Fees (D)
*Sitting fee paid to nominating institution i.e. IDBI Bank Limited. Further Mr. Rakesh Awasthi ceased to be Director w.e.f. May 3, 2016 consequent upon his withdrawal of nomination by IDBI Bank Ltd.
** Amount aggregating to C17.43 Lacs was paid
partner towards professional fee, including service tax and reimbursement of expenses.
C
5. Stakeholders’ Relationship Committeea) Composition:
PolyplexCorporation Ltd.
inter alia
b) Meetings of Stakeholders’ Relationship Committee :
c) Investor Grievance Redressal:
d) Process of transfer of shares
6. Corporate Social Responsibility (CSR) Committee a) Composition:
7. Finance Committee(a) Composition:
inter alia
(b) Meetings of the Finance Committee:
Name of Member Meetings attended
8. Risk Management Committee
9. Independent Directors, their meetings and Familiarisation Programme
AnnualReport2015-16

10. Subsidiary Monitoring Framework
11. Related Party Transactions
12. General Meetings:
AGM Financial Year Date of Meeting Location of the Meeting Time
* Chairman of the Audit Committee could not attend the Annual General Meeting.
Financial Year/ Date of Annual General Meeting
Subject
C
PolyplexCorporation Ltd.

Financial Year/ Date of Annual General Meeting
Subject
C
C
C
13. Disclosures :
appointment are given in the Notice convening the ensuing
AnnualReport2015-16

14. Company’s Website and its Policies with Weblinks:
a) Corporate Social Responsibility (CSR) Policy:
b) Nomination & Remuneration Policy:
c) Whistle Blower Policy (Policy on vigil mechanism)
d) Policy on Related Party Transactions:
e) Policy for determining ‘Material Subsidiaries’:
f) Code of Conduct for Board Members and Senior Management:
g) Familiarisation programme for Independent Directors:
h) Code of Conduct for Insider Trading/Code of Practices & Procedures for fair Disclosure of Unpublished Price Sensitive Information:
i) Code of Internal Procedures and Conduct for Regulating, Monitoring and Reporting of Trading by Insiders:
j) Policy for preservation and archival of documents:
16. Means of Communication
Declaration by the CEO pursuant to Para D to Schedule V of SEBI (Listing Obligations and Disclosure Requirements) Regulations, 2015 regarding adherence to the Code of Conduct.
Pranay Kothari
PolyplexCorporation Ltd.
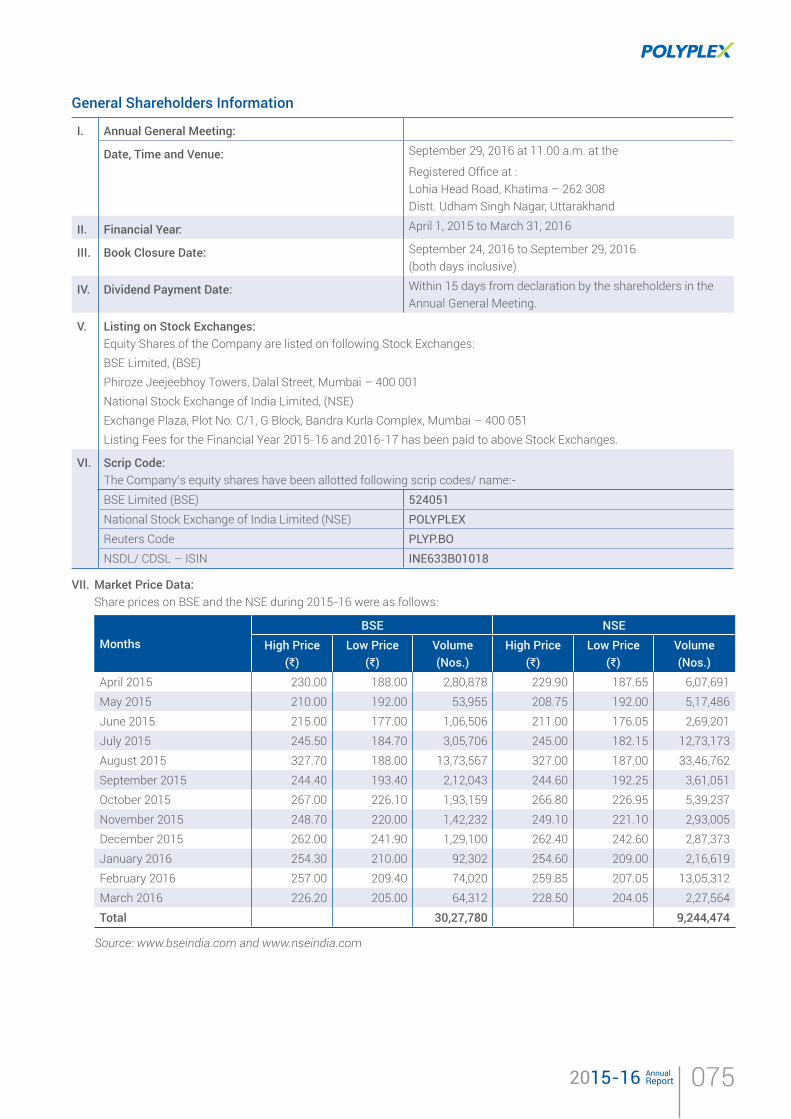
General Shareholders Information
I. Annual General Meeting:
Date, Time and Venue:
II. Financial Year:
III. Book Closure Date:
IV. Dividend Payment Date:
V. Listing on Stock Exchanges:
VI. Scrip Code:
524051
POLYPLEX
PLYP.BO
INE633B01018
VII. Market Price Data:
MonthsBSE NSE
High Price (D)
Low Price (D)
Volume (Nos.)
High Price (D)
Low Price (D)
Volume (Nos.)
Total 30,27,780 9,244,474
Source: www.bseindia.com and www.nseindia.com
AnnualReport2015-16

VIII. Stock Performance of the Company in comparison to NSE Nifty
Polyplex’s share price movement vs. NSE Nifty Index (2015-16)
IX. Registrars and Share Transfer Agents (RTA):
Karvy Computershare Private Limited
X. Share Transfer System:
XI. Distribution of Shareholding:
Shareholding in Number of Shares No. of Shareholders
% of total shareholders
Nominal Amount (in D)
% of Total Nominal Amount
Total 13,643 100.00 31,98,46,000 100.00
PolyplexCorporation Ltd.

Category Shares held (Nos.) Percentage of Shareholding1 Promoters
Sub Total 16,001,534 50.032 Non- Promoters
Sub-Total 1,59,83,066 49.97 Grand Total 3,19,84,600 100.00
XII. Dematerialisation of shares and liquidity
Particulars No. of shares % of Total Capital No. of Accounts
Physical
Grand Total 3,19,84,600 100.00 13,643
XIII.
XIV.
Particulars Number of shareholders Number of shares
1
AnnualReport2015-16

XV. Commodity price risk or foreign exchange risk and hedging activities:
XVI. Plant Locations
XVII. Investor Correspondence:
PolyplexCorporation Ltd.

AUDITORS’ COMPLIANCE CERTIFICATE ON CORPORATE GOVERNANCE
To The Members of Polyplex Corporation Limited
For LODHA & CO.Chartered Accountants
N.K. LODHAPartner
AnnualReport2015-16

080 PolyplexCorporation Ltd.
S TA N DA LO N EFINANCIAL STATEMENTS

081AnnualReport2015-16
Report on the Standalone Financial Statements
We have audited the accompanying Standalone Financial
Statements of Polyplex Corporation Limited (“the Company”),
which comprise the Balance Sheet as at 31st March, 2016, the
policies and other explanatory information.
Management’s Responsibility for the Financial Statements
The Company’s Board of Directors is responsible for the matters
stated in Section 134(5) of the Companies Act, 2013 (“the Act”)
with respect to the preparation and presentation of these
Standalone Financial Statements that give a true and fair view
of the Company in accordance with the accounting principles
generally accepted in India, including the Accounting Standards
also includes maintenance of adequate accounting records in
accordance with the provisions of the Act for safeguarding the
assets of the Company and for preventing and detecting frauds
and other irregularities; selection and application of appropriate
accounting policies; making judgments and estimates that
are reasonable and prudent; and design, implementation and
operating effectively for ensuring the accuracy and completeness
of the accounting records, relevant to the preparation and
presentation of the Financial Statements that give a true and fair
view and are free from material misstatement, whether due to
fraud or error.
Auditor’s Responsibility
Our responsibility is to express an opinion on these Standalone
Financial Statements based on our audit.
We have taken into account the provisions of the Act, the
accounting and auditing standards and matters which are
required to be included in the audit report under the provisions of
We conducted our audit in accordance with the Standards on
Standards require that we comply with ethical requirements
and plan and perform the audit to obtain reasonable assurance
misstatement.
An audit involves performing procedures to obtain audit evidence
about the amounts and the disclosures in the Financial Statements.
The procedures selected depend on the auditor’s judgment,
including the assessment of the risks of material misstatement of
statements that give a true and fair view in order to design audit
procedures that are appropriate in the circumstances. An audit
also includes evaluating the appropriateness of the accounting
policies used and the reasonableness of the accounting estimates
made by the Company’s Directors, as well as evaluating the
overall presentation of the Financial Statements.
and appropriate to provide a basis for our audit opinion on the
Opinion
In our opinion and to the best of our information and according to
the explanations given to us, the aforesaid Standalone Financial
Statements give the information required by the Act in the manner
so required and give a true and fair view in conformity with the
accounting principles generally accepted in India, of the State of
its Cash Flows for the year ended on that date.
Report on Other Legal and Regulatory Requirements
(“the Order”) issued by the Central Government of India in
terms of sub-section (11) of section 143 of the Act, and on
the basis of such checks of the books and records of the
Company as we considered appropriate and according to the
information and explanations given to us during the course of
audit, we give in the Annexure ‘A’ a statement on the matters
2. As required by Section 143 (3) of the Act, we report that:
(a) We have sought and obtained all the information and
explanations which to the best of our knowledge and
belief were necessary for the purposes of our audit.
Independent Auditor’s Report
To the Members of POLYPLEX CORPORATION LIMITED

082 PolyplexCorporation Ltd.
1. (a) The Company has maintained proper records showing
full particulars including quantitative details and
(b) The Company has a regular programme of Physical
a phased manner which in our opinion is reasonable
having regard to the size of the Company and the nature
(c) According to the information and explanations given to
us and on the basis of our examination of the records of
the Company, the title deeds of immovable properties are
2 of Note No. 11 of the Standalone Financial Statement.
2. The inventories of the Company (except stock lying with the
by the management at reasonable intervals. In our opinion,
by the Management are reasonable in relation to the size of
the Company and nature of its business. The discrepancies
compared to book records were not material.
3. The Company has granted unsecured loans to two body
(b) In our opinion, proper books of account as required by law
have been kept by the Company so far as it appears from
our examination of those books.
agreement with the books of account.
(d) In our opinion, the aforesaid Standalone Financial
Statements comply with the Accounting Standards
(e) On the basis of the written representations received from
the directors as on 31st March, 2016 and taken on record
by the Board of Directors, none of the directors is
as a director in terms of Section 164 (2) of the Act.
(f) As required by section 143(3) (i) of the Companies Act,
2013, and based on the checking of the books and
records of the Company as we considered appropriate
and according to the information and explanations given
to us, our report on the Internal Financial Controls over
(g) With respect to the other matters to be included in the
opinion and to the best of our information and according
to the explanations given to us:
i. The Company has disclosed the impact of pending
Statements.
ii. The Company has made provision, as required
under the applicable law or accounting standards,
for material foreseeable losses, if any; on long-term
iii. There has been no delay in transferring amounts,
required to be transferred, to the Investor Education
and Protection Fund by the Company.
For LODHA & CO.,
Chartered Accountants
N.K. Lodha
Place: New Delhi Partner
Date: May 30, 2016 Membership No.085155
Annexure “A” referred to in paragraph 1 under the heading “Report on other legal and regulatory requirements” of our report of even date on the Standalone Financial Statements of Polyplex Corporation Limited for the year ended 31st March 2016

083AnnualReport2015-16
corporates covered in the register maintained under Section
189 of the Companies Act, 2013 (‘the Act’).
(a) According to the information and explanations given to
us and based on the audit procedures conducted by us,
we are of the opinion that the terms and conditions of
loans granted by the company are not prejudicial to the
interest of the company.
(b) (i) In case of loan granted to a subsidiary company
listed in the register maintained, amount so granted
`996 Lacs (including `
been fully provided for in the books of accounts and
(ii) In respect of aforesaid loan to another company,
repayment of principal and payment of interest has
been stipulated, principal is not due for repayment
and receipt of interest on the said loan has been
fully received with some days delay.
(c) As principal and interest is not overdue for period over
90 days, we are not offering comments with respect to
4. According to the information, explanations and
representations provided by the management and based
upon audit procedures performed, we are of the opinion that
in respect of loans, investments, guarantees and security, the
Company has complied with the provisions of the Section
185 and 186 of the Companies Act, 2013.
5. In our opinion and according to the information and
explanations given to us, the Company has complied with
provisions of the Act and the rules framed there under (to
the extent applicable) with regard to deposits accepted
from public. We have been informed that no order has been
passed by the Company Law Board or National Company
Tribunal in this regard.
6. We have broadly reviewed the books of account maintained
by the company pursuant to the rules made by the Central
Government for the maintenance of cost records under
section 148(1) of the Act in respect of the company’s
products to which the said rules are made applicable and are
of the opinion that prima facie, the prescribed records have
been made and maintained. We have, however, not made
a detailed examination of the said records with a view to
determine whether they are accurate or complete.
is regular in depositing undisputed statutory dues
including Provident Fund, Employees’ State Insurance,
Income Tax, Sales-Tax, Service Tax, Duty of Customs,
Duty of Excise, Value Added Tax, Cess and other material
statutory dues with the appropriate authorities to the
extent applicable and there are no undisputed statutory
dues payable for a period of more than six months from
the date they become payable as at 31st March, 2016.
given to us, there are no dues in respect of income tax
that have not been deposited with the appropriate
authorities to the extent applicable on account of any
dispute and the dues in respect of service tax, duty of
customs, duty of excise and value added tax that have
not been deposited with the appropriate authorities on
account of any dispute and the forum where the dispute
is pending are given below: -
Name of the statute Nature of dues Period
(Financial Year)
Amount
(` in Lacs)
Forum where disputes are pending
Sale Tax Act Sale Tax 18.40
28.55 Deputy Commissioner (Appeal)
1998-1999 29.05 Deputy Commissioner (Appeal)
2008-2009 1.28 Tribunal
2009-2010 2.23
2010-2011
U.P. Tax on Entry of Goods Act Entry Tax 2001-2002 0.61 Tribunal
Central Excise Act, 1994 Excise Duty and Penalty 2009-2010 19.91 Additional Commissioner
Excise Duty and Penalty 2010-2011 9.22 CESTAT
Excise Duty 2010-2011 1.35 Assistant Commissioner
Excise Duty 2010-2015 1.42 Assistant Commissioner
The Finance Act,1994 Service Tax and Penalty 2009-2014 12.08 Commissioner (Appeal)

084 PolyplexCorporation Ltd.
8. In our opinion, on the basis of audit procedures and
according to the information and explanations given to us,
the Company has not defaulted in repayment of loans and
dues to debenture holders.
9. On the basis of information and explanations given to us,
term loans were applied for the purpose for which the loans
were obtained. No moneys have been raised during the year
by way of initial public offer or further public offer.
10. Based on the audit procedure performed and on the basis of
information and explanations provided by the management,
no fraud by the Company and no fraud on the Company by
the course of the audit.
11. According to the information and explanations given to
us and based on our examination of the records of the
Company, managerial remuneration has been paid/ provided
is in accordance with the requisite approvals mandated by
Financial Statement.
12. In our opinion and according to the information and
explanations given to us, the Company is not a Nidhi
company. Accordingly, paragraph 3(xii) of the Order is not
applicable.
13. According to the information and explanations and records
made available by the management of the Company and
audit procedure performed, for transactions with the related
parties during the year, the Company has complied with
applicable. As explained and as per records, details of related
party transactions have been disclosed in the standalone
Standards.
14. According to the information and explanations given to us,
the Company has not made any preferential allotment or
private placement of shares or fully or partly convertible
debentures during the year. Accordingly, we are not offering
any comment with respect to compliance of requirement of
Section 42 of the Act and utilisation of the money.
15. On the basis of records made available to us and according
to information and explanations given to us, the Company
has not entered into non-cash transactions with the directors
or persons connected with them. Accordingly, we are not
offering any comment with respect to compliance of Section
192 of the Act.
16. The Company is not required to be registered under section
For LODHA & CO.,
Chartered Accountants
N.K. Lodha
Place: New Delhi Partner
Date: May 30, 2016 Membership No.085155
Report on the Internal Financial Controls over Financial
Reporting under Clause (i) of Sub-section 3 of Section 143 of
the Companies Act, 2013 (“the Act”)
as of March 31, 2016 in conjunction with our audit of the
Standalone Financial Statements of the Company for the year
ended on that date.
Management’s Responsibility for Internal Financial Controls
The Company’s management is responsible for establishing
Company considering the essential components of internal
control stated in the Guidance Note on Audit of Internal Financial
Chartered Accountants of India (ICAI). These responsibilities
ANNEXURE ‘B’ TO THE INDEPENDENT AUDITOR’S REPORT OF EVEN DATE ON THE STANDALONE FINANCIAL STATEMENTS OF POLYPLEX CORPORATION LIMITED

085AnnualReport2015-16
include the design, implementation and maintenance of adequate
including adherence to Company’s policies, the safeguarding of
its assets, the prevention and detection of frauds and errors, the
accuracy and completeness of the accounting records, and the
under the Companies Act, 2013.
Auditor’s Responsibility
Our responsibility is to express an opinion on the Company’s
audit. We conducted our audit in accordance with the Guidance
Note on Audit of Internal Financial Controls Over Financial
issued by ICAI and deemed to be prescribed under Section
143(10) of the Companies Act, 2013, to the extent applicable to
of Internal Financial Controls and, both issued by the Institute
of Chartered Accountants of India. Those Standards and the
Guidance Note require that we comply with ethical requirements
and plan and perform the audit to obtain reasonable assurance
reporting was established and maintained and if such controls
operated effectively in all material respects.
Our audit involves performing procedures to obtain audit evidence
exists, and testing and evaluating the design and operating
effectiveness of internal control based on the assessed risk.
The procedures selected depend on the auditor’s judgement,
including the assessment of the risks of material misstatement
and appropriate to provide a basis for our audit opinion on the
reporting.
Meaning of Internal Financial Controls Over Financial Reporting
a process designed to provide reasonable assurance regarding
statements for external purposes in accordance with generally
procedures that (1) pertain to the maintenance of records that, in
reasonable detail, accurately and fairly reflect the transactions and
dispositions of the assets of the company; (2) provide reasonable
assurance that transactions are recorded as necessary to
generally accepted accounting principles, and that receipts and
expenditures of the company are being made only in accordance
with authorizations of management and directors of the company;
and (3) provide reasonable assurance regarding prevention or
timely detection of unauthorized acquisition, use, or disposition
of the company’s assets that could have a material effect on the
Inherent Limitations of Internal Financial Controls Over Financial
Reporting
or improper management override of controls, material
misstatements due to error or fraud may occur and not be
detected. Also, projections of any evaluation of the internal
reporting may become inadequate because of changes in
conditions, or that the degree of compliance with the policies or
procedures may deteriorate.
Opinion
In our opinion, the Company has, in all material respects, an
reporting were operating effectively as at March 31, 2016, based
by the Company considering the essential components of internal
control stated in the Guidance Note on Audit of Internal Financial
Chartered Accountants of India.
For LODHA & CO.,
Chartered Accountants
N.K. Lodha
Place: New Delhi Partner
Date: May 30, 2016 Membership No.085155

086 PolyplexCorporation Ltd.
Balance Sheet as at 31st March 2016
As per our report of even date attached For and on behalf of the Board of Directors
For Lodha & Co. Chartered Accountants Sanjiv Saraf Pranay Kothari Brij Kishore Soni
Chairman Executive Director Director DIN: 00003998 DIN: 00004003 DIN: 00183432N. K. Lodha Partner Manish Gupta Ashok Kumar GurnaniMembership No. 085155
Place: New Delhi Place: NoidaDate: May 30, 2016 Date: May 30, 2016
Particulars Note No.
As at31 March, 2016
As at31 March, 2015
I. EQUITY AND LIABILITIES
Shareholder's Funds
Share Capital 2 3,256.32 3,256.32
3 39,845.34 38,081.81
Non Current Liabilities
Long Term Borrowings 4 9,232.93
Deferred Tax Liabilities (Net) 5
Long Term Provisions 6 163.33 136.11
Current Liabilities
Short Term Borrowings 3,366.98 6,909.53
Trade Payables 8 1,281.15 1,023.03
Other Current Liabilities 9 10,214.68
Short Term Provisions 10 948.02
TOTAL 68,101.79 79,117.85
II. ASSETS
Non Current Assets
Fixed Assets
Tangible Assets 11 41,589.05
Intangible Assets 11 13.12 15.38
Capital Work-in-Progress 219.34
Non Current Investments 12 1,951.43 1,951.43
Long Term Loans and Advances 13 2,594.96 1,890.03
Current Assets
Current Investments 14 - 1,535.00
Inventories 15 8,992.52
16 6,860.64
523.04 981.16
Short Term Loans and Advances 18 5,133.66
Other Current Assets 19 224.03
TOTAL 68,101.79 79,117.85
(` in Lacs)

AnnualReport2015-16
for the year ended 31st March 2016
As per our report of even date attached For and on behalf of the Board of Directors
For Lodha & Co. Chartered Accountants Sanjiv Saraf Pranay Kothari Brij Kishore Soni
Chairman Executive Director Director DIN: 00003998 DIN: 00004003 DIN: 00183432N. K. Lodha Partner Manish Gupta Ashok Kumar GurnaniMembership No. 085155
Place: New Delhi Place: NoidaDate: May 30, 2016 Date: May 30, 2016
Particulars Note No.
Year ended31 March, 2016
Year ended31 March, 2015
20 100,116.48 110,694.15
Less: Excise Duty 5,491.23
I Revenue from Operations (Net) 105,202.92
II Other Income 21 1,831.51
III Total Revenue (I + II) 96,932.27 106,949.55
IV Expenses
Cost of Materials Consumed 22 64,480.64
Changes in Inventories 23 346.06 1,529.41
24 4,801.83
Finance Costs 25 1,620.42
Depreciation and Amortisation 6,464.82
Other Expenses 26 14,449.16 15,326.64
Total Expenses 93,440.01 104,665.81
V 3,492.26 2,283.74
996.00 -
VII 2,496.26 2,283.74
VIII Tax Expense
MAT Credit (381.81)
Deferred Tax (524.96) 193.05
Prior Period Adjustment - Tax (16.13) -
Total (198.92) 289.92
IX 2,695.18 1,993.82
X Earnings Per Equity Share
Basic (in `) 8.43 6.23
Diluted (in `) 8.43 6.23
(` in Lacs)

088 PolyplexCorporation Ltd.
Cash Flow Statement for the year ended 31st March 2016
2015-16 2014-15
2,496.26 2,283.74
Adjustments For :
Depreciation 6,464.82
Provision for Doubtful Debts / Bad Debts Written Off - -
Interest 1,620.42
Unrealised Foreign Exchange (Gain) / Loss (0.45) 41.65
Excess Provision / Sundry Balances Written Back (Net) (82.84) (28.13)
2.34
Asset Written Off 6.04 3.95
(22.63)
(424.41) (498.14)
(1,048.93) (651.94)
8,204.53 10,430.77
Adjustments For :
4,391.22 631.40
Inventories 483.32
Trade and Other Payables 1,103.15 205.12 3,814.68
Cash Generated From Operations 14,182.22 14,245.45
Taxes Paid (802.11) (432.44)
Cash Flow Before Exceptional Items 13,380.11 13,813.01
Exceptional Items 996.00 -
Net Cash From Operating Activities 14,376.11 13,813.01
Purchase of Fixed Assets (Incl Capital Advances) (4,310.94)
Sale of Fixed Assets
(146.00)
Purchase of Short Term Investments (63,625.00)
- 2.50
Sale of Short Term Investments 62,632.63
1,401.84
Net Cash Used in Investing Activities 900.89 (4,251.06)
(` in Lacs)

089AnnualReport2015-16
Cash Flow Statement for the year ended 31st March 2016
2015-16 2014-15
Net Proceeds From Long Term Borrowings (6,332.09)
Net Proceeds From Short Term Borrowings (453.40)
Interest Paid
Dividends Paid (801.81) (638.92)
- -
Net Cash Used In Financing Activities (15,735.12) (9,098.24)
Net Increase in Cash And Cash Equivalents (458.12) 463.71
Cash and Cash Equivalents at the beginning of the year 860.35 399.12
Other Bank Balances at the beginning of the year 120.81 118.33
Total Cash And Bank Balances at the beginning of the year 981.16 517.45
Cash and Cash Equivalents at the end of the year 406.52 860.35
Other Bank Balances at the end of the year 116.52 120.81
Total Cash and Bank Balances at the end of the year 523.04 981.16
(` in Lacs)
NOTE:
As per our report of even date attached For and on behalf of the Board of Directors
For Lodha & Co. Chartered Accountants Sanjiv Saraf Pranay Kothari Brij Kishore Soni
Chairman Executive Director Director DIN: 00003998 DIN: 00004003 DIN: 00183432N. K. Lodha Partner Manish Gupta Ashok Kumar GurnaniMembership No. 085155
Place: New Delhi Place: NoidaDate: May 30, 2016 Date: May 30, 2016

090 PolyplexCorporation Ltd.
Notes to Financial Statements for the year ended 31st March 2016
Basis of Accounting
cost convention on the accrual basis. Insurance/Other Claims are recognised only when it is reasonably certain that the ultimate
collection will be made. GAAP comprises mandatory accounting standards as prescribed under Section 133 of the Companies Act,
issued by the Securities and Exchange Board of India (SEBI). Accounting policies have been consistently applied except where a newly
issued accounting standard is initially adopted or a revision to an existing accounting standard requires a change in the accounting
policy hitherto in use.
Revenue Recognition
under the term of contract, usually on the delivery of the goods.
company and the revenue can be reliably measured with the reasonable certainty of its recovery.
included in the turnover.
Fixed Assets/Capital work in progress
I. Fixed Assets are stated at cost of acquisition less accumulated depreciation and impairment loss, if any. All realized and unrealized
assets on completion of construction / erection.
Intangible Assets
and the cost of the asset can be measured reliably.
Borrowing Costs
Borrowing costs attributable to acquisition / construction of qualifying assets are capitalised with the respective assets, till the date of
Investments
Long-term investments are stated at cost less provision for permanent diminution in the value of such investments. Current investments
are stated at lower of cost and net realisable value.
Depreciation / Amortisation
prescribed in Schedule II to the Companies Act, 2013 except for Plant and Machinery running on continuous process basis, where based
on internal assessment and independent technical evaluation carried out by external valuer the management believes that the useful
different from the useful lives as prescribed under Part C of Schedule II of the Companies Act 2013.
Polyester resin plant has been considered as continuous process as per technical assessment.
Intangible assets are amortised over the period of its useful life on Written Down Value Method (WDV) basis.
Foreign Currency Transactions
Foreign currency transactions are accounted at exchange rate on the date of transaction.
Monetary assets and liabilities relating to foreign currency transactions are stated at exchange rate prevailing at the end of the year and
term foreign currency monetary items for depreciable assets are capitalized
Gains / losses on foreign exchange derivative contracts like structured options, forward and swap to hedge interest rate risk and
(including gain / loss on rollover charges) cost of the assets.
Note:1 SIGNIFICANT ACCOUNTING POLICIES

091AnnualReport2015-16
Notes to Financial Statements for the year ended 31st March 2016
Investment in equity shares of foreign subsidiary companies are stated at the exchange rate as on transaction date. Unrealised Gain/
Loss relating to translation of net investment in form of monetary items in non integral operations are recognised in the Foreign Currency
Expenditure incurred on Research & Development
assets.
Inventories
Inventories are valued as follows: -
Cost for the purpose of valuation has been determined as under: -
(ii) Finished Goods and Stock in Process are valued at cost of conversion and other cost incurred in bringing the inventories to present
location and condition.
and charged as expenses during the period in which the employees perform the services.
Gratuity is funded through a trust for which a policy with Life Insurance Corporation of India has been taken.
Government Grants
Grants relating to Fixed Assets are shown as deduction from the gross value of the Fixed Assets and those of the nature of Project
related expenses.
Provision for Tax
Current tax is determined as the amount of tax payable in respect of estimated taxable income for the year and in accordance with the
provisions as per Income Tax Act 1961. Deferred tax is recognised using the enacted / subsequently enacted tax rates and laws as on
the Balance Sheet date, subject to the consideration of virtual/reasonable certainty of realisation in respect of deferred tax assets, on
all timing differences, between taxable income and accounting income that originate in one period and are capable of reversal in one or
more subsequent periods.
Leases
ownership of the leased item, are capitalised at the lower of the fair value and the present value of the minimum lease payments at the
the reduction of lease liability so as to achieve a constant rate of interest on the remaining balance of the liability. Finance charges are
charged directly against income.
Lease arrangement where the risks and rewards are incidental to ownership of an asset substantially vest with the lessor are recognised
Impairment
The carrying amount of the Company’s assets, are reviewed at each balance sheet date to determine whether there is any indication of
impairment of asset.
Note:1 SIGNIFICANT ACCOUNTING POLICIES

092 PolyplexCorporation Ltd.
Notes to Financial Statements for the year ended 31st March 2016
An impairment loss is recognised whenever the carrying amount of an asset exceeds its recoverable amount. The recoverable amount
is greater of Net selling price and value in use.
of Impairment loss recognised in prior periods is recorded when there is an indication that the impairment losses recognised from the
assets no longer exists or have deceased.
Provisions, Contingent Liabilities and Contingent Assets
A provision is made/ recognised, based on the management estimate required to settle the obligation at balance sheet date, when
required to settle the obligation. Contingent liabilities, if material, are disclosed by way of notes. Contingent assets are not recognised
or disclosed in the Financial Statement.
Note:1 SIGNIFICANT ACCOUNTING POLICIES
Particulars As at
31st March, 2016
As at
31st March, 2015
Authorised
3,40,00,000 (Previous Year - 3,40,00,000) Equity Shares of `10 each 3,400.00 3,400.00
Issued and Subscribed
3,31,80,300 (Previous Year - 3,31,80,300) Equity Shares of `10 each 3,318.03 3,318.03
Issued, Subscribed and Fully Paid-up
3,19,84,600 (Previous Year - 3,19,84,600) Equity Shares of `10 each 3,198.46 3,198.46
Add: Forfeited shares (Amount originally paid up)
TOTAL 3,256.32 3,256.32
Note:2 SHARE CAPITAL (` in Lacs)
Particulars No. of shares No. of shares
Shares outstanding as at the beginning of the year 31,984,600 31,984,600
Additions during the year - -
Shares outstanding as at the end of the year 31,984,600 31,984,600
RECONCILIATION OF NUMBER OF SHARES
Particulars As at
31st March, 2016
No. of shares
As at
31st March, 2015
No. of shares
Secure Investments Limited
SHAREHOLDERS HOLDING MORE THAN 5% SHARES
RIGHTS ATTACHED TO THE SHARES
The Company has only one class of Equity Shares of par value of ` 10/- per share. Each holder of Equity Share is entitled to one vote
approval of shareholders in ensuing Annual General Meeting.
In the event of liquidation of the Company, the holder of Equity Shares will be entitled to receive remaining assets of the Company after
distribution of all preferential amount and the remaining balance is distributed in proportion to the number of equity shares held by the
Equity Shareholders.
AGGREGATE NUMBER OF EQUITY SHARES ALLOTED AS FULLY PAID UP BY WAY OF BONUS SHARES
2015-16 2014-15 2013-14 2012-13 2011-12 2010-11
- - - - - 15,992,300

093AnnualReport2015-16
Notes to Financial Statements for the year ended 31st March 2016
Particulars As at
31st March, 2016
As at
31st March, 2015
Capital Reserve
Central Investments Subsidy 85.00 85.00
State Investments Subsidy 30.00 30.00
Share Warrants Forfeited 250.80 250.80
Sub Total (a) 365.80 365.80
Securities Premium Reserve
As per last Balance Sheet 2,348.20 2,348.20
Sub Total (b) 2,348.20 2,348.20
General Reserve
As per last Balance Sheet 5,485.58 5,286.20
269.52 199.38
Sub Total (c) 5,755.10 5,485.58
Balance Brought Forward 29,882.23 28,806.59
Add:
2,695.18 1,993.82
Corporate Dividend Tax - Proposed Dividend - Written Back
Less:
269.52 199.38
Proposed Dividend 959.54
Corporate Dividend Tax - Proposed Dividend -
31,376.24 29,882.23
TOTAL (a + b + c + d) 39,845.34 38,081.81
Note: 3 (` in Lacs)
Particulars As at
31st March, 2016
As at
31st March, 2015
Secured Term Loans From Banks
-
Foreign Currency Term Loan 14,566.44 20,683.85
Sub Total (a) 14,566.44 25,371.35
Less: Current Portion
- 1,250.00
Foreign Currency Term Loan 5,333.51
Sub Total (b) 5,333.51 7,441.71
TOTAL (a - b) 9,232.93 17,929.64
Note: 4 LONG TERM BORROWINGS (` in Lacs)
Loan Amount
(` in Lacs)
No of Equal
Installments
Frequency Period
From To
6,586.80 5 Semi Annual 2018-19
3,149.66 9 Quarterly 2018-19
4,829.98 11 @ Quarterly 2018-19
` `425.00 Lacs quarterly, FY 2018-19: ` ` 829.98 Lacs in 3rd quarter.
Loans are repayable as under:
Loans are secured as under:
The Foreign Currency Term Loan of ` 14,566.44 Lacs (Previous year: ` ` Nil (Previous year:
` basis by hypothecation / equitable mortgage in respect of Company’s movable / immovable

094 PolyplexCorporation Ltd.
Notes to Financial Statements for the year ended 31st March 2016
Particulars As at
31st March, 2016
As at
31st March, 2015
Deferred Tax Asset
Disallowance as per Income Tax Act (465.00)
Deferred Tax Liability
Disallowance on account of Depreciation
TOTAL 93.76 618.71
Note: 5 DEFERRED TAX LIABILITIES (NET) (` in Lacs)
Particulars As at
31st March, 2016
As at
31st March, 2015
163.33 136.11
TOTAL 163.33 136.11
Note: 6 (` in Lacs)
Particulars As at
31st March, 2016
As at
31st March, 2015
Secured Loans *
Working Capital Demand Loans from Banks 5,083.15
Bank CC Account 448.40
Buyer's Credit 188.30
TOTAL 3,366.98 6,909.53
Note: 7 SHORT TERM BORROWINGS (` in Lacs)
` 3,366.98 Lacs (Previous Year
` 6,909.53 Lacs) are secured / to be secured by way of hypothecation of inventories, book debts and other current assets both present
Particulars As at
31st March, 2016
As at
31st March, 2015
Total Outstanding due to
- -
1,281.15 1,023.03
TOTAL 1,281.15 1,023.03
Note: 8 TRADE PAYABLES (` in Lacs)
Particulars As at
31st March, 2016
As at
31st March, 2015
Current Maturity of Long Term Debt 5,333.51
Interest accrued but not due on borrowings 46.44 96.16
Unclaimed Dividend 114.31 116.50
113.84 141.36
Statutory Liabilities 312.68 234.81
Advance from Customers (including related party) 939.18 869.35
Creditors for Capital Expenditure 13.18 11.62
Other liabilities
TOTAL 9,750.11 10,214.68
Note: 9 OTHER CURRENT LIABILITIES (` in Lacs)

095AnnualReport2015-16
Notes to Financial Statements for the year ended 31st March 2016
Particulars As at
31st March, 2016
As at
31st March, 2015
Provision for Wealth Tax -
152.33
Proposed Dividend 959.54
Corporate Dividend Tax -
TOTAL 1,111.87 948.02
Note: 10 (` in Lacs)
Note: 11 FIXED ASSETS (` in Lacs)
Particulars
Gross Block Depreciation/ Amortisation Net Block
As At
01.04.2015
Additions
during the
year
Sale /
adjustments
As at
31.3.2016
As at
01.04.2015
For the
year
Sale /
adjustments
As At
31.03.2016
As At
31.03.2016
As at
31.3.2015
Tangible Assets
Freehold Land 1,693.09 - - 1,693.09 - - - - 1,693.09 1,693.09
Leasehold Land 493.33 - - 493.33 108.09 5.93 - 114.02 385.24
Buildings 164.49 - 13,869.04 4,488.30 668.55 - 5,156.85 9,216.25
1,656.40 58.38 42,986.89 5,386.66 48,354.18 29,901.46
Electrical Installations 2.01 14.43 2,095.49 1,433.05 211.04 1,635.34 460.15
458.81 9.82 456.50 26.88 102.04
105.56 1,186.04 836.63 913.83 301.29
Vehicles 6.82 0.11 155.02 32.34 0.09 89.93
Total 96,523.72 1,942.79 140.18 98,326.33 50,364.75 6,462.57 90.04 56,737.28 41,589.05 46,158.97
Previous Year 4,580.92 -
Intangible Assets
Computer Software 140.50 - - 140.50 125.12 2.26 - 13.12 15.38
Total 140.50 - - 140.50 125.12 2.26 - 127.38 13.12 15.38
Previous Year 131.84 8.66 - 140.50 5.40 - 125.12 15.38 -
Grand Total - Current Year 96,664.22 1,942.79 140.18 98,466.83 50,489.87 6,464.83 90.04 56,864.66 41,602.17 46,174.35
Grand Total - Previous Year 4,589.58 96,664.22 43,541.50 -
Notes :
1. Freehold Land costing ` `
2. Additions to Freehold Land during the Previous year 2014-15 amounting to ̀ 28.69 Lacs represents payment made for 0.316 hectare
of land acquired pending transfer to concerned authorities in exchange.
` 1,124.61 Lacs (Previous Year: Gain of `
` 3,031.45
Lacs).
` Nil (Previous Year: ` 235.03 Lacs) on account of Interest on Loans.
5. Specialized software under Intangible assets is amortised over useful life i.e. over the period of 5 years.

096 PolyplexCorporation Ltd.
Notes to Financial Statements for the year ended 31st March 2016
Particulars As at 31st March, 2016 As at 31st March, 2015No. of shares (` in Lacs) No. of shares (` in Lacs)
(At Cost less Provision)Long Term Investments(Other Than Trade)Unquoted - Equity / Ordinary Shares(Fully Paid up unless otherwise stated)
Investment in Subsidiary CompaniesPolyplex (Asia) Pte Ltd (common stock, no par value) 100,000 463.83 100,000 463.83 Sub Total (a) 463.83 463.83
Quoted - Equity / Ordinary Shares(Fully Paid up unless otherwise stated)
Investment in Subsidiary CompaniesPolyplex (Thailand) Public Company Limited * (Face Value: Baht 1)
132,000,000 132,000,000
Sub Total (b) 1,487.60 1,487.60 TOTAL (a + b) 1,951.43 1,951.43
Note:Aggregate of Unquoted Investments (At Cost less Provisions) 463.83 463.83 Aggregate of Quoted Investments (At Book Value) (At Market Value) 16,112.38
Note: 12
Particulars As at 31st March, 2016 As at 31st March, 2015No. of units (` in Lacs) No. of units (` in Lacs)
(Other than Trade)
(Quoted)
Mutual Funds
Pramerica Liquid Fund - Growth Option - - 102,826 1,535.00
TOTAL - 1,535.00
Aggregate of Quoted Investments (At Book Value) - 1,535.00
(At Market Value) - 1,536.10
Note: 14
Particulars As at 31st March, 2016
As at 31st March, 2015
Capital advances to vendors 21.28
Security Deposits 654.40
MAT Credit Entitlement
TOTAL 2,594.96 1,890.03
Note: 13 (` in Lacs)
Particulars As at 31st March, 2016
As at 31st March, 2015
(at lower of cost or net realisable value)
` ` 4,483.15
Stock in Process 1,153.59
Finished Goods (incl stock in transit of ` ` 1,018.64 Lacs) 2,332.35 2,244.22
1,456.12 1,361.51
TOTAL 8,992.52 9,475.84
Note: 15 (` in Lacs)

AnnualReport2015-16
Notes to Financial Statements for the year ended 31st March 2016
Particulars As at
31st March, 2016
As at
31st March, 2015
(Unsecured, considered good unless otherwise stated)
Debts outstanding for a period exceeding six months from the due date
Considered good 10.54 15.62
31.95 31.95
Less: Provision for Doubtful Debts (31.95) (31.95)
Other Debts
Considered good 6,850.10 10,363.63
TOTAL 6,860.64 10,379.25
Note: 16 (` in Lacs)
Particulars As at
31st March, 2016
As at
31st March, 2015
(Unsecured, considered good unless otherwise stated)
2,496.25
Advances to Vendors and Others 1,119.89
346.40
Prepaid Expenses 193.24 230.82
Intercorporate Deposits - 500.00
39.26 51.24
Advance Tax (Net of Provisions) 438.50 341.19
424.81
TOTAL 5,133.66 6,484.07
Note: 18 (` in Lacs)
Particulars As at
31st March, 2016
As at
31st March, 2015
Cash and Cash Equivalents
Cash on hand 10.13
Cheques in hand 83.16 -
Bank balance with scheduled banks
Current Accounts 313.23
Fixed Deposits with origin less than three months - 52.00
Sub Total (a) 406.52 860.35
Earmarked Balances with Banks
Unclaimed Dividend Accounts 114.31 116.50
Sub Total (b) 114.31 116.50
Other Bank Balances
Fixed Deposits (Lien with Banks) 2.21 4.31
Sub Total (c) 2.21 4.31
TOTAL (a + b + c) 523.04 981.16
Note: 17 (` in Lacs)
Particulars As at
31st March, 2016
As at
31st March, 2015
33.41
190.31
TOTAL 224.03 178.88
Note: 19 OTHER CURRENT ASSETS (` in Lacs)

098 PolyplexCorporation Ltd.
Notes to Financial Statements for the year ended 31st March 2016
Particulars Year ended
31st March, 2016
Year ended
31st March, 2015
Sales
Plastic Film 93,995.25
4,592.83 11,945.48
Others
Sub Total (a) 99,735.84 110,495.57
Other Operating Income
Liabilities Written Back 82.84 28.13
Sub Total (b) 380.64 198.58
TOTAL (a + b) 100,116.48 110,694.15
Note: 20 (` in Lacs)
Particulars Year ended
31st March, 2016
Year ended
31st March, 2015
250.88 315.94
22.63
Dividend Income 1,048.93 651.94
Foreign Exchange Fluctuation (Net) 62.02 153.90
Interest Income 424.41 498.14
Other Income / Claims 15.90 104.08
TOTAL 1,831.51 1,746.63
Note: 21 OTHER INCOME (` in Lacs)
Particulars Year ended
31st March, 2016
Year ended
31st March, 2015
Particulars of Material Consumed
Petrochemicals
(PTA, MEG, Polypropylene)
Packing Material
3,539.62 4,199.09
TOTAL 64,480.64 73,698.58
Material consumed
Imported (Value) 2,648.62 5,245.02
Imported (%) 4.11
Domestic (Value) 61,832.02 68,453.56
Domestic (%) 95.89 92.88
TOTAL (value) 64,480.64 73,698.58
TOTAL (%) 100.00 100.00
Particulars Year ended
31st March, 2016
Year ended
31st March, 2015
61,812.88
Packing Material
TOTAL 64,480.64 73,698.58
Note: 22 COST OF MATERIALS CONSUMED (` in Lacs)

099AnnualReport2015-16
Notes to Financial Statements for the year ended 31st March 2016
Particulars Year ended 31st March, 2016
Year ended 31st March, 2015
Opening StockFinished Goods 2,244.22 3,052.89
360.01 1,130.36 Stock in Process - Chips
4,965.05 Closing Stocks
Finished Goods 2,332.35 2,244.22 259.21 360.01
Stock in Process - Chips 461.69 3,053.25
Add : Increase / (Decrease) in Excise Duty on Stocks 1.50 Net Changes in Inventories 346.06 1,529.41
Note: 23 (` in Lacs)
Particulars Year ended 31st March, 2016
Year ended 31st March, 2015
Interest Expense 644.99 Other Borrowing Cost 286.68 TOTAL 821.07 1,620.42
Note: 25 FINANCE COSTS (` in Lacs)
Particulars Year ended 31st March, 2016
Year ended 31st March, 2015
Salaries, Wages, Bonus etc 5,890.84 4,035.52 Contribution to Provident and other Funds 491.24 415.04 Staff Welfare Expenses 496.18 TOTAL 6,878.26 4,801.83
Note: 24 EMPLOYEE BENEFITS EXPENSE (` in Lacs)
Particulars Year ended
31st March, 2016
Year ended
31st March, 2015
Stores & spares consumed
Imported (Value) 520.65
Imported (%) 33.18 30.86
Domestic (Value) 1,048.54 1,204.22
Domestic (%) 66.82 69.14
Total (value) 1,569.19 1,741.76
Total (%) 100.00 100.00
Particulars Year ended 31st March, 2016
Year ended 31st March, 2015
Manufacturing Expenses 2.02 -
Stores and Spares Consumed 1,569.19 Power and Fuel 5,824.86
Building 128.40 153.63 Plant and Machinery 188.31 Sub Total (a) 7,643.05 7,937.37
Note: 26 OTHER EXPENSES (` in Lacs)

100 PolyplexCorporation Ltd.
Notes to Financial Statements for the year ended 31st March 2016
Particulars Year ended 31st March, 2016
Year ended 31st March, 2015
Administrative Expenses 141.51
Insurance 254.94 340.26 Directors' Commission 28.00 25.00 Directors' Sitting Fee 11.00 Other Administrative Expenses 2,689.20 Sub Total (b) 2,900.86 3,253.02
Selling expensesFreight 3,331.03 Other Selling Expenses 482.05 Sub Total (c) 3,813.08 4,072.46
Other ExpensesAsset Written Off 6.04 3.95 Loss on Sale of Fixed Assets (Net) 2.34 56.55 Donation 8.25 1.10
2.19 Sub Total (d) 92.17 63.79
TOTAL (a + b + c + d) 14,449.16 15,326.64
Note: 26 OTHER EXPENSES (contd...) (` in Lacs)
Note: 27 OTHER EXPLANATORY NOTES
A. Estimated amount of contracts remaining to be executed on capital account and not provided for (Net of Advances of ̀
(Previous Year: ` 21.28 Lacs)) ` 1,640.33 Lacs. (Previous Year: ` 130.36 Lacs).
B. Contingent Liabilities not provided for and other commitments, in respect of:
i. Disputed matters under litigation:
ii. Bills discounted with banks ` 422.12 Lacs (Previous Year: ` Nil).
iii. Custom duty saved amounting to ` ` 2,639.24 Lacs) in respect of import of machinery under
iv. Guarantees given to the banks and others ` ` ` Nil (Previous Year: ` 2.00
Lacs) on behalf of other bodies corporate.
C. Export incentives amounting to ` `
D. The revenue expenditure of ̀ 441.39 Lacs (Previous Year: ̀ 256.28 Lacs) and capital expenditure of ̀ Nil (Previous Year: ̀
Particulars Current Year Previous Year
103.36
41.14 29.14
Service Tax 12.55 -
Income Tax 382.46
Others 25.36
(` in Lacs)

101AnnualReport2015-16
Note: 27 OTHER EXPLANATORY NOTES (contd...)
Notes to Financial Statements for the year ended 31st March 2016
E. i. As required by Section 22 of The Micro, Small and Medium Enterprises Development Act, 2006 the following information is
disclosed:
G. (i) Trade Receivables, Loans & Advances and Other Current Liabilities include the following:
Particulars Balance as atMarch 31, 2016
MaximumOutstandingCurrent Year
Balance as atMarch 31, 2015
MaximumOutstanding
Previous YearA. Subsidiaries / Step down subsidiaries
Loans & Advances against reimbursement of expensesPolyplex (Thailand) Public Company Ltd. - - 16.46Polyplex Europa Polyester Film Sanayi Ve Ticaret A.S. - 3.81 - 11.94
- - -Polyplex (Asia) Pte. Ltd. - - -Polyplex USA LLC - - - -EcoBlue Ltd. - 1.51 - 0.58Receivable / (Payable) against sale / purchase of materialPolyplex Trading (Shenzhen) Co. Ltd. 42.31 114.08Polyplex Europa Polyester Film Sanayi Ticaret A.S. 44.44 -Polyplex (Thailand) Public Company Ltd. -Polyplex USA LLC 3,818.86 3,333.31 3,333.31Polyplex Europa B V 16.12 620.50 493.99EcoBlue Ltd. 0.40 15.54 -
(` in Lacs)
F. Capital work in progress includes equipments not yet installed, construction / erection material, construction / erection work
in progress, machinery at site and / or in transit, advance to suppliers and other pre-operative expenses pending allocation /
capitalization. Pre-operative expenses pending allocation / capitalization are:Particulars As At
March 31, 2016As At
March 31, 2015Pre-operative expenses brought forward -
- 4.58- 2.23- 20.26
Insurance - 3.88Interest on Term Loan - 42.30
- 38.206.91 5.38
Total 6.91 716.55Less : Scrap Sales - 0.50
6.91 716.05Less : Allocated and Capitalised during the year -Balance Pending Allocation Transfer to Balance Sheet 6.91 -
(` in Lacs)
Sr. No Particulars 2015 - 16 2014 - 15a) i) Principal amount remaining unpaid at the end of the accounting year - -
ii) Interest due on above - -b) The amount of interest paid by the buyer along with amount of payment made
to the suppliers beyond the appointed date- -
c)year
- -
d) The amount of interest due and payable for the period of delay in making payment (which have been paid but beyond the due date during the year) but
- -
e) The amount of further interest due and payable in succeeding year, until such interest is actually paid.
- -
(` in Lacs)

102 PolyplexCorporation Ltd.
Notes to Financial Statements for the year ended 31st March 2016
Note: 27 OTHER EXPLANATORY NOTES (contd...)
G. (i) Trade Receivables, Loans & Advances and Other Current Liabilities include the following: (contd...)Particulars Balance as at
March 31, 2016
Maximum
Outstanding
Current Year
Balance as at
March 31, 2015
Maximum
Outstanding
Previous YearB. Others
Interest free Loans to Employees 169.44 202.26 148.11
(` in Lacs)
(ii) Details of Loan given covered under Section 186(4) of the Companies Act, 2013 :Name of the Company ` In Lacs PurposePeninsula Beverages and Foods Company Private Limited Business Operations
H.
Particulars Balance as at
March 31, 2016
Maximum
Outstanding
Current Year
Balance as at
March 31, 2015
Maximum
Outstanding
Previous YearLoans Given
Subsidiaries / Step down subsidiariesPeninsula Beverages and Foods Company Private
Limited
996.00 996.00 921.00 921.00
(` in Lacs)
ii. Exceptional Item for the year ended March 2016 represents provision of ` 996 Lacs towards outstanding balance of loan given
fully eroded.
` ` 44.22 Lacs).
I. Company has entered into operating lease agreement for a premise. Lease is non- cancellable for a period of six years and renewable
thereafter on mutually agreed terms.Particulars Current Year Previous Year
- 20.10
Minimum Lease Payments
- Not later than one year - -
- -
- -
(` in Lacs)
J. i. The Foreign Currency Exposure that are not hedged by a derivative instrument or otherwise are as follows:Particulars Document
CurrencyCurrent Year Previous Year
Amount (Fx)
Amount (` in Lacs)
Amount (Fx)
Amount (` in Lacs)
Loans - Long Term USD 9,586.53 21,246,9816,630,551
- - 210,000,000 1,115.31
Loans - Short Term USD 2,646.28 5,383.3463,000 2,165,299 1,462.02
Debtors USD 3,823,162 2,535.63 3,591.46480,496 800,356 540.24
Sundry Creditors USD 195,804 129.90 194,623 121.84
0.45 40,000 0.21
Other Liabilities USD 49.66 92,296666 0.50 - -

103AnnualReport2015-16
Notes to Financial Statements for the year ended 31st March 2016
Note: 27 OTHER EXPLANATORY NOTES (contd...)
ii. The Foreign Currency Exposure that are hedged by a derivative instrument or otherwise are as follows:Particulars Current Year Previous Year
Contract
Sell/Buy
Currency Amount
(Fx)
Contract Sell/
Buy
Currency Amount
(Fx)
Forward Contracts USD 1,000,000 USD 3,250,000
Forward Contracts 689,422 602,644
Forward Contracts USD USD -
SWAP Deal USD - USD 2,000,000
iii. The Company took certain option structure, forward and interest rate / currency swap contracts to cover the foreign exchange
risk related with the import of Fixed Assets. During the year, loss of ̀ Nil (Previous Year: ̀ 139.35) on foreign exchange derivatives
taken for payments to suppliers of imported capital goods and loss (net) of ` Nil (Previous Year: loss (net) of ` 209.32 Lacs)
on mark to market on outstanding derivatives as on March 31, 2016 has been capitalized / shown as part of pre-operative
expenses based on expert opinion, as the same is attributable to the Fixed Assets.
K. Payments to Auditors:Particulars Current Year Previous YearAudit Fee * 18.02 16.08
Tax Audit fee * 1.15 1.12
14.45 8.02
Out of Pocket Expenses 0.91 0.83
TOTAL 34.53 26.05
* includes Service Tax
(` in Lacs)
L. Expenditure in Foreign Currency:Particulars Current Year Previous YearConsultation Fees 13.21 36.44
Interest 536.62
Finance Charges 84.19
114.11 156.14
Others 218.49
TOTAL 924.46 1,227.44
(` in Lacs)
Particulars Current Year Previous Year3,263.10 5,045.09
Capital Goods 254.88 1,132.88
TOTAL 4,188.25 6,904.09
(` in Lacs)
N. Dividend remitted in Foreign Currency:Particulars Current Year Previous YearFinal Dividend w.r.t. F.Y. 2014-15 w.r.t. F.Y. 2013-14
Amount of Dividend (` in Lacs) 328.95 263.16
2 2
13,158,134 13,158,134
M. Earnings in Foreign Currency:Particulars Current Year Previous Year
` 139.59 Lacs) 23,349.24
Dividend (Gross) from Subsidiary Companies 1,048.93 651.94
TOTAL 25,389.67 24,001.18
(` in Lacs)

104 PolyplexCorporation Ltd.
Notes to Financial Statements for the year ended 31st March 2016
Note: 27 OTHER EXPLANATORY NOTES (contd...)
P.
Expenses pending allocation are as under:
obligation is determined based on actuarial valuation using the Projected Unit Credit Method, which recognises each period of
obligation. The obligation for leave encashment is recognised in the same manner as gratuity.
Particulars Current Year Previous YearEmployer’s Contribution to Provident Fund 219.61
Employer’s Contribution to Superannuation Fund 60.06 58.62
(` in Lacs)
Particulars Gratuity Gratuity Leave Encashment
Leave Encashment
Funded Funded Non Funded Non Funded
Current Year Previous Year Current Year Previous Year
a) Reconciliation of Opening and Closing Balances of
644.56 431.88 145.61 102.12
Current Service Cost 19.12
Interest Cost 49.63 34.55 11.21
Actuarial (Gain) / Loss 134.43 21.90
(35.86) (28.13)
644.56 198.55 145.61
b) Reconciliation of Opening and Closing Balances of
Fair value of Plan Assets at beginning of the year 555.33 - -
Expected return on Plan Assets 53.86 44.26 - -
Actuarial (Gain) / Loss (2.69) - -
Employer Contribution - -
(35.86) - -
Fair value of Plan Assets at year end 555.33 - -
Fair Value of Plan Assets as at year end 555.33 - -
Present Value of Obligation as at year end 644.56 198.55 145.61
Net Assets/ (Liability) (89.23) (198.55) (145.61)
d) Expenses Recognized during the year :
Current Service Cost 19.12
Interest Cost 49.63 34.55 11.21
Expected return on Plan Assets (53.86) (44.26) - -
Actuarial (Gain) /Loss 146.06 21.90
208.15 193.82 58.36
e) Investment Details :
LIC Group Gratuity (Cash Accumulation) Policy 100% 100%
f) Actuarial assumptionMortality Table (L.I.C.) 1994 – 96
Ultimate1994 – 96 Ultimate
1994 – 96 Ultimate
1994 – 96 Ultimate
8.00% 8.00%
6.00%
(` in Lacs)

105AnnualReport2015-16
Notes to Financial Statements for the year ended 31st March 2016
Note: 27 OTHER EXPLANATORY NOTES (contd...)
The estimates of rate of escalation in salary considered in actuarial valuation take into account inflation, seniority, promotion and
Particulars As at 31st March
2016 2015 2014 2013 2012
Gratuity
Obligations at year end 644.56 431.88 351.26 322.51
Plan Assets at year end, at fair value 555.33 452.48 449.26
Funded Status (25.79) (89.23) 37.88 101.22 126.75
Actuarial (Gain) / Loss on:
Obligations 134.43 13.52 40.20
Plan Assets 2.69 1.20 3.13
Others
Obligations at year end 198.55 145.61 102.12
Actuarial (Gain) / Loss on Obligation 21.90 (2.00) (0.91)
(` in Lacs)
Q. Earnings Per Equity Share (EPS)
Particulars Unit Current Year Previous Year
(` in Lacs) 2,695.18 1,993.82
Weighted average number of equity shares considered as Denominator for
calculation of Basic EPS
(No.) 31,984,600 31,984,600
Weighted average number of equity shares considered as Denominator for
calculation of Diluted EPS
(No.) 31,984,600 31,984,600
Basic EPS (`) 8.43 6.23
Diluted EPS (`) 8.43 6.23
R.
Statements.
i. Parties where control exists
Subsidiary / Step down Subsidiaries a. Polyplex (Thailand) Public Co Limited (PTL)
b. Polyplex (Asia) Pte. Limited (PAPL)
c. Polyplex (Singapore) Pte. Limited (PSPL)
d. Polyplex Europa Polyester Film Sanayi Ve Ticaret A.S. (PE)
e. Polyplex USA LLC (PU)
f. Polyplex Trading (Shenzhen) Co. Ltd. (PTSL)
g.
h.
i. EcoBlue Ltd. (EL)
j. Peninsula Beverages and Food Company Private Limited (PBF)
k. Polyplex Europe B. V. (PEBV)
l. Polyplex Paketleme Çozumleri Sanayi Ve Ticaret A.S. (PPC)

106 PolyplexCorporation Ltd.
Notes to Financial Statements for the year ended 31st March 2016
ii. Other related parties with whom transactions have taken place during the year
Note: 27 OTHER EXPLANATORY NOTES (contd...)
Key Management Personnel (KMP) a. Mr. Sanjiv Saraf (Chairman)
b.
c.
d.
Relative of Key Management Personnel a.
Enterprises over which Key Management
Personnel, their relatives and major shareholders
a. Beehive Systems Private Limited
b. Manupatra Information Solutions Private Limited
c. Manupatra Publishing Private Limited
d. Altivolus Infotech Private Limited
e. Dalhousie Villa Private Limited
f.
g.
h.
i. Abohar Power Generation Private Limited
j.
k.
l.
m.
n.
o.
p. S. D. College Society (Lahore), New Delhi
iii. Nature of Transactions with Related Parties
S.
No.
Particulars Subsidiaries of
the Company
Key
Management
Personnel
Relative of
KMP
Enterprises
over which
influence exist
Total
1 Purchase of Material / Services - - 29.19 58.89
(28.92) ( - ) (26.19) (84.81)
2 - - -
(24.62) ( - ) ( - )
3 Sale of Material 8,828.65 - - - 8,828.65
( - ) ( - ) ( - )
4 Sale of Shares - - - - -
( - ) ( - ) ( - ) (2.50) (2.50)
5 - 544.98 - - 544.98
( - ) (368.30) ( - ) ( - ) (368.30)
6 Commission to Director - 28.00 - - 28.00
( - ) (25.00) ( - ) ( - ) (25.00)
Director's Sitting Fees - 21.40 - - 21.40
( - ) (11.00) ( - ) ( - ) (11.00)
8 Donation Given - - - 4.00 4.00
( - ) ( - ) ( - ) ( - ) ( - )
9 13.05 - - 126.60 139.65
(120.12) ( - ) ( - ) (134.38) (254.50)
10 Loan given during the Year - - -
(421.00) ( - ) ( - ) ( - ) (421.00)
11 1,048.93 - - - 1,048.93
(651.94) ( - ) ( - ) ( - ) (651.94)
(` in Lacs)

AnnualReport2015-16
Notes to Financial Statements for the year ended 31st March 2016
Note: 27 OTHER EXPLANATORY NOTES (contd...)
iii. Nature of Transactions with Related Parties
S. No.
Particulars Subsidiaries ofthe Company
Key Management
Personnel
Relative ofKMP
Enterprises over which
influence exist
Total
12 - - - 166.21 166.21
(83.21) ( - ) ( - ) (252.33) (335.54)
Outstanding at year end
13Goods / Services
1,568.64 - - 8.64
(3,902.55) ( - ) ( - ) (4.35) (3,906.90)
14expenses recovered
- - - 9.59 9.59
( - ) ( - ) ( - ) (3.12) (3.12)
15 Loan 996.00 - -
(921.00) ( - ) ( - ) (2,646.00)
16 - - 81.35 - 81.35
( - ) ( - ) ( - ) ( - ) ( - )
- - 20.25 5.00 25.25
( - ) ( - ) (20.25) (5.00) (25.25)
18 Deposits Payable - - - 4.66 4.66
( - ) ( - ) ( - ) (4.66) (4.66)
19 Payables - 28.00 -
( - ) (25.00) ( - ) (6.94) (31.94)
20 Investment in Equity / Preference Shares
1,951.43 - - - 1,951.43
(1,951.43) ( - ) ( - ) ( - ) (1,951.43)
(` in Lacs)
Disclosure of Material Transactions with related parties:
S. No.
Particulars Subsidiaries ofthe Company
KMP /Relative of
KMP
Enterprises over which
influence exist
1 Purchase of Material / Services
- -
( - ) ( - )
- -
( - ) ( - )
Dalhousie Villa Private Limited - -
( - ) ( - )
2 Services Rendered
Beehive Systems Private Limited - - 36.00
( - ) ( - ) (36.00)
- - 32.12
( - ) ( - )
Manupatra Information Solutions Private Limited - - 21.99
( - ) ( - ) (25.95)
- - 15.53
( - ) ( - ) ( - )
Altivolus Infotech Private Limited - - 15.96
( - ) ( - ) (15.96)
(` in Lacs)

108 PolyplexCorporation Ltd.
Notes to Financial Statements for the year ended 31st March 2016
Disclosure of Material Transactions with related parties:
S.
No.
Particulars Subsidiaries of
the Company
KMP /
Relative of
KMP
Enterprises
over which
influence exist
3 Sale of Material
Polyplex USA LLC 6,136.86 - -
( - ) ( - )
Polyplex Europa Polyester Film Sanayi Ve Ticaret A.S. - -
(2,526.84) ( - ) ( - )
4 Expenses Recovered
Beehive Systems Private Limited - - 36.44
( - ) ( - ) (36.63)
Altivolus Infotech Private Limited - - 33.29
( - ) ( - ) (49.33)
Manupatra Information Solutions Private Limited - - 19.89
( - ) ( - ) (16.00)
Private Limited - -
( - ) ( - )
5 Loan given during the Year
Peninsula Beverages and Foods Company Private Limited - -
(421.00) ( - ) ( - )
6 Payment to Key Managerial Personnel
Mr. Sanjiv Saraf - 28.00 -
( - ) (25.00) ( - )
- -
( - ) ( - )
Mr. Manish Gupta - 185.23 -
( - ) ( - )
- 52.53 -
( - ) (39.30) ( - )
7 Donation Given
S. D. College Society (Lahore), New Delhi - - 4.00
( - ) ( - ) ( - )
8 Dividend Received
Polyplex (Asia) Pte Limited 805.20 - -
(651.94) ( - ) ( - )
Polyplex (Thailand) Public Co Limited - -
( - ) ( - ) ( - )
9 Interest Received
Limited - - 166.21
( - ) ( - ) (252.33)
* To the extent payable
` 9.91 Lacs for FY 2014-15.
(` in Lacs)
Note: 27 OTHER EXPLANATORY NOTES (contd...)

109AnnualReport2015-16
Notes to Financial Statements for the year ended 31st March 2016
Note: 27 OTHER EXPLANATORY NOTES (contd...)
T. ` 314.50 Lacs (including
contribution to Superannuation fund and Provident fund) and does not include payment of ̀ ` 0.66 Lacs paid towards
leave encashment and medical reimbursements as per the policy of company, in terms of the approval of the shareholders as per
`
Lacs, for which application for approval is pending with Ministry of Corporate Affairs, Government of India.
U. Debtors over six months include overdue debtors aggregating to ` 31.95 Lacs (Previous Year: ` 31.95 Lacs) (net of provision of ` Nil
(Previous Year: ` Nil)) where Company has initiated legal or other necessary action for recovery.
provisions of Income Tax Act, 1961, as assessed by the management and is net of Deemed Tax Credit Entitlement in respect
of overseas subsidiary company of ` ` Nil)
(ii) Income Tax assessment in respect of certain years are in process and for certain years some additions have been made. In
no provisions has been considered necessary by the management.
W. In accordance with the provisions of Accounting Standard on Impairment of Assets (AS – 28), the management has made
assessment of assets considering the business prospects related thereto and, accordingly, no provision on account of impairment
of assets is considered necessary in these accounts.
X.
Y. ` Lacs with two decimals.
As per our report of even date attached For and on behalf of the Board of Directors
For Lodha & Co. Chartered Accountants Sanjiv Saraf Pranay Kothari Brij Kishore Soni
Chairman Executive Director Director DIN: 00003998 DIN: 00004003 DIN: 00183432N. K. Lodha Partner Manish Gupta Ashok Kumar GurnaniMembership No. 085155
Place: New Delhi Place: NoidaDate: May 30, 2016 Date: May 30, 2016

110 PolyplexCorporation Ltd.
CONSOLIDATEDFINANCIAL STATEMENTS
111AnnualReport2015-16
Report on the Consolidated Financial Statements
We have audited the accompanying Consolidated Financial
Statements of Polyplex Corporation Limited (hereinafter referred
company and its subsidiaries collectively referred to as “the
Group”), comprising of the Consolidated Balance Sheet as at
Loss, the Consolidated Cash Flow Statement for the year then
and other explanatory information (hereinafter referred to as “the
Consolidated Financial Statements”).
Management’s Responsibility for the Consolidated Financial
Statements
preparation of the Consolidated Financial Statements in terms of
the requirements of the Companies Act, 2013 (hereinafter referred
to as “the Act”) that give a true and fair view of the Consolidated
consolidated cash flows of the Group in accordance with the
accounting principles generally accepted in India, including the
respective Board of Directors of the Companies included in the
group and of its associates are responsible for maintenance of
adequate accounting records in accordance with the provisions
of the Act for safeguarding of the assets of the group and for
preventing and detecting frauds and other irregularities; the
selection and application of appropriate accounting policies;
making judgments and estimates that are reasonable and
prudent; and the design, implementation and maintenance
effectively for ensuring the accuracy and completeness of the
accounting records, relevant to the preparation and presentation
are free from material misstatement, whether due to fraud or
error, which have been used for the purpose of preparation of
the Consolidated Financial Statements by the Directors of the
Auditor’s Responsibility
Our responsibility is to express an opinion on the Consolidated
Financial Statements based on our audit. While conducting
the audit, we have taken into account the provisions of the Act,
the accounting and auditing standards and matters which are
required to be included in the audit report under the provisions of
We conducted our audit in accordance with the Standards
standards require that we comply with ethical requirements and
plan and perform the audit to obtain reasonable assurance about
whether the Consolidated Financial Statements are free from
material misstatement.
An audit involves performing procedures to obtain audit evidence
about the amounts and the disclosures in the Consolidated
Financial Statements. The procedures selected depend on the
auditor’s judgment, including the assessment of the risks of
material misstatement of the Consolidated Financial Statements,
whether due to fraud or error. In making those risk assessments,
Statements that give a true and fair view in order to design audit
procedures that are appropriate in the circumstances. An audit
also includes evaluating the appropriateness of the accounting
policies used and the reasonableness of the accounting estimates
evaluating the overall presentation of the Consolidated Financial
Statements.
We believe that the audit evidence obtained by us and audit
evidence obtained by the other auditors in term of their report
referred to in sub- paragraph (a) of the other matters paragraph
opinion on the Consolidated Financial Statements.
Opinion
In our opinion and to the best of our information and according
to the explanations given to us, the aforesaid Consolidated
Financial Statements give the information required by the Act in
the manner so required and give a true and fair view in conformity
with the accounting principles generally accepted in India, of the
Consolidated State of Affairs of the Group, as at 31st March 2016,
for the year ended on that date.
Other matters
` 4,04,264.40
Lacs as at 31st March, 2016, total revenues of `1,94,363.29 Lacs
`
that date, as considered in the Consolidated Financial Statements.
whose reports have been furnished to us by the Management and
our opinion on the Consolidated Financial Statements, in so far
as it relates to the amounts and disclosures included in respect
of these subsidiaries and our report in terms of sub-sections (3)
and (11) of Section 143 of the Act, in so far as it relates to the
Independent Auditor’s ReportTo the Members of
POLYPLEX CORPORATION LIMITED

112 PolyplexCorporation Ltd.
aforesaid subsidiaries, is based solely on the report of the other
auditors.
Our opinion on the Consolidated Financial Statements, and our
reliance on the work done and the reports of the other auditors.
Report on Other Legal and Regulatory Requirements
1. As required by sub-section 3 of Section 143 of the Act, we
report, to the extent applicable, that:
a) We have sought and obtained all the information and
explanations which to the best of our knowledge and
belief were necessary for the purposes of our audit of the
aforesaid Consolidated Financial Statements.
b) In our opinion, proper books of account as required by
law relating to preparation of the aforesaid Consolidated
Financial Statements have been kept so far as it appears
from our examination of those books and the reports of
the other auditors.
c) The Consolidated Balance Sheet, the Consolidated
with the relevant books of account maintained for the
purpose of preparation of the Consolidated Financial
Statements.
d) In our opinion, the aforesaid Consolidated Financial
Statements comply with the Accounting Standards
e) On the basis of the written representations received from
2016 taken on record by the Board of Directors of the
of its subsidiary company incorporated in India, none of
2016 from being appointed as a Director in terms of
Section 164(2) of the Act.
operating effectiveness of such controls, refer to our
separate report in “Annexure A”; and
g) with respect to the other matters to be included in the
opinion and to the best of our information and according
to the explanations given to us and on the basis of report
of other auditors:
i. The Consolidated Financial Statements disclose the
impact of pending litigations on the consolidated
the Consolidated Financial Statements;
ii. Provision has been made in the Consolidated Financial
Statements, as required under the applicable law or
accounting standards, for material foreseeable losses,
if any, on long term contracts including derivative
Consolidated Financial Statements.
iii. There has been no delay in transferring amounts,
required to be transferred, to the Investor Education
For LODHA & CO.,
Chartered Accountants
N.K. Lodha
Place: New Delhi Partner
Date: May 30, 2016 Membership No.085155
Report on the Internal Financial Controls over Financial
Reporting under Clause (i) of Sub-section 3 of Section 143 of
the Companies Act, 2013 (“the Act”)
In conjunction with our audit of the Consolidated Financial
Statements of the Company as of and for the year ended 31
subsidiary (incorporated in India) together referred to as “the
Group”) which are companies incorporated in India, as of that
date.
Management’s Responsibility for Internal Financial Controls
its subsidiary companies, which are companies incorporated in
ANNEXURE ‘A’ TO THE INDEPENDENT AUDITOR’S REPORT ON CONSOLIDATED FINANCIAL STATEMENTS

113AnnualReport2015-16
India, are responsible for establishing and maintaining internal
reporting criteria established by the Company considering the
essential components of internal control stated in the Guidance
Note on Audit of Internal Financial Controls over Financial
(‘ICAI’). These responsibilities include the design, implementation
conduct of its business, including adherence to company’s
policies, the safeguarding of its assets, the prevention and
detection of frauds and errors, the accuracy and completeness
of the accounting records, and the timely preparation of reliable
Auditor’s Responsibility
Our responsibility is to express an opinion on the Group’s internal
conducted our audit in accordance with the Guidance Note on
“Guidance Note”) issued by ICAI and the Standards on Auditing,
issued by ICAI and deemed to be prescribed under section
143(10) of the Companies Act, 2013, to the extent applicable to
of Chartered Accountants of India. Those Standards and the
Guidance Note require that we comply with ethical requirements
and plan and perform the audit to obtain reasonable assurance
reporting was established and maintained and if such controls
operated effectively in all material respects.
Our audit involves performing procedures to obtain audit evidence
exists, and testing and evaluating the design and operating
effectiveness of internal control based on the assessed risk. The
procedures selected depend on the auditor’s judgment, including
the assessment of the risks of material misstatement of the
and appropriate to provide a basis for our audit opinion on the
Meaning of Internal Financial Controls Over Financial Reporting
process designed to provide reasonable assurance regarding the
statements for external purposes in accordance with generally
procedures that (1) pertain to the maintenance of records that,
in reasonable detail, accurately and fairly reflect the transactions
and dispositions of the assets of the Group; (2) provide reasonable
assurance that transactions are recorded as necessary to
generally accepted accounting principles, and that receipts
and expenditures of the companies are being made only in
accordance with authorizations of management and directors
which are companies incorporated in India); and (3) provide
reasonable assurance regarding prevention or timely detection of
unauthorized acquisition, use, or disposition of the Group’s assets
Inherent Limitations of Internal Financial Controls Over Financial
Reporting
or improper management override of controls, material
misstatements due to error or fraud may occur and not be
detected. Also, projections of any evaluation of the internal
reporting may become inadequate because of changes in
conditions, or that the degree of compliance with the policies or
procedures may deteriorate.
Opinion
companies, which are companies incorporated in India, have, in all
criteria established by the Company considering the essential
components of internal control stated in the Guidance Note on
issued by the ICAI.
For LODHA & CO.,
Chartered Accountants
N.K. Lodha
Place: New Delhi Partner
Date: May 30, 2016 Membership No.085155

114 PolyplexCorporation Ltd.
Consolidated Balance Sheet as at 31st March 2016
As per our report of even date attached For and on behalf of the Board of Directors
For Lodha & Co.
Chartered Accountants Sanjiv Saraf Pranay Kothari Brij Kishore Soni
Chairman Executive Director Director
DIN: 00003998 DIN: 00004003 DIN: 00183432
N. K. Lodha
Partner Manish Gupta Ashok Kumar Gurnani
Membership No. 085155
Place: New Delhi Place: Noida
Date: May 30, 2016 Date: May 30, 2016
Particulars Note
No.
As at
31 March, 2016
As at
31 March, 2015
I. EQUITY AND LIABILITIES
Shareholder's Funds
Share Capital 2 3,256.32 3,256.32
3 228,865.03 208,832.93
Minority Interest 63,519.96 65,891.44
Non Current Liabilities
Long Term Borrowings 4
Deferred Tax Liabilities (Net) 5 - -
Other Long Term Liabilities 6A 61.42 85.12
Long Term Provisions 6B 561.66
Current Liabilities
Short Term Borrowings 49,602.89 55,663.51
Trade Payables 8 18,654.66 20,135.52
Other Current Liabilities 9
Short Term Provisions 10 1,223.61 948.02
TOTAL 457,075.07 474,397.88
II. ASSETS
Non Current Assets
Fixed Assets
Tangible Assets 11
Intangible Assets 11
Capital Work-in-Progress 293.28
Goodwill on Consolidation 330.25 405.60
Non Current Investments 12 - -
Long Term Loan and Advances 13 3,033.15 2,268.12
Other Non-Current Assets 14 501.82
Deferred Tax Assets (Net) 5
Current Assets
Current Investments 15 1,626.05
Inventories 16 43,434.46
43,400.58 40,229.01
18 113,500.13
Short Term Loans and Advances 19 8,925.12 12,889.68
Other Current Assets 20 2,025.94
TOTAL 457,075.07 474,397.88
1, 28
(` in Lacs)

115AnnualReport2015-16
for the year ended 31st March 2016
As per our report of even date attached For and on behalf of the Board of Directors
For Lodha & Co.
Chartered Accountants Sanjiv Saraf Pranay Kothari Brij Kishore Soni
Chairman Executive Director Director
DIN: 00003998 DIN: 00004003 DIN: 00183432
N. K. Lodha
Partner Manish Gupta Ashok Kumar Gurnani
Membership No. 085155
Place: New Delhi Place: Noida
Date: May 30, 2016 Date: May 30, 2016
Particulars Note No.
Year ended31 March, 2016
Year ended31 March, 2015
21 323,034.83
Less: Excise Duty 5,491.23
I Revenue from Operations (Net) 318,019.11 320,416.22
II Other Income 22 3,358.02
III Total Revenue (I + II) 321,377.13 332,206.84
IV Expenses
Cost of Materials Consumed 23 183,431.11 201,994.59
Purchases of Stock-in-trade 1,565.44
Changes in Inventories 24 2,051.66
25
Finance Costs 26
Depreciation and Amortisation 20,895.56
Other Expenses 64,666.81 59,641.99
Total Expenses 308,395.03 319,162.74
V 12,982.10 13,044.10
6,565.82
VII 6,416.28 8,269.31
VIII Tax Expense
Current Tax 1,159.02
MAT Credit (381.81)
Deferred Tax 81.46
Prior Period Adjustment - Tax (16.13) 2.61
Total 4,791.59 494.38
IX 1,624.69 7,774.93
X Less: Minority Interest (1,279.14) 3,980.19
XI 2,903.83 3,794.74
XII Earnings Per Equity Share
Basic (in `) 9.08 11.86
Diluted (in `) 9.08 11.86
1, 28
(` in Lacs)

116 PolyplexCorporation Ltd.
Consolidated Cash Flow Statement for the year ended 31st March 2016
2015-16 2014-15
6,416.28 8,269.31
Adjustments For :
Depreciation / Amortization 20,969.89 21,654.44
Provision for doubtful debts/ bad debts written off 16.61
Interest Expenses
Interest Income (2,861.03)
6,565.82 -
Unrealised foreign exchange (gain) / loss 3,502.65
Excess provision / sundry balances written back (93.08) (28.13)
Provision for Doubtful Debts written back (35.29) -
Exceptional Item (Loss on sales of investment in subsidiary) -
9.82 (9.22)
Asset written off 6.85 3.95
(29.54) (23.61)
32,805.06 22,638.11
39,221.34 30,907.42
Adjustments For :
Trade and other receivables (98.36) (2,298.23)
Inventories 1,600.24
Trade payables and Other Liability 349.06
Cash Generated From Operations 41,954.75 37,958.91
Taxes Paid (550.40) (358.18)
Net Cash From Operating Activities 41,404.35 37,600.73
(5,186.05) (15,688.11)
Sale of Fixed Assets 60.42
Sale of Investment in Subsidiary - 16,884.84
Sale of Long Term Investments -
Purchase of Short Term Investments (63,625.00)
Sale of Short Term Investments- MF 90,352.22
(Decrease) / Increase in Minority Interest {net of dividend paid} (1,092.34)
Interest/Dividend received 2,244.80
Net Cash Used in Investing Activities (2,043.91) 8,433.15
(` in Lacs)

AnnualReport2015-16
Consolidated Cash Flow Statement for the year ended 31st March 2016
2015-16 2014-15
(35,568.16) (34,826.29)
Net proceeds from Short Term Borrowings (6,060.62)
Interest paid (4,868.09)
Dividends paid (801.81) (638.92)
Net Cash Used In Financing Activities (47,298.68) (23,431.37)
ARISING ON CONSOLIDATION 14,001.39 (8,435.14)
Net Increase in Cash and Cash Equivalents 6,063.15 14,167.37
Cash and Cash Equivalents as at beginning of the year
Other Bank balances as at beginning of the year 49,850.91
Total Cash & bank balances as at beginning of the year 107,436.98 93,269.61
Cash and Cash Equivalents as at end of the year
Other Bank balances as at end of the year
Total Cash & bank balances as at end of the year 113,500.13 107,436.98
(` in Lacs)
NOTE:
1. Cash and cash equivalent represents cash and bank balances as per Note 18.
As per our report of even date attached For and on behalf of the Board of Directors
For Lodha & Co.
Chartered Accountants Sanjiv Saraf Pranay Kothari Brij Kishore Soni
Chairman Executive Director Director
DIN: 00003998 DIN: 00004003 DIN: 00183432
N. K. Lodha
Partner Manish Gupta Ashok Kumar Gurnani
Membership No. 085155
Place: New Delhi Place: Noida
Date: May 30, 2016 Date: May 30, 2016

118 PolyplexCorporation Ltd.
Notes to Consolidated Financial Statements for the year ended 31st March 2016
BASIS OF CONSOLIDATION
(a) The Consolidated Financial Statements (CFS) relate to Polyplex Corporation Limited (the Company), and its Subsidiaries. The CFS
has been prepared in accordance with Accounting Standard 21 on “Consolidated Financial Statements” (AS 21), and are prepared
on the following basis:
(i) The Financial Statements of the Company and its Subsidiaries are combined on a line by line basis by adding together the
book values of like items of assets, liabilities, income and expenses, after fully eliminating inter-group balances and inter-
difference between the Company’s cost of investments in the Subsidiaries, over its portion of equity at the time of acquisition
order to arrive at the net income attributable to equity shareholders of the Company. Minority Interest’s share in net assets
of consolidated subsidiaries is presented in the Consolidated Balance Sheet separate from liabilities and the equity of the
into consideration:
(1) The amount of equity attributable to minorities at the date on which investments in a subsidiary is made.
(2) The minorities’ share of movement in equity since the date parent-subsidiary relationship came into existence.
(3) The losses attributable to the minorities are adjusted against the minority interest in the equity of the subsidiary.
(ii) In case of foreign subsidiaries, being non-integral foreign operations, revenue items are translated at the average rates
prevailing during the period. Assets, liabilities and equity are translated at the closing rate. Any exchange difference arising on
(b) Accounting Assumption
The Consolidated Financial Statements have been prepared using uniform accounting policies, in accordance with the Generally
conformity with generally accepted accounting principles in the respective countries on accrual basis. Accordingly, the Financial
generally accepted accounting principles and practices.
(c)
wholly owned or controlled subsidiaries as on March 31, 2016, as given below:
Name of the Company Country of
Incorporation
% Shareholding
Polyplex (Asia) Pte. Limited (PAPL) Singapore 100%
Polyplex (Thailand) Public Company Limited (PTL) Thailand 51%
Polyplex (Singapore) Pte. Limited (PSPL) Singapore 100% (1)
Polyplex Europa Polyester Film Sanayi Ve Ticaret A.S. (PE) Turkey 100% (2)
Polyplex Trading (Shenzhen) Co. Limited (PTSL) China 100% (3)
U.S.A 100% (4)
U.S.A 100% (1)
Polyplex USA LLC (PU) U.S.A 100% (5)
Peninsula Beverages and Foods Company Private Limited (PBF) India 100% (4)
Thailand
Polyplex Europe B.V. (PEBV) Netherland 100% (1)
Polyplex Paketleme Çozumleri Sanayi VE Ticaret Anonim Sirketi (PP) Turkey
Note: 1 SIGNIFICANT ACCOUNTING POLICIES
(1) 100% Subsidiary of PTL. (4) 100% Subsidiary of PAPL
(2) 100% Subsidiary of PSPL. Includes 4 shares not registered in the
(3) 100% Subsidiary of PSPL

119AnnualReport2015-16
Notes to Consolidated Financial Statements for the year ended 31st March 2016
Note:1 SIGNIFICANT ACCOUNTING POLICIES
(d) Additional information, as required under Schedule III to the Companies Act, 2013, of the enterprises consolidated as Subsidiary.
(e)
(f) The policy for depreciation for manufacturing unit adopted by Polyplex Corporation Limited (PCL) is written down Value Method (WDV) as per life prescribed in Schedule II to the Companies Act, 2013 except for Plant and Machinery running on continuous process basis. Where based on internal assessment and independent technical evaluation carried out by external valuer the management believes that the useful
different from the useful lives as prescribed under Part C of Schedule II of the Companies Act 2013.
The policy adopted by different subsidiaries on depreciation is enumerated below: (i) PTL (including subsidiaries): Land is stated at cost. Buildings and Equipments are stated at cost less accumulated depreciation and allowance for loss on impairment
assets (if any).
Depreciation of buildings and building improvements, machinery and equipment is calculated by reference to their costs on the straight line basis. Depreciation of other equipment is calculated on the sum of the year digits basis.
* Ceased to be subsidiary w.e.f. 2nd March, 2015.
Name of the Entity
Current Year Previous YearNet Assets
(Total Assets - Total Liabilities)
Share in Net Assets (Total Assets - Total
Liabilities)
Share in
As % of Consolidated
net assets
Amount (` in Lacs)
As % of Consolidated
Loss
Amount (` in Lacs)
As % of Consolidated
net assets
Amount (` in Lacs)
As % of Consolidated
Loss
Amount (` in Lacs)
Parent CompanyPolyplex Corporation Limited 18.60 43,101.66 92.81 19.53 41,338.13 52.54 1,993.82 SubsidiariesIndianPeninsula Beverages and Foods Company Private Limited
(0.40) (931.46) (65.88) (0.41) (865.58) (598.46)
ForeignPolyplex (Asia) Pte. Limited 45.53 56.82 98,983.19
0.60 (0.43) (12.49) 0.62 1,311.45 1.12 42.32 Polyplex (Thailand) Public Company Limited
22.38 51,881.65 (6,206.03) (1,962.63)
Polyplex (Singapore) Pte. Limited
8,655.84 (0.21) (6.08) 4.16 (0.10) (3.94)
Polyplex Europa Polyester Film Sanayi Ve Ticaret A.S.
52.55 121,811.03 410.53 46.49 98,413.13 233.18 8,848.66
Polyplex Trading (Shenzhen) Co. Limited
0.10 240.95 0.10 (0.93) (35.45)
Inc 9.34 (4,831.24) 10.44 22,091.85 12.30 466.60
Polyplex USA LLC 4.02 4.22 8,933.05 (6.56) (249.04)EcoBlue Limited 0.39 905.05 245.85 0.32 4.31 163.58 Polyplex Europe B.V. 0.14 3.55 103.09 0.10 205.63 1.96 Polyplex Paketleme Çozumleri Sanayi VE Ticaret Anonim Sirketi
0.04 85.53 1.55 45.01 0.02 40.30 0.59 22.29
Ticaret A.S. * - - - - - - 5.01 190.20
TOTAL 157.03 363,972.57 (42.29) (1,228.13) 161.07 340,932.44 186.55 7,079.18 Adjustment for:Minority Interest in Subsidiaries
(63,519.96) 44.05 (31.13) (65,891.44) (104.89) (3,980.19)
Total Eliminations arising out of consolidation
(29.62) (68,661.51) 98.24 2,852.82 (29.93) 18.33
TOTAL 100.00 231,791.10 100.00 2,903.83 100.00 211,683.65 100.00 3,794.74

120 PolyplexCorporation Ltd.
Notes to Consolidated Financial Statements for the year ended 31st March 2016
Note:1 SIGNIFICANT ACCOUNTING POLICIES
The estimated useful lives of plant and equipment are as follows:
20, 50 years
4 -20 years
3-10 years
Motor Vehicles 5 years
Depreciation is included in determining income. No depreciation is provided on land, machinery in transit, and assets under installation and construction.
(ii) PAPL: Depreciation on computer begins when the assets are available for use and is calculated on the straight line basis over its estimated
useful life of 4 years.
related costs over the estimated useful lives of the respective assets, which range from 5-30 Years.
(g) loan agreement.
is required to make lump-sum payments to employees whose employment is terminated due to retirement or for reasons other than resignation or misconduct. The computation of liability is based upon the retirement pay ceiling announced by the Government. Such payments are calculated on the basis of 30 days’ pay, (limited to a maximum of `employment at the rate of pay applicable at the date of retirement or termination.
(i) Foreign Currency Transaction In case of PTL (Including Subsidiaries), and PAPL, gain / loss on exchange difference (including derivative instruments) are transferred to
(j)
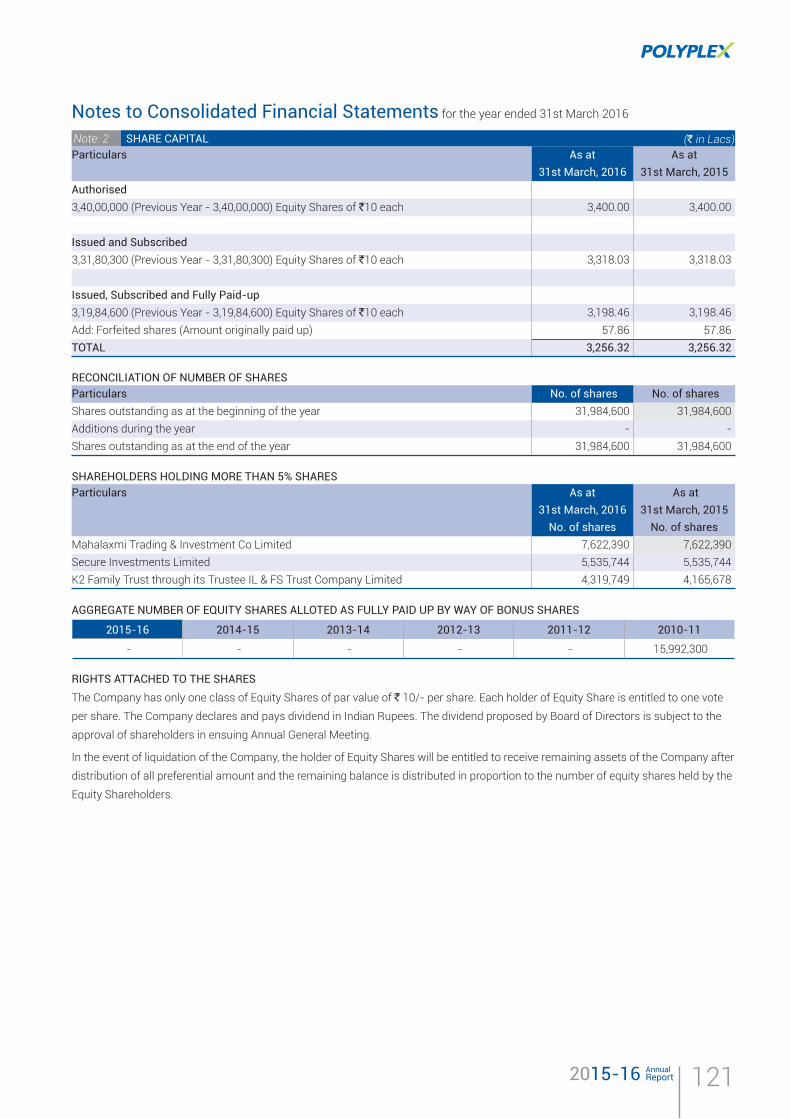
121AnnualReport2015-16
Notes to Consolidated Financial Statements for the year ended 31st March 2016
Particulars As at
31st March, 2016
As at
31st March, 2015
Authorised
3,40,00,000 (Previous Year - 3,40,00,000) Equity Shares of `10 each 3,400.00 3,400.00
Issued and Subscribed
3,31,80,300 (Previous Year - 3,31,80,300) Equity Shares of `10 each 3,318.03 3,318.03
Issued, Subscribed and Fully Paid-up
3,19,84,600 (Previous Year - 3,19,84,600) Equity Shares of `10 each 3,198.46 3,198.46
Add: Forfeited shares (Amount originally paid up)
TOTAL 3,256.32 3,256.32
Note: 2 SHARE CAPITAL (` in Lacs)
Particulars No. of shares No. of shares
Shares outstanding as at the beginning of the year 31,984,600 31,984,600
Additions during the year - -
Shares outstanding as at the end of the year 31,984,600 31,984,600
RECONCILIATION OF NUMBER OF SHARES
Particulars As at
31st March, 2016
No. of shares
As at
31st March, 2015
No. of shares
Secure Investments Limited
SHAREHOLDERS HOLDING MORE THAN 5% SHARES
RIGHTS ATTACHED TO THE SHARES
The Company has only one class of Equity Shares of par value of ` 10/- per share. Each holder of Equity Share is entitled to one vote
approval of shareholders in ensuing Annual General Meeting.
In the event of liquidation of the Company, the holder of Equity Shares will be entitled to receive remaining assets of the Company after
distribution of all preferential amount and the remaining balance is distributed in proportion to the number of equity shares held by the
Equity Shareholders.
AGGREGATE NUMBER OF EQUITY SHARES ALLOTED AS FULLY PAID UP BY WAY OF BONUS SHARES
2015-16 2014-15 2013-14 2012-13 2011-12 2010-11
- - - - - 15,992,300

122 PolyplexCorporation Ltd.
Notes to Consolidated Financial Statements for the year ended 31st March 2016
Particulars As at 31st March, 2016
As at 31st March, 2015
Capital Reserve
Central Investments subsidy 85.00 85.00
State Investments subsidy 30.00 30.00
Share Warrants Forfeited 250.80 250.80
Others 58.36 58.36
Sub Total (a) 424.16 424.16
Securities Premium Reserve
As per last Balance Sheet 15,295.69
Add : Updation on Translation Adjustment (505.42) 853.91
Less : Minority Interest 418.42
Sub Total (b) 15,473.43 15,731.18
Legal Reserve #
As per last Balance Sheet 1,838.18
Updation on Translation Adjustment (35.40) 59.82
Sub Total (c) 1,802.78 1,838.18
General Reserve
As per last Balance Sheet 5,485.58 5,286.20
269.52 199.38
Sub Total (d) 5,755.10 5,485.58
Surplus Bought Forward 153,448.68
Add:
2,903.83
Corporate Dividend Tax - Proposed Dividend - Written Back
Less:
269.52 199.38
Proposed Dividend 959.54
Corporate Dividend Tax - Proposed Dividend -
Sub Total (e) 155,151.35 153,448.68
Foreign Exchange Translation Reserve (Including arised on Consolidation)
As per last Balance Sheet 31,905.15 49,442.81
Addition during the year 18,353.06
Sub Total (f) 50,258.21 31,905.15
TOTAL (a + b + c + d + e + f) 228,865.03 208,832.93
is not available for dividend distribution.
Note: 3 (` in Lacs)
Particulars As at 31st March, 2016
As at 31st March, 2015
Secured Term Loans From Banks
-
Foreign Currency Term Loan 105,093.64
Sub Total (a) 79,801.34 109,781.14
Less: Current Portion
- 1,250.00
Foreign Currency Term Loan 8,389.01 11,225.00
Sub Total (b) 8,389.01 12,475.00
TOTAL (a - b) 71,412.33 97,306.14
Note: 4 LONG TERM BORROWINGS (` in Lacs)

123AnnualReport2015-16
Notes to Consolidated Financial Statements for the year ended 31st March 2016
Particulars As at
31st March, 2016
As at
31st March, 2015
Deferred Tax (Assets)
Disallowance as per Income Tax Act
Deferred Tax Liability
Disallowance on account of Depreciation
TOTAL (2,679.08) (6,320.47)
Note: 5 DEFERRED TAX LIABILITY/ (ASSETS) (NET) (` in Lacs)
Particulars As at
31st March, 2016
As at
31st March, 2015
Financial Lease Liability 61.42 85.12
TOTAL 61.42 85.12
Note: 6A OTHER LONG TERM LIABILITIES (` in Lacs)
Particulars As at
31st March, 2016
As at
31st March, 2015
561.66
TOTAL 647.98 561.66
Note: 6B (` in Lacs)
Particulars As at
31st March, 2016
As at
31st March, 2015
Secured Loans
Loans from Banks repayable on Demand 49,414.59 53,901.30
Buyer's Credit 188.30
TOTAL 49,602.89 55,663.51
Note: 7 SHORT TERM BORROWINGS (` in Lacs)
Particulars As at
31st March, 2016
As at
31st March, 2015
Total Outstanding due to
Micro and small enterprises - -
Other vendors other than micro and small enterprises 18,654.66 20,135.52
TOTAL 18,654.66 20,135.52
Note: 8 TRADE PAYABLES (` in Lacs)
Particulars As at 31st March, 2016
As at 31st March, 2015
Current Maturity of Long Term Debt 8,389.01
Current Maturity of Finance Lease 28.94 26.19
Interest accrued but not due on borrowing 225.95
Unclaim Dividend 114.42 116.61
Other Security Deposits 144.15 141.36
Statutory liability 506.60
Creditors for Capital Expenses
Advance from Customers 1,612.88 1,228.14
Other liabilities 8,461.30
TOTAL 19,830.87 21,717.22
Note: 9 OTHER CURRENT LIABILITIES (` in Lacs)

124 PolyplexCorporation Ltd.
Notes to Consolidated Financial Statements for the year ended 31st March 2016
Particulars As at
31st March, 2016
As at
31st March, 2015
Provision for Wealth Tax -
Proposed Dividend 959.54
Corporate Dividend Tax -
TOTAL 1,223.61 948.02
Note: 10 (` in Lacs)
Particulars As at 31st March, 2016 As at 31st March, 2015Nos. (` in Lacs) Nos. (` in Lacs)
(At Cost less Provision)
(Long Term Investments - Other Than Trade)
Investment in Bonds - - - -
TOTAL - -
Note:
Aggregate of Unquoted Investments (At Cost less Provisions) - -
Note: 12
Particulars As at 31st March, 2016
As at 31st March, 2015
Capital Advances to Vendors 249.84
Security Deposits 811.25
MAT Credit Entitlement
TOTAL 3,033.15 2,268.12
Note: 13 (` in Lacs)
(` in Lacs)
Particulars
Gross Block Depreciation/ Amortisation Net Block
As At 01.04.2015
Additionsduring the
year
Sale /adjustments
* #
As at 31.3.2016
As at 01.04.2015
For theyear
Sale /adjustments
As At 31.03.2016
As At 31.03.2016
As at 31.3.2015
Tangible Assets
Freehold Land - (151.52) 8,543.25 - - - - 8,543.25
Leasehold Land 493.33 - - 493.33 108.09 5.93 - 114.02 385.24
Buildings 382.80 (63.83) 11,949.26 15,069.16 59,468.32
293,451.26 (1,829.50) 120,809.30
Electrical Installations 2.01 14.43 2,095.49 1,433.05 211.04 1,635.34 460.15
1,834.23 321.59 365.86 130.42 312.84
105.56 (380.88) 3,192.45 1,863.65 (164.08) 2,501.38 842.36
Vehicles 1,406.80 33.01 1,345.14 1,063.96 322.44 342.84
TOTAL 376,153.72 4,770.84 (1,850.53) 382,775.09 119,872.55 20,815.38 (1,941.09) 142,629.02 240,146.07 256,281.17
Previous Year 352,024.48 34,053.65 9,924.41 102,803.30 21,500.81 4,431.56
INTANGIBLE ASSETS
Computer Software 495.58 0.52 (38.45) 534.55 316.64 80.18 (21.03)
Total 495.58 0.52 (38.45) 534.55 316.64 80.18 (21.03) 417.85 116.70 178.94
Previous Year 480.06 260.09 495.58 31.18 316.64
Grand Total - Current Year 376,649.30 4,771.36 (1,888.98) 383,309.64 120,189.19 20,895.56 (1,962.12) 143,046.87 240,262.77 256,460.11
Grand Total - Previous Year 352,504.54 34,329.26 10,184.50 120,189.19 256,460.11 -
Notes :
* Sale/Adjustment includes adjustment of foreign exchange fluctuation gain of ` `
` 6565.82 Lacs (Previous Year ` Nil).
Note: 11 FIXED ASSETS (` in Lacs)

125AnnualReport2015-16
Notes to Consolidated Financial Statements for the year ended 31st March 2016
Particulars As at 31st March, 2016 As at 31st March, 2015
No. of units (` in Lacs) No. of units (` in Lacs)
(Other than Trade)
(Unquoted - Other than Shares)
Mutual Funds
Other investment - - 1,626.05
TOTAL 83.37 1,626.05
Note: 15
Particulars As at
31st March, 2016
As at
31st March, 2015
Export Incentives 3.24 36.93
Miscellaneous Expenditure (to the extent not written off) 108.46
Fixed Deposit with Banks 356.43
TOTAL 476.32 501.82
Note: 14 OTHER NON-CURRENT ASSETS (` in Lacs)
Particulars As at
31st March, 2016
As at
31st March, 2015
(at lower of cost or net realisable value)
` ` 1201.35 Lacs) 9,593.14
Stock in Process 5,865.28
Finished Goods (including Traded stock) (including stock in transit of ` 3689.50 Lacs,
TOTAL 40,951.75 43,434.46
Note: 16 (` in Lacs)
Particulars As at
31st March, 2016
As at
31st March, 2015
(Unsecured, considered good unless otherwise stated)
Debts outstanding for a period exceeding six months from the due date
Considered good 339.43
Considered doubtful 222.84
Less: Provision for Doubtful Debts (222.84)
Other Debts
Unsecured, considered good 43,061.15
TOTAL 43,400.58 40,229.01
Note: 17 (` in Lacs)

126 PolyplexCorporation Ltd.
Notes to Consolidated Financial Statements for the year ended 31st March 2016
Particulars As at
31st March, 2016
As at
31st March, 2015
(Unsecured, considered good unless otherwise stated)
1,500.25
8,332.54
523.25
Prepaid Expenses 528.93
Inter-corporate deposit - 500.00
960.98
Advance Tax (Net of Provisions) 93.80 309.30
TOTAL 8,925.12 12,889.68
Note: 19 (` in Lacs)
Particulars As at
31st March, 2016
As at
31st March, 2015
Cash and Cash Equivalent
Cash on hand 49.80
Cheques in hand 83.16 -
Bank Balance with Schedule Banks
Current Accounts
Fixed Deposits with origin less than three months - 52.00
Bank Balance with Non-Schedule Banks
Current Accounts
Fixed Deposits with origin less than three months 21,925.65
Sub Total (a)
Earmarked Balance with Banks
Unpaid Dividend Accounts 114.31 116.50
Fixed Deposits with origin more than one year 356.43
Less: Fixed Deposit presented under Other Non Current Assets (Note 14) (356.43)
Sub Total (b) 114.31 116.50
Other Bank Balances
Fixed Deposits (Lien with Banks) 2.21 4.31
Fixed Deposits with origin more than three months 1,654.38 6,358.22
Fixed Deposits with origin more than one year
Sub Total (c)
TOTAL (a + b + c) 113,500.13 107,436.98
Note: 18 (` in Lacs)
Particulars As at
31st March, 2016
As at
31st March, 2015
33.41
3,105.55 1,992.53
TOTAL 3,139.27 2,025.94
Note: 20 OTHER CURRENT ASSETS (` in Lacs)

AnnualReport2015-16
Notes to Consolidated Financial Statements for the year ended 31st March 2016
Particulars Year ended 31st March, 2016
Year ended 31st March, 2015
Sales
Plastic Films 309,339.30 308,265.32
Others 3,965.83
Gross Sales 322,060.80 325,592.52
Other Operating Income
Liabilities Written Back 93.08 28.13
Provision for Doubtful Debts Written Back 35.29 -
264.63
Prior Period Income 6.39
TOTAL 323,034.83 325,907.45
Note: 21 (` in Lacs)
Particulars Year ended 31st March, 2016
Year ended 31st March, 2015
250.88 291.32
29.54 23.61
1.65 -
Foreign Exchange Fluctuation Gain (Net) -
Interest Income 2,861.03
Miscellaneous Income 158.38
TOTAL 3,358.02 11,790.62
Note: 22 OTHER INCOME (` in Lacs)
Particulars Year ended 31st March, 2016
Year ended 31st March, 2015
190,305.92
Packing Material 13,044.24
TOTAL 183,431.11 201,994.59
Note: 23 COST OF MATERIALS CONSUMED (` in Lacs)
Particulars Year ended 31st March, 2016
Year ended 31st March, 2015
Opening Stock
- Finished Goods
- Stock in Process - Chips / Others
25,098.94
Closing Stocks
- Finished Goods
- Stock in Process - Chips / Others 5,865.28
25,098.94
Add : Increase / (Decrease) in Excise Duty on Stocks 1.50
Net Changes in Inventories 1,370.70 2,051.66
Note: 24 (` in Lacs)
Particulars Year ended
31st March, 2016
Year ended
31st March, 2015
Salaries, Wages, Bonus etc 25,893.39
Contribution to Provident and other Funds 1,389.23 1,233.99
Staff Welfare Expenses 2,232.55 2,045.04
TOTAL 29,515.17 26,745.80
Note: 25 EMPLOYEE BENEFITS EXPENSE (` in Lacs)

128 PolyplexCorporation Ltd.
Notes to Consolidated Financial Statements for the year ended 31st March 2016
Particulars Year ended
31st March, 2016
Year ended
31st March, 2015
Interest Expense 4,604.18
Other Borrowing Cost 313.18
TOTAL 4,807.91 5,587.66
Note: 26 FINANCE COSTS (` in Lacs)
Particulars Year ended
31st March, 2016
Year ended
31st March, 2015
Manufacturing Expenses
2.18 0.62
5,916.48
20,049.14
Building 254.62
2,609.39
Sub Total (a) 30,751.90 29,703.45
Administrative Expenses
Insurance
Directors' Commission 28.00 25.00
Directors' Sitting Fee 99.56
Other Administrative Expenses 11,191.65
Sub Total (b) 11,162.38 13,655.73
Selling Expenses
Freight
Other Selling Expenses 2,602.30
Sub Total (c) 16,738.80 16,078.76
Other Expenses
Asset Written Off 6.85 3.95
Provision for Doubtful Advance to supplier 21.66
Loss on Sale of Fixed Assets (Net) 9.82 54.41
Donation 15.69 13.03
Foreign Exchange Fluctuation loss (Net) -
Amortisation for Pre operative expenses
Bad Debts 2.43 16.61
Provision for Doubtful Debts -
88.36 12.04
Sub Total (d) 6,013.73 204.05
TOTAL (a + b + c + d) 64,666.81 59,641.99
Note: 27 OTHER EXPENSES (` in Lacs)

129AnnualReport2015-16
Notes to Consolidated Financial Statements for the year ended 31st March 2016
Note: 28 OTHER EXPLANATORY NOTES
A. Estimated amount of contracts remaining to be executed on capital account and not provided for (Net of Advances of ̀
Previous Year : ` 249.84 Lacs) ` 1986.90 Lacs (Previous Year : `
a) Disputed matters under litigation:
b) Bills discounted with Banks ` 422.12 Lacs (Previous Year : ` Nil)
c) Custom duty saved amounting to ` ` 2,639.24 Lacs) in respect of import of machinery under
d) Guarantees given to/by the banks ` 90,186.91 Lacs (Previous Year : ` 86,495.83 Lacs) (utilised amount `
(Previous Year : ` ` Nil (Previous Year : ` 2.00 Lacs) on behalf of other bodies corporate.
e) Liability against non-receipts of “C” Form ` 2.25 Lacs (Previous Year : ` Nil)
f) Service Agreements
Polyplex (Thailand) Public Company Limited
As at March 31, 2016, the Company had commitments totalling ` 283.56 Lacs (Previous Year: `
service agreements. These agreements expire between April 2016 and September 2019.
C. Polyplex (Thailand) Public Company Limited
Particulars Current Year Previous Year
103.36
41.14 29.14
Service Tax 12.55 -
Income Tax 382.46
Others 23.93 25.36
(` in Lacs)
POLYPLEX CORPORATION LIMITED
D. i. The Foreign Currency Exposure that are not hedged by a derivative instrument or otherwise are as follows:
Particulars Document
Currency
Current Year Previous Year
Amount
(Fx)
Amount
(` in Lacs)
Amount
(Fx)
Amount
(` in Lacs)
Loans - Long Term USD 9,586.53 21,246,981
6,630,551
- - 210,000,000 1,115.31
Loans - Short Term USD 2,646.28 5,383.34
63,000 2,165,299 1,462.02
Debtors USD 3,823,162 2,535.63 3,591.46
480,496 800,356 540.24
Sundry Creditors USD 195,804 129.90 194,623 121.84
0.45 40,000 0.21
Other Liabilities USD 49.66 92,296
666 0.50 - -

130 PolyplexCorporation Ltd.
Note: 27 OTHER EXPLANATORY NOTES (contd...)
Notes to Consolidated Financial Statements for the year ended 31st March 2016
Particulars Document
Currency
Current Year Previous Year
Amount
(Fx)
Amount
(` in Lacs)
Amount
(Fx)
Amount
(` in Lacs)
USD - - 86,033 46.99
iii. Polyplex Corporation Limited took certain option structure, forward and interest rate / currency swap contracts to cover the
` Nil (Previous Year : ` 139.35 Lacs) on
foreign exchange derivatives taken for payments to suppliers of imported capital goods and loss (net) of ` Nil (Previous Year :
loss (net) of ` 209.32 Lacs) on mark to market on outstanding derivatives as on March 31, 2016 has been capitalized / shown
POLYPLEX CORPORATION LIMITED
ii. The Foreign Currency Exposure that are hedged by a derivative instrument or otherwise are as follows:
Particulars Current Year Previous Year
Contract
Sell/Buy
Currency Amount
(Fx)
Contract
Sell/Buy
Currency Amount
(Fx)
Forward Contracts USD 1,000,000 USD 3,250,000
Forward Contracts 689,422 602,644
Forward Contracts USD USD -
SWAP Deal USD - USD 2,000,000
POLYPLEX (THAILAND) PUBLIC COMPANY LIMITED (INCLUDING SUBSIDIARIES)Particulars Current Year Previous Year
Contract
Sell/Buy
Currency Amount
(Fx)
Contract
Sell/Buy
Currency Amount
(Fx)
Forward Contracts Baht/USD USD Baht/USD USD 3,840,000
USD/Baht USD 31,390,000 USD/Baht USD 30,050,000
Baht/Euro Euro 360,000 Baht/Euro Euro 480,000
Euro/Baht Euro 1,260,000 Euro/Baht Euro 1,110,000
19,420,000 55,650,000
Euro/TL Turkish Lira 3,000,000 Euro/TL Turkish Lira 2,000,000
Euro/USD USD 3,000,000 Euro/USD USD 2,500,000
E. (i) During the year, Polyplex USA LLC (PU) has provided for the impairment loss of ` 6565.82 Lacs on its manufacturing assets,
and the same is recorded as exceptional item.
(ii) During the previous year, PAPL and PE have entered into a Share Purchase Agreement (SPA) to sell their respective stake, 100%
Indorama Ventures Public Company Limited, Thailand,(IVL). The sales transaction is executed as on 2nd March 2015, and the
net loss of `
Further, the above loss does not factor in deferred sales consideration of 6 million Euro (equivalent to ` 4,046.04 Lacs), which
F.

131AnnualReport2015-16
Note: 27 OTHER EXPLANATORY NOTES (contd...)
Notes to Consolidated Financial Statements for the year ended 31st March 2016
G. Operating Lease
POLYPLEX CORPORATION LIMITED
The Company has entered into operating lease agreement for a premise. Lease is not cancellable for a period of six years and
renewable thereafter on mutually agreed terms.
Particulars Current Year Previous Year- 20.10
Minimum Lease Payments- Not later than one year - -
- -- -
(` in Lacs)
POLYPLEX (THAILAND) PUBLIC COMPANY LIMITED
minimum rental payables under these leases as at March 31, 2016 are as follows:
Particulars Current Year Previous YearPayables withinNot later than one year 89.99
5.63Total 43.19 166.58
(` in Lacs)
Particulars Current Year Previous YearPayables withinNot later than one year 28.94 26.19
61.43 85.12Total 90.37 111.31
(` in Lacs)
H. Finance Lease Agreement
POLYPLEX (THAILAND) PUBLIC COMPANY LIMITED
agreements is 5 years.
I. Geographical Segment : Information about Geographical Segment:
S. No. Information about Geographical Segments (by location of customer and assets)
India Outside India Total
1 318,019.11 (81,085.69) (239,330.53) (320,416.22)
2 Carrying Amount of Segment Assets by location of assets 452,893.96
3 Capital Expenditure 2,428.30 2,288.19 (1,455.96) (10,468.60) (11,924.56)
(` in Lacs)
J. Earnings Per Equity Share (EPS)
Particulars Unit Current Year Previous Year(` in Lacs) 2,903.83
Weighted average number of equity shares considered as Denominator for calculation of Basic EPS
(Nos.) 31,984,600 31,984,600
Weighted average number of equity shares considered as Denominator for calculation of Diluted EPS
(Nos.) 31,984,600 31,984,600
Basic EPS (`) 9.08 11.86 Diluted EPS (`) 9.08 11.86

132 PolyplexCorporation Ltd.
Notes to Consolidated Financial Statements for the year ended 31st March 2016
Note: 27 OTHER EXPLANATORY NOTES (contd...)
i. Related parties with whom transactions have taken place during the year
Key Management Personnel/Key Managerial Personnel (KMP)
a. Mr. Sanjiv Saraf (Chairman)b.c.d.
Relative of Key Management Personnel a.Enterprises over which Key Management Personnel, their relatives and major shareholders
a. Beehive Systems Private Limitedb. Manupatra Information Solutions Private Limitedc. Manupatra Publishing Private Limitedd. Altivolus Infotech Private Limitede. Dalhousie Villa Private Limitedf.g.h.i. Abohar Power Generation Private Limitedj.k.l.m.n.o.p. S. D. College Society (Lahore), New Delhi
ii. Nature of Transactions with Related PartiesS. No. Particulars Key
Management
Personnel
Relative of
KMP
Enterprises
over which
influence exist
Total
1 Purchase of Material / Services - 29.19 58.89 ( - ) (26.19) (55.89)
2 - -( - ) ( - )
3 Sale of Shares - - - -( - ) ( - ) (2.50) (2.50)
4 544.98 - - 544.98 (398.44) ( - ) ( - ) (398.44)
5 Commission to Director 28.00 - - 28.00 (25.00) ( - ) ( - ) (25.00)
6 - - 126.60 126.60 ( - ) ( - ) (134.38) (134.38)
Director's Sitting Fees 21.40 - - 21.40 (11.00) ( - ) ( - ) (11.00)
8 Donation Given - - 4.00 4.00 ( - ) ( - ) ( - ) ( - )
9 - - 166.21 166.21 ( - ) ( - ) (252.33) (252.33)
Outstanding at year end10 - - 8.64 8.64
( - ) ( - ) (4.35) (4.35)
11 - 20.25 5.00 25.25
( - ) (20.25) (5.00) (25.25)
(` in Lacs)

133AnnualReport2015-16
Notes to Consolidated Financial Statements for the year ended 31st March 2016
Note: 27 OTHER EXPLANATORY NOTES (contd...)
ii. Nature of Transactions with Related Parties
S. No. Particulars Key Management
Personnel
Relative ofKMP
Enterprises over which
influence exist
Total
Outstanding at year end (contd...)
12 Deposit Payable - - 4.66 4.66
( - ) ( - ) (4.66) (4.66)
13 - - 9.59 9.59
( - ) ( - ) (3.12) (3.12)
14 Loan - -
( - ) ( - )
15 Payables 28.00 -
(25.00) ( - ) (6.94) (31.94)
16 - 81.35 - 81.35
( - ) ( - ) ( - ) ( - )
Note:
(` in Lacs)
Disclosure of Material Transactions with related parties:
S. No. Particulars KMP /
Relative of
KMP
Enterprises
over which
influence exist
1 Purchase of Material / Services
-
(-)
-
(-)
Dalhousie Villa Private Limited -
(-)
2 Services Rendered
Beehive Systems Private Limited - 36.00
(-) (36.00)
- 32.12
(-)
Manupatra Information Solutions Private Limited - 21.99
(-) (25.95)
- 15.53
(-) (-)
Altivolus Infotech Private Limited - 15.96
(-) (15.96)
3 Expenses Recovered
Beehive Systems Private Limited - 36.44
(-) (36.63)
Altivolus Infotech Private Limited - 33.29
(-) (49.33)
Manupatra Information Solutions Private Limited - 19.89
(-) (16.00)
-
(-)
(` in Lacs)

134 PolyplexCorporation Ltd.
Notes to Consolidated Financial Statements for the year ended 31st March 2016
Note: 27 OTHER EXPLANATORY NOTES (contd...)
Disclosure of Material Transactions with related parties:
S. No. Particulars KMP /
Relative of
KMP
Enterprises
over which
influence exist
4 Payment to Key Managerial Personnel
Mr. Sanjiv Saraf 28.00 -
(54.14) (-)
-
(-)
Mr. Manish Gupta 185.23 -
(-)
52.53 -
(39.30) (-)
5 Donation Given
S. D. College Society (Lahore), New Delhi - 4.00
(-) (-)
6 Interest Received
- 166.21
(-) (252.33)
* To the extent payable
` 9.91 Lacs for FY 2014-15
(` in Lacs)
L. ` 314.50 Lacs (including
contribution to Superannuation fund and Provident fund) and does not include payment of ̀ ` 0.66 Lacs paid towards
leave encashment and medical reimbursements as per the policy of company, in terms of approval of the shareholders as per
`
Lacs, for which application for approval is pending with Ministry of Corporate Affairs, Government of India.
M. ` Lacs with two decimals.
N.
As per our report of even date attached For and on behalf of the Board of Directors
For Lodha & Co.
Chartered Accountants Sanjiv Saraf Pranay Kothari Brij Kishore Soni
Chairman Executive Director Director
DIN: 00003998 DIN: 00004003 DIN: 00183432
N. K. Lodha
Partner Manish Gupta Ashok Kumar Gurnani
Membership No. 085155
Place: New Delhi Place: Noida
Date: May 30, 2016 Date: May 30, 2016

135AnnualReport2015-16
FOR
M A
OC
-I
Sr.
No.
Nam
e of
the
Subs
idia
ry C
ompa
nies
an
d C
ount
ry o
f Inc
orpo
ratio
nC
urre
ncy
Shar
eC
apita
lR
eser
ve &
Surp
lus/
Tota
lA
sset
sTo
tal
Liab
ilitie
sD
etai
ls o
fIn
vest
men
t(o
ther
than
insu
bsid
iarie
s)
Turn
over
/In
com
e(L
oss)
Bef
ore
Taxa
tion
Pro
visi
onfo
rTa
xatio
n(L
oss)
Aft
erTa
xatio
n
Pro
pose
dD
ivid
end
% o
f sha
reho
ldin
g(D
irect
ly a
nd/o
r th
roug
h ot
her
Subs
idia
ry/i
es)
1Po
lypl
ex (A
sia)
Pte
. Ltd
.,Si
ngap
ore
US
$11
.30
1,58
3.36
1,60
2.85
1,60
2.85
66.5
326
.39
1.18
25.2
1–
100.
00%
106,
069.
0210
6,06
9.02
4,40
2.64
1,66
8.28
–2
Poly
plex
(Th
aila
nd) P
ublic
Com
pany
Lt
d., T
haila
ndTh
ai B
aht
8,00
0.00
80,5
40.1
980
,540
.19
–(3
,319
.51)
–51
.00%
15,0
23.1
236
,858
.52
151,
245.
6515
1,24
5.65
–(5
03.2
6)(6
,233
.68)
–3
Poly
plex
(Si
ngap
ore)
Pte.
Ltd
., Si
ngap
ore
Euro
91.4
554
.04
145.
5414
5.54
–0.
01(0
.08)
0.00
(0.0
8)–
51.0
0%4,
049.
05–
(5.9
9)–
(5.9
9)–
4Po
lypl
ex E
urop
a Po
lyes
ter F
ilm S
anay
i Ve
Tic
aret
A.S
., Tu
rkey
Euro
40.3
61,
582.
29–
1,01
6.43
168.
063.
0616
5.00
–51
.00%
3,02
4.05
118,
556.
21–
12,5
92.2
322
9.28
12,3
62.9
5–
5Po
lypl
ex T
radi
ng (S
henz
hen)
Com
pany
Lt
d., C
hina
YUAN
(3.8
6)59
.61
59.6
1–
83.4
62.
492.
12–
51.0
0%(3
9.46
)60
9.45
609.
45–
853.
2925
.46
–6
US
$22
.00
(1.1
5)20
.85
20.8
5–
0.96
(0.1
3)0.
06(0
.19)
–10
0.00
%1,
455.
86–
63.5
3(8
.60)
–U
S $
366.
16(4
.43)
383.
4538
3.45
––
3.64
–51
.00%
(293
.16)
––
(240
.88)
4644
.84
–8
Poly
plex
USA
LLC
, USA
US
$36
4.59
(261
.01)
–1,
134.
29(1
03.9
5)–
51.0
0%24
,126
.84
90,5
05.9
290
,505
.92
–4,
643.
52(1
1,52
2.44
)–
9Ec
oBlu
e Li
mite
d, T
haila
ndTh
ai B
aht
106.
50–
166.
3834
.05
132.
33–
200.
001,
825.
691,
825.
69–
2,51
2.58
312.
4463
.94
248.
50–
10Pr
ivat
e Li
mite
d, In
dia
(191
8.89
)64
.84
––
100.
00%
11Po
lypl
ex E
urop
e B.
V., N
ethe
rland
Euro
2.00
2.40
33.4
433
.44
–50
.81
0.36
1.42
–51
.00%
149.
852,
505.
562,
505.
56–
106.
40–
12Po
lypl
ex P
aket
lem
e C
ozum
leri
Sana
yi
Ve T
icar
et A
noni
m S
irket
i, Tu
rkey
1.00
2.65
85.3
985
.39
–23
5.86
2.43
0.49
1.94
–51
.00%
23.3
561
.89
1,99
4.26
1,99
4.26
–5,
508.
4511
.44
45.3
1–
PART
“A”:
SU
BS
IDIA
RIE
S (I
nfor
mat
ion
in re
spec
t of e
ach
Sub
sidi
ary
with
am
ount
s)(A
mou
nt in
Lac
s)
Not
e :
2 N
ames
of S
ubsi
diar
ies
whi
ch a
re y
et to
com
men
ce o
pera
tions
: N
IL3
Nam
es o
f Sub
sidi
arie
s w
hich
hav
e be
en li
quid
ated
or s
old
durin
g th
e ye
ar :
NIL
Fo
r and
on
beha
lf of
the
Boa
rd o
f Dire
ctor
s
S
anjiv
Sar
af
Pra
nay
Kot
hari
B
rij K
isho
re S
oni
Man
ish
Gup
ta
Ash
ok K
umar
Gur
nani
Pla
ce: N
oida
Dat
e:
May
30,
201
6 D
IN: 0
0003
998
DIN
: 000
0400
3 D
IN: 0
0183
432

136 PolyplexCorporation Ltd.
NOTES

Polyplex Corporation Limited CIN: L25209UR1984PLC011596