Enhancing Potential - World Bank
182
Enhancing Potential WORLD BANK EAST ASIA AND PACIFIC ECONOMIC UPDATE APRIL 2018
Transcript of Enhancing Potential - World Bank

Enhancing Potential
WORLD BANK EAST ASIA AND PACIFIC ECONOMIC UPDATE APRIL 2018


WORLD BANK EAST ASIA AND PACIFIC ECONOMIC UPDATE APRIL 2018
Enhancing Potential

© 2018 International Bank for Reconstruction and Development / The World Bank1818 H Street NW, Washington, DC 20433Telephone: 202-473-1000; Internet: www.worldbank.org
Some rights reserved
1 2 3 4 20 19 18 17
This work is a product of the staff of The World Bank with external contributions. The findings, interpretations, and conclusions expressed in this work do not necessarily reflect the views of The World Bank, its Board of Executive Directors, or the governments they represent. The World Bank does not guarantee the accuracy of the data included in this work. The boundaries, colors, denominations, and other information shown on any map in this work do not imply any judgment on the part of The World Bank concerning the legal status of any territory or the endorsement or acceptance of such boundaries.
Nothing herein shall constitute or be considered to be a limitation upon or waiver of the privileges and immunities of The World Bank, all of which are specifically reserved.
Rights and Permissions
This work is available under the Creative Commons Attribution 3.0 IGO license (CC BY 3.0 IGO) http://creativecommons.org/licenses/by/3.0/igo. Under the Creative Commons Attribution license, you are free to copy, distribute, transmit, and adapt this work, including for commercial purposes, under the following conditions:
Attribution—Please cite the work as follows: World Bank. 2018. “Enhancing Potential” East Asia and Pacific Economic Update (April), World Bank, Washington, DC. Doi: 10.1596/978-1-4648-1283-5. License: Creative Commons Attribution CC BY 3.0 IGO
Translations—If you create a translation of this work, please add the following disclaimer along with the attribution: This translation was not created by The World Bank and should not be considered an official World Bank translation. The World Bank shall not be liable for any content or error in this translation.
Adaptations—If you create an adaptation of this work, please add the following disclaimer along with the attribution: This is an adaptation of an original work by The World Bank. Views and opinions expressed in the adaptation are the sole responsibility of the author or authors of the adaptation and are not endorsed by The World Bank.
Third-party content—The World Bank does not necessarily own each component of the content contained within the work. The World Bank therefore does not warrant that the use of any third-party-owned individual component or part contained in the work will not infringe on the rights of those third parties. The risk of claims resulting from such infringement rests solely with you. If you wish to re-use a component of the work, it is your responsibility to determine whether permission is needed for that re-use and to obtain permission from the copyright owner. Examples of components can include, but are not limited to, tables, figures, or images.
All queries on rights and licenses should be addressed to World Bank Publications, The World Bank Group, 1818 H Street NW, Washington, DC 20433, USA; e-mail: [email protected].
ISBN (electronic): 978-1-4648-1283-5
DOI: 10.1596/978-1-4648-1283-5
Photo credits in this publication. Further permission required for reuse. • Cover: Achmad / World Bank. • Page 1: Nguyen Khanh / World Bank • Page 71: Sarouen Bou / World Bank • Page 107: AC Dimatatac / World Bank

Contents
List of Abbreviations xii
Preface and Acknowledgments xiv
Executive Summary xvi
Part I. Recent Developments and Outlook 1
I.A. Recent Developments 2Regional growth accelerated in 2017, capitalizing on supportive external conditions 2
Strong exports contributed to better-than-expected growth 7
Domestic demand remained robust across the region, reflecting improved confidence 8
Fiscal policies consolidated across much of the region in 2017 17
Over three-quarters of the developing EAP population are economically secure, partly thanks to labor-intensive growth 18
Credit growth has moderated, reflecting tighter regulations 21
External financial conditions have been supportive, as reflected in appreciating nominal exchange rates and rising asset valuations, while some turmoil has been experienced in early 2018 22
Recent developments in the Pacific Island Countries 25
I.B. Outlook and Risks 26Growth in developing EAP is expected to remain robust 26
Domestic demand will remain the main driver of regional growth 31
With the prospects for continued growth, poverty is expected to continue declining 32
Fiscal deficits and debt levels are expected to remain in check 33
A more rapid pace of monetary policy normalization in advanced economies could increase volatility and exacerbate vulnerabilities 34
Uncertainty stemming from renewed protectionist sentiment and geopolitical tensions could hamper exports and growth 39
The Pacific Islands remain vulnerable to shocks 39
I.C. Policy Considerations 40In the short term, authorities need to address the risks to stability 40
Lifting long-term growth potential 45
Enhancing economic security 63
An agenda for the Pacific Island Countries 63
Bibliography 67
ENHANCING POTENTIAL
LIST OF CONTENTS III

Part II. Medium-Term Development Agenda 71
II.A. GrowingSmarter:LearningandEquitableDevelopmentinEastAsiaandPacific 72The state of education in EAP 72
Policies for improving education systems 76
A way forward 84
Annex: Elements of policies and practices that promote learning 85
II.B. The Future of Manufacturing-Led Development in East Asia 86The role of manufacturing in East Asia’s development 86
Stylized facts: East Asia in the global manufacturing landscape 87
Trends shaping opportunities for future production 90
Likely impact on future opportunities in developing East Asia 94
Preparing for change 96
Conclusion 101
Bibliography 103
Part III. Country Summaries and Key Indicators 107Cambodia 108
China 111
Fiji 114
Indonesia 117
Lao PDR 120
Malaysia 123
Mongolia 126
Myanmar 129
North Pacific Islands 132
Papua New Guinea 136
Philippines 139
Solomon Islands 142
South Pacific Islands 145
Thailand 149
Timor-Leste 152
Vietnam 155
Contents continued
EAST ASIA AND PACIFIC ECONOMIC UPDATE APRIL 2018
Iv LIST OF CONTENTS

List of Figures
Part I. Recent Developments and Outlook
I.A. Recent DevelopmentsFigure I.A.1. Growth in the second half of 2017 was better than anticipated 2
Figure I.A.2. Manufacturing activity significantly improved during the second half of 2017 2
Figure I.A.3. Large economies surprised with better-than-expected growth rates 6
Figure I.A.4. GDP growth performance varies across smaller economies 6
Figure I.A.5. Export values continued to recover in the second half of 2017… 7
Figure I.A.6. …as have export volumes 7
Figure I.A.7. Exports of intermediate and final electronic products accelerated in 2017 8
Figure I.A.8. Domestic demand remained robust in the second half of 2017 9
Figure I.A.9. EAP country record on public investment spending is mixed 16
Figure I.A.10. Imports have significantly expanded 16
Figure I.A.11. Current account balance developments are mixed 16
Figure I.A.12. After widening in 2016, fiscal deficits started to stabilize in 2017 17
Figure I.A.13. Poverty has continued to decline across the region 18
Figure I.A.14. The share of the economically secure and middle-class continues to expand 19
Figure I.A.15. Unemployment rates are on decline 19
Figure I.A.16. Real wage growth in 2017 was more modest 19
Figure I.A.17. Headline inflation has inched up, while remaining subdued 20
Figure I.A.18. Inflation has been stable overall 20
Figure I.A.19. Producer prices have eased in recent months 20
Figure I.A.20. Most larger countries held policy rates constant or reduced them slightly in 2017 21
Figure I.A.21. Real interest rates remain below the long-term average 21
Figure I.A.22. Credit growth was contained in most countries 21
Figure I.A.23. The stock of private sector debt has been contained, while remaining high in some economies 22
Figure I.A.24. Property prices rose in China, Malaysia, and the Philippines 22
Figure I.A.25. Net FDI inflows were robust in 2017 23
Figure I.A.26. Net FDI outflows from China eased in 2017 23
Figure I.A.27. Net portfolio flows were modestly positive in 2017 23
Figure I.A.28. Following a long rally, stock markets have experienced recent corrections 24
Figure I.A.29. External corporate and sovereign bond spreads continued to narrow, except for the correction in early 2018 24
Figure I.A.30. Many major currencies appreciated against the U.S. dollar during the second half of 2017… 25
Figure I.A.31. …while the Indonesian rupiah and the Philippine peso depreciated in real terms 25
ENHANCING POTENTIAL
LIST OF CONTENTS v

I.B. Outlook and RisksFigure I.B.1. Private consumption and investment are expected to remain the main contributors
to growth 31
Figure I.B.2. Deficits are generally expected to remain stable 33
Figure I.B.3. Growth in government debt is expected to be controlled 33
Figure I.B.4. Developing EAP’s banking sector is well capitalized, overall 35
Part II. Medium-Term Development Agenda
II.A. GrowingSmarter:LearningandEquitableDevelopmentinEastAsiaandPacificFigure II.A.1. Years of schooling in East Asia increased sixfold to equal the global average 73
Figure II.A.2. Forty percent of the region’s students are in education systems that perform above the OECD average 74
Figure II.A.3. Vietnamese and Chinese students from the bottom 40 percent of household income outscored the average OECD student in PISA science and math in 2015 75
Figure II.A.4. A framework for effective schools and education systems 76
Figure II.A.5. Many students in EAP cannot read a single word in second grade 81
Figure II.A.6. Families do not have consistent service coverage between pregnancy and preschool 82
Figure II.A.7. Closing the gap in achievement between socioeconomic groups is affordable 82
II.B. The Future of Manufacturing-Led Development in East AsiaFigure II.B.1. Share of global manufacturing value added in China, global regions, and high-
income countries, 1994–2015 87
Figure II.B.2. Change in manufacturing value added as a share of domestic GDP among countries with expanding global shares, 1994–2014 88
Figure II.B.3. Percentage point change in GDP share from representative manufactures, selected East Asia countries, 1994–2014 89
Figure II.B.4. Change in domestic value added of China’s exports across manufacturing sectors, 1995–2011 91
Figure II.B.5. Change in manufacturing wages and relative unit labor costs, China and selected LMICs, 2003–10 91
Figure II.B.6. Operational stock of industrial robots in the manufacturing sector, selected countries and regions, 1995–2018 93
Figure II.B.7. Operational stock of industrial robots, selected countries and regions, 2015 93
Figure II.B.8. Use of industrial robots in China, by manufacturing subsector, 2004–15 96
Figure II.B.9. Country distribution in competitiveness, capabilities, and connectedness, by manufacturing subsector scenario, circa 2012–14 101
List of Figures continued
EAST ASIA AND PACIFIC ECONOMIC UPDATE APRIL 2018
vI LIST OF CONTENTS

Part III. Country Summaries and Key Indicators
Cambodia
Figure 1. Real GDP growth, contribution to real growth 110
Figure 2. Clothing and other textile products export growth 110
China
Figure 1. Contribution to real GDP growth year-on-year 113
Figure 2. Poverty rates, estimates and projections 113
Fiji
Figure 1. Real GDP growth 116
Figure 2. International and national poverty rates 116
Indonesia
Figure 1. Real GDP growth and contribution to growth 119
Figure 2. Poverty rate, actual and projected 119
Lao PDR
Figure 1. Real GDP growth, contribution to real growth 122
Figure 2. Actual and projected poverty rates and GDP per capita 122
Malaysia
Figure 1. Real GDP growth, contribution to real growth 125
Figure 2. Incidence of poverty at national poverty lines 125
Mongolia
Figure 1. Real GDP growth, contribution to real growth 128
Figure 2. Poverty rate (official poverty line): 2010–16 128
Myanmar
Figure 1. Real GDP growth and sector contribution to real GDP growth 131
Figure 2. CPI inflation and food/non-food contribution to CPI inflation 131
North Pacific Islands
Figure 1. Incidence of poverty at international poverty lines 135
Figure 2. Public and publicly guaranteed external debt 135
Papua New Guinea
Figure 1. Real GDP growth, contribution to real growth 138
Figure 2. Key fiscal indicators 138
List of Figures continued
ENHANCING POTENTIAL
LIST OF CONTENTS vII

Philippines
Figure 1. Real GDP growth, contribution to real growth 141
Figure 2. The sustained growth of the economy makes it likely that poverty reduction has continued 141
Solomon Islands
Figure 1. Trade and trade balance 144
Figure 2. Per capita GDP, growth and level of index 144
South Pacific Islands
Figure 1. Incidence of poverty at international poverty lines and national hardship thresholds 148
Figure 2. Public and publicly guaranteed external debt 148
Thailand
Figure 1. Contribution to annual real GDP growth 151
Figure 2. Poverty rate and GDP per capita growth 151
Timor-Leste
Figure 1. Contributions to real GDP growth 154
Figure 2. Fiscal aggregates 154
Vietnam
Figure 1. Real GDP growth and contribution to Real GDP growth 157
Figure 2. Actual and projected poverty rates and eal GDP per capita 157
List of Figures continued
EAST ASIA AND PACIFIC ECONOMIC UPDATE APRIL 2018
vIII LIST OF CONTENTS

List of Tables
Part I. Recent Developments and Outlook
I.B. Outlook and RisksTable I.B.1. Developing East Asia and Pacific: GDP growth projections 27
Table I.B.2. Poverty in developing EAP is projected to continue falling 32
Part II. Medium-Term Development Agenda
II.A. GrowingSmarter:LearningandEquitableDevelopmentinEastAsiaandPacificTable II.A.1. EAP education systems by performance category 73
II.B. The Future of Manufacturing-Led Development in East AsiaTable II.B.1. New pressures differentially affecting feasibility of subsectors going forward 95
Table II.B.2. New pressures differentially affecting feasibility of subsectors going forward – and the priorities they raise in the 3Cs agenda 100
Part III. Country Summaries and Key IndicatorsCambodia Selected Indicators 110
China Selected Indicators 113
Fiji Selected Indicators 116
Indonesia Selected Indicators 119
Lao PDR Selected Indicators 122
Malaysia Selected Indicators 125
Mongolia Selected Indicators 128
Myanmar Selected Indicators 131
North Pacific Islands Selected Indicators 135
Papua New Guinea Selected Indicators 138
Philippines Selected Indicators 141
Solomon Islands Selected Indicators 144
South Pacific Islands Selected Indicators 148
Thailand Selected Indicators 151
Timor-Leste Selected Indicators 154
Vietnam Selected Indicators 157
ENHANCING POTENTIAL
LIST OF CONTENTS Ix

List of Boxes
Part I. Recent Developments and Outlook
I.A. Recent DevelopmentsBox I.A.1. Recent Global Developments 3
Figure BI.A.1.1. Global GDP growth, 2007–18 3
Figure BI.A.1.2. Regional GDP growth, 2012–18 3
Figure BI.A.1.3. Global trade growth 4
Figure BI.A.1.4. International commodity prices 4
Box I.A.2. E-Commerce Development in China 9
Figure BI.A.2.1. Total e-commerce trade volume in China 10
Figure BI.A.2.2. Online retail sales in China 10
Figure BI.A.2.3. Taobao Villages 11
Box I.A.3. Progress and Impact of Excess Capacity Reduction in China 13
Figure B1.A.3.1. Industrial capacity utilization rates in China 13
Figure B1.A.3.2. Capacity utilization rates and share of state investment, by sector, 2015 13
Figure B1.A.3.3. Fixed asset investment in excess capacity sectors 14
Figure B1.A.3.4. Production capacity in key excess capacity sectors 14
Figure B1.A.3.5. Value added of industry, by excess capacity and other sectors 15
Figure B1.A.3.6. Employment in excess capacity sector 15
I.B. Outlook and RisksBox I.B.1. Global Outlook and Risks 28
Figure BI.B.1.1. Global GDP growth 28
Figure BI.B.1.2. Regional GDP growth 28
Figure BI.B.1.3. World commodity prices forecast 30
Box I.B.2. Intraregional Banking Trends in EAP 36
Figure B1.B.2.1. Cross-border claims on counterparties resident in different regions 36
I.C. Policy ConsiderationsBox I.C.1. Behavioral Science for Development in East Asia 42
Box I.C.2. Potential Growth in East Asia and the Pacific 45
Figure BI.C.2.1. Evolution and estimation of potential output growth 46
Figure BI.C.2.2. Potential output growth under illustrative reform scenarios 48
Box I.C.3. EAP Infrastructure Status Update – Access, Costs, and Private Participation 50
Figure BI.C.3.1. Electricity service coverage, ASEAN and benchmark countries 50
Figure BI.C.3.2. Piped water supply coverage, ASEAN and benchmark countries 51
Figure BI.C.3.3. Household connection to sewerage, ASEAN and benchmark countries 51
EAST ASIA AND PACIFIC ECONOMIC UPDATE APRIL 2018
x LIST OF CONTENTS

Box I.C.4. Comprehensive and Progressive Agreement on Trans-Pacific Partnership 53
Figure BI.C.4.1. Aggregate projected gains to income by 2030 55
Figure BI.C.4.2. Projected gains to income by 2030 across East Asia 55
Box I.C.5. Exposure of Developing EAP Economies Through the Belt & Road Initiative to China Trade Shocks 57
Figure BI.C.5.1. Exposure to import competition from China, 2015 58
Figure BI.C.5.2. Exposure to competition from China in third export markets, 2015 58
Box I.C.6. Are East Asian Countries More Innovative? 60
Table BI.C.6.1. Developing countries in East Asia outperform other developing countries in innovation outputs, despite not investing significantly more in inputs 61
Figure BI.C.6.1. EAP countries have efficient innovation systems 61
Box I.C.7. Strengthening Economic Resilience through Temporary Migration – Lessons from Australia’s Seasonal Worker Programme 64
Figure BI.C.7.1. Annual Arrivals under the Seasonal Worker Programme, FY2013–FY2017 64
Figure BI.C.7.2. The vast majority of workers remit money while in Australia 64
List of Boxes continued
ENHANCING POTENTIAL
LIST OF CONTENTS xI

ABIF ASEAN Banking Integration FrameworkAEC ASEAN Economic CommunityAI artificial intelligenceAKPK Agensi Kaunseling dan Pengurusan Kredit
(Malaysia)APEC Asia-Pacific Economic CooperationB&R Belt & Road Initiativebbl per barrelBRI Belt & Road InitiativeB-S-J-G Beijing, Shanghai, Jiangsu, and
GuangdongCPI Consumer Price IndexCPTPP Comprehensive and Progressive Agreement
for Trans-Pacific PartnershipEGRA Early Grade Reading AssessmentsEMDEs emerging market and developing
economiesFDI foreign direct investmentFY fiscal yearGDP gross domestic productGEP growth elasticity of povertyGVCs global value chainsHICs high-income countriesICT information and communication
technologyIMF International Monetary FundIoT the internet of things IP intellectual propertyLGFB local government financing vehiclesLMICs lower-middle-income countries NBS National Bureau of Statistics (China)n.e.c. not elsewhere classifiedNPLs nonperforming loansOECD Organisation for Economic Co-operation
and Development
OPEC Organization of the Petroleum Exporting Countries
PBOC People’s Bank of ChinaPISA Programme for International Student
AssessmentPMI Purchasing Managers’ IndexPPI private participation in infrastructurePPP purchasing power parityQ1 first quarterQ2 second quarterQ3 third quarterQ4 fourth quarterQABs Qualified ASEAN BanksR&D research and developmentRCA revealed comparative advantageRCEP Regional Comprehensive Economic
PartnershipSAAR seasonally adjusted annual rateSME small and medium-sized enterpriseSOE state-owned enterpriseSWP Australian Seasonal Worker ProgrammeTCJA Tax Cuts and Jobs Act (United States)TFP total factor productivity3Cs competitiveness, capabilities, and
connectednessTIMSS Trends in International Mathematics and
Science StudyTPP Trans-Pacific PartnershipUNCTAD United Nations Conference on Trade and
DevelopmentUNICEF United Nations Children’s FundWTO World Trade Organizationyoy year-over-year
List of Abbreviations
EAST ASIA AND PACIFIC ECONOMIC UPDATE APRIL 2018
xII LIST OF ABBREVIATIONS

Regions, World Bank Classification and Country Groups
ASEAN Association of Southeast Asian NationsEAP East Asia and PacificECA Eastern Europe and Central AsiaLAC Latin America and the Caribbean
MENA Middle East and North AfricaMNA Middle East and North AfricaPICs Pacific Island CountriesSAR South AsiaSSA Sub-Saharan Africa
List of Abbreviations continued
Country Abbreviations
AUS AustraliaCAN CanadaCHN ChinaCYM Cayman IslandsDEU GermanyFJI FijiFSM Federation States of MicronesiaHKG Hong Kong SAR, ChinaIDN IndonesiaJPN JapanKHM CambodiaKIR KiribatiKOR Republic of KoreaLAO Lao People’s Democratic RepublicMHL Marshall Islands
MNG MongoliaMMR MyanmarMYS MalaysiaNRU NauruPHL PhilippinesPLW PalauPNG Papua New GuineaSGP SingaporeSLB Solomon IslandsTHA ThailandTLS Timor-LesteTON TongaTUV TuvaluUSA United StatesVNM VietnamVUT VanuatuWSM Samoa
Currency Units
A Australian dollar$NZ New Zealand dollarB Thai bahtCR Cambodian rielD Vietnamese dongF$ Fiji dollarK Myanmar kyatK Papua New Guinea kina
Kip Lao kipP Philippine pesoRM Malaysian ringgitRMB Chinese renminbiRp Indonesian rupiahSI$ Solomon Islands dollarTog Mongolian turhrikUS$ Timor-Leste (U.S. dollar)US$ United States dollar
ENHANCING POTENTIAL
LIST OF ABBREVIATIONS xIII

Preface and Acknowledgments
The East Asia and Pacific Economic Update is a joint product of the World Bank Office of the Chief Economist, East Asia and Pacific Region, and the Macroeconomics, Trade and Investment Global Practice, prepared in collaboration with the Poverty and Equity Global Practice, the Development Prospects Group, and the Finance and Markets Global Practice. The report was prepared by Ha Nguyen (Co-Task Team Leader) and Miguel Eduardo Sanchez Martin (Co-Task Team Leader), under the guidance of Sudhir Shetty (Chief Economist, East Asia and Pacific Region). Ndiame Diop, Deepak Mishra, and Salman Zaidi provided valuable advice to the team.
Chapter I was prepared by Miguel Eduardo Sanchez Martin (lead), Ekaterine Vashakmadze, Judy Yang, Vera Kehayova, and Ha Nguyen. Contributions were received from the Chapter III team (listed below), as well as Ana Maria Aviles, Paulo Bastos, Giorgia Demarchi, Jesse Doyle, Gunjan Gulati, Taufik Ramadhan Indrakesuma, Brad Larson, Yan Li, Xubei Luo, Darwin Marcelo, Samantha De Martino, Serrana Murrica, Andy Mason, Keita Miyaki, Evgenij Najdov, Sjamsu Rahardja, Aditi Raina, Kenneth Simler, Bambang Sharnoko Sjahrir, Diego Sourrouille, Radu Tatucu, Anuja Utz, Renos Vakis, and Luan Zhao.
Chapter II was prepared by Michael Crawford and Elaine Ding (Chapter II.A), and Mary Hallward-Driemeier and Gaurav Nayyar (Chapter II.B).
Chapter III was prepared by staff from the Macroeconomics, Trade and Investment Global Practice and the Poverty and Equity Global Practice: Kiatipong Ariyapruchya, Reena Badiani-Magnusson, Davaadalai Batsuuri, Hans Beck, Andrew Blackman, Derek Hung Chiat Chen, Yew Keat Chong, Olga Da Conceicao, Kevin Chua, Kevin Cruz, Somneuk Davading, Georgia Demarchi, Gabriel Demombynes, Reno Dewina, Viet Tuan Dinh, Sebastian Eckardt, Kim Alan Edwards, Samuel Freije-Rodriguez, Frederico Gil Sander, Imogen Halstead, Birgit Hansl, Kristen Himelein, Virginia Horscroft, Annette De Kleine, Mizuho Kida, David Knight, Chandana Kularatne, Jonathan William Lain, John Litwack, Xubei Luo, Sodeth Ly, Elitza Mileva, Thi Da Myint, Shabih Ali Mohib, Arvind Nair, Evgenij Najdov, Jean-Pascal Nguessa Nganou, Carlos Orton Romero, Keomanivone Phimmahasay, Obert Pimhidzai, Sharon Faye Alariao Piza, Ririn Purnamasari, Rong Qian, Richard Record, Jaffar Al Rikabi, Imam Setiawan, Dhruv Sharma, Altantsetseg Shiilegmaa, Kenneth Simler, Kimsun Tong, Ikuko Uochi, Judy Yang, Gabriel Roberto Zaourak, and Luan Zhao. The work was managed by Ndiame Diop and Deepak Mishra for the Macroeonomics, Trade and Investment Global Practice, and by Salman Zaidi for the Poverty and Equity Global Practice. Thi Thanh Than Bui, Kristina Catherine Tan Mercado, and Dave Stephan made substantive contributions to the model, table production, and assisting staff with their forecasts. Arsianti Arsianti, Angkanee Luangpenthong, and Yulita Sari Soepardjo provided technical support.
Assistance with communications and outreach was provided by Marcela Sanchez-Bender, Lívia Pontes, and Alejandro Cedeno Ulloa (External Communications, East Asia and Pacific Region). The report was edited by Diane Stamm, and designed and typeset by Budy Wirasmo. Administrative support was provided by Cecile Wodon.
EAST ASIA AND PACIFIC ECONOMIC UPDATE APRIL 2018
xIv PREFACE AND ACKNOWLEDGMENTS

Throughout the report, geographic groupings are defined as follows:
Developing EastAsia andPacific comprises Cambodia, China, Indonesia, Lao People’s Democratic Republic (PDR), Malaysia, Mongolia, Myanmar, Papua New Guinea, the Philippines, Thailand, Timor-Leste, Vietnam, and the Pacific Island Countries.
The Pacific IslandCountries comprise Fiji, Kiribati, the Marshall Islands, the Federated States of Micronesia, Palau, Samoa, the Solomon Islands, Tonga, Tuvalu, and Vanuatu.
The ASEAN member countries comprise Brunei Darussalam, Cambodia, Indonesia, Lao PDR, Malaysia, Myanmar, the Philippines, Singapore, Thailand, and Vietnam.
The ASEAN-5 comprise Indonesia, Malaysia, the Philippines, Thailand, and Vietnam.
This report is based on data available through March 27, 2018, inclusive.
Preface continued
ENHANCING POTENTIAL
PREFACE AND ACKNOWLEDGMENTS xv

Executive Summary
The global economy grew faster than expected in 2017, with a broad-based upturn. Growth increased in more than half of the world’s economies. In advanced economies, the recovery in growth was led by strong investment. More rapid growth among emerging market and developing economies reflected recovery in commodity exporters and continued robust activity in commodity importers. This synchronous global recovery provided a substantial boost to manufacturing and trade growth.
GrowthindevelopingEastAsiaandPacific(EAP)acceleratedslightlyin2017,reflectingthefavorableglobal environment. Regional growth was faster than earlier expectations, reflecting higher than expected growth in China, as well as in Malaysia, Thailand, and Vietnam. On the back of recovering commodity prices and a rebound in global trade and manufacturing, the region’s exports grew strongly. Private consumption remained solid in 2017, as consumer and producer confidence generally improved. While investment growth in China continued to ease, it accelerated in the rest of the region in 2017, amid improved business sentiment. Fiscal deficits were generally smaller. Inflation remains subdued in most countries. Regional financial markets generally remained buoyant. Bond spreads have continued to decline, net capital outflows have been contained, and currencies and asset prices have generally strengthened. In early 2018, however, financial volatility has increased in response to the prospects of faster monetary policy tightening in advanced economies and escalating trade tensions.
The growth outlook for the region remains favorable. After growing faster than expected in 2017, China is expected to slow in 2018, as a result of which growth in developing EAP as a whole will ease to 6.3 percent in 2018. Excluding China, growth in developing EAP is expected to remain stable in 2018, reflecting solid prospects in Thailand and some commodity exporters, notably Indonesia. Domestic demand will remain robust in most of the region’s economies and continue to underpin growth in 2018 and beyond. With economies operating close to their potential, price pressures are expected to rise.
Following stronger than anticipated growth in 2017, China is expected to slow moderately in 2018 as its economy continues to rebalance. This moderation of growth to 6.5 percent would be the result of the authorities’ greater focus on continuing the slowing of credit growth, further reducing excess capacity in some heavy industry sectors, and putting more emphasis on the quality of growth, including attention to environmental considerations.
Growth in the large ASEAN economies is expected to be robust and relatively stable in 2018. Indonesia and Thailand are expected to see slightly higher growth, reflecting improved prospects for investment and private consumption amid improved confidence. The Philippines will likely see growth remain at the same level, while continuing to be broad-based. In Vietnam and Malaysia, growth is expected to slow in 2018. In Vietnam, this reflects an adjustment following the strong rebound in agricultural production in 2017. In Malaysia, the slowdown in growth from its 2017 peak will be on account of the anticipated decline in public capital spending, which will be only partially offset by the continued expansion of exports and private investment.
Theprospectsfortheregion’ssmallereconomiesaregenerallyfavorable,reflectingstrongercommodityprices and higher investment. Mongolia’s success in stabilizing its economy coupled with higher commodity exports improve its growth prospects. Myanmar is also expected to grow faster, although the ongoing tensions in
EAST ASIA AND PACIFIC ECONOMIC UPDATE APRIL 2018
xvI EXECUTIVE SUMMARY

Rakhine State coupled with perceptions of slowing reform could hurt prospects. Papua New Guinea and Timor-Leste are likely to experience a cyclical recovery associated with firming commodity prices, although domestic policy uncertainties could limit their short-term growth prospects. The impact of the recent earthquake in Papua New Guinea could also affect growth prospects adversely. Cambodia is likely to see stable growth, while Lao PDR will likely see a slight slowing of growth in 2018 before rebounding modestly in 2019–2020, reflecting additional capacity expected to be installed in the electricity sector. Growth in Fiji and the Solomon Islands is projected to ease, while remaining around 3 percent over the medium term. Growth in the smaller Pacific Island Countries is expected to remain modest and volatile due to their high reliance on tourism and grant revenues, and a high share of commodities in their imports.
Robust growth has underpinned and will continue to contribute to the region’s success in reducing poverty and economic insecurity. The incidence of extreme poverty in the region is now in the low single digit. The extreme poor are concentrated in a few lower-income countries and in remote locations within more affluent countries. Over the last 15 years, the share of the region’s population that is economically secure or middle class has tripled. Although this proportion will likely continue to rise with the prospects for continued growth, it remains a concern that almost a quarter of the region’s population—or about half a billion people—will still be economically insecure.
This positive outlook for the region’s economies is subject to two sets of risks. First, a more rapid pace of U.S. monetary policy tightening than is currently anticipated could increase volatility and exacerbate vulnerabilities. It is now clear that monetary policy in the United States will be progressively tightened over the course of 2018. What is uncertain is the pace at which this monetary tightening will proceed. The recent fiscal expansion in the United States, including due to the passage of the Tax Cuts and Jobs Act, may mean that the pace of U.S. interest rate increases will be faster than currently anticipated. This could exacerbate the recent volatility in equity markets, with rising interest rates pushing bond yields higher, making them a more attractive alternative to equities. This instability could interact with existing financial sector vulnerabilities in many developing EAP economies.
Second, heightened policy uncertainty could dim the prospects for global growth. This uncertainty stems from two sources. One comes from recent actions by the United States on trade and investment policies which could reverse the recent recovery in global international trade that is expected to contribute to the region’s continued growth. The United States has imposed tariffs on solar panels, washing machines, steel, and aluminum, and is in the process of levying tariffs on a range of imports from China. While these specific measures are expected to have only a limited impact on exports of developing EAP countries, including China, they raise questions about the future of U.S. trade policy. These measures also risk retaliation and adoption of additional trade restrictions by other countries, some of which have already been initiated. Another source of uncertainty that could affect trade and investment flows in the region comes from geopolitical tensions, particularly in the Korean Peninsula and the South China Sea. Although these tensions have abated somewhat recently, any escalation could bring financial turbulence and disrupt regional supply chains.
Developing EAP countries will need to be prepared to address the risks associated with monetary tightening inadvancedeconomiesandtheirpossibleinteractionswithdomesticfinancialvulnerabilities.As advanced economies pursue monetary tightening, countries in the region may need to respond by increasing their policy rates and allowing some exchange rate depreciation to reinforce the current account balance and prevent sharp
ENHANCING POTENTIAL
EXECUTIVE SUMMARY xvII

capital outflows. Countries could also look for ways to reduce their dependency on short-term, foreign-currency-denominated debt to respond to shifting global liquidity conditions. There is also a need to focus on strengthening financial sector oversight by improving data quality, introducing risk-based supervision, ensuring compliance with the latest international Basel standards, and setting up crisis management frameworks. Macroprudential regulation can also be a suitable tool to mitigate certain risks such as overborrowing. Where fiscal buffers are limited, and public debt levels high or rising, it will be necessary to move toward a more conservative fiscal stance and improve public debt management.
In tandem, the prospects of moderating growth across the region in the medium term mean that countries willneedtofindwaysofraisingtheir long-termpotentialgrowth.This could include measures aimed at improving public spending and infrastructure provision, deepening trade integration and improving trade facilitation, implementing reforms to enhance competitiveness, and building human capital.
With the threats to the continued openness of the global trading system, it is advisable for developing EAP to continue enhancing trade facilitation and integration. Developing EAP, as one of the regions participating more prominently in global trade, will need to keep removing barriers to trade and pursuing further integration. Thus, ensuring trade and investment policy coordination in the region and avoiding tariff escalation would be especially desirable at this juncture. Regional trade agreements and initiatives such as the ASEAN Economic Community, the Comprehensive and Progressive Agreement for Trans-Pacific Partnership, the Belt & Road Initiative, and the Regional Comprehensive Economic Partnership offer opportunities in this regard. Deeper trade integration and better trade facilitation will be even more important as countries in the region adapt to the emerging challenges of labor-saving technologies and automation, and the blurring of the lines between manufacturing and services.
Improving competitiveness will also be important as developing EAP countries adjust to the ongoing changes in the manufacturing landscape. As labor costs become less important in determining firms’ location decisions, various elements of the business environment will become more significant in shaping the ability of countries to retain their positions in existing manufacturing activities or in moving up into high-skill and medium-skill industries over time.
Increasing the contribution of education to economic growth will require increasing the effectiveness of schools and education systems. This will require action in the following five main domains so as to raise learning outcomes and the quality of human capital: (a) aligning institutions and creating sound administrative systems to ensure basic conditions for learning; (b) concentrating equitable public spending on primary education; (c) increasing teaching accountability, raising selectivity in recruitment, and providing adequate pay and career prospects; (d) providing a key package of services (for example, health coverage for children of preschool age) that can help ensure children’s physical and cognitive development, thus raising readiness to learn; and (e) adopting a systemic approach to assessment and using feedback to inform instruction.
As technologies continue to evolve, including with greater automation, more emphasis will be needed on upgrading capabilities and ensuring that workers and managers have the necessary skills. Basic numeracy and literacy, as well as familiarity with digital technology, will be important, as will access to higher-quality tertiary education. To ensure that improved production technologies diffuse across firms, it will also be necessary
EAST ASIA AND PACIFIC ECONOMIC UPDATE APRIL 2018
xvIII EXECUTIVE SUMMARY

to implement measures that help firms improve their basic managerial and organizational practices so that they can use and adapt new processes.
To provide economic security, more focus will be needed on strengthening social assistance and insurance programs and on increasing resilience to systemic shocks. Social assistance programs can be strengthened, particularly in lower-income countries with less capacity, by introducing cash transfer programs and improving targeting. Expanding the coverage of measures, such as pensions, that help households insure against idiosyncratic risks and ensuring their sustainability can help strengthen social insurance schemes. Resilience to systemic shocks can be increased by instituting country-level risk management mechanisms to manage risks ex ante or cope with their impacts ex post.
Pacific IslandCountries (PICs) need to focus onmaintainingfiscal sustainability and enhancing theireconomic resilience. Despite the improved fiscal positions of most PICs, both revenues and expenditures remain subject to large and frequent shocks. To ensure fiscal sustainability, reforms need to shore up revenues; reduce low-quality spending while improving the effectiveness of spending in the social sectors; and build up buffers against shocks, such as sovereign wealth funds. In addition, accessing temporary migration schemes can help small PICs strengthen their economic resilience.
ENHANCING POTENTIAL
EXECUTIVE SUMMARY xIx


Part I. Recent Developments and Outlook
1
WORLD BANK EAST ASIA AND PACIFIC ECONOMIC UPDATE APRIL 2018

I.A. Recent Developments
Developing East Asia and Pacific continued to grow robustly in 2017, amid a favorable global context (strong global demand, supportive financing conditions, and higher commodity prices). Regional growth surpassed expectations, reflecting higher-than-expected growth in China, Malaysia, Thailand, and Vietnam. Strong exports as well as robust private consumption and higher investment underpinned the strong growth performance. Fiscal deficits were generally contained. Regional financial markets overall remained buoyant although there has been some volatility in early 2018, related to the prospects of faster monetary policy tightening in advanced economies and escalating trade tensions. Bond spreads have continued to decline, net capital outflows have been limited, and currencies and asset prices have generally strengthened.
Regional growth accelerated in 2017, capitalizing on supportive external conditions
GrowthindevelopingEastAsiaandPacificacceleratedslightlyin2017.Growth in the region strengthened marginally to 6.6 percent in 2017, slightly higher than earlier expectations. Growth in several major regional economies (China, Malaysia, Thailand, Vietnam) surpassed expectations, reflecting recovering global demand, higher commodity prices, benign global financing conditions, and robust domestic demand. Growth in the region excluding China also accelerated slightly faster than expected, to 5.4 percent, reflecting an upswing in the ASEAN-5 (Figure I.A.1). The region continued to be a major driver of global growth, accounting for more than a third of it in 2017, mostly because of China’s significant contribution. At an estimated rate of 6.6 percent in 2017, developing EAP is once again the fastest-growing region in the world for the first time since 2014.
The external environment was supportive throughout 2017, and significantly contributed to regionalgrowth. Global growth accelerated to 3.1 percent in 2017, reflecting the investment-led pickup in advanced economies and recovery in commodity-exporting emerging market and developing economies (EMDEs). The upturn
Figure I.A.1. Growth in the second half of 2017 was better than anticipated
Figure I.A.2. Manufacturing activity significantly improved during the second half of 2017
GDP growth (year-over-year percent change) Purchasing Manager’s Index (manufacturing; seasonally adjusted, 50+ = expansion), 3-month moving average
8
7
6
5
4
3
2
Q4-14 Q1-15 Q2-15 Q3-15 Q4-15 Q1-16 Q4-16Q3-16Q2-16 Q1-17 Q2-17 Q3-17 Q4-17
56
54
52
50
48
46
44
42
Mar-14 Sep-14 Mar-15 Sep-15 Mar-16 Sep-16 Mar-17 Sep-17 Mar-18
J ASEAN-5 and China ▬ CHN ▬ ASEAN-5 ▬ Emerging markets ▬ CHN ▬ IDN ▬ MYS ▬ VNM ▬ THA
Sources: Haver Analytics; World Development Indicators. Sources: Haver Analytics; World Bank staff estimates.
2 PART I. RECENT DEVELOPMENTS AND OUTLOOK
EAST ASIA AND PACIFIC ECONOMIC UPDATE APRIL 2018

was broad-based, with growth in 2017 higher in more than half of the world’s economies. This synchronous, investment-led global recovery provided a substantial boost to global and regional manufacturing and trade (Figure I.A.2). Recent global activity data (for example, industrial production, purchasing managers indexes, and trade flows) have been solid, suggesting continued momentum in the global economy (Box I.A.I).
Box I.A.1. Recent Global Developments
The global economy continues to experience a broad-based upturn. Global growth reached a stronger-than-expected 3.1 percent in 2017—a notable recovery from a post-crisis low of 2.4 percent in 2016 and its strongest rate since 2011. The substantial improvement reflected an investment-led pickup in advanced economies and a growth acceleration in Emerging Market and Developing Economies (EMDEs), where activity in commodity exporters rebounded (Figure BI.A.1.1).
Overall, growth increased in more than half of the world’s economies in 2017, highlighting the broad-based nature of the recovery. Among advanced economies, the recovery in 2017 was substantially stronger than expected in the Euro Area and, to a lesser degree, in the United States and Japan, largely due to more vigorous investment. Growth in advanced economies strengthened in 2017, reaching an estimated 2.2 percent, helped by a recovery in capital spending and exports. The pickup in investment reflected increased capacity utilization, favorable financing conditions, and rising profits and business sentiment.
Figure BI.A.1.1. Global GDP growth, 2007–18 Figure BI.A.1.2. Regional GDP growth, 2012–18Percent Percent
2008 2009 2010 2011 2012 2013 2014 2015
9
8
7
6
5
4
3
2
1
0
-1
-2
-3
-4
2007 2018f2016 2017
10
8
6
4
2
0
-2
2014
2015
2016
2017
2018
f
2014
2015
2016
2017
2018
f
2014
2015
2016
2017
2018
f
2014
2015
2016
2017
2018
f
2014
2015
2016
2017
2018
f
2014
2015
2016
2017
2018
f
J World ▬ Advanced economies ▬ Emerging and developing economies J EAP J SAS J ECA J LAC J MENA J SSA
Sources: Haver Analytics; World Bank.Notes: f = forecasts. Data for 2018 are working assumptions. The updated data and forecasts will be published in the June 2018 issue of the World Bank’s Global Economic Prospects.
Sources: Haver Analytics; World Bank.Note: f = forecasts. Data for 2018 are estimates. The updated data will be published in the June 2018 issue of the World Bank’s Global Economic Prospects. Lines denote long-run pre-crisis (1990–2008) average growth.
EMDEgrowth accelerated in 2017 to 4.4 percent, reflecting a recovery in commodity exportersamid continued robust activity in commodity importers. Growth in commodity exporters accelerated in 2017 to a still subdued rate of 1.8 percent, up from 0.8 percent in 2016. Several large economies, including Argentina, Brazil, Nigeria, and Russia, emerged from recession. Although the recovery was led by a rebound in Brazil and Russia (the largest economies in this group), it was broad-based and seen in more than 50 percent of commodity exporters. Recovery in commodity-exporting economies was supported by improved confidence, diminishing drag from earlier policy tightening, and bottoming out of investment
(continued)
I.A. RECENT DEVELOPMENTS 3
ENHANCING POTENTIAL

after a prolonged period of weakness. Nonetheless, this pickup has not been enough to raise average per capita incomes across commodity-exporting EMDEs.
Growth in commodity-importing EMDEs remained robust at an estimated 6.2 percent in 2017. After a prolonged slowdown that began in 2011, investment in EMDEs picked up in 2017. Commodity importers across Asia continued to register solid growth, in line with potential rates, supported by robust domestic demand and strengthening exports. Many commodity importers in Europe and Central Asia and the Middle East and North Africa enjoyed positive trade and financial spillovers from strengthening activity in the euro area and the recovery in Russia (Figure BI.A.1.2).
The cyclical recovery in global manufacturing continued at the start of 2018, providing ongoing support to global trade growth. Global industrial production was robust in the first two months of 2018. The global composite purchasing managers’ index (PMI) rose to 54.8 in February, its highest reading since mid-2014, with almost all countries registering continued expansion. Despite diminishing economic slack and rising oil prices, global (median) inflation remained subdued at 2.1 percent (year-over-year) in January. However, market-based inflation expectations have been trending up in the United States and other major advanced economies since the start of 2018.
This synchronous, investment-led recovery has providing a substantial boost to global trade. Global trade growth is estimated to have reached a stronger-than-expected 4.5 percent in 2017, following two years of pronounced weakness. A cyclical rebound in investment contributed to strong growth of trade in machinery, electronics, and semiconductors (Figure BI.A.1.3). Since the second half of 2017, momentum has moderated somewhat but remains strong.
Figure BI.A.1.3. Global trade growth Figure BI.A.1.4. International commodity pricesPercent Index, nominal term, 2010 = 100
24
20
16
12
8
0
4
-4
-8
-16
-20
2006 2008 2010 2012 2014 201720162007 2009 2011 2013 2015
-12
2018 2008 2010 2012 2014 201720162007 2009 2011 2013 2015 2018
180
140
100
60
20
▬ Volume ▬ Value ▬ Energy ▬ Metals ▬ Agriculture
Sources: Netherlands Bureau for Economic Policy Analysis.Note: A. Last observation is December 2017.
Sources: Netherlands Bureau for Economic Policy Analysis; World Bank.Note: Last observation is February 2018.
Energy and metals prices recovered in 2017 while agricultural prices remained broadly stable, in line with April projections. Oil prices averaged US$53 per barrel in 2017, up 22 percent from 2016, as a result of steadily growing demand, an extension of production cuts among oil exporters, and stabilizing U.S.
(Box I.A.1 continued)
(continued)
4 PART I. RECENT DEVELOPMENTS AND OUTLOOK
EAST ASIA AND PACIFIC ECONOMIC UPDATE APRIL 2018

Followingaprolongedperiodofstableglobalfinancingconditions,areassessmentofinflationrisksandrisingtradetensionstriggeredepisodesoffinancialmarketvolatilityinthefirstquarterof2018.U.S. long-term yields have been on a steady upward trend since the start of the year, rising to 2.9 percent for the first time since January 2014, as inflation expectations and prospects of a faster normalization of U.S. monetary policy increased. While capital inflows to EMDEs have remained strong so far in 2018, some outflows took place following the market turmoil in early 2018, although these were less pronounced than during prior episodes of volatility. A favorable global economic backdrop, including still strong trade growth, rising commodity prices, and a weaker U.S. dollar, have so far helped prevent a broader reassessment of credit risks in EMDEs.
GrowthinChinamoderatedinQ42017,to6.3percent(quarter-over-quarterseasonallyadjustedannualrate)but,growthtickedupto6.9percentfor2017asawhole—adeviationfromtheeconomy’sstructuralslowdown. Economic activity continued to be driven mainly by consumption on the back of resilient household spending, although an increase in net exports explained much of the acceleration relative to 2016. Investment growth continued to slow, particularly reflecting strict environmental regulations and cuts in overcapacity sectors. Private investment also slowed, reflecting firms’ reluctance to reinvest retained earnings, although the reason for this is unclear given the steady improvements in China’s business sentiment (World Bank 2017a). Sectoral
shale oil production. Metals prices were up 24 percent in 2017, supported by robust global demand and environmentally-driven supply cuts in China. Agricultural prices remained broadly stable on ample supplies.
Commodity prices have remained broadly stable in 2018. Oil prices have remained above US$60 per barrel over the first quarter of 2018. Metals prices have been stable so far in 2018, as Chinese demand has slowed. Agricultural prices inched up in the first quarter of 2018, compared to a year earlier, following three years of price stability. The price uptick was primarily driven by fears of drought-driven supply disruptions in South America. Stocks-to-use ratios for grains—a measure of global supply availability relative to demand—remain high for most grains.
Followingaprolongedperiodofstableandexceptionallyfavorableglobalfinancingconditions,areassessmentofinflationrisksinadvancedeconomieshasledtoariseinlong-termyieldsand,inFebruary, triggered a correction in global equity markets. U.S. long-term yields have been on a steady upward trend since the start of the year, rising to 2.86 percent on average in February 2018, the first time since January 2014, as inflation expectations and prospects of a faster normalization of U.S. monetary policy increased.
WhilecapitalinflowstoEMDEshaveremainedstrongin2018,someoutflowstookplacefollowingthe market turmoil in February, although these were less pronounced than during prior episodes of volatility. Sovereign bond spreads and credit default swaps remain close to the low levels prevailing throughout 2017, and bond issuance activity continues to be sustained. A favorable global economic backdrop, including strong global trade, rising commodity prices, and a weaker U.S. dollar, have so far helped prevent a broader reassessment of credit risks in EMDEs.
(Box I.A.1 continued)
I.A. RECENT DEVELOPMENTS 5
ENHANCING POTENTIAL

rebalancing also continued, with services growing faster than industry. A sharp acceleration in exports helped by robust global demand outweighed a rebound in imports stemming from solid domestic demand, resulting in a positive contribution from net exports to GDP growth.
Theupturnintheotherlargeregionaleconomiesreflectedincreasedconfidence,highercommodityprices,strongglobaltrade,andreversalofcapitaloutflows.Aggregate growth in developing EAP excluding China increased to 5.4 percent in 2017. Growth was higher than expected, especially in Thailand, Malaysia, and Vietnam
(Figure I.A.3). In Thailand, growth experienced a strong rebound reaching a five-year high of 3.9 percent in 2017, following several years of subdued performance. This reflected higher public investment and stronger exports and tourism receipts boosted by stronger global demand and improved confidence. Growth rebounded sharply in Malaysia, reflecting robust private sector expenditure and improved confidence, and in Vietnam, due to a rebound in agricultural production. Stronger exports also lifted growth in both economies. Growth inched up in Indonesia, partly driven by the continued recovery of commodity prices and firming investment. In the Philippines, growth decelerated slightly in a postelection year to a still solid 6.7 percent, as investment eased.
Meanwhile, performance in the smaller economies was mixed in 2017 (Figure I.A.4). In Myanmar, growth rebounded slightly, to 6.4 percent, although it was lower than expected, as business confidence continued to deteriorate due to ongoing domestic uncertainty. Growth in Mongolia rebounded strongly in 2017, helped by strong coal exports and improved private investment in the mineral sector, in the wake of successful economic
Figure I.A.3. Large economies surprised with better-than-expected growth ratesGDP growth (year-over-year percent change)
8
7
6
5
4
3
2
1
0
Q4-14 Q1-15 Q2-15 Q3-15 Q4-15 Q1-16 Q4-16Q3-16Q2-16 Q1-17 Q2-17 Q3-17 Q4-17
▬ IDN ▬ MYS ▬ PHL ▬ THA ▬ VNM ▬ CHN
Sources: Haver Analytics; World Development Indicators.
Figure I.A.4. GDP growth performance varies across smaller economiesGDP growth (year-over-year percent change)
Panel A Panel B9
8
7
6
5
4
3
2
1
0
2014 2015 2016 2017e
9
8
7
6
5
4
3
2
0
1
-2
-1
2014 2015 2016 2017e
▬ KHM ▬ LAO ▬ MNG ▬ MMR ▬ FJI ▬ TLS ▬ PNG ▬ SLB
Sources: National authorities through 2015. World Bank estimates for 2017. Note: Myanmar is presented on a fiscal year basis (for example, 2015 = FY2015/16).
6 PART I. RECENT DEVELOPMENTS AND OUTLOOK
EAST ASIA AND PACIFIC ECONOMIC UPDATE APRIL 2018

stabilization measures supported by international financial institutions. In Cambodia, stronger growth in emerging manufacturing exports (for example, auto parts, electrical appliances) and tourist receipts partly offset the moderation in garment exports growth (World Bank 2017i). In contrast, in the Lao People’s Democratic Republic, growth slowed on weaker tourism activity, stronger curbs on government spending, moderating credit growth, and decelerating investment. Performance in 2017 was negatively affected by political uncertainty in Papua New Guinea as well as in Timor-Leste, where parliamentary inability to pass a budget led to large falls in expenditure in the last quarter.
Strong exports contributed to better-than-expected growth
The region has disproportionally benefited froma rebound in global export demand. The recovery in regional exports contributed to the upside growth surprise across the region, on the back of both recovering commodity prices and a rebound in global trade and manufacturing. This in turn was encouraged by stronger capital spending in advanced economies and a rebound of imports in China and several other large EMDEs. Export values in most developing EAP economies experienced a marked recovery in 2017, following a decline in 2016, and continued booming in Vietnam (Figure I.A.5). Commodity exporters, such as Malaysia and Indonesia, saw their export volumes surging, as they benefited from firming demand for commodities (Figure I.A.6).
Figure I.A.5. Export values continued to recover in the second half of 2017…Export values (index of 12-month moving sum, January 2013 = 100)
Jan-13
Jul-13
Jan-14
Jan-15
Jan-16
Jul-14
Jul-15
Jul-16
Jan-17
190
170
150
130
110
90
70
Jan-18
Jul-17
▬ CHN ▬ THA ▬ MYS ▬ IDN ▬ PHL ▬ VNM
Sources: Haver Analytics; World Bank staff estimates.
Figure I.A.6. …as have export volumesExport volume growth (percent, 12-month growth rate)
Panel A Panel B
Jul-14
Jan-15
Jan-16
Jul-15
Jul-16
Jan-17
12
10
8
6
4
2
0
-2
-4
-6
Jan-18
Jul-17
21
18
15
12
9
6
3
-3
0
-6
-9
Jul-14
Jan-15
Jan-16
Jul-15
Jul-16
Jan-17
Jan-18
Jul-17
▬ CHN ▬ Commodity exporters ▬ IDN ▬ THA ▬ MYS ▬ PHL ▬ VNM
Sources: Haver Analytics; World Bank staff estimates.Note: Commodity exporters in EAP include Indonesia, Lao PDR, Malaysia, Mongolia, Myanmar, Papua New Guinea, Timor-Leste, and Tonga.
I.A. RECENT DEVELOPMENTS 7
ENHANCING POTENTIAL

The global technological cycle has driven faster exports of machinery, electronics, and integrated circuits. The rise in industrial production and the restocking of the technology inventory (including mobile phones), in particular, were among the most significant determinants of export growth in 2017 (IMF 2017a). China (including Hong Kong SAR, China), Malaysia, and the Philippines are among the top 10 exporters of integrated circuits (with 22, 6.4, and 3.4 percent of total global exports in 2016, respectively) and semiconductor devices (31, 8.5, and 2.5 percent, respectively).1 While their share in global markets is relatively low, exports of broadcasting equipment, computers, and other final electronic products represent more than 10 percent of total exports in Vietnam, Thailand, the Philippines, and Malaysia. These countries benefited disproportionately from the pickup in the global cycle due to their competitiveness and established capacity, and experienced an acceleration of exports in these categories (Figure I.A.7). In 2017, year-over-year export volumes accelerated to 20.7 percent in the Philippines, thanks to the hike in international demand for integrated circuits, computers, and other electronics, which represent more than half of its export basket (World Bank 2015b). Similarly, Malaysia benefited from the boost in global semiconductor sales (21.9 percent increase year-over-year in October).
Domesticdemandremainedrobustacrosstheregion,reflectingimprovedconfidence
Conditions across the regional economies remain strong. Growth has been broad-based across both sectors and countries, labor markets are tightening without triggering excessive inflation so far, consumer confidence is high, and businesses are responding to growing demand by increasing investment. However, recent signs of an uptick in inflation suggest that output gaps continue to narrow or may have closed in some countries.
Private consumption remained solid in 2017 and early 2018, as consumer and producer confidencegenerally improved. Continued accommodative policies and tighter labor markets also supported robust private consumption across the region. Notably, during 2017, the contribution of private consumption to growth expanded in Thailand, reflecting improved confidence and political stability, and in Malaysia, boosted by continued wage growth (Figure I.A.8). Consumption also remained robust in China, helped by the expansion of e-commerce (Box I.A.2.). Meanwhile, in the Philippines, rising inflation and slightly higher unemployment have gradually weakened consumer sentiment, and contributed to a moderation in consumption growth.2 Among smaller economies, private consumption in Cambodia and Lao PDR eased in 2017, following a strong 2016.
1 Atlas of Economic Complexity.
2 Base effect is also a contributing factor to the slower consumption growth in 2017 since election-related spending boosted domestic consumption activities in 2016.
Figure I.A.7. Exports of intermediate and final electronic products accelerated in 2017Exports of electronics (deflated index, 2010 = 100)
200
100
0
2010 201720162012 2013 2014 20152011
180
160
140
120
80
60
40
20
▬ CHN ▬ VNM ▬ THA ▬ MYS ▬ PHL
Sources: World Bank; IMF World Economic Outlook; Philippines Statistics Authority; China General Administration of Customs; Department of Statistics, Malaysia; ASEAN – CEIC Generate; and World Bank staff estimates.Note: Definitions of exports for electronics differ across countries.
8 PART I. RECENT DEVELOPMENTS AND OUTLOOK
EAST ASIA AND PACIFIC ECONOMIC UPDATE APRIL 2018

Figure I.A.8. Domestic demand remained robust in the second half of 2017 Contribution of expenditure components to change in GDP (percentage points, year-over-year)
Panel A Panel B16
14
12
10
8
6
4
-10
2
0
-2
-4
-6
-8
Q1-14Q3-1
4Q1-1
5Q1-1
6Q1-1
7Q3-1
5Q3-1
6Q4-1
7Q1-1
4Q3-1
4Q1-1
5Q1-1
6Q1-1
7Q3-1
5Q3-1
6Q4-1
7Q1-1
4Q1-1
4Q1-1
4Q3-1
4Q3-1
4Q3-1
4Q1-1
5Q1-1
5Q1-1
5Q1-1
6Q1-1
6Q1-1
6Q1-1
7Q1-1
7Q1-1
7Q3-1
5Q3-1
5Q3-1
5Q3-1
6Q3-1
6Q3-1
6Q4-1
7Q4-1
7Q4-1
7
China Indonesia Malaysia Philippines Thailand
J Private consumption J Gross capital formation J Government consumption J Net exports J Statistical discrepancy ▬ GDP growth
Source: Haver Analytics; World Bank staff estimates.Note: In China, consumption refers to both government and private.
Box I.A.2. E-Commerce Development in China1
China has become the largest and one of the fastest-growing e-commerce markets in the world.2 The number of internet users in China reached 730 million in 2016, of which 467 million made purchases online.3 The annual total e-commerce trade volume in China increased nearly 30-fold at a compound annual growth rate of 32 percent (Figure BI.A.2.1).4 According to a 2017 McKinsey report, China’s worldwide e-commerce transaction value grew from less than 1 percent a decade ago to over 40 percent now, exceeding that of France, Germany, Japan, the United Kingdom, and the United States combined.5 The rapid growth of e-commerce in China demonstrates that the transition from physical to digital commerce, often perceived as a high-income country phenomenon, can happen at a much lower level of per capita income.
Online retail sales have grown even faster in China. Annual online retail sales in China grew about 40 times, from RMB 125.7 billion in 2008 to RMB 5,155.6 billion in 2016, at a compound annual rate of 59 percent (Figure BI.A.2.2). In 2008, only 1 percent of total retail sales of consumer goods was purchased online; in 2016, the ratio reached 16 percent. The share of e-commerce in total retail sales in China
1 Prepared by Xubei Luo, drawn from the joint research on e-commerce in China between the World Bank and the Alibaba Group, China.
2 E-commerce includes sales and purchases of goods and services conducted electronically over computer networks, with telephone calls, faxes, and manually typed e-mails generally excluded, and is realized by receiving and placing orders. E-commerce transaction can be categorized into four types based on participants involved: business-to-business (B2B), business-to-costumer (B2C), business-to-government (B2G), and consumer-to-consumer (C2C).
3 Ministry of Commerce of the People’s Republic of China 2016.
4 Calculated as the ratio of [(trade volume in 2015 – trade volume in 2004)/trade volume in 2004]. All RMB are presented in nominal terms.
5 Woetzel et al. 2017.
(continued)
I.A. RECENT DEVELOPMENTS 9
ENHANCING POTENTIAL

(15.5 percent in 2016) is the second highest in the world, trailing only the United Kingdom. The number of packages sent through online sales increased tenfold from 1 billion in 2006 to 10 billion in 2014.6
Figure BI.A.2.1. Total e-commerce trade volume in China
Figure BI.A.2.2. Online retail sales in China
Trillion yuan Trillion yuan Percent
30
25
20
15
10
5
0
2006 2008 2010 2012 2014 20162007 2009 2011 2013 201520052004
6
5
4
3
2
1
0
18
16
14
12
10
8
6
4
2
0
2008 2010 2012 2014 20162009 2011 2013 2015
Sources: World Bank staff calculations based on National Bureau of Statistics of China and Ministry of Commerce of China (2016)
J Online retail sales ▬ Share of online retail sales to total retail sales of consumer goods
Sources: World Bank staff calculations based on National Bureau of Statistics of China, Ministry of Commerce of China, and China International Electronic Commerce Center Research Institute (2016).
However, the development of online retail is uneven across Chinese provinces and between urban and rural areas. In 2015, in Beijing, 45 percent of the total retail sales of consumer goods were purchased online, followed by nearly 40 percent in Shanghai, 35 percent in Zhejiang, and 28 percent in Guangdong. However, this share was much lower (less than 2 percent) in nine provinces in the inland areas. And nearly three-quarters of online stores and internet users concentrate in urban areas.7
E-commerce development in rural China still has immense potential. Total online retail transactions have grown faster in rural areas than in urban areas. Rural online retail transactions increased from 353 billion yuan in 2015 to 895 billion yuan in 2016, representing 17 percent of the total online retail transactions, an increase from 9 percent in 2015.8
The development of e-commerce in rural areas shows strong signs of clustering. In the last few years, villages with a large share of online sellers and with a large share of GDP coming from e-commerce, or “Taobao Villages,” emerged and developed rapidly in rural China, particularly in the coastal region.9 The number of Taobao Villages increased from 212 in 2014 to 1,311 in 2016, and to 2,118 in 2017 (Figure
6 Goldman Sachs 2018.
7 Ministry of Commerce of the People’s Republic of China 2016.
8 Calculated based on data from the National Bureau of Statistics of China and the Ministry of Commerce of the People’s Republic of China, 2006. Total rural online retail transaction refers to the sum of online retail transaction from e-commerce enterprises (including individuals) operated in the administrative regions at the county level or below (excluding city districts).
9 Except for being an administrative village with online shops and having a total annual e-commerce transaction volume of more than RMB 10 million, a village must meet at least one of the following two conditions to become a Taobao Village: having at least 10% of village households actively engage in e-commerce, having at least 100 active online shops operated by villages.
(Box I.A.2 continued)
(continued)
10 PART I. RECENT DEVELOPMENTS AND OUTLOOK
EAST ASIA AND PACIFIC ECONOMIC UPDATE APRIL 2018

BI.A.2.3). Nearly 70 percent of the Taobao villages in 2017 were in three coastal provinces (Zhejiang, Guangdong, and Jiangsu). By August 2016, China had more than 300,000 active online shops operating in the Taobao Villages.
Figure BI.A.2.3. Taobao VillagesPanel A. 2014, 212 Taobao Villages Panel B. 2015, 780 Taobao Villages
Panel C. 2016, 1,311 Taobao Villages Panel D. 2017, 2,118 Taobao Villages
Source: AliResearch.
To help e-commerce development in rural areas, the government entered a partnership with the Alibaba Group to support the expansion of e-commerce to rural areas. The Rural Taobao Program was launched in 2014 through subsidizing the “last-kilometer” logistics services. The program, aimed at connecting remote villages to an online market, supports the installation of an e-commerce terminal at a
(Box I.A.2 continued)
(continued)
I.A. RECENT DEVELOPMENTS 11
ENHANCING POTENTIAL

While investment growth in China continued to ease, it accelerated in the rest of the region in 2017, amid improved business sentiment and dissipating headwinds. Investment growth softened in China, reflecting domestic rebalancing efforts and cuts in overcapacity sectors (Box I.A.3). In contrast, investment growth in the region excluding China is estimated to have risen to 5 percent in 2017, following a prolonged slowdown during the last few years. Capital expenditures in the large developing EAP economies are increasing rapidly, leading the cycle and further boosting business sentiments. The Philippines is an exception, with investment growth slowing to a still high 9 percent, from 23.7 percent in 2016, reflecting a slowing of durable equipment investment and construction growth. Among smaller economies, investment recovery was lagging in Papua New Guinea and Timor-Leste, hampered by domestic policy uncertainty.
central village location, where a terminal manager can help villagers buy and sell online. The number of Rural Taobao Program sites expanded from 212 villages in 12 counties at its inception in 2014 to nearly 30,000 villages in 549 counties in 2016.
There is a strong association between e-commerce development and the economy. Measured by the Online Business Index and the Online Shopping Index, developed by AliResearch, online business has developed rapidly and gradually spread from the coastal economic centers to the inland. Compared with online purchase, online business is even more concentrated, particularly in Zhejiang, Jiangsu, and Shanghai.
E-commerce development is closely associated with the level of development and economic growth rate of a location. Drawing from a database of over 2,000 counties in China during 2013–15, we find that e-commerce, measured by online sales or online business, is closely associated with the key economic characteristics of a location. E-commerce is more developed in counties where the following characteristics are present: a higher level of development; higher shares of GDP in secondary or tertiary sectors; more developed ICT infrastructure; and higher saving deposits. We also find that, after controlling for these key economic characteristics, economic growth is higher in counties where e-commerce is more developed.
E-commercecanpotentiallycontributetojobcreationandbenefitthedisadvantaged.According to one estimate, e-commerce directly and indirectly created over 37 million jobs in China in 2016.10 Anecdotal studies show that the use of internet technology to engage in innovation and entrepreneurship activities has helped disadvantaged groups, such as the elderly, disabled, and women, to escape poverty by providing flexible job opportunities. It is also said to improve their levels of life satisfaction.
However, empirical evidence on the causality between e-commerce and poverty reduction remains thin. Causality from e-commerce development to economic growth or the channels through which the participation in e-commerce is translated to poverty reduction is yet to be established. More research is needed to provide the evidence basis for policies to support the development of e-commerce and maximize its impact on growth and poverty reduction.
10 Ministry of Commerce of the People’s Republic of China 2016.
(Box I.A.2 continued)
12 PART I. RECENT DEVELOPMENTS AND OUTLOOK
EAST ASIA AND PACIFIC ECONOMIC UPDATE APRIL 2018

Box I.A.3. Progress and Impact of Excess Capacity Reduction in China1
China has experienced chronic excess capacity in its industry sector. Industrial capacity utilization rates in China have been constantly below 80 percent since the global financial crisis (Figure B1.A.3.1). While excess capacity usually occurs during an economic downturn due to weak demand, the persistence of excess capacity in China cannot be fully explained by demand-side factors. Rather, overinvestment appears to be the fundamental problem that led to excess capacity in China, which was exacerbated by a massive fiscal stimulus carried out in response to the global financial crisis and fueled by investment and subsidies used by local governments to maintain economic growth in recent years. Excess capacity impacted the industries with high shares of state investment, such as ferrous and non-ferrous metals, chemicals, and transport equipment manufacturing (Figure B1.A.3.2).
Figure B1.A.3.1. Industrial capacity utilization rates in China
Figure B1.A.3.2. Capacity utilization rates and share of state investment, by sector, 2015
Percent Share of SOE investment, percent
85 46
80 42
75 38
70 34
65 30
2006 2008 2010 2012 2014 201720162007 2009 2011 2013 2015 2018
30
20
10
0
55 60 65 70 75
Rail, ship & othertransport equipment
Ferrous metalsmelting & pressing Automobile
Chemical material& products Non-ferrous metal
smelting & pressing
▬ NBS ▬ PBOC 5,000 Industrial Enterprises Survey, rhs Capacity utilization rates in 2015
Sources: People’s Bank of China (PBOC); National Bureau of Statistics (NBS); World Bank staff calculations.Note: rhs=right-hand side.
Sources: National Bureau of Statistics; Chinese Entrepreneurs Research System; World Bank staff calculations.
Dealing with excess capacity would significantly enhance the efficiency of the industry sectorand improve the quality of economic growth. The corporations in the excess capacity sectors2 in China accounted for roughly 25 percent of industrial employment and 30 percent of sales revenues, while generating over 35 percent of corporate debt and 50 percent of industrial losses in 2015. Despite weak financial performance, fixed asset investment in the excess capacity sectors grew at an annualized rate of 22 percent between 2005 and 2014 (Figure B1.A.3.3). During the same period, production capacity of the excess capacity sectors also expanded rapidly.
In 2015, China’s authorities introduced a comprehensive program aimed at reducing excess capacity. Government policies have focused primarily on cutting existing capacity. Specifically, the government has pledged to reduce 150 million tons of crude steel capacity and 800 million tons of coal capacity over
1 Prepared by Luan Zhao. Helpful comments from Ha Nguyen are gratefully acknowledged.
2 Following the official definition, excess capacity sectors include (a) Coal Mining & Dressing; (b) Ferrous Metal Mining & Dressing; (c) Non-Ferrous Metal Mining & Dressing; (d) Non-Metal Mineral Mining & Dressing; (e) Paper Making & Paper Products; (f) Chemical Material & Products; (g) Non-Metallic Mineral Products; (h) Ferrous Metal Smelting & Pressing; (i) Non-Ferrous Metal Smelting & Pressing; and (j) Rail, Ship, Aircraft, Spacecraft & Other Transport Equipment.
(continued)
I.A. RECENT DEVELOPMENTS 13
ENHANCING POTENTIAL

2016–20. A target, announced by the State Council, was set for the centrally owned state-owned enterprises (SOEs) to cut capacity in the steel and coal industries by 10 percent in 2016–17. To facilitate the reform, the central government has set up special funds to help with displaced workers. Some subnational governments have initiated similar plans targeting local producers. In addition, the government has introduced a series of measures including strengthening environmental and energy efficiency standards, suspending production in mining and raw materials sectors during peak heating seasons, limiting financial supply to overcapacity sectors, and restructuring or liquidating inefficient enterprises.
Figure B1.A.3.3. Fixed asset investment in excess capacity sectors
Figure B1.A.3.4. Production capacity in key excess capacity sectors
Trillion RMB Million tons
6
5
4
3
2
1
0
20082010
20122014
20162009
20112013
20152017
20072006
20052004
4,000
3,500
3,000
2,500
2,000
1,500
1,000
500
0
120
100
80
60
40
20
0
20082010
20122014
20162009
20112013
20152007
20062005
2004
J Coal mining & dressing J Ferrous metal mining & dressing ▬ Crude steel ▬ Steel product ▬ Cement
J Non-ferrous metal mining & dressing J Non-metal mineral mining & dressing ▬ Chemical fiber, rhs ▬ Chemical fertilizer, rhs ▬ Caustic soda, rhs
J Paper making & products J Chemical material & products Sources: NBS; World Bank staff calculations.Note: rhs = right-hand side. J Non-metallic mineral products J Ferrous metal smelting & pressing
J Non-ferrous metal smelting & pressing J Rail, ship, & other transport equipment
Sources: NBS; World Bank staff calculations.
Thestronggovernmentactionsduring2016–17havehadasignificantimpactoncurbingexcesscapacity. China has well exceeded its official targets in cutting existing steel and coal capacities in 2016–17.3 At the same time, investment in new plants has declined sharply, as evidenced by negative fixed asset investment growth in excess capacity sectors since 2015. Consequently, production capacity in most overcapacity sectors peaked in 2015 (Figure B1.A.3.4). The capacity cuts have led to a recovery in industrial capacity utilization rates, which rose to 77 percent in 2017, the highest rate since 2013. This, together with ongoing efforts to restrict industrial production in polluted sectors, has helped lift prices and contributed to strong corporate profit growth in China in 2017.
The economic resilience of recent quarters offers Chinese authorities an opportunity to accelerate excess capacity reduction. A sharp decline of value-added growth in overcapacity sectors since 2016 has been a drag on industry growth. Excluding excess capacity sectors, the industry sector in China still maintained steady growth until recently (Figure B1.A.3.5). There are concerns that China’s massive capacity reduction would bring economic pain in terms of employment. From 2015 to 2017, employment in key
3 China officially cut 65 million tons of steel capacity and 290 million tons of coal capacity in 2016 and exceeded the official targets again in 2017 by cutting another 50 million tons of steel capacity and 150 million tons of coal capacity.
(Box I.A.3 continued)
(continued)
14 PART I. RECENT DEVELOPMENTS AND OUTLOOK
EAST ASIA AND PACIFIC ECONOMIC UPDATE APRIL 2018

overcapacity sectors had already declined by 19 percent (or 4.9 million workers), which accounted for 45 percent of total job losses in industry sectors (Figure B1.A.3.6). A mitigating factor is the relatively high job creation in China, which has made it easier for laid-off workers to find alternative jobs. In 2017, 13.5 million new urban jobs were created in China, of which 5.6 million represent reemployed from layoffs.
Figure B1.A.3.5. Value added of industry, by excess capacity and other sectors
Figure B1.A.3.6. Employment in excess capacity sector
Yoy, % Million people
12
10
8
6
4
2
0
2014 201720162013 2015
30
25
20
15
10
5
0
20082010
20122014
20162009
20112013
20152017
20072006
2005
▬ Excess capacity sectors ▬ Other industry sectors J Coal mining & dressing J Ferrous metal mining & dressing
Sources: CEIC; World Bank staff calculations. J Non-ferrous metal mining & dressing J Non-metal mineral mining & dressing
J Paper making & products J Chemical material & products
J Non-metallic mineral products J Ferrous metal smelting & pressing
J Non-ferrous metal smelting & pressing J Rail, ship, & other transport equipment
Sources: CEIC; World Bank staff calculations.
Challenges for further excess capacity reduction remain. First, the official targets focused primarily on eliminating existing capacity, while some firms are aggressively building new capacity.4 Second, private firms are the dominant players in many of the excess capacity sectors. However, the policies aiming at reducing capacity target mainly large SOE producers, especially central SOEs. For small private producers, the administrative measures are less binding. For instance, rising commodity prices in 2017 created an incentive for private domestic producers to increase production, which partially offset efforts to reduce capacity. Third, most of the capacity elimination target set for 2016–20 had already been achieved in 2016–17. This suggests that capacity elimination in 2018–20 will be much more modest unless the targets are raised.5 Fourth, excess capacity reduction, if implemented successfully, requires winding down inefficient enterprises through bankruptcy and closure, and resolving the corresponding increase in bad debt. There were only about 18,000 bankruptcy cases during 2015–17 in China, an extremely low number for the size of the economy.6 The government will need to consider using the bankruptcy mechanism to eliminate capacity at zombie companies, while further working toward removing market-distorting policies such as subsidies that promote the emergence of new capacity.
4 Baowu Steel, one of the largest steel SOEs based in Shanghai, China, aimed to increase capacity further from 70 to 80 million tons to 80 to 100 million tons by 2019–21, after eliminating a capacity of about 10 million tons in 2016.
5 Since 115 million tons of steel capacity has already been eliminated, there are only 35 million tons left to close over the next three years. In coal, there is only 360 million tons of capacity left to close to meet the 13th Five-Year Plan target. The cuts over the next three years will represent only 1 and 3 percent of annual steel and coal output, respectively, compared to about 5 percent in 2016–17.
6 For comparison, the number of bankruptcies is typically over 1 percent of firms in other countries (see Claessens and Klapper 2003).
(Box I.A.3 continued)
I.A. RECENT DEVELOPMENTS 15
ENHANCING POTENTIAL

Thisrecoveryininvestmentgrowthin2017reflectsseveralforces.They include rising commodity prices, which have helped raise capital expenditures and lower costs of financing in commodity-exporting economies (Indonesia, Mongolia); strengthening global manufacturing (Malaysia, Thailand); and improving economic conditions and investor sentiment (Malaysia, Mongolia, Vietnam).
Public capital expenditure has also supported growth in Thailand and the Philippines, while it has declined in other countries (Figure I.A.9). In 2017, public investment to GDP in Thailand and the Philippines remained higher than the levels observed during the first half of the decade, as authorities continue implementing major infrastructure projects. Public capital expenditure in Cambodia, on decline during the last five years, picked up slightly in 2017, as the government-financed component expanded. Meanwhile, public investment as a share of GDP declined slightly in Malaysia. Capital spending dropped sharply in Timor-Leste, as budget legislation has been on standby during a political impasse. In Mongolia, budgeted capital spending fell to 6.1 percent of GDP in 2017 from 9.3 percent in 2016, as arrears for previous years (2.7 percent of GDP) were cleared.
FigureI.A.9.EAP country record on public investment spending is mixedGeneral government capital expenditure (percent of GDP)
Panel A Panel B12
10
0
2011 201720162012 2013 2014 2015
8
6
4
2
14 60
5012
4010
30
0 0
2011 201720162012 2013 2014 2015
8
20
6
10
4
2
▬ CHN ▬ IDN ▬ MYS ▬ PHL ▬ THA ▬ VNM ▬ MNG ▬ MMR ▬ KHM ▬ TLS, rhs
Source: World Bank staff estimates based on official sources.Note: Data for Malaysia, Myanmar, and the Philippines refer to central government capital expenditure. Data for Myanmar and the Philippines refer to the fiscal year. Data for Indonesia and Malaysia refer to the four-quarter average. Data for 2017 refer to Q3 estimates. rhs = right-hand side.
Figure I.A.10. Imports have significantly expanded Figure I.A.11. Current account balance developments are mixed
Imports of goods and services (index, quarter moving sum, Q4 2013 = 100) Current account balance as a percentage of GDP (seasonally adjusted, %)
160
110
60
150
140
130
120
100
90
80
70
Q4-13 Q4-14Q2-14 Q4-15Q2-15 Q4-16Q2-16 Q4-17Q2-17
16
14
12
10
0
-2
-4
-6
Q1-14
Q1-15
Q1-16
Q3-17
Q4-17
Q3-14
Q3-15
Q3-16
Q1-17
2
4
6
8
▬ CHN ▬ IDN ▬ MYS ▬ PHL ▬ THA ▬ CHN ▬ IDN ▬ MYS ▬ PHL ▬ THA
Sources: Haver Analytics; World Bank staff estimates. Sources: Haver Analytics; Philippines Central Bank; World Bank staff estimates.
16 PART I. RECENT DEVELOPMENTS AND OUTLOOK
EAST ASIA AND PACIFIC ECONOMIC UPDATE APRIL 2018

Imports increased as domestic demand strengthened, while the increase in exports kept current accounts in check or contributed to higher surpluses. Imports significantly increased across all large developing EAP economies during 2017, reflecting firming commodity prices as well as strengthening demand for final consumption goods and intermediate inputs to manufacturing (Figure I.A.10). Meanwhile, current account balances improved overall, especially during Q2 and Q3 2017, on the back of unexpectedly rapid export growth (Figure I.A.11). In Thailand, current account surplus as a percentage of GDP declined in Q4 2017, as imports growth accelerated, partly reflecting higher investment in machinery and equipment. In the Philippines, current account balance turned negative in Q4 2017.
Fiscal policies consolidated across much of the region in 2017
Fiscal deficits were generally contained in 2017. In commodity exporters, deficits were slightly smaller (Indonesia, Malaysia) or were significantly reduced (Mongolia, Timor-Leste). In Mongolia, the deficit declined eightfold, explained by better-than-expected revenue performance from the rise in coal exports, and a commitment to spending control in the context of a fiscal adjustment program. Vietnam also made some progress in containing its widening deficit and growing public debt, mostly through a sharp reduction of public investment. In China, fiscal policy remained accommodative, as the authorities had planned. In Thailand, the fiscal deficit slightly widened due to tax cuts. In Fiji, higher spending was supported by post-cyclone reconstruction efforts, while outlays ultimately fell short from those budgeted, with the deficit narrowing. Meanwhile, in Lao PDR and Myanmar, deficits are estimated to have slightly expanded in 2017, driven by public investment and state economic enterprise results, respectively, and despite buoyant tax collection (Figure I.A.12).
Figure I.A.12. After widening in 2016, fiscal deficits started to stabilize in 2017General government fiscal balance (percent of GDP)
Panel A Panel B0
-1
-2
-3
-4
-5
-6
-7
-8
201720162013 2014 2015
0
-2
-4
-6
-8
-10
-12
-14
-16
-18
201720162013 2014 2015
▬ CHN ▬ IDN ▬ MYS ▬ PHL ▬ THA ▬ VNM ▬ KHM ▬ FJI ▬ LAO ▬ MNG ▬ MMR
Source: World Bank staff estimates.Note: Data refer to general government fiscal balance, except for Indonesia, where data refer to central government fiscal balance; fiscal deficits do not reflect off-budget spending items.
I.A. RECENT DEVELOPMENTS 17
ENHANCING POTENTIAL

Over three-quarters of the developing EAP population are economically secure, partly thanks to labor-intensive growth
Continued robust growth has contributed to the region’s success in reducing poverty. Extreme poverty (based on the International Poverty Line of US$1.90 per day, 2011 purchasing power parity [PPP]) is now below 2 percent including China, and 4.5 percent excluding China. At the lower-middle-income poverty line of US$3.20 per day, 2011 PPP, regional poverty rates are 10.2 percent including China, and 20.7 percent excluding China (Figure I.A.13).
Figure I.A.13. Poverty has continued to decline across the region Poverty rate (vertical axis, percent) and number of poor (size of bubble, million), for US$1.90 per day (2011 PPP), US$3.20 per day (2011 PPP), and poverty lines (US$5.50 per day, 2011PPP)
Panel A. Developing EAP Panel B. Developing EAP excluding China70
60
50
40
30
20
10
0
201720162012 2013 2014 2015
941
827
757714
657608
455
138
338
70
295
58
261
50
233
44
209
38
70
60
50
40
30
20
10
0
201720162012 2013 2014 2015
342333
327319
306300
183
51
174
44
165
39
148
35
141
33
135
29
Q International poverty line ($1.90/day 2011PPP) Q International poverty line ($1.90/day 2011PPP)
Q Lower-middle income class poverty line ($3.20/day 2011PPP) Q Lower-middle income class poverty line ($3.20/day 2011PPP)
Q Upper-middle income class poverty line ($5.50/day 2011PPP) Q Upper-middle income class poverty line ($5.50/day 2011PPP)
Sources: World Bank East Asia and Pacific Team for Statistical Development; PovCalNet.Note: The most recent household survey used for actual estimates vary from 2006 in Kiribati to 2016 in Indonesia and Mongolia. Estimates prior to 2016 are (a) derived directly from household survey data; (b) China 2013 is a survey break and data are not comparable with previous years; (c) interpolated between existing surveys; or (d) extrapolated based on per capita GDP growth and historical estimates of the growth elasticity of poverty (GEP), but China, Papua New Guinea, and the Pacific Island Countries are based on neutral growth distribution. For 2016 onward, estimates are projected based on projected per capita GDP growth and the GEP, and are hence preliminary and subject to revision. In China, data through 2012 are not comparable with those for subsequent years, owing to a change in the survey methodology that acted to lower reported poverty, and may account for nearly half of the reported decrease in the poverty headcount between 2012 and 2013. In late 2012, separate urban and rural household surveys were replaced with a single national household survey, which uses stratified, multistage sampling methods. There were significant changes in the collection of information from migrants (now treated as part of the urban population when measuring aggregate disposable income), and the treatment of net taxes and transfers in rural areas; and rents from home ownership are now imputed. This latter factor, in particular, might have had a substantial effect on reported poverty.
Standards of living have increased by other measures, as well. Over the last 15 years, the share of the economically secure and middle-class in the region (those consuming more than US$5.50 per day in 2011 PPP) has more than tripled, aided by the rapid progress made both in China and in most of the other large ASEAN countries (Figure I.A.14). Even excluding China, half the region’s population is now economically secure or part of the middle class (World Bank 2018a).
Labor markets are operating near potential. Unemployment rates are generally falling across the region. Indonesia experienced the most significant declines in 2017, as domestic reforms and firming commodity prices contributed to economic recovery (Figure I.A.15). Following strong wage growth in 2016, increases in 2017 were more modest, while remaining supportive of consumption (Figure I.A.16). Jobs are continuing to transition out of agriculture and into higher-paid sectors. In Vietnam, manufacturing jobs in export-oriented sectors are well paid and expanding, benefiting strongly from large greenfield foreign direct investment inflows, and added over 1.5 million net jobs during 2014–16. Manufacturing wages in Malaysia grew at 9.4 percent in Q4 2017, almost twice the rate of the wage growth in the services sector, against the backdrop of strong exports growth.
18 PART I. RECENT DEVELOPMENTS AND OUTLOOK
EAST ASIA AND PACIFIC ECONOMIC UPDATE APRIL 2018

Figure I.A.14. The share of the economically secure and middle-class continues to expandPercentage of total population
Panel A. Developing EAP Panel B. Developing EAP excluding China 100
90
80
70
60
50
40
30
20
10
0
2002 2004 2006 2008 2010 2012 2014 2016 2017
Not economically secure
(less than PPP US$5.50/day)
Economically secure and middle-class
(over US$5.50/day 2011PPP)
100
90
80
70
60
50
40
30
20
10
0
2002 2004 2006 2008 2010 2012 2014 2016 2017
Not economically secure
(less than PPP US$5.50/day)
Economically secure and middle-class
(over US$5.50/day 2011PPP)
Source: World Bank staff estimates.
Figure I.A.15. Unemployment rates are on decline Figure I.A.16. Real wage growth in 2017 was more modest
In percent Year-over-year percent change
Panel A Panel B12
10
8
6
4
2
0
2003 2004 2005 2006 2007 2008 2009 2010 2011 2012 2013 2014 2015 2016 2017
25
20
15
10
5
0
-5
2010 201720162012 2013 2014 20152011
▬ PHL ▬ MYS ▬ IDN ▬ CHN J PHL J MYS J IDN J CHN J VNM
Source: World Bank staff estimates using official sources. Source: World Bank staff estimates using official sources.Note: For China, data refer to urban nonprivate wage growth. For the Philippines, 2017 wage is preliminary. Wages data for Indonesia refer to August of each year.
Inflationhasremainedincheck,reflectingtheoffsettingeffectsoffoodandenergyprice trends and appreciating currencies
Headlineinflationremainssubduedinmostcountries,althoughit isgettingclosertotargets.Overall, inflation has increased slowly since mid-2017, despite rising oil prices, strengthening growth, and fast credit growth in some countries (Vietnam). Stable international food prices and appreciating regional currencies have helped. Inflation is nevertheless building up toward target in most large economies (Figure I.A.17).
Astherecoveryfirmsupandoutputgapsclose,therearesignsofupwardpressureonprices.Among major regional economies, Consumer Price Index (CPI) inflation has recently picked up (in the Philippines, China, and Vietnam), while remaining stable at low levels in Thailand (Figure I.A.18). Wage growth, historically a key driver of
I.A. RECENT DEVELOPMENTS 19
ENHANCING POTENTIAL

inflation, has trended up but continues to be subdued, and core inflation remains quiet across all major economies. Meanwhile, producer price inflation, which rebounded in 2016 and early 2017, eased during the second part of the year and into 2018 (Figure I.A.19). Among smaller economies, CPI inflation increased modestly toward the end of the year, with the exemption of Mongolia where, driven by rising food and oil prices and wages, it jumped sharply to 6.4 percent (year-over-year) in December, while remaining below the central bank target of 8 percent.
Central Banks in developing EAP have responded in an uneven manner to U.S. monetary policy tightening. In 2017, the Central Banks of Japan, Thailand, and Indonesia announced they would maintain rates unchanged, since the nature of economic recovery is not broad-based. Meanwhile, the State Bank of Vietnam had introduced interest rate cuts earlier in the year to support growth. In contrast, Bank Negara Malaysia increased the overnight policy rate by 25 basis points to 3.25 percent at their January 25, 2018, meeting (Figure I.A.20). Except for Vietnam, rates remain below the average for the last 10 years (Figure I.A.21).
Figure I.A.17. Headline inflation has inched up, while remaining subduedHeadline Inflation (year-over-year, percent change)
9
6
3
0
-3IDN MYS VNM PHL CHN THACommodity exporters Commodity importers
J 2015 J 2016 J 2017 ▬ Inflation target
Sources: Central Bank News; Haver Analytics.
Figure I.A.18. Inflation has been stable overallHeadline inflation (end of period year-over-year, percent)
Panel A Panel B
Jan-14
Jan-15
Jan-16
Jul-14
Jul-15
Jul-16
Jan-17
Jul-17
10
8
6
4
2
-2
0
Jan-18
Jan-14
Jan-15
Jan-16
Jul-14
Jul-15
Jul-16
Jan-17
Jul-17
Jan-18
18
16
14
12
10
8
6
4
2
0
-4
-2
▬ CHN ▬ IDN ▬ MYS ▬ PHL ▬ THA ▬ VNM ▬ KHM ▬ LAO ▬ MMR ▬ MNG ▬ TLS
Source: Haver Analytics.
FigureI.A.19.Producer prices have eased in recent months Producer Price Index (end of period year-over-year change, percent)
20
15
10
5
0
-5
-10
Jan-13
Jul-13
Jan-14
Jan-15
Jan-16
Jul-14
Jul-15
Jul-16
Jan-17
Jan-18
Jul-17
▬ CHN ▬ MYS ▬ PHL ▬ THA ▬ IDN
Source: Haver Analytics.Note: The official Producer Price Index of the Philippines only covers the manufacturing sector.
20 PART I. RECENT DEVELOPMENTS AND OUTLOOK
EAST ASIA AND PACIFIC ECONOMIC UPDATE APRIL 2018

Figure I.A.20. Most larger countries held policy rates constant or reduced them slightly in 2017
Figure I.A.21. Real interest rates remain below the long-term average
Policy rate (percentage points) Real policy rate (percentage points)
8
7
6
5
4
3
2
1
0
Jan-15
Jul-15
Jan-16
Jan-17
Jan-18
Jul-16
Jul-17
6
5
4
3
2
1
0
-1
-2
CHN IDN MYS PHL THA VNM
▬ CHN ▬ IDN ▬ MYS ▬ PHL ▬ THA ▬ VNM J Top of current cycle J Real policy rate, latest available in 2018 Q 10-year average
Sources: Haver Analytics; People’s Bank of China. Sources: Haver Analytics; World Bank staff estimates.
Creditgrowthhasmoderated,reflectingtighterregulations
Credit growth has subsided in China and was contained in other countries. In China, regulatory tightening has brought real credit growth in the banking sector below double digits without disruption in economic activity. Regulatory changes have also reduced the pace of growth of shadow financing (see Box I.B.3 in World Bank 2017a). In Thailand (tightening lending standards), Indonesia, and Malaysia (contained household and business lending), credit growth remained subdued (Figure I.A.22). In the Philippines, credit growth accelerated during the first three quarters of 2017, prior to slowing toward the end of the year, while remaining in double digits. Credit to businesses was primarily driven by lending to the real estate, electricity and gas, wholesale and retail trade, and manufacturing sectors. In Vietnam, credit growth has remained high, at over 18.2 percent (year-over-year)
Figure I.A.22. Credit growth was contained in most countriesReal growth in net domestic credit (year-over-year, percent)
Panel A Panel B
Jan-14
Jan-15
Jan-16
Jul-14
Jul-15
Jul-16
Jan-17
Jul-17
Jan-18
25
20
15
10
5
0
Jan-14
Jan-15
Jan-16
Jul-14
Jul-15
Jul-16
Jan-17
Jul-17
Jan-18
35
30
25
20
15
10
5
0
▬ CHN ▬ IDN ▬ MYS ▬ PHL ▬ THA ▬ VNM ▬ LAO ▬ KHM
Sources: Haver Analytics; World Bank staff estimates.Note: Nominal growth in domestic credit is deflated by the CPI. For Vietnam, we refer to total credit. For Cambodia, we refer to net credit to the private sector (loans).
I.A. RECENT DEVELOPMENTS 21
ENHANCING POTENTIAL

in December 2017 amidst falling interbank interest rates and ample liquidity in the banking sector. Following the introduction of an 18 percent interest rate cap in February 2017, credit growth decelerated significantly in Cambodia, while recovering later in the year, driven by construction and real estate.
Due to contained credit growth, growth in private sector debt stabilized in 2017. China’s total nonfinancial debt (relative to GDP) was stable in 2017, but it is still well above the emerging market average (Figure I.A.23). Nonfinancial corporate debt remained above 160 percent of GDP but ticked down. Private sector debt growth remained contained in the ASEAN-5, except for the Philippines, where rapid credit growth has contributed to an increase in outstanding debt, which nevertheless remains at relatively low levels by international standards.
Figure I.A.23. The stock of private sector debt has been contained, while remaining high in some economies
Figure I.A.24. Property prices rose in China, Malaysia, and the Philippines
Credit by sector (percent of GDP) Real Residential Property Prices, Index, 2010 = 100
300
250
200
150
100
50
0
CHN
20102015
2016
Q3–17
EmergingIDNMYS VNM THA PHL
20102015
2016
Q3–172010
20152016
Q3–172010
20152016
Q3–172010
20152016
20172010
20152016
Q3–172010
20152016
Q3–17
160
140
120
100
80
60
Jun-05
Jun-06
Jun-07
Jun-08
Jun-09
Jun-10
Jun-11
Jun-12
Jun-13
Jun-14
Jun-15
Jun-16
Jun-17
Dec-17
J Credit to general government J Credit to households J Credit to nonfinancial corp. ▬ CHN ▬ IDN ▬ MYS ▬ PHL ▬ THA
Sources: Bank for International Settlements; Central Bank of the Philippines; International Financial Statistics.Note: For 2017, data refer to end-Q3, except for the Philippines, where they refer to end-2017. For the Philippines and Vietnam, disaggregated data on credit to households and nonfinancial corporations are not available. The group “emerging economies” comprises the following countries, for which data are available: Argentina, Brazil, Chile, India, Mexico, the Russian Federation, South Africa, and Turkey.
Source: Bank for International Settlements.
Property prices in Malaysia and the Philippines have been rising. Property prices rose by more than 150 percent in Malaysia and the Philippines between December 2010 and September 2017, the latest month for which data are available (Figure I.A.24). This is consistent with a global trend of steady increases in real house prices since 2013. Meanwhile, in China, growth in property prices eased in 2017, owing to tighter policies aimed at addressing potential vulnerabilities in the real estate sector.
Externalfinancialconditionshavebeensupportive,asreflectedinappreciatingnominal exchange rates and rising asset valuations, while some turmoil has been experienced in early 2018
Netforeigndirectinvestment(FDI)inflowswerestablein2017(Figure I.A.25). In Thailand, following large net FDI outflows in 2016, there were signs of recovery in the second half of 2017, as political uncertainty receded and the business environment improved. In Vietnam, FDI disbursements reached a record high of US$17.5 billion, or nearly 24 percent of total investment in 2017. Driven to some extent by the pickup in manufacturing, new
22 PART I. RECENT DEVELOPMENTS AND OUTLOOK
EAST ASIA AND PACIFIC ECONOMIC UPDATE APRIL 2018

FDI commitments also increased by 44 percent in 2017, the largest since the peak in 2008. FDI inflows to Cambodia also remained buoyant, above 10 percent of GDP in 2017. In China, net FDI inflows picked up in Q4 2017 thanks to renewed investor optimism about economic prospects (Figure I.A.26). Meanwhile, Timor-Leste is seeing its lowest FDI inflows in a decade, amid deteriorating investor sentiment.
Meanwhile, net portfolio flows were modestlypositive in 2017 (Figure I.A.27). A notable exception is China, where capital restrictions coupled with better-than-expected growth resulted in a significant increase in net portfolio investment. Net portfolio flows were reduced in Malaysia in the second half of 2017, as energy prices recovered, investor confidence rose, and the growth outlook improved. The Philippines witnessed some portfolio outflows as there was some weakening in confidence, and investing in advanced economies has become increasingly attractive.
Stock prices soared in 2017, although there were corrections in early 2018. As global equity markets reached all-time highs, stock markets in the region kept rising during the second half of 2017, against the backdrop of better economic performance and improved investor sentiment. Vietnam’s stock market index rose the most at close to 50 percent during 2017. However, following developed country financial markets, the region’s stock markets experienced a correction in early 2018, after which trends have started to diverge across countries (Figure I.A.28). This was driven by rising inflation expectations and prospects for faster monetary policy normalization in the United States, and escalating trade tensions. These developments highlight how developing EAP’s financial markets are exposed to, and tightly connected with, developed country financial markets.
Figure I.A.27. Net portfolio flows were modestly positive in 2017Portfolio investment: Net inflows, 4-quarter moving average, % GDP
10 10
8 8
66
44
2
2
0
0
-2
-2
-4
-4
-6
-6 -8
Q1-14
Q3-14
Q1-15
Q1-16
Q1-17
Q3-15
Q3-16
Q3-17
J Total, excl. China, rhs ▬ CHN ▬ IDN ▬ MYS ▬ PHL ▬ THA ▬ VNM
Source: Haver Analytics, World Bank staff estimates.Note: rhs=right-hand side.
Figure I.A.25. Net FDI inflows were robust in 2017 Figure I.A.26. Net FDI outflows from China eased in 2017Net FDI flows (US$ billion, four-quarter sum) Net FDI flows (US$ billion)
20
15
10
5
0
-5
-10
-15
Q1-14
Q3-14
Q1-15
Q1-16
Q1-17
Q3-15
Q3-16
Q3-17
400
300
200
100
0
-100
-200
-300
201720162012 2013 2014 2015 Q1-16
Q2-16
Q3-16
Q4-16
Q1-17
Q2-17
Q3-17
Q4-17
▬ IDN ▬ MYS ▬ PHL ▬ THA ▬ VNM J FDI net inflows J FDI net outflows ▬ Balance of FDI net flows
Source: Haver Analytics. Source: Haver Analytics.
I.A. RECENT DEVELOPMENTS 23
ENHANCING POTENTIAL

Figure I.A.28. Following a long rally, stock markets have experienced recent corrections
FigureI.A.29.External corporate and sovereign bond spreads continued to narrow, except for the correction in early 2018
US$, index, end-2015 = 100 Emerging Market Bond Index spreads, basis points
210
190
170
150
130
110
90
70
Dec-15
Dec-16
Mar-16
Mar-17
Jun-16
Jun-17
Sep-16
Sep-17
Dec-17
Mar-18
400
350
300
250
200
150
50
100
0
Dec-15
Dec-16
Mar-16
Mar-17
Jun-16
Jun-17
Sep-16
Sep-17
Dec-17
Mar-18
▬ CHN ▬ IDN ▬ MYS ▬ PHL ▬ THA ▬ VNM ▬ CHN ▬ IDN ▬ MYS ▬ PHL ▬ VNM
Sources: Thomson Reuters; Datastream; International Finance Corporation Global Macro & Market Research.
Sources: J.P. Morgan; International Finance Corporation Global Macro & Market Research.
Bondspreadshavetightened(exceptinChina),andthecreditratingsforIndonesiaandthePhilippineshave been upgraded. During 2017, bond spreads in the regional economies generally declined, as economic performance has been better than expected and risk perceptions have eased (Figure I.A.29). Indonesia and Vietnam experienced large declines in bond spread in 2017. Indonesia issued the world’s first green sovereign sukuk bond, raising US$1.25 billion in international markets. Overall, following a decline in 2016, developing EAP countries successfully resumed issuances in international bonds. It is nonetheless worth noting that, following stock market corrections in early 2018, bond indexes have increased for most countries.
Overall, amid positive developments, major currencies in the region have been appreciating against the dollar. As the trade-weighted U.S. dollar depreciated by about 7.5 percent in 2017, currencies in developing EAP have generally appreciated in nominal terms, contributing to the mitigation of inflationary pressures (Figure I.A.30). The Malaysian ringgit and the Thai baht showed great strength in the last quarter of 2017, reflecting better exports, improved capital inflows, and stronger growth prospects. In contrast, in real trade-weighted terms, the Indonesian rupiah, the Philippine peso, and the Lao kip have been sliding (Figure I.A.31). In Indonesia, after remaining stable in the first half of the year, the rupiah depreciated following an unexpected increase in the domestic policy rate (World Bank 2017c). In the Philippines, rising imports of both final and intermediate goods outperformed exports , leading to a widening trade deficit and currency depreciation (World Bank 2017j). In Lao PDR, in contrast, depreciation of the kip was related to greater exchange rate flexibility, helping to bridge the gap between the official and the parallel foreign exchange market rates, and supporting export competitiveness and reserve accumulation.
24 PART I. RECENT DEVELOPMENTS AND OUTLOOK
EAST ASIA AND PACIFIC ECONOMIC UPDATE APRIL 2018

Figure I.A.30. Many major currencies appreciated against the U.S. dollar during the second half of 2017…
Figure I.A.31. …while the Indonesian rupiah and the Philippine peso depreciated in real terms
Index of U.S. dollar to local currency, December 2015 = 100 Real effective exchange rate index, December 2015 = 100
120
115
110
105
100
95
90
Dec-15
Dec-16
Mar-16
Mar-17
Jun-16
Jun-17
Sep-16
Sep-17
Dec-17
Mar-18
120
115
110
105
100
90
95
80
85
Dec-15
Dec-16
Mar-16
Mar-17
Jun-16
Jun-17
Sep-16
Sep-17
Dec-17
Mar-18
▬ CHN ▬ IDN ▬ MYS ▬ PHL ▬ THA ▬ VNM ▬ CHN ▬ IDN ▬ MYS ▬ PHL ▬ THA
Source: Haver Analytics.Note: Decrease denotes depreciation against the U.S. dollar. US$ index is a weighted average of the values of major world currencies that circulate widely outside their country of issue.
Sources: Bank for International Settlements; World Bank staff estimates.Note: Falling values denote depreciation. The real effective exchange rate is deflated using the Consumer Price Index.
RecentdevelopmentsinthePacificIslandCountries
The Pacific Island Countries saw continued growth in 2017. In general, growth was driven by increased construction activity financed by grants, sustained and high fishing license revenues, and recovering tourism and retail. Recovery and reconstruction in Vanuatu and Tuvalu after Cyclone Pam in 2015 have helped boost economic activity. Meanwhile, growth has moderated in Nauru due to a slowdown in phosphate exports.
InthePacificIslandCountries,fiscaldeficitshaveoverallstabilized,partlythankstoimprovedrevenue.High fishing license receipts from foreign vessels are one of the main sources of growing revenue collection, as are fiscal surpluses that some countries have used to build fiscal buffers in sovereign wealth funds (Kiribati, Micronesia, Tuvalu). However, in some cases, this growing revenue has been accompanied by increased public expenditure, particularly on the wage bill (Kiribati, Nauru, Tonga), state-owned enterprise subsidies, and increased contributions to public pensions (the Marshall Islands, Palau). In Vanuatu, an increase in the value-added tax in 2018 (from 12.5 percent to 15 percent) and further improvements in tax administration and compliance, are aimed at curbing fiscal pressures stemming from previous reconstruction efforts. Finally, in the Solomon Islands, fiscal mismanagement has led to a widening deficit, which has been draining government cash reserves.
I.A. RECENT DEVELOPMENTS 25
ENHANCING POTENTIAL

I.B. Outlook and Risks
The growth outlook for the East Asia and Pacific region until 2020 is favorable. While growth in China is expected to slow gradually over the period as it continues to rebalance, the rest of the region is likely to continue to grow at its current pace as global trends become less supportive once global growth peaks in 2018. With sustained growth, poverty is expected to continue to fall, including at the higher thresholds that are more relevant to middle-income countries. The main risks to the outlook include those associated with an abrupt or sharper-than-expected tightening of global financial conditions and heightened policy uncertainty, especially due the rising threat of trade restrictions and an escalation of geopolitical tensions in the region.
Growth in developing EAP is expected to remain robust
Regionalgrowthisprojectedtoeaseto6.3percentin2018andtoaround6percentonaveragein2019–20, broadly in line with the previous forecasts, led by a structural slowdown in China. The growth forecast for developing EAP excluding China has been upgraded to 5.4 percent in 2018, reflecting improved prospects in Thailand and several commodity-exporting economies, where cyclical recovery is proceeding faster than expected (for example, Malaysia, Mongolia) (Table I.B.1).
Global conditions are expected to be supportive in 2018. Global growth is projected to peak at 3.2 percent in 2018, before moderating slightly in 2019–20. Global financing conditions will gradually tighten, leading to a moderation of global investment and trade flows. As commodity prices plateau and output reaches potential, the upturn in commodity-exporting EMDEs is projected to level off (World Bank 2018b) (Box I.B.1).
China is likely to see slower growth as its rebalancing continues. Following stronger-than-projected 6.9 percent growth in 2017, activity in China is expected to moderate in 2018 to 6.5 percent, and 6.2 percent on average in 2019–20. This would be the result of the authorities’ greater focus (as was reaffirmed in the National People’s Congress in March 2018) on improving the quality of growth and continuing the slowing of credit growth while further reducing excess capacity in some heavy industry sectors. The continued adjustment in the housing market will also weigh on activity and growth.
Growth in the ASEAN-5 countries is expected to be stable in 2018–20. Growth in Indonesia and Thailand—the two largest economies of this group—is expected to slightly strengthen in 2018, reflecting improved prospects for investment and private consumption amid improved confidence (World Bank 2017c, World Bank 2017n). Growth in the Philippines would remain at 6.7 percent in 2018 and will continue to be broad-based. In Vietnam, growth is expected to decelerate to around 6.5 percent in 2018, following a strong rebound in 2017 from earlier sharp deceleration caused by weather-related declines in agricultural production in 2016 (World Bank 2017g). In Malaysia, growth is expected to ease in 2018 to 5.4 percent from its 2017 peak, in the context of an already anticipated decline in public capital spending and easing export growth, while being sustained by a continued high level of private sector expenditure (World Bank 2017b).
26 PART I. RECENT DEVELOPMENTS AND OUTLOOK
EAST ASIA AND PACIFIC ECONOMIC UPDATE APRIL 2018

Prospectsforseveralofthesmallereconomiesarealsofavorable,reflectingstrongercommoditypricesand higher investment. In Myanmar, economic growth is projected to recover to 6.7 percent in 2018, although investment prospects have been impacted by a perception of a slowing reform pace and could further deteriorate with the ongoing developments in Rakhine State (World Bank 2017d). Growth in Cambodia is expected to pick up slightly in 2018, underpinned by election-related spending. Mongolia and Timor-Leste would experience a cyclical recovery associated with firming commodity prices, although domestic policy uncertainties could limit an acceleration of growth in the latter two. In Papua New Guinea, the earthquake in February 2018 has resulted in the shutdown of many liquefied natural gas facilities and increased government expenditures for relief and reconstruction. As a result, in 2018, the fiscal situation is expected to be under further pressure and growth could be revised downwards once the full impact of the earthquake is clearer. Growth in Lao PDR is projected to ease further, to 6.6 percent in 2018 before rebounding modestly in 2019–20, reflecting additional capacity expected to be installed in the electricity sector (World Bank 2017f).
Table I.B.1. Developing East Asia and Pacific: GDP growth projections
Forecast Change from October 2017 Updatec
percentage points
2016 2017 2018 2019 2020 2017 2018 2019
Developing EAP 6.3 6.6 6.3 6.1 6.0 0.2 0.1 0.0China 6.7 6.9 6.5 6.3 6.2 0.2 0.1 0.0
Developing EAP excl. China 4.9 5.4 5.4 5.3 5.3 0.3 0.2 0.1Developing ASEAN 4.9 5.4 5.4 5.4 5.4 0.2 0.2 0.2
Indonesia 5.0 5.1 5.3 5.3 5.4 0.0 0.0 0.0Malaysia 4.2 5.9 5.4 5.1 4.8 0.7 0.4 0.3Philippines 6.9 6.7 6.7 6.7 6.6 0.1 0.0 0.0Thailand 3.2 3.9 4.1 3.8 3.8 0.4 0.5 0.3Vietnam 6.2 6.8 6.5 6.5 6.5 0.5 0.1 0.1Cambodia 7.0 6.8 6.9 6.7 6.6 0.0 0.0 0.0Lao PDR 7.0 6.7 6.6 6.9 6.9 0.0 0.0 0.0Myanmar 5.9 6.4 6.7 6.9 7.1 0.0 0.0 0.0
Mongolia 1.5 5.1 5.3 6.4 6.5 2.3 2.2 -0.9Fiji 0.4 3.8 3.5 3.4 3.3 0.0 0.0 0.1Papua New Guinea 2.4 2.1 2.5 2.7 2.9 0.0 0.0 0.3Solomon Islands 3.5 3.2 3.0 2.9 2.8 0.2 0.0 0.1Timor-Lestea 5.3 -1.8 2.2 4.2 4.0 -4.2 -2.0 -0.8
Assumptions about the external environment:b
World 2.4 3.1 3.2 3.1 2.9 0.2 0.3 0.2Advanced economies 1.6 2.2 2.3 2.0 1.7 0.1 0.4 0.3Emerging and developing economies 3.7 4.4 4.6 4.7 4.7 0.3 0.1 0.1Crude oil (spot, US$/barrel) 43 53 60 61 62 0.0 4.0 2.0Non-energy commodities (index, 2010 = 100) 79 84 86 87 87 0.0 1.0 2.0Food (index, 2010 = 100) 90 91 92 93 94 -1.0 -1.0 -1.0
Sources: World Bank data and staff estimates.Note: a. Non-oil GDP. b. Global growth forecasts represent preliminary working assumptions. The updated revised forecasts are from the April 2018 World Bank Commodity Price Outlook. Myanmar data are fiscal year growth rates (2017 = FY2017/18). Changes from October 2017 are calculated with one decimal point precision and rounded to one decimal point. c. World Bank East Asia and Pacific Economic Update, October 2017 (World Bank 2017e).
I.B. OUTLOOK AND RISKS 27
ENHANCING POTENTIAL

Thegrowthoutlook for thePacific IslandCountries ismixed.Growth in Fiji is expected to remain above-trend, underpinned by reconstruction activities and tourism, while easing over 2018–20. The Solomon Islands’ economy is projected to grow at around 3 percent over the medium term, with growth driven predominately by major investments in infrastructure, including road transport, telecommunications, and energy. Overall, growth in the South Pacific Islands is expected to remain resilient over the medium term. In Tonga, the damage caused by Cyclone Gita in February 2018 is expected to contribute to growth deceleration in 2018, while recovery and reconstruction efforts may contribute to a rebound in economic activity in the following years. Among North Pacific Island economies, except for Palau, growth is projected to remain modest. In Nauru, the economy is projected to contract in FY2018 as Australia’s Regional Processing Centre for asylum seekers scales down. The outlook for
Box I.B.1. Global Outlook and Risks
Global growth is expected to peak in 2018. Global growth is projected to reach a peak of 3.2 percent in 2018, as the cyclical momentum continues. It will then slightly moderate to an average of 3 percent in 2019–20, reflecting a gradual slowdown in advanced economies (Figure BI.B.1.1). Growth in advanced economies is projected to firm slightly to 2.3 percent in 2018 and an average of 1.8 percent in 2019–20, following an investment-led recovery in 2017, as labor market slack diminishes and monetary policy accommodation is gradually unwound. Over the forecast horizon, growth in advanced economies is expected to move closer to subdued potential growth rates, which remain constrained by aging populations and weak productivity trends.
Figure BI.B.1.1. Global GDP growth Figure BI.B.1.2. Regional GDP growthPercent Percent
20082009
20102011
20122013
20142015
9
7
5
3
1
-1
-3
-5
20072018f
20162017
2019f2020f
10
8
6
4
2
0
-2
2015
2016
2017
2018
f
2019
f
2020
f
2015
2016
2017
2018
f
2019
f
2020
f
2015
2016
2017
2018
f
2019
f
2020
f
2015
2016
2017
2018
f
2019
f
2020
f
2015
2016
2017
2018
f
2019
f
2020
f
2015
2016
2017
2018
f
2019
f
2020
f
J World ▬ Advanced economies ▬ Emerging and developing economies J EAP J SAS J ECA J LAC J MENA J SSA
Source: World Bank.Note: Working assumptions for 2018; forecasts for 2019–20; updated forecasts will be published in the June 2018 issue of the World Bank report, Global Economic Prospects. F = forecast.
Source: World Bank.Note: Lines denote long-run (1990–2017) average growth. Working assumptions for 2018; forecasts for 2019–20 will be finalized and published in the June 2018 issue of the World Bank report, Global Economic Prospects. f = forecast.
Conversely,growthinemergingmarketanddevelopingeconomies(EMDEs)isexpectedtoaccelerate,reaching4.6percentin2018andanaverageof4.7percentin2019–20.This mainly reflects a further cyclical pickup of growth in commodity exporters, which is forecast to rise to 2.7 percent in 2018 and to an average of 3.1 percent in 2019–20 as the effects of the earlier commodity price collapse dissipate (Figure BI.B.1.2). The rebound in commodity exporters is expected to be broad-based and the negative output gaps
(continued)
28 PART I. RECENT DEVELOPMENTS AND OUTLOOK
EAST ASIA AND PACIFIC ECONOMIC UPDATE APRIL 2018

are projected to gradually close, assuming broadly stable oil and other commodity prices over the forecast period.
Growth in commodity importers is projected to inch down to 5.8 percent in 2018 and remain broadly stable thereafter. A gradual slowdown in China is expected to be offset by a modest pickup in the rest of the group during the forecast horizon. Excluding China, growth in commodity importers is foreseen to be 5 percent in 2018 and to accelerate to an average of 5.1 percent in 2019–20, reflecting the diminishing role of idiosyncratic factors weighing on activity in some large economies in 2017 (for example, India, Mexico).
The robust pace of expansion in EMDE regions with a substantial number of commodity importers isexpectedtocontinue(EAPandSouthAsia,aswellasthewesternpartoftheEuropeandCentralAsia(ECA)region).Most of the EMDE regions with large numbers of commodity exporters (the eastern part of ECA, Latin America and the Caribbean, Sub-Saharan Africa), are expected to see faster growth during the forecast horizon, as the impact of the earlier collapse in commodity prices dissipates. Growth in the Middle East and North Africa region, which slowed in 2017 due to oil production cuts, is expected to rebound in 2018.
DespitetheprojectedfirmingofactivityamongEMDEsovertheforecasthorizon,absentsignificantpolicy changes to boost potential growth, long-term fundamental drivers of EMDE growth are expected to continue to weaken over the next decade. This reflects a more subdued pace of capital accumulation, slowing productivity growth, and less favorable demographic trends (World Bank, 2018). Demographic trends are expected to worsen particularly in East Asia and Pacific (for example, China, Thailand) and Europe and Central Asia (for example, Poland, Russia), while they will remain especially supportive to potential growth in South Asia.
Global trends are expected to become less supportive over the forecast period. Global trade, which accelerated sharply in 2017, benefiting from a cyclical upturn in global manufacturing, is expected to remain strong in 2018, but to moderate thereafter, as global investment growth eases. Overall, growth in global trade of goods and services is expected to moderate from 4.7 percent in 2017 to 4.4 percent in 2018, which is still higher than April projections. A projected deceleration of capital spending in China and most advanced economies is expected to contribute to a further moderation of global trade growth in 2019 and 2020.
Global financing conditions, which remained benign throughout 2017, are likely to tighten in2018, as monetary policy gradually normalizes in major advanced economies. Inflation expectations and prospects of a faster normalization of U.S. monetary policy have increased. Global interest rates are expected to continue rising, as inflation gradually picks up and monetary policy normalizes across advanced economies. A continued drawdown of net asset purchases by major central banks will contribute to putting upward pressure on long-term yields.
(Box I.B.1 continued)
(continued)
I.B. OUTLOOK AND RISKS 29
ENHANCING POTENTIAL

Capitalinflowsarestillexpectedtobesustainedin2018,assumingcontinuedrecoveryinEMDEgrowth. However, foreign direct investment flows are projected to remain relatively subdued, as flows to China continue to decelerate and commodity prices recover only slowly. As global interest rates continue to increase, EMDE external financing conditions could become increasingly challenging in 2018 and 2019.
Energyprices,andtosomeextentagriculturalprices,areexpectedtomoderatelyfirm.Oil prices are expected to average US$60 per barrel in 2018, and US$60.8 per barrel in 2019. Downside risks to prices arise from the possibility of faster-than-expected U.S. shale production, or a premature end to the Organization of the Petroleum Exporting Countries (OPEC)/non-OPEC cuts. Upside risks primarily arise from rising geopolitical tensions. Metals prices have been stable in the first quarter of 2018 and are expected to change little over the forecast horizon, as Chinese demand gradually slows. Upside risks include stricter pollution control policies in China. Agricultural prices have increased slightly in the first quarter of 2018, fears of drought-driven supply disruptions in South America, following three years of stability. Stocks-to-use ratios for grains—a measure of global supply availability relative to demand—remain high for most grains, which will continue to put downward pressure on prices (Figure BI.B.1.3).
Although risks to the global outlook continue to be tilted to the downside, they are more balanced than in the previous EAP Updates. This is mainly due to the possibility of stronger-than-expected growth in the largest advanced economies and EMDEs—reflecting, for instance, a more pronounced investment-led recovery in the United States and the euro area, or a faster rebound in large commodity exporters. In the United States, fiscal policy is becoming more simulative. The fiscal stimulus, alongside recent tax cuts, will provide considerable support to growth in the near term. The benefits of fiscal stimulus will likely be constrained because the economy is already operating at near full capacity and the pace of monetary policy normalization might slightly accelerate. If these positive surprises were to materialize, they could have beneficial international spillovers.
Nonetheless, there remain important downside risks. Disorderly financial market movements, such as an abrupt tightening of global financing conditions or a sudden rise in financial market volatility, could trigger financial turbulence and potentially derail the expansion. The adverse effects of rising borrowing costs could be particularly acute for those EMDEs with large external financing needs, fragile corporate balance sheets, and significant fiscal sustainability gaps. In addition, escalating trade protectionism or rising geopolitical risk could also negatively affect confidence, trade, and overall economic activity. Over the longer term, a more pronounced slowdown in potential output growth in both advanced economies and EMDEs would make the global economy more vulnerable to shocks and worsen prospects for continued improvements in living standards.
Figure BI.B.1.3. World commodity prices forecastNominal U.S. dollars, 2010 = 100
130
110
90
70
50
30
10
1980 1985 1990 1995 2000 2005 2010 2015 2020
▬ Energy ▬ Metals ▬ Agriculture
Source: World Bank.
(Box I.B.1 continued)
30 PART I. RECENT DEVELOPMENTS AND OUTLOOK
EAST ASIA AND PACIFIC ECONOMIC UPDATE APRIL 2018

these countries is subject to substantial risks due to their reliance on tourism, grants, and commodity imports. A slowdown in key trading partners, further U.S. dollar appreciation, and natural disasters could negatively impact tourism activity. Higher commodity prices could make food and fuel imports costlier and inflation higher.
Domestic demand will remain the main driver of regional growth
Private consumption in developing EAP will continue to support domestic demand (Figure I.B.1). Private consumption is expected to remain robust in a majority of the regional economies (for example, China, Vietnam, the Philippines, Malaysia) and accelerate in Indonesia, Thailand, and several small commodity exporters. Investment growth is expected to strengthen across the region led by countries that experienced several years of relatively weak investment (for example, Thailand and commodity exporters). In China, in contrast to much of the rest of the region, net exports will continue to contribute to growth, although this contribution will diminish in 2019–20.
Figure I.B.1. Private consumption and investment are expected to remain the main contributors to growthContribution of expenditure components to GDP growth, percentage points
Panel A. Developing EAP Panel B. Developing EAP (excluding China)8
7
6
5
4
3
2
1
-1
0
2014 202020192016 2017 20182015
8
7
6
5
4
3
2
1
-1
0
2014 202020192016 2017 20182015
J Private consumption J Gross capital formation J Net exports J Private consumption J Gross capital formation J Net exports
J Government consumption ▬ GDP J Government consumption ▬ GDP
Source: World Bank staff estimates.
Tradeflowsareexpectedtomoderateastheglobalenvironmentbecomeslesssupportiveovertheforecasthorizon. In Thailand, the significant contribution to growth from net exports in past years is set to diminish in 2018 and gradually dissipate in 2019–20, as import growth will rise, reflecting firming domestic demand. Across the region, trade flows are expected to remain robust, absent major external shocks, but the pace of both export and import growth will gradually decelerate as the global environment becomes less supportive over the forecast horizon, after global growth peaks in 2018. While exports are expected to maintain momentum into 2018, supported by the upswing in international investment, it is unlikely they will attain the double-digit rates achieved in 2017, which was partly due to a lower base effect and partly due to a sharp rebound of global demand. Import volumes will continue to accelerate, underpinned by strong domestic demand, while import values will experience strong growth because of stronger commodity prices.
I.B. OUTLOOK AND RISKS 31
ENHANCING POTENTIAL

Withoutputgapsclosingorclosed,inflationexpectationsareexpectedtorise.The cyclical recovery in many regional economies, including the commodity exporters (Indonesia, Malaysia, Mongolia) and Thailand is close to running its course. In general, the region is now operating around its potential level with output gaps closing or closed, and labor markets are tightening. In this context, price pressures are expected to increase in 2018.
With the prospects for continued growth, poverty is expected to continue declining
Projections show that poverty across the region will continue to decline (Table I.B.2). By 2020, the proportion and number of extreme poor in the region will be relatively small and they will be concentrated in a few countries—Lao PDR, Papua New Guinea, and Timor-Leste—and in remote locations within more affluent countries. The policy challenge will be reaching these differentiated groups of extreme poor with public services and social assistance programs.
Table I.B.2. Poverty in developing EAP is projected to continue falling
PPPUS$1.90percapitaperdaypoverty:EstimatesandProjectionsYear 2017 2018 2019 2020
Developing EAPPoverty rate (%) 1.9 1.6 1.4 1.3Number of poor (millions) 38 33 29 26
Developing EAP excluding ChinaPoverty rate (%) 4.4 4.0 3.6 3.2Number of poor (millions) 29 26 24 22
PPP US$3.20 per capita per day poverty: Estimates and ProjectionsYear 2017 2018 2019 2020
Developing EAPPoverty rate (%) 10.2 9.2 8.3 7.5Number of poor (millions) 209 188 170 155
Developing EAP excluding ChinaPoverty rate (%) 20.6 19.6 18.5 17.5Number of poor (millions) 135 129 124 118
PPP US$5.50 per capita per day poverty: Estimates and ProjectionsYear 2017 2018 2019 2020
Developing EAPPoverty rate (%) 30.0 27.7 25.6 23.9Number of poor (millions) 608 564 524 489
Developing EAP excluding ChinaPoverty rate (%) 45.8 44.6 43.3 42.2Number of poor (millions) 300 295 290 285
Source: World Bank East Asia and Pacific Team for Statistical Development.Note: The most recent household income and expenditure surveys vary from 2006 in Kiribati to 2016 in Indonesia and Mongolia. Estimates are extrapolated based on per capita GDP growth and historical estimates of the growth elasticity of poverty. PPP = purchasing power parity.
32 PART I. RECENT DEVELOPMENTS AND OUTLOOK
EAST ASIA AND PACIFIC ECONOMIC UPDATE APRIL 2018
Even with growth, economic insecurity will continue to be a concern. The proportion of the region’s population that is economically insecure (between US$3.20 and US$5.50 per day, 2011 PPP) is expected to decline. However, almost a quarter of the region’s population will remain in this category by 2020, accounting for almost half a billion people. And leaving aside China, this group makes up close to 43 percent of the region, and is particularly high in populous countries like Indonesia and the Philippines.
Fiscaldeficitsanddebtlevelsareexpectedtoremainincheck
Therearelikelytobecontinuingeffortstoimprovethefiscalposition.In 2018–20, deficits, on average, will remain at levels similar to those during 2015–17 (Figure I.B.2). In China, while the explicit consolidated deficit should be comparable to 2017, the quasi-fiscal deficit associated with off-budget public borrowing is expected to narrow significantly. In Vietnam and Mongolia, fiscal consolidation efforts, underpinned by rising oil and mineral prices, are expected to result in a significant reduction in the public sector deficit. In contrast, the Philippines and Thailand are expected to see increases in their deficits associated to the implementation of large infrastructure programs. In Cambodia, public spending levels are expected to keep rising, mainly driven by the public payroll and increasing capital spending.
Figure I.B.2. Deficits are generally expected to remain stable
Figure I.B.3. Growth in government debt is expected to be controlled
General government fiscal deficit (percent of GDP) General government debt (percent of GDP)
10
5
0
0 5 10
KHM
VNM
LAOMMR
MNGCHNFJI
PHLMYS
THA
IDN
Ave
rage 2
01
8–2
0
90
80
70
60
50
40
30
20
10
0
CHN IDN MYS PHL KHMTHA LAOVNM MNG
Average 2015–17 J 2015 J 2016 J 2017 J 2018 J 2019 J 2020
Source: World Bank staff estimates.Note: Data refer to general government fiscal deficit, except for Indonesia, where they refer to central government fiscal deficit, and Cambodia, where they refer to general government fiscal deficit before grants. The area above (below) the 45 degree line reflects projected deficit increases (decreases).
Source: World Bank staff estimates.Note: Data refer to general debt, except for Indonesia, where data refer to central government debt. Data for China exclude significant off-budget debt for public investment accumulated since 2015.
Public sector debt stock is expected to remain contained in most economies. Public sector debt would keep rising in Thailand and Cambodia, albeit from a relatively low base. Meanwhile, Malaysia and Vietnam are expected to continue curbing outstanding debt, while debt would remain checked in the rest of the region. Nonetheless, debt remains high in Vietnam and Lao PDR, where there are also significant risks stemming from implicit or explicit public guarantees. In Mongolia, public debt, although falling, remains above 80 percent of GDP (Figure I.B.3).
Revenue gains stemming from rising prices may be limited in some commodity exporters. In Indonesia, increases in revenue collection may be limited by a lack of adjustment in fuel prices at the gas station, and in
I.B. OUTLOOK AND RISKS 33
ENHANCING POTENTIAL

Papua New Guinea by exemptions to mining companies. Revenue as a percentage of GDP has also been declining in Myanmar, despite improvements in tax administration, due to declining gas revenue, as production in the sector has been declining due to weakening demand.
Delaysintheimplementationoflargeinvestmentprograms—publicandprivate—couldaffectgrowthinMongolia(mining),andinThailandandthePhilippines(infrastructure).In Mongolia, during the last months of 2017, authorities cancelled a series of projects due to their late start, with only a few months remaining in the fiscal year. In Thailand, government investment decelerated in 2017 due to challenges in project execution driven by inclement weather and delays in approval and procurement processes.
A more rapid pace of monetary policy normalization in advanced economies could increase volatility and exacerbate vulnerabilities
Interest rate increases in the United States are likely to continue, and the end of quantitative easing has been announced. In 2017, the U.S. Federal Reserve raised its policy rate three times, cumulatively increasing it by 75 basis points, and formally announced the beginning of the process of unwinding its quantitative easing program. On March 21, 2018, the policy rate was increased by an additional 25 basis points. Further monetary tightening is foreseen in 2018, as U.S. employment and wage growth has been stronger than expected, and the odds of four Fed rate rises this year have now increased to around 30 percent. Similarly, the European Central Bank initiated in January 2018 the reduction of monthly asset purchases, from €60 billion to €30 billion, and the program, expiring in September 2018, is unlikely to be extended. As advanced economy central banks start reducing their balance sheets, they will be returning bonds to the market in exchange for excess reserves. It will be necessary to find more private buyers for the increasing number of bonds in circulation, which is likely to result in interest rate pressures (Rajan 2017). As a result, emerging market economies are expected to pay a premium on their upcoming debt issuances.
There is a risk that a more rapid pace of U.S. monetary policy normalization could lead to heightened financialvolatility. In 2013, speculation about the withdrawal of quantitative easing led to stock market sell-offs, currency depreciation, and a hike in domestic bond yields, especially affecting those countries with the largest foreign participation in their financial markets (Indonesia, Malaysia, the Philippines, and Thailand), and exposing them to volatility (World Bank 2013). Contrary to that “taper tantrum” episode in 2013, U.S. monetary policy tightening this time has so far been clearly communicated and is being implemented in a gradual manner, which has given central banks in the region more time to plan and react (Park and Tian 2017). However, the pace of monetary tightening in the United States may also need to be more rapid due to the recent adoption of the Tax Cuts and Jobs Act and its likely impact on the U.S. fiscal deficit. Recent volatility suggests that markets are already anticipating that rising interest rates will be pushing bond yields higher, making them a more attractive alternative to equities, which could lead to further stock market corrections and financial volatility.
Greater financial volatility could interact with financial sector vulnerabilities inmany countries. Two decades after the Asian financial crisis, which triggered a series of policy adjustments and structural reforms, the region has become more resilient. Stronger fundamentals—including narrowing domestic and external imbalances, and stronger policy buffers amid solid growth—further improved the region’s ability to withstand external headwinds. These improvements notwithstanding, those countries in the region with high levels of debt
34 PART I. RECENT DEVELOPMENTS AND OUTLOOK
EAST ASIA AND PACIFIC ECONOMIC UPDATE APRIL 2018

(for example, China, Lao PDR, Malaysia, Mongolia) or still fast credit growth (for example, China, the Philippines, and Vietnam) continue to face vulnerabilities in their financial sectors. Mongolia and Papua New Guinea have large external financing needs. Limited policy buffers are a concern in smaller economies, especially if they are compounded with high stock of debt (for example, Mongolia and Papua New Guinea). Countries with large foreign holdings of bonds (Indonesia, Malaysia) could be also exposed.
Banking systems in the region continue to be generally well capitalized, while there has been some deterioration in asset quality. Capital adequacy ratios have been consistently above the Basel III standard of 10.5 percent; capital to risk weighted assets varies between 14 and above 20 percent; and Tier 1 capital is well above the Basel III standard of 8 percent across the region. However, there has been some deterioration in asset quality. Over the last year, the ratio of nonperforming loans (NPLs) to total loans has slightly increased in Cambodia, Thailand, and Fiji. Some of the smaller economies may have lax loan classification schemes, and NPL figures could be underestimated (Figure I.B.4). In Vietnam, rapid credit growth together with a sizable stock of problem loans heightens concerns about asset quality and related capital impairment risks in the banking sector (World Bank 2017g). In China, because of strengthening oversight of the banking sector, risky lending has moved away from banks toward the less-well-supervised parts of the financial system. Nonbank financial institutions, including asset managers and insurance companies, have grown even faster than the banking sector, and widespread implicit guarantees have added to these risks, possibly threatening financial stability (IMF 2017b).
Figure I.B.4. Developing EAP’s banking sector is well capitalizedPanel A. Capital adequacy (in percent) Panel B. NPLs to total loans ratio (in percent)35
30
25
20
15
10
5
0
KHM CHN FJI IDN WSMMYS SLBPHL THA
3.5
3.0
2.5
2.0
1.5
1.0
0.5
0
KHM THAFJI IDN MYS PHLCHN
J Capital to risk-weighted assets J Tier 1 capital to risk-weighted assets J 2016Q4 J 2017Q1 J 2017Q2 J Latest*
Source: Financial Soundness Indicators.Note: *China (2017Q4); Cambodia, Indonesia, Malaysia, the Philippines, Thailand (2017Q3); Fiji (2017Q2); Samoa (2017Q2); the Salomon Island (2017Q1).
Intraregionalcross-borderbankinghasalsorisenrapidlyinrecentyears,bringingefficiencygainsbutalsothepossibilityofsystemicriskstofinancialstability.Over the last decade, banking assets in EAP have increased by almost 10 percent a year, around four times faster than global banking assets. Around three quarters of the Asia-Pacific market is dominated by local or regional banks, with the adoption of standards and initiatives contributing to regional integration (Box I.B.2). However, increased regional integration could be a double-edged sword in a context of global monetary policy tightening, as cross-border bank flows are most likely to withdraw from the least developed markets in the region, which could result in credit crunch affecting local companies (Brauning and Ivashina 2016).3
3 The experience of the Vienna Initiative could be potentially relevant for developing EAP. Established in Eastern and Central Europe by range of financial institutions, it was aimed to prevent a large-scale and uncoordinated withdrawal of cross-border bank groups from the region in the aftermath the global financial crisis, which could have triggered systemic bank crises not only in individual countries but in the entire region.
I.B. OUTLOOK AND RISKS 35
ENHANCING POTENTIAL

Box I.B.2. Intraregional Banking Trends in EAP1
Since the global financial crisis, the Asian banking sector has seen remarkable growth. Today, 40 percent of global banking assets are now in Asia, and the largest five banks in the world by assets are in East Asia and Pacific (EAP).2 According to a recent Oliver Wyman report, banking assets in Asia have grown by almost 10 percent per year since 2009.3 This is especially significant when compared to the growth in global banking assets of around 2.5 percent per year, or stagnation or even a slight decline in banking assets in North America and Europe.
EAP banks are becoming increasingly sophisticated and innovative. With memory of the Asian financial crisis still vivid, the region has come a long way since end-1990s. The largest economies in the region have well-capitalized and profitable financial systems. At the same time, the majority of the largest regional banks have performed well in terms of growth, size, profitability, and degree of sophistication. For example, in terms of profitability, Asian banks have consistently achieved average return on equity levels over 10 percent—and even higher in China and certain Southeast Asian markets.4 Consequently, EAP’s share of global banking profits has increased, as has the market capitalization of EAP banks. Moreover, EAP banks have increasingly adopted international accounting and risk management standards, and many of them are leading the way in the fintech (financial technology) area.
Over the last decade, there has been a significant internationalization of EAP banks.With the increase in size and sophistication of some of the banking systems in the region, many large banks have considerably expanded their regional activity. By some measures, over 75 percent of the Asia-Pacific banking market is dominated by either domestic or regional banks.5 As illustrated in Figure B1.B.2.1, over the last decade banks in the region have increased their share of cross-border claims on counterparties resident in different regions to approximatively 60 percent of all developing country claims.6
1 Prepared by Ana Maria Aviles, Yan Li, and Radu Tatucu.
2 S&P Global Market Intelligence 2017 (https://marketintelligence.spglobal.com/). The first four are Chines banks (Industrial and Commercial Bank of China, China Construction Bank, Agricultural Bank of China and Bank of China), followed by Mitsubishi UFJ Financial Group of Japan.
3 Oliver Wyman 2017.
4 Oliver Wyman 2017.
5 Oliver Wyman 2017. This represents a 25 percent increase from the 60 percent market share as recently as 2009.
6 Cross-border claims are positions booked by offices outside the counterparty country.
(continued)
Figure B1.B.2.1. Cross-border claims on counterparties resident in different regionsPercent
100
99
98
97
96
95
94
93
92
91
Mar-05
Mar-06
Mar-07
Mar-08
Mar-09
Mar-10
Mar-11
Mar-12
Mar-13
Mar-14
Mar-15
Mar-16
Mar-17
Sep-17
J Developing countries (excl. EAP) J Developing EAP J Developed countries
Sources: Bank for International Settlements.
36 PART I. RECENT DEVELOPMENTS AND OUTLOOK
EAST ASIA AND PACIFIC ECONOMIC UPDATE APRIL 2018

Bankswithastrongregionalpresenceappearsoundandprofitable.For illustrative purposes, we have selected a sample of regionally active banks to assess their performance. The sample includes some of the largest banks by assets in the region, as well as a few smaller banks.7 Overall, in the selected sample, banks appear well capitalized and with solid liquidity positions. Their Tier 1 capital, which has been consistently improving since 2014, was more than 12 percent in FY2016, well above the required minimum of 4.5 percent. In addition, overall, their ratio of liquid assets to tangible bank assets was more than 20 percent during 2012–16. Finally, the ratio of loan loss reserves to nonperforming loans for most of the featured banks was more than 70 percent in FY2016.
Therearesignificantbenefitsassociatedwithincreasedinternationalbankingactivities,resultinginenhancedfinancialdevelopmentandultimatelyhighereconomicgrowth.8 First, financial integration may stimulate capital accumulation via financial deepening in the host country, especially when the domestic financial sector is underdeveloped. Second, financial integration can result in efficiency gains and productivity growth due to improved resource allocation and transfer of technology and knowledge. Indeed, as Lehner and Schnitzer (2008) show, foreign bank entry is frequently associated with spillover effects for local banks and increasing competition in the local market. Third, financial integration exposes policy decisions and corporate actions to greater financial market scrutiny than in financial sectors dominated by domestic banks and financial institutions. Fourth, cross-border financial activity can stimulate the growth of small and medium-sized enterprises (SMEs) in host countries and enhance cross-border activity, resulting in greater regional economic integration. In general, given the geographic location and cultural affinity, regional banks and regional markets are often better suited to serve regional needs than global banking institutions. Regional banks have filled the gaps left as global banks have withdrawn from the region after the global financial crisis. And, therefore, the region is now enjoying some of the benefits of the increased intraregional banking.
However, absent proper checks, banking regionalization comes with considerable risks for stability, as well. Benefits associated with regional financial integration are not assured without the proper safeguards, particularly enhanced supervision. First, cross-border banking can be associated with several key risks, including adverse spillovers if there is insufficient official capacity to exercise the required oversight. Second, foreign bank credit may be less stable than domestic credit, particularly during adverse economic times, though the literature on this subject is mixed.9 Third, foreign banks can cherry-pick borrowers, thus negatively affecting overall private credit as they worsen the credit pool remaining for domestic banks. Detragiache,
7 This includes seven of the top 50 largest Asia-Pacific banks by total assets: China: Industrial and Commercial Bank of China Ltd., China Construction Bank Corp.; Hong Kong SAR, China: Hongkong and Shanghai Banking Corp. Ltd.; Singapore: DBS Group Holdings Ltd., Overseas-Chinese Banking Corp. Ltd., United Overseas Bank Ltd.; Malaysia: Malayan Banking Bhd. (Maybank), and CIMB Bank of Malaysia and Bangkok Bank of Thailand, which although not in the region’s top 50 largest banks by assets, have a strong regional presence in EAP. This list is not exhaustive.
8 For a detailed discussion, see Eyraud, Sing, and Sutton (2017).
9 For instance, De Haas and van Lelyveld (2014) find there was no evidence of “cut and run” behavior by foreign banks during the period following the Russian crisis of 1998, and Peek and Rosengren (2000) found that foreign banks even expand during troubled times in the host country. However, Claessens and van Horen (2013) found that foreign banks reduced credit by 6 percentage points more in 2009 relative to domestic banks, but only in the case of developing countries and emerging markets.
(continued)
(Box I.B.2 continued)
I.B. OUTLOOK AND RISKS 37
ENHANCING POTENTIAL

Gupta, and Tressel (2008) and Claessens and van Horen (2014) find that while foreign banks can select the best borrowers and even lower overall credit, this practice arises mainly in low-income countries, and not so when banks are large in the market and are from home countries that are in geographic proximity.
Fourth, greater integration could also make macroprudential policies implemented by countries easier to circumvent, through cross-border leakages and provision of credit. Fifth, greater regional banking integration might have an adverse impact on financial stability through the transmission of international shocks. For instance, Raddatz and Schmuckler (2012) and Puy (2016) find that international fund flows—in particular, to and from emerging markets—tend to be highly procyclical with financial conditions at home and often independent of the borrowing countries’ fundamentals. Certainly, openness in the banking sector introduces volatility and exposes countries to foreign exchange risks, monetary policy shocks imported from other countries, and other mismatches.
Policymakershaveacrucialroleinmaximizingthebenefitsonincreasedregionalbankingactivitywhile managing the risks associated with it. A stronger legal, regulatory, and supervisory framework in host jurisdictions encourages a sound expansion of international banks in host countries. Specific elements to consider include transparency, good information sharing, property rights, and contract enforcement. It is also important to consider specific bank characteristics and the environment of home and host countries. For development considerations, larger banks and those that are culturally closer, with a greater share of domestic financial intermediation including deposit taking, tend to provide better access to SMEs and households and are less likely to focus only on large corporate customers.
As for stability, cross-borderflows tend tobemorevolatileand less resilient thanabrick-and-mortar bank presence. Therefore, foreign banks with a greater commitment, as reflected in closeness both in distance to headquarters and in culture, that have larger local market shares, and rely more heavily on local funding, are more willing both to incur temporary costs when faced with external shocks and to support the local economy (World Bank 2017m). In addition, the oversight of international banking is a complex matter, and it benefits considerably from extensive cross-border coordination among regulatory bodies. In the region, it is worth noting that the ASEAN central banks endorsed the ASEAN Banking Integration Framework (ABIF) in December 2014, to facilitate the flow of financial services among member states. As part of the ABIF, member countries have adopted the scheme of Qualified ASEAN Banks (QABs), which stipulates that a bank qualified in one jurisdiction will receive equal treatment in the others. Negotiations to implement the QABs are beginning at the bilateral level, starting with the larger economies.
(Box I.B.2 continued)
38 PART I. RECENT DEVELOPMENTS AND OUTLOOK
EAST ASIA AND PACIFIC ECONOMIC UPDATE APRIL 2018

Uncertainty stemming from renewed protectionist sentiment and geopolitical tensions could hamper exports and growth
The resurgence of global trade could be threatened by the recent imposition of trade and investment restrictions. The recent imposition of tariffs by the United States on solar panels, washing machines, steel, and aluminum could mark a shift toward a more protectionist stance. While these specific measures are expected to have only a limited impact on developing EAP exports, they may be supplemented with more proposed increases in tariffs on a range of Chinese exports to the United States, as well as the threat of investment restrictions that would prevent Chinese citizens from acquiring, controlling, or even owning significant shares of U.S. businesses. These latter measures were recommended by an investigation by the U.S. Trade Representative for violations of U.S. intellectual property rights by China.
These actions may lead to retaliation, some of which has already been initiated. In early February, China announced the opening of an investigation on imported sorghum, mostly sourced from the United States, and the European Union has threatened to impose tariffs on U.S. peanut butter and orange juice, among other products. China has also responded to the latest set of trade and investment restrictions by announcing higher tariffs on a range of products imported from the United States, such as fruits and pork.
Regional geopolitical tensions may also affect trade and economic performance in some countries. Bans have been imposed on three Chinese companies that were trading heavily with the Democratic People’s Republic of Korea, and further sanctions could follow. There are also signs of an intensification of geopolitical competition between China and India in the Greater Indian Ocean region, which comprises the maritime component of the Belt and Road Initiative, with Chinese-backed ports in Myanmar, among other countries, and growing tensions around the Maldives (BMI Research 2018). On the South China Sea, tensions have lessened in recent months, as both China and the Philippines have agreed to sort out territorial disputes using diplomatic channels.
ThePacificIslandsremainvulnerabletoshocks
ExternaldebtlevelshavebeencontainedinthePacificIslandCountries,butfiscalsustainabilityremainsvulnerable to shocks. While countries have overall been improving their fiscal positions, buffers differ widely, with cash balances ranging from 12 months of recurrent spending in Kiribati to just one month in the Marshall Islands. Medium-term fiscal risks are associated with the expiring of the Compact Sector Grants (in Micronesia, the Marshall Islands, and Palau), which have been supporting public spending on education, health, and general infrastructure.
I.B. OUTLOOK AND RISKS 39
ENHANCING POTENTIAL

I.C. Policy Considerations
Despite a positive growth outlook for the region, policy makers will be well advised to address the threats to stability and sustained growth. In the short term, these relate to the risks associated with monetary tightening in advanced economies and their possible interactions with domestic financial vulnerabilities. Addressing these risks will require being ready to tighten monetary policy and build fiscal buffers. Over the longer term, there is a need to raise the growth potential of economies in the region. While priorities will differ across countries, policies should aim to increase public and private investment, promote productivity growth, and foster human capital.
In the short term, authorities need to address the risks to stability
Despite the positive outlook and still supportive global conditions, recent signs of volatility highlight the need to mitigate risks to macroeconomic stability. During the last few years, in a context of subdued global demand, countries have tried to underpin economic activity with loose monetary and fiscal policies. In some developing EAP economies, this has led to fast credit growth and enlarging fiscal deficits and debt stocks. Currently, given the positive regional outlook and a still favorable global environment, authorities have the space to move away from policies aimed at stimulating short-term growth toward measures that address underlying vulnerabilities. This is especially important as financial markets have started to experience some bouts of volatility in early 2018.
Ì Addressingmacrofinancialvulnerabilities
As some of the above-mentioned risks seem more likely to materialize, developing EAP countries would need to be ready to tighten monetary policy. Stronger fundamentals have improved the region’s ability to withstand external headwinds. Most countries in developing EAP have been preparing to react to monetary policy normalization in advanced economies by improving the current account positions and containing debt growth. Following steady policy rates for an extended period, central banks have room to respond to potential capital outflows or foreign exchange pressures by raising policy rates. With inflationary pressures remaining benign, the need for an immediate tightening of interest rates decreases in some countries; those may maintain a neutral policy stance in 2018, while getting ready for monetary tightening. Meanwhile, strong growth momentum and high outstanding debt stocks may force Malaysia to further increase interest rates. In Vietnam, some liquidity tightening may be required to close the gap between low interbank rates and official policy rates.
Countries could also resort to additional measures to mitigate potential risks stemming from heightened volatility. These include reducing dependency on short-term foreign-currency-denominated debt to respond to shifting global liquidity conditions. As advanced economies pursue monetary tightening, countries in the region may need to respond by increasing the policy rates and allowing some exchange rate depreciation to reinforce the current account balance and prevent sharp capital outflows. Some economies may use reserves to mitigate excessive exchange rate volatility or liquidity constraints. Ultimately, the mix of policies will depend on country
40 PART I. RECENT DEVELOPMENTS AND OUTLOOK
EAST ASIA AND PACIFIC ECONOMIC UPDATE APRIL 2018

fundamentals, inflationary pressures, and the degree of reliance on debt denominated in foreign currency and foreign capital (World Bank 2013).
Macroprudential regulation can be a suitable tool to mitigate certain risks such as overborrowing. Regulators can use macroprudential measures, such as liquidity-coverage ratios or minimum capital and reserve requirements to maintain financial institutions in check, while it is important that they ensure that profitability is not jeopardized. In this regard, it would be advisable to avoid imposing interest rate caps. China has focused on lifting caps on foreign ownership of financial institution, further streamlining oversight of asset management products sold by financial institutions, and tightening regulations on entrusted loans and bond trading transactions, limiting borrowing by local government financing vehicles, and merging certain financial sector regulatory functions; going forward, Chinese authorities could also consider a gradual and targeted increase in bank capital. Over the last decade, Malaysia has enforced a maximum 70 percent of loan-to-value for a third house, a maximum 60 percent of loan-to-value on nonindividuals taking loans for residential properties, and a maximum tenure of 35 years for purchase of properties (Lau 2015). Thailand, in 2017, lowered the credit limit and personal loan limit to borrowers with low monthly income (Pongsaparn, Wongwachara, and Nudam 2017). These are examples of macroprudential regulation that can be introduced to limit household indebtedness, especially shielding those with more limited ability to repay.
Lower-middle-income economies in developing EAP would also need to focus on addressing some persistentmacrofinancialvulnerabilitiesbystrengtheningoversight.Developed country financial markets are at all-time highs in many measures (such as price-earnings ratio), which could potentially lead to sharp market corrections, and international interest rate increases may make outstanding debt harder to service. To mitigate the potential negative impacts of global financial volatility on domestic markets, authorities would need to focus on strengthening oversight by improving data quality, introducing risk-based supervision, ensuring compliance with the latest international Basel standards and International Finance Reporting Standards, and setting up crisis management frameworks. Cambodia and Myanmar, among other countries in the region, are currently working on implementing supervision-related reforms. In February 2014, the State Bank of Vietnam established a Monetary and Financial Stability Department, responsible for analyzing, assessing, and implementing macroprudential policy, and introducing measures to prevent systemic risk in the financial system (ADB 2014).
Ì Buildingfiscalbuffers
On thefiscal side, some countrieswouldneed tomove toward amore conservativefiscal stance andimprove public debt management. While global conditions remain supportive, recent market turbulence could point to an eventual deterioration. Countries in the region, especially those with already high or quickly rising public debt levels, would need to build fiscal buffers and control risks. Both Vietnam and Lao PDR would need to strengthen public debt management and undertake reforms in state-owned enterprises (including banks).
China has introduced a series of measures to impose strict limits on local government borrowing, while at the same time restricting off-budget public borrowing, although some implementation challenges persist. To finance local infrastructure projects, in recent years, local governments actively borrowed off-budget through corporate entities in the form of local government financing vehicles (LGFV). The government took some
I.C. POLICY CONSIDERATIONS 41
ENHANCING POTENTIAL

important corrective actions to address these issues in late 2016 and 2017. The new measures appear to be having a significant impact at the local level, although challenges remain. The total liabilities of LGFVs grew by about 15 percent year-over-year in the first half of 2017, down from above 20 percent a year during 2012–16. Going forward, it will be important to continue to alleviate capacity and informational constraints for effective debt monitoring and management at the local level, achieve a clearer separation of commercial and public finances, and ensure that any future national fiscal stimulus is pursued in a manner that is consistent with prudent local government finance.
Inaddition,avoidingtaxcompetitionandfosteringrevenuecollectionwouldhelpconsolidatethefiscalposition. The U.S. Tax Cuts and Jobs Act is estimated to affect affiliates accounting for almost half of the global FDI stock and could potentially lead to the repatriation to US$2 trillion of overseas funds of American multinationals (UNCTAD 2018). This could negatively affect FDI prospects and spur tax competition. At this juncture, it is important to prevent a race to the bottom in response to the passing of the Tax Cuts and Jobs Act, given that developing EAP is already a region with low average corporate tax rates and pervasive tax holidays (Abbas and Klemm 2013; World Bank 2015a). ASEAN could be the platform to negotiate and agree on a set of basic principles in the design of tax holidays, as well as on minimum levels of corporate income tax rates.
Instead, countries could focus on streamlining the tax administration and broadening the tax base to keep raising revenue while remaining competitive. Cambodia, Lao PDR, and Myanmar, lower-middle-income economies with a narrow tax base, have been undertaking tax policy and administration reviews, and are planning a reform agenda accordingly. Other smaller countries featuring low collection levels, such as Timor-Leste, would also benefit from conducting a tax review and adopting a revenue mobilization strategy. In Indonesia, a proposed reform of the tax on medium, small, and micro enterprises aims at lowering their tax burden, encouraging their growth and formalization. Indonesia has also used behavioral science to increase tax compliance (Box I.C.1). In the Philippines, a second tax reform package, focusing on rationalizing fiscal incentives and adjusting corporate income tax rates, was submitted to Congress in January. Effective implementation of these reforms will be crucial to ensuring the sustainability of public finances.
Box I.C.1. Behavioral Science for Development in East Asia1
To achieve impacts, behavioral insights complement standard economic assumptions, generating a more complete understanding of human economic behavior, and thus opening more options for policy interventions. Standard development policy typically targets financial resources, laws, or incentives—the conventional tools used by policy makers. A behavioral approach enriches standard development policy by focusing on individual and collective mindsets. It draws on a variety of disciplines, including economics, psychology, anthropology, sociology, and neuroscience. And because a key insight from behavioral science is that behavior and decision making are contextual, interventions informed by behavioral insights rely on careful diagnostics and involve an iterative process of testing and adaption.
1 Prepared by Giorgia Demarchi, Samantha De Martino, Taufik Ramadhan Indrakesuma, Serrana Murrica, Kenneth Simler, Bambang Sharnoko Sjahrir, and Renos Vakis.
(continued)
42 PART I. RECENT DEVELOPMENTS AND OUTLOOK
EAST ASIA AND PACIFIC ECONOMIC UPDATE APRIL 2018

Byfocusingonthedemandside—theuser’sperspective—policyrecommendationsfrombehavioralinsights are desirable as they can be adapted regardless of supply-side readiness. Some desired behaviors, such as breastfeeding to combat malnutrition, do not rely at all on the delivery of government services and may be best addressed through “nudge” initiatives using behavioral insights. Crucially, these interventions tend to be cost-effective and rely on relatively low budget inputs, and therefore can offer governments a new tool that could assist them in achieving their development objectives in a resource-constrained environment. Currently, behavioral interventions to address stunting are being initiated by the Ministries of Health in partnership with the World Bank in Indonesia and the Philippines; Myanmar is embarking on similar efforts. The focus in Indonesia is on understanding the norms around breastfeeding, so as to devise ways to overcome the related challenges they pose to nutrition outcomes. The Philippines is looking at the different challenges that hinder better nutrition outcomes, from political will and service delivery, to an individual’s beliefs and behaviors. Global evidence on the design of behavioral interventions with an impact on nutrition outcomes is still limited; however, it promises to grow quickly as more countries design and evaluate their efforts in this field.
CountriesinEAPhavestartedtofollowothers—suchasAustralia,Peru,theUK,andmanyothers—inleveraging the behavioral toolkit in policy making. As testimony to the observed potential of behavioral science to impact policy, governments in Australia (New South Wales), Singapore, and the UK have started to set up behavioral teams to adopt behavioral insights across policy issues and within public administration.2
The following examples highlight the applications of behavioral science for development in East Asia:
Education: Reframing mindsets and changing lives in Indonesia
There is evidence that the skills people develop at a young age are critical to their long-term cognitiveandnoncognitive(socioemotional)development.But children, especially those from poorer socioeconomic backgrounds, are often limited in their aspirations by what they think they can learn and aspire to in life. In Indonesia, the Ministry of Education and Culture and the World Bank are introducing an intervention to reframe the beliefs of middle school students by showing them that intelligence is malleable. The intervention is an adaptation of a program in Peru that led to an increase in math test scores equivalent to one full year of schooling (0.14 standard deviations), at a cost of less than $0.20 per student. The Peru intervention reached 50,000 students in an initial phase, and an additional 250,000, subsequently. In Indonesia, a successful first experiment was rolled out in 2017 to 180,000 students in 1,200 schools, with initial impacts on standardized exam scores that echo those in Peru. Building on the pilot, an expanded curriculum on socioemotional skills is being designed for a rollout in July 2018. This expanded intervention
2 The World Bank has also set up its own behavioral science unit—the Mind, Behavior, and Development Unit (eMBeD). The unit collaborates with client countries by working closely with policy makers to diagnose bottlenecks, design interventions, and evaluate results using “nimble RCTs” (quickly executed randomized control trials using administrative data).
(continued)
(Box I.C.1 continued)
I.C. POLICY CONSIDERATIONS 43
ENHANCING POTENTIAL

will cover 2,100 schools, and includes a survey that will measure the intermediary impacts in mindset, socioemotional skills, aspirations, study behaviors, and cognitive outcomes.
Finance: Increasing tax compliance in Indonesia
Behavioral science has long informed tax policy by leveraging social norms, especially peer comparisons, to motivate compliance. However, as behavior and decision making are contextual, not all tax policy can be made more effective with the use of social norms. To highlight the importance of context in behavioral policy design, the World Bank supported the Polish tax authorities in designing a trial to improve tax collection. The results indicated that using punitive language in the letters addressed to taxpayers increased tax compliance more than social norms, with “hard tones,” increasing tax compliance by 20.8 percent. If the communication that performed best in the trial had been sent to all taxpayers, the Polish Tax Authority would have generated 56 percent more revenue. In Indonesia, a similar intervention is being designed in collaboration with the World Bank to increase registration and tax compliance of small and medium-sized enterprises (SMEs) by testing the effects of framing, and of testing the impact of publicly recognizing good citizens (compliers). The initiative will first launch an information campaign by sending letters to SMEs with varying language (testing loss aversion compared to gains framing), followed by an intervention to publicly recognize tax-compliant SMEs.
Finance: Improving debt management in Malaysia
AgensiKaunselingdanPengurusanKredit (AKPK) isanagencysetupbyBankNegaraMalaysiathat uses counselling and a structured debt management program to help Malaysians avoid legal bankruptcyproceedingsandenhanceindividualfinancialcapability.Approximately 142,000 people have been served by this program, but delinquencies and premature terminations continue to pose a challenge. By altering the framing and timing of communication with clients and establishing a sense of trust, reciprocity, and individual responsibility, an intervention supported by the World Bank aims to reduce delinquencies. AKPK sends tailored SMS messages to participants and tests the framing of the messages. For example, clients who are not yet delinquent may receive a message congratulating them on their 6- or 12-month anniversary with AKPK, positively reinforcing their relationship and commitment to pay on time. AKPK is testing a variety of messages for clients who are behind on payments. These remind them of their longer-term goal of being debt-free, the moral commitment they made to AKPK, social norms and the favorable behavior of other clients, or the consequences of defaulting. Those who have missed two payments and are on the verge of removal from the program receive reminders about their commitment to AKPK or a message to call AKPK if help is needed. A randomized control trial is testing the impact of communicating different messages via SMS for four to six months, targeting approximately 50,000 AKPK clients. Results are
(Box I.C.1 continued)
(continued)
44 PART I. RECENT DEVELOPMENTS AND OUTLOOK
EAST ASIA AND PACIFIC ECONOMIC UPDATE APRIL 2018

forthcoming, and clients will be tracked for six months after the interventions have ended to understand longer-term outcomes and sustainability.
Incorporating behavioral insights into policies has yielded positive and lasting results, especially in low-income contexts. The initial behavioral interventions with impacts to date have focused on altering the details of timing, framing messages, simplifying processes, and highlighting peer comparisons. This works by changing the framing or the choice architecture, and is simple and cost-effective. The frontier moving forward in behavioral science is complementing this with shifting social norms and changing mental models. Only by shifting norms can we expect long-lasting behavioral change. Across many domains—education, labor markets, health, environment, organizational effectiveness, and finance—behavioral science is improving conventional policy making. It is doing so by diagnosing the wide set of psychological, social, and economic factors that influence decision making, and then providing low-cost, quick solutions that can dramatically increase the impact of policies and, most importantly, change mindsets and norms for more productive and healthy societies.
(Box I.C.1 continued)
Lifting long-term growth potential
Asregionalgrowthisexpectedtomoderate inthe longerterm,countrieswillneedfindwaystoraisetheir potential growth (Box I.C.2). Going forward, countries in developing EAP could improve the efficiency of public spending and infrastructure provision, deepen trade integration and improve trade facilitation, improve competitiveness, and enhance human capital. Some of the proposed policy options are discussed in the remainder of this section.
Box I.C.2. Potential Growth in East Asia and the Pacific1
Potential growth is the rate of increase of potential output, or the level of output an economy would sustain at full capacity utilization and full employment.2 Potential growth can be boosted by a combination of labor supply growth, investment in human and physical capital, and total factor productivity (TFP) growth. Productivity growth is possible by improving technology and efficiency. Investment in human
1 This box was prepared by Ekaterine Vashakmadze. Modelling work was done by Sinem Kilic Celik. Research assistance was provided by Anh Mai Bui and Jinxin Wu. The analysis draws on the World Bank’s Global Economic Prospects January 2018: Broad-Based Upturn, but for How Long? (World Bank 2018b).
2 Potential output is not directly observable. Numerous methods of assessing potential output are available. The level and growth rate of potential output are estimated from long time series of actual output, employment, capital stocks, and productivity, using a variety of techniques. Estimates of short-term output may be computed using filtering techniques, while estimates of long-term potential output rest on structural models or long-term growth expectations (see more in World Bank 2018b). This box primarily uses potential output as a (Cobb-Douglas) production function of fully employed labor and capital, as well as technology and efficiency of factor allocation that drive total factor productivity. Other studies find results similar to those described here (see, for example, ADB (2016), Bai and Zhang (2017), and Maliszewski and Zhang (2015)). For a more detailed literature review and references, see World Bank (2018b).
(continued)
I.C. POLICY CONSIDERATIONS 45
ENHANCING POTENTIAL

capital entails expanding access to better-quality education and health services. Apart from underlying demographic trends, labor supply growth can be raised by increasing labor force participation through labor market reforms, aimed particularly at women and older workers.
Evolution of potential growth
SincetheAsianfinancialcrisis20yearsago,growthintheEastAsiaandPacific(EAP)regionhasbeen twiceashighas theemergingmarketanddevelopingeconomies (EMDE)median,buthasslowed sharply (Figure BI.C.2.1). At around 7 percent during 2013–17, potential growth in the EAP was still about twice as high as the average for other EMDEs. But this pace is well below the rates achieved over the last two decades. In large part, this reflects slowing potential growth in China, from around 10 percent during 2003–07 to 7 to 8 percent during 2013–17, about 1.3 percentage points below its longer term (1998–2017) average.
Figure BI.C.2.1. Evolution and estimation of potential output growthPanel A. Actual output growth Panel B. Potential growthPercent Percent
14
12
10
8
6
4
2
0
1998–2017 2003–07 2013–17 2018–20
10
8
6
4
2
0
CHNEAPexclCHN
LAO VNM KHM MMR MNG MYS IDN THAPHL VUTSLB WSMPNG KIRFJI TONEast Asia Pacific Islands
J China J EAP excluding China ▬ Median J 2013–17 ave. Q Longer-term ave. 1998–2017 ▬ Subregional ave. longer-term ave.
Panel C. Contribution to postcrisis actual growth slowdown Panel D. Potential growth decompositionPercent Percent
12
10
8
6
4
2
02003–07 2013–17 2003–07 2013–17
EAP excluding ChinaChina
10
8
6
4
2
01998–2017
EAP excluding ChinaChina2003–07 2013–17 2018–27 1998–2017 2003–07 2013–17 2018–27
J Growth J Potential J Cycle J TFP J Capital J Labor Q Potential growth
Sources: World Bank staff estimates; World Development Indicators; Penn World Tables; International Monetary Fund.--Note: Panel A. Red and orange bars show period averages of annual GDP-weighted averages. Black vertical lines denote range of GDP-weighted averages of the six EMDE regions, with horizontal markers denoting the median. Panel B. Potential growth estimates are based on the production function method for China, Mongolia, the Philippines, and Thailand, and on multivariate filter-based potential growth estimates for Indonesia and Malaysia; for all other countries, due to data limitations, potential growth estimates are based on expectations proxied by five-year World Economic Outlook growth forecasts. Panel C. Red bars denote average actual growth over period. Orange bars denote contribution of potential growth to change in actual growth between the two periods; blue bars denote contribution of cyclical growth. Panel D. Potential growth estimates based on production function approach.
(Box I.C.2 continued)
(continued)
46 PART I. RECENT DEVELOPMENTS AND OUTLOOK
EAST ASIA AND PACIFIC ECONOMIC UPDATE APRIL 2018

Potential growth across the rest of the region is varied, with policy reforms driving improvements in a few economies, and weak commodity prices and unfavorable demographics changes driving slow growth in most others. In Indonesia, Malaysia, and the Philippines, potential growth rose to around 5 percent during 2013–17, with each country’s potential growth rate around or above its long-term average rate. Favorable demographics, robust investment growth, and capital and labor market reforms lifted potential growth in each country. In Indonesia, the country most severely affected by the Asian financial crisis, growth rose to above 5 percent, in the Philippines growth rose to 5 to 6 percent, and in Malaysia it rose to 5 percent during 2013–17 (ADB 2016; IMF 2018). In contrast, the rest of the region saw potential growth during 2013–17 weaken to at or below its long-term average, driven predominantly by labor force and productivity challenges. In Thailand, potential growth weakened to around 3.5 percent due to unfavorable demographics and domestic policy uncertainty. Potential growth in Vietnam, Cambodia, and Lao PDR remained high (around 6 percent, 7 percent, and 7 percent, respectively), but below their long-term averages, reflecting tepid productivity growth and slowing labor force growth. In Papua New Guinea and Mongolia, potential growth slowed owing to the collapse in global commodity prices, and weakness in import demand from major commodity-importing economies. In Timor-Leste, potential growth slowed because of shortages of human and physical capital, and in several smaller Pacific Islands, growth was weak and volatile, reflecting country-specific factors (World Bank 2017k).
Prospects for Potential Growth: What Could Happen?
Duringthenextdecade(2018–27),theregionisexpectedtoexperienceabroad-basedslowdowninpotentialgrowth,toa(still-robust)rateofaround6percent.Demographic trends that are dampening labor supply in many countries are set to continue, putting the region at risk of becoming old before becoming rich (World Bank 2016). The largest declines in the share of working-age population are expected in China, but will also characterize Thailand and Vietnam. In contrast, countries including Cambodia, Indonesia, Lao PDR, Malaysia, Myanmar, Papua New Guinea, and the Philippines will see a rise in working-age populations and could enjoy a demographic dividend if they generate sufficient jobs (IMF 2017c; World Bank 2016).
A slowing pace of capital accumulation is projected to reduce EAP potential growth by about 0.4 percentage points. The steepest slowdown in capital accumulation is expected in China, where policy efforts will continue to be needed to rein in credit growth. In contrast, in Thailand, investment is expected to recover from previously depressed levels. In most EAP countries, TFP growth prospects are challenged by multiple factors (Chapter 3, World Bank 2017l; 2018b). These include maturing global value chains and electronics technologies (China, Malaysia), a switch in information and communications technologies to consumer applications from productivity-enhancing hardware and software (China), slowing human capital accumulation in lower-income economies with limited fiscal space (Cambodia, Lao PDR), and slowing factor reallocation (China, Malaysia, Thailand, Vietnam). Finally, these domestic factors will be complemented by expectations of lower potential growth at the global level.
(Box I.C.2 continued)
(continued)
I.C. POLICY CONSIDERATIONS 47
ENHANCING POTENTIAL

Policy Options to Lift Potential Growth
Comprehensive policy efforts could help countries in the region improve their potential growth and speed up income convergence. Given that factor accumulation is expected to slow, accelerating productivity growth is the main path for many regional economies to achieve convergence with high-income economies. China faces the challenge of completing its transition to a slower but more sustainable and balanced growth path, while raising productivity. In some countries with high investment needs and low labor participation rates, higher and more efficient use of investment and higher labor participation rates could improve potential growth (see section I.C of this report).
Illustrative estimates of the possible gains in potential output growth from a combination of measures, including additional and more efficient investment, improvements in education and health services, and higher labor participation rates is shown in Figure BI.C.2.2. The baseline scenario in the figure is one of “business as usual” in that it assumes broadly constant policies, which means that all policy variables follow their long-term average trends.3 Education and health outcomes evolve along their historical linear trends.4 Investment growth looking forward is the average of long-term growth between 1998 and 2017, and long-term investment-to-GDP ratios.5
The baseline scenario is contrasted in Figure BI.C.2.2 with the policy scenario to show the impacts of various reforms on potential growth (“reform impact”). In this scenario, each policy variable is assumed to rise as much as its biggest 10-year improvement on record for each country, subject to ceilings. Specifically, (a) the investment growth rate in each country is assumed to rise by its largest increase in any 10-year period during 1998–2017; (b) educational outcome indicators—secondary and tertiary enrollment and completion rates—and life expectancy are assumed to rise in each country by as much as the maximum improvement over any 10-year period during 1998–2017;6 and (c) for each age group in each country, female labor force
3 The scenario assumes that all population-related variables (including age and gender structure of the population, fertility, and life expectancy) evolve as in the UN Population Projections under the assumption of median fertility and normal mortality.
4 Secondary and tertiary enrollment rates by gender are assumed to grow through the forecast horizon at their average growth during 1998–2017 but are capped at 100 percent. Economy-wide averages are calculated as the population-weighted (2000–16) average of these gender-specific rates. Secondary and tertiary education completion rates by gender and age group are assumed to grow at their average rate during 1998–2017.
5 Considering the policy-driven rebalancing away from investment in China, investment growth rates are assumed to be constant at their last five-year average (2013–17).
6 Caps: enrollment rates at 100 percent; completion rates at the maximum across advanced economies in 2016; life expectancy at the median advanced-economy life expectancy in 2016.
(Box I.C.2 continued)
(continued)
Figure BI.C.2.2. Potential output growth under illustrative reform scenarios8
7
6
5
42013–17
EMDEs
2018–27 Reformimpact
China EAP excluding China
2013–17 2013–172018–27 2018–27Reformimpact
Reformimpact
J Fill investment needs (via capital) J Fill investment needs (via productivity)
J Education and health improvements J Labor market reforms
Sources: World Bank staff estimates; World Development Indicators; International Monetary Fund, World Economic Outlook; Penn World Tables; United Nations World Population Prospects: 2017 Revision (medium-fertility scenario). Baseline assumptions and illustrative policy scenarios are described in the main text of the box.
48 PART I. RECENT DEVELOPMENTS AND OUTLOOK
EAST ASIA AND PACIFIC ECONOMIC UPDATE APRIL 2018

participation rates are assumed to rise by the largest increase over any 10-year period during 1998–2017, but not to exceed male labor force participation rates. In addition, implicit for this scenario is the premise that the additional investment will be used productively.
A comparison of the policy and baseline scenarios shows how a combination of additional and more efficientinvestment,bettereducationalandhealthoutcomes,andhigherlaborforceparticipationcould raise potential growth over the next decade in the region. Raising physical capital via elevated investment growth would not only boost potential growth via directly accelerating capital and increasing its contribution to growth, but would also increase potential growth via improved productivity (TFP). It is estimated that such an investment boost would raise potential regional growth by 0.4 percentage points a year on average, of which a quarter is via enhanced productivity. Measures to raise human capital could lift both labor supply and TFP growth. The scenarios suggest that improvements in education (in terms of secondary and tertiary enrollment and competition rates) and health outcomes (in terms of life expectancy)—via their effect on labor supply and TFP growth—could lift potential growth in the region by 0.2 percentage points, on average. Raising labor supply can be achieved through reforms aimed at increasing female labor force participation rates. As a result, potential growth could rise by 0.2 percentage points on average, during 2018–27.
(Box I.C.2 continued)
Ì Improvingpublicexpenditureefficiencyandinfrastructureprovision
Forfiscalpolicytopositivelycontributetogrowth,thequalityandefficiencyofpublicspendingwouldneedto be increased. In Indonesia, despite the considerable resources already devoted to decentralization of government spending, there is still ample room for improvement in terms of coordination, transparency, accountability, and service provision. More broadly, moving away from spending objectives and adopting performance-based incentives would lift outcomes (Ollivaud 2017). In the Philippines, a proposed Budget Reform Act, recently approved in the House of Representatives and already filed in the Senate, aims to modernize all stages in the budgeting process, from budget planning to execution and monitoring, with the objective of improving spending efficiency.
Improvingpublicinvestmentmanagementtoefficientlyrevampaccesstoinfrastructurecanhelpeffectivelyfoster capital accumulation and productivity. In Cambodia, Lao PDR, Timor-Leste, and Vietnam, strengthening the public financial management and public investment management frameworks is needed to reduce waste due to inefficiencies. Leakages in some developing economies have been estimated to be as high as 50 or 60 percent of the funds invested (Riera-Crichton, Vegh, and Vuletin 2014). Despite substantial investments to date, overall access to infrastructure in developing EAP remains fragmented, particularly in water and sanitation and transport, and in several lower-middle-income economies (Box I.C.3). This suggests a need to increase public investment efficiency, and to optimally use public-private partnerships and improved asset management. In addition to upgrading these functions at a country level, there is also a role, as recognized by the Master Plan on ASEAN Connectivity (MPAC) 2025, for prioritizing infrastructure projects at the regional level. Doing so would allow for the establishment of a rolling pipeline of priority infrastructure projects that strengthen connectivity across ASEAN economies.
I.C. POLICY CONSIDERATIONS 49
ENHANCING POTENTIAL

Box I.C.3. EAP Infrastructure Status Update – Access, Costs, and Private Participation1
Access to infrastructure in the EAP region is highly fragmented. While infrastructure services are developing in many parts of the EAP, there are marked differences in access to and quality of services between countries (particularly, low- and high-income Association of Southeast Asian Nations [ASEAN] countries and between ASEAN and the Pacific Islands Countries) and between rural and urban areas. Large-scale investments are still required, particularly in water and sanitation and transport, in several low- and middle-income countries.
Countries can generally be divided into three broad groups with respect to access: highly advanced and well-equipped countries, such as Singapore and the Republic of Korea; a semi-advanced group, which includes middle-income countries such as China, Malaysia, Thailand, and Fiji; and a group exhibiting lower access levels, with lower-income countries, such as Myanmar and most of the Pacific Islands, excluding Fiji and Samoa.
Singapore is by far the most developed economy in terms of access to infrastructure services, with 100 percent access to electricity, piped water, and sanitation. In ASEAN, Cambodia and Myanmar require the greatest improvement with respect to extending access to all services. Timor-Leste and the Pacific Island Countries—particularly Papua New Guinea and the Solomon Islands—also report low levels of access and quality. Despite their relatively strong economies, Malaysia requires road development in rural areas and extension of urban sewerage services, and Thailand and Fiji need improved water treatment and urban sanitation services.
Electricity is the most advanced infrastructure service in the region. Overall, data in 2014 reveal that EAP’s urban population has a high rate of electricity service coverage at 86 percent; the rural population has 65 percent coverage. Still, nearly 60 million people lack access. Most ASEAN countries have near-total coverage of electricity services in rural areas, with the exception of the Philippines, Lao PDR, Cambodia, and Myanmar. Among the Pacific Island Countries (except Fiji and Samoa, which have near-total coverage), access remains below 60 percent for most countries, and there is a marked urban-rural divide. For instance, in Vanuatu, urban access rates are as high as 100 percent, but only 11.5 percent in rural areas. Low electrification
1 Prepared by Darwin Marcelo and Aditi Raina. The results in this box are from the recently published report by the World Bank Infrastructure, PPPs and Guarantees (IPG) Group, “The Status of Infrastructure Services in East Asia and Pacific”. Further details on data sources and limitations can be found there.
(continued)
Figure BI.C.3.1. Electricity service coverage, ASEAN and benchmark countries
Sources: World Bank Infrastructure, PPPs & Guarantees (IPG) Group; Singapore (2017) rendering based on World Development Indicators data, 2014.
50 PART I. RECENT DEVELOPMENTS AND OUTLOOK
EAST ASIA AND PACIFIC ECONOMIC UPDATE APRIL 2018

is affected by the archipelagic geography and related challenges to establish efficient and high-quality power grids (Figure BI.C.3.1).
Datain2015showthat93.7percentoftheEAPpopulationhasaccesstoimproveddrinkingwater,but piped water supply is relatively low in the region. Only Malaysia and high-income countries such as Japan, New Zealand, Korea, and Singapore have extensive overall access to piped connections at the household level. Second-tier countries include Thailand (57 percent), the Philippines (43 percent), and China (73 percent), as well as Samoa (85 percent) and Fiji (68 percent). The third tier includes the low-income ASEAN countries and the other Pacific Islands, with household access levels between 20 and 30 percent. Myanmar and Papua New Guinea are at the low end of household piped access, with only 8 percent and 9 percent overall coverage, respectively (Figure BI.C.3.2).
Figure BI.C.3.2. Piped water supply coverage, ASEAN and benchmark countries
Figure BI.C.3.3. Household connection to sewerage, ASEAN and benchmark countries
Source: World Bank Infrastructure, PPPs & Guarantees (IPG) Group; Singapore (2017) rendering based on data from World Health Organization and UNICEF Joint Water Supply and Sanitation Monitoring Programme, “Progress on Sanitation and Drinking Water,” 2015.
Source: World Bank Infrastructure, PPPs & Guarantees (IPG) Group; Singapore (2017) rendering based on data from World Health Organization and UNICEF Joint Water Supply and Sanitation Monitoring Programme, “Progress on Sanitation and Drinking Water,” 2015.
The sanitation sector has the lowest coverage and service quality. Data in 2015 show that urban piped sewerage connection is generally low, as is the percentage of wastewater collected and treated. Access rates to urban piped sewerage in some countries are up to 10 times lower than rates of urban piped water connection. In fact, only high-income benchmark economies enjoy full access to urban piped sanitation systems (Figure BI.C.3.3). These countries are followed by Cambodia (44.81 percent) and Malaysia (42.4 percent), with fair levels of urban sewerage access, and Timor-Leste, with an 18.2 percent urban household connection rate. Coverage values elsewhere in the region (even in urban areas) are in the single digits. Wastewater treatment in Indonesia, Cambodia, Lao PDR, and Myanmar is practically nonexistent.
Revenues from tariffs, that is, the price charged to consumers for utility services, in general, are not sufficienttocoverthecostsofproduction.In several ASEAN countries, such as Indonesia, Vietnam, and the Philippines, average unitary revenues from electricity tariffs do not cover the marginal cost required to
(Box I.C.3 continued)
(continued)
I.C. POLICY CONSIDERATIONS 51
ENHANCING POTENTIAL

generate electricity, let alone to distribute and transmit electricity to users. In fact, only China, Malaysia, and Thailand are operating at general cost recovery levels for electricity production. In terms of water supply, on average, the utilities studied in all countries except for Fiji and China currently cover their operating costs by tariff revenues. This does not imply, however, that current water revenues are sufficient to cover the capital costs required to expand service or rehabilitate existing infrastructure. Among the countries with available information, only the Philippines, Korea, and Cambodia reported operating cost coverage ratios above 2, which would give water utilities room to make capital investments to expand and maintain their infrastructure.
Publicfinance remains the largest source of funding for infrastructure development. In the EAP region, private participation in infrastructure (PPI) investments have risen to pre-financial-crisis levels, but they still account for a very small proportion of the total investments in infrastructure. For instance, in 2015, PPI investments in China were less than 1 percent of total investment in transport, energy, and water. Further, in the EAP, PPI investments accounted for a meager 0.2 percent of GDP. Therefore, PPI investments will continue to be complemented heavily by public sector investments in infrastructure.
(Box I.C.3 continued)
Ì Pursuing regional integration initiatives can help preserve trade dynamism
With growing threats to the continued openness of the global trading system, it is advisable for countries in developing EAP to continue enhancing trade integration and improving trade facilitation. Countries in developing EAP need to avoid resorting to protectionism in response to increasing global policy uncertainty. Resorting to protectionism would raise consumer prices while raising producer costs, which would hinder export competitiveness. In addition, higher tariffs would be sustaining inefficient industries and delaying structural transformation. Developing EAP, as one of the regions participating more prominently in global trade, would need to keep removing barriers to trade and pursuing further integration. Thus, ensuring trade and investment policy coordination in the region and avoiding tariff escalation would be especially desirable at this juncture. Increased coordination would also help prevent a disorderly proliferation of bilateral agreements, which would otherwise reshape the trade and value chain landscape in the region, resulting in winners and losers, and increasing compliance and transaction costs (Roubini Global Economics 2017).
Deepening trade integration and improving trade facilitation will be even more important as countries in the region adapt their manufacturing-led development strategies to the emerging challenges of labor-saving technologies and automation, the blurring of the lines between manufacturing and services, and changing trade patterns. As noted in Part II.B, “connectedness,” defined as openness to trade in goods and services and good logistical capabilities, will be essential for countries to succeed in a world in which manufacturing is intensive in the use of services, trade flows are increasingly concentrated, and more services can be traded across borders. The priorities for reform include eliminating restrictive non-tariff measures, improving trade facilitation, and liberalizing trade in services.
52 PART I. RECENT DEVELOPMENTS AND OUTLOOK
EAST ASIA AND PACIFIC ECONOMIC UPDATE APRIL 2018

TheASEANEconomicCommunity(AEC)remainsthemainplatformtokeeppursuingregionalintegration.The AEC over the last decade has achieved substantive progress in terms of tariff elimination, service liberalization, and harmonization of capital market regulations, among other areas. Implementation of its latest Blueprint 2025 would be an opportunity for member economies to deepen integration around non-tariff measures, rules of origin, trade in services,4 competition and consumer protection, or intellectual property rights (ASEAN Secretariat 2015).
The approval of the Comprehensive and Progressive Agreement for Trans-Pacific Partnership (CPTPP)offers opportunities to strengthen trade links with emerging and advanced economies outside the region. The signing in March 2018 of the CPTPP by 11 countries on the Pacific coast signals the willingness to salvage the original agreement and keep pursuing integration, while leaving the door open in case the United States reconsiders joining the agreement. The CPTPP is a new-generation agreement that goes significantly beyond tariff reductions among member countries and includes investment provisions, commitments on intellectual property rights protection, and mutual recognition of procedures in sanitary and phytosanitary standards and technical barriers to trade. As a result of its implementation, both Malaysia and Vietnam, members of the CPTTP, are expected to experience an increase in their GDP of around 1 percent by 2030, and neighboring countries intensely trading with CPTTP members could also see smaller positive spillovers (Box I.C.4).
Ongoing efforts can serve as stepping stones toward the materialization of more recent initiatives such as the Regional Comprehensive Economic Partnership (RCEP) and the Belt and Road Initiative (BRI).For example, implementation of this latest AEC Blueprint could facilitate progress in RCEP negotiations, which have been facing challenges around tariff reduction and services liberalization. Since the RCEP combined market represents around a third of the global economy, developing EAP economies would be expected to obtain significant gains from the crystallization of this agreement. The RCEP would also help disentangle the “noodle bowl” of Free Trade Agreements proliferating in the region (Baldwin 2008). Finally, the BRI could be a suitable complement to these regional pacts. Its focus on improving infrastructure and enhancing connectivity across countries in the region could lead to significant gains, provided the investments are well chosen and complementary policies and institutions are upgraded to manage their economic, social and environmental risks. For instance, as BRI economies in the region integrate more deeply, their exposure to competition from China will also increase, and the resulting adjustment costs will need to be addressed (Box I.C.5).
4 Liberalization of certain services is currently under consideration in the Philippines and Lao PDR. Meanwhile, restrictiveness in services sectors remain high in Indonesia (for example, retailing, professional), and Thailand (professional) ASEAN Secretariat and World Bank 2015.
Box I.C.4. Comprehensive and Progressive Agreement on Trans-Pacific Partnership1
The return of the mega-regional trade agreement
TheUnitedStateswithdrawalfromtheTrans-PacificPartnership(TPP)agreementinJanuary2017derailed implementation of a mega-regional trade agreement. The agreement among 12 countries was considered a “new generation” of regional trade agreements covering countries with 40 percent of world
1 Prepared by Sjamsu Rahardja.
(continued)
I.C. POLICY CONSIDERATIONS 53
ENHANCING POTENTIAL

GDP and 26 percent of world trade. The TPP aimed to eliminate 95 to 100 percent of import tariff lines, lower non-tariff barriers, and increase predictability and transparency in trade-related policies.2 For the agreement to be enforced, the combined GDP of the agreeing countries must be at least 85 percent of the 12 countries’ total GDP, based on 2013 data.3 In practice, this meant that only the United States or Japan could single-handedly prevent the TPP from coming into force.
The announcement to conclude theComprehensive andProgressiveAgreement for Trans-PacificPartnership(CPTPP)signalsawillingnessamong11TPPcountriestosalvagetheoriginalagreement.In March 2018, trade ministers from 11 countries signed CPTPP, whose markets make up about 13.5 percent of world GDP and 14 percent of world trade. The announcement signals that lowering barriers in cross-border trade and investment among CPTPP members is still important for members. The average tariffs for intra-CPTPP member imports range from near zero percent for Singapore to 5.8 percent for Mexico. The import tariffs on agricultural products are still high, especially for Japan and Mexico, at 15.6 percent and 15.4 percent, respectively. CPTPP countries in East Asia also still face tariff discrimination in the CPTPP markets of North, Central, and South America. Given the differences in development levels across CPTPP in East Asia, the agreement also signals commitments from developing country members to use political capital to push for policy reforms.
What is left in the CPTPP
CPTPPmembersdecidedtodroparticlesconsideredtoosensitiveandthatcouldderailratificationof the agreement. The list of suspended provisions suggests two major issues that the 11 parties are not comfortable retaining from the original TPP agreement. First, parties agreed to exclude investments in natural resources from the Investment Chapter, and to restrict access to Investors State Dispute Settlement for settling disputes in government-funded projects. Second, the scope has been changed with respect to commitments regarding intellectual property rights protection. Specifically, it has been decided to drop provisions on data protection for biologics and small molecule drugs, and length of copyright protection, and to better align patentable subject matters with the World Trade Organization (WTO) Trade-Related Aspects of Intellectual Property Rights agreement. In this regard, CPTPP is not pushing for extending the patent of a pharmaceutical invention if there are delays by authorities in granting a patent or providing marketing approval. Nor will parties to the CPTPP pursue criminal procedures for those who seek commercial benefit from breaking content-protecting technology. Several other articles are also suspended, such as compliance with labor rights as one of conditions for participating in government procurement programs, and the scrutinizing of the procurement of pharmaceuticals and medical instruments in a national health care system.
2 See discussion in East Asia and Pacific Economic Update, April 2016, page 112 - 116.
3 Article 30.5.2 of the TPP text. https://ustr.gov/sites/default/files/TPP-Final-Text-Final-Provisions.pdf
(Box I.C.4 continued)
(continued)
54 PART I. RECENT DEVELOPMENTS AND OUTLOOK
EAST ASIA AND PACIFIC ECONOMIC UPDATE APRIL 2018

Nevertheless, the CPTPP agreement retains interlinked commitments that can facilitate companies, including small and medium-sized enterprises, to more seamlessly operate cross-border. Nineteen of 30 of the original TPP chapters were intact, and CPTPP retains the features of a new generation trade agreement. The CPTPP agreement seeks to resolve issues in non-tariff measures by promoting better regulatory practices and mutual recognition of procedures in sanitary/phytosanitary and technical barriers to trade. Trade facilitation in CPTPP commitments are compatible with provisions in the WTO Trade Facilitation Agreement that promote border agencies cooperation, certainty in procedures, and a risk-based system for inspection. These aspects are particularly important for securing market access for the East Asian members of the CPTPP and could potentially induce positive spillover effect to nonmembers. The agreement is expected to improve investment policies, increase protection for intellectual property rights, open government procurement to competition, and reduce protection of state-owned enterprises. All these entail reforms that could potentially induce productivity gains for developing economies, such as Malaysia and Vietnam.
Potential impact of CPTPP for the economies in East Asia
The preliminary results from a World Bank Computable General Equilibrium model suggest that under a conservative scenario, by 2030 income of CPTPP members in East Asia is projected to increase by 0.7 percent compared to the baseline economic scenario (Figure BI.C.4.1).4 The projected gains to income of East Asian members of the CPTPP is about 41 percent compared to the projected gains under the original TPP. Nevertheless, commitments for more open trade and investment among CPTPP members is expected to raise trade and, hence, increase GDP against the baseline scenario (see Figure BI.C.4.2). Malaysia and Vietnam are projected to gain the most because of greater access to CPTPP markets.
4 Adapted from Maliszewska, Olekseyuk, and Osorio-Rodarte 2018. Preliminary results. Instead of presenting projected real GDP, we present projected impact on income, which includes potential gains or losses from changes in terms of trade.
(Box I.C.4 continued)
(continued)
Figure BI.C.4.1. Aggregate projected gains to income by 2030
Figure BI.C.4.2. Projected gains to income by 2030 across East Asia
Percentage of baseline scenario Percentage of baseline scenario
2.0
1.5
1.0
0.5
0
-0.5
EAP members of CPTPP EAP nonmember EAP
9
6
3
0
-3BRN
CPTPPMYS JPN VNM CHN KHM IDN KOR LAO PHL THA
Nonmember
J TPP J CPTPP J TPP J CPTPP
Source: Adapted from Maliszewska, Olekseyuk, and Osorio-Rodarte (2018). Source: Adapted from Maliszewska, Olekseyuk, and Osorio-Rodarte (2018).
I.C. POLICY CONSIDERATIONS 55
ENHANCING POTENTIAL

For Vietnam, markets in Australia, Canada, Mexico, and Japan account for 12.5 percent of Vietnam’s merchandise export. With CPTPP, a firm with a production base in Malaysia or Vietnam can seamlessly source intermediate inputs from Japan or Canada, source business services from Australia or Singapore, and have products marketed in all over the world. Thus, CPTPP is expected to increase demand for products and services from members, and raise relative prices (terms of trade) of export products and, hence, increase income.
Gains from the CPTPP can potentially be higher due to improvements in productivity. The projected results above do not yet consider the impact of the CPTPP on greater competition, better trade facilitation, and improved certainty in policies, all of which can be delivered only through policy reforms, restructuring of institutions (for example, customs, government procurement), and more options for products and services. Taking these factors into account, projected gains from the CPTPP to income would be 2.2 percent for Malaysia and 4.4 percent for Vietnam, instead of 1.9 percent and 2.8 percent, respectively.
The CPTPP can potentially also serve as a building block for greater regional economic integration across Asia and the Pacific. Most parties to the CPTPP are already members of the Asia-Pacific Economic Cooperation (APEC), the goal of which is to pursue greater economic integration through “open regionalism.”5 In this regard, the CPTPP brings in countries that are not part of existing bilateral or regional trade agreements, such as Australia with Canada, Mexico, and Peru; or Vietnam with Canada, Chile, Mexico, and Peru. Setting up a mega-regional agreement like the CPTPP can avoid the “spaghetti bowl” effect in dealing with different rules of bilateral or smaller regional agreements.
How the conclusion of the CPTPP might induce progress in the ongoing negotiation of the Regional Comprehensive Economic Partnership (RCEP) remains to be seen. Sixteen countries involving six members of the CPTPP together with China, India, Korea, and the rest of the ASEAN members are negotiating the RCEP, which is expected to be completed in 2018. The RCEP negotiation has been facing difficulties in reconciling divergent interests in tariff reduction and services liberalization between India and other negotiating parties.6 Nevertheless, the RCEP can potentially add further gains to economies in East Asia, mostly because of the sheer size of the combined markets, which comprise around 39 percent of world GDP. To minimize diversion in trade and investment, certain chapters of the CPTPP, such as investment policies, services trade, and trade facilitation, can be useful references for the RCEP as well as for unilateral reform efforts in other developing economies in East Asia.
5 APEC aspires to be a “building block” for multilateralism in the global trade system. Through APEC, the agenda of regional economic integration is synchronized with multilateral effort to reduce trade and investment barriers. For a discussion, see, for example, Bergsten (1997).
6 http://www.business-standard.com/article/economy-policy/asean-leaders-at-republic-day-2018-india-s-stakes-high-as-rcep-hangs-fire-118010800518_1.html.
(Box I.C.4 continued)
56 PART I. RECENT DEVELOPMENTS AND OUTLOOK
EAST ASIA AND PACIFIC ECONOMIC UPDATE APRIL 2018

Box I.C.5. Exposure of Developing EAP Economies Through the Belt & Road Initiative to China Trade Shocks1
TheBeltandRoadInitiative(BRI)seekstodeepenChina’sregionalintegrationthroughinfrastructureinvestment and regional cooperation, thereby strengthening trade and investment links among the countries involved. With several infrastructure projects already ongoing, the initiative is expected to progressively reduce trade costs over the coming decades, and thus generate long-run economic gains for B&R economies.2 But deeper integration can also impose adjustment costs within these economies, especially in the short run. These costs may arise because of increased competition from Chinese products, which could challenge local industries. However, improved access to China’s vast market could benefit the export sector in economies that would be part of BRI.
ThisboxdocumentsthedegreeofexposureofeachEastAsiaandPacificeconomytocompetitionand demand shocks associated with deeper integration with China through BRI.3 To capture exposure to Chinese competition, the analysis draws on the export similarity index of Finger and Kreinin (1979), using trade data at the six-digit level for each country pair. This index takes values between zero and one, and the higher its value the closest is the product distribution of exports in the two countries. Exposure to demand shocks associated with China’s imports is measured in an analogous way, capturing the fact that some of these economies currently export more of what China imports than others.4
Exposure to competition shocks from China is higher in Vietnam, Malaysia, the Philippines, Thailand, and Indonesia. These economies source a relatively large share of imports from China and have an export structure similar to China’s (Figure BI.C.5.1). To the extent that differences in export structure reflect underlying differences in production structures across countries, these economies are likely to be more exposed to import competition from China in their own markets in several industries.5 Further integration with China would likely involve stronger competitive pressures in final goods markets, which may also have important implications for factor market adjustment (notably labor markets). There are nevertheless various important sources of mutual gains from further integration: consumers would gain access to a wider range of product varieties, and firms and countries would obtain efficiency gains due to further specialization in different varieties or stages of production, leading to lower prices.
Several other economies that would be part of BRI are only weakly exposed to competition shocks associated with further integration with China. Among EAP countries, Myanmar, Mongolia, and Timor-
1 Prepared by Paulo Bastos.
2 Gains from deeper integration can have a static or dynamic nature. Static gains are driven by increased specialization according to comparative advantage, a greater concentration of resources in the most efficient firms within each sector, and an expansion in the range of product varieties available to consumers. Dynamic gains may arise from a trade-induced diffusion of ideas and improved access to intermediate inputs, fostering process and product innovations within firms.
3 The material in this box is drawn substantially from Bastos (2017).
4 By focusing on both supply and demand shocks, the analysis also accounts for Chinese demand of intermediate inputs that are used in the production of Chinese exports.
5 Economies with relatively higher export similarity to China are also more likely to be exposed to Chinese competition in third export markets.
(continued)
I.C. POLICY CONSIDERATIONS 57
ENHANCING POTENTIAL

Leste source a sizable share of imports from China but have an export structure that differs considerably from China’s. To the extent that differences in export structure reflect differences in production structures, these economies are only weakly exposed to Chinese import competition in their own markets, even though they source a large share of imports from China. Mutual gains from further integration with China are likely to derive mainly from further specialization according to comparative advantage.
Exposure to positive demand shocks from China is highest in Mongolia. The Chinese market accounts for a large share of exports of these economies, and their export structure displays a relatively high degree of similarity with China’s overall import demand (Figure BI.C.5.2). China is also an important destination market for Lao PDR and Myanmar, although the export structure of these economies differs significantly from the structure of China’s overall import demand. Finally, Malaysia, the Philippines, and Singapore export a sizable share of exports to China and have an export structure that is relatively close to the structure of Chinese multilateral imports, suggesting that these economies are also strongly exposed to China’s demand shocks.
Economies more exposed to competition shocks from China as a result of BRI should consider if their policies for inclusion are appropriate to deal with the resulting adjustment costs. These costs are associated with reallocations of workers across sectors, regions and occupations triggered by sector-specific competition and demand trade shocks. Countries more exposed to competition shocks from China are likely to have more displaced workers and therefore face stronger costs of adjustment. Policies to deal with these trade shocks include social protection and trade adjustment assistance measures (including education and training). Well-designed credit, housing and place-based polices may also facilitate adjustment. Trade-specific adjustment programs can also play a complementary role.
(Box I.C.5 continued)
Figure BI.C.5.1. Exposure to import competition from China, 2015
Figure BI.C.5.2. Exposure to competition from China in third export markets, 2015
Share of imports sourced from China Share of exports to China
0.5
0.4
0.3
0.2
0.1
0
0 0.1 0.2 0.3 0.4 0.5
MMR
MNG
TLS VNM
IDNKHMTHA
PHLLAOMYS
0.8
0.6
0.4
0.2
0.1
0
0 0.1 0.2 0.3 0.4
MMR
MNG
TLS
VNM IDN
KHM
THA
PHL
LAO
MYS
0.7
0.5
0.3
Similarity between country’s exports and China’s exports Similarity between country’s exports and China’s imports
Sources: CEPII BACI dataset; World Bank staff calculations. Sources: CEPII BACI dataset; World Bank staff calculations.
58 PART I. RECENT DEVELOPMENTS AND OUTLOOK
EAST ASIA AND PACIFIC ECONOMIC UPDATE APRIL 2018

Ì Improving competitiveness and the environment for entrepreneurship and innovation to boost productivity
Intheshorttomediumterm,reformsinspecificaspectsofthebusinessenvironmentcanhelpdevelopingEAP economies improve their competitiveness. Among the most common and pressing areas for reform in developing EAP are starting a business (Cambodia, the Philippines, Myanmar, Lao PDR), dealing with construction permits (Cambodia, China), getting credit (Myanmar), and enforcing contracts (Myanmar, Cambodia, the Philippines, Indonesia). During 2017, Thailand implemented significant reforms in several of the above-mentioned areas, which may have helped underpin improved investor confidence. Addressing existing bottlenecks would be especially important for those countries ranking low on the Doing Business Index, since this potentially bears on investor perceptions. In that regard, in Lao PDR the prime minister in February issued an order to establish a “Lao PDR Doing Business Regulatory Reform and Coordination Mechanism” to advance this agenda. Similarly, in Fiji, the government has established a taskforce to implement reforms on some of these areas, and has also introduced an amendment to the Investment Law comprising best practices from the laws of other leading pro-arbitration jurisdictions.
Improving competitiveness will also be an important building block for countries to adjust to the ongoing changes in the manufacturing landscape. With the advent of greater automation and the increased tradability of services, labor costs alone are a much less important determinant of where factories choose to locate (Part II.B). The various aspects of a country’s business environment, including the quality of physical infrastructure, tax policies, legal systems, and labor market regulations, will become more significant determinants of location decisions, and the ability of countries either to retain their positions in existing manufacturing activities or move up into new ones. A continued focus on identifying and addressing weaknesses in the business environment will therefore be essential if countries in the region are not to fall behind.
Lower-middle-incomeeconomiesintheregioncouldbenefitfromintroducingreformstolandandcapitalmarkets. In Vietnam and Cambodia, the banking sector presents inefficiencies, with an outdated regulatory-prudential framework and interest rate caps. Capital markets—both debt and equity—in Cambodia, Lao PDR, Myanmar, and Vietnam remain relatively shallow and do not play a major role in financial intermediation. These countries would need to prioritize the enactment of capital market development strategies; these would also comprise measures to support the development of secondary markets. In addition, these economies often present restrictions on land use and/or insecure land rights. In many cases, addressing these issues would require revising the land laws, improving land registration and records, and accompanying them with the corresponding geospatial information. Related to some of the market distortions mentioned above, Vietnamese and Cambodian authorities are currently preparing new competition laws.
Finally, initiatives aimed at fostering entrepreneurship, technology adoption, and innovation could help boost productivity. As their populations age and returns to capital decrease, many economies in developing EAP would need to move from factor-accumulation-driven to productivity-driven growth. As an example, Malaysia has already placed productivity gains at the core of its 11th Development Plan, embedding it in the objectives and accountability mechanisms of both the public and private sectors (EPU 2017), and other countries in developing East Asia could follow. There are at least three sets of reforms that could help achieve this shift toward productivity-driven growth: (a) measures aimed at fostering entrepreneurship by removing barriers to the formalization and growth of traditional SMEs and nurturing startups, as well as revamping managerial capabilities through education
I.C. POLICY CONSIDERATIONS 59
ENHANCING POTENTIAL

and training programs (Cirera and Maloney 2017); (b) facilitating technological adoption and strengthening readiness across individuals, firms, and governments; and (c) strengthening innovation, which requires both devoting more resources and upgrading complementary factors such as the intellectual property rights system, capital markets, and competition policies (Box I.C.6. Innovation).
Box I.C.6. Are East Asian Countries More Innovative?1
Developing East Asia and Pacific (EAP) countries havemore efficient innovation functions thantheir global peers. EAP countries tend to invest as much or less in innovation inputs than other developing countries, yet they outperform their global peers in innovation outputs. Nevertheless, EAP countries are far from achieving the level of performance seen in OECD countries, in terms of both investment in innovation inputs and in translating them into effective outputs.2 While innovation policies need to be country specific, in general, EAP countries would benefit from investing more in innovation-generating activities and strengthening the complementary factors such as reducing the cost of doing business, and improving their trade regimes, competitiveness frameworks, intellectual property rights protection, and human capital.
Benchmarking innovation inputs and outputs
The frameworkdeveloped inCireraandMaloney (2017) forms thebasisofouranalysis.Lack of credible data forces us to focus on a narrow set of five indicators of inputs: research and development (R&D) expenditure as a percentage of GDP, the number of researchers involved in R&D per thousand people, payments for intellectual property (IP) per capita, the percentage of the population that uses the internet (as a proxy for digital infrastructure), and management quality as reported by the World Management Survey. On the output side, we consider patent and trademark applications per million people and high-technology exports per capita.3
ThespendingbyEAPcountriesoninnovationinputsdoesnotdiffersignificantlyfromtherestofthe developing world. As shown in Table BI.C.6.1, all innovation inputs and outputs are strongly and positively correlated with a country’s per capita income. On inputs, EAP countries are not different from the rest of developing countries with respect to R&D expenditure, researchers involved in R&D, internet use, or management quality. The only variable where East Asian countries invest more is IP payments, which is likely because of the large presence of foreign companies in these countries. But even here there is only weak statistical significance. The index of innovation inputs—a normalized average of how each country ranks on the five input indicators—is positive but statistically insignificant.4
1 Prepared by Bradley Larson and Deepak Mishra.
2 OECD 2013.
3 All data are available from the World Bank’s World Development Indicators except management quality, which comes from the World Management Survey. Values for IP payments, high-technology exports, trademark applications, and patent applications were highly skewed and therefore logged for regression analysis.
4 Output and input indexes were calculated as the average of country rankings on each of the respective components, normalized to 0–1 scale, if a country was not missing an observation for more than one of those components.
(continued)
60 PART I. RECENT DEVELOPMENTS AND OUTLOOK
EAST ASIA AND PACIFIC ECONOMIC UPDATE APRIL 2018

Incontrast,EAPcountriessignificantlyoutperformtheirpeerswithrespecttoinnovationoutputs.For example, as shown in Table BI.C.6.1, EAP countries have 333 percent more patent applications than the rest of the developing world, all else being equal.5 Similarly, EAP country high-tech exports are 680 percent higher than a typical developing country. The index of innovation outputs—a normalized average of how each country ranks on the three output indicators—for EAP countries is positive and highly significant for EAP countries.
Table BI.C.6.1. Developing countries in East Asia outperform other developing countries in innovation outputs, despite not investing significantly more in inputsRegression results, by dependent variable
Type Dependent variable GNI per capita EAP dummy R2 N
Inputs R&D expenditures (% of GDP) 0.047 *** 0.226 0.25 58Researchers in R&D (per thousand people) 0.083 *** 0.299 0.25 50Log payments for IP (per capita) 0.495 *** 1.106 ** 0.50 104Internet users (per capita) 4.393 *** -2.534 0.58 130Management quality index 0.128 *** 0.407 0.65 17Normalized average rank of inputs 0.040 *** 0.026 0.61 111
Outputs Log high-technology exports (per capita) 0.513 *** 2.050 *** 0.35 108Log trademark applications (per million people) 0.230 *** -0.016 0.42 91Log patent applications (per million people) 0.357 *** 1.466 *** 0.52 84Normalized average rank of outputs 0.048 *** 0.123 *** 0.64 91
Sources: World Bank 2018; World Management Survey 2015.Note: The dependent variable (Column 2) is regressed on a constant term, gross national income (GNI) per capita (US$ thousands, Atlas method), and a dummy for the EAP region. ** denotes a 95 percent level of significance, and *** denotes a 99 percent level of significance.
DoEAPcountrieshavemoreefficientinnovationfunctions?
EAP countries exhibit relatively greater innovation efficiency than the rest of thedeveloping world. As shown in Figure BI.C.6.1, investment on both innovation inputs and outputs rises with per capita income. So, on average, more inputs yield more outputs. Countries above the 45-degree line are relatively more efficient at converting inputs to outputs. However, on average, EAP countries lag OECD countries in terms of level of innovation inputs and outputs,6 though not so much on the efficiency of the innovation function.
5 100*(exp(1.466)-1) = 333 percent.
6 OECD 2013.
(Box I.C.6 continued)
(continued)
Figure BI.C.6.1. EAP countries have efficient innovation systemsNormalized average rankings of input and output indicators, by country
MMRKHM
IDN
PHL
MNG
WSM VNM
THA
MYSCHN
45-degree line
Ave
rage o
utp
uts
rank
Average inputs rank
Q EAP Q OECD Q Other countries
Sources: World Bank 2018; World Management Survey 2015.
I.C. POLICY CONSIDERATIONS 61
ENHANCING POTENTIAL

The higher efficiency at the regional level, however,masks considerable variation. For example, per capita R&D expenditure in China is significantly higher, and growing faster, than any country at its stage of development. At the same time, Vietnam spends relatively little on R&D. Interestingly, both China and Vietnam significantly outperform their global peers with respect to patent applications and high-tech exports. Clearly the underlying production function for innovation differs considerably across EAP countries, and hence the key elements of their innovation policies are likely to be different, as well.
The big advantage that East Asian countries enjoy relative to their global peers is in having strong “innovation complementarities.” As Cirera and Maloney (2017) note, the efficiency of the innovation function depends on a broad set of complementarities, such as the business environment, trade and investment policies, competition policies, efficiency of the capital markets, level of protection of intellectual property rights, and the quality of physical and human capital. Many East Asian countries invested heavily in building these complementarities, which underpinned their early development success. But with rising income, the appetite for deeper structural reforms seems to have waned in many of these countries. If East Asian countries are to continue to lead the world in growth and job creation, they need to pursue a two-pronged strategy of investing more in innovation inputs while accelerating structural reforms to strengthen the complementary factors that influence innovation.
(Box I.C.6 continued)
Ì Building human capital
Increasing the contribution of human capital to economic growth in much of developing EAP will require enhancing the effectiveness of its schools. Except for China and Vietnam, most students in developing EAP are in basic education systems that perform well below the international average. There are five main domains in which reforms could be pursued to raise learning outcomes and the quality of human capital (Part II.A), and there are innovative ways to encourage learning. For example, in Indonesia, authorities are preparing an intervention to reframe the beliefs of middle-school students by showing them that intelligence is malleable, improving their readiness to learn, mindset, and aspirations (Box I.C.1).
As manufacturing technologies continue to evolve with a greater emphasis on automation, more emphasis will be needed on upgrading capabilities by ensuring that workers and managers have the necessary skills. Countries will need to emphasize basic numeracy and literacy as well as familiarity with digital technology (Part II.B). Access to, and quality of, tertiary education will also need to be emphasized so that firms can find the workers they need as they upgrade their production processes. To ensure that improved production technologies diffuse across firms, it will also be necessary to implement measures that help firms improve their basic managerial and organizational practices so that they can use and adapt new processes (Cirera and Maloney 2017).
62 PART I. RECENT DEVELOPMENTS AND OUTLOOK
EAST ASIA AND PACIFIC ECONOMIC UPDATE APRIL 2018

Enhancing economic security
To enhance economic security, social assistance and insurance programs need to be strengthened. An important aim for policy is not only to reduce poverty more rapidly but also to help households manage risks that might push them back into poverty . Social protection systems have historically played a limited role in EAP’s development model (World Bank 2018a). Going forward, cash transfer programs (conditional or not) can play a key role in reaching the poorest, provided they are better targeted. In addition, the coverage of social insurance schemes, including pensions, will need to be expanded to tackle the challenges associated with aging populations and high informality. As the distinction between contributory and non-contributory programs blurs, there are also opportunities to move toward universal coverage in some countries, while ensuring fiscal sustainability (ibid). In general, countries with high shares of poor and vulnerable populations need to prioritize instituting or strengthening social assistance programs while countries with higher proportions of the economically secure and middle class can focus on expanding the coverage of social insurance.
Resilience to large aggregate shocks can be increased by instituting country-level mechanisms to manage risks ex ante or cope with their impacts ex post. Sometimes natural disasters or other systemic shocks are unavoidable, which requires complementing household-level risk management measures with country-level measures Ex ante strategies include fostering financial inclusion to help people build up savings, introducing crop insurance schemes, and setting up early warning systems. Ex post, adaptive social safety nets can distribute transfers after shocks materialize (ibid).
AnagendaforthePacificIslandCountries
InthePacificIslandCountries(PICs),maintainingfiscalsustainabilitywhileensuringeffectivespendingremains a challenge. Despite the improving fiscal positions of most PICS, both revenue and expenditure remain subject to large and frequent shocks. To ensure fiscal sustainability, reforms need to shore up revenues, reduce low-quality spending while improving the effectiveness of spending in the social sectors, and build up buffers against shocks. Particularly in those countries that depend on U.S.-provided sector grants that will be phased out in 2023, it will be important to pursue accumulation in sovereign wealth funds (Palau, the Federated States of Micronesia, and the Marshall Islands).
Accessing temporarymigration schemes can help small Pacific Island Countries strengthen economicresilience. The Pacific islands are different from larger EAP countries; being small and remote, they have limited job growth and are exposed to frequent natural disasters and economic shocks. Taking advantage of temporary migration schemes can help mitigate some of these vulnerabilities. An example is the Australian Seasonal Worker Programme (SWP), which since 2012 has employed over 17,000 Pacific Islanders and generated some $A144 million in income gains (Box I.C.7). These gains have benefited sending countries, communities, and households through remittances and knowledge transfer, but also the workers themselves, who are able to become more productive and acquire new skills.
I.C. POLICY CONSIDERATIONS 63
ENHANCING POTENTIAL

Box I.C.7. Strengthening Economic Resilience through Temporary Migration – Lessons from Australia’s Seasonal Worker Programme1
Giventhegeographicisolation,highlevelofexposuretoshocks,andlimitedjobgrowthinPacificIslandCountries(PICs),labormigrationhaslongbeenconsideredameansofstrengtheningeconomicresilience. The Australian Seasonal Worker Programme (SWP), which was formally introduced in 2012, represents a critical temporary migration pathway for the region. It began with a 12,000-worker cap for the initial stage of implementation, but the cap was removed in 2015. Since then, the program has expanded rapidly—with 6,166 workers arriving in FY2017 (i.e., from July 1, 2016 to June 30, 2017) (Figure BI.C.7.1). The SWP is one of only a handful of temporary migration schemes globally that maintains an explicit development objective for labor-sending countries, and indeed the program plays a crucial role in fostering economic resilience in the Pacific and Timor-Leste.
Building the resilience of individual workers and their households
Some participating workers in the SWP are employed prior to departure, but the majority (65 percent) are not, and for these workersthe scheme represents an opportunity to fulfiltheir productive potential. The income gains vary by country, but in all cases represent a significant increase in their earnings potential back home. The Pacific-wide factor increase in income is 4.3 but is as high as 5.6 in Tonga. The vast majority (86 percent) of Pacific seasonal workers are remitting money home while in Australia (Figure BI.C.7.2). Over a six-month employment stint, the average Pacific seasonal worker is remitting approximately A$2,200 while in Australia and transferring A$6,650 in savings home at the end of their stay.
1 Prepared by Jesse Doyle and Anuja Utz of the World Bank. This section draws on World Bank 2018c; World Bank 2018d.
(continued)
Figure BI.C.7.1. Annual Arrivals under the Seasonal Worker Programme, FY2013–FY2017
7,000
6,000
5,000
4,000
3,000
2,000
1,000
0
FY13 FY14 FY15 FY16 FY17
Uncapping of the programme
J VUT J TUV J TON J TLS J SLB J WSM J PNG J NRU J KIR J FJI
Source: Australian Department of Immigration and Border Protection 2017.
Figure BI.C.7.2. The vast majority of workers remit money while in AustraliaPercentage of workers who remitted money home while in Australia
100
90
80
70
60
50
40
30
20
10
0Samoa(N=55)
Tonga(N=174)
Timor-Leste(N=43)
Vanuatu(N=72)
Other PICs(N=36)
Pacific average=86
Source: World Bank staff calculations.
64 PART I. RECENT DEVELOPMENTS AND OUTLOOK
EAST ASIA AND PACIFIC ECONOMIC UPDATE APRIL 2018

Atthehouseholdlevel,theprogramhasasignificantimpactonsavingsandexpenditure.In Tonga, SWP households had 169 percent more savings per capita than nonparticipating households. The additional savings generated can help create a buffer against different types of shocks. The impacts on per capita expenditure, as expected, are positive and statistically significant (37 percent more than other households in the case of Tonga). This extends to both cash expenditure and the value of own-produced food that was being consumed. The cash expenditure derived from the program is primarily being channeled into home improvements and the accumulation of durable assets. Participating households in Tonga and Vanuatu were 14 to 16 percent more likely to have made improvements to their dwellings, many of which are aimed at disaster-proofing their homes.
Strengthening resilience at the country level
Attheaggregatelevel,theSWPhasemployed17,320PacificIslanderssince2012anddeliveredapproximately A$144 million in net income gains to the region. The aggregate development impacts to date are the most significant for Tonga, Vanuatu, Samoa, and Timor-Leste, four countries that have a relatively high level of exposure to different types of shocks. The A$99.4 million in net income that Tonga has gained through the program since its inception is more than double the annual bilateral aid budget from the Australian government (Australian Department of Foreign Affairs and Trade 2017). The A$26.2 million earned in FY2017 also represents more than double the A$12.4 million generated through Tonga’s exports. For Vanuatu, the A$31.5 million generated amounts to approximately 45 percent of Australia’s annual bilateral aid budget (ibid). The A$5.8 million in income gains for Samoa and A$5.5 million for Timor-Leste are equally remarkable, given they were later entrants to the program. The large inflows of foreign currency generated from the program have a clear role in creating resilience to shocks, whether from natural disasters or economic downturns.
Social impacts of seasonal migration
Overall,seasonalworkinAustraliahasnotonlybenefitedindividualhouseholdsthroughremittances,but also brought about positive social impacts for the participating and nonparticipating households andcommunitiesinthePacific.Beyond the short-term material benefits, participants across Tonga and Vanuatu have highlighted the “new skill sets” or “social remittances” they have gained as part of their exposure to the scheme. Female seasonal workers highlighted positive changes emanating from gaining new skills and knowledge, including increased levels of financial literacy, English language proficiency, and leadership and entrepreneurial skills. Because of this, women in Tonga and Vanuatu have generally improved their ability to control and manage household finances when they return. They have become better managers, and there is better coordination between spouses on the way money is spent. Even when they are
(continued)
(Box I.C.7 continued)
I.C. POLICY CONSIDERATIONS 65
ENHANCING POTENTIAL

not participating in the SWP, women are gaining more control in the management of household finances as recipients of remittances.
Through seasonal work opportunities, women in both Tonga and Vanuatu are now able to negotiate their traditional gender roles, although this has failed to bring about long-term changes within households. In Tonga, when female workers were away, it was more common for the husband to get help and support from other female members of the household or extended family members than in Vanuatu. It is now acceptable for men to help in domestic chores, including taking care of children and other family members when women participate in, and manage earnings from, the SWP. Even though women and men’s traditional roles in Tonga are narrowing with the increasing participation of women and men in seasonal work, traditional gendered power relations remain intact.
There are some negative social impacts due to the absence of family members for extended periods. Of the 17,320 workers who have participated in the SWP since its inception, only 13.7 percent have been women. The significant gap between the male and female participation rates in the SWP has meant that more men than women are away from their families for extended periods of time. The absence of men from their immediate families often leads to issues of neglect and failure on the part of men/husbands to provide regular financial support for the families back home. Lack of communication has also eroded trust and commitment between couples and led to negative impacts on families and intimate relationships, especially in Tonga.
(Box I.C.7 continued)
66 PART I. RECENT DEVELOPMENTS AND OUTLOOK
EAST ASIA AND PACIFIC ECONOMIC UPDATE APRIL 2018

Bibliography
Abbas, Ali S. M., and Alexander Klemm. 2013. “A Partial Race to the Bottom: Corporate Tax Developments in Emerging and Developing Economies.” IMF Working Paper WP/12/28, International Monetary Fund, Washington, DC.
ADB (Asian Development Bank). 2014. Viet Nam: Financial Sector Assessment, Strategy and Roadmap. Manila: Asian Development Bank.
———. 2016. Asian Development Outlook 2016: Asia’s Potential Growth. Manila: Asian Development Bank.
ASEAN Secretariat and World Bank. 2015. ASEAN services integration report. A joint report by the ASEAN Secretariat and the World Bank (English). Washington, DC: World Bank Group.
ASEAN Secretariat. 2015. ASEAN Economic Community Blueprint 2025. Jakarta: ASEAN Secretariat; November.
Australian Department of Foreign Affairs and Trade. 2017. “2017–18 Total Australia ODA to the Pacific.” Canberra: Department of Foreign Affairs and Trade.
Australian Department of Immigration and Border Protection. 2017. “Seasonal Worker Programme annual visas granted data.” Canberra: Australian Department of Immigration and Border Protection.
Bai, C., and Q. Zhang. 2017. A Research on China’s Economic Growth Potential. China Perspectives book series. Abingdon, U.K.: Taylor and Francis Group.
Baldwin, R. 2008. “Managing the Noodle Bowl: The Fragility Of East Asian Regionalism.” The Singapore Economic Review 53 (03): 449–478. World Scientific Publishing Co.
Bastos, Paulo. 2017. “China’s Trade Dynamics and Implications for Belt & Road Economics.” mimeo, World Bank, Washington, DC.
Bergsten, Fred C. 1997. “Open Regionalism.” Working Paper 97-3, Peterson Institute for International Economics, Washington, DC. https://piie.com/publications/working-papers/open-regionalism.
BMI Research. 2018. “Political Risk Analysis – Sino-Indian Rivalry Intensifying Over Maritime Silk Road.” BMI Research, London, February 14.
Brauning, F., and V. Ivashina. 2016. “Monetary policy and global banking.” Working Papers 17-5, Federal Reserve Bank of Boston, Boston.
China International Electronic Commerce Center Research Institute. 2016. “Cross-Border E-Commerce Development and the Challenges of International Rules.” In Chinese. Beijing: China International Electronic Commerce Center Research Institute.
Cirera, X., and W. Maloney. 2017. The Innovation Paradox: Developing-Country Capabilities and the Unrealized Promise of Technological Catch-Up. Washington, DC: World Bank. doi:10.1596/978-1-4648-1160-9.
Claessens, Stijn, and Leora F. Klapper. 2003. “Bankruptcy Around the World: Explanations of its Relative Use.” American Law and Economic Review 7 (Spring): 253–283.
Claessens, S., and N. van Horen. 2013. “Impact of foreign banks.” Journal of Financial Perspectives 1: 29–42.
———. 2014. “Foreign banks: trends and impact.” Journal of Money, Credit and Banking 46: 295–326.
De Haas, R., and I. van Lelyveld. 2004. “Foreign Bank Penetration and Private Sector Credit in Central and Eastern Europe.” Journal of Emerging Market Finance 3 (2): 125–51.
Detragiache, E., P. Gupta, and T. Tressel. 2008. “Foreign banks in poor countries: theory and evidence.” Journal of Finance 63: 2123–2160.
BIBLIOGRAPHY 67
ENHANCING POTENTIAL

EPU (Economic Planning Unit). 2017. Malaysia Productivity Blueprint. Economic Planning Unit, Prime Minister’s Department, Putrajaya.
Eyraud L., D. Sing, and B. Sutton. 2017. “Benefits of Global and Regional Financial Integration in Latin America.” IMF Working Paper WP/17/1, International Monetary Fund, Washington, DC.
Finger, Joseph, and Mordechai Elihau Kreinin. 1979. “A measure of export similarity and its possible uses.” Economic Journal 89 (356): 905–912.
Goldman Sachs. 2018. “The Rise of China’s New Consumer Class.” http://www.goldmansachs.com/our- th ink ing/macroeconomic- ins ights /growth-of -ch ina /ch inese-consumer / index .html?cid=PS_01_50_07_00_01_15_01&mkwid=uui8CuV3.
Hallward-Driemeier, M., and G. Nayyar. 2017. Trouble in the Making?: The Future of Manufacturing-Led Development. Washington, DC: World Bank.
IMF (International Monetary Fund). 2017a. Seeking Sustainable Growth: Short-Term Recovery, Long-Term Challenges. Washington DC: International Monetary Fund, October.
_______. 2017b. Financial system stability assessment for the People’s Republic of China. Monetary and Capital Markets Department, International Monetary Fund. Washington DC: International Monetary Fund, December 6.
_______. 2017c. “Preparing for Choppy Seas.” Regional Economic Outlook: Asia and Pacific, May 2017. Washington, DC: International Monetary Fund.
______. 2018. “Indonesia: 2017 Article IV Consultation.” International Monetary Fund, Washington, DC.
Lau, C. C. 2015. “Macroprudential surveillance and policy framework – Malaysia’s experience.” Presentation at CEMLA V Meeting on Financial Stability, Center for Latin American Monetary Studies, Buenos Aires, July 23–24.
Lehner, M., and M. Schnitzer. 2008. “Entry of Foreign Banks and Their Impact on Host Countries.” Journal of Comparative Economics 36 (3): 430–52.
Maliszewska, Maryla, Zoryana Olekseyuk, and Israel Osorio-Rodarte. 2018. “Economic and Distributional Impacts of Comprehensive and Progressive Agreement for Trans-Pacific Partnership.” World Bank, Washington, DC.
Maliszewski, W., and L. Zhang. 2015. “China’s Growth: Can Goldilocks Outgrow.” IMF Working Paper 15/113, International Monetary Fund, Washington, DC.
Ministry of Commerce of the People’s Republic of China. 2016. “E-Commerce in China.” In Chinese. http://images.mofcom.gov.cn/dzsws/201706/20170621110205702.pdf.
OECD (Organisation for Economic Co-operation and Development). 2013. Innovation in Southeast Asia. OECD Reviews of Innovation Policy. Paris: Organisation for Economic Co-operation and Development.
Oliver Wyman. 2017. “Asia Banking Agenda 2017.” http://www.oliverwyman.com/our-expertise/insights/2017/apr/asia-banking-agenda-2017.html.
Ollivaud, P. 2017. “Improving the allocation and efficiency of public spending in Indonesia.” OECD Economics Department Working Papers, No. 1381, OECD Publishing, Paris.
Park, Donghyun, and Shu Tian. 2017. “The Fed Interest Rate Hike: How Hard Will It Hit Asia?,” Forbes, December 19.
Peek, J., and E. Rosengren. 2000. “Collateral damage: effects of the Japanese bank crisis on the United States.” American Economic Review 90: 30–45.
Pongsaparn, P., W. Wongwachara, and R. Nudam. 2017. “Macroprudential policy: its role, effectiveness and interaction with monetary policy.” Bank of Thailand, Bangkok.
68 PART I. RECENT DEVELOPMENTS AND OUTLOOK
EAST ASIA AND PACIFIC ECONOMIC UPDATE APRIL 2018

Puy, D. 2016. “Mutual fund flows and the geography of contagion.” Journal of International Money and Finance 60: 73–93.
Raddatz, C., and S. L. Schmukler 2012. “On the international transmission of shocks: microevidence from mutual fund portfolios.” Journal of International Economics 88: 357–374.
Rajan, R. G. 2017. “Central Banks’ Year of Reckoning.” Project Syndicate, December 21.
Riera-Crichton, D., C. A. Vegh, and G. Vuletin. 2014. “Procyclical and Countercyclical Fiscal Multipliers: Evidence from OECD Countries.” NBER Working Papers 20533, National Bureau of Economic Research, Inc., Cambridge, MA.
Roubini Global Economics. 2017. “2018 Themes: Normalization needs a steady hand.” Roubini Global Economics, London, November 17.
UNCTAD (United Nations Conference on Trade and Development). 2018. “Tax Reform in the US: Implications for International Investment.” Investment Trend Monitor, Special Edition (29) (February). United Nations Conference on Trade and Development, Geneva.
Woetzel, J., J. Seong, K. W. Wang, J. Manyika, M. Chui, and W. Wong. 2017. “China’s Digital Economy: A Leading Global Force.” McKinsey Global Institute, Discussion Paper, August. McKinsey Global Institute.
World Bank. 2013. World Bank East Asia and Pacific Economic Update, October 2013: Rebuilding Policy Buffers, Reinvigorating Growth. Washington, DC: World Bank.
———. 2015a. World Bank East Asia and Pacific Economic Update, October 2015: Staying the Course. Washington, DC: World Bank.
———. 2015b. Philippine Economic Update, January 2015: Making Growth Work for the Poor. Washington, DC: World Bank.
———. 2016. Live Long and Prosper: Aging in East Asia and Pacific. World Bank East Asia and Pacific Regional Report. Washington, DC: World Bank.
———. 2017a. China Economic Update, December 2017: Growth Resilience and Reform Momentum. Washington, DC: World Bank.
———. 2017b. Malaysia Economic Monitor, December 2017: Turmoil to Transformation, 20 Years after the Asian Financial Crisis. Washington, DC: World Bank.
———. 2017c. December 2017 Indonesia Economic Quarterly: Decentralization that Delivers. Washington, DC: World Bank.
———. 2017d. Myanmar Economic Monitor, October 2017: Capitalizing on Investment Opportunities. Washington, DC: World Bank.
———. 2017e. World Bank East Asia and Pacific Economic Update, October 2017: Balancing Act. Washington, DC: World Bank.
———. 2017f. Lao PDR Economic Monitor: Lowering Risks and Reviving Growth (English). Washington, DC: World Bank.
———. 2017g. Taking stock: an update on Vietnam’s recent economic developments – special focus: improving efficiency and equity of public spending. Washington, DC: World Bank.
———. 2017h. East Asia and Pacific Cities: Expanding Opportunities for the Urban Poor. Urban Development. Washington, DC: World Bank.
———. 2017i. Cambodia economic update: Cambodia climbing up the manufacturing value chains – October 2017. Washington, DC: World Bank.
BIBLIOGRAPHY 69
ENHANCING POTENTIAL

———. 2017j. Philippines Economic Update, October 2017: Preserving Consistency and Policy Commitment. Washington, DC: World Bank.
______. 2017k. Pacific Possible: Long-term Economic Opportunities and Challenges for Pacific Island Countries. Washington, DC: World Bank.
______. 2017l. East Asia and Pacific Economic Update: Sustaining Resilience. Washington, DC: World Bank.
———. 2017m. Global Financial Development Report 2017/2018: Bankers without Borders. Washington, DC: World Bank.
______. 2017n. Thailand Economic Monitor– August 2017: Digital Transformation. Washington, DC: World Bank.
———. 2018a. Riding the Wave: An East Asian Miracle for the 21st Century. World Bank East Asia and Pacific Regional Report. World Bank Group, Washington, DC.
———. 2018b. Global Economic Prospects, January 2018: Broad-Based Upturn, but for How Long?. Washington, DC: World Bank.
World Bank. 2018c. Maximizing the Development Impacts from Temporary Migration: Recommendations for Australia’s Seasonal Worker Programme. Washington, DC: World Bank.
World Bank. 2018d. The Social Impacts of Seasonal Migration: Lessons from Australia’s Seasonal Worker Programme for Pacific Islanders. Washington, DC: World Bank.
World Management Survey. 2015. http://worldmanagementsurvey.org/.
70 PART I. RECENT DEVELOPMENTS AND OUTLOOK
EAST ASIA AND PACIFIC ECONOMIC UPDATE APRIL 2018

Part II. Medium-Term Development Agenda
71
WORLD BANK EAST ASIA AND PACIFIC ECONOMIC UPDATE APRIL 2018

II.A. Growing Smarter: Learning and Equitable Development in East Asia and Pacific1
One-quarter of the world’s school-age children live in East Asia and Pacific. During the last 50 years, some economies in the region have successfully transformed themselves by investing in the continuous upgrading of knowledge, skills, and abilities of their workforce. Through policy foresight, they have produced graduates with new levels of knowledge and skills almost as fast as industries have increased their demand for skilled workers. Yet the success of these high-performing systems has not been replicated throughout the region. Tens of millions of students are in school but not learning, and as many as 60 percent of students remain in school systems that are struggling to escape from the global learning crisis or in systems where performance is likely poor. Many students in these systems fail to reach basic levels of proficiency in key subjects and are greatly disadvantaged because of it.
A new World Bank report "Growing Smarter: Learning and Equitable Development in East Asia and Pacific" focuses on the experiences of economies in the region that have been able to expand schooling and learning, and showcases those that have managed to pursue successful education reforms at scale. By examining these experiences, the report provides both diagnoses and detailed recommendations for improvement not only for education systems within East Asia and Pacific but also for countries across the globe. In East Asia and Pacific, the impressive record of success in education in some low- and middle-income countries is proof of concept that schooling in resource-constrained contexts can lead to learning for all. The report identifies five policy domains through which successful EAP economies have pursued and achieved the impressive learning outcomes that drive their economic growth today.
Overthelast60years,agroupofcountriesandeconomiesinEastAsiaandPacific(EAP)havesuccessfullytransformed their economies by investing in the continuous upgrading of the knowledge, skills, and abilities of their workforce. East Asia’s consistent high performance on internationally comparable tests is well known; seven of the top 10 education systems in the world are in East Asia. Yet success has not been as widely replicated as it could be. Tens of millions of students in EAP are in school but not learning. Roughly 60 percent of the region’s students are in school systems with a learning crisis, or where performance is poor or not measured. A new World Bank (2018) report, Growing Smarter: Learning and Equitable Development in East Asia and Pacific2, examines the experiences of economies in the region that have pursued successful reforms, at scale, and with equitable outcomes, and distills lessons for any country that wants to raise performance. The report identifies five policy domains through which successful EAP economies have pursued and achieved the impressive learning outcomes that drive their economic growth today.
The state of education in EAP
The29countriesandeconomiesinEAParehometo26percentoftheworld’sschool-agedchildren.Most are enrolled in school—EAP has only 13 percent of the world’s out-of-school population. Nine percent of the region’s
1 Prepared by Michael Crawford and Elaine Ding.
2 The report was prepared by a team led by Michael Crawford, Amer Hasan, and Raja Bentaouet Kattan. The team comprised Sachiko Kataoka, Andrew Ragatz, Andrew Coflan, Elaine Ding, Courtney Melissa Merchant, Elisabeth Sedmik, and Anny Wong.
72 PART II. MEDIUM-TERM DEVELOPMENT AGENDA
EAST ASIA AND PACIFIC ECONOMIC UPDATE APRIL 2018

children are out of school, this number comprising mostly children at secondary-level. The region’s education system is extremely heterogenous. The largest education system in the region (China’s massive 182-million-student system) is larger than the population of all but seven of the world’s countries. National systems in four other countries (Indonesia, Japan, the Philippines, and Indonesia) each enroll more than 10 million students. In contrast, 10 economies have systems with fewer than 100,000 students. The 3,000-student enrollment in Tuvalu’s system is smaller than that of a single large high school in New York City. In total, the region is home to 331 million school-age children, representing about one-quarter of the world’s school-age population. Throughout the region, girls and boys attend school in roughly equal numbers and do not have systematically different learning outcomes. While almost all students finish elementary school, a smaller share finish lower and upper secondary school.
The EAP region is home to some of the world’s best-performing education systems. Countries like Japan, the Republic of Korea, and Singapore have long dominated the top ranks of international tests of learning outcomes. More recently, large middle-income countries like Vietnam and China are demonstrating remarkable results from their education systems in building human capital to fuel continued growth. Throughout the region, demand for skilled workers is rising as fast or faster than supply, and the returns to schooling remain robust.
The quantity of schooling has expanded dramatically while measures of quality are also rising. The growth of education in EAP in the last two generations has been phenomenal. The average adult in EAP now has about eight years of schooling, the same as the world average, up from only 1.3 years in 1950 (Figure II.A.1). While many systems’ quality suffers as they expand, several EAP countries have simultaneously broadened access to education while raising measured levels of quality to or above Organisation for Economic Co-operation and Development (OECD) averages.
However, what is true on average hides some serious challenges at the country level. Despite the well-known successes, most students in EAP study in education systems with either disappointing results or no measures of outcomes. Forty percent of EAP students are in education systems that perform at or above the OECD average, while 60 percent are in systems with learning outcomes that are either below proficiency or unknown.
Figure II.A.1. Years of schooling in East Asia increased sixfold to equal the global average
Table II.A.1. EAP education systems by performance category
Average years of schooling (population age 25+) System EconomiesTop-Performing Japan; Republic of Korea; Singapore;
Taiwan, China; Hong Kong SAR, China; Macao SAR, China; Shanghai, China
Above-average performing
B-S-J-G (China), Vietnam
Below-average performing
Indonesia, Malaysia, the Philippines, Thailand
Emerging Cambodia, Fiji, Kiribati, Lao PDR, the Marshall Islands, the Federated States of Micronesia, Mongolia, Myanmar, Palau, Papua New Guinea, Samoa, the Solomon Islands, Timor-Leste, Tonga, Tuvalu, Vanuatu
8
7
6
5
4
3
2
1
0
1950 1955 1960 1965 1970 1975 1980 1985 1990 2000 2005 20101995
2.9
1.3
3.2
1.8
3.4
2.2
3.7
2.8
4.1
3.3
4.5
3.9
5.0
4.6
5.5
5.1
5.9
5.6
6.5
6.3
7.1
7.0
7.6
7.5
8.0
7.9
▬ World ▬ EAP
Source: Data from Barro and Lee 2013.Note: Results are weighted by population. Timor-Leste and Pacific Island countries are missing.
Note: Shanghai was the sole representative of China in the PISA 2009 and PISA 2012. B-S-J-G (China) refers to the cities and municipalities of Beijing, Shanghai, Jiangsu, and Guangdong, which participated in the PISA 2015.
II.A. GROWING SMARTER: LEARNING AND EQUITABLE DEVELOPMENT IN EAST ASIA AND PACIFIC 73
ENHANCING POTENTIAL

EAP’s education systems can be grouped into four performance levels (Table II.A.1). Aggregated scores on key internationally comparable tests of student achievement (Programme for International Student Assessment [PISA] and Trends in International Mathematics and Science Study [TIMSS]) provide a strong—albeit imperfect—measure of systems performance. This methodology consolidates scores from different tests in different years with varying participation—and therefore varying robustness—by country. It also does not show score trends. Nonetheless, these overall scores provide the best available proxy measure of the respective performances of these education systems.
EAP’s high-income countries have built large modern education systems, and their students learn more than students anywhere. Most of these countries participate in international standardized tests such as PISA and TIMSS, and they generally score at least a half standard deviation (50 points) above the OECD average score—the equivalent of over a year and a half of schooling (Figure II.A.2). When post-2000 test scores are aggregated and averaged, seven out of 10 top scorers have been EAP high-income countries. These can be referred to as Top- Performing Systems. Less than two generations ago, however, most of these countries had income levels and faced policy challenges similar to those faced by low- and middle-income countries today. Lessons regarding how they raised performance to current high levels are pertinent to all countries.
Figure II.A.2. Forty percent of the region’s students are in education systems that perform above the OECD average
350 400 450 500 550 600 650406 512 556
106 points; 3.5 years of schooling
PHL
IDN
MYS THA
VNM B-S-J-G (China)Macao SAR, China
JPN
Taiwan, China
Hong Kong SAR, China
KORSGP
Shanghai, China
Composite constructed average of PISA and TIMSS performance over all available iterations
Q Below-Average Performing Systems Q Above-Average Performing Systems Q Top-Performing Systems
▬ Average score, Below-Average Performing Systems ▬ Average score, Above-Average Performing Systems ▬ Average score, Top-Performing Systems � Non-EAP countries
Sources: Calculations based on PISA and TIMSS scores on nine assessments since 2000 (for PISA) and 2003 (for TIMSS).Notes: B-S-J-G (China)=Beijing, Shanghai, Jiangsu, and Guangdong (China); PISA=Programme for International Student Assessment; TIMSS=Trends in International Mathematics and Science Study. Figure shows composite constructed average performance score with mean of 500 points and standard deviation of 100 points. The Philippines has only participated in TIMSS.
Two large middle-income countries, Vietnam and China, together account for about 70 percent of students in the region. Both these Above-Average Performing Systems have PISA scores above the OECD average, despite having income levels that would predict much lower learning outcomes. They also have a smaller spread of scores across socioeconomic status and large shares of top-scoring students. They provide proof-of-concept that education systems in developing countries can outperform those of wealthier countries when the right policies and practices are in place.
Another set of countries has not been able to achieve the levels of learning they seek for their students. These Below-Average Performing Systems include Malaysia, the Philippines, Indonesia, and Thailand. Their aggregate average scores on the TIMSS and PISA fall more than half a standard deviation below the OECD average.
74 PART II. MEDIUM-TERM DEVELOPMENT AGENDA
EAST ASIA AND PACIFIC ECONOMIC UPDATE APRIL 2018

Some individual countries have performances that are below expectations given their development levels, but they have nonetheless commendably continued to benchmark in international tests as they seek ways to improve performance. (The Philippines data is from 2003, the last time the country participated in an international learning assessment. The Philippines is participating in the 2018 Programme for International Student Assessment.)
Afinalgroupdoesnotyetparticipateininternationalcomparableexamsand/orcollectslittlereliablecomparative data and are therefore referred to as Emerging Systems. Many of EAP’s smaller countries fit into this category. Some have designed strong national learning measurement systems, while others use Early Grade Reading Assessments to measure reading abilities. Some are preparing to participate in international tests for the first time.
High and equitable average performance is a feature of some developing EAP economies. Globally, measured learning outcomes tend to be highest in high-income countries and correlate with GDP per capita. However, both Vietnam and China (provinces of Beijing, Shanghai, Jiangsu, and Guangdong) provide important exceptions to this trend. Students in these systems not only score above the OECD average, they also have a high share of top-scoring students and, simultaneously, excellent scores among economically disadvantaged students. As Figure II.A.3 shows, students from the second income quintile score above 500 on PISA in math and science—better than the average OECD student regardless of income. Students from the very poorest households also score very highly. These systems provide clear evidence that national education systems can be both equitable and deliver high quality when the right policies and practices are implemented.
Figure II.A.3. Vietnamese and Chinese students from the bottom 40 percent of household income outscored the average OECD student in PISA science and math in 2015 Panel A. Reading Panel B. Math Panel C. SciencePISA score PISA score PISA score
1(bottom)
474
503
2
519
3
534
4 5(top)
558
600
500
550
400
450
350
442
476
494
512
555
445471
486
507
534
373
389399
414
451
514
533
548
576
600
500
550
400
450
350
470
503
520
535
575
436
460
475
497
525
366381
390
410
450
485
1(bottom)
2 3 4 5(top)
516
533
549 574
600
500
550
400
450
350
476
506
522
539
581
444
470
486
508
537
384
398406
419
454
488
1(bottom)
2 3 4 5(top)
Wealth quintile Wealth quintile Wealth quintile
▬ OECD ▬ Top-Performing Systems ▬ Above-Average Performing Systems ▬ Below-Average Performing Systems
▬ Performance of bottom 40 percent of students in Vietnam and B-S-J-G (China)
Source: OECD 2016–17.Note: The economies included in Top-Performing Systems, Above-Average Performing Systems, and Below-Average Performing Systems are listed in Table II.A.1. OECD=Organisation for Economic Co-operation and Development; PISA=Programme for International Student Assessment.
II.A. GROWING SMARTER: LEARNING AND EQUITABLE DEVELOPMENT IN EAST ASIA AND PACIFIC 75
ENHANCING POTENTIAL

Policies for improving education systems
Lessons for improving education systems are focused on five policy domains. The region’s education systems are diverse in size, organization, goals, and legal and institutional framework. Analysis of the successful systems shows, however, that they overlap in key policies and practices in five areas (Figure II.A.4) and tend to perform well in five key domains. They generally:
• Align institutions to ensure the basic conditions for learning.
• Concentrate public spending on basic education first.
• Are simultaneously demanding and supportive of teachers as professionals. • Ensure that children are ready to learn in school. • Assess students to inform instruction.
Nocountryintheregioniswithoutsomesuccessinsomeaspectsofpoliciesinthesefiveareas,andnosingle country excels on all 15 practices. The Annex to this section lists the five domains and 15 associated practices. Overall, successful countries have developed and implemented these policies and practices more coherently and consistently and have sustained implementation for longer periods of time. As a result, their systems have steadily increased aggregate student achievement. By contrast, many countries with disappointing results in education have experimented with these policies and practices but have not yet been able to translate them into improved student learning outcomes. The examples and recommendations below stand to succeed when adopted broadly and when implementation efforts are strong and continuous.
Domain 1: Aligning institutions and creating sound administrative systems to ensure basic conditions for learning. The first step toward building effective school systems is to succeed on the basics—from building schools and providing basic infrastructure and textbooks to creating and implementing basic policies for teachers and personnel. Institutional alignment—the coherence of objectives and responsibilities—is critical in helping to create and sustain the sound administrative systems that implement policies and reforms. Countries with aligned institutions are better able to implement, synchronize, evaluate, and revise core sets of policies and practices that foster continuous improvement of the system.
Institutionalalignmentfocusesfirstonensuringthatthebasicconditionsforlearningareinplace.Students who lack desks or textbooks or who have teachers whose training is unrelated to the demands of delivering the curriculum cannot reasonably be expected to engage in meaningful classroom interactions that produce learning. Ensuring safe, adequate physical space for students, selecting and training teachers, and developing curriculums with a framework for learning requires robust administrative systems so that policies are translated into reality for teachers and students in classrooms.
Figure II.A.4. A framework for effective schools and education systems
INSTITUTIONS
Asses
s stud
ents to
diag
nose
issue
s an
d
info
rm ins
truc
tion
Ensure children are
ready to learn
in school
Concentrate effective,
equity-minded public
spending on basic
education
Select and
sup
port
teac
hers thr
ough
out
their ca
reer
s to
allow
the
m
to foc
us o
n th
eir clas
sroo
m
ASSESS
MENT
PUBLICSP
EN
DIN
G
LEARNING
76 PART II. MEDIUM-TERM DEVELOPMENT AGENDA
EAST ASIA AND PACIFIC ECONOMIC UPDATE APRIL 2018

AlackofbasicschoolfacilitiesremainsachallengethroughoutEastAsiaandPacific,exceptamongitstopperformers. Reasons for poor school conditions may include insufficient public spending on school infrastructure, limited access to water and electricity in rural areas, and difficult and costly construction conditions. Many schools in Indonesia and the Philippines do not meet basic standards for sanitation facilities, desks, chairs, or sufficient space per student (World Bank 2009, 2016a). In the Lao People’s Democratic Republic, only 32 percent of schools have handwashing facilities and only 29 percent have working electricity (light) in classrooms (Demas, Khan, and Arcia, forthcoming). Rural schools in Thailand that serve the most disadvantaged students fall dramatically short of having the adequate facilities and conditions that urban schools have (World Bank 2015).
Aligning political support around education’s link to jobs and social mobility is critical. Political pressure for quality education will often oblige governments to create and maintain such systems. High-performing economies in East Asia had great success in creating industries that offered rising amounts of formal employment that transformed economies. The most successful economies set basic policy directions decades ago. Industrial policy brought firms like Sony, Samsung, and LG into existence by providing incentives while ensuring that they competed in the global marketplace. This competitive pressure drove technology acquisition—and with it a need for ever better knowledge and human capital. Policies in successful East Asian economies caused demand for human capital to outstrip supply, driving long-term real increases in wages and incomes. In Vietnam, for example, a 94 percent increase in the share of workers with tertiary education from 1992 to 2006 was met with a 273 percent increase in wage premiums for the same workers (Di Gropello and Sakellariou 2010).
Secure employment in the modern industrial sector served as both a ladder for social mobility and a cushion against the lack of government-provided social safety nets. Initial successes wherein those with more schooling got better jobs started a virtuous circle that reinforced the demand for schooling, the value parents placed on achievement for their children, and in turn pressure on governments to provide effective education.
Establishing sound administrative systems enables countries to implement more complex policies more effectively. Institutional and administrative capacity allows for effective management and oversight beyond physical inputs. It leads countries to succeed with policies that influence the amount and quality of instruction. For instance, experience in the region indicates that the ability to define a single national curriculum was critical to the success of the Top-Performing Systems. These unified curriculums generally focused on a clear and unambiguous set of learning goals. They were part of the trend of simplifying the educational endeavor, especially when capacity was low, to allow emerging education systems to focus on a narrower set of goals. Other countries in the region have struggled to ensure alignment of new curriculums with textbooks and instructional materials.
Governmentswithstronginstitutionalandadministrativecapacityalsoexercisedfirmcontroloverthetraining and development of teachers. In many cases, they were able to define standards of qualifications for teachers and, more importantly, create mechanisms through which compliance with these standards was assured.
Domain 2: Concentrating equitable public spending on basic education. Spending education resources wisely has been a key achievement of high-performing systems and an expression of institutional and administrative competence. Across the region, countries that spent educational resources effectively concentrated on three key tasks: prioritizing basic education, managing essential inputs, and spending to promote equity. They
II.A. GROWING SMARTER: LEARNING AND EQUITABLE DEVELOPMENT IN EAST ASIA AND PACIFIC 77
ENHANCING POTENTIAL

also recognized that the quality of spending, rather than the quantity, has the greatest impact on learning. They therefore avoided setting artificial or arbitrary targets for allocating a certain share of GDP or public expenditure to education.
Solid initial public investment among high-performing economies ensured strong foundations for education systems later. Singapore spent almost a third of its national budget on education in 1952. Although this share declined steadily as Singapore’s income rose, absolute levels of spending on basic education continued to rise. Indeed, both Korea and Singapore doubled real spending per student on basic education, and absolute spending per student rose in Japan between 2000 and 2013. In Japan and Korea—where tertiary education is largely privately financed—public spending per student on tertiary education has never exceeded spending for basic education.
Bycontrast,someEAPeconomiesdonotconcentratepubliceducationspendingonbasiceducation—evenwhile learning levels remain unsatisfactorily low. In Indonesia and Malaysia, per student spending for primary and secondary education is much lower than spending for tertiary education. Lao PDR allocates more public money to tertiary education than to primary, despite the latter having vastly more students enrolled. However, this characterization does not apply to the middle-income countries with above-average performance. Vietnam still prioritizes public investment in primary and secondary education and China also prioritizes investment in primary, vocational, and preschool education (OECD 2016a).
Top-Performing Systems spend to promote equity. In the East Asia and Pacific region’s Top-Performing Systems, the central government plays a key role in equalizing education funding across the country. In Japan, the central government subsidizes prefectures (equivalent to states or provinces) to equalize public resources. For nine-year compulsory education, prefectures fund two-thirds of the cost of teachers’ salaries, and the central government subsidizes the remaining third, to help equalize the quality of teachers across municipalities and schools. Disadvantaged schools have the same share of qualified teachers as advantaged schools and more teachers per student. At the upper-secondary level, students from low-income families are exempt from tuition fees for public schools; they receive financial support to pay tuition fees for private schools, and scholarships to cover financial obligations other than tuition costs, such as school trips and textbooks. In Singapore, the government provides merit-based scholarships and other financial assistance for all students, as well as tuition subsidies for students from low- and middle-income families to attend independent schools (National Center on Education and the Economy n.d.).
Of the Above-Average Performing Systems, Vietnam allocates more spending per capita to geographically disadvantaged provinces and districts and pays teachers serving in disadvantaged areas higher salaries than teachers in cities, through various types of allowances. In China, reducing inequalities in education is a government priority. The government has gradually integrated the compulsory education funding guarantee in rural areas. By 2010, 97 percent of the total educational investment in rural compulsory education came from the government budget (OECD 2016a).
Domain 3: Select and support teachers throughout their careers, to allow them to focus on the classroom. At the heart of high-performing education systems is coherence in the recruitment, development,
78 PART II. MEDIUM-TERM DEVELOPMENT AGENDA
EAST ASIA AND PACIFIC ECONOMIC UPDATE APRIL 2018

and support of teachers. Policies and practices start from the premise that teaching is a difficult but learnable skill. Recruitment and selection of talented individuals are considered the beginning of a process in which new teachers learn their craft. Observation, collaboration, and feedback are integral parts of career-long professional development centered on acquiring and refining pedagogical and content knowledge to continuously improve the quality of instruction. Career advancement depends on, among other things, evaluation of teaching performance. Clear career paths allow teachers to be promoted and increase their salaries while remaining in the classroom. Curriculums and textbooks align in ways that enhance a teacher’s ability to deliver high-quality instruction.
Good teaching results from integrated policies for recruitment, professional development, and retention. Improving teacher quality requires concerted actions to recruit, develop, and retain effective teachers. In Shanghai, teachers work in teaching-research groups at the school, district, provincial or municipal, and national levels to constantly improve. At the school level, teaching-research groups are professional development networks consisting of same-subject teachers. The central government provides incentives to increase the pool of teaching candidates and encourage teacher retention; and teacher pay is appealing, varying by performance and years of service.
Selectivityinrecruitmentisthefirststeptocreatinganeffectivecorpsofteachers.As education systems in the region expanded, many more teachers were needed. At first, recruitment had to be broad and less selective. But at the first opportunity, effective systems raised selectivity, making salaries and working conditions attractive, so that talented individuals would apply. Today in Japan, newly hired teachers represent only 5 percent of the applicant pool. In Singapore, the government recruits the top third of graduates of universities and polytechnic schools to become teachers (Tan and Wong 2007). In Korea, teacher education programs admit only the top 10 percent of high school graduates, and only one in 20 passes the arduous exams to become a teacher (Ferreras, Kessel, and Kim 2015).
Career paths and salary policies encourage experienced teachers to stay in the classroom. Efforts to develop experienced, effective teachers pay dividends if those teachers remain classroom teachers. In some less successful countries, promotion, advancement, and higher pay are likely to come through moving to administrative positions and leaving the classroom. By contrast, in Shanghai, teachers have opportunities to advance professionally through a five-level ranking system while remaining classroom teachers. Under this system, schools regularly evaluate teachers for promotion to a higher rank, accompanied by a salary increase, based on their years of service and teaching performance. In both Japan and Korea, teachers with more than 15 years of experience (and whose performance has been routinely assessed) enjoy salaries that are, respectively, 125 and 140 percent of per capita GDP—far higher than the OECD average of 107 percent. The high reward for experience is a likely reason for the extremely low annual teacher attrition rates in high-performing economies in East Asia and Pacific—less than 3 percent on average, compared to 6 percent in most Western European countries and 8 percent in the United States (Wong 2017). These policies help ensure maximum benefit from the investment in teachers’ career-long professional development.
Effective systems systematically observe teachers and provide feedback on their performance. On average, in OECD countries, 40 percent of teachers never teach alongside another teacher, observe another teacher, or receive feedback. Top-Performing Systems—and increasingly Above-Average Performing Systems—treat the classroom as a public space and make teacher observation and feedback routine quality-promotion activities. Special attention to observation is part of teachers’ induction into the profession—the time when it is most
II.A. GROWING SMARTER: LEARNING AND EQUITABLE DEVELOPMENT IN EAST ASIA AND PACIFIC 79
ENHANCING POTENTIAL

critical to refine, improve, or correct teaching practices. Shanghai schools have lesson observation rooms where lessons can be videotaped and demonstrations conducted with an audience. Japan’s induction period is designed around observation, with many demonstration lessons conducted in front of panels for evaluation and feedback. Observation is the first step in professional development built around collaboration with peers.
Collaboration serves as an in-service professional development tool. Collaboration and teamwork are required of teachers from induction onward. In Shanghai, teachers are not promoted unless they can prove that they work collaboratively; mentors are not promoted unless they can show that their mentees improve. Teachers are given ample time for these collaborative activities. They teach only 10 to 12 hours a week, less than half the U.S. average of 27 hours (Liang, Kidwai, and Zhang 2016).
A streamlined curriculum allows for uncluttered, focused textbooks. Chinese textbooks, for example, tend to be thin, narrowly focused on specific topics, and significantly more demanding than textbooks in the United Kingdom (Qin 2017). Textbooks cover 78 topics in the United States, 38 in Korea, and 17 in Japan (Liang, Kidwai, and Zhang 2016). Having fewer topics suggests a narrower focus and deeper study of topics, which could lead to much deeper understanding. Normal practice is for students to cover all textbook content, making study more efficient and allowing students to master topics. The mastery approach is believed to have been important in propelling students in Hong Kong SAR, China; Shanghai; and Singapore to the top of the PISA rankings (Qin 2017).
Low pay and delayed or irregular payments to teachers make teaching less attractive and discourage talented applicants. In Cambodia, it has been reported that low pay has led of lack of motivation among teachers and to pressure to pay teachers for private tutoring. In Lao PDR, preliminary results of a World Bank survey found that 53 percent of teachers report delays in receiving their salary at least once a year (Demas, Khan, and Arcia, forthcoming).
Uncoordinated policy actions may be costly and fall short on results. Indonesia’s rollout—and eventual rollback—of their 2013 curriculum presents a cautionary tale of misalignment. With pressure to implement the new curriculum before a change of government, the government announced and developed the new curriculum hurriedly. Curricula was developed without consulting key stakeholders, textbooks failed to make it to the hands of teachers on time, and teachers did not receive adequate training. This eventually led to large-scale curricula rollback in 2015.
In Top-Performing Systems, teachers spend a larger proportion of total working hours preparing for class. In Japan, for example, teachers spend, on average, only 18 hours a week teaching, although they have the highest total working hours (53 hours a week). Nearly two-thirds of their working time is spent on lesson preparation and other quality-enhancing activities to make in-class time much more effective.
Domain 4: Ensuring that children are ready to learn. Intellectual, social, and emotional development early in life all affect how well children perform academically in primary school and get along with their peers and teachers. Governments in high-performing school systems help support children’s “readiness to learn.”
80 PART II. MEDIUM-TERM DEVELOPMENT AGENDA
EAST ASIA AND PACIFIC ECONOMIC UPDATE APRIL 2018

Gaps in readiness to learn manifest early and can linger if unaddressed. Gaps in children’s readiness to learn manifest themselves early. If unaddressed, they can affect children’s cognitive and noncognitive skills over the long term.
There are large cross-country differences in young children’s ability to read, as measured by the Early GradeReadingAssessments(EGRA).In every country in the Emerging System group, the majority of students do not meet national standards—and many cannot read any words at all (Figure II.A.5). Even in countries where “zero-word” rates are relatively low, reading fluency is not very high and a large portion of students are still struggling with basic subtasks.
EGRA data cover different languages, making comparability a challenge, and they do not cover all students in some countries. But the overall message is still clear. In many systems throughout the region, most children arrive at school not ready to learn. By second grade, too many of these children are still unable to read a single word.
Gaps in readiness to learn in the early grades predict performance at age 15. If students are not ready to “read to learn” going into the early grades of primary school, there is little chance they will attain a high level of functional literacy by the time they complete primary school. When examined alongside EGRA data, PISA results suggest that the countries with low early reading ability also have high functional illiteracy (conceptualized as the inability to comprehend the main message in grade-appropriate texts in late primary school). If students do not learn to read fluently in the early grades, there is little hope they will develop the skills to succeed on tests like PISA or, more important, in a professional workplace.
Investments in readiness to learn appear to generate lasting returns. High-performing systems in the region appear to have focused on children’s physical and cognitive development, assessed and improved the quality of the services they offer, and coordinated across actors to deliver needed services. Their efforts to universalize preschool progressively appear to have borne fruit. In Korea, the Nuri Curriculum was introduced in 2012 to integrate curriculum standards for nursery centers and kindergartens for an emphasis on holistic child development. It lays out comprehensive lesson content and learning objectives. Korea also assesses service and staff quality, providing funding and training to monitor results (OECD 2016c). In Singapore, three waves of reforms—in 2000, 2008, and 2012—sought to improve the quality of teachers, centers, and programs, and improve accessibility and affordability. By 2009, 97 percent of children were reported to be in preschool. Throughout the region, children who had access to early childhood education and development services posted higher PISA test scores than children who did not—even after controlling for socioeconomic differences (OECD 2012, 2016d).
Figure II.A.5. Many students in EAP cannot read a single word in second grade
Indonesia
0 10 20 30 40 50 60
Tonga
Myanmar - Yangon
Cambodia
Vanuatu
Timor-Leste
PhilippinesCebuano language
Percent of 2nd graders who cannot read a single word
Source: Graham and Kelly 2017.Note: All data are from the nationally or regionally representative samples completed in the second half of the school year with the exception of the Philippines. The Philippines conducted its only nationally representative Early Frade Reading Assessment (EGRA) in 2013 for third and first graders only, in both English and Filipino. The results were similar to those in Indonesia: the rates of zero-word readers for third graders were low—at only 1 percent for both languages—and reading comprehension was at 73 percent for Filipino. On the other hand, English reading comprehension was only 32 percent. The 2014 EGRA study targeted regions and schools that taught subcomponent for all countries except Cambodia and Timor-Leste, for which the score is based on the familiar word reading subcomponent. In the Philippines, tests were conducted in the indicated mother tongues. Scores for Timor-Leste are for combined tests of Portugese and Tetum. Scores for Vanuatu are for tests in English. Data are from the following years: Cambodia 2012, Indonesia 2014, Myanmar 2015, the Philippines 2014, Timor-Leste 2009, Tonga 2009, and Vanuatu 2010.
II.A. GROWING SMARTER: LEARNING AND EQUITABLE DEVELOPMENT IN EAST ASIA AND PACIFIC 81
ENHANCING POTENTIAL

Low- and middle-income countries in the region lack key packages of services. Despite growing evidence of the efficacy of early childhood education and development programs, some education systems still do not deliver key packages of services. Multiple sectors are responsible for providing the services that support children and their families. A “package” of services refers to the collective services provided across sectors to support holistic child development. Below-Average Performing or Emerging Systems are supporting readiness to learn in a variety of ways, but disparities in coverage across five key packages are wide (Figure II.A.6). Most countries provide broad service coverage during pregnancy and birth, but there is a large drop-off in coverage rates for services for families and children of preschool age. Coverage of services for family support and for child health and development tends to be low even in countries where preschool coverage rates are high. In contrast, coverage of all these service packages is high in Korea.
There is strong evidence that this package of services is linked to readiness to learn. For instance, substantial gaps exist between the ability of children from poor and wealthy families to perform basic functions, such as counting from 1 to 10. These gaps are also apparent in the use of preschool services, with a gap of 65 percentage points in Lao PDR and 54 percentage points in Mongolia. Gaps are similar in access to high-quality care at home. In Cambodia, the gap in access to preschools between the richest and poorest quintiles is 31 percentage points, and the gap in access to high-quality care is 24 percentage points.
The costs of inaction during the early years are high—and the cost of action is affordable. The social and economic costs of inaction during the early years are high. Most governments in the region can afford to close gaps in achievement between children from the top and bottom wealth quintiles (Figure II.A.7). Closing wealth gaps in access to preschools would cost just a small fraction of total education spending; in most countries, it would cost only a small
Figure II.A.7. Closing the gap in achievement between socioeconomic groups is affordable Percent of GDP
7
6
5
4
3
2
1
0
Japan SingaporeB-S-J-G(China) Vietnam Malaysia ThailandKorea, Rep. Indonesia
3.8
0.1
0.1
4.6
3.0
3.9
6.3
3.3
6.1
4.1
0.1 0.2
0.9
0.1 0.1
0.2
0.1
0.0
3
0.1
0.1
0.1
0.4
0.5
J Total government spending on education
J Government spending on preprimary education
J Additional spending required to close learning gap between children from richest and poorest households
Source: Authors' calculations based on data from PISA 2015 (OECD 2016b), UIS, and World Bank and Government of Vietnam 2017.Note: Data on total government spending are the latest available between 2011 and 2014, except 2016 for Indonesia and 2015 for China and Singapore. Cost of Inaction is for closing in percentage of students falling below basic proficiency in science. Data on percentage of government spending on preprimary are from UNESCO Institute for Statistics, Vietnam Ministry of Economy, and Vietnam Ministry of Finance for 2013, except 2012 for the Republic of Korea and Vietnam and 2014 for Japan. No data available for preprimary spending by B-S-J-G (China). B-S-J-G (China) = Beijing, Shanghai, Jiangsu, and Guangdong (China); PISA = Programme for International Student Assessment; UNESCO = United Nations Educational, Scientific, and Cultural Organization.
Figure II.A.6. Families do not have consistent service coverage between pregnancy and preschoolPercent of families
100
90
80
70
60
50
40
30
20
10
0
Cambodia Indonesia Myanmar Philippines Timor-Leste Korea, Rep.
J Pregnancy J Birth J Family support
J Child health and development J Preschool
Sources: Data from Demographic and Health Surveys. Preschool attendance data were supplemented by the World Bank EdStats database (World Bank, various years).Note: As described in Denboba and others (2014), pregnancy includes at least four care visits, iron supplementation, and diet counseling during pregnancy. Birth includes doctor or nurse present at delivery and breastfeeding. Family support includes mother having completed at least primary education, last birth interval greater than two years and last pregnancy desired, at least three types of stimulating activities at home, health care facility not too far and visit within 12 months, vitamin A and iron supplementation in last six months, and safe water source and improved sanitation. Child health and development includes at least three types of food besides breast milk from six months on; zinc supplement in case of diarrhea; children with weight, height, and height-weight ratio less than two standard deviations below the mean; and access to deworming medicine. Preschool measures enrollment in preprimary education. No data were available on non-breast milk nutrition for the Philippines. Only Cambodia had information on the provision of diet counseling during pregnancy and availability of deworming medicine.
82 PART II. MEDIUM-TERM DEVELOPMENT AGENDA
EAST ASIA AND PACIFIC ECONOMIC UPDATE APRIL 2018

fraction of spending on preprimary education. Estimates for a few countries—particularly Indonesia, Malaysia, and Thailand—are larger.
Domain 5: Assessing students to diagnose issues and inform instruction. A systemic approach to assessment drives high-quality learning outcomes in the classroom. Efforts to assess student learning in the Top-Performing Systems have been integrated with an actionable feedback mechanism—linked closely with policies and practices relating to teachers, students, and curriculums. The mix of assessments varies across countries, but all Top-Performing Systems have well-defined ways of feeding the information on student learning outcomes gained from such assessments back into the system to drive quality. At the classroom level, good practice involves training teachers to use such assessments and to incorporate classroom assessment into curriculums. At the school level, it involves informing principals’ decisions and educational strategies. And at the system level, it involves using assessment data to create a broad commitment to quality and spur policy decisions.
Classroom assessments increasingly inform instruction. Almost all countries have a system-level framework for large-scale assessment and exam activities, and more than half have such a framework for classroom assessment activities (Jimenez, Nguyen, and Patrinos 2012).3 Teachers’ preservice training increasingly includes techniques for productive use of classroom assessment. Top-Performing Systems include assessments in teacher training programs and provide guidance and monitoring on their use. In Singapore, educational reform included efforts to support assessment in the classroom, including studying teacher practices and designing a two-year professional development program to support assessment (Ho 2012).
International large-scale assessments have spurred learning-focused reforms. International benchmarking adds most value when it leads to the identification of specific areas for improving education quality. In Top-Performing Systems and Above-Average Performing Systems, international assessment data have spurred changes. Taiwan, China’s Happy Reading program, launched in 2008, was a response to low performance on PISA 2006. It used PISA microdata as a benchmark to align teaching methods, increase the amount of time allocated for reading instruction, increase resources, and revise teacher development (Driskell 2014). In Japan, PISA has been important in tandem with the national assessment to drive and monitor education reform.
Early Grade Reading Assessments are critical for Emerging Systems. International large-scale assessments such as PISA and TIMSS provide helpful information when a national school system has reached a level of performance compatible with the measured outcomes of the test. Where education systems are still emerging, targeted assessments of foundational skills provide more relevant information. EGRAs and Early Grade Math Assessments gauge student progress in early primary school.
EGRAs provide a snapshot of—and in some cases awake-up call about—what students are learning.They have spurred systemic changes in teaching methodologies and curriculums. In the Philippines, EGRA data helped policy makers develop clear and appropriate reading benchmarks for language, age, and region, enabling progress in tracking and accountability. In Tonga and Vanuatu, EGRA analysis in 2009 revealed low reading and comprehension. These results informed the Pacific Early Age Readiness and Learning program, to address both school readiness and early grade literacy through a variety of channels, including community-based groups,
3 SABER (Systems Approach for Better Education Results) is a set of tools that enables countries to evaluate and benchmark education policies across 13 areas including teachers, early childhood development, school autonomy and accountability, and student assessments (see http://saber.worldbank.org/).
II.A. GROWING SMARTER: LEARNING AND EQUITABLE DEVELOPMENT IN EAST ASIA AND PACIFIC 83
ENHANCING POTENTIAL

public awareness, teacher training, and a roadmap for early years to guide implementation of country priorities. Evaluation of the intervention and tracking of literacy gains showed improvements in reading of a half to a full year (Patrinos 2016).
The East Asia region has long utilized high-stakes examinations to allocate spots for further education. These have their place—but also have undesirable effects. As education systems in the region grew and matured, many relied on meritocratic, standardized selection to allocate scarce places in secondary education and universities. Test-based allocation played a central role in the push for better quality, and many aspects of quality were defined by how they affected test results. Indeed, most countries in the region still use exams for entrance decisions at the secondary level. While they motivated students, they also brought well-known negative effects related to stress and creativity-killing, exam-focused learning.
Some EAP economies have removed high-stakes exams or adapted them at lower levels of education. Korea removed middle-school entrance exams in the 1960s and high school entrance exams in the 1970s, as part of its high school equalization policy. It has subsequently experimented with further ways to reduce exam stress for students. In 2013, Malaysia replaced the high-stakes exam at the end of lower-secondary school with a mix of school-based exams and a centralized exam that included more critical thinking skills. Singapore maintains the primary school-leaving exam at the end of sixth grade.
A way forward
To improve learning outcomes, countries need an integrated approach that implements policy actions simultaneously. The foregoing examples of actions that lead to better learning outcomes demonstrate how policies and practices must be integrated and mutually supportive, and consistently implemented. Improving education cannot be done quickly or with frequently changing approaches. Success in each policy domain or practice usually represents years of struggle and determined implementation. This work pays off because when overall policies concentrate coordinated efforts in the five key areas identified by the report, students stand the best chance of learning the most in school.
The impressive record of success in education in some low- and middle-income countries in East Asia and Pacificisproof-of-conceptthatschoolinginresource-constrainedcontextscanleadtolearningforall.All education systems would like to improve, but the urgency is greater for those with consistently disappointing performance. Low- and middle-income countries that are unhappy with what their school systems are achieving—in East Asia and Pacific or elsewhere—can apply the policies and practices that underlie this success to ensure that their students learn. Providing learning opportunities is imperative for millions of children who are either out of school or in school but not learning. Lessons from high performers suggest that countries can improve learning outcomes by staying focused on implementation success in the five policy domains and 15 elements described above and listed in the Annex, which follows. Through such efforts, more and more students can find that they are not only attending school but are learning and acquiring valuable knowledge habits and skills while there.
84 PART II. MEDIUM-TERM DEVELOPMENT AGENDA
EAST ASIA AND PACIFIC ECONOMIC UPDATE APRIL 2018

Annex: Elements of policies and practices that promote learning
The success of some education systems in East Asia and Pacific shows that students learn most when efforts focus on five policy domains and align 15 elements. These domains and elements are as follows.
Domain 1. Align institutions to ensure basic conditions for learning. • Ensure that the basic conditions for learning exist in all schools.
Domain 2. Concentrate effective, equity-minded public spending on basic education. • Spend effectively. • Concentrate public spending on basic education. • Channel resources to schools and districts that are falling behind.
Domain 3. Select and support teachers throughout their careers, to allow them to focus on the classroom. • Raise the selectiveness of who becomes a teacher. • Support new teachers by observing classroom practices and providing feedback. • Make teachers’ jobs easier by providing clear learning goals and uncluttered texts. • Keep experienced teachers in the classroom and leading as peers and researchers. • Center teacher training on classroom practice and the ability to teach the curriculum.
Domain 4. Ensure that children are ready to learn in school. • Focus on physical and cognitive development from birth. • Assess and improve the quality of early childhood education and development services. • Coordinate actors to deliver needed services.
Domain 5. Assess students to diagnose issues and inform instruction. • Benchmark learning through participation in international large-scale assessments. • Diagnose cohort progress using national assessments. • Inform instruction with data from formative classroom assessment.
II.A. GROWING SMARTER: LEARNING AND EQUITABLE DEVELOPMENT IN EAST ASIA AND PACIFIC 85
ENHANCING POTENTIAL

II.B. The Future of Manufacturing-Led Development in East Asia4
In the past, export-led manufacturing was associated with economic growth and poverty reduction in East Asia. In the future, the advent of labor-saving technologies, changing trade patterns, and the increasing servicification of manufacturing will make manufacturing-led development strategies more challenging for developing countries in the region. Trade is slowing. Global value chains remain concentrated among a relatively small number of countries. Furthermore, the Internet of Things, advanced robotics, and 3D printing are shifting what makes locations attractive for production by reducing the importance of low-skilled labor. Despite these mounting challenges, there remains considerable scope to leverage the manufacturing sector for growth and development. The magnitude of automation, export concentration, and the intensity of services input use vary across manufacturing subsectors. This provides a window of opportunity for countries to continue to compete using existing business models and technologies. Countries should use this window to address the agenda on competitiveness, capabilities, and connectedness (the ”3Cs”) and ensure that they position themselves to take advantage of new opportunities as technologies diffuse. Alarmism is neither constructive nor necessary, but there is an urgency to this agenda in preparing countries for new sources of productivity and job creation going forward.
The role of manufacturing in East Asia’s development
Some of the biggest development gains in history have been associated with the process of industrialization. The rise of successive waves of East Asian countries to upper-middle-income and high-income status was based on the strength of the manufacturing sector, starting in the late 19th century with Japan. Subsequently, the “economic takeoff” around 1960 that resulted in East Asia’s growth miracle in Hong Kong SAR, China; Taiwan, China; the Republic of Korea; and Singapore coincided with the rapid export growth of manufactures (Leipziger 1997; Rodrik 1994; Stiglitz and Yusuf 2001; World Bank 1993). Between 1970 and 2010, China, Korea, and Thailand had significant increases in the share of manufacturing in employment and value added, combined with some of the highest per capita income growth rates in the world (Cruz and Nayyar 2017). Moreover, the focus of these East Asian economies on export-oriented industrialization (unlike many countries in Latin America) helped deliver the dual benefits of productivity growth and jobs for unskilled labor. Consequently, these Asian economies reduced poverty dramatically (Devlin, Estevadeordal, and Rodríguez-Clare 2006).
The advent of new labor-saving technologies and shifts in trade flows raise questions as to whetherexport-led manufacturing growth will be as relevant to East Asian countries in the future as it was in the past. Trade is slowing. Global value chains (GVCs) remain concentrated among a relatively small number of countries. Furthermore, the Internet of Things (IoT), advanced robotics, and 3D printing are shifting what makes locations attractive for production by reducing the importance of low-skilled labor. These trends raise concerns that export-led manufacturing will no longer offer an accessible pathway for lower-income countries in developing East Asia to continue to grow rapidly. At the same time, higher-income countries in developing East Asia with a sizable manufacturing base in the region may be in a better position to adopt new technologies, harness agglomeration
4 Prepared by Mary Hallward-Driemeier and Gaurav Nayyar. The section draws from a new World Bank report, Trouble in the Making? The Future of Manufacturing-Led Development (Hallward-Driemeier and Nayyar 2017). Readers can find additional analysis at www.worldbank.org/futureofmanufacturing.
86 PART II. MEDIUM-TERM DEVELOPMENT AGENDA
EAST ASIA AND PACIFIC ECONOMIC UPDATE APRIL 2018

economies, and develop services that are increasingly embodied in the production of goods. Yet, these countries will still face the challenge of adapting to this fast-changing economic landscape in order to compete successfully in the broader global economy.
This section does three things. It (a) presents a set of stylized facts that situate East Asia in the global manufacturing landscape over the last two decades; (b) outlines how three key trends—automation, export concentration, and servicification—are shaping how and where manufacturing is likely to take place in the future, with a focus on implications for developing East Asia; and (c) provides a policy framework focused on strengthening competitiveness, capabilities, and connectedness—the 3 “Cs”—to help countries in the region take best advantage of opportunities going forward. In doing so, it illustrates some of the policy priorities based on countries’ specific production structures and the differential changes expected across manufacturing subsectors.
Stylized facts: East Asia in the global manufacturing landscape
To understand the future impacts of technology, shifting trade patterns, and the servicification of manufacturing on the geography of production, it is important to know how the global manufacturing landscape has changed in the recent past.
Ì Between countries
Much of the decline in the share of high-income countries in global manufacturing value added over the last two decades coincides with a strong move toward production in East Asia, particularly China. That the share of high-income countries (HICs) in global manufacturing value added has declined over the last two decades largely reflects the offshoring of production by their multinational companies, which either set up subsidiaries as export platforms in lower-cost locations or produce goods overseas to serve local markets. Figure II.B.1 shows the trends from 1994 to 2015, but the decline in the HICs’ share was apparent for decades before that. Much of the decline of production in HICs coincides with a strong move toward production in Asia, particularly China. China’s share of global manufacturing value added increased from less than 5 percent in 1994 to 25 percent in 2015. Around half the countries worldwide have seen their share in global manufacturing value added increase, albeit from a low base, and this includes all developing economies in East Asia.
High-income countries, including those in East Asia, remain the dominant exporters across major manufacturing sector groups, with China having
Figure II.B.1. Share of global manufacturing value added in China, global regions, and high-income countries, 1994–2015Percent
80
70
60
50
40
30
20
10
0
CHN ECA MENA SSA HICEAP SASLAC
J 1994 J 2000 J 2005 J 2010 J 2015
Source: World Development Indicators database.
II.B. THE FUTURE OF MANUFACTURING-LED DEVELOPMENT IN EAST ASIA 87
ENHANCING POTENTIAL

joined their ranks. Across the five major manufacturing sector groups as defined in Hallward-Driemeier and Nayyar (2107)—low-skill labor-intensive tradables,5 medium-skill global innovators,6 high-skill global innovators,7 commodity-based regional processing,8 and capital-intensive regional processing9—the large majority of the top 10 exporting countries10 are high-income economies. At the same time, the shifting importance of export locations highlights the rise of China beyond the low-skill, labor-intensive manufactures, where it was the largest exporter in 2002, 2007, and 2011. China in 1995 was outside the top 10 exporting countries for the high-skill global innovators. By 2002, it reached the eighth position and quickly became the top exporter in this manufacturing sector group by 2007, a position that it retained in 2011. Similarly, among the medium-skill global innovators, China was outside the top 10 exporting countries in 2002, but became the fourth largest exporter in 2007 and remained so in 2011 (Hallward-Driemeier and Nayyar 2017).
Other developing economies in East Asia have also emerged as major exporters across the major manufacturing sector groups. Beyond the high-income economies and China, a group of about 15 large emerging markets formed the next tier of big players across the manufacturing groups. Within developing East Asia, these include Indonesia, Malaysia, the Philippines, Thailand, and Vietnam. Across developing countries, a few even made it to the top 10 exporters by 2011. These included India and Turkey in labor-intensive tradables, Malaysia in high-skill global innovators, Mexico in medium-skill global innovators, India and Russia in capital-intensive regional processing, and Brazil and Russia in commodity-based regional processing.
Ì Within countries
Three-quarters of countries worldwide are experiencing a decline in the share of manufacturing in GDP, but some in East Asia are among the few that have experienced an increase in the relative size of the manufacturing sector. Falling shares of manufacturing value added in GDP are a widespread phenomenon.11 What is striking is that such a decline also characterizes half of the 92 countries whose global shares of manufacturing production are rising. (Forty-six of the countries shown in Figure II.B.2 are below the 45-degree line.) In developing East Asia, this includes China, Indonesia, Malaysia, the Philippines, and Lao PDR, and would indicate that services are rising even faster than manufacturing in these countries. Vietnam, Cambodia, and Myanmar, in contrast, are among the
5 Textiles, garments, and leather products; manufacturing n.e.c.
6 Transportation equipment; other machinery and equipment; electrical machinery and apparatus not elsewhere classified (n.e.c.).
7 Electronics, computing, and optical instruments; pharmaceutical products.
8 Food processing, wood products, paper products, basic metals, fabricated metal products, nonmetallic mineral products, rubber and plastic products.
9 Chemical products; refined petroleum products.
10 As measured by domestic value added in share of gross exports [in US$].
11 All the countries that were high income in 1994 are now experiencing a domestic decline in the share of value added accounted for by manufacturing—as are virtually all the 107 countries whose global shares of manufacturing production are also declining.
Figure II.B.2. Change in manufacturing value added as a share of domestic GDP among countries with expanding global shares, 1994–2014Share of manufacturing value added in GDP (percent, 2014)
40
35
30
25
20
15
10
5
0
0 5 10 15 20 25 30 35 40
MMR
KHM
VNM
LAOMNG
CHN
KOR
THA
MYSIDN
PHL SGP
Share of manufacturing value added in GDP (percent, 1994)
Source: Hallward-Driemeier and Nayyar 2017.Note: The size of the bubble indicates countries’ share in global manufacturing value added in 2014.
88 PART II. MEDIUM-TERM DEVELOPMENT AGENDA
EAST ASIA AND PACIFIC ECONOMIC UPDATE APRIL 2018

small global players that experienced an increase in the GDP share of manufacturing between 1994 and 2014. Myanmar was one of three that experienced the largest percentage point increase—from 8 percent to 21 percent—while Cambodia also made marked strides from 9 percent to 17 percent.
In East Asian countries where there was a relative decline of the manufacturing sector in GDP or employment, like elsewhere, this does not translate into absolute declines. Among the 66 countries for which we have data, 12 experienced an absolute decline in real manufacturing value added in the last 20 years, many of which had conflict situations. No country from developing East Asia was among these. As for employment, a somewhat larger share of countries experienced an absolute decline in jobs, but these were mainly HICs. Seven countries stand out for having lost close to 1 million manufacturing jobs or more, while China is the extreme positive outlier, gaining 48 million manufacturing jobs during 1994–2011 (Hallward-Driemeier and Nayyar 2017).
Inmanylower-middle-incomecountries(LMICs),thepeaksharesofmanufacturinginvalueaddedandemployment were both lower and occurred at lower levels of development than in the past. Rodrik (2015) reveals this finding—referred to as “premature deindustrialization” by Dasgupta and Singh (2007)—for a sample of 42 countries between 1950 and 2012, and shows that this process has been more rapid in successive decades since the 1960s. A comparison between the earlier and later industrializers within East Asia itself illustrates this point. The peak share of manufacturing in GDP, at 13.5 percent and 12 percent, was associated with a per capita income of US$1,042 (in constant 2010 dollars) in Indonesia and US$846 (in constant 2010 dollars) in the Philippines. In contrast, higher peak shares of manufacturing in GDP, at 28 percent and 30 percent, were associated with higher per capita income levels of US$7,718 (in constant 2010 dollars) in Korea and US$10,478 (in constant 2010 dollars) in Singapore (Hallward-Driemeier and Nayyar 2017).
Ì Patterns of specialization
There is some evidence of the “flying geese”paradigm12 among industrializers in East Asia, except for China, which remains a big player across all manufacturing subsectors. Countries in the region that have become middle income or high income are changing the composition of their production baskets away from low-skill, labor-intensive goods to more skill-intensive goods. In the case of Korea, Malaysia, Indonesia, and the Philippines, this change is reflected in a declining share of food and beverages and textiles and apparel in GDP, alongside an increasing share of transportation equipment and computers and electronics in GDP between 1994 and 2014 (Figure II.B.3). Based on export baskets, between 1993–95 and 2011–13, Korea and Thailand acquired a revealed comparative
12 The “flying geese” paradigm is a model for the international division of labor based on dynamic comparative advantage, where the main driver is the “leader’s imperative for internal restructuring” because of increasing labor costs (Akamatsu 1962). As the comparative advantages (on a global scale) of the “lead goose” cause it to shift further and further away from labor-intensive production to more capital-intensive activities, it sheds its production of commoditized goods to countries further down in the hierarchy in a pattern that then reproduces itself among the countries in the lower tiers. The East Asian experience is usually cited to typify this pattern.
Figure II.B.3. Percentage point change in GDP share from representative manufactures, selected East Asia countries, 1994–20146
4
2
0
-2
-4
-6
MYS PHL IDNKOR JPN
J Food and beverages J Textiles and wearing apparel
J Computer and electronics J Transport equipment
Source: Industrial Statistics database of the United Nations Industrial Development Organization.
II.B. THE FUTURE OF MANUFACTURING-LED DEVELOPMENT IN EAST ASIA 89
ENHANCING POTENTIAL

advantage13 in medium-skill global innovator industries and lost their revealed comparative advantage in labor-intensive tradables. At the same time, during the same period, Cambodia, Indonesia, and Vietnam maintained their revealed comparative advantage in labor-intensive tradables while Myanmar acquired a revealed comparative advantage in those. China, with a revealed comparative advantage in four of five manufacturing sector groups in 2011, is entering higher-value-added sectors while also maintaining its production in the labor-intensive sectors.
Few developing economies outside of East Asia have a revealed comparative advantage in anything but labor-intensive tradables or commodity-based regional processing. The large majority of low-income and lower-middle-income countries lacked a revealed comparative advantage in the high- and medium-skill global innovator industries in 1993–95 and had not acquired one by 2012–14. Vietnam and the Philippines in East Asia are among the few exceptions to this norm. While developing countries in South Asia share East Asia’s success in the manufacture of labor-intensive tradables, those in Sub-Saharan Africa lacked a revealed comparative advantage even in these industries (Hallward Driemeier and Nayyar 2017). This divergence between Southeast Asia and Sub-Saharan Africa is indicative of the fact that beyond the consideration of low unit labor costs, value chains in labor-intensive tradables such as wearing apparel and other light manufacturing have developed along regional lines.
Trends shaping opportunities for future production
Three trends that are changing what it takes for a location to be attractive for production are highlighted here: shifting trade patterns, new technologies, and servicification of manufacturing.
Ì Shifting trade patterns
Weak import demand resulting from the global trade slowdown may limit prospects for manufacturing export-led growth in hitherto less industrialized countries. Despite its recovery in 2017, global trade growth has been strongly subdued in recent years—growing on average by 3 percent per year since 2012, well below the precrisis annual average of 7 percent (1987–2007). Trade weakness in the aftermath of the 2008 global financial crisis has been most pronounced in the high-income economies at the center of the crisis, notably the euro area and the United States, which are also the major export markets. Developments within the manufacturing sector are key to understanding the slowdown. At the world level, the long-run elasticity of manufacturing trade to GDP was 2.4 in the 1990s and fell to 1.9 in the 2000s, while services trade elasticity and commodity trade elasticity increased over the same period (Constantinescu, Mattoo, and Ruta, forthcoming).
Furthermore, the slowing pace of globalization might be more structural than cyclical with what appears to be a maturation of global value chains. The long-term elasticity of trade in goods with respect to income in the 2000s returned to the levels that had preceded the “long 1990s”: elasticity was 1.1 between 1970 and 1985, rose to 2.2 during 1986–2000, and then declined to 1.6 in the 2000. This elasticity increased during the 1990s as production fragmented internationally into GVCs, leading to a rapid surge in trade in parts and components, and decreased in the 2000s as this process “matured” (Constantinescu, Mattoo, and Ruta 2017; Haugh, Jin, and
13 Revealed comparative advantage (RCA) is defined as the ratio of the share of a sector in a country’s total exports to the share of that sector in world exports. It implies that country “i” has an RCA in sector “j” if RCAij > 1.
90 PART II. MEDIUM-TERM DEVELOPMENT AGENDA
EAST ASIA AND PACIFIC ECONOMIC UPDATE APRIL 2018

Pandiella 2016; Timmer et al. 2015). The diminishing importance of the parts and components imports is reflected most clearly in their falling share of China’s manufacturing exports, from the mid-1990s peak of 34 percent to the current share of approximately 22 percent (Constantinescu, Mattoo, and Ruta, forthcoming).
Partoftheslowdownintradeinglobalvaluechainsalsoreflectsthegrowingconcentrationofexportsin the top-producing countries. The growing share of trade accounted for by the top producers has been
particularly pronounced in garments and textiles, and in electronics, transportation equipment, and electrical machinery. China, in particular, has come to be a top producer in almost all double-digit manufacturing sectors (Hallward-Driemeier and Nayyar 2017), and it is expanding the domestic content of its exports by substituting domestic for foreign inputs (Kee and Tang 2015), thereby producing larger parts of the value chain within its borders. The fact that China is moving up from, yet not moving out of, the lower-value-added end of GVCs is captured by recent evidence that China is increasing its domestic value added in all manufacturing sectors (Figure II.B.4). This could make it that much more challenging for countries with more nascent manufacturing sectors to enter or expand their scale.
At the same time, China’s rising wages create the possibility for production relocation to low-wage countries, especially in East Asia. Chinese manufacturing wages rose by 281 percent between 2003 and 2010, much faster than in many other low- and middle-income economies (Figure II.B.5, panel A). Even accounting for shifts in real exchange rates, Chinese competitiveness from a unit labor cost perspective appears to have declined over the same period relative to that of many other LMICs (Figure II.B.5, panel B). This may encourage the relocation
Figure II.B.4. Change in domestic value added of China’s exports across manufacturing sectors, 1995–2011Percent
Food products
,
beverages/t
obacco
Texti
les, texti
leproducts
,
leather and footw
ear
Wood, paper,
paper products
,
printin
g and publishing
Chemicals
and non-metallic
mineral products
Basicmetals
and fabricated
metal products
Machinery
and equipment, nec
Electrica
l and optic
al equipment
Transp
ort equipment
Manufacturin
g nec; recyc
ling
80
60
40
20
0
J 1995 J 2011
Source: Trade in Value Added (TIVA) Database of the Organization for Economic Co-operation and Development and World Trade Organization.
Figure II.B.5. Change in manufacturing wages and relative unit labor costs, China and selected LMICs, 2003–10 Panel A Panel BPercent change in manufacturing wages, 2003–10 Unit labor costs relative to China
300
250
200
150
100
50
0
Botswana Brazil China Ethiopia India Korea, Rep. Malawi Malaysia Mauritius
72
186
281
1
98
43
21
34
88
5
4
3
2
1
0
Botswana Brazil Ethiopia India Korea, Rep. Malawi Malaysia Mauritius
Source: Trade in Value Added (TiVA) Database of the Organization for Economic Co-operation and Development and World Trade Organization.
J 2003 J 2010
Source: Ahmed and Chen (2017).
II.B. THE FUTURE OF MANUFACTURING-LED DEVELOPMENT IN EAST ASIA 91
ENHANCING POTENTIAL

of production toward other lower-cost economies, especially to neighboring countries through regional production networks. Evidence shows that in the context of shared international production, China’s trading partners benefit if their production structure is complementary to China’s, which is the case for many lower-cost countries in the region (Boffa, Santoni, and Taglioni 2017).
Ì Diffusion of Industry 4.0
Theprospectsofmanufacturingexport-leddevelopmentarefurtherinfluencedbyemergingtechnologies—primarilytheInternetofThings,advancedrobotics,and3Dprinting—thataretransformingproductionprocesses. Although new technologies encompass a wide range of new product lines, what holds the potential to be disruptive for developing economies is the use of new process technologies to produce traditional manufactured goods, which can change conventional patterns of comparative advantage. The focus here is on robotics (particularly artificial intelligence [AI]-enabled); digitalization and internet-based systems integration, including sensor-using “smart factories” (that may also be AI-enabled); and 3D printing. These are among the most emphasized technologies in the Industry 4.0 literature (Cirera, Cruz, Beisswenger, and Schueler 2017). Moreover, while not all these technologies are new (robots and 3D printing have been around for decades, and the IoT builds on information and communication technology (ICT) legacy technologies), cost innovation, software advances, and evolving business formats and consumer preferences are fueling their adoption (Comin and Ferrer 2013).
The greater diffusion of existing ICT technologies and newer IoT developments can reduce trade and coordination costs and further strengthen globally fragmented production. For example, Lendle and Olarreaga (2017) find that the impact of distance on cross-border trade flows across 61 countries and 40 product categories is about 65 percent smaller for eBay transactions relative to total international trade. More generally, Osnago and Tan (2016) and World Bank (2016b) find that a 10 percent increase in an exporter’s rate of internet adoption led to a 1.9 percent increase in bilateral exports. New technologies in the IoT space, some of which are already in use, can further reduce the costs of coordinating globally fragmented production by making it easier to track and monitor components as they move through the supply chain. Cloud computing, for example, can change the landscape of information storage and exchange while also enabling better, more cost-effective coordination of globally fragmented production. Similarly, the analysis of large, fast-moving, and varied streams of “big data” has received much attention because it can enable firms in GVCs to optimize complex distribution, logistics, and production networks.
At the same time, the potential to rebundle activities through advanced robotics in “smart” factories may challenge established patterns of comparative advantage, a factor particularly relevant for developing East Asia, which is currently involved in GVCs. By reducing the relative importance of wage competitiveness, increased automation under Industry 4.0 has already enabled some leading firms, albeit in small measure, to reshore historically labor-intensive manufacturing activities back to high-income economies and closer to the final consumers. Two well-known recent examples of this are Philips shavers in the Netherlands and Adidas shoes in Germany (Assembly Magazine 2012; Bloomberg Technology 2012; Economist 2017a, 2017b; Financial Times 2016). A report by Citigroup and the University of Oxford’s Oxford Martin School finds that 70 percent of Citi institutional clients surveyed believe automation will encourage companies to move their manufacturing closer to home, with North America seen as having the most to gain from this trend, and China and Association of Southeast
92 PART II. MEDIUM-TERM DEVELOPMENT AGENDA
EAST ASIA AND PACIFIC ECONOMIC UPDATE APRIL 2018

Asian Nations (ASEAN) member countries seen as having the most to lose (Citigroup 2016). But reports about the advent of reshoring and resulting changes in globally fragmented production at present appear to be greatly exaggerated (De Backer et al. 2016).
The rapid robotization in China to address declining wage competitiveness is particularly noteworthy given recent expectations of an en masse migration of light manufacturing activities to lower-cost economies in East Asia. Standard Chartered Global Research (2016) found that 48 percent of 290 manufacturers surveyed in the Pearl River Delta would consider automation as a response to labor shortages; less than a third would consider moving capacity either inland or out of China. Some high-profile firms are already substituting a substantial number of workers with industrial robots. For example, Foxconn—the firm known for producing Apple and Samsung products in China’s Jiangsu province—recently replaced 60,000 factory workers with industrial robots (South China Morning Post 2016). Nationally, the country is projected to have the largest operational stock of robots by 2018—more than doubling the number in 2015 (Figure II.B.6).14 Some other large emerging markets, including Indonesia, Malaysia, and Thailand in East Asia also registered nontrivial stocks of industrial robots in 2015 (Figure II.B.7).
Figure II.B.6. Operational stock of industrial robots in the manufacturing sector, selected countries and regions, 1995–2018
Figure II.B.7. Operational stock of industrial robots, selected countries and regions, 2015
In thousands
0 50 100 150 200 250 300 350 450400
Japan
Germany
North America
Korea, Rep.
China
250
200
150
100
50
0
China Thailand Mexico Brazil India Turkey Malaysia Indonesia
206
15 149 9 7 4 3
Number of robots (thousands) Source: Calculations based on Industrial Robots Statistics, International Federation of Robotics.
J 2018 J 2015 J 2010 J 2005 J 2000 J 1995
Source: Calculations based on Industrial Robots Statistics, International Federation of Robotics. Note: nec = not elsewhere classified.
3D printing can be scale-reducing, thereby reducing the advantage of established manufacturing centers such as China, but is still too costly to be widely used. Scale is expected to matter less with 3D printers than with other new manufacturing process technologies, and the demand for customized, quickly delivered goods could lead to geographically dispersed manufacturing activity—that is, a “micromanufacturing” model, whereby even small businesses in a wide range of LMICs can access international designs and print them locally. However, 3D printing has so far mainly been used for prototyping and has a considerable presence or significant potential only in certain niche industries.
Further, given the widespread capabilities needed to use 3D printing, or if scale economies in 3D printing itself turn out to be strong, printing activity may cluster close to major markets. The scenario of dispersed
14 On a per capita basis, China will not stand out. But China, within a decade, has gone from having very few robots to using more than any other country.
II.B. THE FUTURE OF MANUFACTURING-LED DEVELOPMENT IN EAST ASIA 93
ENHANCING POTENTIAL

manufacturing activity might be constrained by the scarcity of trained technicians and engineers or by reliable electricity supply in many developing economies. The weak protection of intellectual property rights is another factor: firms will be unlikely to send designs to places where they can easily be printed without limit for customers not paying license fees or royalties. Further, countries that are not open to trade in services risk being left behind because the 3D printing model effectively substitutes trade in services (through the payment of license fees and royalties for designs) for goods trade (Arvis et al. 2017). There could therefore be reshoring and concentration of 3D printing activity, likely close to major markets in Europe, North America, and East Asia.
Ì Servicificationofmanufacturing
The advent of robotics, 3D printing, and a new wave of digitalization through the Internet of Things emphasizes the growing importance of services in the broader manufacturing process. The generation of data and its subsequent use in “smart” factories will be central to this servicification of manufacturing. For instance, interconnected manufacturing where machinery and equipment are connected to the internet requires the transmission of data across the entire production chain. And ICT-related services are the predominant producer and user of these data. For example, data processing services, such as cloud computing, produce data for “smart” factories while advanced data analytics use this real-time information to optimize production processes. Similarly, 3D printing eliminates the need to move manufactured goods over long distances from production centers and instead puts the premium on trade in services—primarily data flows—as part of the manufacturing process. For example, designs, data, and other information from a product designer/producer in an exporting country will be delivered digitally for printing in a target market (Arvis et al. 2017).
Likely impact on future opportunities in developing East Asia
The challenges associated with the diffusion of automation technologies, shifting trade patterns and exportconcentration,andtheservicificationofmanufacturingvaryacrosssubsectors.The use of robots in high-income economies, which brings into question the long-term viability of the labor-intensive production processes used in less industrialized countries, varies across manufacturing subsectors. The greater use of robots is likely correlated with the adoption of other “smart” technologies under Industry 4.0, and the sectors that are already relatively more robotized are also the most susceptible to 3D printing (Hallward-Driemeier and Nayyar 2017). The rise of services as a necessary complement to the success of manufacturing also deserves emphasis—the focus is on the share of professional, scientific, and technical service inputs into manufacturing value added, which vary across subsectors and particularly matter for the adoption of new technologies. Similarly, manufacturing subsectors whose exports are concentrated among a few countries illustrate where it may be harder for others to maintain their competitiveness, let alone enter or expand production, owing to large-scale and agglomeration economies. The impact of these trends on the viability of being a competitive production location will be influenced by the extent to which subsectors are traded. For example, the diffusion of automation technologies will matter less for firms seeking to remain viable using traditional technologies if a subsector is less traded internationally. Similarly, export concentration means little for international competition if the subsector is less traded internationally. Categorizing the relative magnitude of automation, tradedness, export concentration, and services intensity as
94 PART II. MEDIUM-TERM DEVELOPMENT AGENDA
EAST ASIA AND PACIFIC ECONOMIC UPDATE APRIL 2018

“high” or “low,” Table II.B.1 shows that the bar to be a competitive production location is rising more in some manufacturing subsectors than others.
Table II.B.1. New pressures differentially affecting feasibility of subsectors going forwardExtent of impacts of new technology and globalization
Sectors (grouped by the common combinations of trends they face)
Increasing concentration
of international production
Traded Robots/3D printers Use of services
Transportation High High High HighElectronics High High High HighPharmaceuticals High High High HighElectrical machinery High High High HighMachinery and equipment High High High LowManufacturing n.e.c. High High High LowTextiles High High Low LowRubber and plastics Low Rising High LowFabricated metals Low Rising High LowFood Low Low Low HighChemicals Low Low Low HighCoke and refined petroleum Low Low Low HighWood products Low Low Low LowPaper products Low Low Low LowBasic metals Low Low Low LowNonmetalic mineralsa High Low Low LowSource: Hallward-Driemeier and Nayyar (2017). Note: a. Given that nonmetalic minerals are minimally traded, the increased concentration of international trade is of less importance, and this is grouped with the other sectors facing limited impact of the three trends. n.e.c. = not elsewhere classified.
An analysis of those sectors where developing East Asia actively produces and exports, including with a revealed comparative advantage, reveals how different combinations of trends raise different challenges.
Six highly traded manufacturing subsectors, which are characterized by a relatively high magnitude of automation,exportconcentration,andservicification,arelikelytobethemostcompetitivetobreakintoor maintain. Electronics, computers, and optical instruments; pharmaceutical products; transportation equipment; other machinery and equipment; electrical machinery and apparatus; and manufacturing not elsewhere classified (n.e.c.)15 are the most internationally traded manufacturing sectors, typically organized in GVCs. In 2014, Thailand, Indonesia, the Philippines, Malaysia, and Vietnam had a revealed comparative advantage (RCA) in at least one of these subsectors, which largely relates to the completion of unskilled labor-intensive assembly and other tasks. This RCA might be harder to maintain or acquire in the future given that these sectors combine relatively high levels of export concentration (as measured by the Herfindahl-Hirschman index) with a relatively high number of robots per 1,000 workers currently in use. China is rapidly automating and might therefore be at an advantage relative to the rest of developing Asia given that scale and agglomeration matter more in ecosystem-intensive industries such as automobiles, electronics, and heavy machinery. In addition, electronics, computers, and optical instruments; pharmaceutical products; and transportation equipment also have relatively high shares of professional services input in total value added.
15 Comprising furniture, jewelry, toys, sports equipment, and musical instruments.
II.B. THE FUTURE OF MANUFACTURING-LED DEVELOPMENT IN EAST ASIA 95
ENHANCING POTENTIAL

Thetextiles,apparel,andfootwearsubsectorhasbeenslowtoautomate—includinginChina—andthemigration of low-skilled jobs to lower-cost locations is likely to continue. While highly traded internationally, the textiles, apparel, and footwear sector is the least automated sector in terms of robots per 1,000 workers currently in use, including in China, where wages continue to rise (Figure II.B.8).16 Therefore, large-scale import substitution effects appear unlikely, which is especially important in East Asia, where countries either maintained their RCA in the sector (Thailand, Indonesia, Vietnam, Cambodia, Myanmar) or lost their RCA (Malaysia and the Philippines) between 1995 and 2014. Further, although the export of these sectors has been concentrated in China, recent foreign direct investment (FDI) patterns in apparel and leather products are indicative of the “flying geese” paradigm, including in East Asia. China experienced a decline in the number of greenfield FDI projects in 2011–15 compared with 2003–07, while Vietnam experienced an increase, that is, consistent with new FDI seeking to locate in a lower-cost location.
Opportunities will be least affected in most commodity-based manufactures—sectors that are lessautomated, less intensive in the use of professional services, less traded, and where export locations are geographically less concentrated. International competition is likely to increase least in a range of commodity-based manufactures that are both less automated and less traded internationally. These sectors typically produce goods that are bulky to transport or that require proximity to raw materials: basic metals, nonmetallic mineral products, coke and refined petroleum, wood products, paper products, and food processing. This is good news because all of developing East Asia had an RCA in these sectors in 2014. Among them, however, food processing and coke and refined petroleum are among the manufacturing subsectors that are relatively more intensive in the use of professional services.17 Further, fabricated metal products and rubber and plastic products are quite automated, but with less export concentration and a lower overall trade intensity, global competition will likely intensify less.
Preparing for change
Challenges associatedwith new technologies, shifting trade patterns, and servicification increase theneed for countries in developing East Asia to carry out reforms to strengthen their competitiveness, increasetheircapabilities,andimprovetheirconnectedness(referredtoasthe“3Cs”).Competitiveness addresses the shift from low wages to broader considerations of the business environment in determining low unit
16 There are some early signs of the use of 3D printing in segments of footwear manufacturing. Take the example of Adidas, the German sporting goods company, which has established 3D printing facilities to produce athletic footwear in Ansbach, Germany, and Atlanta, Georgia, in the United States. The two “Speedfactories” are expected to initially produce around 500,000 pairs of shoes per year, which accounts for only a small percentage of the over 300 million pairs of athletic footwear produced annually.
17 Other nonmetallic products are also relatively more concentrated in terms of exporting countries, but this means little given that they are the most nontraded manufacturing subsector.
Figure II.B.8. Use of industrial robots in China, by manufacturing subsector, 2004–15 in thousands
250
200
150
100
50
0
2004 2005 2006 2007 2008 2009 2010 2011 2012 2013 2014 2015
J Food and beverages J Textiles J Wood and furniture J Paper
J Pharmaceuticals, cosmetics J Chemical and chemical products J Rubber and plastics
J Nonmetallic products J Basic metals J Fabricated metal products
J Machinery and equipment J Electrical machinery J Office, accounting/computing equip.
J Motor vehicles, trailers and semitrailers J Furniture
Source: Calculations based on International Federation of Robotics World Robotics database.
96 PART II. MEDIUM-TERM DEVELOPMENT AGENDA
EAST ASIA AND PACIFIC ECONOMIC UPDATE APRIL 2018

labor costs, which will be particularly important in sectors where global production is becoming more concentrated. Capabilities address the need for workers and firms to strengthen their ability to adopt and use new technologies—and the additional regulations and policies needed to support this. Connectedness highlights not only shifts in the trade agenda, but also the growing synergies across sectors to achieve success in manufacturing.
Ì Impact of trends on Competitiveness and Connectedness
The business environment agenda has greater urgency as new technologies make labor a smaller share of overall costs. As China’s wages rise, manufacturers will increasingly look to other offshore locations for low-cost manufacturing tasks; for example, wage costs in Vietnam are typically less than half of China’s, while those in Ethiopia are only a quarter of China’s and half of Vietnam’s (Dinh et al. 2012; Standard Chartered Global Research 2016). However, given that new technologies are making labor a smaller share of overall costs, this places a greater premium on the business environment agenda, including access to finance, basic infrastructure, quality control mechanisms, tax regimes, and regulations that promote flexible labor markets, which liberalize backbone services and improve firm entry and exit. Many low-income economies fare poorly on these different metrics, and the resulting lack of scale and time-to-market advantages erode their competitiveness.
The business environment architecture will also need to incorporate new technology-based services that improve production processes, and regulations will need to adjust to new business forms. New technologies can improve access to financial services in ways that expand opportunities for manufacturing, including in countries with a relatively weak business environment. Mobile payment systems are an increasingly intricate part of ensuring that services can be embedded in goods—and that trade in digital services can be embodied in the making of goods. New technologies are also being used to develop new business forms. For example, the prospect for expanding the sharing economy to warehousing, production facilities, and vehicles could significantly reduce the costs needed to set up a business. Such arrangements, however, will rely on contract enforcement, more sophisticated payment systems, and competition policies overseeing platform production systems.
Market access restrictions, the connectivity agenda, and regulatory cooperation remain indispensable and need to be tackled with greater urgency. Although significant progress has been made in addressing trade restrictions on manufactures, lower-income economies in East Asia seeking new opportunities for export-led manufacturing will still benefit from reducing restrictions on the import of intermediate inputs and from secure market access in their destination markets. Tariffs remain high in some sectors or are not subject to stringent commitments, and several nontariff measures also affect trade flows. Similarly, trade facilitation that aims at better logistics and easing border clearance merits even greater emphasis given heightened global competition and the increasing importance of delivery time, especially in higher-income markets. The World Trade Organization 2013 Trade Facilitation Agreement (which entered into force in February 2017) represents an important step in this regard.
Forsectorswheretheservicificationofmanufacturingismoreimportant,thetradereformagendafortherange of services embodied in goods will also become more pressing. Services sector reforms are relevant in their own right, but their importance is magnified by changing technologies whereby services are increasingly embodied in the production and sale of goods—through banking, transport, and telecommunications, for example.
II.B. THE FUTURE OF MANUFACTURING-LED DEVELOPMENT IN EAST ASIA 97
ENHANCING POTENTIAL

But services trade remains hampered by substantial policy barriers, with restrictions more common in LMICs than in high-income countries (Hallward-Driemeier and Nayyar 2017). For example, major barriers to FDI and some barriers to cross-border electronic trade of ICT-enabled services have impeded Indonesia’s participation in GVCs for electrical goods and motor vehicles (Bamber et al. 2017).
Ì Addressing the Capabilities Gap
Education and training policies will need to be redesigned to deliver the new skills needed for countries to engage in more complex production processes. Countries will need to emphasize basic numeracy, literacy, and digital literacy skills with greater urgency for a large section of the population. At the same time, a focus on advanced skills for a subset of the population that has access to higher-quality tertiary education must be emphasized. This might involve greater investment in the development of advanced ICT-related skills, such as software programming and coding or complementary skills in engineering, as well as soft skills that foster creativity, problem solving, and initiative. These programs should also be more responsive to changing industry demands if firms are to be able to find the employees they need.
In ensuring access to new technologies, the diffusion of improved production processes should be the priority, differentiating across firms and countries, including over time as capabilities expand.While innovations on the frontier grab headlines and the imagination of policy makers, far more impact in improving firm productivity and employment outcomes can be achieved by helping firms catch up and move closer to the frontier. There is a need to start with improvement of more basic managerial and organizational practices, which will allow firms to use and adapt new processes, and to proceed to more sophisticated technological knowledge associated with Industry 4.0 further along (Cirera and Maloney, 2017). Therefore, rather than trying to jump straight to R&D subsidies for Industry 4.0 technologies, the mix of policy instruments should reflect this capabilities escalator (Cirera and Maloney, 2017).
To realize the promise of Industry 4.0, the system of certifying quality standards will become central to participating in global value chains. With more complex products and processes, improving quality infrastructure systems can facilitate opportunities for export-led manufacturing to the extent that certification of internationally recognized standards enables firms to sell in major markets. New technologies may also change the content of some standards and increase the pressures to meet them. For example, quality infrastructure is increasingly embedded in the physical and software components of deeply interconnected manufacturing processes associated with Industry 4.0: sensor-based applications, control systems, and continuous monitoring devices.
The development of a data ecosystem, including regulatory frameworks to support cross-border data flows,willalsobecomeincreasinglyimportant.With an increasing emphasis on the use of data processes in production, issues relating to intellectual property rights, data security, and privacy must be addressed for firms to adopt these data-driven technologies. As new technologies create forms of international trade, new rules on cross-border data flows will also need to emerge. With “smart” production processes enabled by the IoT, restrictions on cross-border data flows will affect the ability of firms to use many of these technologies associated with Industry 4.0. At the same time, the agenda on intellectual property rights and privacy concerns will likely be emphasized more, given the risks for firms and consumers with these cross-border data flows. Regional and bilateral trade
98 PART II. MEDIUM-TERM DEVELOPMENT AGENDA
EAST ASIA AND PACIFIC ECONOMIC UPDATE APRIL 2018

agreements are increasingly covering a range of nontariff measures including “deep” provisions in policy areas such as data protection (Hofmann, Osnago, and Ruta 2017).
� A country typology: Mapping East Asian countries in the 3Cs space
An illustration of how countries perform across these three dimensions highlights the relative preparedness of countries in East Asia compared to other regions. Figure II.B.9—in which the axes represent countries’ capabilities and connectedness and the color of their markers indicates their levels of competitiveness—highlights how these 3Cs vary across countries. A country’s competitiveness combines the dimensions of ease of doing business, rule of law, and use of mobile technologies to complete financial transactions. A country’s capabilities to support technology diffusion and innovation combine the dimensions of ICT use, tertiary school enrollment rates, and the share of royalty payments and receipts in trade. A country’s connectedness to markets combines the dimensions of logistics performance, restrictions on trade in manufactured goods, and restrictions on trade in professional services. For each summary measure, these relevant indicators are converted to z-scores to normalize their scales and are then averaged. On the capabilities and connectedness indexes, countries are categorized as “high” or “low” based on the median z-score value. On the competitiveness index, countries are categorized as “high,” “medium,” or “low” (shown by the color shading of the markers) based on partitioning the data into terciles.
China is the only country in the region to combine greater capabilities to support technology diffusion and innovation and better connectedness to trade and complementary services, while most others are neither as technology-ready nor trade-ready. All but one country in the high capabilities–high connectedness (upper right) quadrant in Figure II.B.9 are also in the high or medium tercile for competitiveness and thus are likely to be better placed to address the higher requirements that changes in technology, trade, and increased servicification may bring. China is among this set, comprising largely high-income countries. On the flip side, Indonesia, the Philippines, Cambodia, Lao PDR, and Myanmar are among a large set of low- and middle-income countries in the lower left (low capabilities–low connectedness) quadrant that are also in the low or medium tercile for competitiveness. Here, the rising bar will be particularly challenging. Malaysia is the only country in this lower-left quadrant that is included in the top tercile for competitiveness. Few countries have high capabilities but low connectedness (upper-left quadrant), while many more have low capabilities but high connectedness (lower-right quadrant). Thailand falls among the former, and Vietnam among the latter.
� Mapping the 3Cs to combinations of trends in different subsectors highlights country priorities for reform
The trends of automation, shifting trade patterns and export concentration, and servicification haveimplications for likely priorities in the 3Cs agenda. Table II.B.2 links these sets of trends to what they are likely to imply for demands on the 3Cs. The trends do not map one-for-one to each of the 3Cs, but there are some associations. The closest association is between the adoption of new technologies and “capabilities.” However, if countries can compete using traditional technologies, they may not need to have the same “capabilities,” but they would need to be much stronger in “competitiveness” and “connectedness” to be viable (at least in the short to medium term). International concentration in trade is associated with rising demands on both “connectedness” and “competitiveness,” if the sector is one characterized by international trade. The last trend is services intensity,
II.B. THE FUTURE OF MANUFACTURING-LED DEVELOPMENT IN EAST ASIA 99
ENHANCING POTENTIAL

which is most closely tied with “competitiveness”— the ability to have the complementary elements of professional services in the ecosystem for manufacturing to take place successfully. To the extent that these services can be traded, services intensity could also be linked to “connectedness,” particularly if services are embodied in a widely traded good.
Table II.B.2. New pressures differentially affecting feasibility of subsectors going forward – and the priorities they raise in the 3Cs agenda
Extent of impacts of new technology and globalization Priorities within 3Cs agendaSectors (grouped by the common combinations of trends they face)
Increasing concen-tration of inter-national
production
Traded Robots/3D printers
Use of Services
Com
peti
tive
ness
Capa
bilit
ies
Conn
ecte
dnes
s
Transportation High High High High
Yes Yesa Yes
Electronics High High High HighPharmaceuticals High High High HighElectrical machinery High High High HighMachinery and equipment High High High Lowb
Manufacturing n.e.c. High High High Lowb
Textiles High High Low Low Yes YesRubber and plastics Low Rising High Low
YesFabricated metals Low Rising High LowFood Low Low Low High
YesChemicals Low Low Low HighCoke and refined petroleum Low Low Low HighWood products Low Low Low LowPaper products Low Low Low LowBasic metals Low Low Low LowNonmetalic minerals High Low Low LowSource: Hallward-Driemeier and Nayyar (2017). Note: If countries want to use smart factories for any of the sectors, they need to address all 3Cs. a. It may not be necessary to have high capabilities if countries can still compete with older technologies, but competitiveness will need to be high. b. While the need for services is lower, the openness to trade and concentration in trade makes competitiveness important.
Countries’ position in the 3Cs space may not be compatible with the magnitude of automation, trade concentration, and services intensity that characterize sectors where the bar is rising to be a competitive production location. Given high tradedness, export concentration, exposure to new technology, and services intensity, a strong performance on each of the 3Cs is expected to be needed for transportation equipment, electronics, pharmaceuticals, electrical machinery, machinery and equipment n.e.c., and other manufacturing n.e.c.18 Thus, all countries not in the upper-right quadrant and not gray (high in competitiveness) in Figure II.B.9 are at risk of displacement. This includes all developing economies in East Asia. Vietnam, for example, needs to address the capabilities gaps if it wants to use more of the new processes, or combine its current high connectedness with better competitiveness (compared to its current position of medium competitiveness) to make competing while using traditional technologies viable (at least in the short to medium term). Malaysia, in the lower-left quadrant, too, could either improve its capabilities or combine its current high competitiveness (gray) with better connectedness to compete while using traditional technologies. The textiles, garments, and footwear
18 Three of the six sectors are not characterized by high services intensity, but, because they are traded and concentration is high, the need for competitiveness in the business environment is likely to be high over time, as well.
100 PART II. MEDIUM-TERM DEVELOPMENT AGENDA
EAST ASIA AND PACIFIC ECONOMIC UPDATE APRIL 2018

subsector is highly traded and exports are concentrated, but there is little exposure to automation. Therefore, capabilities matter less, but competition from trade means that low wages are not sufficient and more needs to be done to improve the competitive environment and connectivity. Here, Vietnam is not at risk of displacement because it combines high connectedness with medium competitiveness. At the same time, Cambodia, with its low connectedness and low competitiveness, is likely to face greater challenges.
Conclusion
Strengthening the 3Cs—competitiveness, capabilities, and connectedness—becomes increasinglyimportant for countries to adapt, but the reform agenda—including in developing East Asia—needssome reconceptualization in the face of coming changes. Technological advances and changing globalization patterns reinforce the urgency in some elements of the traditional reform agenda, but they also introduce a new understanding of why each of the 3Cs is important and thus why new agenda items need to be added. That is:
• Ensuring competitiveness will increase the urgency of reforms that lower unit labor costs, but also put more emphasis on ensuring that institutional frameworks support new business models, new contracting relationships to use technology, and new ways that manufacturing goods deliver services.
• Building capabilities will add to workers’ skills, strengthen firms’ abilities to absorb new technologies, and provide the new infrastructure and rules needed to use them.
• Strengthening connectedness will continue to encompass openness to trade in goods and logistics performance, but also will raise the importance of accessing the growing synergies of services as embodied and embedded features of goods.
The identification of policy priorities within thisreform agenda will also require customization across countries. Countries vary in their levels of competitiveness, capabilities, and connectedness. Further, given existing patterns of specialization across different manufacturing subsectors, countries may need to emphasize certain parts of the 3Cs agenda, depending on how changing technology and globalization patterns differentially affect certain subsectors. For example, if a subsector is expected to need higher capabilities, countries that are active in the sector should likely prioritize strengthening their capabilities to maintain or expand their position in the subsector.
There is still considerable scope for developing countries in East Asia to rely on manufacturing-led development, but challenges are mounting given changing technologies and shifting globalization
FigureII.B.9.Country distribution in competitiveness, capabilities, and connectedness, by manufacturing subsector scenario, circa 2012–14Capability
2.0
1.5
1.0
0.5
0
-0.5
-1.0
-1.5
-1.5 -1.0 -0.5 0 0.5 1.0 1.5
USA
KORJPN
SGP
AUSDEU
HKG
THA CHN
VNMIDN
MYSPHL
KHMPNG
Connectedness
Q High competitiveness Q Medium competitiveness Q Low competitiveness
Sources: Calculations based on Kee, Nicita, and Olarreaga (2009); Borchert, Gootiiz, and Mattoo (2014); International Telecommunications Union’s ICT Indicators Database; and the following World Bank databases: World Development Indicators, Worldwide Governance Indicators, Global Findex, and Logistics Performance Index.
II.B. THE FUTURE OF MANUFACTURING-LED DEVELOPMENT IN EAST ASIA 101
ENHANCING POTENTIAL

patterns. Change is coming. But the rate varies across subsectors. This provides a window of opportunity where countries can continue to compete using existing business models and technologies. Countries should use this window to address the “3Cs” and ensure that they position themselves to take advantage of new opportunities as technologies diffuse. Change may be disruptive, but not being able to access and use new technologies is likely to be much more costly. Alarmism is neither constructive nor necessary, but there is an urgency to this agenda in preparing countries for new sources of productivity and job creation going forward.
102 PART II. MEDIUM-TERM DEVELOPMENT AGENDA
EAST ASIA AND PACIFIC ECONOMIC UPDATE APRIL 2018

Bibliography
Akamatsu, Kaname. 1962. “A Historical Pattern of Economic Growth in Developing Countries.” The Developing Economies 1 (s1): 3–25.
Arvis, Jean-Francois, Paul E. Kent, Ben Shepherd, and Rajiv Nair. 2017. “Additive Manufacturing and the Diffusion of 3D Printing: Impact on International Trade.” Unpublished manuscript. World Bank, Washington, DC.
Assembly Magazine. 2012. “Automation Profiles: Robots Help Philips Shave Assembly Costs.” Assembly Magazine, June 1.
Bamber, Penny, Olivier Cattaneo, Karina Fernandez-Stark, Gary Gereffi, Erik van der Marel, and Ben Shepherd. 2017. “Diversification through Servicification.” Unpublished manuscript. World Bank, Washington, DC.
Barro, Robert, and Jong-Wha Lee. 2013. “A New Data Set of Educational Attainment in the World, 1950–2010.” Journal of Development Economics 104 (C): 184–198.
Bloomberg Technology. 2012. “China No Match for Dutch Plants as Philips Shavers Come Home.” Bloomberg Technology, January 19. http:// www.bloomberg.com/news/articles/2012-01-19/china-no-match- for -dutch-plants-as-philips-shavers-come-home-1-.
Boffa, Mauro, Gianluca Santoni, and Daria Taglioni. 2017. “From China with Love.” Unpublished manuscript. World Bank, Washington, DC.
Borchert, Ingo, Batshur Gootiiz, and Aaditya Mattoo. 2014. Policy Barriers to International Trade in Services: Evidence from a New Database, World Bank Economic Review, vol. 28(1), 162-188.
Cirera, Xavier, Marcio Cruz, Stefan Beisswenger, and Gregor Schueler. 2017. “Technology Adoption in Developing Countries in the Age of Industry 4.0.” Unpublished manuscript, World Bank, Washington, DC.
Cirera, Xavier, and William F. Maloney. 2017. The Innovation Paradox: Developing Country Capabilities and the Unrealized Promise of Technological Catch-up. Washington, DC: World Bank.
Citigroup. 2016. “Technology at Work v2.0: The Future Is Not What It Used to Be.” Citi GPS: Global Perspectives & Solutions. Joint Report with Oxford Martin School.
Comin, Diego A., and Martí Mestieri Ferrer. 2013. “If Technology Has Arrived Everywhere, Why Has Income Diverged?” NBER Working Paper 19010, National Bureau of Economic Research, Cambridge, MA.
Constantinescu, Cristina, Aaditya Mattoo, and Michele Ruta. 2017. “Trade Developments in 2016: Policy Uncertainty Weighs on World Trade.” Global Trade Watch, February 21. World Bank, Washington, DC.
———. 2017. Forthcoming. “The Global Trade Slowdown: Cyclical or Structural?” World Bank Economic Review.
Cruz, Marcio, and Gaurav Nayyar. 2017. “Manufacturing and Development: What Has Changed?” Unpublished manuscript. World Bank, Washington, DC.
Dasgupta S. and Singh A. 2007 Manufacturing, Services and Premature Deindustrialization in Developing Countries: A Kaldorian Analysis. In: Mavrotas G., Shorrocks A. (eds) Advancing Development. Studies in Development Economics and Policy. Palgrave Macmillan, London
De Backer, Koen, Carlo Menon, Isabelle Desnoyers-James, and Laurent Moussiegt. 2016. “Reshoring: Myth or Reality?” OECD Science, Technology, and Industry Policy Paper No. 27. Organisation for Economic Co-operation and Development, Paris.
Demas, A., M. M. Khan, and G. Arcia. Forthcoming. “Delivery of Education Services in Lao PDR: Results of the SABER Service Delivery Survey, 2017.” World Bank, Washington, DC.
BIBLIOGRAPHY 103
ENHANCING POTENTIAL

Denboba, A., R. Sayre, Q. Wodon, L. Elder, L. Rawlings, and J. Lombardi 2014. Stepping Up Early Childhood Development: Investing in Young Children for High Returns. Washington, DC: World Bank.
Devlin, Robert, and Graciela Moguillansky. 2011. Breeding Latin American Tigers: Operational Principles for Rehabilitating Industrial Policies in the Region. Washington, DC: World Bank.
Devlin, Robert, Antoni Estevadeordal, and Andrés Rodríguez-Clare, eds. 2006. The Emergence of China: Opportunities and Challenges for Latin America and the Caribbean. Washington, DC: Inter-American Development Bank.
Di Gropello, E., and C. Sakellariou. 2010. “Industry and Skill Wage Premiums in East Asia.” Policy Research Working Paper 5379, World Bank, Washington, DC.
Dinh, Hinh T., Vincent Palmade, Vandana Chandra, and Frances Cossar. 2012. Light Manufacturing in Africa: Targeted Policies to Enhance Private Investment and Create Jobs. Africa Development Forum Series. Washington, DC: World Bank.
Driskell, N. 2014. “Global Perspectives: Explaining Taiwan’s Dramatic Improvement in PISA Reading.” National Center on Education and the Economy, Washington, DC. http://ncee.org/2014/10/global-perspectives-explaining-taiwans-dramatic-improvement-in-pisa-reading/.
Economist. 2017a. “3D Printers Will Change Manufacturing,” June 29.
———. 2017b. “3D Printers Start to Build Factories of the Future,” June 29.
Ferreras, Ana, Cathy Kessel, and Myong-Hi Kim. 2015. Mathematics Curriculum, Teacher Professionalism, and Supporting Policies in Korea and the United States: Summary of a Workshop. Washington, DC: The National Academies Press.
Financial Times. 2016. “Robot Revolution Helps Adidas Bring Shoemaking Back to Germany,” June 8.
Gereffi, Gary, and Donald L. Wyman, eds. 2014. Manufacturing Miracles: Paths of Industrialization in Latin America and East Asia. Princeton, NJ: Princeton University Press.
Graham, Jimmy, and Sean Kelly. 2017. “Early Grade Reading in East Asia and the Pacific.” Background paper for Growing Smarter: Learning and Equitable Development in East Asia and Pacific. World Bank, Washington, DC.
Hallward-Driemeier, Mary C., and Gaurav Nayyar. 2017. Trouble in the Making? The Future of Manufacturing-Led Development. Washington, DC: World Bank.
Haugh, David, Yosuke Jin, and Alberto González Pandiella. 2016. “Growing Together: Towards a More Inclusive Ireland.” OECD Economic Department Working Paper No. 1293, Organisation for Economic Co-operation and Development, Paris.
Ho, E. S.-C. 2012. “Student Learning Assessment.” UNESCO, Paris. http://www.unescobkk.org/fileadmin/user_upload/epr/Quality/SLA_8August-final.pdf.
Hofmann, Claudia, Alberto Osnago, and Michele Ruta. 2017. “Horizontal Depth: A New Database on the Content of Preferential Trade Agreements.” Policy Research Working Paper 7981, World Bank, Washington, DC.
Jimenez, Emmanuel, Vy Nguyen, and Harry Anthony Patrinos. 2012. “Stuck in the Middle? Human Capital Development and Economic Growth in Malaysia and Thailand.” Policy Research Working Paper 6283, World Bank, Washington, DC. http://dx.doi.org/10.1596/1813-9450-6283.
Kee, Hiau Looi, and Heiwai Tang. 2015. “Domestic Value Added in Exports: Theory and Firm Evidence from China.” Policy Research Working Paper 7491, World Bank, Washington, DC.
Leipziger, Danny M., ed. 1997. Lessons from East Asia. Ann Arbor: University of Michigan Press.
Lendle, Andreas, and Marcelo Olarreaga. 2017. “Can Online Markets Make Trade More Inclusive?” ADBI Working Paper No. 742, Asian Development Bank Institute, Tokyo.
104 PART II. MEDIUM-TERM DEVELOPMENT AGENDA
EAST ASIA AND PACIFIC ECONOMIC UPDATE APRIL 2018

Liang, Xiaoyan, Huma Kidwai, and Minxuan Zhang. 2016. How Shanghai Does It: Insights and Lessons from the Highest-Ranking Education System in the World. Washington, DC: World Bank.
National Center on Education and the Economy. n.d. “Singapore Overview.” http://ncee.org/what-we-do/center-on-international-education-benchmarking/top-performing-countries/singapore-overview-2/.
OECD (Organisation for Economic Co-operation and Development). 2012. PISA 2012 Results Key Findings: Volume II. Paris: OECD Publishing.
———. 2016a. Education in China: A Snapshot. Paris: OECD Publishing.
———. 2016b. Low-Performing Students: Why They Fall Behind and How to Help Them Succeed. Paris: OECD Publishing. Http://dx.doi.org/10.1787/9789264250246-en.
———. 2016c. “Starting Strong IV: Monitoring Quality in Early Childhood Education and Care Country Note: Korea.” OECD Publishing, Paris.
———. 2016d. Low-Performing Students: Why They Fall Behind and How To Help Them Succeed. Paris: OECD Publishing. http://dx.doi.org/10.1787/9789264250246-en.
———. 2016–17. PISA 2015 Results. 5 volumes. Paris: OECD Publishing.
Osnago, Alberto, and Shawn W. Tan. 2016. “Disaggregating the Impact of the Internet on International Trade.” Policy Research Working Paper 7785, World Bank, Washington, DC.
Patrinos, H. A. 2016. “Investing in Early Years Learning: It Can Be Done!” Education for Global Development (blog). World Bank, Washington, DC. http://blogs.worldbank.org/education/investing-early-years-learning-it-can-be-done.
Qin, Amy. 2017. “Britain Turns to Chinese Textbooks to Improve its Math Scores,” New York Times, August 5.
Rodrik, D. 1994. “King Kong Meets Godzilla: The World Bank and the East Asian Miracle.” Discussion Paper No. 944, Centre for Economic Policy Research, London.
———. 2015. Premature Deindustrialization, NBER Working Paper No. 20935
South China Morning Post. 2015. “Rise of the Robots: 60,000 Workers Culled from Just One Factory as China’s Struggling Electronics Hub Turns to Artificial Intelligence,” September 21.
Standard Chartered Global Research. 2016. “Global Supply Chains: New Directions.” Special Report. Standard Chartered Global Research, London.
Stiglitz, Joseph E., and Shahid Yusuf, eds. 2001. Rethinking the East Asian Miracle. New York: Oxford University Press.
Sui-chu Ho, Esther. 2012. Student Learning Assessment. Paris: UNESCO. http://www.unescobkk.org/fileadmin/user_upload/epr/Quality/SLA_8August-final.pdf.
Tan, Steven K. S., and Angela F. L. Wong. 2007. “The Qualifications of the Teaching Force: Data from Singapore.” In A Comparative Study of Teacher Preparation and Qualification in Six Nations, edited by Richard E. Ingersoll. Philadelphia: Consortium for Policy Research in Education, pp. 71 – 82. http://www.cpre.org/images/stories/cpre_pdfs/sixnations_final.pdf.
Timmer, Marcel P., Erik Dietzenbacher, Bart Los, Robert Stehrer, and Gaaitzen J. de Vries. 2015. “An Illustrated User Guide to the World Input–Output Database: the Case of Global Automotive Production.” Review of International Economics 23 (3): 575–605.
TIMSS (Trends in International Mathematics and Sciences Study). 2015. “TIMSS 2015 International Database.” https://timssandpirls.bc.edu/timss2015/international-database/.
BIBLIOGRAPHY 105
ENHANCING POTENTIAL

Wong, Anny. 2017. “Insights from East Asia’s High Performing Education Systems: Leadership, Pragmatism and Continuous Improvement.” Background paper for Growing Smarter: Learning and Equitable Development in East Asia and Pacific. World Bank Washington, DC.
World Bank. 2009. “Investing in Indonesia’s Education at the District Level: An Analysis of Regional Public Expenditure and Financial Management.” World Bank, Washington, DC.
———. 2015. Thailand: Wanted, A Quality Education for All. Washington, DC: World Bank. https://openknowledge.worldbank.org/handle/10986/22355.
———. 2016a. Assessing Basic Education Service Delivery in the Philippines: Public Education Expenditure Tracking and Quantitative Service Delivery Study. Washington, DC: World Bank.
———. 2016b. World Development Report: Digital Dividends. Washington, DC: World Bank.
———. 2018. Growing Smarter: Learning and Equitable Development in East Asia and Pacific. Washington, DC: World Bank. https://openknowledge.worldbank.org/handle/10986/29365.
———. Various years. Educational Statistics (EdStats) database. World Bank, Washington, DC
106 PART II. MEDIUM-TERM DEVELOPMENT AGENDA
EAST ASIA AND PACIFIC ECONOMIC UPDATE APRIL 2018

Part III. Country Summaries and Key Indicators
107
WORLD BANK EAST ASIA AND PACIFIC ECONOMIC UPDATE APRIL 2018

CAMBODIA
2017Population, million 16.1GDP, US$ billion 22.1GDP per capita, US$ 1,375School enrolment rate, primary (% gross)a 116.7Life expectancy at birth, yearsa 68.5Sources: World Bank WDI, Macro Poverty Outlook, and official data.Notes: a. Most recent WDI value (2015).
Summary
Cambodia’s economy continues to grow robustly, albeit at a modestly declining trend. Real growth is estimated to have eased slightly to 6.8 percent in 2017 (Figure 1). Following substantial moderation, textile and apparel exports rebounded. The tourism and agriculture sectors continued their recovery. Growth is projected to remain strong, expanding at 6.9 percent in 2018. Downside risks to the outlook include erosion of export competitiveness due to rapidly rising real wages, risks associated with prolonged construction boom, and potential election-related uncertainty.
Recent Developments
Growth is estimated to have eased slightly to 6.8 percent in 2017, according to the preliminary data from the authorities. Strong global demand helped contribute to a recovery in garment exports during the second half of 2017. Textile and apparel exports to the European
Union (including United Kingdom) accelerated at a whopping 19.6 percent year-on-year (y/y) by December 2017, compared with only 7.5 percent in July 2017. Overall, textile and apparel product exports growth eased only slightly to 7.7 percent in 2017, compared with 8.4 percent in 2016. Tourist arrivals number grew by 11.8 percent in 2017, compared with 5 percent in 2016, thanks to the authorities’ efforts to attract Chinese tourists by introducing the “China-ready” initiative. The output in agriculture sector recovered with the expansion of rice and rubber plantation, owing to favorable weather conditions and gradual recovery of agricultural commodity prices.
Private consumption has eased, subduing inflation. Slower domestic credit growth contained private consumption which in turn dampened import growth. As a result, inflation declined to 2.2 percent at the end of 2017, compared with 3.9 percent in 2016. Following the introduction of an 18 percent interest rate cap in April 2017, credit growth decelerated. Credit to the construction and real estate sector, however, accelerated again during the second half of 2017, growing at 37.1 percent in November 2017, up from 28.4 percent in May 2017, as appetite for construction and real estate investment revived.
Thanks to continued solid export growth and softer import demand, the current account deficit narrowed. The moderation in domestic demand resulted in a slowdown in imports growth. The current account deficit slightly declined to 9.8 percent of GDP, compared to 10.2 percent of GDP in 2016, and was entirely financed by FDI inflows. Improved confidence boosted bank deposits, largely in US dollars, which grew at 23.3 percent y/y in December 2017. Gross foreign reserves further accumulated, reaching US$ 8.7 billion or 6 months of imports in 2017. The Cambodian riel (CR) which is pegged to the US dollar remained stable at CR 4,010 per US dollar at the end of February 2018.
The authorities’ decision to boost wages of civil servants increased spending, but its effect on fiscal deficit was
EAST ASIA AND PACIFIC ECONOMIC UPDATE APRIL 2018
108 CAMBODIA

neutralized by strong revenue collection. Public sector wages continued to increase in 2018, and are expected to reach 8.4 percent of GDP. However, exceptionally strong revenue collection in 2017, stemming largely from increased tax compliance, helped contain the deficit. The fiscal deficit (excluding grants) is estimated to have narrowed to 2.7 percent of GDP in 2017, compared to 3.6 percent in 2016. Cambodia’s debt distress level remained low as per the 2017 WB/IMF Debt Sustainability Analysis.
Outlook
Cambodia’s high growth trajectory is expected to continue. Real growth is projected to reach 6.9 percent in 2018, and decelerate at a modest pace in the short- and medium-term. Growth in 2018 is expected to be underpinned by rising government spending and favorable global conditions, including robust demand in advanced economies. In the medium term, large FDI flows and public investment in infrastructure are expected to help promote output by boosting aggregate demand and expanding the productive capacity of the economy.
Downside risks to the outlook include threats associated with a prolonged construction boom, potential uncertainty related to the July 2018 general elections, and declining external competitiveness. In addition, employment growth prospects look less certain. As real wages rapidly increase, Cambodia’s external competitiveness, which primarily relies on cheap labor, is being eroded.
Risks and Challenges
A skilled labor force, with higher productivity, would help compensate for rapidly rising real wages. Addressing skills constraints, as envisioned in the 2017–25 National Technical and Vocational Education and Training Policy, is a priority. Greater coordination
among public and private entities will be essential to the successful implementation of this framework.
Lifting the constraints to small- and medium-sized enterprises and businesses can support growth and job creation. It is important to reduce the costs to firm formalization, operation, and financing, while providing access to incentives and support programs. Fostering domestic investment, including in agro-processing, could also help strengthen linkages to foreign owned businesses and exporters.
The ongoing construction and real estate boom needs close monitoring. Credit growth directed to the construction and real estate sector has accelerated in recent years. It is therefore necessary to reduce the scope for speculative activities. In the banking and microfinance sectors, it is crucial to adopt lending guidelines and ensure adequate monitoring, while revisiting the non-performing loan classifications.
ENHANCING POTENTIAL
CAMBODIA 109

CAMBODIA Selected Indicators 2015 2016 2017e 2018f 2019f 2020f
Real GDP growth, at constant market prices 7.0 7.0 6.8 6.9 6.7 6.6Private Consumption 5.9 6.7 4.6 4.3 4.0 4.6Government Consumption 4.4 5.7 6.5 10.6 3.3 4.4Gross Fixed Capital Investment 10.6 10.1 6.1 10.5 10.6 8.0Exports, Goods and Services 7.2 8.6 5.3 7.2 8.3 8.5Imports, Goods and Services 6.5 8.6 4.1 6.4 7.0 7.2
Real GDP growth, at constant factor prices 6.9 6.9 6.7 6.8 6.6 6.6Agriculture 0.2 1.4 1.7 1.1 1.0 1.0Industry 11.7 10.5 9.9 8.2 7.1 7.7Services 7.1 6.8 6.6 8.3 8.9 8.0
Inflation (Consumer Price Index) 1.3 3.5 3.4 3.2 3.4 3.3Current Account Balance (% of GDP) -11.5 -10.2 -9.8 -9.4 -9.2 -9.9Financial and Capital Account (% of GDP) 14.2 14.3 13.7 14.3 13.9 14.0
Net Foreign Direct Investment (% of GDP) 9.1 10.8 10.8 10.9 10.6 10.5Fiscal Balance (% of GDP) -3.5 -3.6 -2.7 -5.9 -5.4 -5.3Debt (% of GDP) 31.3 32.4 33.8 35.3 36.1 36.7Primary Balance (% of GDP) -3.2 -3.1 -2.3 -5.6 -5.0 -4.9Source: World Bank, Poverty & Equity and Macroeconomics, Trade & Investment Global Practices.Notes: e = estimate, f = forecast.
Figure 1. Real GDP growth, contribution to real growth Figure 2. Clothing and other textile products export growth
Percent Percent change
8
6
4
2
-2
0
20112010 2012 2013 2014 2015 2016 2017p
100
80
60
40
20
-40
0
-20
Mar-06
Mar-07
Mar-08
Mar-09
Mar-10
Mar-11
Mar-12
Mar-13
Mar-14
Mar-15
Mar-16
Mar-17
J Agriculture J Garment/footw. J Construction J Real estate J Other manuf. ▬ Total ▬ US ▬ EU (including UK)
J Trade J Other services J Taxes less subsidies ▬ GDP growth Source: Cambodian authorities.
Source: National Institutes of Statistics.
EAST ASIA AND PACIFIC ECONOMIC UPDATE APRIL 2018
110 CAMBODIA

CHINA
2017Population, million 1,384GDP, current US$ billion 11,987.0GDP per capita, current US$ 8,661International poverty rate ($1.9)a 1.4Lower middle-income poverty rate ($3.2)a 9.5Upper middle-income poverty rate ($5.5)a 31.5School enrolment, primary (% gross)b 104.1Life expectancy at birth, yearsb 76.1Source: WDI, Macro Poverty Outlook, and official data.Notes: (a) Most recent value (2014), 2011 PPPs. (b) Most recent WDI value (2015).
Summary
Supported by improving external conditions and greater domestic business confidence, GDP growth accelerated to 6.9 percent in 2017. Growth is projected to moderate in 2018–20, as credit growth is being tightened, excess capacity lowered, and rebalancing continues. Poverty reduction is expected to continue, with the extreme poverty rate projected to decline to 0.3 percent by 2020. The Government has prioritized over the short and medium term the quality over quantity of economic growth and to reduce macroeconomic vulnerabilities.
Recent Developments
China’s growth remains robust and economic rebalancing continues. GDP growth accelerated to 6.9 percent in 2017, from 6.7 percent in 2016, aided by a synchronous global economic recovery and greater
business confidence at home. Sharp increase in net exports contributed significantly to higher GDP growth in 2017. Consistent with economic rebalancing, growth was concentrated primarily in services, which grew by 8 percent, while industry expanded by 6.1 percent in 2017. In addition, the composition of growth continued to shift from manufacturing, real estate and financial services to emerging sectors, such as IT (26 percent growth) and leasing services (11 percent growth).
China’s economic resilience has been reflected in rising incomes and job creation. In 2017, average real household disposable income per capita grew by 7.3 percent, up from 6.3 percent in the previous year, and exceeding the pace of GDP growth. The growth was faster in rural areas (7.3 percent) than in urban areas (6.5 percent). The main source of income growth was wages. In 2017, 13.5 million new urban jobs were created (gross), compared with 13.1 in 2016. Consequently, household consumption expenditures have also increased in rural (6.8 percent) and urban areas (4.1 percent) in 2017, consistent with sustained growth in standards of living and the narrowing of rural-urban income differentials.
Regulatory changes in 2017 had some success in reducing credit growth. Growth in total credit to the non-financial sector was 13.5 percent in 2017, down from 15.7 percent in 2016. Slowing down the pace of growth of shadow financing was a regulatory priority. This is partly visible in much slower growth in commercial bank assets during 2017. Commercial bank assets expanded at an 8.6 percent annual pace during this time, as compared to 16.5 percent during 2016. China also launched a renewed effort to regulate effectively subnational debt with stronger measures to implement the 2014 Budget Reform and establish more comprehensive debt monitoring and management system.
After two years of significant outflows, net capital flows in China stabilized in 2017. Capital outflows in 2017 were estimated at US$ 80.5 billion (or 0.7 percent of
ENHANCING POTENTIAL
CHINA 111

GDP), as compared to US$ 647 billion (5.8 percent of GDP) and US$ 640 billion (or 5.7 percent of GDP) in 2015 and 2016, respectively. In the context of broad US dollar depreciation, the Renminbi appreciated by 6.7 percent against the US dollar and remained stable against the official trade-weighted basket of currencies in 2017.
Outlook
Growth is forecast to moderate to 6.5 percent in 2018, and further to 6.3 and 6.2 percent in 2019–20 in the context of tighter macroeconomic policy, more moderate growth in global trade, and continuing reforms to address overcapacity in a number of industries and alleviate vulnerabilities built up since the global financial crisis. Rebalancing toward more consumption-and-services-led growth is also expected to continue.
Poverty rates are expected to continue to decline. Using the international poverty line ($1.9/ day 2011PPP) poverty rates are forecasted to continue falling from 0.6 to 0.3 percent between 2017 and 2020. Using the poverty lines of US 3.2/day and $ 5.5/day, perhaps more appropriate for a country with the income levels of China, poverty rates are projected to be 2.6 and 14.6 percent, respectively, by 2020.
Risks and Challenges
The key downside risk to the outlook is related to the rising, albeit at a slower pace, leverage of the nonfinancial sector. Despite the recent slowdown, credit continues to grow considerably faster than GDP. Total credit to the non-financial sector, including central and local government, stood at 245 percent of GDP in 2017, about 100 percent higher than before the global financial crisis. The economic resilience of recent quarters offers the authorities an opportunity to accelerate deleveraging. As demonstrated throughout
2017, financial stability is a top policy priority for the authorities.
Despite recent improvement in the international environment, there are also external risks to China’s outlook. An upside risk is the possibility of a stronger than expected recovery in advanced countries. Downside risks include the possibility of more restrictive trade policies and heightened geopolitical tensions. The uncertainty associated with the withdrawal of accommodative monetary policies in high-income economies may contribute to less favorable global financing conditions for emerging markets. This could affect China through lower net capital inflows and higher interest rates. To limit external risks of protectionist measures, China could open further to global trade and investment flows, and further clarify its exchange rate and capital control policies.
In terms of China’s economic transition, the authorities have articulated well the structural reforms needed to support rebalancing and sustain strong economic growth (e.g., in the 13th Five Year Plan). Until 2017 reform implementation was mixed but picked up encouragingly last year. While significant progress has already been achieved in some areas, such as the regulation of financial markets and fiscal reform, deeper reforms are needed to increase the role of markets and the private sector, competition, and domestic consumption in driving productivity-led and greener growth in the future. In this light, China’s leadership has currently prioritized the quality over the quantity of economic growth for the near and medium term, with particular emphasis on reducing financial risks, eradicating poverty, and improving the environment.
Poverty rates using the international poverty line are low in China. The country has embarked on an ambitious strategy to eliminate extreme poverty by 2020. Addressing still high inequality is another challenge. Promotion of migration and improvements in social services, including social protection, can contribute to the achievement of more equitable sustained growth.
EAST ASIA AND PACIFIC ECONOMIC UPDATE APRIL 2018
112 CHINA

Figure 1. Real GDP growth and contributions to real GDP growth
Figure 2. Poverty rates, estimates and projections
Percentage points Poverty rate, percent
8
7
6
5
4
3
2
1
-1
0
2012 2013 2014 2015 2016 2017 2018f 2019f 2020f
10
9
8
7
6
5
4
3
2
1
0
2014 2015 2016 2017 2018f 2019f 2020f
J Private consumption J Government consumption J Gross capital formation ▬ Poverty line $1.90 a day ▬ Poverty line $3.20 a day
J Net exports J Statistical discrepancy ▬ GDP Sources: National Bureau of Statistics; World Bank estimates.
Sources: National Bureau of Statistics; World Bank estimates.
CHINA Selected Indicators 2015 2016 2017e 2018f 2019f 2020f
Real GDP growth, at constant market prices 6.9 6.7 6.9 6.5 6.3 6.2Private Consumption 7.4 8.6 7.0 7.4 7.2 7.1Government Consumption 9.7 8.8 8.1 8.2 7.7 7.5Gross Fixed Capital Investment 7.0 6.7 5.5 5.5 5.3 5.2Exports, Goods and Services -0.9 2.1 8.0 7.2 6.0 5.3Imports, Goods and Services -0.6 6.1 7.1 6.5 6.1 5.6
Real GDP growth, at constant factor prices 6.9 6.7 6.8 6.5 6.3 6.2Agriculture 3.9 3.3 3.9 3.3 3.3 3.3Industry 6.2 6.3 6.1 5.7 5.5 5.4Services 8.0 7.6 7.9 7.7 7.4 7.2
Inflation (Consumer Price Index) 1.4 2.0 1.6 2.2 2.3 2.4Current Account Balance (% of GDP) 2.7 1.7 0.9 0.8 0.7 0.6Financial and Capital Account (% of GDP) -0.8 0.4 -0.2 0.3 0.4 0.5
Net Foreign Direct Investment (% of GDP) 0.6 -0.4 0.5 0.5 0.6 0.6Fiscal Balance (% of GDP)a -2.7 -3.2 -3.7 -3.7 -3.3 -3.2Debt (% of GDP) 35.1 35.7 36.6 37.2 37.5 37.7Primary Balance (% of GDP) -1.9 -2.3 -2.6 -2.4 -2.0 -1.9International poverty rate ($1.9 in 2011 PPP)b 1.1 0.8 0.6 0.5 0.4 0.3Lower middle-income poverty rate ($3.2 in 2011 PPP)b 8.2 6.7 5.3 4.2 3.3 2.6Source: World Bank, Poverty & Equity and Macroeconomics, Trade & Investment Global Practices.Notes: e = estimate, f = forecast. (a) The adjusted fiscal balance adds up the public finance budget, the government fund budget, the state capital management fund budget and the social security fund budget. (b) 2014 is actual based on group data provided by China NBS, 2015 onwards are projections using neutral distribution with pass through 0.72.
ENHANCING POTENTIAL
CHINA 113

FIJI
2017Population, million 0.9GDP, current US$ billion 4.8GDP per capita, current US$ 5,328Basic needs poverty ratea 28.1School enrolment, primary (% gross)a 105.5Life expectancy at birth, yearsa 70.1Sources: WDI, Macro Poverty Outlook, and official data.Notes: a) Fiji Bureau of Statistics. Based on income-based National Pov. Most recent WDI value (2015).
Summary
Growth accelerated to 3.8 percent in 2017 from 0.4 percent in 2016 in the wake of Cyclone Winston. Growth was underpinned by cyclone reconstruction, tourism, and agriculture recovery. Inflation eased as shortages were reduced. Fiscal policy remains focused on post-cyclone reconstruction. Downside risks include natural disasters and uncertainties ahead of new elections. Building climate resilience and a supportive business environment are key to supporting an inclusive and resilient economy.
Recent Developments
GDP growth is estimated to have accelerated to 3.8 percent in 2017 from the sharp slowdown in 2016 in the wake of Cyclone Winston in 2016 (0.4 percent) underpinned by reconstruction activities, tourism, and recovery in the agriculture sector—a critical
source of livelihood for many Fijians affected by the cyclone (Figure 1). Visitor arrivals continue to grow, by 6.4 percent in the year to December 2017, led by arrivals from Australia, New Zealand, and the United States. The latest national poverty estimates predate the cyclone, but suggest that 28.1 percent of the population were living below the income-based basic-needs poverty line in 2013–14 (Figure 2).
Annual inflation eased to 1.5 percent in January, down from 2.8 percent in December and much lower than the 6.8 percent recorded a year ago. Compared to January 2017, prices were higher for alcohol and tobacco—reflecting a 15 percent increase in duties in August 2017. Although taxes on alcohol and tobacco tend to hit the poor hardest, international evidence suggests that the poor are more sensitive to price increases and, therefore, are more likely to reduce their consumption and to improve their health. The Fijian dollar has remained broadly stable against a basket of currencies of its main trading partners. In the year to January, it has strengthened against the US and the New Zealand dollars, but weakened against the euro, the Australian dollar and the yen. The real effective exchange rate appreciated over the same period by 1.6 percent.
The current account deficit expanded to an estimated 5.7 percent of GDP in 2017 from 5.0 percent in 2016. Import demand for raw materials and capital equipment continues to be strong as reconstruction activities continue. A large surplus in the services account (relating to tourism and transport) is providing needed offsets. Foreign reserves continue to remain at comfortable levels, at about $2,160 million at end-February, which is sufficient to cover 4.9 months of retained imports.
Deficit in fiscal year 2016–17 was 2.2 percent of GDP, much lower than the 7.3 percent projected in the budget because of delays in reconstruction due to bad weather, supply shortages, and the difficulty of delivering materials to maritime and remote areas. Current expenditure also undershot the budget projection
EAST ASIA AND PACIFIC ECONOMIC UPDATE APRIL 2018
114 FIJI

as both the wage bill and other expenses were lower than expected. The 2017–18 budget remains focused on completing reconstruction, with a planned deficit of 7.9 percent of GDP, mainly reflecting a rollover of capital expenditure from last year, but also increases in the wage bill and social welfare. Wages were increased after a review to realign them with the private sector. Transfers were increased as poverty alleviation schemes became more generous.
Outlook
GDP growth is expected to remain above-trend, moderating to 3.5 percent in 2018 and around 3.0–3.5 percent in the medium term, in line with potential growth. Inflation is expected to increase following increases in excise taxes, public wages, and oil prices. It is projected to average 3.3 percent in 2018 and converge to 3 percent in the medium term.
The current account deficit is projected to decline to 5 percent of GDP in 2018 and to 3.8 percent in 2020, with easing import demand for reconstruction combined with a widening surplus in the services account as Fiji's tourism sector expands and transport services benefit from its position as a transport hub for the Pacific.
The fiscal deficit is projected to decline to more moderate levels in the medium term through a combination of the normalization of post-Winston capital spending, continued effort in revenue mobilization, and greater control of recurrent spending. Removing Winton-related capital spending would save about 2 percent of GDP. Growth in current expenditure, especially the wage bill and transfers, is also expected to moderate after the significant increases in this year’s budget. The ratio of public debt to GDP is projected to rise to 47 percent in 2018 before declining to 45–46 percent by 2020.
Risks and Challenges
There are several risks to the outlook. Potential upside risks include lower-than-expected import commodity prices and stronger-than-expected tourism because of the introduction of three flights a week to Japan from July 2018. Downside risks include another natural disaster and a sharp slowdown in China, which could hit Fiji’s main export and tourism source markets such as Australia, New Zealand, and Japan. Uncertainty ahead of the next general election, which can take place anytime between May and November this year, could slow hard-to-unwind capital investment by the private sector.
The structural reform agenda includes building climate resilience and creating a more supportive environment for private-sector-led growth. Fiji is exposed to frequent natural disasters, causing an average loss of between 2 and 5 percent of GDP. In 2016, Cyclone Winston affected close to two-thirds of the population and caused a loss of nearly a third of GDP. With climate change, the expected losses will increase to 2.5–6.5 percent a year by 2050 (PCRAFI 2015 and Fiji Climate Vulnerability Assessment 2017). Attracting more FDI and expanding the role of the private sector in the economy will require modernizing the legal and regulatory framework. Time spent dealing with multiple approval procedures is raising the costs of doing business, especially for small firms.
ENHANCING POTENTIAL
FIJI 115

Figure 1. Real GDP growth Figure 2. International and national poverty ratesPercent Percent
10
8
6
4
2
-4
0
-2
2012 2014 2016 2018f 2020f20102008200620042002200019981996 2013/142008/92002/3
40
30
20
0
10
▬ Real GDP growth ▬ 5 period moving average ▬ $3.20/day ▬ $1.90/day ▬ Consumption basic needs poverty ▬ Income basic needs poverty
Source: World Development Indicators and staff estimates. Sources: World Development Indicators and staff estimates.
FIJI Selected Indicators 2015 2016 2017e 2018f 2019f 2020f
Real gross domestic product 3.8 0.4 3.8 3.5 3.4 3.3Agriculture 6.3 -9.7 3.8 2.1 2.3 2.3Industry 1.1 -0.7 4.7 3.5 3.1 3.1Services 4.0 2.1 3.7 3.1 3.1 2.9
Inflation (Consumer Price Index) 1.4 3.9 3.4 3.3 3.0 3.0Current Account Balance (% of GDP) -3.6 -5.0 -5.7 -5.0 -4.4 -3.8Fiscal Balance (% of GDP)a -2.3 -4.7 -2.2 -4.5 -3.0 -2.8Source: World Bank, Poverty & Equity and Macroeconomics, Trade & Investment Global Practices.Notes: e = estimate, f = forecast.
EAST ASIA AND PACIFIC ECONOMIC UPDATE APRIL 2018
116 FIJI

INDONESIA
2017Population, million 263.5GDP, current US$ billion 1,015.5GDP per capita, current US$ 3,854International poverty rate ($1.9)a 6.5Lower middle-income poverty rate ($3.2)a 31.1Upper middle-income poverty rate ($5.5)a 62.8Gini coefficienta 38.4School enrolment, primary (% gross)b 105.9Life expectancy at birth, yearsb 69.0Sources: WDI, Macro Poverty Outlook, and official data.Notes: (a) Most recent value (2016), 2011 PPPs; (b) Most recent WDI value (2015).
Summary
Indonesia ended 2017 on a high note, with annual real GDP expanding the fastest in four years, led by stronger investment and net exports. At the same time, the current account deficit narrowed to a six-year low, and the central government budget deficit reached the lowest since 2014, on stronger global trade and commodity prices. Despite weaker commodity prices, the economic outlook continues to be positive on the back strengthening private and government consumption, partly lifted by the upcoming elections.
Recent Developments
Real GDP grew 5.2 percent yoy in Q4, faster than the 5.1 percent in Q3, the highest growth in six quarters. The stronger growth was driven by higher domestic
demand, including stronger investment, and private and government consumption (Figure 1). Despite slowing, export and import growth remained robust due to a sustained recovery in global trade and commodity prices. Net exports, however, were a drag on growth in Q4 as imports grew faster than exports, partly reflecting higher investment in machines and equipment. After significant destocking in Q3, inventories accumulated in Q4, contributing positively to GDP growth. On the production side, manufacturing continued to contribute the most to growth among the nine production sectors, while construction and other services sectors saw the largest growth.
For 2017 as a whole, GDP growth rose to 5.1 percent from 5.0 percent in 2016, the highest in four years. The stronger outturn was partly due to stronger investment and net exports, in line with the continued recovery in commodity prices, strong global growth and trade flows, and still relatively supportive global financing conditions.
Headline consumer price inflation eased to an average of 3.5 percent yoy in Q4 2017 from 3.8 percent in Q3, largely due to muted food price inflation, which reached the lowest quarterly average in 14 years. Core inflation in Q4 remained unchanged from the 3 percent in Q3, the lowest quarterly average on record, reflecting stable inflationary pressures as the economy operates at near full employment. In annual terms, headline inflation was 3.8 percent, higher than the 3.5 percent in 2016, predominantly due to increases in administered prices, notably the three electricity tariff hikes in H1 2017.
Macro financial conditions remained stable. Bond yields declined an average of 150 bps across all tenors in 2017, following a 90 bps drop in 2016. Monetary policy remained stable with the policy interest rate being held steady at 4.25 percent in Q4, following the two consecutive 25 bps cuts in Q3. Gross capital inflows in 2017 surged more than three times that of 2016 on improved investor confidence due to the credit rating upgrades.
ENHANCING POTENTIAL
INDONESIA 117

Total government spending grew the fastest in three years, supported by higher capital, material, and social spending. Notably, the disbursement of capital expenditures improved from 73 percent in 2016 to 97 percent in 2017—the highest in six years. Overall, capital expenditures grew by 21.1 percent in 2017. While total tax revenues as share of GDP fell to less than 10 percent in 2017, the exclusion of receipts from the one-time Tax Amnesty program actually yields an increase in the tax ratio from 2016, reflecting ongoing tax reform efforts. Higher commodity prices helped revenue growth reach a six-year high and kept the fiscal deficit at 2.4 percent of GDP in 2017, the lowest in three years.
Meanwhile in the external sector, the current account deficit widened to 2.2 percent of GDP in Q4, from 1.7 percent of GDP in Q3, driven primarily by a lower surplus in goods trade and wider deficit in the service account. Reflecting the improved terms of trade and the recovery in global trade, the current account deficit stood at 1.7 percent of GDP for 2017, the lowest in 6 years.
The official poverty rate—calculated using Indonesia’s national poverty line—was 10.1 percent in September 2017, 0.6 percentage points lower than in September 2016, the largest yoy decline since March 2013. While growth in employment and real earnings slowed between August 2016 and August 2017, job creation tilted towards formal, manufacturing work, with the share of workers in the agricultural sector experiencing its largest yoy decline since 2004.
Outlook
The economic outlook continues to be positive with GDP growth projected to reach an average of 5.3 percent in the medium-term, on strengthening domestic demand lifted by the upcoming regional and presidential elections, recovery in private consumption, and still easy financing conditions. Net exports, however, will
drag economic growth as investment growth is import-intensive.
Headline inflation is expected to pick up in the next few years due to higher import costs associated with higher crude oil prices. The fiscal balance is expected to narrow modestly over the forecasting horizon, in line with the smaller deficit stipulated in the 2018 budget and as critical revenue enhancing reforms are implemented. The current account deficit is expected to widen over the medium term, in line with stronger domestic demand and weaker terms of trade.
The international poverty rate (those living below US$1.90 per day in 2011 PPP terms) is predicted to fall to 5.6 percent in 2017 and reach below 4 percent by 2020. Although the pace of poverty reduction is forecast to be slower than in the preceding decade, the yoy declines expected in 2017 and 2018 are larger than the yoy declines witnessed in 2015 and 2016, with stronger prospects for economic growth outweighing the effects of rising inflation.
Risks and Challenges
Risks to the economic growth outlook are tilted to the downside. On the external front, with protectionism on the rise, there is a risk that the nascent recovery in global trade could stall, weighing on Indonesian exports and hence growth.
Although the normalization of U.S. monetary policy is proceeding in an orderly manner, there is a risk that such movements may lead to financial volatility as markets undergo valuation corrections as seen as with the U.S. stock market earlier this year. For example, faster than expected inflation could trigger unexpected monetary tightening, leading to volatile capital outflows from emerging markets.
Progress on poverty reduction could stall or be undone by economic shocks. The recent malnutrition crisis in
EAST ASIA AND PACIFIC ECONOMIC UPDATE APRIL 2018
118 INDONESIA

Papua, measles outbreaks across several provinces, and the hike in rice price inflation since late 2017, are likely to have disproportionate effects on the earnings and purchasing power of the poor and vulnerable.
Figure 1. Real GDP growth and contribution to growth Figure 2. Poverty rate, actual and projectedPercent Percent
8
6
4
2
-4
0
-2
Dec-14
Dec-15
Dec-16
Dec-17
Jun-14
Jun-15
Jun-16
80
60
40
0
20
2013 2015 2017 2019f201120092007200520032001
J Private consumption J Government consumption J Investment ▬ PPP US$1.90 poverty rate, percent ▬ PPP US$3.20 poverty rate, percent
J Net exports J Statistical discrepancy J Change in inventories ▬ GDP Sources: National Socioeconomic Survey (SUSENAS); World Bank staff calculations.Note: poverty rates for 2017, 2018, 2019, and 2020 are forecasts. There were breaks in the Susenas sampling strategy between 2010 and 2011 and between 2014 and 2015.
Sources: National Statistics Agency (BPS); World Bank staff calculations.
INDONESIA Selected Indicators 2015 2016 2017e 2018f 2019f 2020f
Real GDP growth, at constant market prices 4.9 5.0 5.1 5.3 5.3 5.4Private Consumption 4.8 5.0 5.0 5.1 5.2 5.2Government Consumption 5.3 -0.1 2.1 4.0 4.5 5.0Gross Fixed Capital Investment 5.0 4.5 6.2 6.0 5.7 6.5Exports, Goods and Services -2.1 -1.6 9.1 7.0 6.0 5.5Imports, Goods and Services -6.2 -2.4 8.1 7.0 6.0 6.5
Real GDP growth, at constant factor prices 4.2 4.6 4.8 5.3 5.3 5.4Agriculture 3.8 3.4 3.8 4.0 4.1 4.2Industry 3.0 3.8 4.1 4.5 4.7 5.0Services 5.5 5.7 5.7 6.4 6.1 6.1
Inflation (Consumer Price Index) 6.4 3.5 3.8 3.5 3.7 3.7Current Account Balance (% of GDP) -2.0 -1.8 -1.7 -1.9 -2.1 -2.3Financial and Capital Account (% of GDP) 2.1 1.9 2.9 3.5 3.8 4.2
Net Foreign Direct Investment (% of GDP) 1.2 1.7 2.0 2.8 3.2 3.6Fiscal Balance (% of GDP) -2.6 -2.5 -2.4 -2.3 -2.3 -2.2Debt (% of GDP) 27.5 28.3 25.5 28.9 29.2 29.2Primary Balance (% of GDP) -1.2 -1.0 -0.8 -0.7 -0.6 -0.5International poverty rate ($1.9 in 2011 PPP)a,b 7.2 6.5 5.6 4.8 4.1 3.4Lower middle-income poverty rate ($3.2 in 2011 PPP)a,b 33.3 31.1 28.9 26.9 25.0 23.1Upper middle-income poverty rate ($5.5 in 2011 PPP)a,b 67.4 62.8 61.2 59.7 58.2 56.7Source: World Bank, Poverty & Equity and Macroeconomics, Trade & Investment Global Practices.Notes: e = estimate, f = forecast. (a) Calculations based on EAPPOV harmonization, using 2010-SUSENAS, 2015-SUSENAS, and 2016-SUSENAS. Actual data: 2015, 2016. Nowcast: 2017. Forecast are from 2018 to 2020. (b) Projection using annualized elasticity (2010–2015) with pass-through = 1 based on GDP per capita in constant LCU.
ENHANCING POTENTIAL
INDONESIA 119

LAO PDR
2017Population, million 6.9GDP, current US$ billion 17.0GDP per capita, current US$ 2,472International poverty rate ($1.9)a 22.7Lower middle-income poverty rate ($3.2)a 58.5Upper middle-income poverty rate ($5.5)a 85.0Gini coefficienta 36.4School enrolment, primary (% gross)b 111.3Life expectancy at birth, yearsb 66.3Source: WDI, Macro Poverty Outlook, and official data.Notes: (a) Most recent value (2012), 2011 PPPs. (b) Most recent WDI value (2015)
Summary
Growth decelerated in 2017, but remained robust, driven by expansion in power generation, manufacturing and agriculture, also helping poverty reduction. Growth is expected to further slow in 2018 while high fiscal and external deficits will increase debt levels. Low reserves and rising public debt service may undermine growth prospects. However, the business environment reforms, if implemented, will contribute to growth and poverty reduction.
Recent Developments
Growth remained strong at 6.7 percent in 2017, though continuing the decelerating trend. Continued expansion in power generation, manufacturing, and agriculture were weighed down by flat mining output, moderation
in construction and weaker tourism performance. The recent expansion of manufacturing and commercial agriculture, which are more labor intensive, may mean that Lao PDR is emerging from its jobless growth past, resulting in a strengthened link between growth and poverty reduction. Net exports slightly improved, underpinned by strong exports of electricity, parts and components as well as agricultural products that helped offset the decline in service exports. The start of works on the Lao section of the Singapore-Kunming railway project only partially offset the decline in investment in power projects and the slowdown in credit growth. Control on public consumption and slight moderation in private consumption contributed to slowing aggregate demand. Inflation in 2017 declined to 0.8 percent on average, reflecting falling food prices and slowing aggregate demand, offsetting the effects of recovering oil prices.
The fiscal deficit widened to 5.5 percent in 2017 as a large increase in investment spending more than offset the tight control on recurrent expenditure and modest improvement in revenue collection. Revenues increased by 9 percent, as higher VAT, royalties and overflight fees compensated the fall in income and trade taxes. Operating expenses were tightly controlled as well as domestically financed investment projects. However, external borrowing to finance infrastructure projects rose considerably, including for transmission lines and the railway project. Domestic arrears, though declining, still persist. Public debt increased to about 60 percent of GDP and the risk of debt distress remains high.
The external imbalance slightly narrowed, underpinned by improved net export in goods. Exports to main markets rose by 16 percent driven by electricity, electrical parts and agricultural products (rubber, roots and edible vegetables) as well as higher commodity prices. This offsets the expected weak tourism revenue and an increase in imports, due largely to gradually recovering oil price and machinery and steel to support construction of the large infrastructure projects. The lower current account deficit and more external
EAST ASIA AND PACIFIC ECONOMIC UPDATE APRIL 2018
120 LAO PDR

borrowing, including Government bonds issuance, boosted reserves to about US$1 billion by year end. Still, the reserves remain below two months of imports and 30 percent of foreign currency deposit. The nominal and real effective exchange rates depreciated by around 8 percent during 2017, helping reverse some of the appreciation in earlier years. The increased flexibility also helped the official and the parallel market rates converge.
Credit growth continued to slow down, partly due to the tighter regulation of foreign currency lending. To stimulate credit growth, the authorities lowered the policy rates in November 2017, followed by reduction of the spread between foreign currency deposit and loan rates, and lowering of the caps on Kip deposit rates. However, a weak transmission mechanism and inability by banks to adequately price risk put in question the effectiveness of the policies. As parts of the banking sector remain weak, the Bank of Lao PDR initiated restructuring plans for two state-owned banks and is strengthening the legal framework including through the revision of the laws on commercial banks and central bank.
Outlook
GDP growth is projected to slow to 6.6 percent in 2018. Agriculture and manufacturing are expected to continue to benefit from a favorable external environment. The 2018 Visit Lao Year campaign may help boost tourism. The construction of railway and the pipeline of power projects will continue to support growth, but also pose challenges to fiscal consolidation. Growth is expected to pick up slightly in 2019–2020 supported by close to 3,000MW of power generation capacity coming on stream and growing opportunities for the non-resource sector resulting from closer ASEAN integration and the Government’s commitment to improve the business environment. Inflation is likely to pick up as oil prices recover; however, should remain around 3 percent.
The Government plans to consolidate the fiscal position with the deficit declining to below 5 percent in 2018, though the track record is yet to be established. The Government puts efforts in strengthening non-resource taxation including increasing excise tax rates, reviewing exemptions and improving public finance management. Recovering commodity prices will also support revenues. However, the borrowing to finance infrastructure projects and contingent liabilities in power sector will keep the fiscal deficit and public debt high.
The current account deficit is expected to widen over the next few years due to large import content of the construction of infrastructure projects. This will offset the expected export earnings growth from power, manufacturing and tourism. The completion of construction of the railway and commercial operation of major power projects is expected to improve the external imbalance in the longer term.
Risks and Challenges
Delays in pursuing reforms will further slow growth and could undermine macroeconomic stability. The failure to address the pressing needs on fiscal consolidation, public debt management and reforms in tax policy and administration will keep public debt sustainability at high risk. Slippages in the restructuring process of banks and the failure to consider good practices could prolong the risks to financial sector stability. In the meantime, failure to match productivity improvement in line with proposed wage increase will likely lower private investment. With an increasing need for fiscal consolidation, the challenge for poverty reduction will be to effectively fund service delivery in lagging regions to build household endowments and equalize opportunities between the non-poor and the poor. On the other hand, if the recently announced commitment to reform the business environment materializes, it promises to unlock the potential in many sectors and help restore growth rates to around 7 percent per annum.
ENHANCING POTENTIAL
LAO PDR 121

LAO PDR Selected Indicators 2015 2016 2017e 2018f 2019f 2020f
Real GDP growth, at constant market prices 7.3 7.0 6.7 6.6 6.9 6.9Private Consumption 4.5 4.5 4.3 5.0 5.2 5.4Government Consumption 4.5 7.7 6.6 5.2 4.2 3.6Gross Fixed Capital Investment 9.6 3.2 3.0 9.2 7.5 3.1Exports, Goods and Services 6.7 10.5 11.0 8.0 10.0 12.0Imports, Goods and Services 4.0 4.6 5.0 6.8 7.0 6.5
Real GDP growth, at constant factor prices 6.8 6.9 6.9 6.7 6.9 7.0Agriculture 3.6 2.8 2.9 3.0 3.0 3.0Industry 7.0 12.0 11.0 8.1 8.8 9.1Services 8.0 4.7 5.0 6.7 6.8 6.6
Inflation (Consumer Price Index) 1.3 1.6 0.8 3.0 3.0 3.0Current Account Balance (% of GDP) -20.0 -12.9 -11.7 -14.0 -14.4 -12.9Fiscal Balance (% of GDP) -4.4 -4.5 -5.5 -4.9 -4.4 -4.0Debt (% of GDP) 57.3 58.5 61.1 65.1 65.8 66.0Primary Balance (% of GDP) -3.4 -3.4 -4.3 -3.6 -2.9 -2.5International poverty rate ($1.9 in 2011 PPP)a,b 20.6 20.0 19.4 18.9 18.4 17.8Lower middle-income poverty rate ($3.2 in 2011 PPP)a,b 55.0 54.0 53.1 52.2 51.2 50.3Upper middle-income poverty rate ($5.5 in 2011 PPP)a,b 83.2 82.7 82.2 81.7 81.2 80.7Source: World Bank, Poverty & Equity and Macroeconomics, Trade & Investment Global Practices.Notes: e = estimate, f = forecast. (a) Calculations based on EAPPOV harmonization, using 2007-LECS and 2012-LECS. Nowcast: 2015–2017. Forecast are from 2018 to 2020. (b) Projection using annualized elasticity (2007–2012)
Figure 1. Real GDP growth, contribution to real growth Figure 2. Actual and projected poverty rates and GDP per capita
Percent and percentage points contribution Poverty rate, percent GDP per capita, million constant LCU
10
8
6
4
2
-2
0
2013 2014 2015 2016 2017
100 25
90
2080
15
70
10
60
5
50
40
30
20
10
0 0
2012 2014 2016 2018f 2020f20102008200620042002
J Private consumption J Government consumption J Gross fixed investment ▬ International poverty rate ▬ Lower middle-income poverty rate
J Net export ▬ GDP per capita ▬ Upper middle-income poverty rate ▬ GDP per capita
Source: Staff estimate based on national statistics. Source: World Bank.
EAST ASIA AND PACIFIC ECONOMIC UPDATE APRIL 2018
122 LAO PDR

MALAYSIA
2017Population, million 31.6GDP, current US$ billion 314.5GDP per capita, current US$ 9,945School enrolment, primary (% gross)a 101.8Life expectancy at birth, yearsa 75.2Source: WDI, Macro Poverty Outlook, and official data.Notes: (a) Most recent WDI value (2015).
Summary
Malaysia experienced a significant acceleration of growth at 5.9 percent in 2017, supported by a confluence of favorable domestic and external factors. The economy is forecast to expand by 5.4 percent in 2018, underpinned by a sustained high level of private sector expenditure. Nevertheless, continued uncertainties to the global outlook weigh on Malaysia’s growth as the economy is vulnerable to shifts in external demand and global financial market conditions.
Recent Developments
Malaysia’s economy continued to expand strongly in H2 2017, growing at 6.2 and 5.9 percent in the third and fourth quarters of the year, respectively. Private consumption remained the primary contributor to growth, underpinned by stable labor market conditions and continued income growth. Private investment also expanded firmly, driven by continued capital spending
in both domestic- and export-oriented sectors. Public consumption grew at a faster pace during Q4 2017 on account of increased spending on supplies and services, including maintenance charges. Meanwhile, public sector investment growth turned negative in Q4 2017, following lower capital expenditure by both the Federal Government and public corporations. On the external front, gross exports continued to benefit from the cyclical upturn of global trade activity, sustaining a double-digit rate of growth into the second half of 2017. The strong export growth was underpinned by the robust performance in manufactured exports, particularly Electrical and Electronic (E&E) products. Gross imports also expanded firmly during the period, supported by the sustained demand for intermediate imports, consistent with the strong growth of manufactured exports.
Labor market conditions remained stable throughout H2 2017. The labor force participation rate was marginally higher at 68 percent in Q4 2017, while the unemployment rate remained low at 3.4 percent during the period. Manufacturing wages grew strongly at 9.4 percent in Q4 2017, almost twice the pace of the wage growth in the services sector, which was 5.0 percent over the same period.
New survey data show that the official poverty rate declined from 0.6 to 0.4 percent of households. Median monthly household income reached RM 6,958, representing a 4.4 percent real annual growth rate since the last survey in 2014. Income growth rates were relatively even across income groups, and across rural and urban areas. Income inequality was unchanged, with the Gini coefficient remaining at 0.40 and the income share of the bottom 40 percent declining marginally from 16.8 to 16.4 percent. Headline inflation continued to moderate to 3.6 percent in H2 2017, largely reflecting the lower inflation in the transportation category. Meanwhile, inflation for the food and non-alcoholic beverages category remained relatively high at 4.0 percent during the period, driven in part by sustained price increases in the food
ENHANCING POTENTIAL
MALAYSIA 123

away from home category. While underlying inflation moderated towards the end of 2017, there remain concerns regarding cost of living pressures, particularly for urban low-income households, due to the relatively high food price inflation over the past years. These pressures have been compounded by high housing costs amid a structural shortfall of affordable homes for lower-income households, especially in urban areas. Sustained foreign interest in the domestic financial markets amid better than expected growth prospects led to net portfolio inflows by non-residents and contributed towards the strengthening of the ringgit during H2 2017. The pace of credit growth to the private sector has moderated somewhat, attributable mainly to the slower growth of outstanding business loans. In January 2018, Bank Negara Malaysia reduced the degree of monetary accommodation by raising the overnight policy rate to 3.25 percent. As the domestic economy is assessed to be firmly on a steady growth path, the normalization is intended to prevent the build-up of risks that could arise from interest rates being too low for a prolonged period, while ensuring ample policy space for buffers in the event of shocks.
Outlook
Malaysia’s growth is expected to remain strong in the near term, albeit at a more moderate pace compared to 2017. In aggregate, Malaysia is forecast to register an economic growth rate of 5.4 percent in 2018, supported by the continued strength of private consumption. With the anticipated decline in public investment, gross fixed capital formation will be driven mainly by the expansion of private sector capital expenditure, which is expected to be sustained by the continued flows of infrastructure projects and capital investments in the manufacturing and services sectors. The strength of Malaysia’s export performance is expected to continue into H1 2018 in tandem with the ongoing cyclical upturn in global trade, although at a lower rate than the preceding year. Meanwhile, the government remains committed to fiscal consolidation amid a continued expectation of the fiscal deficit target of 2.8 percent of GDP being achieved in 2018.
Malaysia’s social protection system is strengthened with the introduction of the Employment Insurance Scheme in January 2018. It provides up to 6 months of income support, training, and job search assistance to retrenched workers. Conversely, low-income households are facing a decline in the real value of their BR1M cash transfer payments, which were not increased in the annual budget for the first time since the program was introduced in 2012. Looking further ahead, Malaysia’s economy is projected to expand at 5.1 percent in 2019 and 4.8 percent in 2020 and is expected to achieve high-income country status at some point between 2020 and 2024.
Risks and Challenges
Downside risks to Malaysia’s growth prospects relate mainly to the external environment. In particular, an abrupt adjustment to global financial market conditions, or weaker than expected growth in the major economies and export demand could have disproportionately negative spillovers on Malaysia, given its high level of integration with the global economy and financial markets. Domestically, downside risks relate primarily to the relatively high level of household and public-sector debt, as well as uncertainties surrounding Malaysia’s forthcoming general election.
A strengthening economy offers a crucial opportunity for Malaysia to accelerate structural reforms for sustained longer-term growth and to facilitate its transition towards the achievement of high-income country status in the coming years. Concurrently, achieving a near-balanced federal budget over the medium term would necessitate a deeper wave of reforms to enhance revenue collection and improve public sector efficiency, including the targeting efficiency of social protection programs such as BR1M. Equally important is to reinforce measures to improve labor productivity and implement measures to ensure that growth is inclusive and provides access to opportunities for all citizens.
EAST ASIA AND PACIFIC ECONOMIC UPDATE APRIL 2018
124 MALAYSIA

Figure 1. Real GDP growth, contribution to real growth Figure 2. Incidence of poverty at national poverty linesPercent, percentage points Percent
10
8
6
4
2
-4
0
-2
Q1-13
Q1-14
Q1-15
Q1-16
Q1-17
Q3-13
Q3-14
Q3-15
Q3-16
Q3-17
12
10
8
6
4
2
0
2009 2012 2014 2016
J Private consumption J Government comsumption J Gross capital formation ▬ Total ▬ Urban ▬ Rural
J Change in inventories J Net exports ▬ Real GDP Sources: Department of Statistics Malaysia.
Sources: Department of Statistics Malaysia.
MALAYSIA Selected Indicators 2015 2016 2017e 2018f 2019f 2020f
Real GDP growth, at constant market prices 5.0 4.2 5.9 5.4 5.1 4.8Private Consumption 6.0 6.0 7.0 6.7 6.4 6.0Government Consumption 4.4 0.9 5.4 2.7 2.4 2.1Gross Fixed Capital Investment 3.6 2.7 6.2 4.9 4.7 4.3Exports, Goods and Services 0.3 1.1 9.6 7.5 6.7 6.1Imports, Goods and Services 0.8 1.1 11.0 7.9 7.0 6.5
Real GDP growth, at constant factor prices 4.9 4.2 5.8 5.4 5.1 4.8Agriculture 1.3 -5.1 7.2 3.7 3.5 3.3Industry 5.4 4.2 4.9 4.7 4.5 4.2Services 5.1 5.6 6.2 6.1 5.8 5.4
Inflation (Consumer Price Index) 2.1 2.1 3.7 2.7 2.6 2.5Current Account Balance (% of GDP) 3.0 2.4 3.0 3.0 2.9 2.8Fiscal Balance (% of GDP) -3.2 -3.1 -3.0 -2.8 -2.6 -2.3Debt (% of GDP) 54.5 52.7 50.8 50.3 49.4 48.3Primary Balance (% of GDP) -1.1 -1.0 -0.8 -0.7 -0.5 -0.4Sources: World Bank, Poverty & Equity and Macroeconomics, Trade & Investment Global Practices.Notes: e = estimate; f = forecast.
ENHANCING POTENTIAL
MALAYSIA 125

MONGOLIA
2017Population, million 3.1GDP, current US$ billion 12.0GDP per capita, current US$ 3,909School enrolment, primary (% gross)a 100.9Life expectancy at birth, yearsa 69.1Source: WDI, Macro Poverty Outlook, and official data.Notes: (a) 2016. (b) Most recent WDI value (2015).
Summary
The Mongolian economy grew by 5.1 percent in 2017 exceeding expectations, following strong coal exports, strong foreign direct investment, and improved business sentiments. Growth outlook remains positive in 2018 and beyond, mainly supported by increased private investment in mining and a new impetus in trade and transport services. Improvements in household incomes and positive outlook augur well for poverty reduction after sharp increase of 2016. Risks to the outlook include political uncertainty, climate and commodity shocks, and border related issues.
Recent Developments
Mongolia’s economy recovered strongly in 2017 as real GDP rose to 5.1 percent from 1.5 percent in 2016. Despite bottlenecks at the border with China and weather-related shocks, growth exceeded expectations in 2017, largely supported by a revived coal sector, and strong private investment including in non-mineral sector (trade and transport). Improved market
sentiments following successful implementation of government’s economic recovery plan also contributed to this performance. Following positive developments on the labor market, private consumption recovered strongly in 2017 (4.3 percent) following a contraction in 2016. Unemployment rate in Q4 2017 declined by almost 1.5 percentage points from 8.6 percent in Q4 2016. Although inflation remained below the central bank rate of 8 percent, it accelerated to 6.4 percent in 2017 with rising prices of meat, vegetables, fuel, and the effects of excise tax levied on vehicles. Despite regional differences, real average household income, which contracted in 2016, increased by 6.5 percent in 2017. Income improvements have translated into expenditures growth as real average household expenditures rose by about 7 percentage points in 2017 from 1.6 percent in 2016. As a result, poverty rates may have leveled off in 2017.
The fiscal stance improved substantially in 2017 as overall deficit dropped by almost nine folds to 1.9 percent of GDP from 17 percent of GDP in 2016. This was explained by a better than expected revenue performance from the rise in coal exports, and a commitment to spending control (e.g., reduction in interest payments, streamlining wage bill through hiring freeze, and rationalization of underperforming capital spending) in the context of its fiscal adjustment program. Substantial improvement in fiscal balance ultimately led to a sharp reduction in government debt in 2017. Despite positive terms of trade, current account balance slightly deteriorated in 2017 following a surge in investment income by non-residents due to large FDI inflows. Merchandise exports increased by 26 percent in 2017, with sharp rise in coal exports from 5.3 percent in 2016. This broadly positive external environment along with stronger official sector support, and other factors mentioned above, have helped strengthen Mongolia’s external buffers. Gross international reserves increased to US$3 billion (4.9 months of imports) from US$1 billion reached in February 2017, its lowest level since August 2008. Bank of Mongolia (BoM) has implemented a prudent exchange rate policy resulting in a 2.3 percent appreciation of the Tugrug in 2017 from the 25 percent depreciation of 2016.
EAST ASIA AND PACIFIC ECONOMIC UPDATE APRIL 2018
126 MONGOLIA

Outlook
Despite some base effects, economic growth is projected to further improve modestly to 5.3 percent in 2018 from 5.1 percent in 2017, and to accelerate to over 6 percent in 2019–20. Private investment will remain a key driver for growth in the medium-term, especially in mining, trade and transport services. Despite reduced depreciation pressure on the exchange rate, inflation will likely rise although modestly—putting at risk the BOM medium term target of 8 percent as food and petrol prices are expected to continue to increase. Private consumption is also projected to further improve over the medium term. Accordingly, BOM has started to gradually tighten monetary policy to contain inflation.
Agriculture is projected to grow around 4 percent over the medium term, but below its 2014–15 performance, due to the adverse effects of harsh winter. Industry is projected to grow around 7 percent in 2018–20, as substantial developments are expected in mining. Services sector growth would be supported by strong linkages between mining and transport. Moreover, trade and transport may also gain from the intensification of relations with Russia.
The fiscal deficit could decline further as long as government remains committed to implement its fiscal consolidation program agreed with development partners, despite recent policy reversals (see below). The declining deficit path will likely result in continued reduction on debt over the medium term. The balance of payments will continue to face structural vulnerabilities exacerbated by the country’s debt situation. Despite robust export growth, investment related construction imports over the next two years will rise and put pressure on the current account balance. Exchange rate depreciation will continue to subside following the disbursement of outstanding official sector (donors) support and further FDI inflows. Moreover, gross international reserves would significantly improve to 6.8 months of imports in 2019 from 4.9 months in 2017.
Given the positive macro outlook, poverty rates are expected to start declining in 2018. However, gains in urban poverty reduction may be partially countered by protracted rural poverty unless economic activity improves in rural areas.
Risks and Challenges
Mongolia’s underlying structural issues remain despite its strong recovery of 2017. There are substantial domestic and external exogenous risks to the outlook. These risks include persistent political uncertainty which could trigger a delay of implementation of mega projects in mining sector; climate shocks; commodity market volatility; and bottlenecks at the border; as well as regional instability.
The recent policy reversals, including abandoning the progressive Personal Income Tax system, and modifying extension of retirement age, could raise concerns about policy stability, thereby affecting market sentiments and FDI. In contrast, if the government maintains fiscal discipline and promote policies to attract FDI, Mongolia's prospects for growth and poverty reduction further improve. Weather-related shocks will remain an important challenge to Mongolia’s economy. Livestock is the main source of income in rural areas and further growth is key to raising living conditions in the countryside. Adaptation to climate change should also be prioritized to help mitigate primary sector production shocks.
Commodity market volatility is likely to affect Mongolia’s growth prospects. Improving management of proceeds from minerals is therefore critical.
Worsening of non-trade barriers at the border with China and resumption of coal imports from North Korea could affect Mongolia’s coal exports. Unless Mongolia addresses deficiencies in its anti-money laundering system, the country could find itself on the FATF grey list, posing an additional risk to FDI and the financial sector.
ENHANCING POTENTIAL
MONGOLIA 127

Figure 1. Real GDP growth, contribution to real growth Figure 2. Poverty rate (official poverty line): 2010–16Percent, percentage points Percent of total population
35
30
25
20
15
10
5
0
-5
-10
-15
-20
-25
Q1-13
Q1-14
Q1-15
Q1-16
Q1-17
Q3-13
Q3-14
Q3-15
Q3-16
Q3-17
50
40
30
20
10
0
2012 2014 201620112010
J Final consumption J Gross capital formation J Net exports ▬ GDP J National average J Urban J Rural
Source: National Statistics Office. Source: National Statistics Office.
MONGOLIA Selected Indicators 2015 2016 2017e 2018f 2019f 2020f
Real GDP growth, at constant market prices 2.5 1.5 5.1 5.3 6.4 6.5Private Consumption 7.4 -7.9 4.3 3.7 6.7 6.9Government Consumption -4.7 11.0 -3.2 -1.7 1.9 4.2Gross Fixed Capital Investment -34.4 7.8 32.8 7.0 34.0 8.0Exports, Goods and Services 1.2 12.6 13.4 9.0 8.0 8.5Imports, Goods and Services -11.4 12.4 25.0 7.3 15.4 8.0
Real GDP growth, at constant factor prices 5.6 1.6 3.8 5.3 6.4 6.5Agriculture 10.7 6.2 2.3 3.5 3.6 4.0Industry 9.9 -0.6 -1.4 5.0 7.0 9.0Services 0.8 2.0 8.6 6.1 6.8 5.4
Inflation (Private Consumption Deflator) 1.1 0.9 6.4 8.0 6.9 6.5Current Account Balance (% of GDP) -7.3 -6.0 -10.2 -6.5 -8.4 -6.0Financial and Capital Account (% of GDP) 3.0 7.8 24.9 10.9 16.1 6.3
Net Foreign Direct Investment (% of GDP) 1.5 1.0 11.8 11.8 14.9 12.2Fiscal Balance (% of GDP) -8.2 -16.7 -1.9 -5.6 -4.1 -1.7Debt (% of GDP) 60.7 86.0 83.8 81.4 78.9 73.8Primary Balance (% of GDP) -5.4 -13.1 2.2 -1.5 -0.6 1.5Source: World Bank, Poverty & Equity and Macroeconomics, Trade & Investment Global Practices.Notes: e = estimate; f = forecast.
EAST ASIA AND PACIFIC ECONOMIC UPDATE APRIL 2018
128 MONGOLIA

MYANMAR
2017Population, million 54.9GDP, current US$ billion 79.8GDP per capita, current US$ 1,455International poverty rate ($1.9)a 6.4Lower middle-income poverty rate ($3.2)a 29.8Upper middle-income poverty rate ($5.5)a 67.6Life expectancy at birth, yearsa 66.4Source: WDI, Macro Poverty Outlook, and official data.Notes: (a) Most recent value (2015), 2011 PPPs. Most recent WDI value (2015).
Summary
The real GDP growth estimate for FY2017/18 (April–March) remains 6.4 percent driven by strong exports and industry and services activity offsetting a slow recovery in agriculture. Inflation is rising driven by food and fuel prices and central bank financing of an expanding fiscal deficit. Despite the growth outlook, the pace of poverty reduction is likely to remain modest. Downside risks to the macroeconomic outlook have intensified especially from uncertainties related to the conflict in Rakhine State.
Recent Developments
Rapid growth and economic reforms have driven poverty reduction in the last decade. Rising consumer purchasing power and greater access to markets have contributed to substantial growth in household asset ownership. Using the international poverty line ($1.9/
day in 2011 PPP), poverty is estimated to be 6.4 percent in 2015. Although historical trends in global poverty measures are not available, national estimates point to a decline in the share of population living in poverty from 48.2 percent in FY 2004/5 to 32.1 percent in 2015. Poverty has fallen faster in Urban than Rural areas, and 87 percent of the poor are in farms and villages. Despite improvements in living conditions, there are many near-poor who are susceptible to falling into poverty following shocks.
Economic growth recovered to 6.3 percent (y/y) in the first six months of FY2017/18 from a slowdown to 5.4 percent in the same period of FY2016/17. Growth in aggregate demand was supported by large net exports—exports (20 percent of GDP) grew by 26 percent and imports by 22 percent—as well as by stable private consumption (50 percent of GDP) and early signs of recovery in domestic and foreign investment.
Commodity exports, notably rice, metal and ore, garments and natural gas, grew rapidly in the first six months of FY2017/18. The export of rice, grew by 200 percent in volume terms. Garment exports rose by 52 percent, continuing a rapid expansion, albeit from a low base, and supported by investment. Buoyed by higher oil and gas prices, the export of natural gas has increased by 10 percent during the first six months.
The service sector is buoyant, supported by financial, communication and wholesale/retail trade activity. The sector grew by 8.4 percent in the first half of the year, accounting for the largest contribution to growth. Industrial activity also accelerated, with the PMI (output, value and employment) indicating continued strong performance. In contrast, the share of agriculture has shrunk slightly, growing at 0.5 percent despite signs of a recovery in production. The sectoral composition of growth in this period suggests limited progress on poverty, and a possible increase in inequalities between urban and rural areas. The decrease in value addition in agriculture is likely to result in reduced incomes among the poor and rural populations.
ENHANCING POTENTIAL
MYANMAR 129

After a period of easing, inflation rose to 5.2 percent in January 2018 in response to both higher food and nonfood prices. Food prices rose faster in January to 4.6 percent from 2.3 percent in December. Nonfood inflation grew at 6.3 percent in January driven by a 20 percent increase in local petrol prices as global oil prices passed through. Given poorer households tend to devote a higher share of their expenditures to food and energy, the impact of these price changes needs to be monitored closely.
The exchange rate in the official and parallel markets converged and remained relatively stable in 2017 compared with 2016 at around 1,357 Kyat per US$. The market rate appreciated slightly to February 2018 supported by the weakening dollar and strong export performance, which opened a slight gap to the official reference rate.
Outlook
The growth outlook for FY2017/18 remains at 6.4 percent on the assumption of a stable exchange rate and improved performance in manufacturing and services. Growth is expected to return to its trend—around 6.7 percent in FY 2018/19 and 7 percent in FY 2019/20. Despite a growing economy, the pace of poverty reduction is likely to remain modest in the near future. Faster agricultural growth is needed to have positive implications on the poor in rural areas. The faster growth in the service sector is likely to induce a faster poverty reduction in urban areas, and subsequently continue increasing inequalities.
The overall fiscal outlook has deteriorated with the fiscal deficit increasing from 3 percent in 2016/17 to near 5 percent in 2017/18, driven by lower tax collection, and increases planned in capital expenditure. Rising deficits have put pressure on domestic financing, with the level of government borrowing from the Central Bank as a share of total financing likely to increase beyond the 30 percent target for FY2017/18. Inflation is projected
at 5.5 percent in the second half of FY2017/18 due to increased financing of the fiscal deficit from CBM and a continued rise in domestic food and fuel prices. A proposed increase in the minimum wage may also push up costs.
Risks and Challenges
Risks to baseline economic activity are firmly tilted to the downside. The extent of the economic impact of heightened insecurity in Rakhine State since August 2017 remain uncertain. While leading indicators suggest limited impact of the Rakhine conflict on investor perceptions, tourism is likely to have suffered nationwide.
The banking sector faces a challenging transition to comply with Basel I. Regulations issued in July 2017 brought to the forefront the vulnerabilities in a banking sector that has typically relied on overdrafts for lending purposes. These vulnerabilities persist even as the Central Bank of Myanmar(CBM) has been working with commercial banks to allow for a smooth transition into the new regulatory framework.
The construction sector remains vulnerable to constraints in the real estate sector. In particular, the sales and purchases of property has slowed due to a property tax rate at 30 percent and high borrowing costs, which, at a minimum of 13 percent per annum, is high for the region. The slowdown in construction will adversely impact poorer households who are disproportionately employed as unskilled labor.
The agriculture sector remains highly exposed to fluctuations in demand from major trading partners and supply shocks which could ripple through supply chains involving businesses from farms to trading companies.
The launch of consultations on the Myanmar Sustainable Development Plan (MSDP) meets investors’ calls for a clearer and consistent set of policy direction and
EAST ASIA AND PACIFIC ECONOMIC UPDATE APRIL 2018
130 MYANMAR

Figure 1. Real GDP growth and sector contribution to real GDP growth
Figure 2. CPI inflation and food/non-food contribution to CPI inflation
Growth and contribution in percentage points yoy change and component contribution, percent
9
8
7
6
5
4
3
2
1
-1
0
2013 2014 2015 2016 2017f 2018f 2019f 2020f Apr-14
Aug-14
16
14
12
10
8
6
4
2
0
Apr-15
Aug-15
Apr-16
Aug-16
Apr-17
Dec-14
Dec-15
Dec-16
Aug-17
Dec-17
J Agriculture J Industry J Services J CPI food J CPI nonfood ▬ CPI headline
Sources: MOPF, World Bank staff estimates. Sources: CSO, World Bank staff estimates.
MYANMAR Selected Indicators 2015 2016 2017e 2018f 2019f 2020f
Real GDP growth, at constant market prices 7.0 5.9 6.4 6.7 6.9 7.1Real GDP growth, at constant prices 7.0 5.9 6.4 6.7 6.9 7.1
Agriculture 3.4 -0.4 3.0 4.0 4.1 4.1Industry 8.3 8.9 8.0 8.3 8.5 8.5Services 8.7 8.2 7.4 7.2 7.4 7.8
Inflation (Consumer Price Index) 8.4 7.0 5.5 4.9 5.3 5.3Current Account Balance (% of GDP) -7.2 -5.3 -4.7 -4.7 -4.1 -3.8Fiscal Balance (% of GDP) -5.1 -3.0 -4.7 -4.8 -4.4 -4.4Primary Balance (% of GDP) -3.4 -1.1 -3.2 -3.1 -3.1 -3.4International poverty rate ($1.9 in 2011 PPP)a,b 6.4 6.0 5.8 5.4 5.2 4.8Lower middle-income poverty rate ($3.2 in 2011 PPP)a,b 29.8 28.8 28.1 27.0 25.7 24.6Upper middle-income poverty rate ($5.5 in 2011 PPP)a,b 67.6 66.6 65.5 64.5 63.2 62.0Source: World Bank, Poverty & Equity and Macroeconomics, Trade & Investment Global Practices.Notes: e = estimate, f = forecast. (a) Calculations based on EAPPOV harmonization, using 2015-MPLCS. Actual data: 2015. Nowcast: 2016–2017. Forecast are from 2018 to 2020. (b) Projection using neutral distribution (2015) with pass-through = 0.3 based on GDP per capita in constant LCU.
priorities. The MSDP, the attendant public investment program, and their resolute implementation can support positive investor sentiment, jobs and productivity. This could help the poor to participate in economic activities, and shelter the poor and vulnerable from shocks.
ENHANCING POTENTIAL
MYANMAR 131

NORTH PACIFIC ISLANDS
2016Population, million 0.31GDP, US$ billion 1.12GDP per capita, current US$ 3,643Sources: WDI, World Bank staff estimates.
Summary
Growth in the North Pacific countries—Kiribati, Republic of the Marshall Islands, Federated States of Micronesia, Nauru, and Palau—is estimated to have been relatively strong in FY2017, supported by donor-funded construction and a recovery in tourism activity in the case of Palau. While high fishing revenues have bolstered fiscal balances, substantial fiscal risks remain, including due to wage bill pressures and the scheduled expiry of Compact Grants.
Recent Developments
In Kiribati, economic growth is estimated to have been 3.1 percent in 2017, representing Kiribati’s seventh consecutive year of economic expansion. The fiscal surplus for 2017 is estimated to have been 3.5 percent of GDP. At the end of 2017, the government decided to grant a significant public service pay rise from 2018. This 30 percent across-the-board pay rise is expected to have a widespread effect on disposable incomes, because of Kiribati’s large number of public servants (in per capita terms) and the extensive family networks
that most public servants support. To afford the significant public service pay rise, while maintaining an appropriately conservative forecast for fishing license fee revenue in 2018, the government is budgeting to keep non-wage recurrent spending relatively flat and reduce capital spending. The projected budget surplus for 2018 is 3.2 percent of GDP. Inflation has remained at around 2 percent for the last two years, owing to the relative stability of food, fuel and transport prices, and the relative stability of the Australian dollar (which Kiribati uses as its currency). Despite large trade deficits, the current account has remained in surplus in recent years primarily due to high fishing license fees paid by foreign companies, estimated to have been nearly 60 percent of GDP in 2017. These high fees have been driven by the effects of the Vessel Day Scheme (a regional agreement that establishes the minimum price of a vessel day and limits the total number of vessel days sold) and continued favorable weather conditions. Large fishing license revenues have resulted in the accumulation of substantial cash reserves, and net transfers of AUD 120 million to the RERF (the sovereign wealth fund) over 2015 and 2016. Cash reserves are now well above the buffer required to deal with general volatility and shocks, at around 12 months of recurrent spending.
Economic growth in the Republic of the Marshall Islands (MHL) is expected to have remained stable in FY2017, at around 1.7 percent, driven by continued public infrastructure investment, following growth of 1.9 percent in FY2016. The current account has remained in surplus in recent years, with foreign grants and higher fishing license receipts more than offsetting a fall in exports and an increase in service imports. Consumer prices are expected to have been around 1 percent in FY2017, following a fall in FY2016, when the stronger US dollar (the official currency of the MHL) put downward pressure on food and transport prices. High fishing license fees have underpinned small fiscal surplus over the past three years, a trend which is expected to have continued in FY2017. However, larger fiscal surpluses will be required to build adequate
EAST ASIA AND PACIFIC ECONOMIC UPDATE APRIL 2018
132 NORTH PACIFIC ISLANDS

buffers to sustain government spending following the scheduled end of Compact grants from 2024, as current projections indicate that the corpus of the MHL Trust Fund will not be sufficiently large to generate an annual income stream that can fully replace the expiring grants. In addition, government cash reserves are expected to have remained low (the most recent data indicate that reserves were around USD 8 million at the end of 2015, equivalent to 1 month of recurrent spending), although the steady flow of external grants has shielded the MHL from liquidity squeezes.
In FY2017, the economy of the Federated States of Micronesia (FSM) is projected to have expanded modestly (by around 2 percent), due to increased construction activity related to Compact-funded infrastructure projects, following contractions in four of the past five years. The sluggish growth performance over recent years has weighed on formal sector employment, and remains over 4 percent below its FY2011 level. This is likely to have exacerbated basic needs poverty in turn, since consumption welfare tends to be lower for those who are economically inactive or engaged in informal activities. Consumer prices fell in FY2016 and are expected to have remained flat in FY2017, due to a strong US dollar (the official currency of the FSM) holding down prices for fuel and food imports. After traditionally running large deficits, the current account is expected to have registered a fourth consecutive year of surplus in FY2017, reflecting higher fishing license receipts resulting from the introduction of the Vessel Day Scheme. High fishing revenues have also underpinned a significant improvement in the FSM’s fiscal performance in recent years, resulting in large fiscal surpluses of 7–12 percent of GDP during FY2014–FY2016, with another large fiscal surplus expected in FY2017. The government has prudently transferred fiscal surpluses to the FSM Trust Fund aimed at mitigating external shocks and potential future revenue shortfall from the scheduled end of Compact grants from 2024. Nevertheless, further transfers of fiscal surpluses will be needed to build adequate fiscal buffers, as the combined corpus of the nation’s two trust
funds are projected to be less than sufficient to deliver an annual investment income that can fully replace the expiring grants. The central government retains cash reserves of around 5 months of general government current spending.
After doubling in size in the early part of the decade, Nauru’s economy has expanded much more slowly in recent years and growth remains volatile, with a lack of diversification translating into a high degree of vulnerability to shocks. Growth is estimated to have slowed to 4 percent in FY2017, from 10 percent in FY2016, due to a slowdown in phosphate exports—with phosphate reserves now almost completely depleted—as well as a moderation in activity associated with Australia’s Regional Processing Centre (RPC) for asylum-seekers, which in recent years has been the main driver of economic activity in Nauru. Government revenue has increased substantially since FY2012, primarily due to RPC-related revenues and fishing license fees. However, government spending has also increased rapidly, particularly on the wage bill (in an effort to retain key public employees), but also on goods, services, and social benefits, which, in addition to the priority assigned to health and education spending, is likely to have particularly benefitted the poor and vulnerable. Recent estimates indicate that a fiscal deficit of around 1 percent of GDP was realized in FY2017, and that the government has very limited cash reserves.
The Palauan economy is expected to have grown by around 5 percent in FY2017, up from 1.9 percent in FY2016, as tourism activity recovered with the entry of new hotels, and construction picked up. Higher tourist receipts in FY2017 are expected to have narrowed the current account deficit, which registered 10.3 percent of GDP in FY2016. The economy has continued to create jobs (up 4.4 percent in FY2016), meaning formal employment has now increased by 16 percent since FY2012. This is likely to have reduced the poverty risk for many Palauan households. Consumer prices fell by 1.3 percent in FY2016, as the stronger US dollar (the official currency of Palau) held down local prices for
ENHANCING POTENTIAL
NORTH PACIFIC ISLANDS 133

food and transport services. Palau’s fiscal position has strengthened in recent years, with FY2016 registering a fiscal surplus (including grants) of 4.3 percent of GDP, the sixth consecutive annual surplus. The government has retained a healthy cash balance, with reserves estimated to increase from around 3 months of government spending in FY2015 to about 6 months of spending by FY2021. However, the Compact Trust Fund continues to shrink as a percent of GDP. Greater fiscal consolidation and revenue mobilization is necessary to ensure long-term fiscal sustainability.
Outlook
The outlook for the North Pacific countries is generally positive, driven by strong fishing revenues and a pipeline of donor and government-financed infrastructure. Nevertheless, substantial risks remain, due to the region’s reliance on grants, fishing revenues, and commodity imports. Fisheries revenues could fluctuate, although the Vessel Day Scheme and favorable climatic conditions have lifted collection in recent years. Higher commodity prices could make food and fuel imports costlier and inflation higher. Global financial sector volatility could affect returns on the various trust funds and their ability to provide fiscal space for priority spending or respond to future shocks, given the limited space for additional debt and the lack of monetary policy levers. Attention to the quality of spending is vital, given the countries’ large infrastructure and essential services deficit, widespread poverty, and young and growing populations—needs that cannot be met without more effective spending. In addition, room needs to be left for disaster-related expenditure shocks, which could increase in frequency and severity with climate change.
EAST ASIA AND PACIFIC ECONOMIC UPDATE APRIL 2018
134 NORTH PACIFIC ISLANDS

Figure 1. Incidence of poverty at international poverty lines
Figure 2. Public and publicly guaranteed external debt
Percent of the population Percent of GDP
40
30
20
0
10
Kiribati (2006) Micronesia, Fed. States (2013/14)
70
60
50
40
30
20
0
10
2013 2014 2015 2016 2017p2011 20122009 20102007 2008
J Extreme poverty (US$1.90/day) J Poverty (US$3.20/day) ▬ KIR ▬ MHL ▬ FSM ▬ NRU
Sources: World Bank PovCalNet. Sources: Latest available joint World Bank and IMF DSAs.
NORTH PACIFIC ISLANDS Selected Indicators 2015 2016 2017e 2018f 2019f 2020f
Real GDP growth, at constant market pricesKiribati 10.3 1.1 3.1 2.3 2.4 2.3Marshall Islands -0.4 1.9 1.7 1.8 1.6 1.6Micronesia, Federated States 4.9 -0.1 2.0 1.4 0.9 0.7Nauru 2.8 10.4 4.0 -4.0 0.2 1.5Palau 11.4 1.9 5.0 5.0 4.0 3.0
Sources: World Bank, Macroeconomics and Fiscal Management Global Practice, and Poverty Global Practice.Notes: Financial Years in the Small PICs are as follows: Nauru (Jul–Jun); MHL, FSM, and Palau (Oct–Sept). e = estimate; f = forecast.
ENHANCING POTENTIAL
NORTH PACIFIC ISLANDS 135

PAPUA NEW GUINEA
2017Population, million 8.1GDP, US$, billion 21.8GDP per capita, US$ 2,690National poverty ratea 39.9Gini coefficienta 41.0Life expectancy at birth, yearsb 65.4Source: WDI, Macro Poverty Outlook, and official data.Notes: (a) Most recent value 2009/10, national values. (b) Most recent WDI value (2015).
Summary
Real GDP growth remains moderate given the generally low commodity-price environment. The recent earthquake will place added downward pressure on growth and the fiscal balance.
Recent Developments
In 2017, with improved weather conditions as the impact of the El Niño has now passed, there are signs of expansion in the agriculture sector. Palm oil production is expected to return to normal while palm oil prices have also strengthened. The cocoa harvest is expected to increase with new areas coming into production. The mining sector is also expected to grow strongly driven by higher copper exports with the Ok Tedi mine fully recovering from the suspension of production the previous year owing to the lack of rainfall affecting
the availability of water needed for processing and transport of minerals on barges.
Notwithstanding the improved performance of the agriculture and mining sectors, in 2017 real GDP growth decelerates further to 2.1 percent. This is driven by a decline in government spending (in response to moderate revenue inflows) and a shortage of foreign currency. This shortage is making it difficult for businesses, which supply the domestic market, to source spare parts, restock their inventories and conduct other international transactions and is hampering private investment and consumption. However, with the concurrent decline in government spending, it is difficult to disentangle the precise impact of these different factors on overall growth.
On the fiscal side, in response to the low commodity-price environment, the government has undertaken fiscal consolidation resulting in an improvement in the overall budget deficit and the non-resource primary balance. Total spending stood at 13.3 billion in 2017, 2 percent lower than in 2016. At the same time, the Final Budget Outcome (2017) reports revenue growth (excluding grants) of 11.4 percent over the previous year. This is higher than the 10.6 percent growth forecast in the 2017 Supplementary Budget, with higher than expected GST revenue a key factor.
As a result, the budget deficit declined to 2.4 percent in 2017 from 4.4 percent of GDP the previous year while the non-resource primary balance improved to -1.7 percent from -4.4 percent of non-resource GDP.
Fiscal consolidation also helped the government keep the debt ratio at 31 percent of GDP in both 2016 and 2017.
Notwithstanding the lower commodity prices, on the back of LNG exports, relatively sluggish GDP growth and significant import compression due to the limited availability of foreign exchange, the current account surplus stood at 16.8 percent GDP in 2017, similar
EAST ASIA AND PACIFIC ECONOMIC UPDATE APRIL 2018
136 PAPUA NEW GUINEA

to that in 2016. The surplus in the current account is largely offset by financial account outflows due to a build-up in foreign currency account balances of resident mineral companies.
The preliminary balance of payments (BoP) data for the nine months to September 2017 showed an overall surplus of PGK327 million, compared to a surplus of K241.0 million in the corresponding period of 2016. In 2017, the BoP is expected to show an overall surplus of 0.2 percent of GDP, compared to a deficit of 0.8 percent in 2016.
Headline inflation in 2017, eased to 5.4 percent from 6.7 percent in 2016, owing primarily to lower food price inflation which declined to 2.8 percent from 5.1 over the same period. In contrast, underlying inflation increased from 2.6 percent to 3.0 percent between 2016 and 2017, with higher inflation related transport being a contributing factor.
Reflecting the slowdown in growth, formal employment declined by 0.9 percent over the year to September 2017. In the non-resource sector, formal employment declined by 1.1 percent over the year to September 2017 while formal employment in the resource sector increased by 8.1 percent over the year to September 2017.
Based on the latest household survey data, the national poverty rate in 2010 is 39.9 percent. The level of consumption inequality, measured by the Gini coefficient, is 0.41 in 2010.
Outlook
For 2018, real GDP growth is forecast to increase to 2.5 percent. This reflects a recovering agricultural sector, and APEC-related public and private expenditures having a positive impact on the services sector. Restrained government spending and shortages of foreign currency will continue to moderate growth.
In the longer-term, the outlook for growth is relatively more sanguine with the establishment of more resource projects in the 2020s.
Risks and Challenges
There are several challenges in the near-term. Firstly, the earthquake at the end of February 2018 has resulted in the shutdown of the PNG LNG facilities and increased government expenditure to undertake reconstruction and provide relief. Therefore, once the full impact of earthquake is determined, in 2018, growth is expected to be revised downwards coupled with added pressure on the fiscal balance. In this environment, maintaining macroeconomic stability and government’s ability to maintain a prudent fiscal stance and ensure public service delivery (particularly capital expenditure) in the face of limited revenue receipts will remain a challenge.
Therefore, in the near term, risks continue to be weighted on the downside. Fiscal stress and limited foreign currency inflows are expected to continue. Fiscal consolidation, while necessary in the face of lower commodity prices, runs the risk of further moderating growth. A continuation of the foreign exchange shortage would also dampen growth by moderating aggregate demand. There is a growing risk that if the FX shortage continues, an active shadow FX market will emerge openly.
ENHANCING POTENTIAL
PAPUA NEW GUINEA 137

Figure 1. Real GDP growth, contribution to real growth Figure 2. Key fiscal indicatorsPercent, percentage points Percent of GDP Percent of GDP
10
8
6
4
2
-2
0
2015 2016 2017f 2018f 2019f 2020f 2015 2016 2017f 2018f 2019f 2020f
35 24
30 22
2520
20
18
15
16
10
14
-5 10
5
120
J Agriculture, forestry & fishing J Oil & gas extraction J Mining & quarrying J Overall budget balance, lhs J Debt, lhs
J Construction J Other ▬ Total ▬ Total expenditure & net lending, rhs ▬ Revenue incl. grants, rhs
Sources: PNG Treasury, Bank of Papua New Guinea, IMF and World Bank staff calculations. Sources: PNG Treasury, Bank of Papua New Guinea, IMF and World Bank staff calculations.
PAPUA NEW GUINEA Selected Indicators 2015 2016 2017e 2018f 2019f 2020f
Real GDP growth, at constant market prices 8.0 2.4 2.1 2.5 2.7 2.9Mining and Petroleum 8.9 1.8 1.0 1.1 1.1 1.1Non-mining and non-petroleum -1.0 0.6 1.1 1.4 1.6 1.8
Inflation (Consumer Price Index p.a.) 6.0 6.7 5.4 5.0 5.1 5.3Current Account Balance (% of GDP) 13.3 16.7 16.8 20.2 19.2 18.0
Resource 17.5 19.2 21.4 24.8 23.9 22.9Non-resource -4.2 -2.5 -4.6 -4.6 -4.7 -4.9
Fiscal balance (% of GDP) -4.4 -4.4 -2.4 -2.3 -2.1 -1.7Debt (% of GDP) 29.0 31.0 31.1 30.1 30.9 31.2Sources: PNG Treasury, Bank of Papua New Guinea, IMF and World Bank staff calculations. Notes: e = estimate; f = forecast.
EAST ASIA AND PACIFIC ECONOMIC UPDATE APRIL 2018
138 PAPUA NEW GUINEA

PHILIPPINES
2017Population, million 104.9GDP, current US$ billion 311.4GDP per capita, current US$ 2,968International poverty rate ($1.9)a 6.6Lower middle-income poverty rate ($3.2)a 27.0Upper middle-income poverty rate ($5.5)a 56.1Gini coefficienta 44.4Life expectancy at birth, yearsb 69.0Sources: World Bank WDI, Macro Poverty Outlook, and official data.Notes: (a) Most recent value (2015) 2011 PPP. (b) Most recent WDI value (2015).
Summary
The Philippines’ growth performance slightly weakened in 2017 to 6.7 percent year-on-year from 6.9 percent in 2016. The main growth driver was stronger external demand due to the ongoing global recovery, while higher inflation mellowed consumption growth and investment growth slowed significantly. Monetary and fiscal policies remained accommodative. Sustained economic growth in recent years made it likely that poverty continued to decline, but recent inflation trends might adversely impact the poor.
Recent Developments
Anchored in strong exports, the Philippine economy grew by 6.7 percent year-on-year in 2017, slightly less than the 6.9 percent in 2016 (Figure 1). Export growth nearly doubled to 19.7 percent in 2017, supported by
a broad-based recovery in the global economy. Total consumption growth mellowed to 6.0 percent, as inflation climbed. But consumption growth remained close to the seven-year average of 5.8 percent, supported by robust remittances. Investment growth significantly slowed to 9.0 percent from 23.7 percent as durable equipment investment growth and construction growth weakened. On the production side, the manufacturing sector growth accelerated to 8.6 percent in 2017, and outpaced the growth in the services sector which decelerated to 6.7 percent in 2017 from 7.4 percent a year ago. Meanwhile, the agriculture sector rebounded due to higher sugarcane and rubber yields which fed into exports.
The country’s balance of payments position registered a deficit of 0.3 percent of GDP in 2017 compared to a 0.1 percent deficit in 2016. This was attributed to a widening trade deficit and net outflows of foreign portfolio investments, driven by policy rate normalization in advanced economies which made Philippine assets less attractive. As a result, the peso in nominal terms depreciated by 6.1 percent year-on-year from an average of P/US$47.51 in 2016 to P/US$50.40 in 2017. International reserves declined and import coverage shrank from an average of 9.7 months in 2016 to 8.4 months in 2017.
Despite a newly rebased CPI series, headline inflation grew in 2017 from January’s 2.5 percent to December’s 2.9 percent, averaging 2.9 percent in 2017 compared to 1.3 percent in 2016. In early 2018, inflation nearly hit the ceiling of the central bank’s target range of 4 percent, yet the policy rate remained unchanged, and in March the reserve requirement ratio was reduced. Higher food inflation due to higher prices for fish, fruits and meat, and rising energy prices affected by higher global crude oil prices, drove inflation. Core inflation also increased with the pass-through effect of a weaker peso contributing. Domestic liquidity and credit expanded with money supply increasing by 13.2 percent year-on-year in 2017, and credit growth expanding by 17.8 percent in 2017.
ENHANCING POTENTIAL
PHILIPPINES 139

The fiscal deficit shrank to 2.2 percent of GDP in 2017 from 2.4 percent in 2016, falling below the government’s 3.0 percent deficit target in 2017. Public expenditure reached 17.9 percent of GDP in 2017 slightly up from 17.6 percent of GDP in 2016. However, the government still fell short of its programmed spending for 2017 by three percent. Expenditure growth was driven by infrastructure outlays which reached 3.6 percent of GDP. Despite the Bureau of Customs and Bureau of Internal Revenue missing narrowly their collection targets for 2017, revenues reached 15.7 percent of GDP in 2017 compared to 15.2 percent in 2016. Meanwhile, the debt-to-GDP ratio remained constant at 42.1 percent in 2017 as nominal GDP growth kept pace with the growth of the national government debt stock.
Sustained economic growth in recent years made it likely that poverty has continued to decline since 2012. Based on the lower middle-income class poverty line (US$3.20/day in 2011 PPP), poverty is estimated at 27.0 percent in 2015, and 24.2 percent in 2017. Factors that drove poverty reduction in the past - including the movement of employment out of agriculture, remittances and the government’s conditional cash transfer - are likely to continue to push the poverty ratio down. The rebound in agriculture is expected to benefit the poor disproportionately as a large share of their income is from agriculture, but the recent increase in inflation might have adversely impacted them since they spend a significant share of income on food.
Outlook
The Philippine economy is projected to maintain its growth rate at 6.7 percent in 2018 and 2019. Any growth above 6.7 percent would require vigorous investment in physical and human capital to push the economy beyond its current potential output. Investment growth hinges on the government’s ability to effectively and timely implement the Build, Build, Build public investment program. The country is expected to benefit from the global recovery during 2018. However, in 2018, export
growth is expected to level off compared to its strong expansion in 2017 while imports are projected to remain elevated due to high demand for intermediate and capital goods.
The poverty rate based on the lower middle-income class line is projected to decline to 22.9 percent in 2018 (Figure 2). The pace of poverty reduction might drop slightly in the face of the increase in inflation, but poverty is expected to continue to fall as the economy continues to grow and transition out of agriculture. The sustained overall growth would support the continuous poverty reduction.
Risks and Challenges
Downside risks to economic prospects include a faster-than-expected pace of policy rate normalization in advanced economies which could further adversely impact capital flows and weaken the peso. Exacerbated by the widening of the current account deficit, the effect of a weaker peso can pass through higher domestic prices, and increase inflationary pressure at a time when global commodity prices are rising. The monetary authority would need to watch for early overheating signs and if necessary adjust its accommodative monetary policy stance. In addition, the medium-term growth prospects hinge on the sustained pick up in both public and private investment, which is partly dependent on the implementation of the government’s public investment program. As the pace of public expenditure growth accelerates, authorities must remain mindful of rising deficits and increasing financing costs amidst tighter global financing conditions, which may be cushioned by the revenue impact of the ongoing tax reform legislation.
Structural policies that support investment and trade are critical to boost productivity and growth. This requires government’s commitment to reforms that promote competition, secure property rights, lessen regulatory complexities, and improve doing business
EAST ASIA AND PACIFIC ECONOMIC UPDATE APRIL 2018
140 PHILIPPINES

in the country. The country’s most pressing challenge remains the delivery of inclusive growth, sustained investment in physical infrastructure and human capital such as in education, skills and health, are important to create quality employment especially among the poor.
Figure 1. Real GDP growth, contribution to real growth Figure 2. The sustained growth of the economy makes it likely that poverty reduction has continued
Percent, percentage points Poverty rate, percent GDP per capita, constant LCU, in thousands
20
15
10
5
0
-5
-15
-10
2013 2014 2015 2016 2017 2003 2005 2007 2009 2011 2013 2015 2017 2019f
70
60
50
40
30
20
10
0
120
100
80
60
40
20
0
J Private consumption J Government consumption J Investments ▬ International poverty rate ▬ Lower middle-income
J Exports J Imports ▬ GDP growth ▬ Upper middle-income ▬ GDP per capita
Source: Philippine Statistics Authority. Sources: Philippine Statistics Authority and World Bank staff estimates.
PHILIPPINES Selected Indicators 2015 2016 2017e 2018f 2019f 2020f
Real GDP growth, at constant market prices 6.1 6.9 6.7 6.7 6.7 6.6Private Consumption 6.3 7.0 5.8 5.8 6.2 6.1Government Consumption 7.6 8.4 7.3 8.9 7.1 6.6Gross Fixed Capital Investment 16.9 25.2 10.3 11.8 11.9 12.6Exports, Goods and Services 8.5 10.7 19.2 15.1 15.0 15.0Imports, Goods and Services 14.6 18.5 17.6 15.8 15.8 16.0
Real GDP growth, at constant factor prices 6.1 6.9 6.7 6.7 6.7 6.6Agriculture 0.1 -1.3 3.9 3.7 3.0 2.5Industry 6.4 8.4 7.2 7.4 7.4 7.6Services 6.9 7.4 6.7 6.8 6.8 6.5
Inflation (Consumer Price Index) 0.7 1.3 2.9 3.3 3.0 3.0Current Account Balance (% of GDP) 2.5 -0.4 -0.8 -1.2 -1.4 -1.6Financial and Capital Account (% of GDP) 0.8 0.1 -0.7 0.1 0.1 0.1
Net Foreign Direct Investment (% of GDP) 2.0 2.7 3.2 3.1 3.0 3.1Fiscal Balance (% of GDP) -0.9 -2.4 -2.2 -2.5 -2.6 -2.8Debt (% of GDP) 36.2 34.6 34.6 34.4 34.3 34.3Primary Balance (% of GDP) 1.2 -0.3 -0.4 -0.5 -0.6 -0.7International poverty rate ($1.9 in 2011 PPP)a,b 6.6 5.8 5.1 4.5 4.0 3.6Lower middle-income poverty rate ($3.2 in 2011 PPP)a,b 27.0 25.5 24.2 22.9 21.7 20.6Upper middle-income poverty rate ($5.5 in 2011 PPP)a,b 56.1 55.2 54.3 53.5 52.6 51.8Source: World Bank, Poverty & Equity and Macroeconomics, Trade & Investment Global Practices.Notes: e = estimate, f = forecast. (a) Calculations based on EAPPOV harmonization, using 2006-FIES and 2015-FIES. Actual data: 2015. Nowcast: 2016–2017. Forecast are from 2018 to 2020. (b) Projection using annualized elasticity (2006–2015) with pass-through = 1 based on GDP per capita in constant LCU.
ENHANCING POTENTIAL
PHILIPPINES 141

SOLOMON ISLANDS
2017Population, million 0.6GDP, current US$ billion 1.4GDP per capita, current US$ 2,187National basic needs poverty rate (%) 12.7Gini coefficienta 37.1School enrolment, primary (% gross)a 114.3Life expectancy at birth, yearsa 70.5Source: WDI, Macro Poverty Outlook, and official data.Note: (a) Most recent WDI value (2015).
Summary
A new Government inherited a precarious fiscal situation after three years of poor fiscal management that led to deficits and a depletion of cash reserves. The macroeconomic situation is benign, with average growth expected to remain at trend of around 3 percent and low inflation. Risks include a sharper than expected downturn in the Chinese economy, and uncertainties in the logging and mining sectors. Current fiscal consolidation efforts ahead of next year’s elections and greater private sector investment to promote inclusive economic growth are necessary.
Recent Developments
Economic growth for 2017 is estimated at 3.2 percent, driven by agriculture, fishing, and investments in construction, communications and manufacturing. Output in the logging sector, a key driver of growth
over the recent decade, is expected to have stabilized in 2017. Domestic activity, as measured by the Central Bank’s production index, has been somewhat volatile since the second half of 2016. Following a strong performance in the last six months of 2016, the production index decelerated over the first half of 2017 by 9 percent, to 87 index points, driven mainly by weak performance in three of the major export commodities (cocoa, log output and fish catch). Production recovered significantly over the second half of the year, to index 113 points in November, largely driven by a robust pick-up in log output. International prices for most of Solomon Islands’ key export commodities fell during 2017, notably for palm oil (17 percent), copra (22 percent), and cocoa (13 percent). International fish prices, on the other hand grew by 30 percent over the same period.
On the fiscal side, continued public financial management problems throughout 2017 resulted in the accumulation of substantial domestic payment arrears (equivalent to 1.4 percent of GDP), impeding private sector activity. Since 2015, the government has pursued expansionary fiscal policy with targeted investments towards rural infrastructure and development, and the health and education sectors—potentially important and direct investments in improving the well-being of Solomon Islands’ poor. Between 2015 and 2017, the government posted fiscal deficits, financed through a draw-down of the government’s cash reserves. This increase in expenditures resulted in cash reserves declining from 3.6 months of recurrent spending in end-2015, to around 1 month at end-2017, significantly eroding the government’s ability to absorb future exogenous shocks. A newly-formed government in end-2017 has committed to eliminate payment arrears and re-establish a balanced budget in 2018, to start rebuilding cash reserves to adequate levels. Priority areas of government spending to be protected from expenditure restraint in 2018 include health, education and national security.
EAST ASIA AND PACIFIC ECONOMIC UPDATE APRIL 2018
142 SOLOMON ISLANDS

Total PPG external debt stood at 8.2 percent of GDP in end-2017. As such, Solomon Islands continues to enjoy one of the lowest debt-to-GDP ratios in the EAP region, and globally. The most recent Debt Sustainability Analysis, undertaken in late 2017, continues to classify Solomon Islands at a moderate risk of debt distress with the baseline scenario subject to significant risks, resulting from a lower-than-expected growth path and a shock to financing terms.
International reserves stood at US$500 million at end-2017, equivalent to 8.5 months of imports. The current account is projected to have widened from 3.9 percent of GDP in 2016 to 4.4 percent in 2017, to support imports related to large infrastructure projects. Inflation remained contained at 1 percent in 2017.
Outlook
Solomon Islands’ economy is projected to grow on average by around 3 percent per year over the medium-term, driven by major infrastructure investments in the road transport, telecommunications and energy sectors. This baseline scenario also assumes resumed gold-mining activity, the exploitation of large nickel deposits, and sustained levels of foreign direct investment averaging 3.3 percent of GDP.
A return to sound fiscal management in 2018, complemented by key public financial management reforms and the commencement of a tax review, could lay the foundation for additional fiscal space for spending in the social sectors, and on much-needed infrastructure investments, while rebuilding fiscal buffers over the medium-term. Payment of domestic expenditure arrears are expected to instil confidence and reduce delays in capital expenditures. Ongoing expenditure pressures associated with the 2019 general elections, the government’s tertiary education scholarships program, and the hosting of the 2023 South Pacific Games pose a continued risk to medium-term fiscal consolidation.
The current account deficit is expected to widen to 5.0 percent of GDP by end-2018, reflecting an increase in imports related to much needed infrastructure and energy projects, and the underlying long-run decline in logging exports. The Honiara Consumer Price Index is expected to remain at around 3 percent over the medium term.
Risks and Challenges
In the near term, growth will be supported by major infrastructure projects and logging may not decline significantly. This outlook is subject to considerable risks, particularly from any contraction in log demand in China (the main export destination for logs), or delays in infrastructure projects. Thereafter, the impending decline of the logging industry will likely significantly reduce growth and a vital source of government revenue. With accessible logging sources expected to be fully depleted in the long run and uncertainty around the exploitation of the country’s mining potential, Solomon Islands faces the challenge of developing new sources of growth. Mining has the potential to become a key driver of growth but future developments in the mining sector hinge on the development of a legal and regulatory framework conducive to mining, and on clear procedures for the acquisition of land (for the exploration and exploitation). Such frameworks and procedures will also ultimately impact the extent to which forthcoming benefits from mining are shared across the population
ENHANCING POTENTIAL
SOLOMON ISLANDS 143

Figure 1. Trade and trade balance Figure 2. Per capita GDP, growth and level of indexUS$, thousands Percent of GDP Percent growth Index
40
30
20
10
0
-10
-20
-30
-40
900
800
700
600
500
400
300
200
100
0
20092012
20192015
20062007
20082016
20172018
20132014
20102011
20212020
20092012
20192015
20062007
20082016
20172018
20132014
20102011
20212020
12
10
8
6
4
2
0
-2
-4
-6
-8
160
140
120
100
80
60
40
20
0
J Trade balance, rhs ▬ Imports ▬ Exports J Real GDP per capita, percent change ▬ Real GDP per capita index (2003=100), rhs
Sources: Central Bank of the Solomon Islands, World Bank staff estimates, IMF.Note: rhs= right-hand side.
Sources: World Bank staff estimates, IMF.Note: rhs= right-hand side.
SOLOMON ISLANDS Selected Indicators 2015 2016e 2017e 2018f 2019f 2020f
Real GDP growth, at constant market prices 2.5 3.5 3.2 3.0 2.9 2.8Inflation (Consumer Price Index p.a.) -0.6 0.5 1.0 1.2 2.0 2.7Balance of Payments
Current account balance (% of GDP) -3.0 -3.9 -4.4 -5.0 -6.4 -6.8Imports (goods and services, % of GDP) 53.5 50.7 50.8 51.2 52.5 52.2Exports (goods and services, % of GDP) 45.5 44.9 44.2 42.8 42.4 41.7Foreign direct investment (% of GDP) 2.8 3.0 4.5 2.5 3.6 3.7
Fiscal Balance (% of GDP) -0.2 -3.1 -4.3 0.0 0.1 0.3External Debt (% of GDP) 9.7 7.5 8.2 11.9 13.9 16.2Sources: World Bank, Poverty & Equity and Macroeconomics, Trade & Investment Global Practices.Notes: e = estimate; f = forecast.
EAST ASIA AND PACIFIC ECONOMIC UPDATE APRIL 2018
144 SOLOMON ISLANDS

SOUTH PACIFIC ISLANDS
2016Population, million 0.58GDP, US$ billion 2.00GDP per capita, current US$ 3,419Sources: WDI, World Bank staff estimates.
Summary
The small South Pacific Island Countries (PICs)—Samoa, Tonga, Tuvalu, and Vanuatu—have generally seen solid growth in recent years, driven by donor-funded investments in some cases, and strength in the agriculture, tourism, and commerce sectors in others. In Tonga, Cyclone Gita is likely to reduce growth in the near term, while recovery and reconstruction in Vanuatu and Tuvalu after Cyclone Pam in 2015 has helped to boost economic activity. Maintaining fiscal sustainability in the face of large and frequent shocks remains a challenge for these countries.
Recent Developments
Economic growth in Samoa slowed to 2.4 percent in FY2017, down from around 7 percent in FY2016 (year ending June), due to slowing activity in the construction sector (reflecting the completion of major infrastructure works in 2016), the transport sector, and in the commercial fishing industry. Nevertheless, activity in the wholesale and retail sectors has remained strong. Average annual inflation remained
contained at 1.3 percent in FY2017, with declines in local prices offsetting a modest pickup in the prices of imported goods (particularly fuel) in FY2017. The current account deficit narrowed to 2.3 percent of GDP in FY2017, below levels observed in previous years, during which disaster-recovery and other construction activities tended to increase the import bill. Samoa’s foreign exchange reserves currently stand at around 3.7 months of imports, and may need to be bolstered over time.
Comprehensive revenue policy and administrative reforms have led to significant increases in domestic revenue collection over the last five years. Combined with tighter controls on operating expenditure, these increases in revenue have helped to substantially reduce the budget deficit, despite a pronounced decline in external grants over the same period. While the deficit increased modestly to 1.1 percent of GDP in FY2017, from 0.4 percent of GDP in FY2016, this was mainly due to a pick-up in infrastructure spending and a further decline in grants, with current spending declining by 1.5 percentage points of GDP. While Samoa’s external public debt remains high compared with most other small PICs, as a proportion of GDP it has declined below the government’s target of 50 percent, down from its peak of 55 percent in FY15.
Growth has remained robust in Tonga in recent years, although Cyclone Gita caused widespread damage and loss of income in Tongatapu and ‘Eua in February, adversely affecting livelihoods. Growth in FY2017 (year ending June) was estimated at 2.7 percent, a slight slowing from FY2016 but still relatively fast in historical terms, supported by infrastructure construction, and strength in the agriculture and tourism sectors. While inflation has been very subdued in recent years, it spiked to 7.2 percent in year-average terms in FY2017, due to policy-driven tax increases on fuel, alcohol, tobacco, and less healthy foods and drinks, as well as the effects of dry weather which pushed up domestic food prices. This may have increased cost-of-living pressures for some households. While inflation should
ENHANCING POTENTIAL
SOUTH PACIFIC ISLAND COUNTRIES 145

eventually return to more modest rates as these one-off effects pass through, over the short to medium term Cyclone Gita will likely continue to put upward pressure on food prices in particular. Due to construction-related imports, the current account deficit is estimated to have remained sizable at 12 percent of GDP in FY2017, though this was largely financed by capital grants. Official foreign exchange reserves currently stand at around 6 months of import cover.
The government continues to focus on increasing domestic revenues, which have increased by over 5 percentage points of GDP from FY2013 to FY2017, supported by a series of policy and administration reforms. Total public spending has also increased, mostly in response to cyclone reconstruction needs and increases in wages for civil servants. The fiscal balance has been volatile in recent years, with a narrow deficit of 0.4 percent of GDP estimated for FY2016 and FY2017.
Economic growth has picked up in Tuvalu, with 2.6 percent growth in 2015 and estimated growth of around 3.0 percent in 2016, partly due to recovery spending following Cyclone Pam. Government and donor funded investments, including in outer-islands schools and clinics, have also supported growth. In 2017, growth is estimated to have fallen slightly to 2.8 percent, reflecting a slow-down in government spending. Inflation is estimated to have declined to 2.9 percent in 2017 from 3.5 percent in 2016.
Government expenditure has risen in recent years, reflecting an expansion in capital spending and increased wages, salaries and transfers. The pick-up in expenditure has been more than offset by rising fishing license fees (estimated at around 73 percent of GDP in 2016 and 58 percent of GDP in 2017) on the back of favorable exchange rates, weather conditions, and access fees. As a result, despite the large one-off expenditures related to Tropical Cyclone Pam, the government has achieved fiscal surpluses averaging around 13 percent of GDP since 2015, which have
largely been reinvested into the Tuvalu Trust Fund and Survival Fund.
The current account moved from a net surplus of around 3.3 percent in 2015 to a modest deficit of around 1.3 percent of GDP equivalent in 2017, due to increased imports for government and donor funded investment projects. The deficit has been largely financed by TTF returns and high fishing license revenues. Remittances, which are dominated by transfers from seafarers, have been in long-term decline, and are now slightly under 10 percent of GDP. Gross reserves have remained adequate, covering around six months of imports in 2016 and 2017.
Vanuatu has gradually recovered from the impact of Tropical Cyclone Pam which struck in 2015. A recovery in the agriculture sector (which had been hampered by unusually dry conditions triggered by El Niño throughout 2015 and early 2016), and tourism, and the further ramping-up of infrastructure projects are expected to have propelled GDP growth to around 4 percent in 2017. Inflation is estimated at 3.1 percent in 2016, reflecting increased domestic demand for food, transport and education. The current account is estimated to have widened to just over 10 percent of GDP in 2017, in line with the high import content of infrastructure projects. Gross official reserves were estimated at US$341 million in 2017, equivalent to 9.5 months of import cover.
In the first three quarters of 2017, tourism arrivals declined by 5 percent year-on-year, due to a decline in arrivals by sea. The recent completion of the Luganville wharf and upgrades to the Port Vila wharf are expected to help reverse this trend.
In 2016, the incoming government committed to advancing major construction projects (which had previously stalled), resulting in fiscal pressures in 2016 and 2017. An increase in VAT in 2018 (from 12.5 percent to 15 percent), further improvements in tax administration and compliance, and the proposed
EAST ASIA AND PACIFIC ECONOMIC UPDATE APRIL 2018
146 SOUTH PACIFIC ISLAND COUNTRIES

introduction of income tax are expected to ease these pressures. Although this may increase cost-of-living pressures, the largest contribution to the increased tax take should be borne by those with greater levels of income and consumption.
Outlook
In Samoa, the August 2017 exit of a major manufacturer of automotive wire harnesses is likely to have dampened economic activity, with growth in FY18 projected to slow to below 2 percent. Growth is expected to increase in subsequent years due to a series of one-off factors, before returning to an annual rate of around 2 percent over the medium term, supported by construction of public infrastructure and increased productive capacity in the tourism and agriculture sectors. As public debt remains high, it is important that fiscal restraint is maintained.
In FY2018 and FY2019, growth in Tonga was previously projected at around 3 percent, though the near-term outlook for the remainder of FY2018 and FY2019 is now likely to be driven by Cyclone Gita-related recovery and reconstruction activities and the extent of losses in the agriculture and tourism sectors. The FY2018 budget was modestly expansionary and reflected quite optimistic domestic revenue projections, which may be difficult to meet given the unforeseen impact of the cyclone. A key challenge facing Tonga in the next few years is to maintain a prudent fiscal stance, including through careful management of the government wage bill and prioritization of reconstruction spending.
In Tuvalu, the economy is expected to grow at around 2 percent per year over the medium term, with economic performance remaining dependent on the public sector and donor-funded expenditures. Income flows from fishing license revenues are volatile and difficult to predict, but there is a good chance that the recent high levels will not be sustained. Given the potential for a tightening in available resources, improving the quality
of expenditure and preserving fiscal buffers will be important.
In Vanuatu, if current and planned public investments are undertaken efficiently, and with due regard to domestic capacity constraints, they should boost Vanuatu’s potential growth rate and ensure that services are available to the poorest and most vulnerable. Given the government’s conservative fiscal stance in recent years, it now has some fiscal space to take on moderate levels of concessional debt to meet its post-cyclone recovery and broader development needs.
ENHANCING POTENTIAL
SOUTH PACIFIC ISLAND COUNTRIES 147

Figure 1. Incidence of poverty at international poverty lines and national hardship thresholds
Figure 2. Public and publicly guaranteed external debt
Percent of the population Percent of GDP
40
35
30
25
20
15
10
5
0TON2009
WSM2008
TUV2010
VUT2010
70
60
50
40
30
20
10
0
2010 2011 2012 2013 2016 201720152014
J Extreme poverty (US$1.90/day) J Poverty (US$3.20/day) ▬ Samoa ▬ Tonga ▬ Tuvalu ▬ Vanuatu
J Nationally defined hardships Sources: Latest available joint World Bank and IMF DSAs.
Sources: World Bank (2016), Systematic country diagnostic for the eight small Pacific Island Countries.
SOUTH PACIFIC ISLANDS Selected Indicators 2015 2016 2017e 2018f 2019f 2020f
Real GDP growth, at constant market pricesSamoa 1.6 7.1 2.4 1.8 3.2 5.0Tonga 3.7 3.4 2.7 2.0 3.0 3.5Tuvalu 2.6 3.0 2.8 2.3 2.2 2.0Vanuatu 0.2 3.5 4.2 3.8 2.5 3.0
Sources: World Bank, Macroeconomics and Fiscal Management Global Practice, and Poverty Global Practice.Notes: Financial years for Tuvalu and Vanuatu (Jan–Dec); Samoa and Tonga (Jul–Jun). e = estimate; f = forecast.
EAST ASIA AND PACIFIC ECONOMIC UPDATE APRIL 2018
148 SOUTH PACIFIC ISLAND COUNTRIES

THAILAND
2016Population, million 68.1GDP, current US$ billion 407.0GDP per capita, current US$ 5,973School enrolment, primary (% gross)a 103.7Life expectancy at birth, yearsa 74.4Source: WDI, Macro Poverty Outlook, and official data.Notes: (a) Most recent WDI value (2014).
Summary
Thailand’s economic recovery gained momentum, driven by external demand and gradual recovery in private investment. Thailand grew 3.9 percent in 2017, above market expectations. Export growth accelerated to 7.5 percent driven by merchandise exports and rebound in tourism. Headline inflation was below the target range of 1-4 percent. Low inflation also reflects declining agricultural prices, which could slow down poverty reduction. Growth is projected to exceed 4 percent in 2018, but downside risks remain high from slower private investment and rising global protectionism.
Recent Developments
Thailand’s economic recovery has gained momentum in recent months driven by external demand and gradual recovery in domestic investments. Annual growth
improved to 3.9 percent in 2017, the highest since 2012.
Macroeconomic fundamentals remain stable, with headline inflation at less than 1 percent, current account in surplus and financial stability maintained with stable ratios of Non-Performing Loans (NPLs) and loan concentration among sectors being reduced.
Exports was the main driver of growth, growing by 7.5 percent in 2017, the highest since 2011. This was supported by better than expected global economic performance increasing demand for Thailand’s merchandise exports, especially for electronics. Tourism also rebounded in 2017 with a 9 percent increase in tourist arrivals after a relative slowdown in 2016 driven by measures to curb illegal tour operators.
Domestic demand growth continued to expand in 2017, albeit at a gradual pace. Private consumption continued to grow at slightly over 3 percent, driven by improved purchasing power of non-agricultural households, counterbalanced by dampened consumption growth among agricultural households due to lower agricultural prices.
Private investment remains a cause for concern, growing at a modest 2.1 percent in 2017. Increased outlays for machinery and equipment, reflected in higher capital goods imports, were offset by a decline in construction activity. Leading indices of business confidence remain at levels lower than in 2011.
Government investment decelerated in 2017 reflecting challenges in execution of the fiscal stimulus projects, due to inclement weather and delays in approval and procurement processes.
Poverty is expected to decline at a slower rate in rural areas in the medium term as agricultural prices are not expected to reach highs observed in recent years. Growth could become less inclusive, with the rural poor
ENHANCING POTENTIAL
THAILAND 149

negatively affected unless agricultural productivity increases.
Outlook
Thailand’s economic recovery is expected to gather pace in 2018. Growth is projected to accelerate further to 4.1 percent in 2018, driven by continued strength of exports and a boost in public investment activity due to approval of large infrastructure projects and spending by state owned enterprises. Private investment is also expected to pick up, reflecting potential crowding in from progress of critical public infrastructure connectivity projects.
However, economic growth may experience a tapering in the medium term. The pace of expansion of exports is expected to moderate, reflecting high base effects and the dissipation of the impact of positive export shocks such as the relocation of production base of electronics to Thailand. Government investment may also taper after strong growth in 2018 due to possible delays in mega projects.
Macroeconomic stability will likely be maintained, while fiscal and monetary policy stances are expected to remain accommodative. Headline inflation is unlikely to breach the inflation target range of 1–4 percent amid anchored inflationary expectations. Monetary and fiscal buffers are expected to remain adequate with room for further expansion to support economic activity, if needed.
Risks and Challenges
The key risk to the outlook is a lower spillover from external to domestic demand, especially for private investment. Private investment sentiment has recovered slowly since falling sharply in 2012, with some indication of planned increase in activity signaled by higher capital goods imports. However, private
investors remain concerned about political uncertainty and delays in planned public infrastructure projects to improve connectivity. The extent of crowding-in will depend critically on the progress on execution of mega-projects including under the Eastern Economic Corridor.
Downside risk also comes from external demand. Deceleration in growth in key trading partners such as the US and increased protectionism may diminish export growth. Thailand may also face risks to external financing flows due to recent changes in US tax policy and potential increase in US bond yields driven by increase in US interest rates.
In the medium term, raising Thailand’s potential growth above 4-5 percent remains a challenge and a national priority. Continuity in implementing the 20-year national strategy in areas such as education, public investment management and services are critical to raising productivity growth and achieving high-income status as Thai society rapidly ages.
EAST ASIA AND PACIFIC ECONOMIC UPDATE APRIL 2018
150 THAILAND
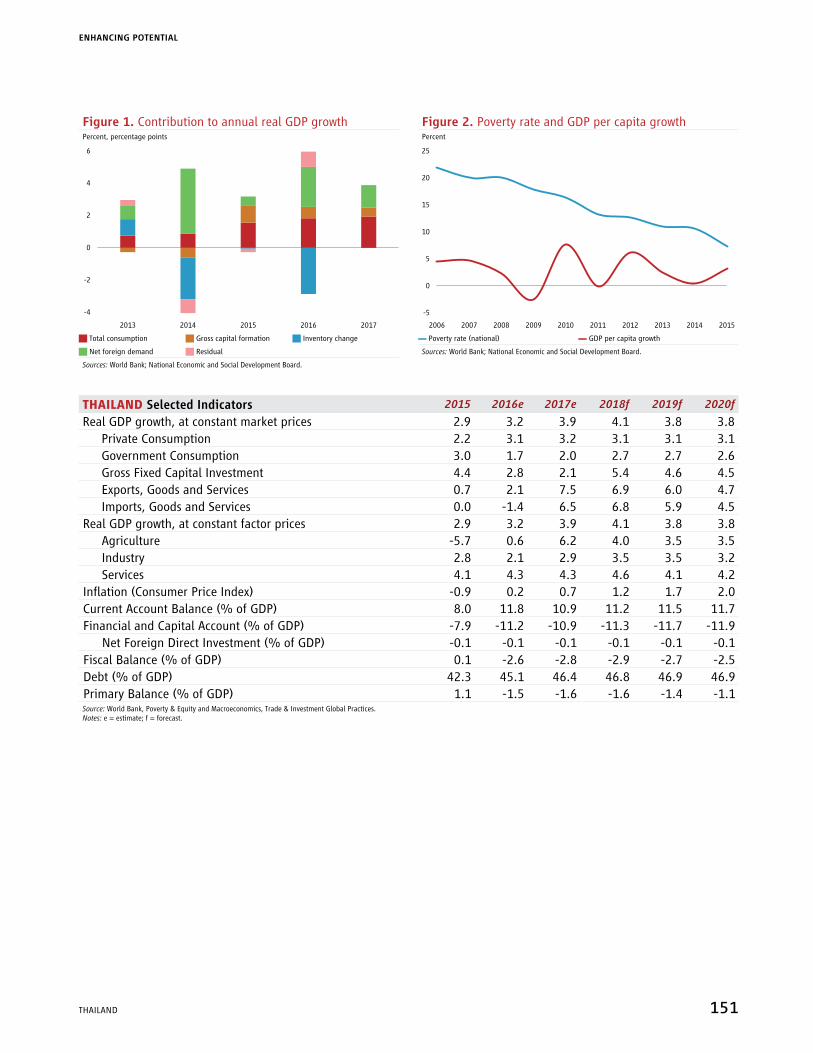
Figure 1. Contribution to annual real GDP growth Figure 2. Poverty rate and GDP per capita growthPercent, percentage points Percent
6
4
2
0
-2
-4
2013 2014 2015 2016 2017
25
20
15
10
5
-5
0
200820072006 2009 2010 2011 2013 201520142012
J Total consumption J Gross capital formation J Inventory change ▬ Poverty rate (national) ▬ GDP per capita growth
J Net foreign demand J Residual Sources: World Bank; National Economic and Social Development Board.
Sources: World Bank; National Economic and Social Development Board.
THAILAND Selected Indicators 2015 2016e 2017e 2018f 2019f 2020f
Real GDP growth, at constant market prices 2.9 3.2 3.9 4.1 3.8 3.8Private Consumption 2.2 3.1 3.2 3.1 3.1 3.1Government Consumption 3.0 1.7 2.0 2.7 2.7 2.6Gross Fixed Capital Investment 4.4 2.8 2.1 5.4 4.6 4.5Exports, Goods and Services 0.7 2.1 7.5 6.9 6.0 4.7Imports, Goods and Services 0.0 -1.4 6.5 6.8 5.9 4.5
Real GDP growth, at constant factor prices 2.9 3.2 3.9 4.1 3.8 3.8Agriculture -5.7 0.6 6.2 4.0 3.5 3.5Industry 2.8 2.1 2.9 3.5 3.5 3.2Services 4.1 4.3 4.3 4.6 4.1 4.2
Inflation (Consumer Price Index) -0.9 0.2 0.7 1.2 1.7 2.0Current Account Balance (% of GDP) 8.0 11.8 10.9 11.2 11.5 11.7Financial and Capital Account (% of GDP) -7.9 -11.2 -10.9 -11.3 -11.7 -11.9
Net Foreign Direct Investment (% of GDP) -0.1 -0.1 -0.1 -0.1 -0.1 -0.1Fiscal Balance (% of GDP) 0.1 -2.6 -2.8 -2.9 -2.7 -2.5Debt (% of GDP) 42.3 45.1 46.4 46.8 46.9 46.9Primary Balance (% of GDP) 1.1 -1.5 -1.6 -1.6 -1.4 -1.1Source: World Bank, Poverty & Equity and Macroeconomics, Trade & Investment Global Practices.Notes: e = estimate; f = forecast.
ENHANCING POTENTIAL
THAILAND 151

TIMOR-LESTE
2017Population, million 1.3GDP, current US$ billion 1.7GDP per capita, current US$ 1,302International poverty rate ($1.9)a 30.3Gini coefficienta 28.7School enrolment, primary (% gross)b 136.8Life expectancy at birth, yearsb 68.6Source: WDI, Macro Poverty Outlook, and official data.Notes: (a) Most recent value (2014), 2011 PPPs. (b) Most recent WDI value (2015).
Summary
GDP growth is expected to have fallen sharply in 2017 to -1.8 percent, driven by a decline in public spending as the government has not been able to secure a legislative mandate. To resolve the ongoing political impasse, new elections will be held in May 2018 and, following the formation of a new government, public spending is expected to moderate upwards again later in 2018. The budget continues to consume more resources that can be sustainably drawn from the Petroleum Fund, with the risk of a damaging fiscal cliff in the medium-term when state resources are depleted.
Recent Developments
GDP growth is expected to have fallen sharply in 2017 to a projected -1.8 percent from 5.3 percent the year
before.1 This contraction has been driven by lower government spending, and is sharper than predicted six months ago, as Parliament did not pass a proposed rectification budget, leading to especially large falls in expenditure year-on-year in the last quarter. Overall public spending fell by 24 percent. The public sector accounts for 75 percent of GDP, so it can drive overall GDP growth trends. Private consumption is expected to be more resilient in 2017 as civil service salaries were the only area of spending to increase. GFCF is expected to have fallen sharply in 2017 with the fall in public investment accompanied by declining inward foreign investment. By Q3 2017, air passenger arrivals were 12 percent higher year-on-year, suggesting that service exports due to the international visitor market continued to grow. Total aircraft movements stood at 856 in the third quarter of 2017, the highest quarterly level recorded to date. However, exports of coffee, Timor-Leste’s main non-petroleum merchandize export, have fallen sharply in 2017 compared to 2016. Petroleum production fell by 14 percent in 2017. An alternative measure of GDP, which includes both onshore economic activity and a pro-rated amount of activity from the offshore oilfields is expected to have contracted by approximately 10 percent in 2017 in real terms.
2017 was a strong year for government receipts overall, with petroleum receipts and investment returns from the Petroleum Fund (PF) both rising. Yet, non-oil revenue mobilization declined to US$180m, or 10.8 percent of GDP. Balances in the PF grew from US$15.8bn at end 2016 to US$16.8bn at end 2017. Government expenditure, which reached an unprecedented level of US$1.77bn in 2016, has fallen back in 2017 by 24 percent to US$1.35bn with a tighter budget, especially compared in the final quarter, when in previous years large amounts of capital budget were expended. Capital expenditure more than halved (or, excluding a one-off payment to an escrow account in 2016, fell by 30 percent), most of which was spent on road construction. Current expenditure also contracted,
1 Unless specified, GDP refers to the domestic economy excluding production activity in areas of joint-sovereignty, such as the Joint Petroleum Development Area (JPDA). This is sometimes also referred to as ‘non-oil GDP’ to distinguish it from measures of GDP that include some proportion of activity from joint-sovereignty areas (or ‘total GDP’).
EAST ASIA AND PACIFIC ECONOMIC UPDATE APRIL 2018
152 TIMOR-LESTE

by 8 percent to US$940m in 2017. 2017 was the first year amortization payments fell due on public sector debt. The government budget balance is volatile, and the “ESI-adjusted budget balance”,2 calculated as domestic revenue plus ESI less total expenditure, has been steadily deteriorating in recent years, although in 2017, the fiscal consolidation led it to recover from -51 percent of GDP in 2016 to -32 percent of GDP in 2017.
Annual average CPI inflation increased moderately over 2017 to 0.6, from -1.3 percent in 2016, largely driven by prices movements in tradable sector, and depreciation of its currency, the US dollar, in the last year. Credit to the private sector has been stagnant for some time but in 2017, private sector credit began to grow rapidly again, increasing by 25 percent over 2017.
Estimates from the latest living standard survey show the poverty rate in Timor-Leste, based on the national poverty line, declined from 50.4 percent in 2007 to 41.8 percent in 2014. Progress with poverty reduction was uneven across the country: poverty in rural areas, which account for about 80 percent of the poor, fell at a slower rate than in urban areas. Across regions, poverty incidence remains the highest in the Western region (55.5 percent). Despite having the lowest poverty rate, poverty in the Eastern region increased slightly from 31.6 percent to 33.8 percent during 2007–2014, while by contrast the Central region experienced the greatest decline during this period, from 54.3 percent to 40 percent.
Outlook
Growth is expected at 2.2 percent in 2018, lower than the 4 percent forecast six months ago due to continued slow government spending in the first half of the year while the current government lacks a legislative mandate for new spending programs. The return to growth would be driven by a moderate rebound in government
2 Notes: The Estimated Sustainable Income (ESI) is a legally-determined amount that can be sustainable withdrawn each year from the PF for budget financing.
spending in latter part of the year. While the outlook further ahead will be strongly affected by the program of the incoming government, a gradual continuation of historical government policy and recovery in private sector confidence is expected to see growth of 4.2 percent in 2019. The outlook for the private sector is now more uncertain than it was six months ago, and reestablishing regular government operations would be important to strengthen confidence in the positive future trajectory of the economy. FDI stands at its lowest levels than any time in the last 10 years. Some projects which have been delayed should start in earnest in 2018, while other going projects, such as the new Hilton hotel, will continue. A number of relatively large projects are currently under discussion in the tourism and light manufacturing sectors which are not explicitly included in the forecast, and should these projects become confirmed, the private investment outlook may strengthen further. Over the longer term, the outlook for new oil and gas development has improved, with Australia and Timor-Leste agreeing a clear legal framework in early 2018, although development of new capacity, should it occur, is still expected to be some years away.
Risks and Challenges
The outlook for growth depends on how the political situation evolves over 2018, as this will affect both the capacity of the public sector to deliver public services as well as the program of the government. A continuation of the political impasse which has seen the current government unable to pass budget legislation is likely to have adverse impacts on government service delivery, as well as business confidence. While 2017 saw a fiscal consolidation, the government budget remains deeply unsustainable, and a strengthening of pillars of a sustainable financing strategy—enabling private sector growth and developing an efficient domestic revenue mobilization framework—will be needed to avoid a fiscal cliff in the future.
ENHANCING POTENTIAL
TIMOR-LESTE 153

Figure 1. Contributions to real GDP growth Figure 2. Fiscal aggregatesPercent, percentage points Percent of GDP
14
12
10
8
6
4
2
0
-2
-4
-6
-8
-10
2014 2015 2016 2017 2018f 2019f 2015 2016 2017 2018f 2019f
150
125
100
75
50
25
0
-25
-50
-75
J Consumption J Gross fixed capital formation J Net exports J Total expenditure J Total revenue J Domestic revenue + ESI
J Stocks and statistical discrepancy Q Overall growth ▬ Overall budget balance ▬ ESI-adj balance
Sources: General Directorate of Statistic, MoF GoTL & World Bank staff estimates. Sources: Ministry of Finance, GoTL.
TIMOR-LESTE Selected Indicators 2015 2016e 2017e 2018f 2019f 2020f
Real GDP growth, at constant market prices 4.0 5.3 -1.8 2.2 4.2 4.0Private Consumption 0.2 6.0 13.0 8.0 9.1 7.0Government Consumption 3.2 -22.1 -15.8 14.0 -3.2 -3.4Gross Fixed Capital Investment -3.5 15.9 -15.4 8.6 8.6 5.9Exports, Goods and Services -29.2 15.2 3.8 11.3 18.8 18.4Imports, Goods and Services -8.4 8.1 -27.2 26.8 8.7 4.4
Real GDP growth, at constant factor prices 5.8 4.9 -2.9 3.1 4.2 4.0Agriculture -4.3 3.0 -0.5 1.1 1.2 1.4Industry 22.2 7.6 -3.4 9.8 5.9 4.5Services 4.8 4.7 -3.4 1.8 4.4 4.5
Inflation (Consumer Price Index) 0.6 -1.3 0.6 1.5 2.5 2.3Current Account Balance (% of GDP) 20.8 -37.3 -1.0 -9.1 -9.6 -8.1Financial and Capital Account (% of GDP) 3.6 34.3 64.1 52.4 32.4 17.2
Net Foreign Direct Investment (% of GDP) 1.9 -0.4 0.2 1.0 1.9 2.2Fiscal Balance (% of GDP)a -13.2 -32.8 60.5 10.1 -1.3 -11.6Source: World Bank, Poverty & Equity and Macroeconomics, Trade & Investment Global Practices.Notes: e = estimate, f = forecast. (a) 2016 expenditure excludes unspent balances held in an escrow account. (b) Calculations based on EAPPOV harmonization, using 2014-TLSLS. Nowcast: 2015–2017. Forecast are from 2018 to 2020. (c) Projection using neutral distribution (2014) with pass-through = 1 based on GDP per capita in constant LCU.
EAST ASIA AND PACIFIC ECONOMIC UPDATE APRIL 2018
154 TIMOR-LESTE

VIETNAM
2017Population, million 93.7GDP, current US$ billion 223.8GDP per capita, current US$ 2,390International poverty rate ($1.9)a 2.6Lower middle-income poverty rate ($3.2)a 11.2Upper middle-income poverty rate ($5.5)a 35.4Gini coefficienta 34.8School enrollment, primary (% gross)b 108.9Life expectancy at birth, yearsb 75.9Source: WDI, Macro Poverty Outlook, and official data.Notes: (a) Most recent value (2014), 2011 PPPs. (b) Most recent WDI value (2015).
Summary
Growth accelerated to 6.8 percent in 2017, accompanied by macroeconomic stability. Strong job creation and wage growth boosted household incomes and contributed to a continued decline in poverty. Robust growth and macro stability are expected to be sustained over the medium term but risks remain. These include risks of global financial volatility and rising protectionism, as well as domestic vulnerabilities associated with the pace and quality of fiscal consolidation, remaining banking sector constraints and subdued productivity growth.
Recent Developments
Real Gross Domestic Product (GDP) growth is estimated at 6.8 percent in 2017—the fastest expansion in the
past ten years. The uptick in growth reflects a strong rebound of the agriculture sector, rising global and domestic demand that boosted manufacturing and trade, coupled with robust foreign investment inflows. The agro-forestry-fisheries sector expanded by 2.9 percent, a strong recovery from a mere 1.4 percent in 2016. The industry and construction sector grew by 8 percent, well above last year’s 7.4 percent—driven mainly by a 14.4 percent growth in the manufacturing sector, which offsets a 7.1 percent contraction in the mining sector. Growth also picked up in the services sector, expanding at 7.4 percent due to strong tourism receipts and buoyant private consumption, which lifted retail sales by 9.5 percent.
Vietnam’s dynamic economy continues to create jobs and rapid real wage growth, leading to broad-based welfare gains and poverty reduction. Real disposable household incomes are benefiting from low inflation, expanding wage employment, and robust nominal wage growth. Between 2014–16 Vietnam created 1.6 million new manufacturing jobs (net), especially in export-oriented sectors. The rise in wage income accounted for more than half of poverty reduction in recent years. Strong job creation helped reinvigorate structural transformation and reallocation of labor to higher-productivity activities, thereby boosting aggregate labor productivity.
Resilient growth was accompanied by moderate inflation and a strengthening external position. Annual average CPI rose to 3.5 percent in 2017, well below the government’s target of 4 percent, thanks to subdued food prices.
Vietnam’s exports continued to perform strongly, benefiting from stronger external demand and robust FDI in export-oriented manufacturing. The value of merchandise exports from Vietnam increased 21 percent in 2017. At the same time, import turnover rebounded strongly in 2017 to meet the growing demand for investment as well as private consumption. Nevertheless, Vietnam continued to retain current
ENHANCING POTENTIAL
VIETNAM 155

account surplus—now for the seventh year in a row. Supported by a healthy balance of payment, exchange rate remained relatively stable throughout the year.
Amidst muted price pressures, monetary and credit policies continued to balance stability and growth objectives. Credit growth remained high at around 18.2 percent (y/y) in December 2017. Such rapid credit expansion may induce excessive risk taking and poor credit allocation and lead to associated deterioration in asset quality.
Fiscal consolidation is underway, but the quality and sustainability of the adjustment could be improved. The budget deficit narrowed significantly in 2017, containing public debt accumulation and ensuring compliance with the 65 percent of the GDP statutory debt limit. Deficit reduction was aided by buoyant revenue performance. On the spending side, the adjustment has fallen disproportionately on public investment—from 9.1 percent GDP in 2011-16 to an estimate 7.8 percent GDP in 2017. While effective in the short term, this approach is not necessarily sustainable over time, as Vietnam needs significant infrastructure investment to support future growth.
Outlook
Growth and macroeconomic stability are expected to be sustained over the medium term. Growth is projected to stabilize around 6.5 percent, with some potential to surprise on the upside in the short run, especially if the global recovery remains intact. While inflation is projected to remain moderate thanks to a benign global price environment, strong wage growth may ultimately lift core inflation. External balances are projected to benefit from robust exports and FDI inflows. On the fiscal front, the combination of deficit reduction and divestment from SOEs is expected to contain public debt over the medium term.
Risks and Challenges
Despite the generally favorable medium-term outlook, there are significant challenges. Domestically, a slow-down in structural reforms could weaken the ongoing recovery and weigh on Vietnam’s medium-term potential growth. There is also a risk that fiscal consolidation may erode pro-poor fiscal expenditure and investment in human and physical capital. Externally, strong trade and investment links expose Vietnam’s economy to risks associated with a potential rise in protectionism and a possible weakening of external demand.
These risks call for further steps to enhance macroeconomic resilience, including more exchange rate flexibility, a further buildup of foreign reserves, and responsive monetary and macroprudential policies that moderate credit expansion and bolster capital buffers in the banking sector. On the fiscal front, there continues to be a need for deeper revenue and expenditure reforms, including broadening tax bases, right-sizing of the public administration, and higher value for money in public investment. Steps to solidify macroeconomic stability need to be accompanied by progress on structural reforms to lift productivity and potential growth, including steps to reform the SOE sector, improve the regulatory environment, and enhance factor markets, including land and capital.
EAST ASIA AND PACIFIC ECONOMIC UPDATE APRIL 2018
156 VIETNAM

VIETNAM Selected Indicators 2015 2016e 2017e 2018f 2019f 2020f
Real GDP growth, at constant market prices 6.7 6.2 6.8 6.5 6.5 6.5Private Consumption 9.3 7.3 7.4 7.2 7.0 7.0Government Consumption 7.0 7.5 4.9 8.0 8.6 8.6Gross Fixed Capital Investment 9.4 9.9 9.4 8.8 8.2 8.0Exports, Goods and Services 12.6 13.9 14.9 13.6 13.7 13.8Imports, Goods and Services 18.1 15.3 15.3 14.0 13.8 13.8
Real GDP growth, at constant factor prices 6.8 6.2 6.9 6.5 6.5 6.5Agriculture 2.4 1.4 2.9 2.0 2.0 2.0Industry 9.6 7.6 8.0 8.1 8.1 8.1Services 6.3 7.0 7.4 6.9 6.8 6.7
Inflation (Consumer Price Index) 0.9 3.2 3.5 4.0 4.0 4.0Current Account Balance (% of GDP) 0.1 4.0 3.5 3.0 3.0 2.6Fiscal Balance (% of GDP) -6.2 -6.3 -5.1 -5.0 -5.0 -4.9Debt (% of GDP) 57.3 62.4 62.3 62.0 62.0 61.9Primary Balance (% of GDP) -4.2 -4.2 -2.9 -3.0 -2.9 -2.8International poverty rate ($1.9 in 2011 PPP)a,b 2.5 2.5 2.4 2.3 2.2 2.1Lower middle-income poverty rate ($3.2 in 2011 PPP)a,b 10.1 9.2 8.2 7.4 6.6 6.0Upper middle-income poverty rate ($5.5 in 2011 PPP)a,b 32.3 29.8 27.1 24.8 22.6 20.6Source: World Bank, Poverty & Equity and Macroeconomics, Trade & Investment Global Practices.Notes: e = estimate, f = forecast. (a) Calculations based on EAPPOV harmonization, using 2012-VHLSS and 2014-VHLSS. Nowcast: 2015–2017. Forecast are from 2018 to 2020. (b) Projection using annualized elasticity (2012–2014) with pass-through = 1 based on GDP per capita in constant LCU.
Figure 1. Real GDP growth and contribution to Real GDP growth
Figure 2. Actual and projected poverty rates and real GDP per capita
Percent, percentage points Poverty rate, percent GDP per capita, constant LCU, in million
12
9
6
3
0
-6
-3
2012 2013 2016 2017 2018f20152014
45
40
35
30
25
20
15
10
5
0
2010 2012 2016 20182014
60
50
40
30
20
10
0
2020
J Gross capital formation J Change in inventories J Government consumption ▬ Intenational poverty rate ▬ Lower middle-income poverty rate
J Private consumption J Net exports ▬ GDP growth ▬ Upper middle-income poverty rate ▬ GDP per capita
Sources: Vietnam Government Authorities and Macro Poverty Outlook. Sources: World Bank.Notes: see Table 2.
ENHANCING POTENTIAL
VIETNAM 157


WORLD BANK EAST ASIA AND PACIFIC ECONOMIC UPDATE APRIL 2018