Building the Resilience of India’s Internal Security Apparatus
Upload
unicef-office-of-research-innocentiCategory
view
208download
5
Enhancing nutrition security via India’s National Food Security act: Using an axe instead of a scalpel?
Sonalde Desai & Reeve Vanneman

Repeated Cross-Sections, Longitudinal Panels and Cohort Studies
• Description of changes over time• Useful snapshots when social/policy
changes taking place
Repeated Cross Section
• Effects of early life experiences on later outcomes
• Single cohort not suitable for studying social/policy changes
• Attrition a major challenge
Cohort Studies
• Combination of repeated cross-section and cohort studies
• Addition of new cohorts, within family analysis• Useful in changing context• Reinterviews major challenge, panels get old
Panel Studies of households

India’s National Food Security Act, 2013
Justification: High undernutrition and hunger
Solution: Two main pillars
Expansion of Public Distribution System (PDS) to cover 67% of the population for 5 kg of cereals at Rs. 1-3 per kg
Enhancement to Integrated Child Development Schemes (ICDS) to ensure children receive take home rations and hot cooked meals

Crucial Question:
Is NFSA the best strategy for addressing undernutrition?
Implicit assumptions:
GDP growth by itself is not sufficient.
Undernutrition is caused by hunger.
Therefore, solution is more calories.
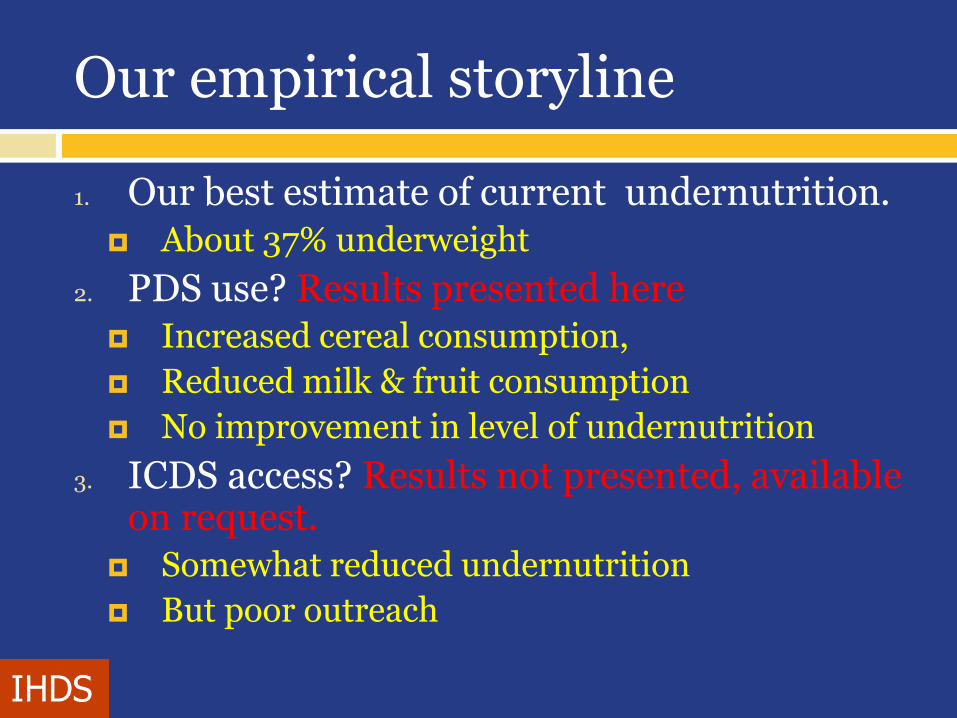
Our empirical storyline
1. Our best estimate of current undernutrition. About 37% underweight
2. PDS use? Results presented here Increased cereal consumption,
Reduced milk & fruit consumption
No improvement in level of undernutrition
3. ICDS access? Results not presented, available on request.
Somewhat reduced undernutrition
But poor outreach
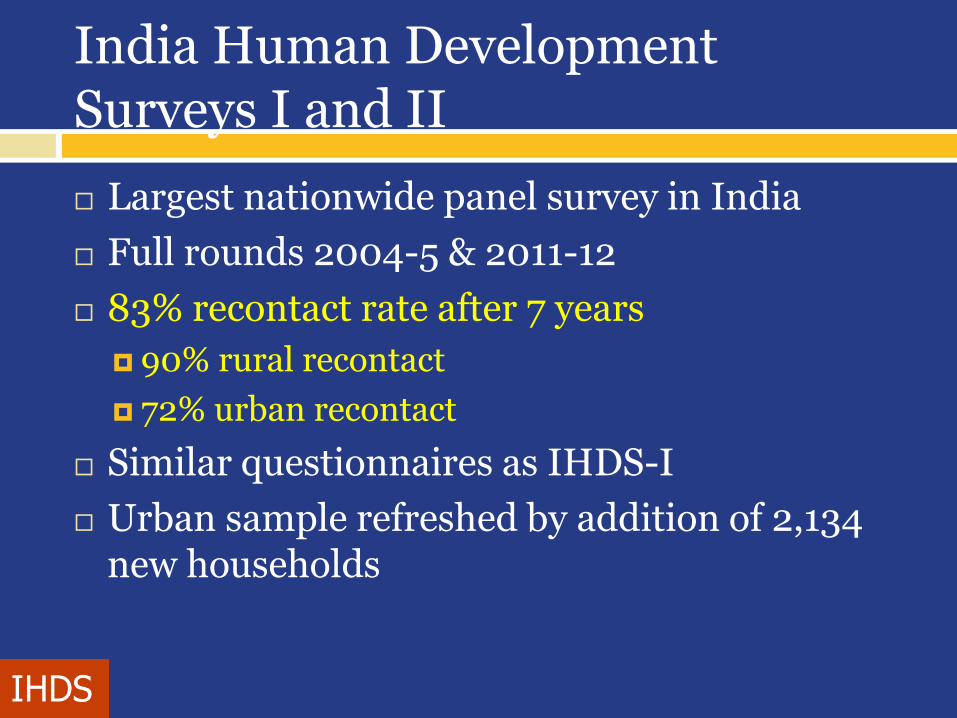
India Human Development Surveys I and II
Largest nationwide panel survey in India
Full rounds 2004-5 & 2011-12
83% recontact rate after 7 years
90% rural recontact
72% urban recontact
Similar questionnaires as IHDS-I
Urban sample refreshed by addition of 2,134 new households

IHDS-II (2011-12) Sample
33 States and UT
1474 villages and 988 urban
blocks
42,152 households
215,754 individuals
39,264 ever married
women 15-49
12,148 kids
age 8-11
12153 Youth
age 15-18

For this analysis the sample is:
1. 42,152 households for household based PDS analysis
2. 10,715 children ages 0-60 months for analysis of underweight, limited to:
Children for whom both month and years of birth are available
Whose weight-for-age z scores range from -6 to +5 SD
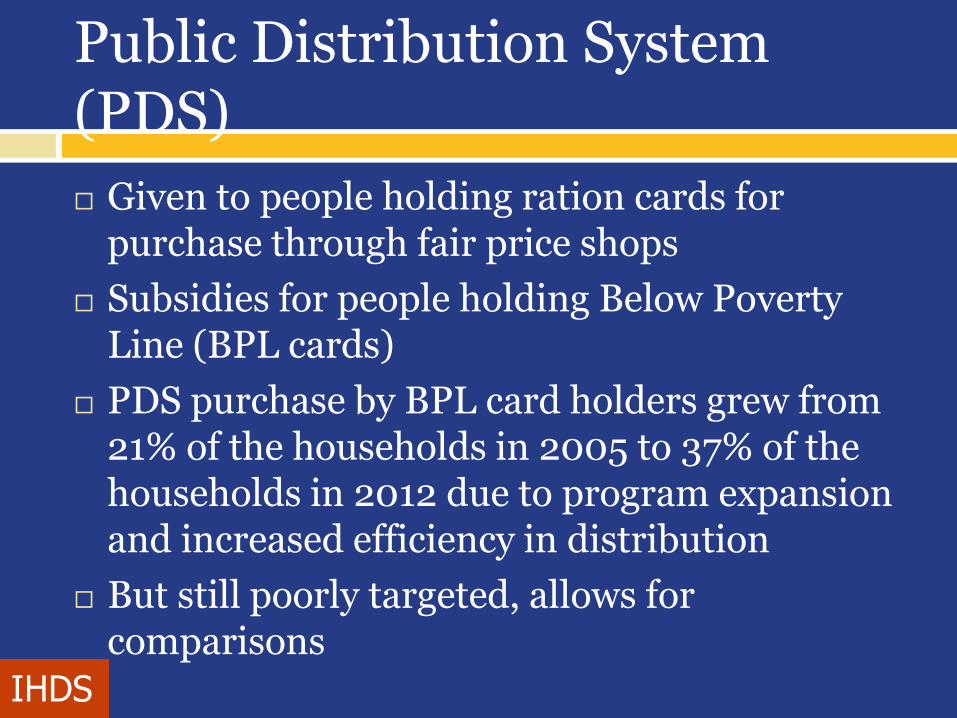
Public Distribution System (PDS)
Given to people holding ration cards for purchase through fair price shops
Subsidies for people holding Below Poverty Line (BPL cards)
PDS purchase by BPL card holders grew from 21% of the households in 2005 to 37% of the households in 2012 due to program expansion and increased efficiency in distribution
But still poorly targeted, allows for comparisons
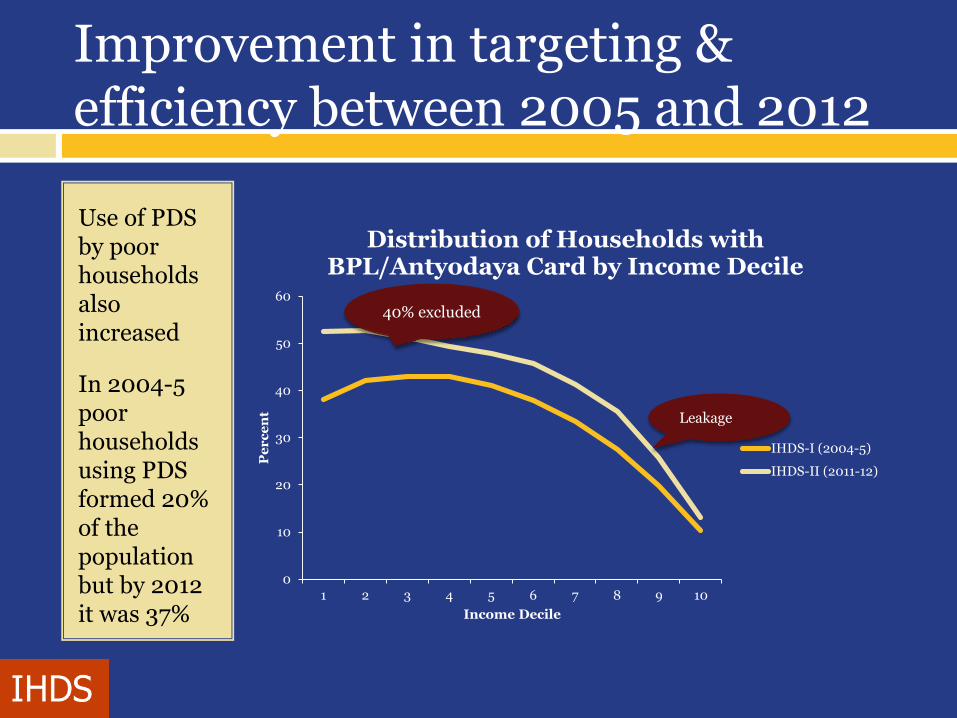
Improvement in targeting & efficiency between 2005 and 2012
Use of PDS by poor households also increased
In 2004-5 poor households using PDS formed 20% of the population but by 2012 it was 37%
0
10
20
30
40
50
60
1 2 3 4 5 6 7 8 9 10
Pe
rc
en
t
Income Decile
Distribution of Households with BPL/Antyodaya Card by Income Decile
IHDS-I (2004-5)
IHDS-II (2011-12)
Leakage
40% excluded

Do we expect PDS to reduce malnutrition? From the literature..
Yes: increased caloric intake using NSS:
Lower decline in caloric consumption for the PDS users over time Himanshu and Sen (2013)
Higher caloric intake in areas where and when value of subsidy is higher Kaul (2014)
No: small or no impact on calories/weight:
Extremely low caloric elasticities (Kochar, 2005)
Introduction of TPDS did little to diminish nutritional outcomes in AP (Tarozzi, 2005)
But most of these studies are based on inadequate cross-sectional data

Propensity Score Matching:
Matching Households on:
State of residence, urban/rural residence, highest education level obtained by an adult above 21 in the household, household income and a squared term for income, number of adult equivalents in the households, number of married women in the household as a proxy for household structure as well as time availability, caste/religion categories (forward caste, OBC, SC, ST, Muslim, other religions), whether household has any toilet and whether it has indoor piped water.
When matching children add:
Child and mother characteristics including child’s gender, age, a dummy variable for infants, and number of children borne by the mother.

No improvement in weight for children from households that use PDS
PDS Users Non-Users Difference S.E. T-stat
Z score for weight-for-age
Matched -1.614 -1.542 -0.071 0.042 -1.70
Moderate Underweight (<2 SD)
Matched 0.400 0.373 0.027 0.013 2.01
Severe Underweight (<3 SD)
Matched 0.160 0.149 0.011 0.010 1.10
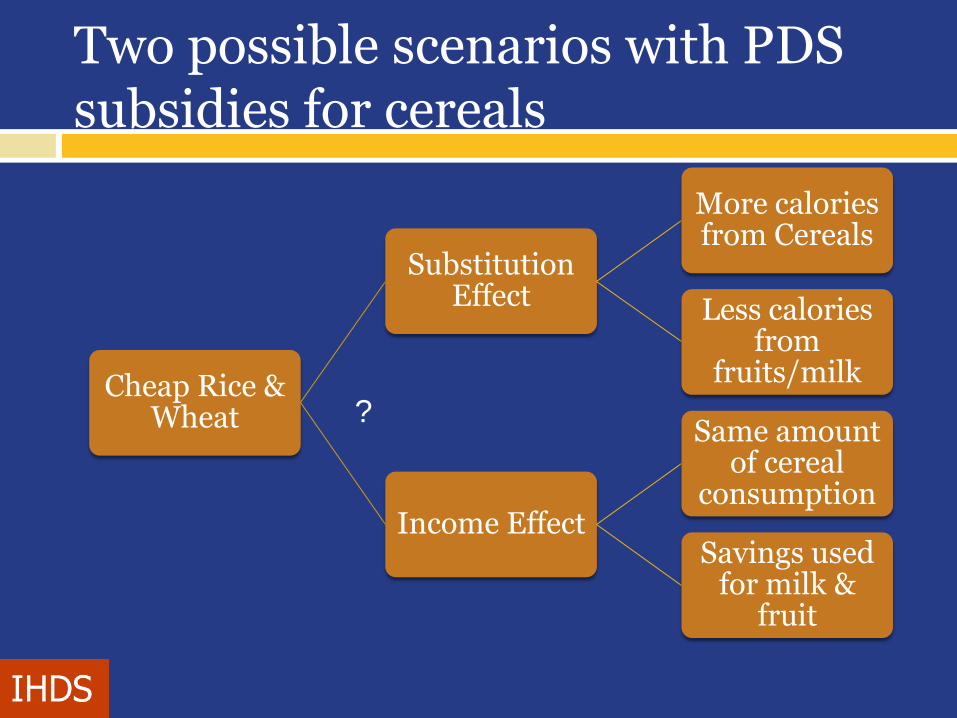
Two possible scenarios with PDS subsidies for cereals
Cheap Rice & Wheat
Substitution Effect
More calories from Cereals
Less calories from
fruits/milk
Income Effect
Same amount of cereal
consumption
Savings used for milk &
fruit
?

Age Adjusted Intake Per Person in matched sample
PDS Users
Non-Users
Difference S.E. T-stat
Quantity cereal (Kg)
Matched 20.473 19.276 1.197 0.166 7.19
Quantity milk (ltr)
Matched 4.372 5.254 -0.882 0.114 -7.77

But what if we are doing a poor job of matching?
PDS use is a function of program efficiency and household time availability
In many remote villages the PDS shops may not be available
Program use has been particularly poor in areas where most shopping is done by men
How do we match on unobservables?
Role of longitudinal data
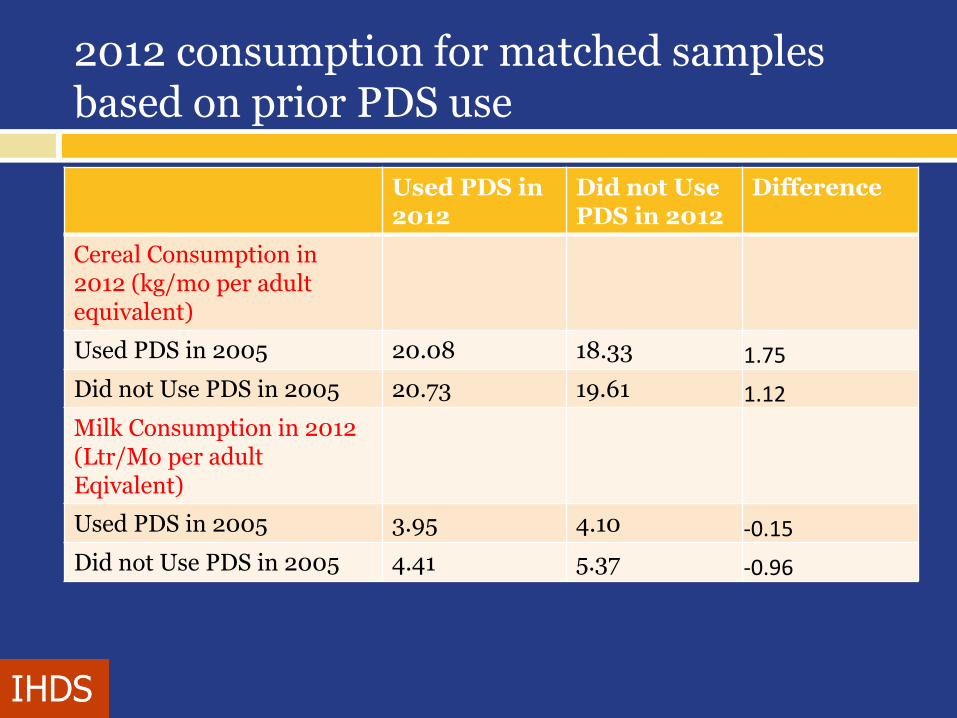
2012 consumption for matched samples based on prior PDS use
Used PDS in 2012
Did not Use PDS in 2012
Difference
Cereal Consumption in 2012 (kg/mo per adult equivalent)
Used PDS in 2005 20.08 18.33 1.75
Did not Use PDS in 2005 20.73 19.61 1.12
Milk Consumption in 2012 (Ltr/Mo per adult Eqivalent)
Used PDS in 2005 3.95 4.10 -0.15
Did not Use PDS in 2005 4.41 5.37 -0.96
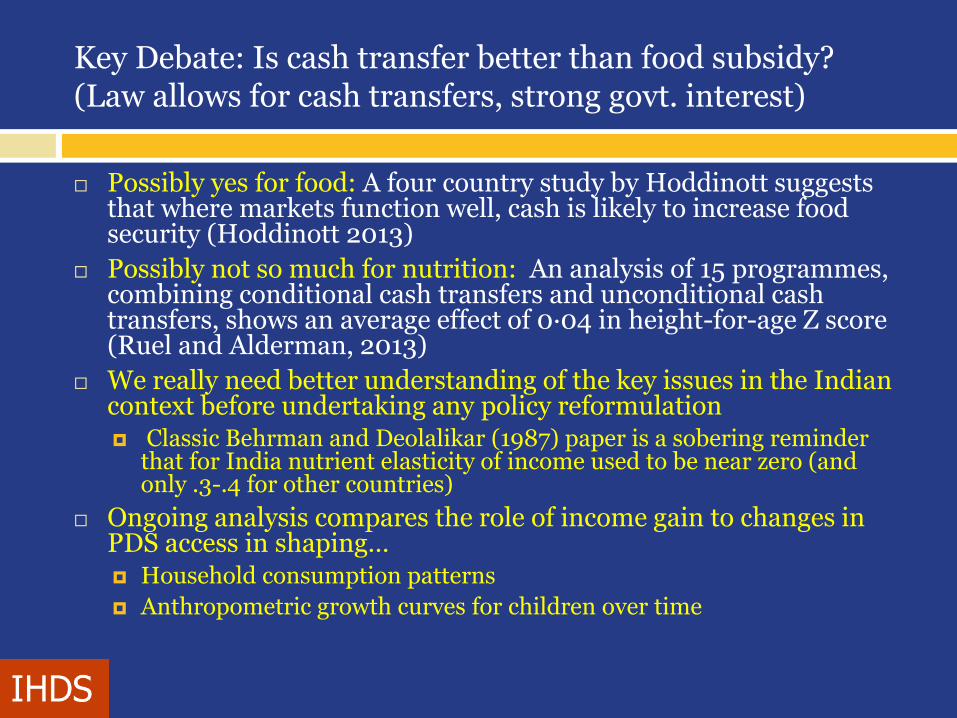
Key Debate: Is cash transfer better than food subsidy? (Law allows for cash transfers, strong govt. interest)
Possibly yes for food: A four country study by Hoddinott suggests that where markets function well, cash is likely to increase food security (Hoddinott 2013)
Possibly not so much for nutrition: An analysis of 15 programmes, combining conditional cash transfers and unconditional cash transfers, shows an average effect of 0∙04 in height-for-age Z score (Ruel and Alderman, 2013)
We really need better understanding of the key issues in the Indian context before undertaking any policy reformulation Classic Behrman and Deolalikar (1987) paper is a sobering reminder
that for India nutrient elasticity of income used to be near zero (and only .3-.4 for other countries)
Ongoing analysis compares the role of income gain to changes in PDS access in shaping… Household consumption patterns
Anthropometric growth curves for children over time


![[Solution Brief] Enhancing NGFW Security with …€¦ · ENHANCING NGFW SECURITY WITH AUTOMATED MALWARE ANALYSIS ... [Solution Brief] Enhancing NGFW Security with Automated ... sonicwall,](https://static.fdocuments.us/doc/165x107/5b1e9fd47f8b9a7f2f8bb1cc/solution-brief-enhancing-ngfw-security-with-enhancing-ngfw-security-with-automated.jpg)