Enhancing linkages of oil and gas industry in the...
104
Enhancing linkages of oil and gas industry in the Nigerian economy T. Ademola Oyejide And Adeolu O. Adewuyi Trade Policy Research and Training Programme (TPRTP) Department of Economics, University of Ibadan [email protected] MMCP Discussion Paper No. 8 March 2011 Making the Most of Commodities Programme (MMCP)
-
Upload
nguyenlien -
Category
Documents
-
view
217 -
download
3
Transcript of Enhancing linkages of oil and gas industry in the...

Enhancing linkages of oil and gas industry in the Nigerian economy
T. Ademola Oyejide And
Adeolu O. Adewuyi Trade Policy Research and Training Programme (TPRTP)
Department of Economics, University of Ibadan [email protected]
MMCP Discussion Paper No. 8
March 2011
Making the Most of Commodities Programme (MMCP)

ii
MAKING THE MOST OF COMMODITIES PROGRAMME Like many other developing economy regions, Africa is benefitting from a sustained boom in commodities prices. Received wisdom has been that commodities production is an inherently enclave activity and that it undermines the viability of industry. The Making the Most of Commodities Programme challenges this negative view of the commodities sector. It‟s research analyses the determinants of backward and forward linkages, identifying policy responses which will broaden and deepen them. In so doing it contributes both to achieving sustainable growth and the spreading of benefits to a wider population. By incorporating younger researchers, building a research network, and dialogue with policymakers, the MMCP also seeks to build analytical and policy capacity, and to influence policy outcomes. The MMCP focuses on a diverse range of commodity sectors in a number of African economies, as well as on key infrastructural determinants of effective linkage development. A number of common factors are identified which will increase linkages beneficially and which lend themselves to policy intervention - the role of ownership, the nature and quality of infrastructure, the national system of innovation, spillover of skills to and from the commodities sector, linkages in regional economies and the nature and consistency of policies directed towards the commodities sectors. The MMCP country/commodity Discussion Papers are: 1. ‘The drive to increase local procurement in the Mining Sector in Ghana: Myth or reality?’,
Gold Robin Bloch and George Owusu, 2. ‘Chinese Construction Companies in Angola: A Local Linkages Perspective’, Lucy Corkin 3. ‘Development and Knowledge Intensification in Industries Upstream of Zambia’s Copper
Mining Sector’, Judith Fessehaie 4. ‘The drive to increase local procurement in the Mining Sector in Africa: Myth or reality?’,
Chris Hanlin 5. South African Mining Equipment and Related Services: Growth Constraints and Policy,
David Kaplan 6. Linkages in Botswana’s Diamond Cutting and Polishing Industry’, Letsema Mbayi 7. The Nature and Determinants of Linkages in Emerging Minerals Commodity Sectors: A
Case Study of Gold Mining in Tanzania, Vuyo Mjimba 8. Enhancing Linkages of Oil and Gas Industry in the Nigerian Economy, Ademola Oyejide and
Adeolu Adewuyi 9. ‘The contribution to local enterprise development of infrastructure for commodity extraction
projects: Tanzania’s central corridor and Mozambique’s Zambezi Valley’, Dave Perkins and Glen Robbins
10. ‘The Tropical Timber Industry in Gabon: A Forward Linkages Approach’, Anne Terheggen 11. ‘Backward Linkages in the Manufacturing Sector in the Oil and Gas Value Chain in Angola’,
Zeferino Teka A MMCP Synthesis Monograph is currently being written by the MMCP Project Leaders: Raphael Kaplinsky (Open University), David Kaplan and Mike Morris (UCT). The MMCP is a collaborative research and policy programme between Policy Research in International Services and Manufacturing (PRISM), Economics and CSSR, University of Cape Town and Development Policy and Practice, Open University. The International Development Research Centre of Canada is the principal funder, with additional funding from the William and Flora Hewlett Foundation, Harry Oppenheimer Institute, and Open University. Further information and other Discussion Papers can be downloaded from: http://commodities.open.ac.uk/discussionpapers or www.cssr.uct.ac.za/prism/projects/mmcp

iii
Abstract The dearth of linkages between the oil sector and the other sectors of the Nigerian economy is a critical developmental problem. Thus, the primary objective of this study is to examine the extent of the linkages that the oil sector has created with the rest of the Nigerian economy. Based on an earlier study which identified areas where local servicing firms in Nigeria have technological and employment potentials, this study covers three of such areas; Fabrication and construction; well-construction and completion, and Control system and ICT. We have used both primary and secondary data and the methods of analysis are both descriptive and inferential. Survey results revealed that the degree of local sourcing of inputs (by local suppliers or servicing firms) in the Control system and ICT sub-sector is less than what obtains in the other sub-sectors. It was also found that linkage between first-tier and second-tier suppliers is weak, though information exchange is relatively higher. In the opinion of the servicing firms, their linkage with the oil sector is weak, but fair in the opinion of the oil firms.. Most servicing firms are national, but the control system and ICT sub-sector has highest multinational presence. Multinational firms dominate the oil sector, followed by joint venture, and few are national. Only public power supply was rated grossly inadequate by the servicing firms, On the average, about half of the servicing firms have agreements with foreign companies and local research centres. Import tariff and taxes are found to be the most inconsistent. Firms are involved in some innovations to survive stiff competition. Control system and ICT sub-sector with higher multinational presence suffer less liquidity problems, but liquidity falls over time. High price of imported raw materials is the largest raw materials problem that affects servicing firms. Based on a regression analysis, it was discovered that the MMCP drivers, other drivers and their interactions affect linkages. In all, availability of skilled labour (skill), policies (tax) and NSI stand out as the major drivers. Based on the above findings, some recommendations are made to the various stakeholders to promote linkages.
‘Enhancing linkages of oil and gas industry in the Nigerian economy’, T. Ademola Oyejide and Adeolu O. Adewuyi, MMCP Discussion Paper No 8, University of Cape
Town and Open University, March 2011
ISBN: 978-1-77011-239-1

iv
Executive Summary
The dearth of linkages between the oil sector and the other sectors of the Nigerian economy is a critical developmental problem. One reason why there are no linkages in the oil sector is the capital intensive nature of oil sector activities and scarcity of capital as well as local expertise. Thus, despite several government development initiatives including promotion of indigenous ownership; articulation of local content policy, local content remains insignificant. This problem has also led to a crisis in the Niger-Delta region (Oil region) which remains undeveloped. Hence, there are political and ethnic agitations in the region against the Oil companies. Creating linkages in the oil sector through development of local capacity to participate in the oil sector activities (through encouragement of indigenous ownership, establishment of the National System of Innovation (NSI) and improvement of the state of infrastructure could help curb this problem. The presence of effective linkages is necessary for a balanced growth of an economy, thus it is important that linkages exist between sectors so as to promote an all-round growth and development of an economy.
The primary objective of this study is to examine the extent of the linkages that the oil sector has created with the rest of the Nigerian economy. The specific objectives of this study include identification and analysis of areas of linkages that the oil and gas industry has created with the rest of the Nigerian economy. It also includes identification of the local content elements in oil and gas activities in Nigeria and examination of the role of ownership, infrastructure, NSI, skill, policy, finance, (and so on) in fostering localisation of oil sector activities with high output and employment potential. Further, the study assesses the spill-over effects from oil and gas industry to the rest of the economy and regional economy. It examines the impacts of the policy measures that have been and/or are being implemented in enhancing linkages in oil and gas sector.
This study is necessitated by the dearth of studies in the area of oil sector linkages in Nigeria particularly with a focus on the role of ownership, infrastructure, National System of Innovation (NSI), skills spill over, policy and other factors in enhancing Oil sector linkages in Nigeria. Thus, the study is based on the theories of linkages particularly backward linkage of the Oil sector. A number of hypotheses tested include; the influence of (a) ownership, (b) infrastructure, (c) National System of Innovation (NSI), (d) skills spill over, (e) policy and (f) other factors, on Oil sector linkages. These hypotheses are termed “MMCP hypotheses”. Based on an earlier study (Heum, 2003), which identified areas where local servicing firms in Nigeria have technological and employment potentials, this study covers three of such areas (Fabrication and construction, well-construction and completion, and Control system and ICT). We have used both primary and secondary data and the methods of analysis are both descriptive and inferential. We conducted a survey in 2010 and we employed frequency and percentage tables, Charts, figures to present and discuss our survey results. We used a regression analysis to examine the impact of individual and interactive drivers. The descriptive analysis shows that Nigeria is among the top five OPEC countries that have had substantial crude oil production over time. Nigeria appears to be the 10th largest oil producer in the World; the largest in Africa until recently when Angola overtook it. Since the discovery of crude oil in Nigeria, the economy is heavily dependent on its oil sector for export, foreign exchange earnings and revenue.
Based on the survey results we found that the degree of local sourcing of inputs (by local suppliers or servicing firms) in the Control system and ICT sub-sector is less than

v
what obtains in the other sub-sectors. It was also found that linkage between first-tier and second-tier suppliers is weak, though information exchange is relatively higher. In the opinion of the servicing firms, their linkage with the oil sector is weak, but fair in the opinion of the oil firms. Although both the oil firms and the servicing firms agree to the same structure of linkage, the Oil firms tend to rate their linkage with their servicing firms higher than the way the servicing firms rate the same linkage. Most servicing firms are national, but the control system and ICT sub-sector has highest multinational presence. Multinational firms dominate the oil sector, followed by joint venture, and few are national.
Infrastructural facilities are rated satisfactory, only public power supply was rated grossly inadequate by the servicing firms, while Oil firms rate infrastructure more satisfactorily than servicing firms. Survey results revealed that skilled labour are available, sometimes from abroad, especially in the ICT sub-sector. On the average, about half of the servicing firms have agreements with foreign companies and local research centres. In terms of policy consistency, import tariff and taxes are the most inconsistent. Firms are involved in some innovations to survive stiff competition. Control system and ICT sub-sector with higher multinational presence suffer less liquidity problems, but liquidity falls over time. High price of imported raw materials is the largest raw materials problem that affects servicing firms.
Based on a regression analysis, it was discovered that the MMCP drivers, other drivers and their interactions affect linkages. In all, availability of skilled labour (skill), policies (tax) and NSI stand out as the major drivers.
Since ownership, infrastructure, NSI, skill spill over and policy are found to be major drivers of Oil sector linkages in Nigeria in Nigeria, therefore effort should be made to address the problems associated with these drivers. Thus, the on-going privatisation and industrial policies in Nigeria should be fine-tuned to encourage more local ownership and joint venture than before. The bank of industry, the small and medium scale industry equity investment scheme (SMIEIS) and the micro-finance banks should be strengthened to cater for the small and medium scale enterprises. In general, the cost of capital (interest rate) should be reduced to encourage indigenous investment in the oil sector. Indigenous entrepreneurs should be encouraged to partner with foreign firms in the delivery of services to the oil sector operators. Local firms should be ready to upgrade their technology in order to be able to service the oil sector. This may be easy through partnership with foreign firms.
Given the poor state of infrastructure in Nigeria particularly power, there is the need to expedite action on the deregulation of the power sector to promote adequate service delivery. The foundation for industrialisation and enhancing linkages is the availability of good infrastructure especially electricity and transportation.
There is the need to set up a committee for effective implementation of the recently passed National Content Bill. This is because the bill will go a long way to promote local sourcing of inputs and upgrading of local skills. All these will also promote employment and increased value added.
The NSI in Nigeria needs to be properly integrated with the rest of the economy particularly the oil sector. There is the need to increase the share of government expenditure on education so that the NSI in Nigeria can function effectively.

vi
TABLE OF CONTENTS
TITLE PAGE i
EXECUTIVE SUMMARY iv
TABLE OF CONTENTS vi-vii
LIST OF TABLES viii
LIST OF FIGURES ix
1.0 INTRODUCTION 1 1.1 Problem Statement 1 1.2 Objectives of the study 2 1.3 Statement of the study story 2 1.4 Organisation of the Report 3
2.0. BACKGROUND OF THE COUNTRY/SECTOR (THE CONTEXT) 3 2.1. Global Oil Sector Structure: Production, Composition, and Trade 3 2.1.1. World Crude oil Production 3
2.1.2. World Trade in Oil 6 2.2. Nigeria Oil Sector Structure – Trade, Composition, and Production 7 2.3. Nigeria‟s geographical location/spread of the sector 8 2.4. Nigeria‟s historical path dependency on the sector 8 2.5. Stylised information about some Drivers of Linkages in Nigeria 9
2.5.1. Ownership (Major Investors) in the Nigerian Oil sector 9 2.5.2. The state of infrastructure in Nigeria 10 2.5.3. NSI, Skills upgrading and localisation in Nigeria 11 2.5.4. Institutional Arrangement, legal framework and policies 12 2.5.5 National Content Development in Nigeria 13
2.6. Summary of legal and Institutional framework of petroleum operations in Nigeria 14
2.7. Past Attempts at Creating Linkages in the Nigerian Oil sector 15
2.8. Linkages Crisis in Nigeria: The Niger-Delta Situation 15
3.0 CONCEPTUAL FRAMEWORK AND LITERATURE REVIEW 16 3.1 Conceptual Framework 16 3.2 International Experience on the Determinants of oil Sector Linkages 20 3.3 Nigeria‟s Experience on the determinants of oil sector Linkages 22
4.0 THEORETICAL FRAMEWORK 23 4.1 Laying out of Value Chain 23
4.1.1. Standard oil and gas value chain 23 4.2 MMCP Hypothesis and other Relevant Issues 24
4.2.1. Drivers of Oil Sector Linkages 24
5.0 METHODOLOGY AND KEY QUESTIONS 26 5.1 The key Questions/Hypotheses 26 5.2 Scope of the study: The aspect of the Value Chain covered 27 5.3 Sources of Data 27 5.4 Research Design 27 5.5 Population of study 28 5.6 Sample and Sampling Technique 28

vii
5.7 The Research Instrument 28 5.8 Validity and reliability of instrument 29 5.9 Administration of research instrument 29 5.10. Field Experience 29 5.11. Methods of Data Analysis 30
5.11.1. Model Specification and Variables Definition 30 5.11.2. Treatment of Interaction Drivers 33
6.0 PRELIMINARY ANALYSIS OF OIL SECTOR LINKAGES IN NIGERIA 33 6.1 General Issues 33 6.2 The Supply/Value Chain and Local Sourcing in the Oil and Gas Industry 33
6.2.1. The Supply/Value Chain in the Nigerian Oil and Gas Industry 33 6.2.2. Local Sourcing and Linkage Factors in the Nigerian Oil and Gas Industry 34
7.0 EMPIRICAL ANALYSIS/FINDINGS: LINKAGE DRIVERS 41 7.1. Ownership and other Firms‟ Characteristics 41 7.2. Infrastructural Adequacy. 43 7.3. NSI/Skills Factors 45 7.4. Spill over and Regional Factors 46 7.5. Policy Issues 47 7.6. Other Linkage Drivers 49
7.6.1. Competition: Effects and Coping Strategies 49 7.6.2. Access to Finance 50 7.6.3. Access to Raw Materials 52 7.6.4. Unstructured Responses on Drivers of Local Sourcing 52
8.0. REGRESSION ANALYSIS OF THE DRIVERS OF LINKAGES 52 8.1. Analysis of Individual Drivers 53 8.2. Analysis of Interactive Drivers 55
9.0 SUMMARY OF FINDINGS, CONCLUSIONS AND POLICY RECOMMENDATIONS 58
9.1 Summary of Key Findings 58 9.2 Policy Recommendations 59 9.3. Current vision for the commodities sector in Nigeria 60
9.4 Policy recommendations 62
REFERENCES 63 APPENDICES 65

viii
LIST OF TABLES
Table 1A: World Crude Oil Production, (Selected OPEC Producers) 1980-2009 (Million Barrels per Day) 4
Table 1B: World Crude Oil Production, (Selected Non-OPEC Producers) 1980-2009 (Million Barrels per Day) 5
Table 2A: Top 5 Global Exporters of Petroleum 6 Table 2B: Top 5 Global Importers of Petroleum 6
Table 3: Population of oil firms suppliers in the two major cities 28 Table 4: Administered (Retrieved) Questionnaires of the Oil Firms Suppliers 29 Table 5: Responses of Oil Suppliers on the Local Contents in their Outputs 34 Table 6: Suppliers' Response on their Linkage with their own Input Suppliers 36 Table 7: Suppliers‟ Responses on their linkage with oil firms 37 Table 8: Responses of Oil firms on the Local Contents in their Activities 39 Table 9: Oil firms‟ Response on their linkage with their Suppliers 40 Table 10: Responses of Oil firms on how they aid Standard and Suppliers
Development 41 Table 11: Some Suppliers Firms Characteristics 42 Table 12: Oil Firms‟ Characteristics 42 Table 13: Infrastructure Performance Assessment by Oil firms‟ suppliers 43 Table 14: Responses of oil suppliers on the Recent Trends of Infrastructural
and Utility Services 43 Table 15: Infrastructure Performance Assessment by Oil firms 44 Table 16: Labour/Skill Information on Oil firm suppliers 45 Table 17: Technology Status of Suppliers 46 Table 18: Labour/Skill Information on Oil firm 46 Table 19: Spill over effect of oil firm supplier 47 Table 20: Consistency of Government Regulations 47 Table 21: Effects of Regulations on Organisations Operations 48 Table 22: Effect of Privatisation 48 Table 23: Effect of LCP on Oil Firms Suppliers 49 Table 24: Innovations Undertaken In Past 5 Years to Face Competition 50 Table 25: Frequency of Liquidity Problems by Suppliers (2005-2009) 51 Table 26: Solutions to Liquidity Problems 51 Table 27: Factors affecting local suppliers‟ access to raw materials 52 Table 28: Regression Estimates showing the Drivers of Linkage in the Nigerian
Oil and Gas Sector 54 Table 29: Stepwise Regression Estimates showing the Individual and Interactive
Drivers of Linkage in the Nigerian Oil and Gas Sector 56

ix
LIST OF FIGURES
Figure 1: Trend of Crude Oil Exports and imports in Nigeria (1980-2008) 8
Figure2: Share of Oil in total Revenue and GDP of Nigeria (1980-2008) 9
Figure 3: Oil and Gas Industry Value Chain 24
Figure 4: Value Chain of focus: Oil firms and their suppliers 35
Figure 5: Servicing firms‟ linkage with their own suppliers 36
Figure 6: Suppliers‟ linkage with oil firms 37
Figure 7: Promotion of emergence and development of local firms by oil firms 38
Figure 8: Promotional programmes 38
Figure 9: Linkage between servicing firms and oil firms 40
Figure 10: Infrastructure performance 44
Figure 11: Suppliers‟ Awareness Level of IFC‟s Programme 49
Figure 12: Effect of Competition 50
Figure 13: Trend of Liquidity Problem 51

1. Introduction 1.1 Problem statement A critical issue with respect to Nigeria and some other oil-rich economies is the existence of poverty in the mist of plenty. Thus, Nigeria that is richly blessed with good quality crude oil is still a developing country with a high level of poverty. Nigeria is more endowed with natural resources than many already-developed countries, yet there seems to be a problem of reaping the benefits of these natural endowments in terms of translating oil-led growth into development. The obvious question that follows from this is; “why” would a country so abundantly blessed with oil and other natural resources still be classified as „developing‟ after five decades of independence? Attempts to answer this question point to the fact that the full extraction and exploitation of the oil involves heavily capital-intensive techniques (in terms of machineries, hi-tech and skills) which Nigeria did not have at the time oil was first discovered and exploited in the late 1950s and beyond. Based on the scarcity of capital, foreign investors dominated the oil sector. However, a large amount of the proceeds generated from the oil sector were repatriated by foreigners to their own countries.. The result was that there was significant loss of value added abroad, as more contracts were awarded to the foreign firms in the oil sector. Thus, little oil proceeds remains to develop other sectors and the entire Nigerian economy. Against the above background, Nigeria suffers from the Dutch Disease Syndrome. The Dutch Disease Syndrome describes a situation whereby sector that was initially a driver of economic growth (Agriculture in the case of Nigeria) starts declining in performance due to the discovery of a natural resource. This Dutch Disease Syndrome in Nigeria developed into a big problem because the booming oil sector had low absorptive capacity in terms of employment since many Nigerians lacked skill or competence required in the various oil sector activities. Moreover, the booming oil sector crowded out the agricultural sector that had the absorptive capacity in terms of employment, and this resulted into rising unemployment and high level of poverty. An explanation for the Dutch Disease Syndrome in Nigeria is the dearth of linkages in the oil sector. In other words, there are no channels through which the gains reaped by oil companies flow to domestic enterprises including the small and medium scale. Thus, there is little or no inter-sectoral linkages (between the oil sector and the other sectors of the economy). If there were linkages, the ideal situation would have been that the domestic subsidiary firms (either created by oil companies in partnership with nationals or set up by domestic investors) will participate in the oil sector activities, and thereby generate employment and income for the domestic residents, leading to reduction in the level of poverty in the country. The dearth of linkages between the oil sector and the other sectors of the Nigerian economy is a critical developmental problem. One reason why there are no linkages in the oil sector is the capital intensive nature of the activities in the sector, and scarcity of capital in Nigeria coupled with lack of local expertise. Thus, despite several governmental development initiatives local content remains very low. The

2
lack of positive spill over effects of oil in Nigeria particularly in the Niger-Delta (Oil region), makes the region to remain undeveloped. It is for this reason that we have political and ethnic agitations in the Niger-Delta areas. The main complaint of the Niger-Delta inhabitants is that they do not enjoy the benefits of the oil found in their region, and this complaint is very reasonable. Creating linkages in this region through development of local capacity to participate in the oil sector activities (through encouragement of indigenous ownership, establishment of the National System of Innovation (NSI) and improvement of the state of infrastructure could help curb this problem. The presence of effective linkages is necessary for a balanced growth of an economy, thus it is important that linkages exist between sectors so as to promote an all-round growth and development of an economy. The severity of this problem in Nigeria can be deduced from the fact that many of the sectors in the economy have been declining in performance, particularly the agricultural sector which was a booming sector before the discovery of oil. This study is necessitated by the dearth of studies in the area of oil sector linkages in Nigeria particularly with a focus on the role of ownership, infrastructure, National System of Innovation (NSI), skills spill over, policy and other factors in enhancing Oil sector linkages in Nigeria.
1.2 Objectives of the study The primary objective of this study is to examine the extent of the linkages that the oil sector has created with the rest of the Nigerian economy. The specific objectives of this study are:
Identification and analysis of linkages in the oil and gas industry that has been created with the rest of the Nigerian economy; a. Map the supply/value chains in the oil and gas industry; b. Identify the activities feeding into the value chain, and the institutions
creating them; Identification of the local content elements in oil and gas activities in Nigeria;
a. Examine the degree of local sourcing; b. Analyse the role of oil firms in promoting linkages; c. Examine the influence of ownership, infrastructure, NSI, skill, policy,
finance, etc in fostering localisation of activities with high output and employment potential;
d. Assess the spill-over effects from oil and gas industry to the rest of the economy and regional economy;
Assessment of the outcomes/impacts of the policy measures that have been and/or are being implemented in enhancing linkages in oil and gas sector
1.3 Statement of the study story Individual MMCP drivers, other drivers and their interactions affect Oil sector linkages in Nigeria. In all, availability of skilled labour, tax policies and innovations stand out as the major drivers of linkages in the Nigerian Oil sector.

3
1.4 Organisation of the Report This report is organised into nine sections. After this introductory section, we have section II on the background of the country/sector which describes the global/country sector structure; country‟s geographical location/spread of the sector; country‟s historical path dependency on the sector; institutional arrangement, legal framework, policies; and some information about the drivers of the linkages. Section III contains conceptual framework and literature review on relevant concepts; international and the country experience on the determinants of oil sector Linkages and other relevant findings. Section IV dwells on the theoretical framework of the study which lays out the value chain; discusses the MMCP Hypothesis and captures other relevant issues. In section V, the methodology of the study is discussed. The key questions/hypotheses are spelt out while the aspect of the Value Chain covered in this study is explained. Section VI is on general issues and core sourcing data, while section VII contains empirical analysis of linkage drivers. Section VIII analyses individual Drivers and Interactive Synthetic Drivers, while section IX concludes the report with summary of key findings and some recommendations.
2.0. Background of the country/sector (the context) 2.1. Global oil sector structure: production, composition, and
trade 2.1.1. World crude oil production The major compositions of energy in the world are crude oil, coal, solar etc. Crude oil however has always been the major source of energy that is most important to countries of the world that have the drive for industrialisation. Crude oil has played an important role in our modern civilisation. It has transformed agriculture and industry and has revolutionised the means of transport. The oil sector has become the basis of vast petrochemical industries that produce fibres, plastics, synthetic rubber, fertilisers, pesticides, synthetic resins and a host of other end-products. The production of crude oil is based on natural endowment, hence only few countries of the world have the privilege of producing the commodity in commercial quantities. The production of crude oil has grown tremendously in the world in the last three decades; it increased from 59.56 million b/d in 1980 to 72.26 million b/d in 2009. It must be noted that the world oil production fluctuated through the period. Although there was a gradual decline in it from 59.56 million b/d in 1980 to 53.97 million b/d in 1985, the world crude oil production gradually and consistently increased to its recent value of 72.26 million b/d in 2009. The quantity of crude oil produced in various countries of the world varies from country to country. Tables 1A and 1B below show crude oil production in selected members of Organisation of Petroleum Exporting Countries (OPEC) and selected non-OPEC member countries respectively. Saudi Arabia has the highest oil production among the OPEC countries and in the world. The country‟s crude oil production stood at 9.9 million b/d in 1980. The country‟s crude oil production, similar to that of the world production declined to 4.27 million b/d in 1987, though, the trend

4
changed and thereafter increased consistently. Other member countries of OPEC that have had substantial crude oil production are Iran, Nigeria, United Arab Emirates, and Venezuela.
Table 1A: World crude oil production, (selected OPEC producers) 1980-2009 (million barrels per day)
Years Iran Iraq Kuwait Nigeria Saudi Arabia
United Arab
Emirates
Venezuela Total OPEC
World
1980 1.66 2.51 1.66 2.06 9.90 1.71 2.17 25.38 59.56
1981 1.38 1.00 1.13 1.43 9.82 1.47 2.10 21.22 56.05
1982 2.21 1.01 0.82 1.30 6.48 1.25 1.90 17.77 53.45
1983 2.44 1.01 1.06 1.24 5.09 1.15 1.80 16.57 53.26
1984 2.17 1.21 1.16 1.39 4.66 1.15 1.80 16.50 54.5
1985 2.25 1.43 1.02 1.50 3.39 1.19 1.68 15.37 53.97
1986 2.04 1.69 1.42 1.47 4.87 1.33 1.79 17.46 56.2
1987 2.30 2.08 1.59 1.34 4.27 1.54 1.75 17.71 56.63
1988 2.24 2.69 1.49 1.45 5.09 1.57 1.90 19.74 58.69
1989 2.81 2.90 1.78 1.72 5.06 1.86 1.91 21.40 59.79
1990 3.09 2.04 1.18 1.81 6.41 2.12 2.14 22.49 60.49
1991 3.31 0.31 0.19 1.89 8.12 2.39 2.38 22.48 60.19
1992 3.43 0.43 1.06 1.94 8.33 2.27 2.37 23.74 60.12
1993 3.54 0.51 1.85 1.96 8.20 2.16 2.45 24.46 60.17
1994 3.62 0.55 2.03 1.93 8.12 2.19 2.59 24.90 61.1
1995 3.64 0.56 2.06 1.99 8.23 2.23 2.75 25.54 62.38
1996 3.69 0.58 2.06 2.00 8.22 2.28 2.94 26.02 63.75
1997 3.66 1.16 2.01 2.13 8.36 2.32 3.28 27.29 65.74
1998 3.63 2.15 2.09 2.15 8.39 2.35 3.17 28.37 66.97
1999 3.56 2.51 1.90 2.13 7.83 2.17 2.83 27.22 65.92
2000 3.70 2.57 2.08 2.17 8.40 2.37 3.16 28.98 68.49
2001 3.72 2.39 2.00 2.26 8.03 2.21 3.01 28.16 68.1
2002 3.44 2.02 1.89 2.12 7.63 2.08 2.60 26.39 67.16
2003 3.74 1.31 2.14 2.28 8.78 2.35 2.34 27.98 69.43
2004 4.00 2.01 2.38 2.33 9.1 2.48 2.56 30.41 2.48
2005 4.14 1.88 2.53 2.63 9.55 2.54 2.56 31.87 3.72
2006 4.03 2.00 2.54 2.44 9.15 2.64 2.51 31.59 3.44
2007 3.91 2.09 2.46 2.35 8.72 2.6 2.43 31.21 2.99
2008 R 4.05 R 2.38 2.59 2.17 9.26 2.68 2.39 R 32.48 3.69
2009 4.04 2.39 2.35 2.21 8.25 2.41 2.24 30.65 72.26
Source: COMTRADE (UNCTAD) accessed through WITS (World Bank)

5
Table 1B: World crude oil production, (selected non-opec producers) 1980-2009 (million barrels per day)
Years Canada China Mexico Norway Former U.S.S.R.
Russia United Kingdom
United States
Total Non-OPEC
World
1980 1.44 2.11 1.94 0.49 11.71 – – 1.62 8.6 34.17 59.56
1981 1.29 2.01 2.31 0.47 11.85 – – 1.81 8.57 34.83 56.05
1982 1.27 2.05 2.75 0.49 11.91 – – 2.07 8.65 35.68 53.45
1983 1.36 2.12 2.69 0.61 11.97 – – 2.29 8.69 36.69 53.26
1984 1.44 2.3 2.78 0.71 11.86 – – 2.48 8.88 38 54.5
1985 1.47 2.51 2.75 0.77 11.59 – – 2.53 8.97 38.6 53.97
1986 1.47 2.62 2.44 0.84 11.9 – – 2.54 8.68 38.74 56.2
1987 1.54 2.69 2.55 0.98 12.05 – – 2.41 8.35 38.92 56.63
1988 1.62 2.73 2.51 1.11 12.05 – – 2.23 8.14 38.96 58.69
1989 1.56 2.76 2.52 1.48 11.72 – – 1.8 7.61 38.4 59.79
1990 1.55 2.77 2.55 1.63 10.98 – – 1.82 7.36 38 60.49
1991 1.55 2.84 2.68 1.87 9.99 – – 1.8 7.42 37.71 60.19
1992 1.61 2.85 2.67 2.13 – – 7.63 1.83 7.17 36.37 60.12
1993 1.68 2.89 2.67 2.28 – – 6.73 1.92 6.85 35.71 60.17
1994 1.75 2.94 2.69 2.57 – – 6.14 2.37 6.66 36.2 61.1
1995 1.81 2.99 2.62 2.77 – – 6 2.49 6.56 36.85 62.38
1996 1.84 3.13 2.86 3.09 – – 5.85 2.57 6.46 37.73 63.75
1997 1.92 3.2 3.02 3.14 – – 5.92 2.52 6.45 38.45 65.74
1998 1.98 3.2 3.07 3.01 – – 5.85 2.62 6.25 38.6 66.97
1999 1.91 3.2 2.91 3.02 – – 6.08 2.68 5.88 38.7 65.92
2000 1.98 3.25 3.01 3.22 – – 6.48 2.28 5.82 39.52 68.49
2001 2.03 3.3 3.13 3.23 – – 6.92 2.28 5.8 39.94 68.1
2002 2.17 3.39 3.18 3.13 – – 7.41 2.29 5.75 40.77 67.16
2003 2.31 3.41 3.37 3.04 – – 8.13 2.09 5.68 41.45 69.43
2004 2.4 3.49 3.38 2.95 – – 8.8 1.85 5.42 42.07 72.48
2005 2.37 3.61 3.33 2.7 – – 9.04 1.65 5.18 41.85 73.72
2006 2.53 3.67 3.26 2.49 – – 9.25 1.49 5.1 41.84 73.44
2007 R 2.63 3.73 3.08 2.27 – – 9.44 1.5 5.06 41.78 72.99
2008 R 2.60 3.79 2.79 2.18 – – 9.36 1.39 R 4.95 41.21 73.69
2009P 2.56 3.8 2.6 2.07 – – 9.5 1.33 5.31 41.61 72.26
Source: COMTRADE (UNCTAD) accessed through WITS (World Bank) Besides the members of the Organisation of Petroleum Exporting Countries (OPEC), there are several other nations of the world that produce crude oil, even in large quantity as shown in Table 1B. The highest crude oil producer among the non-OPEC members is the Former U.S.S.R. Table 1B shows that the country‟s crude oil production was 11.71 million b/d in 1980; this was even higher than crude oil production of the OPEC member countries. United States produced a total of 8.6 million b/d in 1980 and remains above 8 million b/d till 1988 though she is not a member of OPEC. However, crude oil production in the United States started declining in 1989, and continued till 2008 at 4.95 million b/d, though slightly moved to 5.31 million b/d in 2009. Russia is another non-OPEC member that is among major

6
crude oil producing country. From available data, the country produced 7.63 million b/d in 1992, though their production level declined gradually to 5.92 million b/d in 1997, it has since being increasing and stands at 9.5 million b/d in 2009. Other minor crude oil producing countries that are non-OPEC members are: Canada, China, Mexico, Norway and the United Kingdom. Each of these countries produces millions of barrels of crude oil per day.
2.1.2. World trade in oil Tables 2A and 2B show the top 5 exporters and importers of petroleum in the world. The top crude oil exporter‟s countries are Saudi Arabia, Russian Fed, and Norway. Others are Nigeria and United Arab Emirates (Table 2A). Although, the total world export of crude oil was only over $162 billion, the rate of increase in the crude oil export became rapid in the last decade. The world export of crude oil became doubled between the period of 1998 and 2002. There was over 100 percent increase in crude oil export in the world between 2002 and 2005, the value stood at $966 billion in 2006. All the five major exporters of crude oil have consistent increased their crude oil exports between 1998 and 2006.
Table 2A: Top 5 Global Exporters Petroleum $ Value ' 000 % Share in Global Exports
Country 1998 2002 2005 2006 1998 2002 2005 2006
World 162,683,995 318,794,467 755,032,859 966,147,849
Saudi Arabia 26,346,078 49,520,543 124,897,683 160,841,674 16% 16% 17% 17%
Russian Fed. 10,699,418 31,454,555 88,152,966 101,308,820 7% 10% 12% 10%
Norway 13,250,745 24,190,051 46,936,056 52,738,857 8% 8% 6% 5%
Nigeria 9,508,756 14,264,397 41,517,191 55,835,928 6% 4% 5% 6%
United Arab Emirates 10,239,219 15,172,759 40,280,281 56,868,030 6% 5% 5% 6%
Table 2B:Top 5 Global Importers Petroleum
$ Value ' 000 % Share in Global Imports
Country 1998 2002 2005 2006 1998 2002 2005 2006
World 162,683,995 318,794,467 755,032,859 966,147,849
United States 40,734,062 82,588,471 190,390,298 233,198,694 25% 26% 25% 24%
Japan 22,146,701 36,487,123 79,772,916 98,972,140 14% 11% 11% 10%
China 3,274,537 12,757,314 47,722,764 66,411,903 2% 4% 6% 7%
Germany 10,477,479 18,852,063 43,597,849 52,181,798 6% 6% 6% 5%
Korea, Rep. 11,240,588 19,200,267 42,605,836 55,864,936 7% 6% 6% 6%
Source: COMTRADE (UNCTAD) accessed through WITS (World Bank) Table 2B also reports global top five importers of crude oil. The world total export is equal to total import; hence both have the same trend. United States, the highest importer of crude oil in the world, always imports a quarter of world oil import. Other major importing countries are Japan, China, Germany and Korea, Rep.

7
2.2. Nigeria oil sector structure – trade, composition, and production
Nigeria is the 10th largest oil producer in the world, the largest in Africa until recently that she was overtaken by Algeria. The Nigerian economy is largely dependent on its oil sector which supplies the bulk of its foreign exchange earnings and income. The upstream oil industry is Nigeria‟s lifeblood and the single most important sector in the economy. According to the 2008 BP Statistical Energy Survey, Nigeria oil reserves stands at 36.22 billion barrels at the end of 2007 or 2.92 % of the world's reserves. Nigeria's downstream oil industry has four refineries with a nameplate capacity of 438,750 bbl/d. Problems such as fire, sabotage, poor management, lack of turn-around maintenance and corruption have meant that the refineries often operate at 40% of full capacity, if at all. This has resulted in shortages of refined products and the need to increase imports to meet domestic demand. Table 1A, revealed that crude oil production in Nigeria stood at 2.06 million b/d in 1980; it substantially declined to 1.45 million b/d in 1988. The trend of crude oil production in Nigeria changed again in 1989 as it started increasing and the increase was consistent till 2007. Though, there was a slight drop in Nigeria‟s crude oil production in 2008 to 2.17 million b/d, it increased to 2.21 million b/d in 2009. Nigeria is a major importer and exporter of petroleum among nations of the world. While she exports crude oil to a number of countries in the world, she imports refined petroleum products such as petrol, kerosene, diesel etc in order to meet her domestic needs. The amount of Nigeria‟s crude oil export declined from N10681 million in 1981 to N 7201 million in 1983. Moreover her share of crude oil export in the total exports fluctuated in the period. There has been consistent increase in Nigeria crude oil exports since 1987, but very remarkable is that it became doubled between 1990 and 1992. It must also be noted, that Nigeria‟s crude oil exports recorded more than 400 percent increase between 1994 and 1995. The consistent increase in Nigeria crude oil exports translated to equal proportional increase in the country‟s total exports. The share of Nigeria‟s crude oil export in the total export fluctuated around 91.2 percent and 99.0 percent between the period 1981 and 2008. This is depicted in figure 1below. Nigeria imports petroleum products despite being a major producer of crude. Though this scenario happens in some countries such as United States, the reason and motives no doubt is different. The major reason for Nigeria‟s high importation of petroleum products is as a result of the country‟s inability to meet her domestic consumption. Nigeria has four refineries in Kaduna, Warri, Eleme and Port-Harcourt. Even if the four refineries are producing up to their optimum capacity, Nigeria will still not meet her domestic demand of petroleum products, hence the need for importation to augment domestic production. Nigeria imported N119.8 million worth petroleum products in 1981, this however declined to N51.8 million in 1985. Between the period of 1981 and 1985 the proportion of petroleum products imports remain less than 4 percent. Since 1986 the imports of petroleum product has been increasing consistently. The proportion of petroleum product imports in the total imports has also increase in the period, the highest being 28.8 percent in 1996. The value of petroleum product imports stands at N920070.0 million in 2008.

8
Figure 1: Trend of Crude Oil Exports and Imports in Nigeria (1980-2008) Source: Central Bank of Nigeria, Statistical Bulletin (2009)
2.3. Nigeria’s geographical location/spread of the sector Located at the extreme inner corner of the Gulf of Guinea on the west coast of Africa, Nigeria occupies an area of 923,768 sq. km (356,669 sq mi), extending 1,127 km (700 mi) East–West and 1,046 km (650 mi) North–South. It is bordered by Chad on the North-East, by Cameroon on the East, by the Atlantic Ocean (Gulf of Guinea) on the South by Benin (formerly Dahomey) on the West, and by Niger on the North-West and North, with a total boundary length of 4,900 km (3,045 mi), of which 853 km (530 mi) is coastline. Almost all the oil wells in Nigeria are located in the Niger Delta area of the country. The Niger Delta, as now defined officially by the Nigerian government, extends over about 70,000 km² and makes up 7.5% of Nigeria‟s land mass. The Niger Delta consists of the present day Bayelsa State, Delta State, Rivers State, Abia State, Akwa-Ibom State, Cross River State, Edo Stadte, Imo State and Ondo State. Some 31 million people of more than 40 ethnic groups including the Efik, Ibibio, Annang, Oron, Ijaw, Itsekiri, Igbo, Urhobo, Yoruba, and Kalabari, are among the inhabitants in the Niger Delta, speaking about 250 different dialects.
2.4. Nigeria’s historical path dependency on the sector Extraction of crude oil and gas commenced in Nigeria in 1956, with the first discovery of commercial quantity by the then Shell D‟Arcy. Crude oil has been the mainstay of the Nigerian economy; it plays vital role in shaping the economic and political destiny of the country. Despite the discovery of crude oil in commercial quantity in 1956, it was not until the end of the Nigeria civil war (1967 - 1970) that the oil industry began

9
to play a prominent role in the economic life of the country. Figure 2 below shows that oil revenue in 1980 accounted for over 80 percent of the Nigeria total revenue of N15233.5 million. The following year, the total revenue dropped to N13290.5 million evidently as a result of decline in oil revenue to the country. Between 1982 and 1993 the share of oil revenue in total revenue rose consistently from 68.3 percent to 84 percent. Though the percentage share of oil revenue in total revenue fluctuated through the period of 1994 and 2008 it did not fall below 65 percent. In the main, the economy is affected by crude oil price fluctuations.
Figure 2: Shares of Oil in Total Revenue and GDP of Nigeria (1980-2008) Source: Central Bank of Nigeria Statistical Bulletin (2009)
Besides revenue from crude oil, the contribution of crude oil to GDP equally depicts the dependency of Nigeria on crude oil. From the same figure, it can be seen that oil GDP has always been lower as a share of total GDP than non-oil GDP in Nigeria since 1980. Also, both oil and non-oil output has been steadily rising since 1980. Crude oil contributes 21.4 percent to GDP in 1980. The percentage of crude Oil in GDP increased progressively to 35.6 percent in 1981 and remained above 30 percent till 2001. Nigeria recorded gradual decline in oil GDP from 31.5 percent in 2001 to 17.5 percent in 2008.
2.5. Stylised information about some Drivers of Linkages in Nigeria
2.5.1. Ownership (major investors) in the Nigerian oil sector According to the survey conducted by African Development Consulting Group (ADCG) in 1996, there are 18 foreign oil firms in Nigeria. These are Shell Petroleum Development Company Limited (1937), Mobil Producing Nigeria Unlimited (1955),

10
Chevron Nigeria Limited (1961), Texaco Overseas Nigeria Petroleum Company Unlimited (1961), Elf Petroleum Nigeria Limited (1962), Philip (1964), Pan Ocean Oil Corporation (1972), Bought over Ashland Oil Nigeria Limited (1973), Agip Energy and Natural Resources (1979), Statoil/BP Alliance (1992), Esso Exploration and Production Nigeria Limited (1992), Texaco Outer Shelf Nigeria Limited (1992), Shell Nigeria Exploration and Production Company (1992), Total (Nigeria) Exploration and Production Company Ltd. (1992), Amoco Corporation (1992), Chevron Exploration and Production Company (1992), Conoco (1992), and Abacan (1992). Of these companies, Shell is the biggest player. The Shell companies in Nigeria are the Shell Petroleum Development Company (SPDC), the Shell Nigeria Exploration and Production Corporation Ltd (SNEPCO), Shell Nigeria Gas Ltd (SNG), and the Shell Nigeria Oil Products Ltd (SNOP). In addition to these, Shell has a 25.6% shareholding and is also the technical adviser of the Nigerian Liquified Natural Gas Company (NLNG), and its partners in NLNG are the Nigerian National Petroleum Corporation (with 49% interest), Total (15%), and Agip (10.4%). The SPDC is the largest private sector oil and gas company in Nigeria, producing about 43% of Nigeria‟s crude oil. There is a joint venture involving the NNPC which has 55% interest, Shell (30%), EPNL (10%), and Agip (5%). The company‟s operations are concentrated in the Niger Delta region and the adjoining shallow offshore area, where it operates in an oil mining lease area of about 31,000 sq.km. SNEPCO, another Shell company, was established in 1993, and it made the first major deep water discovery (which is the Bonga) in 1995. The development of the Bonga field started in 1999 and has allowed Shell to bring its expertise in deepwater technology into play, and transfer the relevant technologies and skills to Nigeria. Chevron is also one of the big players in the Nigerian oil sector, and worldwide it is one of the largest integrated energy companies. It engages in a host of oil-related activities including oil exploration and production, as well as investing in renewable and advanced technologies, especially technologies that improve their chances of finding, developing and producing crude oil and natural gas. Through Chevron Nigeria Limited (CNL), a principal subsidiary in Nigeria, Chevron operates and holds 40 percent in 13 concessions operated under a joint-venture arrangement with the NNPC, which owns 60 percent interest. Chevron has interests in a number of the oil fields in Nigeria. As at 2009, it had interests ranging from 20 to 100 percent in 12 deepwater blocks in offshore Nigeria, of which it operates 4 of these. It operates the Agbami Field, which spans 45,000 acres and is situated some 30 miles off the coast of the Niger Delta region. In August 2009, this field reached a maximum production rate of 250,000 total barrels of liquids per day. Chevron also has interests in the Apon Field, the Bonga Field, as well as in the Usan project and in the Nsiko discovery.
2.5.2. The state of infrastructure in Nigeria The state of infrastructure particularly power and transportation in Nigeria is very bad as revealed by the World Bank (2007). The World Bank Doing Business survey also reported poor state of infrastructure in Nigeria. Therefore, inadequate infrastructure is a major constraint to the establishment and growth of small and medium enterprises

11
(SMEs) in Nigeria and hence, a major constraint to linkages in the oil sector. However, the Telecommunication sector has improved significantly, while there is a very strong initiative of the government to unbundle the power sector so as to promote efficiency and effectiveness in service delivery in this sector. The rail line is developing while the services of the airline have improved.
2.5.3. NSI, skills upgrading and localisation in Nigeria Efforts of stakeholders towards skills upgrading and localisation in Nigeria need to be examined since this is a critical means of promoting linkages. The stakeholders in creation and development of NSI and skills in Nigeria are the government, Oil firms, private individuals and non-governmental organisations (NGOs). With respect to government, Federal Government budget on education is very small (from less than 1.0% of the total budget in 1971 to 11.6% in 1989 and to 12.6% in 2000, but declines to about 7.0 % subsequently. A number of NSI institutions have been created in Nigeria. These include the establishment of Universities, Polytechnics and Technical colleges as well as the Petroleum Technology Development Fund (PTDF) in 1973. The PTDF is charged with the responsibility of developing, promoting and implementing petroleum technology and manpower development policies through research and training of Nigerian as graduates, professionals, technicians and craftsmen in the fields of petroleum and other engineering areas, geology, geosciences, management, economics and other relevant fields in petroleum and solid minerals industry locally or abroad. The PTDF endowment programme has focused on advancing petroleum technology education in six Nigerian Federal Universities. These Universities and their respective areas of specialisation are: Ahmadu Bello University, Zaria (Chemical Engineering); University of Ibadan (Petroleum Engineering and Geology); University of Maiduguri (Geology); Usman Danfodio University, Sokoto (Pure and Applied Chemistry); University of Nigeria, Nsukka (Geology); and University of Port Harcourt (Gas Engineering). The endowment fund ranged between N10million and N60 million per university. The PTDF also carries out a number of programmes including;
the PTDF Engineering Design Training Programme (EDTP),
Welders Training and Certification Programme (WTCP),
The Local Scholarship Scheme (LSS) and the Overseas Scholarship Scheme (OSS). From 2001 to 2006, 450 M.Sc and 84 Ph.D scholars were trained in the OSS programme.
Past attempts by government in establishing a national system of innovation also include the establishment of the Petroleum Training Institute (PTI) in Delta State (in 1973), the Federal University of Petroleum Resources in Delta State, and also the National College of Petroleum Studies in Kaduna (NCPS, in 1995). The PTI functions as an educational institution, and it also trains lower and middle level manpower to meet the indigenous labour requirements of the oil and gas sector, while the NCPS is for training of high level manpower. There have also been attempts by the private sector in investing in research and education. Almost all the major oil companies investing in Nigeria carry out training programmes and sponsor education through grants of scholarships. A good example

12
is Shell, and some of its activities that are in line with investment in research and development include the following packaged in their social responsibility activities:
The Shell Intensive Training Programme, which was introduced in 1998 with the objective of preparing young graduates for employment in the oil industry.;
University scholarship grants- Shell grants about 850 university scholarships annually to deserving students;
Endowment of Shell Professorial Chairs in 7 universities;
Youth Development Schemes: under which they have trained about 355 youths in a range of skills such as welding, pipefitting and carpentry, entrepreneurship and leadership development and conflicts management;
Provision of employment
Building of infrastructures that promote education. For example, in 2004 Shell completed a total of 86 infrastructural projects, including classroom blocks, teachers‟ quarters and libraries, among others.
Shell also holds a workshop regularly for stakeholders in the oil sector, which includes institutions, industry specialists, unions and academics. The workshop aims at solidifying partnerships among these stakeholders, and this is the underlying basis for a system of innovation.
Between 2001 and 2006 a total of 450 M.sc. and Ph.D students have been through the PTDF scholarships in various areas (PTDF, 2007). M.sc Students trained in various disciplines (450 students)
Engineering 142 students
Geological sciences 71 students
Environmental Technology 71 students
Offshore related courses 26 students
Energy related courses 26 students
Information Technology 33 students
Other areas 81 students Ph.D Students trained in various disciplines (84 students)
Engineering 32 students
Environmental 23 students
Geosciences 12 students
Management and Law 14 students
Information Technology 2 students
Polymer science 1 students
2.5.4. Institutional arrangement, legal framework and policies Until 1960, government participation in the oil industry was limited to the regulation and administration of fiscal policies. In 1971, Nigeria joined the Organisation of Oil producing countries (OPEC) and in line with OPEC resolutions, the Nigerian National Oil Corporation (NNOC) was established, and later became NNPC in 1977. This government parastatal, with all its subsidiary companies, controls and dominates all activities in the oil industry, both upstream and downstream. In April 2000, the Nigerian government set up a new committee on oil and gas reform to deal with the deregulation and privatisation of NNPC. Seven subsidiaries of NNPC are due to be sold including the three refineries, the Eleme Petrochemicals Company Ltd, the

13
Nigerian Petroleum Development Company and the partially owned oil marketing firm, Hyson Nigeria Ltd. Development of local content is regarded as a policy towards encouraging linkages in the oil and gas industry, and hence enables citizens to derive maximum gains from exploration, production and development of the industry. Compared to other countries where local content is high (Brazil, Malaysia, Venezuela and Norway: 45-75%), it is relatively low in Nigeria. Although estimates of local content in the oil and gas industry vary by institutions, it ranged from 3-5% in the 1970s to 1990s, but rose to 14% in 2003 and to about 20% in 2004 (UNCTAD/CALAG, 2006). Attempt by Government to address the problem of very low local content in the oil and gas activities led to the raising of the level to about 35 percent. The Federal Government of Nigeria articulated a Nigeria Content Policy to ensure that investments made in the Oil & Gas industry have a significant trickle-down effect on the economy, and thus, set a local content target of 70% by 2010. The overall objective of the policy is to promote local value addition, build local capacity and improved linkage between the Oil and Gas industry and other sectors of the Nigerian economy. This policy emphasises the utilisation of local human and material resources as well as local services. In Nigeria, a national content policy was by passed into law in April 2010. Apart from sector specific policies, economy policy of deregulation, privatization and general institutional reforms are still ongoing in virtually all sectors of the economy including the oil sector, and these reforms have engendered large inflow of foreign investment into the country. This has also encouraged gradual return of the private sector to the supply and distribution of oil products. Refinery and petrochemical plants are being privatised, while the private sector has been granted approval for establishing new ones by government.
2.5.5. National content development in Nigeria oil and gas sector According to the Nigerian National Petroleum Corporation- NNPC(2009), Nigerian Content means “the quantum of composite value added to, or created in the Nigerian economy through the utilization of Nigerian human and material resources and services in the exploration, development, exploitation, transportation, sale and processing of Nigerian crude oil and gas resources resulting in the development of indigenous capabilities, while encouraging foreign investment and participation, without compromising quality, health, safety and environmental standards‟‟. The promotion of the Nigerian content started with the enactment of the Petroleum Act of 1969. This act contained a section on the protection for indigenous Nigerian firms on the basis of reciprocity (Pet. Act. 1st schedule section 23 (1) and (2). It also contained a section on human capacity development (Pet. Act. 1st schedule section 37; pet regulation, part IV, paragraphs 26, 27, 28 and 29). The joint operating agreements (JOA) and the production sharing contract (PSC) between the Nigerian government and the foreign oil companies in 1991 and 1993 respectively, involved

14
patronage and involvement of indigenous firms in the supply of commodities1. Subsequently, the Nigerian content policy was made in 2005, This policy involves the issuance of 16-23 directives by the Nigerian government on domiciliary of services; award of low-tech on-shore supply of goods and services to indigenous firms; and patronage of domestic sources of commodities. The government wants to achieve 45 percent local content in the oil and gas sector in 2009 and 70 percent in 2010. However, in 2009, only 39 percent was achieved. Among the reasons adduced for this low local content achievement was the absence of the legislation and lack of monitoring and supervision capacity by the NNPC. The Nigerian Content Act (2010) was enacted in 2011. This Act introduces new policies and legislations that seem to change the shape of oil and gas business in Nigeria. According to the Local Content Act, “Nigerians independent operators shall be given first consideration in the award of oil blocks; oil filed licenses, oil lifting licenses and in all projects for which contract is to be awarded in the Nigerian oil and gas industry. In the bidding for any license, permit or interest and before carrying out any project in the Nigerian oil and gas industry, an operator shall submit a Nigerian content ('Plan') to the board demonstrating compliance with the Nigerians Content Act. Finally, the award of contract shall not solely base on the principle of the lower bidder; where a Nigerian indigenous company has capacity to execute such job, the company shall not be disqualified exclusively on the basis that it is not the lowest financial bidder, provided the value does not exceed the lowest bid price by 10 percent”.
2.6. Summary of legal and Institutional framework of petroleum operations in Nigeria
i The concession era
ii The Petroleum act 1969
The oil exploration license (OEL)
The oil prospecting license (OPL)
The oil mining lease (OML)
Assignments
Terminations
Revocations
Interpretation iii Petroleum arrangements
Joint operating agreements (JOA)
The production sharing contract (PSC)
The service contract (SC)
The memorandum of understanding (MoU)
Sole risk iv. Legislation regulating petroleum operation in Nigeria:- the principal acts
Petroleum (drilling and production) regulations 1969
Petroleum profits tax act 1959
1 (JV-JOA, Section 5.5.1 of Schedule C (Uniform Project Implementation Procedure) Premium on
commercial offers of locally sourced goods and services over imports (JOA Schedule C and PSC, Article 5.5 of Annex E)

15
Oil in navigable waters act 1968
Offshore oil revenues act
Offshore oil revenues (registration of grants) act 1972
Oil pipelines act 1965
National Content Act-2010
2.7. Past attempts at creating linkages in the Nigerian oil sector Linkages are created in an economy through a number of means including creations of local institutions, promotion of local sourcing by the foreign investors, creation of partnerships between the foreign investors and domestic companies, building or rehabilitation of infrastructures, formation of clusters, as well as by the creation of a system of innovation. An attempt to create linkages between the oil sector and the rest of the Nigerian economy led to the creation of many government institutions including ministries and parastatals (Ministry of Energy and Petroleum resources; the Nigeria National Petroleum Corporation (NNPC); Universities and Polytechnics, Technical colleges; and so on. The formation of the NNPC in 1971, which is in a joint venture with all the major foreign investors in the oil company, can be said to be a government attempt to partner with the TNCs, so that not all the gains from the oil sector flow abroad. Another government effort in fostering oil sector linkages, especially in the Niger Delta, is the establishment in 2000 of the Niger Delta Development Commission (NDDC) by an Act of parliament to coordinate all development activities of the Niger Delta. The commission derives its funding from statutory contributions by the federal government and the oil producing companies, which are required to contribute 3% of their budget to the NDDC fund. One major step in this direction by the federal government is its establishment of the Petroleum Technology Development Fund (PTDF) by the Decree No. 25 in 1973. Meanwhile, the extent to which these efforts have succeeded in creating linkages between the oil and gas sector and the rest of the economy can be described as inadequate.
2.8. Linkages crisis in Nigeria: the Niger-Delta situation The situation in the Niger Delta is a very good and practical illustration of the consequences of the dearth of linkages in the oil sector. For years now there has been unrest in the area, and the main complaint of the inhabitants of this area is that the government of the country has exploited them. It can be argued that the Niger Delta is the main source of the wealth of our nation, as it is made up of nine oil producing states, yet, the inhabitants continue to struggle for survival by subsistence farming and fishing, while the government and foreign companies pump out oil that generates billions of naira on a daily basis from their own land. Moreover, these companies cause environmental degradation to their land, polluting their water and therefore reducing their already meagre means of livelihood. The people of the Niger Delta made a major response through a group of militants called the Movement for the Emancipation of the Niger Delta (MEND). This group has carried out a series of activities including kidnapping of foreign oil workers (hostage-

16
taking), disruption of activities of the oil companies, closures of flow-stations, sabotage, and intimidation of staff, among others. The Niger Delta crisis can be said to be a war against the Federal Government of Nigeria over resource control, justice and development of the Niger Delta. But as the Niger Delta militants see it, the use of the oil has instead brought about environmental degradation of their environments, and they live under appalling conditions with no clean drinking water, no access to good medical facilities and no good schools for the people. If there were effective linkages between the oil sector and the rest of the economy, these affiliated institutions and services would be available, and there would be little reason for any political unrest.
3.0 Conceptual framework and literature review 3.1 Conceptual framework
Linkages are definitely a desirable phenomenon, as there are many benefits that can be derived from them. For the linkages that occur between domestic SMEs and foreign firms (TNC-SME linkages), both sides stand to gain. For the domestic SMEs linkages present one of the fastest ways of upgrading themselves through transfer of technology, knowledge and skills, improvement of business and management practices, and facilitation of access to finance and international markets (UNCTAD, 2010). When the linkages are strong, they also help the domestic firms by raising their technological and managerial capabilities, production efficiency and growth. As for the foreign firms, linkages (in the form of outsourcing) help them to improve on their flexibility and cut costs, thereby increasing their efficiency from lower costs (Matthews, 2007). There are a number of ways in which linkages are created. According to UNCTAD (2010), the four main types of linkages that can occur are forward linkages between TNCs and Customers, Backward linkages between TNCs and suppliers, linkages among technological partners and linkages that result from a spill-over effect. Linkages between technology partners occur when TNCs engage in joint ventures, licensing agreements, or strategic alliances with local partners, and this can take the form of clustering. This has advantages to both parties as it provides technological and managerial knowledge to the domestic SMEs, and it grants foreign TNCs access to local authorities, institutions and markets. Besides, the gains from clustering accrue to this type of linkage formation, and this includes economies of scale, low costs of purchases, speedy flow of information, among others. In developing linkages, there are four key policy areas that are involved, and they must work hand in hand, not in isolation, for the linkages to be effective (UNCTAD, 2010). They are:
1. Improving the investment climate; that is providing incentives for both private and public investment in the country. Investment promotion activities can be grouped into three main areas (Wells and Wint, 2000): a) Image-building activities which include portraying the country as a
favourable environment for investment, for example, Nigeria‟s „Rebranding Nigeria‟ campaign.
b) Investment-generating activities; which include establishing and strengthening strong contacts with potential investors; and

17
c) Investment-facilitation services; which is where changing the legal and institutional environment comes in, and also providing other encouragements such as expediting the processes of applications and permits, and providing post-investment services.
2. Devising policies for attracting and retaining FDIs that have the potential to create positive spill-over effects on the domestic economy. FDI is important as it has been proven to be instrumental in the catch-up process of some countries that successfully caught up (Nelson, 2007). The quality of FDI involved here is crucial as low quality FDI that have low linkage potential can lead to adverse effects on an economy, such as crowding out the domestic enterprises and therefore resulting in increasing domestic unemployment.
These first two areas work hand-in-hand as we improve the investment climate in order to attract FDI.
3. Strengthening the absorptive capacity of the domestic firms- improving their ability to gain from linkages by increasing their ability to internalize the technological and management skills that flow to them. This is because the likelihood of positive spillovers occurring on the domestic firms are higher when the technological gap between them and the TNCs is relatively smaller, so strengthening their absorptive capacity has to do with reducing this gap.
4. Specific linkage policies involve providing incentives for the TNCs and domestic firms to cooperate so as to provide opportunities for linkages and its positive spill-over effects to occur.
One important way of creating linkages is to encourage innovation and research and development in domestic firms, and also to encourage partnerships between firms, universities and research institutes involved in R&D. This is where the subject matter of this study comes in, as this involves the establishment of a National System of Innovation, which ensures that universities, research institutes, firms, etc are all involved in R&D and are interconnected with each other in a network. Another way of creating linkages is by organizing and supporting training programmes. This is because, as already stated, entrepreneurship is crucial for the innovation process to be complete, and so investment in management capabilities is as important as those in technological skills. Supporting training of domestic labour has a high potential to create linkages because it increases the chances of the TNCs recruiting indigenous managers and engineers, and this in turn increases the chances of these TNCs engaging in local sourcing and procurement practices, which is in itself another form of linkage. Yet another crucial way of encouraging linkages is by the provision of access to financial and non-financial business services. Difficult access to finance is a major growth constraint for SMEs (OECD, 2005). Since entrepreneurship manifests itself through the establishment of SMEs, it is important that SMEs are given all the necessary requirements for growth so as to encourage entrepreneurship, and consequently to raise the absorptive capacity of SMEs to be able to gain from linkages. In sum, the factors that should be considered in order to execute an effective linkage programme are as follows:

18
Creating a critical mass of purchasing companies, which will provide the demand side for the SMEs‟ products and services, and this is done by attracting strategic FDI.
Creating a pool of qualified domestic SMEs to provide the supply side, and this is done by raising their absorptive capacity and upgrading them.
Building an effective selection mechanism which helps to partner TNCs with only domestic SMEs that are up to standard and have the potential to gain from partnerships
Putting in place supporting mechanism to improve the investment climate and encourage linkages.
According to Al-moneef (2006), the term forward linkages refers to the actual physical output from the petroleum sector (oil and gas) which feeds into the rest of the economy as intermediate inputs. The forward linkages in the oil and gas sector include the following.
crude oil input into the refining industry;
the input of gas and its liquid feed stocks (and refined products) into the petrochemical industry; and
the input of oil and gas fuels into electricity production and energy intensive industries.
These linkages have contributed to the development of the manufacturing sector in oil producing countries such as Arab countries. They have also led to growing shares of manufacturing and services and hence, the non-oil activities in GDP. They have enhanced government revenue and provision of utilities at favourable prices. The first direct and noticeable contribution of the oil sector was the development of the refining industry in the oil producing and exporting countries. The second contribution can be traced to the development of the petrochemical industry, which was initially based on natural gas and its liquids. For instance, after the first oil price boom, this development accelerated in Arab economies due to more liberal government policies introduced to promote the use of oil as a vehicle for diversification in industry and the various alliances that had been formed between the newly emerging national oil (or petrochemical) companies and the international investors in the petrochemicals field. This resulted into an explosion of basic, intermediate and final petrochemical production in the Arab oil exporting countries (Al-moneef, 2006). Steven (2003) sees forward linkages from oil and gas projects as the provision of energy inputs to other sectors of the economy. According to him, it is the act of developing an indigenous oil and gas supply so as to make an immediate contribution to economic progress. For instance, improving supply reliability is a key contribution, particularly in the transition countries. Forward linkages are especially relevant in oil projects which produce significant amounts of associated gas. The role of Oil companies in the development of forward linkages has been underscored by Steven (2003). According to Steven (2003), they can aid the development of forward linkages in many ways. First, the provision of domestic supplies of gas or crude can promote competition which drives down prices. Second, they can provide technical assistance in the area of engineering. The transition economies need a well-developed infrastructure to deliver oil and gas as well as require refurbishment and improved maintenance. Such assistance can also be
19
aimed at developing institutional capacity to reform the energy sector and to develop energy policies even if this means leaving the sector to the market. The oil companies with their unique knowledge of the experience of other countries and access to other sources of expertise can do much to guide governments. Successfully reformed energy sectors can do a great deal for the provision of cheap, reliable energy to the rest of the economy. Similarly Al-moneef (2006) conceived backward linkages as the process whereby inputs of goods and services are provided to the petroleum sector by local sources. He pointed out that in the Arab oil producing countries, the importance of these linkages increased after nationalization or promotion of indigenous private ownership of the industry. He also pointed out that backward linkages unlike forward linkages to the local economy respond to the market cycles that influence the oil sector and its operations. Thus, when oil production fell in response to declining world oil demand and increasing non-OPEC production, oil sector-related services also respond accordingly, and as oil sector activity recovered (in the form of oil and gas capacity expansion) oil sector-related services improved as well. According to Steven (2003) backward linkages from the oil and gas projects concern the input of the rest of the economy into the planning, construction and operational phases of the project. The greater the local input of labour and materials, the more positive the impact on the rest of the economy. The obvious contribution from the oil companies in this context relates to procurement policies. Usually, the contract which sets the terms of the operation includes specific clauses relating to minimum content of local employment and/or local content. This is no substitute for a genuine desire on the part of the operating company to maximize local input. The oil companies should promote and nurture the development of local capacity. They can play the role of providing information to local businesses so as to be aware of what sorts of inputs are required, what standards of the inputs are required, and how the tendering process will work. They can also assist in the provision of training in areas such as business planning, quality standards, ethics, E-procurement, and so on. Some sort of “enterprise centre” can be created to act as a conduit to channel information and assistance to local firms. Also, the oil companies can determine the labour requirements and the levels of skill required. This study focuses on the backward linkages of the oil sector. It can be seen from the foregoing that linkages can take the form of information exchange, joint training, joint order and or purchase or sales, joint product development, machinery lending, cooperation for product or quality development and improvement, actions to improve service delivery, and so on. Some forms of linkages appear to be easier than others. For instance, elementary form of linkages can begin from information exchange provision of training, to upgrade skills to meet the required standard and to the advanced stage of joint ordering, joint development and machinery lending. The extent of linkages created depend on necessity, resources requirement for creating the linkages and the benefits to be derived, among other factors.

20
3.2 International experience on the determinants of oil sector linkages
Wlazlowsk (2007) examined the linkages in crude oil and end-product. Crude oil prices were found to have a significant impact on retail petroleum product prices and were shown to affect inflation and other key economic indicators. This article analyses the former's link in the European Union (EU) within a multi-national and multi-product framework. The results indicate that the old EU countries from North-West Europe are well integrated in the global petroleum markets, while the Mediterranean and Eastern European countries depend on the low-quality Russian oils. Furthermore, while product prices in the North West Europe are driven by the world benchmark crudes, countries with easy access to Russian oil are in the bidirectional relationship with its prices. Korhonen and Ledyaeva (2008) in their paper assessed the impact of oil price shocks on oil-producing and oil-consuming economies. VAR models for different countries are linked together via a trade matrix, as in Abeysinghe (2001). As expected, they reported find that oil producers (Russia and Canada) benefit from oil price shocks. For example, a large oil shock, leading to a price increase of 50%, boosts Russian GDP by some 12%. However, oil producers are hurt by indirect effects of oil shocks, as economic activity in their export countries suffers. For oil consumers, the effects are more diverse. In some countries, output drops in response to an oil price shock, while other countries seem to be relatively immune to oil price changes. Finally, indirect effects are also detected for oil-consuming countries. Those countries trading more with oil producers receive indirect benefits via higher demand from the oil producing countries. In general, the largest negative total effects from positive oil price shocks are found in China, USA and Japan while European countries seem to fare quite well during recent positive oil-price shocks. Wunder and Sunderlin (2004) assessed the linkages between oil, macroeconomics, and forests. The study attempts to answer the questions, how an oil boom affect the forest cover of tropical oil-exporting countries? And what macroeconomic linkages and policies are decisive? A comparison of research findings on long-run land-use changes in eight tropical developing economies reveals that the direct physical impacts of the oil industry on forests are unquestionably less than its derived macroeconomic impact. In most cases oil wealth indirectly, but significantly, protects tropical forests. The core mechanism is that oil rents cause macroeconomic "Dutch disease" decreasing the price competitiveness of agriculture and logging, strongly diminishing pressures for forest degradation and deforestation. But domestic policy responses to oil wealth are also vital determinants of the forest outcome. When governments use oil wealth for urban spending sprees, this reinforces the core effect by pulling more labour out of land-using and forest-degrading activities. When oil revenues finance road construction or frontier colonization, however, the core forest-protective effect can be reversed. Repeated currency devaluation and import protection of land-using domestic sectors also increase pressures on forests. Other international capital transfers, like bilateral credits, aid, or debt relief, can have impacts similar to those of oil wealth, either alleviating pressures on forests or aggravating specific forest-detrimental policies. These insights point to forest-friendly safeguards that can realistically be made in the design of structural adjustment

21
programs, considering the important tradeoffs between development and conservation objectives. Hanson, Robinson and Schluter (1993) examined the effects of a world oil price shock and linkages to the agricultural sector. They used an input-output model to analyse the direct and indirect cost linkages between energy and other sectors of the economy. In order to allow sectoral output adjustment and the effects on the U.S. current account, they used the U.S. Department of Agriculture/Economic Research Services Computable General Equilibrium (CGE) model to analyse the sectoral effects under three different macro adjustment scenarios. Their finding reveals that the effects on agriculture are not limited to the direct and indirect energy costs. Exchange rate or foreign borrowing adjustments to higher oil import costs and government support programs for agriculture also matter. Bessant and Kaplinsky (2003) while asserting that manufacturing is no longer simply a business of transformation of inputs into outputs through the use of standard equipment and techniques, but rather the ability to master the knowledge content in production, examined empirically how to put supply chain learning into practice. They posited that as firms struggle to cope with an increasingly turbulent and uncertain economic environment, there is widespread recognition of the importance of organisational learning. One option is to look at the potential of shared learning between firms, where common interests and interdependence provide motivation for experience sharing and other forms of synergy in learning. A particular version of inter-firm learning is the use of supply chains as a mechanism for upgrading and transferring ``appropriate practice‟‟ and this article reports on exploratory research on this theme. It draws on a literature survey and a detailed study of six UK supply chains at various stages of implementing supply chain learning. Contrary to some recent work on so-called 'globalisation', Freeman (1995) argues that national and regional systems of innovation remain an essential domain of economic analysis. Their importance derives from the networks of relationships which are necessary for any firm to innovate. Whilst external international connections are certainly of growing importance, the influence of the national education system, industrial relations, technical and scientific institutions, government policies, cultural traditions and many other national institutions is fundamental. The historical examples of Germany, Japan and the former USSR illustrate this point, as well as the more recent contrast between East Asian and Latin American countries. Gereffi, Humphrey and Sturgeon (2005) built a theoretical framework to help explain governance patterns in global value chains. Their work draws on three streams of literature – transaction costs economics, production networks, and technological capability and firm-level learning – to identify three variables that play a large role in determining how global value chains are governed and change. These are: (1) the complexity of transactions, (2) the ability to codify transactions, and (3) the capabilities in the supply-base. The theory generates five types of global value chain governance – hierarchy, captive, relational, modular, and market – which range from high to low levels of explicit coordination and power asymmetry. The article highlights the dynamic and overlapping nature of global value chain governance through four brief industry case studies: bicycles, apparel, horticulture and electronics.

22
3.3 Nigeria’s experience on the determinants of oil sector linkages UNCTAD (2006) is a survey that aimed at providing a clear understanding of the opportunities in the Nigerian oil services subsector. It contains a critical analysis of the nature, dimension and scope of the oilfield services business and attempts to highlight policy, environmental and legal issues. The report examines the characteristics, size and features of the oilfield services business and discusses recent initiatives aimed at the implementation of local content within the industry by the oil majors and the moves to introduce legislation on local content. The report further stresses the need for both domestic and foreign investors to acquire an understanding of the legal framework for petroleum operations in Nigeria. To undertake the magnitude of investments needed in the next few years in order to meet targets in crude production, domestic and regional gas utilization and downstream projects, Nigeria needs to attract a high level of foreign direct investment. Accordingly, the report also discusses where the opportunities exist for such investments to make an impact. Environmental and community relations are also discussed, for they have been the Achilles heel of petroleum operations in Nigeria since the early 1990s. Lastly, issues of financing, its sources and availability, which are crucial especially to empowering indigenous operators, are presented in the UNCTAD report. Apata (2010) examined the linkages between crude-oil exploration and agricultural development in Nigeria. Crude oil exploration has led to environmental problems in the producing communities. This has adversely affected livelihood activities in agriculture leading to low income. In this study, livelihood diversification strategies of farming households in crude oil-polluted areas of Nigeria were examined. The study documents that majority of the household heads undertook one form of livelihood diversification strategy or another. Eighty-nine percent of the respondents diversified into non-farm activities, and livelihood diversification has significant and elastic effect on household income. The poverty status showed that 85.2% of the household heads that relied only on farm income were unable to meet household basic needs compared with 32.3% for those that diversified into non-farm activities. Albaladejo (2003) assessed the industrial performance and capabilities of Nigeria over the last decade. The study shows that Nigerian industry is inexorably falling behind and becoming increasingly marginalized in the international and regional industrial scene. The increased dependency on oil extraction is identified as one of the causes of the poor performance of the Nigeria industrial sector. Heum, etal. (2003) assessed the enabling environment for private sector development in the Nigerian upstream petroleum industry with a view to recommending ways of increasing and improving the capabilities of Nigerian supply and services companies. Discussing the content of a viable policy approach, the study attempts to integrate the capabilities and potentials of the Nigerian business community with lessons that can be drawn from theory and practical experiences. It goes further to recommend that the ultimate goal of a viable local content policy should be to create jobs by enhancing sustainable industrial growth and national wealth. The recommendations of this study equally include that the local content development has to build on a commitment by the oil and gas companies.

23
4.0 Theoretical framework
4.1 Laying out of value chain 4.1.1. Standard oil and gas value chain The standard value chain for oil and gas sector runs through about five areas. It begins from exploration activities which involves the search for oil resources to production activities which entails exploitation of oil and gas. Further activities include transportation of oil to refineries and finally to consumer through various modes such as pipelines and vessels as well as road networks. Refining involves the transformation of crude oil into finished products such as fuel, kerosene and diesel. The final stage is the distribution of finished products to consumers. In the case of natural gas, the activities also start with exploration just like in the case of oil, the next stage is drilling to bring gas to surface. Then the natural gas has to be processed before been taking to the markets through various modes of transportation the final stage is the distribution of the natural gas to the various consumers. These various activities in the oil and gas are presented in the charts below. a. Crude Oil Value Chain
Using technology to find new oil resources
Bringing oil to the surface using natural and artificial methods
Moving oil to refineries and consumers with tankers, trucks and pipelines
Converting crude oil into finished products
Distributing and selling refined products
b. Natural Gas Value Chain
Using technology to find new oil resources
Bringing gas to the surface
Treating gas to be sent to markets
Moving gas with pipelines and tankers
Distributing and selling natural gas
Exploration Production Transportation Refining Retail
Exploration Drilling Processing Transportation Retail

24
Oil & Gas Industry Value Chain
Upstream
Surface Activity
(geology)
Geophysical (seismis) Activity
Subsurface Activity
(geochemistry)
Transportation Services
Drlling Services
Rig Hire
Pipeline Construction
services
FPSO
Data acquisition & processing
Manufacturing
Service Vessels
Maintenance Services
Rigs Servicing Vessels Services
Control Services
FPSO Servicing
Structure Maintenance &
Repair
Retrofitting Components Fabrication
Lubrication Services
Abandonement
Rigs, marine vessels, & platforms
Design Engineering
Construction of Ref inerySeismic Testing
Directional Services FEED
Training: manpower development
Strucutral Strength & Corrosion Assessment
Pollution Control Exercise & Assessment
Crude Processing Manufacturing of non-fuel products
Product Trading
Product Distribution
Services
R&D
Oilfield Services
Exploration Extraction/Production
Midstream
Downstream
Ref inery Marketing Business Services Transport & Freight
Figure 3: Oil and Gas Industry Value Chain
The oil and gas value chain consists of upstream, midstream, and downstream activities as can be seen in the figure 3. The areas of focus of this study run through the entire value chain particularly the fabrication activity which is very important to both upstream and downstream activities. The well construction and completion activity is an important part of the upstream activity, while the Control system and ICT is critical to both upstream and downstream activities.
4.2 MMCP hypothesis and other relevant Issues 4.2.1. Drivers of oil sector linkages Several factors have been identified as drivers of the oil sector linkages. Mathews (2002) suggested four drivers of linkages. These factors include: transportation, infrastructure, ownership and skills. Other linkage factors mentioned in the literature include: policies and national system of information. These drivers are discussed in turns. One of the most important drivers of the oil sector linkage is the National System of Information (NSI). The NSI involves investment in managerial and entrepreneurial capabilities in addition to investment in technical knowledge. Sometimes it involves sending the indigenes that are products of the domestic universities and educational institutes, abroad to learn the methods of advanced countries (Nelson, 2007). This

25
increases the chances of the Transnational Corporations (TNCs) in the country employing the domestic indigenes in management positions, thereby reducing domestic unemployment. This in turn increases the chances of local sourcing occurring because the indigene managers are more likely to want to form linkages between the TNCs and the domestic supplier firms since they are aware of the benefits this would generate for their domestic supplier SMEs (UNCTAD, 2010). Another driver of linkages that is related to NSIs is knowledge or skill spill-over effects. It is helpful to distinguish between two types of R&D; the more innovative Competence-Creating (CC) type that introduces new lines of capabilities, and the diffusion-related type which is more common, that is the Competence-Exploiting (CE) type (Cantwell and Piscitello, 2007). The more adaptive CE type is primarily demand-driven and so it is basically determined by the extent of differentiation in the domestic markets, while the CC type is basically supply-driven and so depends on the quality of available human and knowledge resources. It can be expected that knowledge and skill spillovers from NSIs are going to influence the level of the Competence-Creating type of R&D more than it would influence the Competence-Exploiting type of R&D. Very few Nigerians are employed in the oil sector, and most of those employed are of the semi-skilled type. The Federal Government implemented a rapid indigenization and Nigerianisation policy in the late 1970s in several sectors of the economy, with registered companies in the country required to apply for job permits under an expatriate quota regime for certain categories of staff, many multinational oil companies began to comply by hiring qualified Nigerian professionals. Many leading oil companies - Shell, Mobil, Gulf (later Chevron) - began intensive training programmes for their Nigerian staff both locally and overseas, and it was this first group of Nigerian employees who later attained top executive, technical and managerial positions in these companies. They have the responsibility of defining strategies to meet and exceed the Federal Government‟s targets for local content, formulating an approach for upgrading the skills and technology of indigenous companies, developing initiatives to guide the transfer of skills and technology to local companies, and liaising with local companies to identify opportunities and modalities for investment. Apart from transportation, other infrastructural facilities are capable of enhancing linkages in developing countries like Nigeria. With poor infrastructure, factor accumulation in one subnational region may not create agglomeration effects in other subnational regions. In the limit, as a country becomes less and less integrated, factor accumulation may not increase effective country size at all. If a country has poor infrastructure, so that subnational regions cannot take advantage of large demand in other regions within the same country, then its production pattern will be similar to those in smaller countries. Ownership is an important driver of linkages in oil producing nations. In the 1990s, the main issues were the use of oil revenues to aid economic recovery/reforms, and the rising concerns for the protection of the oil producing environment, including the rights and livelihoods of the people living in the oil-rich Niger Delta region. The nature and value of these resources in global markets: economic and strategic, the power relations corresponding to the exploitation of these resources and the ways such relations feed into issues of access, ownership, distribution, democracy and social justice are very fundamental. This shows that while the resource may be a curse for

26
those that lose their land, homes, and rights for resource extraction to take place, it can be a blessing for those extractive external forces and their local allies that control and sell these resources on the world market. The oil industry in Nigeria has gone through three phases: the oil concession, state participation, and deregulation eras. The earliest era had its roots in the first decade of the 20th century with pioneering oil exploration work by the German Bitumen Company based on a 1914 colonial Minerals Oil Ordinance granting the monopoly of oil concessions in Nigeria to “British or British-allied capital” (Obi, 2006). Under this law, Shell D‟Arcy (later Shell-BP), was granted an oil concession covering the entire Nigerian mainland in 1938. Shell eventually struck oil in commercial quantity in 1956 in Oloibiri (in present-day Bayelsa state) in the Niger Delta, formally marking the inception of the oil era in the country. The discovery of oil in commercial quantity set the stage for the entry of other oil multinationals and national oil companies (Mobil, Texaco, Esso, Agip and Safrap), that took up the oil acreages given up by Shell in 1958. The early era of the oil industry was characterised by foreign control and non-participation by the Nigerian state that simply collected rents and taxes. The existing studies confirm the proposition that innovation is important in the catch up process of countries. An example is the work of Abramowitz Moses who studied countries that had recently caught up rapidly, and found out that these countries had given priority to higher education systems on engineering training, and also on indigenous research efforts (Nelson, 2007). Fagerberg and Verspagen (2007) conducted a cluster analysis to analyze the growth performance of selected countries for the period 1960-2000. They show that the ability of a low income country to catch up, or otherwise to fall behind, depends to a large extent on its ability to develop its own innovation system. Their study also calls into doubt the effectiveness of catch up strategies that are based solely on imitating or replicating the technologies of advanced countries, that is, it proposes innovation rather than diffusion. There are also other studies that have been carried out on the prerequisites for catch up. However, most of these studies suffer from a number of limitations, one of which is that they have not been organized in a systematic way (Nelson, 2007). Also, most of these studies were carried out on only a small sample of countries, focusing on already developed economies or relatively advanced Newly Industrialised Countries. For this reason, it may not be wise to draw conclusions from them (Fagerberg and Verspagen, 2007).
5.0 Methodology and key questions 5.1 The key questions/hypotheses
i. The ownership hypothesis: “Is the breadth and depth of local sourcing a function of ownership?”
ii. The Infrastructure hypothesis: “Is the breadth and depth of local sourcing a function of the extent and quality of infrastructure?”
iii. The NSI hypothesis: “Is the breadth and depth of local sourcing a function of the extent and quality of the NSI?”

27
iv. The Skill hypothesis: “Is the breadth and depth of local sourcing a function of the extent and quality of the skills?”
v. The Regional factors hypothesis: “Is the breadth and depth of local sourcing a function of the extent and quality of regional factors?”
vi. The Policy hypothesis: “Is the breadth and depth of local sourcing a function of policy design and implementation?”
vii. Other hypothesis: “What other factors influence the breadth and depth of local sourcing?”
5.2 Scope of the study: the aspect of the value chain covered An elaborate study that was done on the oil and gas sector in Nigeria revealed that local capabilities in terms of technological capability and employment potential exist in some areas with beneficial Linkages (Heum, et al, 2003). These areas include;
Fabrication and construction; Well construction and completion; Modification, maintenance and operations; Transportation; Control system and ICT; Design and engineering; and Consultancy.
Based on the foregoing, and given the time and financial constraints this study examines the nature and extent of linkages and factors influencing linkages in the oil and gas sector with particular focus on three of the above identified activities;
Fabrication and construction; well construction and completion; and Control system and ICT.
5.3 Sources of data There are mainly two sources of data used in this study. The first set of data was extracted from secondary sources (past works and documents) that are related to the current research. This source provided initial information about some important issues relating to the oil and gas industry as discussed in the foregoing sections. The second set of data was gathered through primary sources (survey data-interviews and discussions). To understand the current situations in the Nigerian oil and gas sector, especially as it relates to commodity linkage, some oil firms and their local suppliers were surveyed. The following sub-sections provide some notes on how the survey was planned and conducted; and how the data was analysed.
5.4 Research design The study adopts the cross-sectional type of research design as series of information were elicited from selected respondents at a point in time. This provided an opportunity of describing the prevalent situation in the Nigerian oil and gas sector.

28
5.5 Population of study The survey set out to obtain information from two different populations. On the one hand, the first population comprised all oil firms operating in Nigeria and following from earlier studies, internet search of relevant sites and documents, information obtained from the NNPC and key informants, the population of this group was put at 452, and their headquarters are located in Lagos. On the other hand, the second population consists of all the local oil and gas industry suppliers clustered around the two oil cities of Port Harcourt and Warri. These cities were chosen since they were the major centres where oil prospecting, exploration, production and refining occur and local serving firms have been noted to concentrate in these cities just as the oil and gas companies. Similarly, following from earlier studies (such as Heum, 2003), information from trade associations, internet search of relevant sites and documents, information obtained from the NNPC and key informants, the population of the study was put at 230 firms as given in table 3 below.
Table 3: Population of oil firms suppliers in the two major cities Sector Port Harcourt Warri Total
Control System and ICT Fabrication and Construction Well Construction and Completion Other Total
40 65 50 10 170
10 25 20 5 60
50 95 70 15 230
Source :MMCP/ Field survey, 2010. Some other institutions were also contacted in the course of the study. These include the relevant federal and state ministries, chamber of commerce and industry, Niger-Delta Development Commission (NDDC), Petroleum Trust Development Fund (PTDF), Petroleum Training Institute (PTI), University of Port Harcourt, Polytechnics and Technical colleges, Welders‟ associations and Nigerian Institute of Welders (NIW).
5.6 Sample and sampling technique The sample size drawn from the oil firms was 15, representing one third of the number of oil firms in the industry. In the case of the local serving firms, 115 firms were drawn, representing 50% of that population. The sampling technique used to identify would-be oil firm respondents was purposive because of the need to select those in which we have key informants so that the tendency of rejection can be minimised. A multi-stage sampling technique was used in the case of oil firms‟ suppliers. In the first instance, the population was stratified into two, basically, Port Harcourt and Warri. Each of the cities was further stratified into ward areas (locations) and using the raffle variant of simple random sampling, 50% of the serving firms were selected in each ward (locations).
5.7 The research instrument Both structured questionnaires and in-depth interviews were used to collect the
2 both foreign and indigenous firms-medium and large

29
required information from the respondents. There are two sets of questionnaires; oil firms‟ questionnaire and oil firms‟ suppliers‟ questionnaires. Each of these questionnaires was sub-divided into different sections with each section attempting to elicit relevant information addressing each of the objectives. Closed-end questions were mainly used, however, in order not to lose relevant information; few lines were provided for brief explanations on some chosen options. The in-depth interviews were conducted with some key informants and directors of institutions so as to obtain more information and documents.
5.8 Validity and reliability of instrument To ensure the validity of the instrument, the face validity criterion was used. A group of researchers, both within and outside the departments of Economics and petroleum engineering of the University of Ibadan, carefully looked at every item on the instrument. This was done so as to ascertain the relevance and sufficiency of each query within itself as well as in relation to other queries. The reliability procedure is test-retest method, 20 suppliers‟ questionnaires were administered twice on the same respondents with some weeks interval, and responses between the two sets were compared both descriptively and with correlation analysis. Following both the validity and reliability tests, difficult question were either removed or re-phrased.
5.9 Administration of research instrument The instruments were administered to the representative of each firm (the owner(s) or top level officers or somebody very close to the owner). Field assistants (Masters and Ph.D students who have key informants and contacts) were hired and trained to help in the distribution and collection of the questionnaires. They were supervised by the study‟s principal investigators who also conducted the in-depth interviews. Out of the 115 questionnaires distributed to suppliers, 86 questionnaires (i.e. 75%) were filled and retrieved (see table 4) and 6 out of these were excluded from the final analysis due to one error or the other. Out of the 15 questionnaires administered to oil firms, 12 (representing 80%) were retrieved and analysed.
Table 4: Administered (Retrieved) Questionnaires of the Oil Firms Suppliers
Sector Port Harcourt Warri Total
Control system and ICT Fabrication and construction Well construction and completion Other Total
20(15) 32(20) 28(26) 05(03) 85(64)
05(04) 12(07) 10(09) 03(02) 30(22)
25(19) 44(27) 38(35) 08(05) 115(86)
Source: MMCP Field Survey, 2010
5.10. Field experience The following experience is worth mentioning:
1. The study area is known for militancy activities, hence, care was exercised during the interview and field officers were instructed to improvise in situations of unwillingness to respond and/or any slightest sign of violence.
2. Due to oil activities and the presence of multinationals, cost of living is quite high in these two cities, and this limit the length of stay

30
3. Information pertaining to oil and gas are usually released with care, thus, we have to employ the services of some former workers or those with some links with current workers in the oil and servicing firms to obtain some reasonable information
5.11. Methods of data analysis These involve various descriptive and analytical statistics employed in the study. The core sourcing/linkage variables and their drivers are discussed through the use of descriptive statistics, mainly in the form of frequency distributions, simple percentages, averages and charts. Furthermore, in the empirical analysis on the drivers of linkage, the multiple regression technique is used. The procedures for the regression estimation are discussed in the subsequent sub-section.
5.11.1. Model specification and variables definition The following five linkage measures are considered in the present study; the share of inputs that the suppliers sourced locally (inputs), whether the suppliers are involved in information exchange with the oil firms (inform), whether the suppliers are involved in negotiation of payment and delivery with the oil firms (negotiat), whether they get technical upgrading from the oil firms (technic) and whether they get labour training from the oil firms (labour). Each of these five linkage measures is made dependent on the following drivers; ownership (own), infrastructure (inf), NSI/skills (nsi), regional (reg), policy (pol) and others (oth). Hence, equations (1)–(5) below are specified;
1
,
1
,
1
,
1
,
1
inf,
1
,0 inf
k
iiothk
k
ipolk
k
iregk
k
insik
k
ik
k
iownki othpolregnsiowninputs (1)
1
,
1
,
1
,
1
,
1
inf,
1
,0 infinf
k
iiothk
k
ipolk
k
iregk
k
insik
k
ik
k
iownki othpolregnsiownorm (2)
1
,
1
,
1
,
1
,
1
inf,
1
,0 inf
k
iiothk
k
ipolk
k
iregk
k
insik
k
ik
k
iownki othpolregnsiownnegotiat (3)
1
,
1
,
1
,
1
,
1
inf,
1
,0 inf
k
iiothk
k
ipolk
k
iregk
k
insik
k
ik
k
iownki othpolregnsiowntechnic (4)
1
,
1
,
1
,
1
,
1
inf,
1
,0 inf
k
iiothk
k
ipolk
k
iregk
k
insik
k
ik
k
iownki othpolregnsiownlabour (5)
Where i = The subscript represents each of the service firms.
α,,,, = Parameter estimates
1k
= Group operator ranging between 1 and ρ. This shows that the variables
under each of the drivers are more than one. For instance, ρ = 5 under infrastructure (inf) drivers, since five infrastructural facilities are considered.
= error terms

31
Further, i. Dependent Variables
inputs = The actual value given by the suppliers as the share of their inputs that
they source locally; measured in percentage. inform = The extent of suppliers‟ engagement in information exchange with the
oil firms; not at all is scored 1, sometimes is scored 2 and constantly is scored 3.
negotiat = The extent of suppliers‟ engagement in negotiation of payment and delivery conditions with the oil firms; not at all is scored 1, sometimes is scored 2 and constantly is scored 3.
technic = The extent of suppliers‟ engagement in technical upgrading with the oil firms; not at all is scored 1, sometimes is scored 2 and constantly is scored 3.
labour = The extent of suppliers‟ engagement in labour training with the oil firms; not at all is scored 1, sometimes is scored 2 and constantly is scored 3.
ii. Driving Variables
own = The ownership drivers comprise information about the type of servicing
firm, foreign ownership and whether a firm is quoted; (a) Control System & ICT sector: A dummy variable that takes the value
of unity when a firm is in the Control System & ICT sector and zero otherwise
(b) Fabrication & Construction sector: A dummy variable that takes the value of unity when a firm is in the Fabrication & Construction sector and zero otherwise. Since there are three major sectors, the Well Construction & Completion therefore becomes the reference sector.
(c) Multinational firm: A dummy variable that takes the value of unity when a firm is a multinational firm and zero otherwise
(d) Listed firm: A dummy variable that takes the value of unity when a firm is listed in the stock exchange and zero otherwise
inf = The infrastructure drivers comprise information about the following five
facilities; (a) Public power: The degree of adequacy of the public power supply;
very inadequate is scored 1, inadequate is scored 2, can‟t say is scored 3, adequate is scored 4 and very adequate is scored 5.
(b) Water supply: The degree of adequacy of water supply; very inadequate is scored 1, inadequate is scored 2, can‟t say is scored 3, adequate is scored 4 and very adequate is scored 5.
(c) Telephone services: The degree of adequacy of telephone services; very inadequate is scored 1, inadequate is scored 2, can‟t say is scored 3, adequate is scored 4 and very adequate is scored 5.
(d) Internet services: The degree of adequacy of the internet services; very inadequate is scored 1, inadequate is scored 2, can‟t say is scored 3, adequate is scored 4 and very adequate is scored 5.
(e) Transportation facilities: The degree of adequacy of the transportation facilities; very inadequate is scored 1, inadequate is

32
scored 2, can‟t say is scored 3, adequate is scored 4 and very adequate is scored 5.
nsi = The NSI/Skills drivers comprise information about the following;
(a) Technical agreements with foreign firms: A dummy variable that takes the value of unity when a firm has technical agreements with foreign firms and zero otherwise
(b) Relationship with local research centres/universities: A dummy variable that takes the value of unity when a firm has relationships with local research centres/universities and zero otherwise
(c) Skilled labour availability: A dummy variable that takes the value of unity when a firm has access to skilled labour and zero otherwise
(d) Employed skilled labour trained abroad: A dummy variable that takes the value of unity when a firm has employed skilled labour trained abroad and zero otherwise
(e) Employed personnel previously working in oil sector: A dummy variable that takes the value of unity when a firm has employed personnel that were previously working in the oil sector and zero otherwise
reg = The regional drivers comprise information about the following;
(a) Working for oil companies in neighbouring W/A countries: A dummy variable that takes the value of unity when a firm has worked for oil companies in neighbouring W/A countries and zero otherwise
(f) Losing staff to firms in neighbouring W/A countries: A dummy variable that takes the value of unity when a firm has lost staff to firms in neighbouring W/A countries and zero otherwise
pol = The policy drivers comprise information about the following;
(a) Local content policy: A dummy variable that takes the value of unity when a firm has used the provisions of the local content policy and zero otherwise
(b) Ownership regulations: The consistency of government‟s ownership regulations; inconsistent is scored 1, don‟t know is scored 2 and consistent is scored 3.
(c) Labour market regulations: The consistency of government‟s labour market regulations; inconsistent is scored 1, don‟t know is scored 2 and consistent is scored 3.
(d) Tax policy: The consistency of government‟s tax policy; inconsistent is scored 1, don‟t know is scored 2 and consistent is scored 3.
(e) Licensing regulations: The consistency of government‟s licensing regulations; inconsistent is scored 1, don‟t know is scored 2 and consistent is scored 3.
(f) Tariff regulations: The consistency of government‟s tariff regulations; inconsistent is scored, don‟t know is scored 2 and consistent is scored 3.
(g) Business registration: The consistency of business registration; inconsistent is scored 1, don‟t know is scored 2 and consistent is scored 3.

33
oth = Other drivers considered are; (a) Access to finance: A dummy variable that takes the value of unity
when a firm is liquidity constrained and zero otherwise (b) Raw materials constraint: Summation of scores from a 5-point Likert
scale on the degree at which six raw materials constraints are experienced.
(c) Innovation due to competition: Number of innovations undertaken (out of 8) in the past 5 years to face completion.
5.11.2. Treatment of interaction drivers One of the goals of this study is to establish if certain drivers can interact with each other to influence linkage between the oil firms and the servicing firms. However, given the large number of drivers considered above, inclusion of interaction variables will definitely pose some degree of freedom and multicollinearity problems. To address this problem, this study proceeds in four steps. In the first step, bivariate correlations are estimated between each pair of the drivers and only the significant pairs are selected; in the second step, interaction variables are created from the drivers in each of the significant pair; in the third step, an interaction variable is retained if it significantly correlated with at least two of the five dependent variables. Lastly, all the retained interaction variables and the individual drivers are used as explanatory variables to each of the five dependent variables. To eliminate redundant variables, thereby solving the degree of freedom and multicollinearity problem, the stepwise regression procedure is used. In other words, equations (1)–(5) are re-estimated to include the relevant interaction drivers. Therefore, in the stepwise output, only the relevant drivers (and interaction drivers) are retained. Finally, to enable easy comparison of parameters, the standardised beta coefficients are also provided.
6.0 Preliminary analysis of oil sector linkages in Nigeria 6.1 General issues
This section presents survey results on value chain and degree of local sourcing of inputs in the oil sector. It also presents information on ownership characteristics of oil firms and the servicing firms, and the linkages factors.
6.2 The supply/value chain and local sourcing in the oil and gas
industry 6.2.1. The supply/value chain in the Nigerian oil and gas industry The supply chain links from the suppliers of inputs (second-tier suppliers) to oil servicing firms (first-tier suppliers) and finally to the big oil firms, which is the scope of this study (see figure 4 below). Appendix C shows the major inputs of the oil suppliers as well as those who supply these inputs (mainly local firms), while appendix D lists the various products of each of the sectors of oil firms‟ suppliers in

34
Nigeria.
6.2.2. Local sourcing and linkage factors in the Nigerian oil and gas
industry The responses on the nature and extent of the linkages among the three participants depicted in figure 5 are presented in this section. i. Responses of Oil Servicing Firms on Local Sourcing and Linkage Factors Table 5 shows the proportion of local contents in the activities of oil servicing firms3. Local content is relatively higher in the fabrication and construction sub-sector and in the well-construction and completion sub-sector as 45.5% and 41.1% of respondent from these two sectors respectively source more than 75% of their inputs locally. In total, about 55% of supplying firms claim that their outputs contain over 50% local contents.
Table 5: Responses of Oil suppliers on the local contents in their outputs Sector 0-25% 26-50% 51 -75% 76 -1000% Total
control system & ICT 6 (31.6) 4 (21.1) 4 (21.1) 5 (26.3) 19 (100)
fabrication & construction 3 (13.6) 5 (22.7) 4 (18.2) 10 (45.5) 22 (100)
well construction & completion 7 (20.6) 7 (20.6) 6 (17.6) 14 (41.1) 34 (100)
Others 2 (40) 2 (40) 1 (20) - 5 (100)
Total 18 (22.5) 18 (22.5) 15 (18.8) 29 (36.3) 80 (100)
Note: Percent within sector in parentheses; Source: MMCP Field Survey, 2010 The above discussion on local sourcing is augmented by responses on the forms and extent of linkages between the oil servicing firms and their own suppliers on the one hand, and between the oil servicing firms and the oil firms on the other hand.
3 presented in Appendix C

35
Figure 4: Value chain of focus: oil firms and their suppliers Table 6 indicates that the linkage between the servicing firms (first-tier suppliers) and their own input suppliers (second-tier suppliers) is weak, as majority of them (46.3%) are hardly linked to their own suppliers in the seven aspects depicted. When such linkages are scored on a scale of 3 (i.e. not at all is scored 1, sometimes is scored 2 and constantly is scored 3), the average scores for most of the nine aspects are lower than the midpoint of 2, although information exchange linkage is relatively higher than others (see figure 5)
OIL FIRMS
exploration
production
SERVICING FIRMS (FIRST-TIER SUPPLIERS)
Fabrication and Construction Pressure vessels fabrication
Fasteners (NUTS AND BOLTS)
Valves
Heat exchangers
Compression packages
Pump assemblies
Loading arms
Pipe coating and threading
etc
Well Construction and Completion Provision of well head
laying of flow line and pipeline
Perforation of well
Construction of well jacket
etc
Control System and ICT Remote monitoring of well head & flow line
Electronic metering
Well surveillance
Wireless meter transfer
Remote control of safety valves
Intelligent well system
Permanent down hold monitoring
etc
SUPPLIERS OF INPUTS TO OIL SUPPLIERS
(SECOND-TIER SUPPLIERS)

36
Table 6: Suppliers' response on their linkage with their own input suppliers Area of Linkage Not at all Sometimes Constantly Total Mean
1 Information Exchange 37 (46.3) 17 (21.3) 26 (32.5) 80 (100) 1.86
2 Joint Orders 56 (70) 18 (22.5) 6 (7.5) 80 (100) 1.38
3 Joint Product Development 57 (71.3) 16 (20) 7 (8.8) 80 (100) 1.38
4 Machinery Lending 50 (62.5) 26 (32.5) 4 (5) 80 (100) 1.43
5 Joint Sale 64 (80) 13 (16.3) 3 (3.8) 80 (100) 1.24
6 Joint Training 55 (68.8) 20 (25) 5 (6.3) 80 (100) 1.38
7 Joint Purchase 59 (73.8) 17 (21.3) 4 (5) 80 (100) 1.31
Note: Percent within area of linkage in parentheses; to obtain the mean scores, not at all is scored 1, sometimes is scored 2 and constantly is scored 3
Source: MMCP Field Survey, 2010
Figure 5: Servicing firms’ linkage with their own suppliers Note: to obtain the mean scores, not at all is scored 1, sometimes is scored 2 and constantly
is scored 3
Considering how the servicing firms view the cooperation of the oil firms in achieving certain linkages with them, Table 2 shows that majority of the local serving firms are not of the opinion that the oil firms are at all linked with them in almost all the identified eleven channels of linkage. Although slight exceptions can be found in the case of negotiation of payment and delivery conditions, information exchange and actions to improve delivery time and reliability and cooperation in developing quality assurance system, the fact that the mean rating for most firms falls below midpoint shows that linkage is below average. The two highest linkage indicators, negotiation and information exchange, are ordinarily expected, one would have preferred a broader and deeper linkage in joint product development, changes in suppliers less than before, technical upgrading and labour trainings, but unfortunately, these are rated low. (See figure 6).

37
Table 7: Suppliers’ responses on their linkage with oil firms
Area of Linkage Not at all Sometimes Constantly Total Mean
1 information exchange 32 (40) 22 (27.5) 26 (32.5) 80 (100) 1.93
2 negotiation of payment and delivery conditions 31 (38.8) 17 (21.3) 32 (40) 80 (100) 2.01
3 joint product development 56 (70) 17 (21.3) 7 (8.8) 80 (100) 1.39
4 increase in cooperation for product quality improvement 37 (46.3) 23 (28.8) 20 (25) 80 (100) 1.79
5 actions to improve delivery time 35 (43.8) 26 (32.5) 19 (23.8) 80 (100) 1.80
6 actions to improve delivery reliability 34 (42.5) 26 (32.5) 20 (25) 80 (100) 1.83
7 actions for adapting production to smaller/larger batches 43 (53.8) 28 (35) 9 (11.3) 80 (100) 1.58
8 changes suppliers less than before 52 (65) 20 (25) 8 (10) 80 (100) 1.45
9 increase in cooperation in technical upgrading 38 (47.5) 22 (27.5) 20 (25) 80 (100) 1.78
10 increase in cooperation in labour training 40 (50) 21 (26.3) 19 (23.8) 80 (100) 1.74
11 increase in cooperation in developing quality assurance system 37 (46.3) 21 (26.3) 22 (27.5) 80 (100) 1.81
Note: Percent within area of linkage in parentheses; Note: to obtain the mean scores, not at all is scored 1, sometimes is scored 2 and constantly is scored 3
Source: MMCP Field Survey, 2010
Figure 6: Suppliers’ linkage with oil firms Note: to obtain the mean scores, not at all is scored 1, sometimes is scored 2 and constantly
is scored 3
Moreover, when asked if the suppliers think the oil firms are promoting the emergence and development of local firms, figure 7 shows that only 22 (27.5%) of the respondents agree to such statement, the remaining 58 (72.5%) disagree.
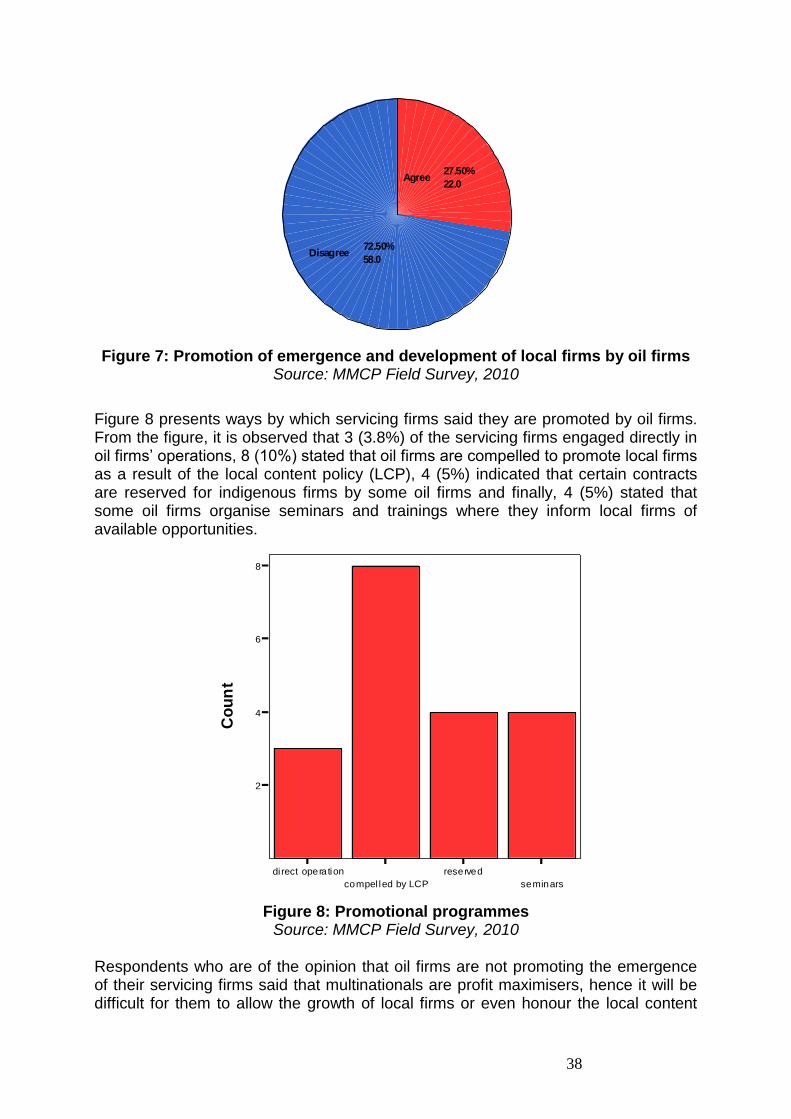
38
Agree
Disagree
Effect of competition
Agree27.50%
22.0
Disagree72.50%
58.0
Figure 7: Promotion of emergence and development of local firms by oil firms
Source: MMCP Field Survey, 2010
Figure 8 presents ways by which servicing firms said they are promoted by oil firms. From the figure, it is observed that 3 (3.8%) of the servicing firms engaged directly in oil firms‟ operations, 8 (10%) stated that oil firms are compelled to promote local firms as a result of the local content policy (LCP), 4 (5%) indicated that certain contracts are reserved for indigenous firms by some oil firms and finally, 4 (5%) stated that some oil firms organise seminars and trainings where they inform local firms of available opportunities.
Bars show counts
di rect operation
compel led by LCP
reserved
seminars
Effect of competition
2
4
6
8
Co
un
t
Figure 8: Promotional programmes Source: MMCP Field Survey, 2010
Respondents who are of the opinion that oil firms are not promoting the emergence of their servicing firms said that multinationals are profit maximisers, hence it will be difficult for them to allow the growth of local firms or even honour the local content

39
policy. They further revealed that major contracts are awarded abroad and that standards are unnecessarily raised so that indigenous firms cannot bid successfully.
iii. Responses of Oil Firms on Local Sourcing and Linkage Factors iv.
Analysis of the oil firms‟ responses on the local contents in their output and how they view their linkages with the servicing firms are provided in this sub-section. According to table 8, the headquarters of these firms are the ones responsible for supply management, also for the majority (83.3%) of these firms; the decisions related to consumable are also taken at the headquarters. On the share of local procurement of goods sourced from local firms, it is shown that 3(25%) of the firms use up to 50% local goods, 5(41.7%) use 51%-75% while the remaining 4(33.3%) use above 75%. The share of local services done by local firms is above 50% for the majority (75%) of the firms, while the share of final product purchased by local business are up to 25% for 41.7% of the oil firms, 26%-50% for 33.3% of the firms and more than 50% for 25% of the firms. It should be recalled from table 5 that the outputs of 55% of supplying firms contain over 50% local contents. Contrasting this with the oil firms‟ response that 75% of them source more than 50% of their goods and service inputs from local firms, and by simple probability, it can be inferred that only about 41% of oil firms are actually using more than 50% local inputs.
Table 8: Responses of Oil firms on the Local Contents in their Activities Frequency Percentage
1.who is in charge of supply management Local office Head office Total
-- 12 12
-
100 100
2. Are decisions related to consumables taken at HQ as well? Yes No Total
10 2 12
83.3 16.7 100
3. Input share in the value of final product Up to 50% Above 50% Not indicated Total
4 4 4 12
33.3 33.3 33.3 100
4. Share of local procurement of goods purchased from local firms Up to 50% 51%-75% Above 75% Total
3 5 4 12
25
41.7 33.3 100
5. Share of local service done by local firms Up to 50% Above 50% Total
3 9 12
25 75
100
6.Share of final product purchase by local business Up to 25% 26%-50% Above 50% Total
5 4 3 12
41.7 33.3 25
100
Source: MMCP Field Survey, 2010 Table 9 presents the oil firms‟ responses on their linkages with their servicing firms, and it is shown that joint product development is the least area of linkage, while negotiations of payment and delivery conditions are the highest area of linkage. A comparison between these responses and those offered by the oil servicing firms in the preceding sub-section on the same issues is given in figure 9.

40
Table 9: Oil firms’ Response on their linkage with their Suppliers
Not at all Sometimes Constantly Total Mean
1 information exchange - 8 (66.7) 4 (33.3) 12 (100) 2.33
2 negotiation of payment and delivery conditions - 5 (41.7) 7 (58.3) 12 (100) 2.58
3 joint product development 6 (50) 4 (33.3) 2 (16.7) 12 (100) 1.67
4 increase in cooperation for product quality improvement 3 (25) 6 (50) 3 (25) 12 (100) 2.00
5 actions to improve delivery time 8 (66.7) 4 (33.3) 12 (100) 2.33
6 actions to improve delivery reliability - 8 (66.7) 4 (33.3) 12 (100) 2.33
7 actions for adapting production to smaller/larger batches 1 (8.3) 11 (91.7) - 12 (100) 1.91
8 changes suppliers less than before 2 (16.7) 10 (83.3) - 12 (100) 1.83
9 increase in cooperation in technical upgrading 4 (33.3) 6 (50) 2 (16.7) 12 (100) 1.83
10 increase in cooperation in labour training 4 (33.3) 4 (33.3) 4 (33.3) 12 (100) 2.00
11 increase in cooperation in developing quality assurance system 4 (33.3) 6 (50) 2 (16.7) 12 (100) 1.83
Note: Percent within area of linkage in parentheses; Note: to obtain the mean scores, not at all is scored 1, sometimes is scored 2 and constantly is scored 3
Source: MMCP Field Survey, 2010 Two issues are notable from the figure. First, on the extent of the linkage between oil firms and their local servicing firms; oil firms tend to rate their linkage with their servicing firms higher than the way the servicing firms rate the same linkage. Second, on the pattern of the linkage; one observes some level consistency as linkages on joint product development, cooperation for product quality and technical upgrading are rated low by both groups of respondents. However, linkages on information exchange, negotiation for payment and actions on deliveries are rated relatively higher by both groups.
Figure 9: Linkage between servicing firms and oil firms
Note: to obtain the mean scores, not at all is scored 1, sometimes is scored 2 and constantly is scored 3
Other issues of linkage are considered in Table 10. The table shows that 9 (75%) of the oil firms indicated that they provide assistance to suppliers in meeting up with standards and the same 75% also indicate that they have supply development strategies for local firm. Further, almost all firms (91.7%) claim to keep relationship with firms that provide input to their suppliers. This finding however, is at variance with earlier view of the servicing firms that oil firms are not doing enough to encourage local firms‟ development.

41
Table 10: Responses of oil firms on how they aid standard and suppliers development
Frequency Percentage
1.Provide assistance to suppliers in meeting up with standards Yes No Total
9 3 12
75 25 100
2. Have a strategy for supply development for local business Yes No Total
9 3 12
75 25 100
3.Participate in IFC suppliers development programme Yes No Total
1 11 12
8.3 91.7 100
4.Keep relationship with firms that provide input to suppliers Yes No Total
1 11 12
8.3 91.7 100
Source: MMCP Field Survey, 2010
7.0 Empirical analysis/findings: linkage drivers This section presents the discussions of the responses on the linkage drivers from the survey
7.1. Ownership and other firms’ characteristics i. Ownership and other Characteristics of Oil Servicing Firms Table 11 gives some features of the Nigerian oil and gas servicing firms. Panel 1 of the table shows that 63 (78.8%) of them are owned by nationals, 12 (15%) by multinationals and 5 (6.3%) are jointly owned by nationals and foreigners. This denotes high presence of local firms in the servicing of the oil and gas sector. Further, it is observed that 21.1% of firms in the control system and ICT sub-sector are multinationals, which is higher than the percentage of multinationals found in the other sectors. Conversely, fabrication sub-sector has the highest local presence. Panel 2 shows two major periods of registration namely, 1981-1990 and 2001 till date. In panel 3, it is shown that very few (16.3%) of domestic suppliers are listed, and the last panel shows that almost all the major owners possess university degrees.

42
Table 11: Some Suppliers Firms Characteristics
S/N Characteristics
control system & ICT
fabrication & construction
well construction & completion other sector total
1.
Ownership Status nationals only multinational joint ventures total
- 16 (84.2) 4 (21.1) - 19 (100)
- 19 (86.4) 2 (9.1) 1 (4.5) 22 (100)
- 20 (70.6) 6 (17.6) 4 (11.8) 34 (100)
- 5 (100) - - 5 (100)
- 63 (78.8) 12 (15) 5 (6.3) 80 (100)
2.
Year Of Registration 1970 - 1980 1981 - 1990 1991 - 2000 2001 till date not indicated total
- 4 (21.1) 3 (15.8) 7 (36.8) 5 (26.3) 19 (100)
1 (4.5) 7 (31.8) 4 (18.2) 4 (18.2) 6 (27.3) 22 (100)
6 (17.6) 5 (14.7) 3 (8.8) 9 (26.5) 11 (32.4) 34 (100)
- 2 (40) 1 (20) 1 (20) 1 (20) 5 (100)
07 (8.80) 18 (22.5) 11 (13.8) 21 (26.3) 23 (28.8) 80 (100)
3.
Is the Company Listed yes no total
- 4 (21.1) 15 (78.9) 19 (100)
- 3 (13.6) 19 (86.4) 22 (100)
- 6 (17.6) 28 (82.4) 34 (100)
- - 5 (100) 5 (100)
- 13 (16.3) 67 (83.8) 80 (100)
4.
Educational Status of Major Owner none secondary ("O" and "A" levels) diploma degrees total
- - 3 (15.8) 16 (84.2) 19 (100)
- 2 (9.1) 2 (9.1) 18 (81.8) 22 (100)
- - 2 (5.9) 32 (94.1) 34 (100)
- - - 5 (100) 5 (100)
- 2 (2.5) 7 (8.75) 71 (88.8) 80 (100)
Note: percent with sector in parenthesis Source: MMCP Field Survey, 2010 ii. Ownership and other Characteristics of Oil Firms Table 12 shows some characteristics of oil firms. The form of ownership is such that the multinationals dominate (58.3%) the oil and gas industry while 16.7% of the oil firms are national firms and 25% are jointly owned by foreigners and nationals furthermore, most (75%) of the firms were registered prior to 1970, though only 1(8.3%) of them indicated that it is listed. Finally, all the owners possess university degrees.
Table 12: Oil firms’ characteristics s/n Characteristics Frequency Percentage
1
Ownership Status nationals only multinational states joint ventures total
2 7 -- 3 12
16.7 58.3 -- 25 100
2
Year Of Registration Up till 1970 1971 – till date Total
9 3 12
75 25 100
3
Is the Company Listed Yes no total
1 11 12
8.3 91.7 100
4
Educational Status of Major Owner none secondary ("O" and "A" levels) diploma degrees total
-- -- -- 12 12
-- -- -- 100 100
Source: MMCP Field Survey, 2010

43
The foregoing shows that the country experienced the presence of oil firms far earlier than the emergence of local suppliers, thereby suggesting the latter growth of local suppliers' activities. It is also observed that the suppliers' industry is national-dominated while oil firms are multinational-dominated. According to the Oil firms, the basic criteria for contracts to be awarded to local firms are quality and environmental standards as well as local content policy.
7.2. Infrastructural adequacy i. Servicing Firms Responses on Infrastructural Adequacy The adequacy, or otherwise, of infrastructure in Nigeria is given in table 13. As evident from the table, except for public power supply/electricity, most respondents see infrastructure as adequate. The case of power is troubling as it is rated grossly inadequate.
Table 13: Infrastructure Performance Assessment by Oil firms’ suppliers
Very adequate Adequate Can‟t say Inadequate
Very inadequate
Total Mean
public power supply/electricity 1 (1.3) 4 (5) 8 (10) 33 (41.3) 34 (42.5) 80 (100) 1.81
water supply 8 (10) 32 (40) 7 (8.8) 15 (18.8) 18 (22.5) 80 (100) 2.96
telephone and communication 8 (10) 46 (57.5) 7 (8.8) 11 (13.8) 8 (10) 80 (100) 3.44
internet services 7 (8.8) 44 (55) 5 (6.3) 17 (21.3) 7 (8.8) 80 (100) 3.34
Transportation 7 (8.8) 37 (46.3) 9 (11.3) 20 (25) 7 (8.8) 80 (100) 3.21
Note: percent of total in parentheses; to obtain the mean scores, very inadequate is scored 1, inadequate is scored 2 can’t say is scored 3, adequate is
scored 4 and very adequate is scored 5. Source: MMCP Field Survey, 2010
Table 14 further presents suppliers‟ responses on the recent trend in the Nigerian infrastructural and utility services. The table shows that the conditions of public power and water supplies are deteriorating while those of the telephone/communication, internet services and transportation are improving. One may therefore conclude from the two tables that the recent improvement in the Nigerian infrastructural facilities like telecommunication, internet and transportation is definitely aiding the operations of oil servicing firms. However, the deteriorating nature of the nation‟s public power and water supplies create problems in the production activities of the servicing firms. Table 14: Responses of oil suppliers on the recent trends of infrastructural and
utility services
S/N Improved Constant Deteriorated Total Mean
1 public power supply/electricity 1 (1.3) 23 (28.8) 56 (70) 80 (100) 1.31
2 water supply 14 (17.5) 43 (53.8) 23 (28.8) 80 (100) 1.89
3 telephone and communication 53 (66.3) 20 (25) 17 (21.3) 80 (100) 2.70
4 internet services 52 (65) 17 (21.3) 11 (13.8) 80 (100) 2.51
5 Transportation 31 (38.8) 31 (38.8) 18 (22.5) 80 (100) 2.16
Note: percent of total in parentheses; to obtain the mean scores, deteriorated is scored 1, constant is scored 2 and improved is scored 3
Source: MMCP Field Survey, 2010

44
ii. Oil Firms Responses on Infrastructural Adequacy Also considered is how the big oil firms assess the country‟s level of infrastructure, and this is given in table 15 below. The table shows that transportation facility is the most adequate infrastructure, and as earlier found, the public power supply scores the least while the others are rated adequate.
Table 15: Infrastructure performance assessment by oil firms
Very adequate adequate Can‟t say Inadequate
Very inadequate Total Mean
public power supply/electricity 1 (8.3) 2 (16.7) - 7 (58.3) 2 (16.7) 12 (100) 2.42
water supply 2 (16.7) 7 (58.3) - 1 (8.3) 2 (16.7) 12 (100) 3.41
telephone and communication 2 (16.7) 9 (75) - - 1 (8.3) 12 (100) 3.92
internet services 2 (16.7) 4 (33.3) - 6 (50) - 12 (100) 3.17
Transportation 7 (58.3) 4 (33.3) 1 (8.3) - - 12 (100) 4.50
Note: percent of total in parentheses; to obtain the mean scores, very inadequate is scored 1, inadequate is scored 2, can’t say is scored 3, adequate is
scored 4 and very adequate is scored 5. Source: MMCP Field Survey, 2010
Figure 10 compares the responses of the oil firms and their servicing firms on the issue of infrastructural adequacy. It is observed from the figure that the oil firms perceive the different elements of infrastructure as adequate more than the way their servicing firms perceive them. This may be explained by the fact that the oil firms possess more resources with which they can privately provide these infrastructures for themselves.
Figure 10: Infrastructure performance Note: to obtain the mean scores, very inadequate is scored 1, inadequate is scored 2 can’t say is scored
3, adequate is scored 4 and very adequate is scored 5.

45
7.3. NSI/Skills factors i. NSI/Skills Factors in Oil Servicing Firms Table 16 below shows that 64(80%) of the oil servicing firms are affirmative that they can find adequate skilled labour. The process of finding this adequate skilled labour does not preclude employing skilled labour educated abroad as 25(31.3%) of the firm state that they do so. In fact, for a sector like control system and ICT with high claim (84.2%) that it can find adequate skilled labour, there is also a high occurrence (47.4%) of employing skilled labour trained abroad. Out of the 25 firm who have employed skilled labour trained abroad, 9(36%) have a maximum of 10% non Nigerian skilled labour 11(44%) have 11%-20%, while 5(20%) have more than 20% of their skilled staff as non Nigerian. In this structure, control system and ICT sector stands out as 77.8% of them have more than 10% of their staff as non Nigerian. Further inquiry into whether the education provided in Nigeria meets company requirement shows that 45(56.3%) of the firm think so; a position supported least by control system and ICT (47.4%), but supported most by the fabrication and construction sector(68.2%). The table also shows that 46 (57.5%) of the firms are aware of their ex-employees who developed expertise with the company and are now engaged in other sectors. Equally 55 (68.8%) have employed personnel‟s previously employed by the oil companies.
Table 16: Labour/Skill Information on Oil firm suppliers
control system & ICT
fabrication & construction
well construction & completion others Total
can find adequate skilled labour 16 (84.2) 18 (81.8) 25 (73.5) 5 (100) 64 (80)
have to employ skilled labour educated abroad 9 (47.4) 7 (31.8) 8 (23.5) 1 (20) 25 (31.3)
share of non Nigeria skilled labour up to 10% 11%-20% above 20% Total
2 (22.2) 5 (55.6) 2 (22.2) 9 (100)
3 (42.9) 1 (14.3) 3 (42.9) 7 (100)
4 (50) 4 (50) - 8 (100)
- 1 (100) - 1 (100)
9 (36) 11 (44) 5 (20) 25 (100)
educations/training provided in Nigeria meet company‟s requirement 9 (47.4) 15 (68.2) 18 (52.9) 3 (60) 45 (56.3)
aware of ex-employees who developed expertise with the company and are now engaged in other sectors 10 (52.6) 13 (59.1) 21 (61.8) 2 (40) 46 (57.5)
employing personnel who were previously employed by the oil companies 13 (68.4) 16 (72.7) 22 (64.7) 4 (80) 55 (68.8)
Note: percent within sector in parentheses Source: MMCP Field Survey, 2010 Further discussions on the servicing firms‟ access to new technology and the form of partnership they are involved in to access the new technology may be important for NSI and skilled labour. According to table 17 below, 61 (76.3%) of the firms have access to new technology. Out of the 80 firms, 38(47.5%) claim they have local innovation/technology agreements with foreign companies, 47(58.8%) possess agreements for upgrading and maintenance, while 27(33.8%) have relationship with local research centres or the university, which include the Petroleum Training Institute, Nigerian Institute of Welders and various universities, polytechnic and technical colleges in their areas.

46
Table 17: Technology Status of Suppliers
control system & ICT
fabrication & construction
well construction & completion others Total
1 access to new technology 15 (78.9) 18 (81.8) 23 (67.6) 5 (100) 61 (76.3)
2 local innovation/tech agreements with foreign companies 11 (57.9) 9 (40.9) 15 (44.1) 3 (60) 38 (47.5)
3 agreements for upgrading& maintenance 12 (63.2) 11 (50) 20 (58.8) 4 (80) 47 (58.8)
4 relationship with local research centres or the university 8 (42.1) 6 (27.3) 11 (32.4) 2 (40) 27 (33.8)
Note: percent within sector in parentheses Source: MMCP Field Survey, 2010
ii. NSI/Skills Factors in the Oil Firms The issue of skilled labour and NSI is equally important to the oil firms, and according to table 18 below, all the oil firms can find adequate skilled labour, however, a very high proportion of them (91.7%) have had situations where the skilled labour was educated abroad. Further, 8 (66.7%) of these firms are of the opinion that education in Nigeria meet their needs. Asking if they are aware of ex-employees now in other sectors, 11 (91.7%) of them confirmed this while 10 (83.3) stated that they have employed personnel previously employed by their suppliers.
Table 18: Labour/Skill Information on Oil firm Frequency Percentage
1Can find adequate skilled labour Yes No Total
12 - 12
100 - 100
2. Have to employs skilled labour educated abroad Yes No Total
12 - 12
100 - 100
3. Share of Non-Nigeria skilled labour Up to 10% 11-20% Above 25% Total
6 4 2 12
50 33.3 16.7 100
4.Education in Nigeria meet firms needs Yes No Total
8 3 12
66.7 33.3 100
5. Aware of ex-employers now in other sector Yes Now Total
11 1 12
91.7 8.3 100
6. Employ personnel previously employed by suppliers Yes No Total
10 2 12
83.3 16.7 100
Source: MMCP Field Survey, 2010
7.4. Spill over and Regional Factors This is measured by the frequency of service rendered to other sectors of the economy by the local serving firms as well as partnership with neighbouring West African countries. This is depicted in table 19 below which shows that 16 (20%) of the Nigerian oil and gas industry suppliers also serve other sectors of the economy. These sectors include:
(a) IT (b) Agro-allied (c) Construction industries (d) Manufacturing sector (e) Power sector (f) Military (g) Petro chemical (h) Solid minerals

47
Table 19: Spill over effect of oil firm supplier
Options
control system & ICT
fabrication & construction
well construction & completion others Total
serve other sectors of the economy 4 (21.1) 4 (18.2) 5 (14.7) 3 (60) 16 (20)
working for oil companies in neighbouring W/Africa countries 1 (5.3) 6 (27.3) 6 (17.6) - 13 (16.3)
partnering with counterparts in neighbouring W/African countries - 3 (13.6) 7 (20.6) - 10 (12.5)
losing trainees or masters in the company to firms in neighbouring W/African countries 4 (21.1) 6 (27.3) 6 (17.6) 1 (20) 17 (21.3)
association with activities in the oil sectors of neighbouring firms 6 (31.6) 1 (4.5) 13 (38.2) 2 (40) 32 (40)
Note: per cent within sector in parentheses Source: MMCP Field Survey, 2010 Exploring further the nature and extent of their service to other areas, the table shows that 13 (16.3%) firm work for oil companies in neighbouring West African countries, one of these is an ICT Company, and 6 are fabrication and construction and 6 also are well construction firms. Moreover, 10 (12.5%) of the firms partner with their counterparts in neighbouring West African countries; 17 (21.3%) lose trainees or masters in their companies to neighbouring West African countries. Finally, 32 (40%) of the firms have association with activities in the oil sector of neighbouring firms. Benefits of such association often include:
Technology transfer More customers Information exchange Marketing and product sales advertisement Lending and borrowing of tools Joint implementation projects
7.5. Policy issues i. Consistency of Government Regulations and its Effects Consistency in regulation engenders proper planning and willingness to take investment stakes, and take those with longer horizons. Table 20 presents the opinion of local oil firms‟ suppliers on the issue of Nigeria government regulation consistency. As it is shown in the table, the two major inconsistent regulations, according to the local serving firms, are taxes and import tariff policies.
Table 20: Consistency of government regulations
Regulations Consistent Don‟t know Inconsistent Total Mean
A ownership regulations 30 (37.5) 36 (45) 14 (17.5) 80 (100) 2.20
B labour market regulation 26 (32.5) 34 (42.5) 20 (25) 80 (100) 2.08
C taxes/tax holidays/duty rebates 21 (26.3) 29 (36.3) 30 (37.5) 80 (100) 1.89
D Licensing 27 (33.8) 33 (41.3) 20 (25) 80 (100) 2.09
E import tariff 15 (18.8) 31 (38.8) 34 (42.5) 80 (100) 1.76
F business registration and start up 26 (32.5) 37 (46.3) 17 (21.3) 80 (100) 2.11
Note: percent of total in parentheses; to obtain the mean scores, inconsistent is scored 1, don’t know is scored 2 and consistent is scored 3
Source: MMCP Field Survey, 2010

48
Table 21 below looks at the effects of regulations on organisations operation. It is shown that all the factors, except for ownership regulation and business registration, make operations of servicing firms more difficult in Nigeria, and import tariff shows as the greatest source of problem.
Table 21: Effects of regulations on organisations operations
Regulations
Made operations easier Unchanged
Made more difficult Total Mean
A ownership regulations 26 (32.5) 42 (52.5) 12 (15) 80 (100) 2.18
B labour market regulation 15 (18.8) 42 (52.5) 23 (28.8) 80 (100) 1.90
C taxes/tax holidays/duty rebates 13 (16.3) 44 (55) 23 (28.8) 80 (100) 1.88
D Licensing 17 (21.3) 43 (53.8) 20 (25) 80 (100) 1.96
E import tariff 1 (1.3) 37 (46.3) 42 (52.5) 80 (100) 1.49
F business registration and start up 21 (26.3) 45 (56.3) 14 (17.5) 80 (100) 2.09
Note: percent of total in parentheses; to obtain the mean scores, made more difficult is scored 1, unchanged is scored 2 and made operations easier is scored 3
Source: MMCP Field Survey, 2010
ii. Effects of some other Policy Measures This section considers policy measures like privatisation, the local content policy (LCP) and the IFC suppliers‟ programme. According to the responses, 40(50%) of the sampled firms were in operation prior to the privatisation period. The firms were asked to indicate how privatisation has affected them and these responses are given in table 22 below.
Table 22: Effect of Privatisation Options Frequency Percent
More firms/competition 8 20
No significant change 22 55
Favourable change 10 25
Total 40 100
Source: MMCP Field Survey, 2010 According to the table, most firms (55%) state that privatisation achieved little or nothing in changing the business environment. However 8(20%) state that privatisation has increased competition for the same number of jobs. Meanwhile, 10(25%) of the firms see privatisation as a blessing as they now have more jobs. This they claim occurs as a result of new research, retraining, expansion and development of new technology inevitable for them in the presence of stiff competition. Considering the LCP measure, 65(81.3%) of the firms indicate that they are aware of this policy. On whether it is easier to get contract from the oil firms under the LCP than before, table 23 shows that only 1(1.54%) firm out of the 65 says it is more difficult, 22(33.85%) firms are of the opinion that LCP has no effect due to politics, heavy importation and situations where major long term contracts are already allocated abroad. However, the remaining 42(64.62%) firms claim that it is easier to get contracts under LCP, being the majority; one may infer that LCP must have had some impacts.

49
Table 23: Effect of LCP on Oil Firms Suppliers. Effect Frequency Percentage
More difficult 1 1.54
No effect 22 33.85
Contract easier 42 64.62
Total 65 100
Source: MMCP Field Survey, 2010 Another important policy is the IFC suppliers‟ development programme. The level of awareness about this programme is low, as just 17(21.25%) of the firms are aware about this programme and none of them has ever benefited from the programme. (See figure 11 below)
Aware
Unaware
Awareness of IFC
Aware21.25%
17.0
Unaware78.75%
63.0
Figure 11: Suppliers’ Awareness Level of IFC’s Programme
Source: MMCP Field Survey, 2010
7.6. Other linkage drivers The three other linkage drivers considered in this section are competition, finance and raw materials availabilities.
7.6.1. Competition: effects and coping strategies The servicing firms were asked about how competition in the industry is affecting them; and out of the 48 firms that responded to this question, figure 12 below shows that 16 (33.3%) of them are of the opinion that competition affects them positively because it raises their search for fund and improved technology, which they use to improve on their service delivery. Further, 15 (31.3%) claim that competition has no affect on them, claiming that they are the best at what they do and no firm compete with them. Finally, 17 (35.4%) respondents stated that competition affect them negatively as they have to compete with more firms, especially with some larger firms and those desperate to get jobs at all costs.

50
positive
no effect
negative
Effect of competition
positive33.33%
16.0
no effect31.25%
15.0
negative35.42%
17.0
Figure 12: Effect of competition Source: MMCP Field Survey, 2010
Table 24 below gives the frequency of innovations undertaken by the servicing firms in the past 5 years so as to cope with competition. As shown in the table, the first three innovations are in the areas of improvement in quality of existing products/services, which is done by 51 (63.8%) of the firms, investments in new machineries is made by 46 (57.5%) of the firms while 53 (66.3%) carried out activities aiming at improving workers‟ skills. The last item in the table tries to verify if the firms are planning any of the above eight innovations in the future. The responses show that the responses of more than 70% of the participants in almost all the sectors are affirmative on this.
Table 24: Innovations undertaken in past 5 years to face competition
control system & ICT
fabrication & construction
well construction & completion others Total
1 improving quality of existing products/services 12 (63.2) 16 (72.7) 19 (55.9) 4 (80) 51 (63.75)
2 invested in new machineries 12 (63.2) 14 (63.6) 18 (52.9) 2 (40) 46(57.5)
3 improved workers skills 10 (52.6) 16 (72.7) 23 (67.6) 4 (80) 53(66.25)
4 reduced the time of product delivery 9 (47.4) 11 (50) 16 (47.1) 2 (40) 38(47.5)
5 introduced/improved a TQM system 6 (31.6) 10 (45.5) 11 (32.4) 4 (80) 31(38.75)
6 introduced new organisational/management techniques 8 (42.1) 8 (36.4) 8 (23.5) 1 (20) 25(31.25)
7 introducing new products 9 (47.4) 8 (36.4) 15 (44.1) 2 (40) 34(42.5)
8 undertaking new functions(production/design /marketing/servicing) 6 (31.6) 9 (40.9) 13 (38.2) 1 (20) 29(36.25)
planning any of the above 8 in the future 14 (73.7) 17 (77.3) 23 (67.6) 4 (80) 58(72.5)
Note: Percent within sector in parentheses Source: MMCP Field Survey, 2010
7.6.2. Access to finance This section presents the proportion of servicing firms having problems in accessing credit and some of their approaches in solving this. The frequency of liquidity problem over time is depicted in table 25 and it shows that fabrication and construction sector has the highest number of firms with liquidity problem, followed by well construction. The other sectors, like control system/ICT with higher multinational presence suffer less liquidity constraint. The last row of table 23 is depicted in figure 13 and it shows declining trend in the proportion of firms with liquidity problems over time.

51
Table 25: Frequency of liquidity problems by suppliers (2005-2009)
Sector 2005 2006 2007 2008 2009 Average %
control system & ICT 2 (10.5) 1 (5.3) 1 (5.3) - 1 (5.3) 5.28
Fabricant. & construction. 6 (27.3) 9 (40.9) 4 (18.2) 5 (22.7) 2 (9.1) 23.64
well construction & complication 4 (11.8) 4 (11.8) 3 (8.8) 5 (14.7) 6 (17.6) 12.94
Others - 1 (20) - 1 (20) - 8.00
Total 12 (15) 15 (18.8) 8 (10) 11 (13.8) 9 (11.3) 13.78
Note: percent within sector in parentheses Source: MMCP Field Survey, 2010
Dot/Lines show counts
2005.00 2006.00 2007.00 2008.00 2009.00
var00001
0
5
10
15
Co
un
t
Figure 13: Trend of Liquidity Problem Source: MMCP Field Survey, 2010
The manner in which servicing firms who have experienced liquidity problems at one time or the other solved the problem is presented in table 26. The table shows that they consider (in descending order) bank loans (15%) personal reserves (15%), bank overdraft (11.3%), suppliers‟ credit (11.3%) and advances from clients (10%) as solutions to their liquidity problems. The fabrication and construction sector is the only sector with the possibility of selling off its raw materials in situations of liquidity problems; and it should be recalled that this is the sector with the highest local presence.
Table 26: Solutions to liquidity problems
Options
control system & ICT
fabrication & construction
well construction & completion others total
sold off raw materials - 2 (9.1) - - 2 (2.5)
sold some equipment - 3 (13.6) 1 (2.9) 1 (20) 5 (6.3)
borrowed from bank (overdraft) 1 (5.3) 3 (13.6) 5 (14.7) - 9 (11.3)
borrowed from bank (loans) 2 (10.5) 5 (22.7) 4 (11.8) 1 (20) 12 (15)
used personal cash reserves 2 (10.5) 5 (22.7) 5 (14.7) - 12 (15)
borrowed informally (money lenders, contributions, etc) 1 (5.3) 2 (9.1) - - 3 (3.8)
took cash advances from clients 1 (5.3) 7 (31.8) - - 8 (10)
obtained suppliers credit - 7 (31.8) 1 (2.9) 1 (20) 9 (11.3)
Note: percent within sector in parentheses Source: MMCP Field Survey, 2010

52
7.6.3. Access to raw materials The respondents were asked to score the level of the problem posed by some six raw materials-related issues with 1 representing Not Affected and 5 representing Seriously Affected. The result of the mean scores is presented in table 27 below. Adopting 3-point as the mid-point, the mean scores depicted in the table for each of the six factors is greater than 3 point; therefore they all affect each sector‟s access to raw materials. Comparing the factors, limited/non-availability of information is the least problematic while high price of imported raw materials is the factor that most seriously affects access to raw materials. This is likely to be explained by the problem posed by inconsistent import tariff discussed earlier under the policy drivers.
Table 27: Factors affecting local suppliers’ access to raw materials
control system & ICT
fabrication & construction
well construction & completion others Total
non-availability of local raw materials 4.21 3.50 3.00 3.75 3.50
high price of local raw materials when available 3.36 3.37 3.18 3.75 3.32
non-availability of working capital to purchase raw materials 3.00 3.69 3.09 5.00 3.38
high prices of imported raw material when available 3.93 3.56 3.86 5.25 3.89
non-availability of working capital to purchase raw materials 3.43 3.27 3.18 5.75 3.45
limited/non-availability of information about raw materials 2.69 3.54 2.73 3.00 2.94
Source: MMCP Field Survey, 2010 7.6.4. Unstructured Responses on Drivers of Local Sourcing The interviewed suppliers were given open access to freely write about what they thought could drive local sourcing and the followings were mentioned;
1. Lack of competent skills and man power 2. Funds/credit facilities 3. No certification/registration/document requirement 4. Failure to follow due process 5. Lack of technology/facilities 6. Poor networking/management 7. Low quality/not meeting with high standard 8. Lack of marketing strategy 9. Bureaucratic procedure 10. High cost of doing business 11. Low professionalism 12. Lack of experience/no reference job 13. Obsolete tools 14. Appropriate pricing 15. Inability to compete with established firms.
Source: MMCP Field Survey, 2010
8.0. Regression analysis of the drivers of linkages This section presents the results of the regression analysis showing the influence of the MMCP drivers on the nature and extent of the linkage between oil firms and their

53
servicing firms. Five areas of linkage are considered and each is represented by one of the columns in Tables 28 and 29. The first is the share of inputs that the servicing firms sourced locally, and this is expected to be relatively high if the oil sector is linked with the local economy. It therefore serves as a proxy for the local value added, since information about the latter was not adequately provided by the respondents. The next two areas of linkage considered are whether the suppliers are involved in information exchange and negotiation of payment and delivery with the oil firms. It should be recalled that these are the two dominant areas of linkage identified earlier; therefore, it is necessary to establish their determinants. Although the last two linkage avenues, namely; technical upgrading and labour training from oil firms, are less practised, it will be informative to show their drivers given the importance of these avenues.
8.1. Analysis of individual drivers The results in table 28 are satisfactory in terms of the fit as given by the moderately strong adjusted R2 and the significant F-statistics. The influence of the drivers as follows; Ownership Drivers: It is observed that servicing firms in the Control System and ICT sector are less likely to source local inputs than those in the Well Construction and Completion sector; however, the Control System and ICT sector are more likely to receive technical upgrading from the oil firms. Further, firms in the Fabrication and Construction sector are more likely to source local inputs and engage in the other forms of linkages with the oil firms. Multinational firms are less likely than their local counterparts to be involved in information exchange and labour training from oil firms. They probably have information advantage as multinationals. Finally, servicing firms that are listed are more likely to be involved in labour training from oil firms than unquoted firms.

54
Table 28: Regression estimates showing the drivers of linkage in the Nigerian oil and gas sector
Share of Inputs
Sourced Locally
Information Exchange with Oil Firms
Negotiation of Payment and Delivery with
Oil Firms
Technical Upgrading
from Oil Firms
Labour Training from Oil Firms
Intercept 66.891** 2.404*** 2.298*** 3.544*** 3.133***
Ownership Drivers
Control System & ICT Sector (Well Construction & Completion)
-20.154*** [-0.358]
0.105 [0.057]
-0.097 [-0.05]
0.456** [0.255]
0.27 [0.151]
Fabrication & Construction sector (Well Construction & Completion)
18.237*** [0.316]
0.375* [0.197]
0.379* [0.191]
0.412* [0.224]
0.388* [0.212]
Multinational Firm (National Firm)
-5.444 [-0.086]
-0.392* [-0.189]
0.037 [0.017]
-0.265 [-0.132]
-0.694*** [-0.347]
Listed Firm (Unlisted Firm)
1.731 [0.025]
-0.033 [-0.014]
0.116 [0.048]
0.257 [0.115]
0.472* [0.213]
Infrastructure Drivers
Public Power Supply/ Electricity -2.968
[-0.103] -0.021 [-0.022]
0.101 [0.102]
-0.103 [-0.113]
-0.042 [-0.046]
Water Supply 4.324 [0.23]
0.015 [0.025]
0.046 [0.071]
0.002 [0.003]
-0.071 [-0.12]
Telephone Services 3.899 [0.174]
-0.001 [-0.002]
0.089 [0.115]
-0.046 [-0.064]
0.043 [0.06]
Internet Services -0.832
[-0.037] 0.054 [0.074]
0.032 [0.042]
0.156 [0.22]
0.198** [0.281]
Transportation Facilities -0.126
[-0.006] -0.072 [-0.099]
-0.057 [-0.075]
-0.245*** [-0.349]
-0.259*** [-0.371]
NSI/Skills Drivers
Technical Agreements with Foreign Companies
13.363** [0.259]
0.683*** [0.402]
0.296 [0.167]
0.198 [0.121]
0.183 [0.112]
Relationship with Local Research Centres/University
5.64 [0.103]
-0.117 [-0.065]
-0.051 [-0.027]
0.022 [0.013]
-0.013 [-0.008]
Skilled Labour Availability -6.378
[-0.099] -0.347 [-0.164]
0.014 [0.006]
0.173 [0.084]
-0.132 [-0.065]
Employ Skilled Labour Educated Abroad
1.563 [0.028]
-0.415* [-0.227]
-0.204 [-0.106]
-0.123 [-0.069]
0.092 [0.052]
Employ Personnel Previously Employed by Oil Companies
-5.468 [-0.098]
0.72*** [0.393]
0.287 [0.15]
0.207 [0.117]
0.12 [0.068]
Regional Drivers
Working for Oil Companies In Neighbouring W/A Countries
4.372 [0.063]
-0.403 [-0.175]
-0.097 [-0.04]
0.167 [0.075]
-0.094 [-0.043]
Losing Staff to Firms in Neighbouring W/African Countries
-24.543*** [-0.389]
-0.154 [-0.074]
-0.014 [-0.006]
-0.06 [-0.03]
0.193 [0.097]
Policy Drivers
Local Content Policy 11.427* [0.221]
0.042 [0.025]
0.254 [0.143]
-0.078 [-0.047]
0.202 [0.123]
Ownership Regulations -9.014* [-0.233]
0.041 [0.033]
-0.012 [-0.009]
-0.117 [-0.095]
0.104 [0.084]
Labour Market Regulation 3.534 [0.093]
-0.224* [-0.18]
-0.31** [-0.239]
-0.106 [-0.088]
-0.246* [-0.205]
Taxes/tax holidays/duty rebates -12.309** [-0.314]
0.373** [0.29]
0.244 [0.181]
0.012 [0.01]
0.084 [0.067]
Licensing 9.955* [0.262]
0.200 [0.16]
0.235 [0.18]
0.02 [0.017]
-0.171 [-0.142]
Import Tariff 2.832 [0.058]
-0.514*** [-0.318]
-0.689*** [-0.407]
-0.349 [-0.223]
-0.276 [-0.177]

55
Business Registration and Start-up -0.557
[-0.014] -0.321** [-0.244]
-0.13 [-0.095]
-0.153 [-0.12]
-0.217 [-0.171]
Other Drivers
Access to Finance -1.926
[-0.078] -0.068 [-0.084]
-0.184** [-0.218]
-0.051 [-0.065]
0.017 [0.022]
Raw Materials Constraints -0.333
[-0.065] -0.011 [-0.067]
-0.009 [-0.05]
-0.03 [-0.185]
-0.028 [-0.174]
Innovation due to Competition -0.884
[-0.059] 0.139** [0.283]
0.17** [0.33]
0.111 [0.233]
0.152** [0.321]
Diagnostics
R2 0.582 0.671 0.646 0.547 0.608
ADJ- R2 0.377 0.509 0.472 0.325 0.415
F-Stat. 3.841*** 5.154*** 4.717*** 3.463*** 4.159***
N-Obs. 80 80 80 80 80
Note: (1) Reference categories in brackets ( ) (2) Standardized betas in parentheses [ ] (3) *, ** and *** represent significance at 10%, 5% and 1% respectively
Source: MMCP Field Survey, 2010
Infrastructure Drivers: The results show that internet facilities aid labour training from oil firms, but transportation appears as a barrier to linkage. NSI/Skills Drivers: Technical agreements with foreign companies tend to raise the share of inputs sourced locally and information exchange. It is also shown that servicing firms that employ labour from abroad engage less in information exchange with oil firms, whereas those that employ personnel from oil companies engage more in information exchange. Regional Drivers: Servicing firms that have lost staff to firms in neighbouring West African countries are likely to reduce the share of local inputs in their activities. Policy Drivers: The local content policy of the government is observed to aid the share of inputs sourced locally, likewise licensing; but the opposite obtains in the case of ownership regulation and taxes. Information exchange is enhanced by taxes but it is reduced by labour market regulation, import tariff and business registration. Furthermore, negotiation of payment and delivery is discouraged by labour market regulation and import tariff. Lastly, labour market regulation serves as a disincentive to labour training from oil firms. Other Drivers: It is shown that servicing firms with better access to finance are less likely to engage in negotiation of payment and delivery with oil firms. Moreover, firms trying to meet up with the challenges of stiff competition are more likely to engage in information exchange, negotiations and labour training with the oil firms.
8.2. Analysis of interactive drivers The purpose of this sub-section is to see whether some drivers interact with each other to influence linkage in the oil and gas sector of Nigeria. However, analysis so far has shown that there are quite a number of candidate drivers of linkage and attempt to interact all of them will pose some serious problems in terms of degree of freedom and collinearity. Therefore, the procedure described in the method of analysis section is adopted.

56
Table 29 below depicts the stepwise regression estimates showing the individual and interactive drivers of linkage in the Nigerian oil and gas sector. An examination of the table shows that the results for the individual drivers are similar to those documented in table 28 above; therefore, only the interaction drivers will be interpreted in this sub-section. The share of inputs sourced locally by licensed firms that have technical agreement with foreign companies is observed to be high; the share also increases when competition engenders innovation, especially in firms that employ personnel formerly working in oil firms. Information exchange with oil firms increases when telephone services interact with skilled labour educated abroad and when firms that have access to skilled labour also signed technical agreements with foreign companies. Although electricity appears to be a problem and a disincentive to linkage, but when there is skilled labour, linkage in the form of negotiation of payment and delivery may be enhanced. Furthermore, the constraint of raw materials is likely to lead to enhanced negotiation of payment and delivery, particularly when there is increase in import tariff and the servicing firm has personnel formerly working in an oil company. Outfits with skilled labour and good communication gadget, especially telephone, are less likely to be involved in technical upgrading arrangement with oil firms; this also applies to firms that have problems with raw materials when faced with increased tariff. However, communication gadget may be used by innovative firms to remain competitive by involving in technical upgrading with oil firms. When import tariff is high and there are raw materials constraints, there is likely to be less labour training from oil firms, however, during the period of high tariff, an innovative firm will engage more in labour training from oil firms to remain competitive. Table 29: Stepwise regression estimates showing the individual and interactive drivers of linkage in the Nigerian oil and gas sector
Share of Inputs
Sourced Locally
Information Exchange with Oil Firms
Negotiation of Payment and
Delivery with Oil Firms
Technical Upgrading
from Oil Firms
Labour Training from Oil
Firms
Intercept 73.831*** 2.354*** 4.977*** 2.64*** 2.689***
Ownership Drivers
Control System & ICT Sector (Well Construction & Completion)
-19.646*** [-0.349]
0.259* [0.14]
Fabrication & Construction sector (Well Construction & Completion)
14.601*** [0.253]
0.431*** [0.227]
0.342** [0.172]
0.242 [0.132]
0.298* [0.163]
Multinational Firm (National Firm)
-0.608*** [-0.304]
Listed Firm (Unlisted Firm)
0.373* [0.168]
Infrastructure Drivers
Public Power Supply/ Electricity -0.137* [-0.15]
Water Supply 3.982** [0.212]
Internet Services 0.112 [0.159]
0.177** [0.252]
Transportation Facilities -0.125** [-0.172] -0.091 [-0.12]
-0.242*** [-0.345]
-0.247*** [-0.353]

57
NSI/Skills Drivers
Technical Agreements with Foreign Companies
0.273* [0.167]
Skilled Labour Availability 2.546***
[1.24]
Employ Skilled Labour Educated Abroad
-0.567*** [-0.31]
Regional Drivers
Working for Oil Companies In Neighbouring W/A Countries
-0.435** [-0.189]
Losing Staff to Firms in Neighbouring W/African Countries
-20.941*** [-0.332]
Policy Drivers
Local Content Policy 10.428** [0.202]
0.237* [0.133]
0.26* [0.159]
10.428** [0.202]
Labour Market Regulation -0.173* [-0.139]
-0.376*** [-0.289]
-0.17* [-0.142]
Taxes/tax holidays/duty rebates -12.882***
[-0.329] 0.379*** [0.294]
0.299*** [0.222]
-12.882*** [-0.329]
Import Tariff -0.508*** [-0.314]
-1.529*** [-0.904]
Business Registration and Start-up -0.237** [-0.18]
-0.188* [-0.148]
Other Drivers
Access to Finance -0.11*
[-0.129]
Raw Materials Constraints -0.127*** [-0.721]
Innovation due to Competition 0.746*** [1.517]
-0.685*** [-1.439]
Interaction Drivers
Electricity * Skilled Labour Availability 0.26*** [0.279]
Telephone Services * Skilled Labour Availability
-0.639*** [-1.34]
Telephone Services * Employ Skilled Labour Educated Abroad
0.22** [0.26]
Telephone Services * Innovation due to Competition
0.048*** [0.394]
0.225*** [2.006]
Technical Agreements with Foreign Companies * Skilled Labour Availability
0.542*** [0.316]
Technical Agreements with Foreign Companies * Licensing
7.383*** [0.301]
Employ Personnel Previously Employed by Oil Companies * Raw Materials Constraints
0.071*** [0.84]
Employ Personnel Previously Employed by Oil Companies * Innovation due to Competition
6.612** [0.465]
Import Tariff * Raw Materials Constraints
0.051* [0.566]
-0.026*** [-0.309]
-0.025*** [-0.298]
Import Tariff * Innovation due to Competition
0.071*** [0.258]
Diagnostics
R2 0.554 0.712 0.715 0.542 0.56
ADJ- R2 0.49 0.644 0.659 0.483 0.488
F-Stat. 8.579*** 10.539*** 12.727*** 9.192*** 7.852***
N-Obs. 80 80 80 80 80
Note: (1) Reference categories in brackets ( ) (2) Standardized betas in parentheses [ ] (3) *, ** and *** represent significance at 10%, 5% and 1% respectively
Source: MMCP Field Survey, 2010

58
The above table can also be used to determine the relative influence of the MMCP drivers vis-a-vis the influence of their interactions and other drivers. An examination of the standardised betas shows that individual variables like transportation, skilled labour, taxes, tariff and innovations are the major drivers of linkages in the Nigerian oil and gas sector. Furthermore, the interactions of telephone with the availability of skilled labour, and with innovation as well as the interaction of tariff and raw materials problems are very important.
9.0 Summary of findings, conclusions and policy recommendations
This section presents summary of findings of the study and conclusion. Some recommendations are also offered for policy.
9.1 Introduction The dearth of linkages between the oil sector and the other sectors of the Nigerian economy is a critical developmental problem. One reason why there are no linkages in the oil sector is the capital intensive nature of oil sector activities and scarcity of capital as well as local expertise. Thus, despite several governmental development initiatives including promotion of indigenous ownership; articulation of local content policy, local content remains insignificant. This problem has also led to a crisis in the Niger-Delta region (Oil region) which remains undeveloped. Hence, there are political and ethnic agitations in the region against the Oil companies. Creating linkages in the oil sector through development of local capacity to participate in the oil sector activities (through encouragement of indigenous ownership, establishment of the National System of Innovation (NSI) and improvement of the state of infrastructure could help curb this problem. The presence of effective linkages is necessary for a balanced growth of an economy, thus it is important that linkages exist between sectors so as to promote an all-round growth and development of an economy. The primary objective of this study is to examine the extent of the linkages in the oil sector that has been created with the rest of the Nigerian economy. The specific objectives of this study are:
Identification and analysis of linkages in the oil and gas industry created with the rest of the Nigerian economy; c. Map the supply/value chains in the oil and gas industry; d. Identify the activities feeding into the value chain, and the institutions
creating them; Identification of the local content elements in oil and gas activities in Nigeria;
e. Examine the degree of local sourcing; f. Analyse the role of oil firms in promoting linkages; g. Examine the influence of ownership, infrastructure, NSI, skill, policy,
finance, etc in fostering localisation of activities with high output and employment potential;
h. Assess the spill-over effects from oil and gas industry to the rest of the economy and regional economy;
Assessment of the outcomes/impacts of the policy measures that have been and/or are being implemented in enhancing linkages in oil and gas sector.

59
This study is necessitated by the dearth of studies in the area of oil sector linkages in Nigeria particularly with a focus of the role of ownership, infrastructure, National System of Innovation (NSI), skills spill over, policy and other factors in enhancing Oil sector linkages in Nigeria. Thus, the study is based on the theories of linkages particularly backward linkage of the Oil sector. A number of hypotheses tested include; the influence of ownership, infrastructure, National System of Innovation (NSI), skills spill over, policy and other factors on Oil sector linkages. These hypotheses are termed “MMCP hypotheses. Based on an earlier study which identified areas where local firms have technological and employment potentials, this study covers three of such areas (Fabrication and construction, well-construction and completion, and Control system and ICT). We have used both primary and secondary data and the methods of analysis are both descriptive and inferential. We conducted a survey in 2010 and we employed frequency and percentage tables, Charts, figures to present and discuss our survey results. We used a regression analysis to examine the impact of individual and interactive drivers.
9.2 Summary of key findings
The descriptive analysis shows that Nigeria is among the top five OPEC countries that have had substantial crude oil production over time. Nigeria appears to be the 10th largest oil producer in the World; the largest in Africa until recently when Angola overtook it. Since the discovery of crude oil in Nigeria, the economy is heavily dependent on its oil sector for export, foreign exchange earnings and revenue. Based on the survey results we found that the degree of local sourcing of input (local suppliers) in the Control system and ICT sub-sector is less than what obtains in the other sub-sectors. It was also found that linkage between first-tier and second-tier supplier is weak, though information exchange is relatively higher. In the opinion of the servicing firms, their linkage with the oil sector is weak, but fair in the opinion of the oil firms. Although both the oil firms and the servicing firms agree to the same structure of linkage, the Oil firms tend to rate their linkage with their servicing firms higher than the way the servicing firms rate the same linkage. Most servicing firms are national, but the control system and ICT sub-sector has highest multinational presence. Multinational firms dominate the oil sector, followed by joint venture, and few are national. Infrastructural facilities are rated satisfactory, only public power is rated grossly inadequate by the servicing firms, while Oil firms rate infrastructure more satisfactorily than servicing firms. Survey results revealed that skilled labour are available, sometimes from abroad, especially in the ICT sub-sector. On the average, about half of the servicing firms have agreements with foreign companies and local research centres. In terms of policy consistency, import tariff and taxes are the most inconsistent. Firms are involved in some innovations to survive stiff competition. Control system and ICT sub-sector with higher multinational presence suffer less liquidity problems, but liquidity falls over time. High price of imported raw materials is the largest raw materials problem that affects servicing firms.

60
Based on a regression analysis, I was discovered that the MMCP drivers, other drivers and their interactions affect linkages. In all, availability of skilled labour (skill), policies (tax) and NSI stand out as the major drivers. Thus, the summary of the key drivers on likert scale 1 to 5 is presented below.
Driver Not important
Moderately important
Quite important
Very important
Dominating important
Ownership Yes
Infrastructure Yes
NSI Yes
Skill Yes
Regional Yes
Policy Yes
Others Yes
Source: Extracted from the regression results
9.3. Current vision for the commodities sector in Nigeria The vision for the economic transformation of the Nigerian economy to the 20th position in the world within the next 20 years is articulated in what is known as the vision 20: 2020. The vision document contains thrusts for both the aggregate economy and the sectors. The thrusts for the oil and gas sector during 2010-2013 (the first implementation plan) include the following. (a) Optimising the contributions of the oil and gas sector by intensifying crude oil and gas exploration; (b) Promotion of private sector investment in both upstream and downstream activities of the oil and gas industry; (c) Deregulation of the oil and gas industry; (d) Promotion of environmentally friendly oil and gas exploration and exploitation methods thereby minimising the environmental degradation of the oil producing areas; (e) Strengthening capacity building programmes especially in the core technical areas of oil and gas; (f) Achieving gas flare-down as a means of reducing pollution and increase revenue base of the economy; (g) Promotion of Liquefied Petroleum Gas (LPG) as fuel for cooking to free liquid petroleum for exports; (h) Diversification of the mode of transportation of petroleum products-pipeline, railway and road haulage. The sectoral objectives for the oil and gas sector include the following. (a) To grow national content in value addition in the sector, thereby expanding linkages to other sectors of the economy; (b) to create an efficient oil and gas industry with low operating cost , maximised revenue and efficient regulations; (c) Increase local refining capacity to serve both domestic and regional markets;

61
(d) To meet domestic gas demand especially in power and manufacturing sectors while optimising; (e) To create a well secured operating and business environment in oil producing areas. The sectoral targets for the plan period include the following. (a) To grow reserves from 40 billion barrels to 50 billion barrels by 2013; (b) To grow crude oil production capacity from 2.8mb/day in 2010 to 4.5 mb/day by 2013; (c) To grow in-country refining capacity from 0.45mb/day to 0.75 mb/day by 2013; (d) To increase local content in oil and gas from current 20.0 percent in 2009 to 35.5 percent in 2010 and to 70.0 percent by 2013; (e) To grow gas reserves from 187TCF in 2010 to 220TCF by 2013; (f) To develop alternative energy in the quest for overall sustainable development in alignment with global initiative to reduce global warning. The following are the implementation strategies that will be adopted to achieve the targets. (a) Creation of an enabling environment in the Niger-Delta (b) Promotion of economic empowerment programmes targeted at building community capacity; (c) Creation of employment opportunities in the oil producing areas by upgrading and building new facilities; (d) Establishment of an appropriate machinery to effectively monitor the activities of all operators in the oil and gas sector; (e)Full commercialisation of the NNPC so as to place it on a level playing field with Joint Venture partners; (f) Privatisation and private equity participation in the existing refineries; (g) Passage of the Petroleum industry Bill and Local content Bill into law; (h) Facilitation of projects that transfer technology and generate employment in the non-oil sector, especially the petrochemical industry, It can be seen from the foregoing that the vision objectives, targets and strategies address the issue of linkages (both forward and backward linkages). The programmes of activities to achieve the goals of the vision in the oil and gas sector include the following (a) Gas master plan (b) Facilities and equipment for capacity building © Bilateral economic co-operations on oil and gas; (d) Extensive Gas pipeline projects; (e) Development of ICT for the oil and gas sector; (f) Procurement of equipment and vehicles. (g) Pressing for passage of petroleum and local content development Bills. The above programmes to a large extent can deliver the vision on linkages. The passage of the National content Bill into law in 2010 will go a long way to promote

62
linkages in the sector. The passage of the Bill into law is an indication of the political will of the government to promote linkages in the sector.
9.4 Policy recommendations Since ownership, infrastructure, NSI, skill spill over and policy are found to be major drivers of Oil sector linkages in Nigeria in Nigeria, therefore effort should be made to address the problems associated with these drivers. For Government The on-going privatisation and industrial policies in Nigeria should be fine-tuned to encourage more local ownership and joint venture in the oil and gas sector than before. The bank of industry, the small and medium scale industry equity investment scheme (SMIEIS) and the micro-finance banks should be strengthened to cater for the small and medium scale enterprises. In general, the cost of capital (interest rate) should be reduced to encourage indigenous investment in the oil sector. Indigenous entrepreneurs should be encouraged by government to partner with foreign firms in the delivery of services to the oil sector operators. Given the poor state of infrastructure in Nigeria particularly power, there is the need to expedite action on the deregulation of the power sector to promote adequate service delivery. The foundation for industrialisation and enhancing linkages is the availability of good infrastructure especially electricity and transportation. There is the need to set up a committee for effective implementation of the recently passed National Content Bill. This is because the bill will go a long way to promote local sourcing of inputs and upgrading of local skills. All these will also promote employment and increased value added. The NSI in Nigeria needs to be properly integrated with the rest of the economy particularly the oil sector. There is the need to increase the share of government expenditure on education so that the NSI in Nigeria can function effectively. For the Corporate sector Local firms should be ready to upgrade their technology in order to be able to service the oil sector. This may be easy through partnership with foreign firms as in the case of some existing domestic firms such as Niger-Dock and Delta-Afrik which partner with Worley-Parson based in the US.

63
References
Abeysinghe, Tilak, 2001. "Estimation of direct and indirect impact of oil price on growth," Economics Letters, Elsevier, vol. 73(2), pages 147-153 Bessant, J., M. Morris and R. Kaplinsky (2003). "Developing capability through learning networks." International Journal of Technology Management” Fiess, Norbert M. & Verner, Dorte, 2001. "Intersectoral dynamics and economic growth in Ecuador," Policy Research Working Paper Series 2514, The World Bank. Freeman, C. (1995) The ”National System of Innovation” in Historical Perspective. Cambridge Journal of Economics. Hanson, K., S. Robinson, and G. Schluter. 1993. Sectoral Effects of a World Oil Price Shock: Economy wide Linkages to the Agricultural Sector.” Journal of Agricultural and ResourceEconomics. 18(1):96-116. Heum, P. (2008). “Local Content Development - Experiences from oil and gas activities in Norway”; study by SNF- project No. 1285, 02/08(August) Heum, P., Quale, C., Karlsen, J. E. Kragha, M. and Osahon G.(2003) Enhancement of Local Content in the Upstream Oil and Gas Industry in Nigeria: A comprehensive and viable policy approach; joint study by SNF-I nstitute for Research in Economics and Business Administration, Bergen, Norway SNF Report No. 25/03(August) Hoekman, Bernard, Keith Maskus and Kamal Saggi (2005), “Transfer of Technology to Developing Countries: Unilateral and Multilateral Policy Options”, World Development, 33(10), October, pp.1587-1602. Jan Fagerberg & Martin Srholec, 2007. "National innovation systems, capabilities and economic development," Working Papers on Innovation Studies 20071024, Centre for Technology, Innovation and Culture, University of Oslo. Korhonen and Ledyaeva (2008) “Trade Linkages and Macroeconomic effects of the Price of Oil” BOFIT Discussion Papers National Planning Commission-NPC (2009), Nigeria Vision 20:2020: Economic Transformation Blue Print, NPC, Abuja. National Planning Commission-NPC (2009), The first National Implementation Plan for NV20:2020: The vision and Development Priorities.. Nigeria Vision 20:2020: Economic Transformation Blue Print, NPC, Abuja. Volume I National Planning Commission-NPC (2009), The first National Implementation Plan for NV20:2020: Sectoral plans and Programmes. Nigeria Vision 20:2020: Economic Transformation Blue Print, NPC, Abuja. Volume II. Nigeria National Petroleum Corporation-NNPC(2009), National Content Guideline, Presentation to Investors on the Gas Master Plan, NNPC, Abuja

64
Obi, C. 2007. “The Struggle for Resource Control in a Petro-state: A Perspective from Nigeria”, in P. Bowles, et al; National Perspectives on Globalisation, Hampshire and New York: Palgrave Macmillan. Sunderlin, W.D., Angelsen, A., Wunder, S., 2003. Forests and poverty alleviation. In: Food and Agriculture Organization, (Ed.), State of the World‟s Forests 2003. Food and AgricultureOrganization, Rome. UNCTAD/CALAG (2006) “Creating Local Linkages by Empowering Indigenous Entrepreneurs. African Oil and Gas Services Sector Survey. Vol 1-Nigeria. United Nations Conference on Trade and Development. Wlazlowski (2008) “Crude oil-end Product Linkages in the European Petroleum Markets” OPEN Review.

65
APPENDIX A (NNPC, 2009)
S/No Activity/Service Areas NCD Pursuit Deadline/Timing Comments
1 Conceptual, FEED and detailed engineering design
Domiciliation in Nigeria End of 2005 Good progress
2 PMT and Procurement Location in-country Q1, 2006 Compliance still shaky
3 Master Procurement Plan Provided to NCD Yearly by Jan 31 Not complied with
4 Fabrication of weighing up to 10,000 Tons inkling pressure vessels and topside integration
For in-country execution 2006 Lukewarm industry reaction
5 Fabrication of support structures including all galvanizing
For in-country execution 2006 Two Galvanizing Plants are being built in the country
6 Fabrication of sub-sea systems facilities. For in-country execution 2006 No plans in the horizon
7 50% of the total tonnage of FPSO topside modules
For in-country execution January 2006 Plans are shaky
8 FPSO topside integration To be carried out in country mid 2006 Required facility not available
9 Certification of welding procedures and welders To be carried out in country mid 2006 In progress
10 Partnerships and alliance Bindings agreement between foreign vendors and their Nigerian partners
No structured approach
11 Low voltage Earthing cables Purchased from Nigeria 2006 Limited industry attention
12 Locally manufactured goods Utilization of locally goods. Not defined Too generalized, no plants
13 All carbon steel pressure vessels Fabricated in-country January 2006 Four pressure vessel plants available in country
14 Seismic/Reservoir management services In-country execution 2006 Capacity issues
15 Waste/low tech logging services (onshore) Reserved for Indigenous companies 2006 Competition and costs issues
16 Coating and threading of pipes To be done in Nigeria 2006 Good industry response
17 Concrete barges To be done in Nigeria 2006 Limited industry appetite
18 Operation and mtce of offshore production units To be carried out by Nigeria companies
2006 Limited capacity (barges)
19 Material Codes and standards Streamlined for the Nigerian market 2006 in progress
20 Barytes and bentonite Locally sourced Not defined Poor industry coordination
21 Insurance Compliance with local law 2006 Limited capacity
22 Cabotage law Compliance 2006 Limited capacity
23 Training of Nigerians All service providers Continuous In progress Source: Nigerian National Petroleum Corporation (NNPC), 2009.

APPENDIX B (NNPC, 2009)
MEASURABLE ACHIEVEMENTS OF THE NATIONAL LOCAL CONTENT POLICY
S/N ACTIVITY 2004 2008
1 Engineering Man hours performed in Nigeria About 250,000 3,500,000
2 International Engineering companies working in Nigeria Nil (after the exit of Bechtel in 1996) 4
3 Local Engineering Companies in Nigeria 5 60
4 Fabrication Tonnage in Nigeria About 12,000 100,000
5 Fab Yard Lifting capacity < 100T 500T
6 Pressure Vessels fabrication One 3 Established and 1 in progress
7 Fabrication of DW buoys, etc Not contemplated Several already executed
8 Pipe manufacturing in Nigeria Not feasible 1 functional mill and two others in progress
9 Industry Skills Development No programme OJT and other skills development programmes
10 Welders Training No programme Structured training of 100 in progress
11 Access to funds Local Banks provide fund at 24% interest rate
NCSF fund at 9% interest

67
APPENDIX C
Firm I.D. SECTOR MAJOR INPUTS SUPPLIERS
1 control syst.&ict Not indicated Not indicated
2 control syst.&ict Not indicated Not indicated
3 control syst.&ict Not indicated Not indicated
4 control syst.&ict Not indicated Not indicated
5 control syst.&ict Not indicated Not indicated
6 control syst.&ict
computer system (all soured abroad) roll-off computer (sales of computer hardwares) comps wood international
7 control syst.&ict core holder, toluere, mathanol, chloroform p v t apparatives perosimeter, permeameter, computer accessories p core tab
8 control syst.&ict hardware, software schlumberger information solutions Nigeria (sf)
9 control syst.&ict
hardware, software plus labour foreign software and hardware companies
10 control syst.&ict Hydraulics
11 control syst.&ict
instrumentation, calibistion services, safety systems, security system, industrial wireless solution, panel building, automation and system integration, technical training, power system
honeywell fire and gas system, zencus- remote monitoring system, matricon-opc.
12 control syst.&ict laboratory equipment,air fin coolers,columns,heat exchangers, air
compressors
13 control syst.&ict marine vessels,haulage&lifting equipment catapillar,libar,nissan,ford,cat,forokawa
14 control syst.&ict NDC equipment, hydrostatic equipment, water blastrong machine
15 control syst.&ict none obtained locally sako resource nig ltd
16 control syst.&ict perm/poro equipment,man power bar beach
17 control syst.&ict
stabilizers, monnerls, jars, motors (mud), drill bits, shock tools natural oil well varco, ja oilfield, safehouse
18 control syst.&ict ultra perm, ultra pore, scal equipment, porositimeter, permeater core lab, bar beach
19 control syst.&ict ultra perm/ultra pore for porosity and perm measurement,scal equipment, human resources(local) bar beach,chivo collon, core lab
20 control syst.&ict visiting client to procure work and contracts, greeting quality personnel geoservices paris
21 Fabrication & construction Not indicated Not indicated
22 Fabrication & construction Not indicated Not indicated
23 Fabrication & construction Not indicated Not indicated

68
24
Fabrication & construction
building materials - obtained locally one saw chippings,wood, lubricants, local labour etc
crushed rock nig. Ltd mayor stand dealers local dredging coys local spare parts dealers etc
25 Fabrication & construction comprressors, pumps, pressure vessels,steel plates, steel pipe,steel
rock,structural steel materials niger dock, dermalong
26 Fabrication & construction eingering and fabricating services eg design of onshore/offshore facilities
clecks, jactet, etc cafcco ventures inc supplier of pipe and piping fittings eg elbows, valves etc
27
Fabrication & construction fabrication services, diving service, instrumentation services. All human resources solved locally it is only some fabrication materials that are solved abroad. p.b djeba ltd, delta steel company, etc
28 Fabrication & construction machines/equipments, manpower (human resources) (locally), materials cle jay nig ltd, landmark, marsh buggies
29 Fabrication & construction
man power/staffing, stationeries, petroleum products new technologies- stationeries, triton g- petroleum products
30 Fabrication & construction manpower,vessels,heavy lifting equipment CAT,catapillar
31 Fabrication & construction mixer,welding machine, vibrator local retailers
32 Fabrication & construction steel metal, electrode, furniture, paints, meyer paints, industrial metals steel
metal meyer paints, industrial metals
33 Fabrication & construction steel, electrode, cutting stronses, oxygen and cutting cylinder we are not
important anything directly we buy materials in an open market environment from retailers kings tech international company- oxygen
34
Fabrication & construction
steel, electrode, grinding disc, paints oxygen & acetylene, excavator, electric motor, etc, aluminium clips, track chain, hydraulic motors, hydraulic pumps
steel-emma steel, aly tech, electrode- aly tech, euge travel,grinding disc -aly tech,paints-aly tech, oxygen & acetylene_ uhesan, excamotor- pan- agrey international usa. Electric motor- uche ego ltd.
35 Fabrication & construction
steel, peline(all obtained abroad) tools (locally obtained) chico enterpicises, warri, delta. Janusaka nig ltd, austron nig ltd
36
Fabrication & construction
welding sleeves, grinding machines, grinding stones, welding machine, electrodes, pipes, wrapping materials, conerall, hand gloves etc
charlisco nig ltd, sales and supply of industrial bolt and nuts s.okoro ltd, sales and supplies of welding and safety materials
37 Fabrication & construction Not indicated Not indicated
38
Fabrication & construction
diesel manpower, cables, vanish/thinner(all obtained locally )
penn-electrical, benin (sales of vnesh) itos limited(cable) popular electrical enterprises (electrical deotresutors )

69
39 Fabrication & construction water, sand paving stone, water
40 Fabrication & construction Not indicated Not indicated
41 Fabrication & construction Not indicated Not indicated
42 Fabrication & construction lathe machine diesel, welding electrodes cement, gas granite- all locally
directed local vendors generally
43 Others Not indicated Not indicated
44 Others Not indicated Not indicated
45 Others Not indicated Not indicated
46 Others ammonia,crude oil,demulsifier, corrosioninlubtor, catalyst
47 Others cement additives, class G cement, basites, cementing chemicals, centraliyers, plug value, DE, pumps, retarder
librod - chemicals benoil - class G cement, anadril
48 Others heavy equipment (well head, generators, tubing
49 Others natural gas, extraction equipment
50 Others refilling of fire extingular, fimaigation of compaines, cean up job boc gas, suppling of censon suppling of chemical fo firmgation
51 Others Treatment chemicals, natural gas shell, Elf, NAOC
52 well construction&completion Not indicated Not indicated
53 well construction&completion Not indicated Not indicated
54
well construction&completion Not indicated schlumberger oil servicing company-wall testing services, oil tubing and wall performance services
55 well construction&completion Not indicated Not indicated
56 well construction&completion Not indicated Not indicated
57 well construction&completion Not indicated Not indicated
58 well construction&completion Not indicated Not indicated
59 well construction&completion Not indicated Not indicated
60 well construction&completion Not indicated Not indicated
61 well construction&completion
based on the Nigerian local content we and segots engage supplies locally to cater for product like the following lifting sling grease-copper coate, safely apparetes-satefy gogglenear muff, etc
acm machines shop-activities they carry our thread redress, rechase, fabrication on our drilling tools, and tools inspectors activities
62 well construction&completion cement additives, class G cement, basites, cementing chemicals, centraliyers, plug value, DE, pumps, retarder
librod - chemicals benoil - class G cement, anadril
63 well construction&completion chemicals,drill rig(sedio forex), hoppers,mud pit
a few local firms, and good number of foreign companies, such as natonal oil varco, and chatered supply
64 well construction&completion community services,oil serviceing and well serving

70
65 well construction&completion drill bits, drill pipes, draw work, demcks, kelly bushing & Kelly national oil varco,chatered supply
66 well construction&completion drill string, cassing, tubing handling equipment,fishing tools international tools
67 well construction&completion equipment - survey and geotech, office machine vehicles universal survey services annealing nig ltd, lambic technical nig ltd
68 well construction&completion heavy lifting&hand held equipment,human resources int. tools,afal
69 well construction&completion hydraudo power unit, power tongues, hand tools chique, afal, international tools
70 well construction&completion inputs obtained abroad total
71 well construction&completion jet perforator, cements , chemicals schlumberger Nigeria
72 well construction&completion logging equipment, human resources geoservices headquaters in paris
73 well construction&completion machines equipment, consumables logging tools, some equipments like machine part are gotten locally owen, weatherford ,tts
74 well construction&completion mud log, sleek line geoservice paris and USA
75 well construction&completion net tool, sand tool, completion accessories our foreign and local partners
76 well construction&completion nitrogen gas (Air liquid ;Boc gases) (locally) diesel (locally)spare parts (inputed)
Boc gas, air liquid, cenoil or any more supplier csi, mantrace
77 well construction&completion servicer position
78 well construction&completion sleekline, mud logging equipment fishing food geoservices paris
79 well construction&completion
barite, bentonite, calcium, cardonate, calcium chlorode, potassium chlorode, sodium, chloride, biopolymers (XCD) starch, emilsifiers, surfactions, corosion inhibitions etc
eunisell, santa sede nig. Ltd., steve - daisy ventures ltd.
80 Well contrution&completion bentonites, barytes, rhometer, hydrometer, pvt equipment, soduim lydroxide sun drilling incorporation, texas usa, eghor Nigeria ltd

71
APPENDIX D
S/N Fabrication and construction Well construction and completion Control system and ICT Others
1 pigging operation solid control& waste management logistic and it Insulation
2 swamp buggy Chemicals elect instrument labour contracts
3 feed mills drilling services system integration repair of generators
4 flour mills hock over casing oil striking and workover operation Purifying
5 corrosion control tubulars/tubing repairs downhold, fishing tools rentals equipment hiring
6 refurbishment of oil well pigs supply logistic support vehicle leasing & maintenance
7 pipe laying slick line provision inspection gas & oil extraction & processing
8 mud can Bhp control syst. Insulation
9 tool basket project management instrumentation labour contracts
10 cuter knife sand control core analysis repair of generators
11 pipeline& flow line fabrication Parker subsurface sample storage Purifying
12 steel workers Lining geological manpower consulting equipment hiring
13 Installations drilling fluids software design vehicle leasing & maintenance
14 buildings, roads, concrete pavement well intervent & testing services lab services
gas & oil extraction & processing
15 well heads platforms slickline surveillance heat exchanger services
16 boats, barges, vessels formatting evaluation 3d laser scanning & modelling
17 mechanical facilities/machines mud logging bucking services
18 Tubing hydraulics specialist data managements
19 winding& rewinding of alternators directional drilling
20 pipe laying well testing
21 flow station oil and gas servicing
22 gas processing facilities construction well head operation
23 elect & elect engineering hydro testing flushing
24 geotech engineering/investigation
25 wireline logging
Source: MMCP Field Survey, 2010

72
APPENDIX E
Oil firm ID Nationality Activity Main products
1 Multinational exploration,marketing crude oil,natural gas,refined products
2 Multinational exploration,production,marketing crude oil,natural gas,fuels,lubricants
3 Multinational exploration,production,marketing crude oil,natural gas,refined product
4 Multinational exploration,production,marketing crude oil,natural gas,refined product
5 Multinational exploration,drilling,designi oil and gas production
6 Joint venture exploration oil and gas
7 Joint venture exploration,marketing crude oil,gas,refined products
8 Joint venture exploration crude oil and gas
9 National exploration crude oil
10 National exploration crude oil
11 Multinational exploration,production,marketing crude oil,natural gas,refined product
12 Multinational exploration crude oil

73
Making the Most of Commodity
Programme (MMCP) University of Cape Town in Collaboration with the University of Ibadan
ENHANCING OIL SECTOR LINKAGES STUDY
QUESTIONNAIRE for Suppliers of oil firms
INTRODUCTION
Good day. My name is ________________ from_____________________________________. We are carrying out a study on Enhancing Oil sector linkages in the Nigerian
Economy. The end goal of this study is to identify the constraints hindering effective linkages of the oil sector in the Nigerian Economy and offer policy options for removing
these constraints. We will use your experiences, views and ideas to advise policy makers and stakeholders on how best they can address the problems hindering oil sector
linkages in the Nigerian Economy. We very much appreciate your participation in this study. I want to assure you that whatever information you provide will be kept strictly
confidential and will be used for capacity development purposes only.
This interview will take about 30 minutes to one hour. This questionnaire is strictly for academic and research purposes.
A. IDENTIFICATION
Questionnaire number ___________________________________________________
State _____________________________________________________
Location town/city ___________________________________________________
Date(s) of interview __________________________________________________________
Number of visits _________________________________________________________
Length of interview _________________________________________________________
Name of Field Officer _________________________________________________________
Name of Supervisor _________________________________________________________
Data Collection by Field editing by Office editing by Data entry by
Name of personnel
Date

74
Study on Enhancing Oil sector Linkages in Nigeria
Quantitative Study Tool
B GENERAL INFORMATION
1. Name of the Enterprise
2 Address:
3 Contact Name:
4 Position:
5 Telephone number…………………….. 6. Fax Number ………………………
7 Email address…………… 8 Website Address of the Company ………………………
9a Date of Establishment:________
10b. Year of Registration with government:_______
11a. Is the company Listed? Yes ( ) No ( ) 11b. If Yes, when ………………………
12 What is the nationality of the owner(s) of the company?
1) Nationals only ( )
2) Multinational Company ( )
3) State owned Enterprises ( )
4) Joint ventures by nationals and foreigners ( ) State proportion of foreign ownership …………………
13 Nature of Enterprise
1) Sole proprietorship ( )
2) Partnership ( )
3) Limited Company ( )
4) Limited Liability Company (Plc) ( )
5) Government company/Corporation ( )
14 Gender of Major owner (with controlling shareholding) (1). Male ( ) (2). Female ( )
(3) Not applicable ( )
15 Age of major owner (with controlling shareholding): ________________Years
16 Highest level of Education of major owner
(1) None ( ) (2) Primary ( ) (3) Secondary (“0” and “A” Levels) ( ) (4) Diploma ( ).
(5) University Degree and Post graduate ( )
17 Please indicate the previous experience of the major owner from the following
Years of Experience
No Experience
Apprentice
Participation in the activities in your industry
Participation in the activities in the oil industry
Others (Please Specify)……………………..
18 Sector of activity and main Products
s/n Sector of Activity Main products
1 Fabrication and Construction
2 Well construction and Completion

75
3 Control system and ICT
4 Other, Specify ..........................
C BUSINESS ENVIRONMENT
Establishment costs
19 Is your business registered? Yes ( ) 2. No ( )
20 How long did the registration process take? ……………………………
21 How much did it cost you officially to register this business? …………………………
22 How much unofficial payments and/or gratification did you pay in order to register the business?..................................
23 What is the proportion of unofficial payments/gratification out of the total cost of registering your business?............................................
24 Did the unofficial payments considerably reduce the amount of time required to register the business?
Yes ( ) 2. No ( )
25 Do you consider that the procedures involved in establishing a business are complex?
Yes ( ) 2. No ( )
26 Do you pay gratification to transit consignment escorted by customs officials?
Yes ( ) 2. No ( )
Contract enforcement costs
27 Have you ever been involved in dispute with any of your business partner (Please tick as applied)?
Yes ( ) 2. No ( )
28 If yes, how many times have you been involved in disputes with any business partner in the last two years? ...................
29 How many of the above dispute (s) did you resolve through each of the following process ?
S/N Process No of dispute times
1 Discuss the issue (s) with the partner (s) and settle amicably
2 Invited the law enforcement agent to intervene in the dispute
3 Seek legal assistance from attorney on the matter
4 Court action
30 How long (on the average) did it take you to resolve a dispute? ____
31 How will you describe the amount of resources spent by your organisation in resolving the dispute
1. Very reasonable ( ) 2. Reasonable ( ) 3. I don‟t know ( )
4. Unreasonable ( ) 5. Very unreasonable ( )
32 How would you describe the process of contract enforcement in the country?
1. very good ( )
2. good ( )
3. average ( )
4. poor ( )
5. very poor ( )
Information costs
33 Please indicate the degree of importance of the following type of business information to your organization on a scale of 1 – 5(1= NOT IMPORTANT and 5 =
HIGHLY IMPORTANT)
INFORMATION TYPE SCORE
Production Information
Marketing and Distribution Information
Financial Sources Information
Business opportunities Information

76
Export and import activities
Standards and Regulations Information
Networking and Strategic Alliances Information
Technology Information
Others, Specify……………………………………………………………..
34 How would you describe the cost of getting access to the following infrastructure? (Please tick as appropriate)
Infrastructure Very affordable Affordable I cannot say Not affordable Highly not
affordable
Public Power Supply/ Electricity
Water Supply
Telephone and Communication
Internet services
Transportation
Other Infrastructure (please specify)………………
35 How would you describe the cost of Monthly bill or service charge for the following infrastructure? (Please tick as appropriate)
Infrastructure Very affordable Affordable I cannot say Not affordable Highly not
affordable
Public Power Supply/ Electricity
Water Supply
Telephone and Communication
Internet services
Transportation
Other Infrastructure (please specify)………………
36 How would you describe the Performance of the following infrastructure? (Please tick as appropriate)
Infrastructure Very Adequate Adequate I cannot say Inadequate Very inadequate
Public Power Supply/ Electricity
Water Supply
Telephone and Communication
Internet services
Transportation
Other Infrastructure (please specify)...……….……
37 (a). Over the last year, would you say the following infrastructural and utility services have ……?
Infrastructure Improved Deteriorated Remained unchanged
Public Power Supply/ Electricity
Water Supply
Telephone and Communication
Internet services
Transportation
Other Infrastructure (please specify)…………….……
37 (b) What role do you see your company and oil companies play in improving the infrastructure?......................................
…………………………………………………………………………………………………………………………………………………………………………
……………………………………………………………………………….
Finance and insurance services
38 How will you describe the adequacy of funds available for your business operation?
(1) Very inadequate ( ) (2) Inadequate ( ) (3) I cannot say ( )
(4) Adequate ( ) (5) Very Adequate ( )
39 What are the major sources of finance for working capital and new investment in your business? (Pls. tick the three most important sources)
(1) Family/Friends ( ) (2) Retained Profit ( ) (3) Banks and Other financial institutions ( )
(4) Rotating Savings and Credit Societies/other Informal sources ( ) (5) Personal funds ( )
(6) Others, Specify ___________________

77
40. What is the average proportion of each source for the start-up of your business?
Year Personal funds Friends Family ROSCAS Banks Others
2005
2006
2007
2008
2009
41 What is the average proportion of each source for the working capital of your business?
Year Friends Family ROSCAS Retained profit Banks Others
2005
2006
2007
2008
2009
42 Have you had any cash flow (liquidity) problems? Tick as appropriate
Year Yes No
2005
2006
2007
2008
2009
43. What did you do about it?
Year Yes No
Sold off raw materials
Sold some equipment
Borrowed from bank(overdraft)
Borrowed from bank (loans)
Used personal cash reserves
Borrowed informally (money lenders, Contributions, etc)
Took cash advances from clients
Obtained supplier credit
Others (specify)
44 Please indicate the degree of importance your organization attaches to credit from formal financial institutions on a scale of 1 – 5 (1= NOT IMPORTANT and
5 = HIGHLY IMPORTANT)
SCORE___________
45 How would you describe your access to credit from formal financial institutions?
Year Very easy Easy I do not know difficult Very difficult
2005
2006
2007
2008
2009
46 How problematic are the following in accessing credit from formal financial institutions?
Highly problematic Just problematic I don‟t know Not so much
problematic
Not problematic at all
Credit purchases
Bank Documentation requirement
Processing time for the credit

78
Collateral requirement
Repayment conditions
Bank charges and interest rates
Opening letters of credit
Others (specify)
Energy supply (Tick as applies)
47 What are the main sources of electricity for your organisation?
1. Public electricity supply ( )
2. Solar powered electricity ( )
3. Diesel and petrol powered electric generator ( )
4. Other s Specify _______
48. What is the average number of hours without electricity in a day? __________
49 What is the average proportion of each source power supply for your organisation?
Year Government supplied electricity Solar powered
electricity
Generator powered electricity Others
Specify
TOTAL
2007 100.0
2008 100.0
2009 100.0
50. Over the last year, would you say that the quality of power supply in the country has ……?
1. Improved significantly ( ) 2. Improved ( ) 4. Deteriorated ( ) 5.Deterorated significantly ( )
3. Remain unchanged ( )
51 What proportion of your production costs is cost of power supply provision?
2005 2006 2007 2008 2009
52 What is the proportion of time that you have electricity outage in the past five year?
2005 2006 2007 2008 2009
Mapping the value chain
53 List your major inputs (and identify the ones obtained locally)
……………………………………………………………………………………………………………………………
……………..
……………………………………………………………………………………………………………………………
……………………………………………………………………………………………………………………………
………………………………
54 What proportion of your inputs is obtained locally?.............................................................................
55 Who are your suppliers? (Name the firms and their
activities)……………………………………………………………….
……………………………………………………………………………………………………………………………

79
…………….
………............................................................................................................................................................
.......................................................................................................................................................................
.............................................
56 What do they supply you?
...................................................................................................................................................
……………………………………………………………………………………………………………………………
……………….
……………………………………………………………………………………………………………………………
………………
57. (a) Are there technological agreement with your buyers or sellers ? Yes ( ) No ( )
(b) Are there marketing contracts with your buyers or sellers? Yes ( ) No ( )
58 What is the size of your company?: (a) Please provide information on your output and Turnover in the last five years
2009 2008 2007 2006 2005
Category Qty Value Qty Value Qty Value Qty Value Qty Value
Production capacity
Output
Turnover/revenue
Profit
Unit price
(b) Please provide information on the Type and Number of Employees you have in the last five years
2009 2008 2007 2006 2005
Category Male Female Male Female Male Female Male Female Male Female
Full time paid employees
Apprentices
Casual/Temporary
Total
Relationship with buyers
59a Who are your main customers? ………………………………………………………………………
…………………………………………………………………………………………………………………….
59b. How has the list of your customers changed over the past 5 years? (explain) …………………………
…………………………………………………………………………………………………………………….
……………………………………………………………………..………………………………………………
60 (a) What have been the major changes in terms of level of demand for your products?
.................................................................................................................................................................................................................................................................
......................................................................................................................... (b) What have been the major changes in terms of quality demanded?
.............................................................................
……………………………………………………………………………………………………………………………
61 What are your main products? List the products and indicate the share sold to the oil companies
a. ……...% of ………………….. sold to ……………….Oil company and changed over time by __________%
b………% of ……………………sold to ……………….Oil company and changed over time by __________%
c………% of………….…………sold to ……………….Oil company and changed over time by _________%

80
d………% of………….…………sold to ……………….Oil company and changed over time by _________%
62 (a) Do you have long term business relationships with your buyers? Yes ( ) No ( ) I f yes, how long? ……….
63 (a) Was your company in operation before the privatisation period? Yes ( ) No ( )
(b) If yes, how has the business environment changed? (explain)………………………………………
………………………………………………………………………………………………………………………
© How has your company responded to such changes? (explain) ……………………………………….
............................................................................................................. .......................................................................
64 (a) Are you aware of the Local Content Policy (LCP) of government aimed at promoting participation of indigenous firm in the oil industry? Yes ( ) No (
)
(b) If yes, is it easier to get contract from the oil firms under the LCP than before its introduction? (Explain) ………………………………..
……..………………………………………………………..……………………… .
………………………………………………………..…………………………………………………………………
(b) If No, why are you unable to set up your firm before LCP? (Explain) …………………………. ………………………………..
……..……………………………………… ………………………………….
……………………………………………………………………………………………………………………..
66 (a) How has your company been affected by increased demand deriving from large investment in the Oil and gas sector in the past decade? (explain )
……………………….................................................................................................................... ...........
(b) How has your company responded to such changes? (explain) ……………………………………………………
………………………………………………………….………………………………………………………….……
67 How did your buyers start trusting your abilities as a supplier? (Can tick as many as possible)
a They did a preliminary audit before committing to us ( )
b They relied on our previous reputation/trajectory ( )
c They trusted us after working together for a long time ( )
d We had certifications (quality, environmental and social) ( )
e We were recommended by other firms ( )
f Others (please explain) ……………………………………………………………………………………
Critical success factors
68 What emphasis do your main buyers place on the following?
Rating: 1=not important to 5=Highly important;
Price competitiveness
Good quality
Capacity to produce volumes requested
Flexibility (small batches, quick changes in production lines)
Speed delivery
Reliable delivery
Capacity to learn and keep up with innovation
Trust
69 How do you rate your own performance in terms of meeting these requirements?
Rating: 1 (not meeting requirements) → 5 (fully meeting requirements)
Price competitiveness
Good quality
Capacity to produce volumes requested
Flexibility (small batches, quick changes in production lines)
Speed delivery
Reliable delivery
Capacity to learn and keep up with innovation

81
Trust
70 Do different Oil and Gas firms have different expectations on your products? Yes ( ) No ( )
71 Do they have different ways to do business or interact with you? Yes ( ) No ( ) Please explain your
position……………………………………………………………………………………. …………………………
72 Is there any difference in the way you do business with small Oil and Gas firms and with large ones?
Yes ( ) No ( ) Please explain your position ………………………………………………………………….
…………………………………………………………………………………………………………………………
73 (a) Are you aware of the International Finance Corporation (IFC) suppliers‟ development programme?
Yes ( ) No ( )
(b) If yes, have you benefited? And how has this programme helped you in improving your competitiveness?
……………………………………………………………………………………………………………………………
…………………………………………………………………………………………………………………………………………………………………………
………………………………………………………………………………
74 (a) Do you think the big oil and gas firms (particularly the multinationals) are promoting the emergence and development of local firms serving the oil and gas
industry in Nigeria? Yes ( ) NO ( )
(b) If yes, how? (Mention their promotional programmes)
…………………………………………………………………………………………………………………………………………………………………………
…………………………………………………………………………………………………………………………………………………………………………
………………………………………………………………………………………………………………………………………………………………
(c) If No, how? (Explain)
…………………………………………………………………………………………………………………………………………………………………………
………………………………………………………………………………
External standards
75 (a) Are there technical regulations you have to comply with (ISO 14000, ISO 9000)? Yes ( ) No ( )
(b) Are you certified? Yes ( ) No ( )
© Where did the pressure to comply come from? ………………………………………………………
(d) Who provides testing facilities? ………………………………………………………………………
(e) Do all your buyers require these certificates? Yes ( ) No ( ) Please explain your case
…………………………………………………………………………………………………………………………………………………………………………
………………………………………………
(f) Have you received any assistance in meeting the requirement for certification? Yes ( ) No ( )
And From whom? ………………………………………………………………………………………
(g) Has certification raised your firm competitiveness? Yes ( ) No ( )

82
(h) How are you penalised in the unlikely case of your products being below
standards?................................................................................................................... ................................
……………………………………………………………………………………………………………..
Upgrading
76 (a) In your judgement, what is your firm doing very well that other firms find difficult to copy or match?
…………………………………………………………………………………………………………………………………………………………………………
………………………………………………………………………………
76 (b) Why do you think other firms in your line of business are unable to participate in the activities in the oil industry? List three major reasons in order of
importance………………………………………………………………….
……………………………………………………………………………………………………………………………………………………………
….
77 Could you take up more functions beyond your primary assignments such as after-sale services or marketing?
Yes ( ) No ( ) Explain..........................................................................................................................................
78 (a) Who are your main competitors? ……………………………………………………………………….
…………………………………………………………………………………………………………………………………………………………………………
…………………………………………………………………………………………………………………………………………………………………………
…………………………………
(b) How is competition affecting you? ……………………………………………………………….
…………………………………………………………………………………………………………………………………………………………………………
………………………………………………
79 Which main innovations have you undertaken in the past 5 years, in order to face competition?
Improving quality of existing products/services ( )
Improving production processes (please specify)
a. Invested in new machineries ( )
b. Improved workers‟ skills ( )
c. Reduced the time of product delivery ( )
d. Introduced/improved a TQM system ( )
e. Introduced new organisational/management techniques ( )
Introducing new products ( )
Undertaking new functions (production/ design/ marketing / servicing) ( )
80 Are you planning any of the above actions in the next future? Yes ( ) No ( )
Clusters
81 In your judgment, has the number of specialised suppliers to the oil and gas industry increased over the past decade?
82 Do you engage in any of the following forms of cooperation with your buyers?
Not at all Sometimes Consistently
1. Information exchange
2. Negotiation of payment and delivery conditions
3. Joint product development
4. Increase in cooperation for product quality improvement
5. Actions to improve delivery time
6. Actions to improve delivery reliability
7. Actions for adapting production to smaller / larger batches
8. Change suppliers less than before

83
9. Increase in cooperation in technical upgrading
10. Increase in cooperation in labour training
11. Increase in cooperation in developing quality assurance
system
83 Do you engage in any of the following forms of cooperation with your suppliers?
Not at all Sometimes Consistently
1. Information exchange
2. Joint orders
3. Joint product development
4. Machinery lending
5. Joint sale
6. Joint training
7. Joint purchase
8. Information exchange
9. Joint orders
10. Joint product development
84 (a) Are you a member of any association (in case of fabricators-Nigeria Fabricators Association –such as Nigerian Welders Association, Nigerian Institute of
Welders, Chamber of Oil and gas, Mines, etc)? Yes ( ) No ( )
(b) Name them……………………………………………………………………………………………………………
(c) Have these associations been useful to you? Yes ( ) No ( )
(d) If yes, in what areas? ……………………………………………………………………………………………………
……………………………………………………………………………………………………………………………
Technology
85 (a) Do you access new technologies? Yes ( ) N0 ( ) (b) If yes, how? (Explain) ………………………………
…………………………………………………………………………………………………………………………….
86 (a) Do you have Local innovation/technology agreements with foreign companies? Yes ( ) No ( )
(b) If yes, name the company(s) and the kind of agreements …………………………………………….
…………………………………………………………………………………………………………….
…..……………………………………………………………………………………………………………………………………………………………
………………………………………………………..
87 Where do you source your fixed capital from? ………………………
88 Do you have agreements for upgrading/maintenance? Yes ( ) No ( )
89 Do you have any relationship with local research centres or the university? Yes ( ) No ( )
90 What are the main constraints that limit your access to latest technology?
Skills
91 (a) Can you find an adequate skilled labour? Yes ( ) No ( )
(b) Do you think the situation is changing? Yes ( ) No ( )
© Do you have to employ skilled labour educated/trained abroad? Yes ( ) No ( )
(d) Which share of your skilled labour is non-Nigerian?...............................................

84
92 (a) Do you think the education and training provided by the Government (and private sector) in Nigeria meet your requirements? Yes ( ) No ( )
(b) Are the training and educational programmes provided by the formal institutions (Tertiary education institutions and research centres) relevant to your
business? Yes ( ) No ( )
© If yes, how? (Explain) …………………………….…………………………………………………………………
93 Are you aware of ex-employees who developed expertise with your company and are now engaged in other sectors? Yes ( ) No ( )
94 Are you employing personnel who were previously employed by the Oil companies? Yes ( ) No ( )
Government Policies
95 Which Government Regulations/Policies affect your operation? (can tick as applicable)
a. Ownership Regulations ( ) (b) Labour Market Regulation ( )
© Taxes/tax holidays/duty rebates ( ) (d) Interest rates ( )
(e) Licensing ( ) (f) Environmental regulations ( )
(g) Business registration and start up ( ) (i) Import Tariffs ( )
(j) Other (Specify) ………………………………………………………
96 What is the extent of problems posed by the following to activities of your company?
Highly problematic Just problematic I don‟t know Not so much
problematic
Not problematic at all
Volatility (up and down movement of prices)
High tariffs on imported inputs
Unstable Exchange rate
Sourcing foreign exchange from the black market
level of black market exchange rate
Adequacy of Investment incentives
Domestic regulations on my business
Fairness, openness and transparency of
government regulation
Others (specify)
97 How consistent are the government regulations concerning the following? (Please tick as applicable)
Consistent Inconsistent I don‟t know
A. Ownership Regulations
B. Labour Market Regulation
C. Taxes/tax holidays/duty rebates
D. Licensing
E. Import Tariffs
F. Business registration and start –up
G. Other
98 How will you describe the effect of the regulations on your organisation‟s operation
Made operations easier Made operations more difficult Unchanged
A. Ownership Regulations
B. Labour Market Regulation
C. Taxes/tax holidays/duty rebates
D. Licensing
E. Import Tariffs
F. Business registration and start –up
G. Other
99 What would you say are the major constraints/barriers that your firm faces? (Indicate the three most important ones)
1. lack of government assistance in overcoming barriers ( )
2. Competition from firms in foreign market ( )
3. Competition from other local producers ( )
4. Problem of finding reliable suppliers/buyers ( )
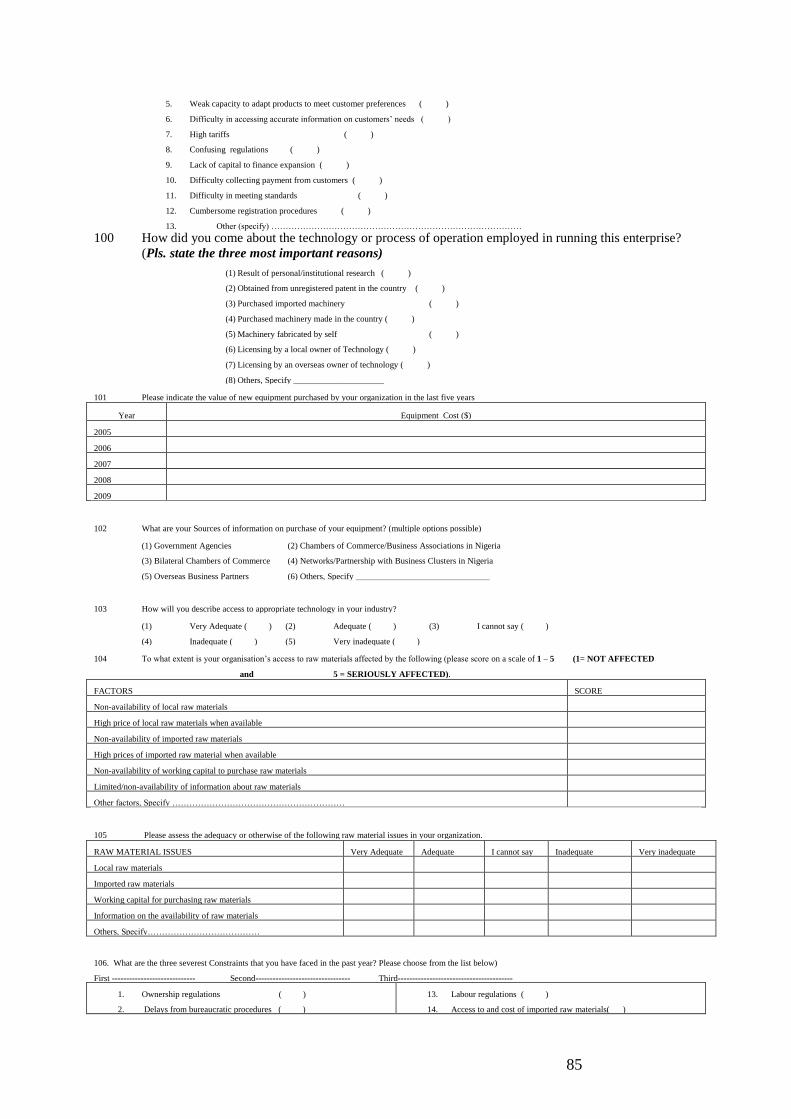
85
5. Weak capacity to adapt products to meet customer preferences ( )
6. Difficulty in accessing accurate information on customers‟ needs ( )
7. High tariffs ( )
8. Confusing regulations ( )
9. Lack of capital to finance expansion ( )
10. Difficulty collecting payment from customers ( )
11. Difficulty in meeting standards ( )
12. Cumbersome registration procedures ( )
13. Other (specify) ……………………………………………………………………………
100 How did you come about the technology or process of operation employed in running this enterprise?
(Pls. state the three most important reasons)
(1) Result of personal/institutional research ( )
(2) Obtained from unregistered patent in the country ( )
(3) Purchased imported machinery ( )
(4) Purchased machinery made in the country ( )
(5) Machinery fabricated by self ( )
(6) Licensing by a local owner of Technology ( )
(7) Licensing by an overseas owner of technology ( )
(8) Others, Specify _____________________
101 Please indicate the value of new equipment purchased by your organization in the last five years
Year Equipment Cost ($)
2005
2006
2007
2008
2009
102 What are your Sources of information on purchase of your equipment? (multiple options possible)
(1) Government Agencies (2) Chambers of Commerce/Business Associations in Nigeria
(3) Bilateral Chambers of Commerce (4) Networks/Partnership with Business Clusters in Nigeria
(5) Overseas Business Partners (6) Others, Specify _______________________________
103 How will you describe access to appropriate technology in your industry?
(1) Very Adequate ( ) (2) Adequate ( ) (3) I cannot say ( )
(4) Inadequate ( ) (5) Very inadequate ( )
104 To what extent is your organisation‟s access to raw materials affected by the following (please score on a scale of 1 – 5 (1= NOT AFFECTED
and 5 = SERIOUSLY AFFECTED).
FACTORS SCORE
Non-availability of local raw materials
High price of local raw materials when available
Non-availability of imported raw materials
High prices of imported raw material when available
Non-availability of working capital to purchase raw materials
Limited/non-availability of information about raw materials
Other factors, Specify ……………………………………………………
105 Please assess the adequacy or otherwise of the following raw material issues in your organization.
RAW MATERIAL ISSUES Very Adequate Adequate I cannot say Inadequate Very inadequate
Local raw materials
Imported raw materials
Working capital for purchasing raw materials
Information on the availability of raw materials
Others, Specify…………………………………
106. What are the three severest Constraints that you have faced in the past year? Please choose from the list below)
First ----------------------------- Second--------------------------------- Third----------------------------------------
1. Ownership regulations ( )
2. Delays from bureaucratic procedures ( )
13. Labour regulations ( )
14. Access to and cost of imported raw materials( )

86
3. High Taxes ( )
4. Competition from imports ( )
5. High interest rates ( )
6. Price controls ( )
7. Government licensing restrictions ( )
8. Lack of infrastructure ( )
9. Inflation ( )
10. Competition from local firms ( )
11. Insufficient demand ( )
12. Lack of business support services ( )
15. access to foreign exchange ( )
16. Access to and cost of Domestic raw materials ( )
17. Difficulty in obtaining licenses ( )
18. Utility Prices ( )
19. High exchange rates ( )
20. Uncertainty about government policies ( )
21. Lack of skilled labour ( )
22. Trade Liberalization ( )
23. Corruption ( )
24. Others, Specify ………………………………….
107 (a) Do you serve other sectors of the economy?
(b) If yes, which sectors? …………………………………..
(c) What do you do for each other sectors you serve?
Specify……………………………………………………………………………………………………………………………………………………….…………
………………………………………………………………………………
108
(a) Are there environmental consequences of your actions?
(b) If yes, what are they? .................................................................................................. ..............................................
(c) How do you manage them? .......................................................................................................................................
............................................................................................................................. ....................................................................................................................................
.........................................................................................................................
109
The nature and role played by regional neighbours where alternative is sought
(1) Are you working for oil companies in the neighbouring West African countries? Yes ( ) No ( )
(2) Are you partnering with the counterpart in your line of business in the neighbouring West African countries?
Yes ( ) No ( )
(3) Are you losing trainees or masters in your company to those firms in the neighbouring West African countries? Yes ( ) No ( )
(4) Do you associate with activities in the oil sectors of neighbouring firms? Yes ( ) No ( )
(5) Do you benefit in any form from such associations? Yes ( ) No ( )
(6) What are the benefits……………………………………………………………………………………………….
…………………………………………………………………………………………………………………………………………………………………
…………………………………………………………………………………………………………………………………………………………………
…………………………………

87
Making the Most of Commodity Programme
(MMCP)
University of Cape Town in Collaboration with the University of Ibadan
ENHANCING OIL SECTOR LINKAGES STUDY
QUESTIONNAIRE for Oil Firms
INTRODUCTION
Good day. My name is __________________from_________________________. We are carrying out a study on Enhancing Oil sector linkages in the Nigerian Economy.
The end goal of this study is to identify the constraints hindering effective linkages of the oil sector in the Nigerian Economy and offer policy options for removing these
constraints. We will use your experiences, views and ideas to advise policy makers and stakeholders on how best they can address the problems hindering oil sector linkages
in the Nigerian Economy. We very much appreciate your participation in this study. I want to assure you that whatever information you provide will be kept strictly
confidential and will be used for capacity development purposes only.
This interview will take about 30 minutes to one hour. This questionnaire is strictly for academic and research purposes
A. IDENTIFICATION
Questionnaire number ___________________________________________________________________
State ________________________________________________________________
Location town/city ________________________________________________________________
Date(s) of interview ________________________________________________________________
Number of visits ________________________________________________________________
Length of interview ________________________________________________________________
Name of Field Officer ________________________________________________________________
Name of Supervisor _______________________________________________________________
Data Collection by Field editing by Office editing by Data entry by
Name of personnel
Date

88
Study on Enhancing Oil sector Linkages in Nigeria
Quantitative Study Tool
B. GENERAL INFORMATION
1. Name of the Company:
2. Address:
3. Contact Name:
4. Position:
5. Telephone number………………………… 6. Fax Number …………………………………..
7. Email address……………………………… 8. Website Address of the Company………………
9a. Date of Establishment: ______________________________________________________________
9b. Year of Registration with government: __________________________________________________
10a. Is the company Listed? Yes ( ) 10b. If Yes, when ……………………………………..
11. What is the nationality of the owner(s) of the company?
1) Nationals only ( )
2) Multinational Company ( )
3) State owned Enterprises ( )
4) Joint ventures by nationals and foreigners ( ) State the proportion of foreign ownership……
12. Nature of Enterprise
1) Sole proprietorship ( )
2) Partnership ( )
3) Limited Company ( )
4) Limited Liability Company (Plc) ( )
5) Government company/Corporation ( )
13. Gender of Major owner (with controlling shareholding) (1) Male ( ) (2) Female ( )
(3) Not applicable
14. Age of major owner (with controlling shareholding): _______________________ Years
15. Highest level of Education of major owner
(1) None ( ) (2) Primary ( ) (3) Secondary (“0” and “A” Levels) ( ) (4) Diploma ( )
(5) University Degree and Postgraduate ( )
16. Please indicate the previous experience of the major owner from the following
Years of Experience
No experience
Apprentice
Trading activities in the industry
Others (Please Specify) ……………………………..
17. Sector of activity and main Products
s/n Sector of Activity Main Products

89
1
2
3
4
C. BUSINESS CLIMATE
18. How could you describe the cost of getting access to the following infrastructure? (Please tick as appropriate)
Infrastructure Very affordable Affordable I cannot say Not affordable Highly not
affordable
Public Power Supply/Electricity
Water Supply
Telephone and Communication
Internet services
Transportation
Other Infrastructure (please specify)……………………..
19. How would you describe the cost of Monthly bill or service charge for the following infrastructure? (Please tick as appropriate)
Infrastructure Very affordable Affordable I cannot say Not affordable Highly not
affordable
Public Power Supply/Electricity
Water Supply
Telephone and Communication
Internet services
Transportation
Other Infrastructure (please specify)……………………..
20. How would you describe the Performance of the following infrastructure? Please tick as appropriate)
Infrastructure Very adequate Adequate I cannot say Inadequate Very inadequate
Public Power Supply/Electricity
Water Supply
Telephone and Communication

90
Internet services
Transportation
Other Infrastructure (please specify)……………………..
21(a) Over the last year, would you say the following infrastructural and utility services have…….?
Infrastructure Improved Deteriorated Remained unchanged
Public Power Supply/Electricity
Water Supply
Telephone and Communication
Internet services
Transportation
Other Infrastructure (please specify)……………………..
21(b) What role do you see your company and oil companies play in improving the infrastructure? ………….
………………………………………………………………………………………………….................
…………………………………………………………………………………………………………….
22. What are the main sources of electricity for your organisation?
1. Public electricity supply ( )
2. Solar powered electricity ( )
3. Diesel and petrol powered electric generator ( )
4. Others Specify _______________________________
23. What is the average number of hours without electricity in a day? _________________________
24. What is the average proportion of each source power supply for your organisation?
Year Government supplied electricity Solar powered
electricity
Generator powered electricity Others
Specify
TOTAL
2007 100.0
2008 100.0
2009 100.0
25. Over the last year, would you say that the quality of power supply in the country has ……?
1. Improved significantly ( ) 2. Improved ( ) 4. Deteriorated ( ) 5.Deterorated significantly ( )
3. Remain unchanged ( )
26 What proportion of your production costs is cost of power supply provision?
2005 2006 2007 2008 2009
27 What is the proportion of time that you have electricity outage in the past five year?
2005 2006 2007 2008 2009
Mapping the Value Chain

91
28 (a) Who is in charge of supply management, (a) your office (Tick and state your office…………………………………………………………………….) Or
Headquarter? ( )
(b) What are the principles/rules governing supply management in the company? (Discuss them)
…………………………………………………………………………………………………………………………………………………………………………
…………………………………………………………………………………………………………………………………………………………………………
…………………………………………………………………………………………………………………………………………………………………………
…………………………………
29 (a) Are decisions related to consumables taken to HQ as well? Yes ( ) No ( )
(b) Are you consulted? Yes ( ) No ( )
30 What share of the value of final product (Crude oil) is composed of inputs? ……………………………
31(a) Break down the costs and value of a barrel of crude oil (in US $) as presented in the table below (see the appendix)
Value Chain Economics in the Oil Sector
Oil activities Cost (US$ per barrel) Value added (US$ per barrel) % value added
Exploration
Production
Transportation
Refining
Distribution
Marketing
Sub-total cost/value
Taxes and Companies net margin
Total value
31(b) Break down the costs and value component of exploration activities in the production of a barrel of crude oil (in US $) as presented in the table below
Value Chain Economics in the Oil Sector
Oil activity Cost (US$ per barrel) Value added (US$ per barrel) % value added
Exploration activities (the figure given in table 1
above)
Distribution by sub-activities
(1)
(2)
(3)

92
(4)
(5)
(6)
Total value
31(c) Break down the costs and value component of exploration activities of a barrel of crude oil (in US $) as presented in the table below
Value Chain Economics in the Oil Sector
Oil activity Cost (US$ per barrel) Value added (US$ per barrel) % value added
Production activities (the figure given in table 1
above)
Distribution by sub-activities
(1)
(2)
(3)
(4)
(5)
(6)
Total value
31(d) Gasoline Cost Components
Component $/B Cents/Gallon Percent of Pump Price
Crude Oil
Operating Costs
Taxes
Company Net Margins
Total
31(e) Please provide any other useful information on the value chain analysis of the oil sector
32 (a) What share of your local procurement of goods is purchased from local firms? ……………………..
(b) What share of your local services activities (repair and maintenance, specialised services, etc) is done by local firms?
……………………………………………………….
(c) List main products (goods and services) obtained from local firms by the names of firms

93
Good (or services) A……………………………………local firm‟s name ……………………………...
Good B…………….……………………………………local firm‟s name ……………………………...
Good C…………….……………………………………local firm‟s name ……………………………...
Good D…………….……………………………………local firm‟s name ……………………………...
Good E…………….……………………………………local firm‟s name ……………………………...
Others…………………………………………………………………………………………………………………………………………………………………
……………………………………………………………………………………. (for examples, equipment, spares, consumables such as tools, cloths, food,
repair and maintenance, specialised services etc)
(d) Good A (above)%___________bought from local business and %___________Change over time
Good B (above)%___________bought from local business and %___________Change over time
Good C (above)%___________bought from local business and %___________Change over time
Good D (above)%___________bought from local business and %___________Change over time
Good E (above)%___________bought from local business and %___________Change over time
33 What share of your final good is purchased by local businesses? ………………………………………..
(b) List main products (goods and services) sold to local firms by the names of firms
Good (or services) A……………………………………local firm‟s name ……………………………...
Good B…………….……………………………………local firm‟s name ……………………………...
Good C…………….……………………………………local firm‟s name ……………………………...
Good D…………….……………………………………local firm‟s name ……………………………...
Good E…………….……………………………………local firm‟s name ……………………………...
Others……………………………………………………………………………………………………...
Critical success factors
34 What emphasis do you place, as a buyer, on the following factors when dealing with suppliers?
Rating: 1 (not important) 5 (very important)
Price competitiveness
Good quality
Capacity to produce volumes requested
Flexibility (small batches, quick changes in production lines)
Speed delivery
Reliable delivery
Capacity to learn and keep up with innovation
Trust
35 Based on your experience in the market, how do you rate your suppliers‟ performance in terms of meeting these requirements?
Rating: 1 (not meeting requirements) → 5 (fully meeting requirements)
Price competitiveness
Good quality
Capacity to produce volumes requested
Flexibility (small batches, quick changes in production lines)
Speed delivery
Reliable delivery
Capacity to learn and keep up with innovation
Trust
36 How has the economic crisis changed your supply management?

94
…………………………………………………………………………………………………………………………………………………………………………
…………………………………………………………………………………………………………………………………………………………………………
………………………………………………………………………………………………
External standards
37 (a) Which standards your suppliers must comply with (e.g. ISO 14000, ISO 9000)?
…………………………………………………………………………………………………………………………………………………………………………
…………………………………………………………………………………………………………………………………………….
38 (b) Have you provided any assistance in meeting these requirements? Yes ( ) No ( )
(c) If you assist your suppliers with compliance, how? (Explain what you do) ………………………….
…………………………………………………………………………………………………………………………………………………………………………
…………………………………………………………………………………………………………………………………………………………….
(d) If suppliers fail to meet any of the factors or standards mentioned above, (a) do you assist them with compliance? ( ) or do you switch to other suppliers? (
)
(e) Are there other rules suppliers have to comply with? Electronic industry codes of conduct EITT (please indicate)
…………………………………………………………………………………………
…………………………………………………………………………………………………………………………………………………………………………
…………………………………………………………………………………………………………………………………………………………………………
………………………………………………………………………
Suppliers‟ development
39 What are the main problems in sourcing locally? (a) Low quality products ( ) (b) disappointment in timely delivery ( ) (c) non-existence of local firms to deal
with ( ) (d) previous bad experience ( ) (e) Others specify …………………………………………………………………………………………
…………………………………………………………………………………………………………………………………………………………………………
………………………………………………
40 (a) Is there any element of additional „hassle‟ in dealing with local suppliers compared to foreign suppliers? Yes ( ) No ( )
(b) If yes, what is the element of additional „hassle‟? ……………………………………………………
…………………………………………………………………………………………………………………………………………………………………………
…………………………………………….
41 (a) Do you have a strategy for supply development for local business? Yes ( ) No ( )
(b) If yes, discuss the strategy (please elaborate) …………………………………………………………
…………………………………………………………………………………………………………………………………………………………………………
…………………………………………………………………………………………………………………………………………………………………………
…………………………………………………………………………………………………………………………………………………………………………
…………..
42 (a) Have you participated in the IFC suppliers‟ development programme? Yes ( ) No ( )
(b) If yes, how has this programme increased your ability to source locally? (Explain) …………………
……………………………………………………………………………………………………………..
43 If you were to consider increasing supply from local business, which suppliers‟ category would you prioritise? Please explain reasons?

95
- Specialised services, such as engineering services
- Fabrication and construction
- Well construction and completion
- Control system and ICT
- OEMS
- Component manufacturers
- Agents and distributors
- Others specify …………………………………………………………………………………………….
Clusters
44 In your judgment, has the number of specialised suppliers to the oil industry increased over the past decade? Yes ( ) No ( ) Please explain
………………………………………………………
45 In the relationship with your suppliers, do you engage in any of the following forms of cooperation?
Not at all Sometimes Consistently
Information exchange
Negotiation of payment and delivery conditions
Joint product development
Increase in cooperation for product quality improvement
Actions to improve delivery time
Actions to improve delivery reliability
Actions for adapting production to smaller / larger batches
Change suppliers less than before
Increase in cooperation in technical upgrading
Increase in cooperation in labour training
Increase in cooperation in developing quality assurance system
46 Does your firm keep any type of relationship with firms that provide inputs to your suppliers? Yes ( ) No ( ) Or suppliers manage their own supply chain
without your help? Yes ( ) No ( )
47 (a) Is your firm a member of any association (Chamber of oil and gas, Mines, etc)? Yes ( ) No ( )
(b) Have these associations been useful to you? Yes ( ) No ( )
Skills
48 (a) Can you find an adequate skilled labour? Yes ( ) No ( )
(b) Do you think the situation is changing? Yes ( ) No ( )
(c) Do you have to employ skilled labour educated/trained abroad? Yes ( ) No ( )
(d) Which share of your skilled labour is non-Nigerian?..................................................................
(e) Do you think the education and skills training provided by the Government (and private sector) meet your requirements? Yes ( ) No ( )
(Please explain your position)………………………………………………………………….
…………………………….……………………………………………………………………………….
(f) Are you aware of ex-employees who developed expertise with your company and are now engaged in other sectors? Yes ( ) No ( )
(g) Are you employing personnel who were previously employed by suppliers? Yes ( ) No ( )