Enhancing human performance in ship operations by ... · Enhancing human performance in ship...
19
This is an electronic reprint of the original article. This reprint may differ from the original in pagination and typographic detail. Powered by TCPDF (www.tcpdf.org) This material is protected by copyright and other intellectual property rights, and duplication or sale of all or part of any of the repository collections is not permitted, except that material may be duplicated by you for your research use or educational purposes in electronic or print form. You must obtain permission for any other use. Electronic or print copies may not be offered, whether for sale or otherwise to anyone who is not an authorised user. Montewka, Jakub; Goerlandt, Floris; Innes-Jones, Gemma; Owen, Douglas; Hifi, Yasmine; Puisa, Romanas Enhancing human performance in ship operations by modifying global design factors at the design stage Published in: Reliability Engineering and System Safety DOI: 10.1016/j.ress.2016.11.009 Published: 01/03/2017 Document Version Publisher's PDF, also known as Version of record Please cite the original version: Montewka, J., Goerlandt, F., Innes-Jones, G., Owen, D., Hifi, Y., & Puisa, R. (2017). Enhancing human performance in ship operations by modifying global design factors at the design stage. Reliability Engineering and System Safety, 159, 283-300. https://doi.org/10.1016/j.ress.2016.11.009
Transcript of Enhancing human performance in ship operations by ... · Enhancing human performance in ship...

This is an electronic reprint of the original article.This reprint may differ from the original in pagination and typographic detail.
Powered by TCPDF (www.tcpdf.org)
This material is protected by copyright and other intellectual property rights, and duplication or sale of all or part of any of the repository collections is not permitted, except that material may be duplicated by you for your research use or educational purposes in electronic or print form. You must obtain permission for any other use. Electronic or print copies may not be offered, whether for sale or otherwise to anyone who is not an authorised user.
Montewka, Jakub; Goerlandt, Floris; Innes-Jones, Gemma; Owen, Douglas; Hifi, Yasmine;Puisa, RomanasEnhancing human performance in ship operations by modifying global design factors at thedesign stage
Published in:Reliability Engineering and System Safety
DOI:10.1016/j.ress.2016.11.009
Published: 01/03/2017
Document VersionPublisher's PDF, also known as Version of record
Please cite the original version:Montewka, J., Goerlandt, F., Innes-Jones, G., Owen, D., Hifi, Y., & Puisa, R. (2017). Enhancing humanperformance in ship operations by modifying global design factors at the design stage. Reliability Engineeringand System Safety, 159, 283-300. https://doi.org/10.1016/j.ress.2016.11.009

Contents lists available at ScienceDirect
Reliability Engineering and System Safety
journal homepage: www.elsevier.com/locate/ress
Enhancing human performance in ship operations by modifying globaldesign factors at the design stage
Jakub Montewkaa,b,c,⁎, Floris Goerlandta, Gemma Innes-Jonesd, Douglas Owend, Yasmine Hifie,Romanas Puisae
a Aalto University, Department of Applied Mechanics, Marine Technology, Research Group on Maritime Risk and Safety, 02150 Espoo, Finlandb Finnish Geospatial Research Institute, 02430 Masala, Finlandc Gdynia Maritime University, Faculty of Navigation, Department of Transport and Logistics, 81-225 Gdynia, Polandd Lloyd's Register, EMEA, Bristol, UKe Brookes Bell R &D, Glasgow, UK
A R T I C L E I N F O
Keywords:Human performanceShip designCollisionGroundingBayesian Belief Networks
A B S T R A C T
Usually the improvements of human performance in the course of ship design process is carried out bymodifying local ergonomics, like electronic visualisation and information display systems on the bridge or in theengine control room, stair or hatch covers design. However, the effect of global design factors (GDFs), such asship motion, whole body vibration and noise, on human performance has not been given attention before. Suchknowledge would allow the improvements of human performance by effective design modification on very earlystage of ship design process.
Therefore, in this paper we introduce probabilistic models linking the effect of GDFs with the humanperformance suitable for ship design process. As a theoretical basis for modelling human performance theconcept of Attention Management is utilized, which combines the theories described by Dynamic AdaptabilityModel, Cognitive Control Model and Malleable Attentional Resources Theory.
Since the analysed field is characterised by a high degree of uncertainty, we adopt a specific modellingtechnique along with a validation framework that allows uncertainty treatment and helps the potential end-users to gain confidence in the models and the results that they yield. The proposed models are developed withthe use Bayesian Belief Networks, which allows systematic translation of the available background knowledgeinto a coherent network and the uncertainty assessment and treatment.
The obtained results are promising as the models are responsive to changes in the GDF nodes as expected.The models may be used as intended by naval architects and vessel designers, to facilitate risk-based shipdesign.
1. Introduction
Reduced human performance is reported as one of major factorscontributing to the maritime accidents, [1–4]. In the recent years thestudies related to the quantification of human performance for variousshipborne operations have been gaining an increasing attention,resulting in a number of models and approaches, see for example [5–8] . At the same time, significant efforts have been made to study andimplement local design modifications of ships improving the ergo-nomics thus human performance on board a ship and ultimately shipsafety, [9–13].
A major recent advance in the field of maritime safety is thedevelopment of risk-based ship design methodology (RBSD), resultingin development of larger and potentially safer ships, [14,15]. Within
RSBD the assessment of the risk level with respect to predefined typesof accidents is conducted in the early design stage, where a designmodification is easy and cost-effective and risk is treated as a designobjective, [12]. In risk analysis two aspects of the analysed accident arecovered, its likelihood (accident prevention) and the anticipatedconsequences (accident mitigation). The latter is addressed by improv-ing technical and structural reliability of a ship and it has beenextensively studied over past years, [16–20]. The former is addressedusually by improving performance of a human, however the researchon the effect of the overall ship design on human performance is in itsinfancy, [21–24], despite its relevance to the field of ship design, [25].Such a method could be incorporated into the RBSD, improving humanperformance through modification of appropriate global design factors(GDFs), thus reducing the risk of accidents already at the early design
http://dx.doi.org/10.1016/j.ress.2016.11.009Received 9 February 2016; Received in revised form 26 August 2016; Accepted 17 November 2016
⁎ Corresponding author at: Aalto University, Department of Applied Mechanics, Marine Technology, Research Group on Maritime Risk and Safety, 02150 Espoo, Finland.
Reliability Engineering and System Safety 159 (2017) 283–300
Available online 23 November 20160951-8320/ © 2016 The Authors. Published by Elsevier Ltd. This is an open access article under the CC BY license (http://creativecommons.org/licenses/BY/4.0/).
MARK

stage.However, the possible risk reduction remains unknown until now,
since the common human error quantification frameworks do notreadily account for the specific effect of the GDFs.
Therefore, this paper presents advances, focusing on modelling theeffect of GDFs on human performance which is measured with theprobability of ship-ship collision and ship grounding, which in turn is arecognized proxy for risk in the RBSD process and can easily beincorporated therein.
As a results of extensive literature survey on the effects of humanexposure to the following three GDFs: ship motion, noise and vibra-tion see [24–26] a workable approach has emerged for modellinghuman performance focussing on attention management, which isfound suitable for the given purpose. It is based on three theories: theDynamic Adaptability Model, [29] Cognitive Control Model [30] andMalleable Attentional Resources Theory [31].
These foundations are used as a guide for constructing two modelspresented here, which are developed using Bayesian Belief Networks(BBNs). BBNs is capable of representing background knowledge aboutthe analysed accidents, the evaluation of associated uncertainties,efficient reasoning and updating in light of new evidence, see forexample [6,32–37].
Finally the models are validated adopting a framework as proposedby [38], which is found suitable for a given purpose, [39]. Theframework allows for rigorous checks of the models along with theevaluation of uncertainty. As result, the models are found to behave in
response to GDF inputs as intended, and the obtained results are foundvalid for a given purpose. The models can offer a valid comparativeassessment of ship designs with respect to human performance, whichis their primary intention.
The remainder of the paper is organized as follows: Section 2introduces the modelling framework, upon which the human perfor-mance models are developed. The models development process ispresented in Section 3. Section 4 discusses the validation of the modelsand Section 5 concludes the paper.
2. Structure of the models
The aim of the presented models is two-fold. First they quantify thehuman performance in the presence of motion, noise and whole bodyvibration that are specific for each ship designs. Second they allowdifferentiation of various ship designs with respect to the humanperformance.
In this section we introduce a modelling framework adopted herethat fits requirements of RBSD and recommendations by IMO regard-ing human performance modelling in maritime [40]. Subsequently thecausal pathway linking the GDFs with human performance is de-scribed.
2.1. Modelling framework
To develop the models we adopt a generic modelling framework by
Fig. 1. A modelling framework adopted for human performance evaluation subjected to GDFs, suitable for risk-informed ship design.
Nomenclature
AMC Attention Management CapabilityAH Alternative HypothesisBBN Bayesian Belief NetworksCCM Cognitive Control ModelDAAct a triplet of Detection, Assessment, ActionAPOA Assessed Proportion of AffectDAM Dynamic Adaptability ModelEPC Error Producing ConditionsGDFs Global Design Factors (noise, whole body vibration,
motion)
GTT Generic Task TypeHEP Human Error ProbabilityHRA Human Reliability AssessmentMART Malleable Attentional Resources TheoryMII Motion Induced InterruptionsMIS Motion Induced SicknessNARA Nuclear Action Reliability AssessmentOOW Officer Of the WatchRBSD Risk-Based Ship DesignSCT Safety Critical TasksWBV Whole Body Vibration
J. Montewka et al. Reliability Engineering and System Safety 159 (2017) 283–300
284

[41], with modification, as depicted in Fig. 1. The framework aims to:
• integrate in systematic way the available background knowledge onthe subject of the analysis,
• provide sound basis for the procedure of human performanceassessment subjected to GDFs
• account for the existing uncertainty by determining its bound for themodels,
• validate the developed probabilistic models,
• facilitate the decision making process.
The relevant data, theories, models and expert's judgment isobtained and gathered into a workable model, mimicking the describedphenomenon. Since the level of available background knowledgesignificantly varies across the models, the modelling choice has toreflect on that, being able to:
• account for the uncertainty,
• propagate it through the model,
• infer in the presence of uncertainty,
Considering the above, we use probabilistic casual models, aka.Bayesian Belief Networks, as a modelling technique. BBNs is recog-nized tool for reasoning under uncertainty, linking various types ofdata into one whole for the wide uncertainty assessment and treatment.Within the BBNs the uncertainty is measured through the probabilities,and propagated through the model with the use of Bayesian Theory.The inherent feature of BBNs, two-ways reasoning, allows not onlyforward propagation of the evidences resulting in an outcome, but it isalso possible to propagate backwards the evidences to estimate themost probable input variables, given a selected state of the output. Thehigh-level modelling framework adopted here is depicted in Fig. 1 andelaborated in the following sections.
2.2. Linking the effects of GDFs with human performance
To describe the process through which exposure to GDFs causallyaffects the performance of a crew member in relation to specificoperations (collision avoidance, grounding avoidance, tasks related tomaintenance of ship technical systems) a causal pathway was devel-oped through the mediating agent of the crewmember. The processserves to do three things:
1. Represent the mechanism by which GDFs exposure impacts humanperformance in operations.
2. Describe the overall topography of the final model.3. Facilitate the identification of nodes.
GDFs can be considered a type of performance shaping factors(PSF), where PSFs are an aspect of the human's individual character-istics, environment, organisation, or task that specifically decrementsor improves human performance, thus increasing or decreasing thelikelihood of human error respectively, [42]. While there are manyother PSFs that can affect human behaviour – for instance training,experience, competence, time available, workload, job design, man-ning, ergonomics of the equipment and procedures - these are excludedfrom the models as they are not affected by exposure to GDFs. All theexcluded PSFs are implicitly assumed to remain constant within themodel.
Other potentially relevant factors, which are not considered, are thelong terms effects of GDFs on the crew performance. For example, wedo not consider the hearing loss due to long-term noise exposure eitherindividually or in combination with other GDFs effects. In practicalterms only the effect of GDFs-affected human performance on thepossible occurrence of collision and grounding in combination with thesafety critical task (SCT) being performed are considered.
In the models the inputs and outputs are predetermined. The GDFsform the three inputs: ship motion, noise and whole body vibration(WBV). The unwanted outcomes form an output: the probability of anaccident. The latter is chosen as a measure of human performance inSCT related to accident avoidance; since it is commonly accepted andwidely used metric in the maritime domain thus it could be easilyimplemented in the RBSD process.
In reality, crew exposure to GDFs is likely to result in a plethora ofeffects on human performance and subsequent outcomes. However, toremain within the scope of our study the causal representation islimited to describing only those mechanisms that can describe therelationships between the predetermined inputs and outputs, asdepicted in Fig. 2.
Two main paths linking GDFs exposure to human behaviour havebeen identified:
• Path 1: Stressor effects. Exposure to a GDF acts as a stressor and canaffect the perceptual, cognitive and physical capabilities of anindividual (e.g. attention management), which can subsequentlyimpair the performance of the individual (i.e. the actual behaviourproduced).
• Path 2: Physical effects. Exposure to a GDF can have specific anddirect effects on the behaviour produced. For example, Ship motioncan result in Motion-Induced Interruptions (MII). MII does notaffect the underlying human capabilities of balance or fine motorcontrol, but it exceeds the ability of the human to compensate andproduce the intended behaviour. Similarly, WBV can directly impactthe actual behaviour produced.
These two paths show how GDFs exposure affects human beha-viour, which in turn influences the performance of SCT. It is theoutcomes of an individual's actions and behaviour that determine thesuccess or failure of a SCT. Insufficient performance of the SCT createsan antecedent for the unwanted outcome. The SCT are associated with:
• Maintaining safe vessel navigation thus avoiding collision orgrounding.
• Proper maintenance of technical equipment of a ship, required forperforming accident evasive action.
However, insufficient task performance alone does not determine
Fig. 2. A causal chain describing the relationship between crew, GDF exposure andunwanted outcomes, [43].
J. Montewka et al. Reliability Engineering and System Safety 159 (2017) 283–300
285
whether or not a collision or grounding occurs; the vessel must also beexposed to the collision or grounding hazard, as follows:
• For a collision to occur, another vessel must be on a collision course.
• For a grounding to occur, the ship must be in shallow water.
This causal mechanism makes the following assumptions:
• While we recognise that individuals have differing cognitive andphysical abilities, it is assumed that all individuals have the samebasic set of capabilities (i.e. all individuals can manage theirattention, irrespective of the extent of this capability).
• Human behaviour is influenced by diffuse and acute effects of GDFsexposure as represented by the paths in Fig. 2.
• The crew perform SCT related to collision and grounding and tasksare appropriate, processes and procedures are optimised, and areundertaken by a competent operator.
• SCT must be performed correctly to maintain safe vessel operation.
• In case of bridge team the SCT manage the exposure of the vessel tothe collision and grounding hazard.
• In case of engine room team the SCT manage the ability of atechnical systems of a vessel to respond as requested by the bridgeteam.
• While it is recognized that interaction effects between GDFs withineach pathway are likely to exist, these are excluded from the models,as the literature does not provide any information describing thisinteraction. For the review of the relevant literature the reader isreferred to our earlier work [26,27].
3. Models development
3.1. Background knowledge related to human performance affectedby the GDFs
It was found that the data on the specific GDF effects of ship motion(with the exception of motion induced interruption MII), noise, WBVon human performance are sparse and in many, but not all, casesgenerated under very specific, often non-marine, conditions. Datashows that there is certainly evidence for GDFs having some effecton human performance. However, the direct effects of GDF exposureon human performance tend to be weak, whereas secondary effectsacting through another mechanism (e.g. fatigue, Motion InducedSickness - MIS) tend to be stronger and more pervasive, [44,45].Specifically, there are some data that describe the:
• Impact of GDFs on specific human capabilities, [46].
• Impact of GDFs on specific human behaviours, [47].
• Impact of errors on task performance, [48].
However, there is very little data about the link between thefollowing components:
• Degraded human capabilities and collision or grounding relatedperformance.
• Degraded task performance and exposure to the collision/groundinghazard
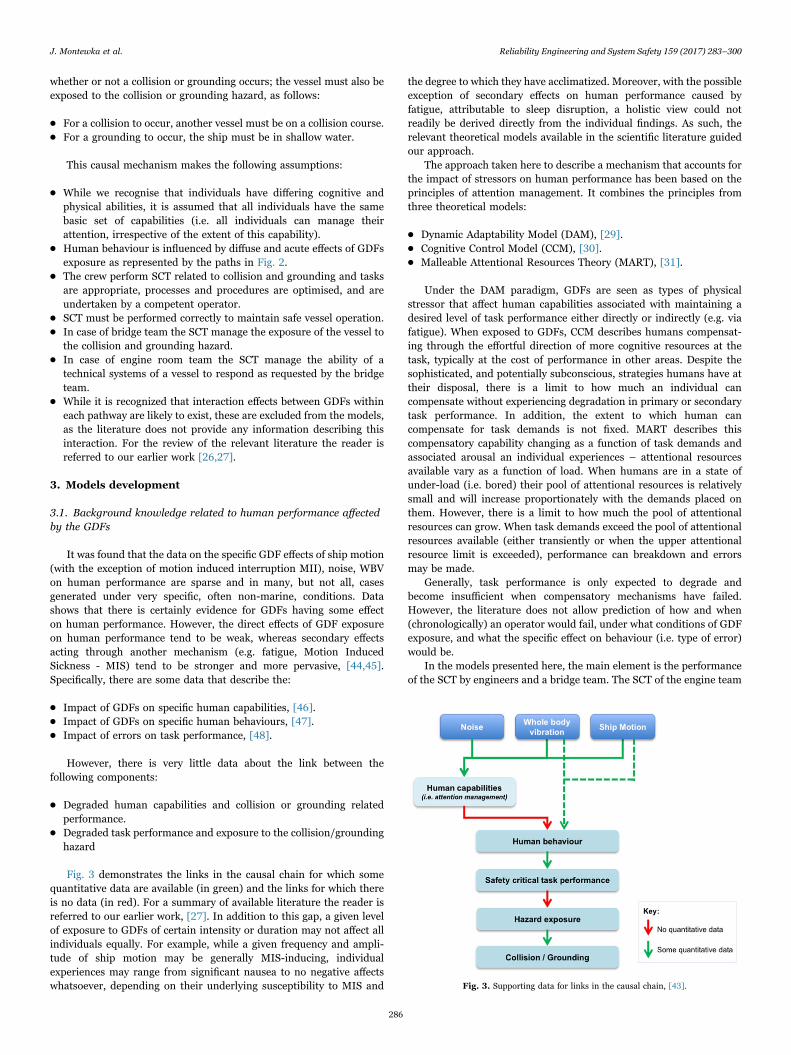
Fig. 3 demonstrates the links in the causal chain for which somequantitative data are available (in green) and the links for which thereis no data (in red). For a summary of available literature the reader isreferred to our earlier work, [27]. In addition to this gap, a given levelof exposure to GDFs of certain intensity or duration may not affect allindividuals equally. For example, while a given frequency and ampli-tude of ship motion may be generally MIS-inducing, individualexperiences may range from significant nausea to no negative affectswhatsoever, depending on their underlying susceptibility to MIS and
the degree to which they have acclimatized. Moreover, with the possibleexception of secondary effects on human performance caused byfatigue, attributable to sleep disruption, a holistic view could notreadily be derived directly from the individual findings. As such, therelevant theoretical models available in the scientific literature guidedour approach.
The approach taken here to describe a mechanism that accounts forthe impact of stressors on human performance has been based on theprinciples of attention management. It combines the principles fromthree theoretical models:
• Dynamic Adaptability Model (DAM), [29].
• Cognitive Control Model (CCM), [30].
• Malleable Attentional Resources Theory (MART), [31].
Under the DAM paradigm, GDFs are seen as types of physicalstressor that affect human capabilities associated with maintaining adesired level of task performance either directly or indirectly (e.g. viafatigue). When exposed to GDFs, CCM describes humans compensat-ing through the effortful direction of more cognitive resources at thetask, typically at the cost of performance in other areas. Despite thesophisticated, and potentially subconscious, strategies humans have attheir disposal, there is a limit to how much an individual cancompensate without experiencing degradation in primary or secondarytask performance. In addition, the extent to which human cancompensate for task demands is not fixed. MART describes thiscompensatory capability changing as a function of task demands andassociated arousal an individual experiences – attentional resourcesavailable vary as a function of load. When humans are in a state ofunder-load (i.e. bored) their pool of attentional resources is relativelysmall and will increase proportionately with the demands placed onthem. However, there is a limit to how much the pool of attentionalresources can grow. When task demands exceed the pool of attentionalresources available (either transiently or when the upper attentionalresource limit is exceeded), performance can breakdown and errorsmay be made.
Generally, task performance is only expected to degrade andbecome insufficient when compensatory mechanisms have failed.However, the literature does not allow prediction of how and when(chronologically) an operator would fail, under what conditions of GDFexposure, and what the specific effect on behaviour (i.e. type of error)would be.
In the models presented here, the main element is the performanceof the SCT by engineers and a bridge team. The SCT of the engine team
Fig. 3. Supporting data for links in the causal chain, [43].
J. Montewka et al. Reliability Engineering and System Safety 159 (2017) 283–300
286

is to maintain the ship systems, ensuring that they function properlywhen needed. This is a simplified description of the effect of GDFs ontechnical failure, through the mediating agent of crewmember. TheSCT of the bridge team is to perform tasks associated with an accidentevasive action. These tasks are complex and distributed in time, thuscan be decomposed into three major phases, [5]: detection (D),assessment (A), action (Act). These three phases (DAAct) reflect thebasic cognitive functions of observation, interpretation and planning,and execution, [49,50].
The performance of various tasks is governed by attention manage-ment, which is the supervisory human capability that directs, allocatesand regulates the attentional resources required for the tasks. Thishigh-level supervisory capability manages lower-level tasks such asperception, cognition, decision-making, memory, fine motor controland locomotion.
To evaluate the effect of GDF exposure on human performance theapproach based on attention management theory is taken. Therein theeffect of GDFs is represented as a stressor that sits either above orbelow the threshold of attentional capacity for any given SCT. If thestressor exceeds the attentional capacity then the attention manage-ment is degraded, whereas no negative effect is expected if the stressorcan be managed within the available attentional capacity.
Representing ship motion, noise and WBV GDFs as stressorsinteracting with an individual's attention management capabilitiesprovides an evidence-based mechanism for human performance thathas been used to develop the models presented here.
3.2. Aggregation of the background knowledge into a model
The GDFs may have either an acute or diffuse effect. In case of anacute effect, the threshold refers to the GDFs level at which anindividual may be unable to physically compensate for GDF exposureand perform actions as intended. In case of diffuse effect, the thresholdrefers to the amount of motion, vibration or noise an individual canendure before it acts as a stressor (with a corresponding stressresponse). The exact value of the threshold will vary between indivi-duals and it is dependent upon previous experience, exposure durationand sensitivity. If the thresholds are not exceeded, then the attention ofa crew-member is not affected, otherwise the attention managementcapability is degraded. It is not yet known what underlying psycholo-gical factors set an individual's baseline tolerance to GDF exposure. Inreality, the overall impact of stressor exposure is likely to be deter-mined by an individual's personal threshold for feeling the effects ofstressor exposure, and the effectiveness of the strategies they adopt formanaging mental resources to preserve task performance (e.g. taskprioritisation and shedding).
Representing GDF exposure effects on safety behaviour via theattention management path provides a structure compatible with theintroduction of an Error Producing Conditions (EPC) using the methodcalled NARA,1 which belongs to the latest (third) generation of thehuman reliability assessment (HRA) methods, and pertains to thenuclear field, [51].
The models begin with the discretization of the GDFs into theclasses, which reflect the available background knowledge in the field.For the review of the effects of GDFs on humans, the reader is referredto earlier work, [27,28]. Based on that discretization, a type of an effectthat the GDF has on a crewmember is determined, namely diffuse oracute along with the thresholds.
The diffuse effect of motion, vibration and noise, as well as the acute
effect of the later is directly affecting the human capabilities of a bridgecrew and the engine team, described by the concept of attentionmanagement. The latter if reduced, increases the probability of humanerror while performing a given type of SCT. If the attention manage-ment remains unaffected, the probability of error stays at its baselinelevel, as obtained from NARA.
Acute effects of all GDFs but noise don’t affect attention manage-ment capability (AMC), but they directly degrade the physical ability ofa crewmember. However, in case of the engine team, this effect is notanticipated, since we assume that the preventive maintenance on shipssystems is not carried out if the levels of GDFs are above thresholds.This is in line with most of the operations guidelines of ships, wherecrews abstain from certain tasks if the weather conditions do not allowfor safe performance of these tasks.
The probability of an error while performing SCT by the bridgeteam (detecting, assessing and acting along with communicating withinthe bridge team) together with the probability of technical failure, dueto erroneous maintenance of critical ship systems by the engine team,yields the probability of not making proper and effective evasive actionwhile on a course leading to an accident.
If the other ship on the collision course does not take appropriateaction either, the collision is inevitable. In case of grounding accident,the lack of action from the ship on a grounding course results in theaccident.
The models are presented in Figs. 4 and 5, and elaborated in detailsin the following sections.
3.3. Quantification of the GDFs and their effect on human capabilities
In the presented models the variables associated with the GDFs areas follows:
• noise (dB),
• vibrations (Hz),
• motion expressed by the accelerations in horizontal and verticalplanes (in RMS g), as well the frequency of vertical motion (in Hz).
The variables are discretised according to the best available back-ground knowledge, summarised in earlier work see [27,28], to reflectvarious effects that the GDFs alone, or with combination, may have ona person.
In the models presented here we assign the equal a prioriprobabilities for the states of GDFs. However, if the models are usedto quantify the human performance associated with a specific shipdesign, these probabilities are updated accordingly to reflect theanticipated behaviour of the designs under evaluation. The discretiza-tion and a’priori probabilities for the GDFs are gathered in tablespresented in Appendix A (Tables A8–A12).
In the models the GDFs affect a person in a binary manner, eitherthey act as a stressor, which degrades the human capability thus humanperformance, or they do not have any effect whatsoever. For the GDFsto become an active stressor their values need to be above threshold.The probabilities of GDFs sitting below or above a threshold, given setof GDFs, are evaluated by the conditional probability tables presentedin the Appendix A (Tables A13–A20). For the summary of relevantbackground knowledge adopted to develop these tables see [27,28].
The quantification of the effect of GDFs stressors on the capabilitiesof human, through the concept of the AMC, is presented in Table 1. Ifthe stressors are active (the GDF sits above the threshold), the AMC isdegraded with the probability of 1. The analogical assumption is madefor the situation where the stressors are inactive.
3.4. Quantification of the human behaviour in the presence of GDFs
3.4.1. Detection, assessment and actionBased on the earlier research, [5,49,50], and rational thought a
1 In recent years, the limitations and shortcomings of the second generation HRAmethods have led to further developments related to the improvement of pre-existingmethods. The only method now defined as third generation is nuclear action reliabilityassessment (NARA) and is, in fact, an advanced version of HEART for the nuclear field.The shortcomings in the second generation, have been the starting point of HRA expertsfor new research and improvement of existing methods, [80].
J. Montewka et al. Reliability Engineering and System Safety 159 (2017) 283–300
287

sequence of SCT related to accident avoidance can be broken down intothree major phases: detection, assessment, action (DAAct). These arelinked with the basic cognitive functions of human such as observation,interpretation and planning, and execution. In the models presentedhere the performance of a human with respect to these functions ismodelled with the use of NARA guidelines and the generic task types(GTT) that it offers. To limit the complexity of the models, a single GTTwas sought to represent all relevant navigational tasks performed bythe OOW that are important in executing collision avoidance and
GDFs and their effects on bridge personell
GDFs and their effects on engine personnel
Human capabilities
Hazard exposure
Human behaviour while performing safety critical tasks
Safety critical task performance
Fig. 4. A model for ship-ship collision accounting for the effect of GDFs.
GDFs and their effects on bridge personell
GDFs and their effects on engine personnel
Human capabilities Human behaviour while performing safety critical tasks
Safety critical task performance
Fig. 5. A model for ship grounding accounting for the effect of GDFs.
Table 1Probability table of the node Attention Management Capability and Attention Manage-ment Capability 2 (Parent node for the former GDF stressor and for the latter GDFstressor technical).
Attention Management Capability - AMC Probability
GDF stressor Active InactiveNormal 0 1Degraded 1 0
J. Montewka et al. Reliability Engineering and System Safety 159 (2017) 283–300
288

navigation in shallow waters. The GTT that is most analogous is, [51]:
Task C1 – Simple response to alarms/indications providing clearindication of situation (Simple diagnosis required) Response mightbe direct execution of simple actions or initiating other actionsseparately assessed. (Nominal HEP =0.0005)
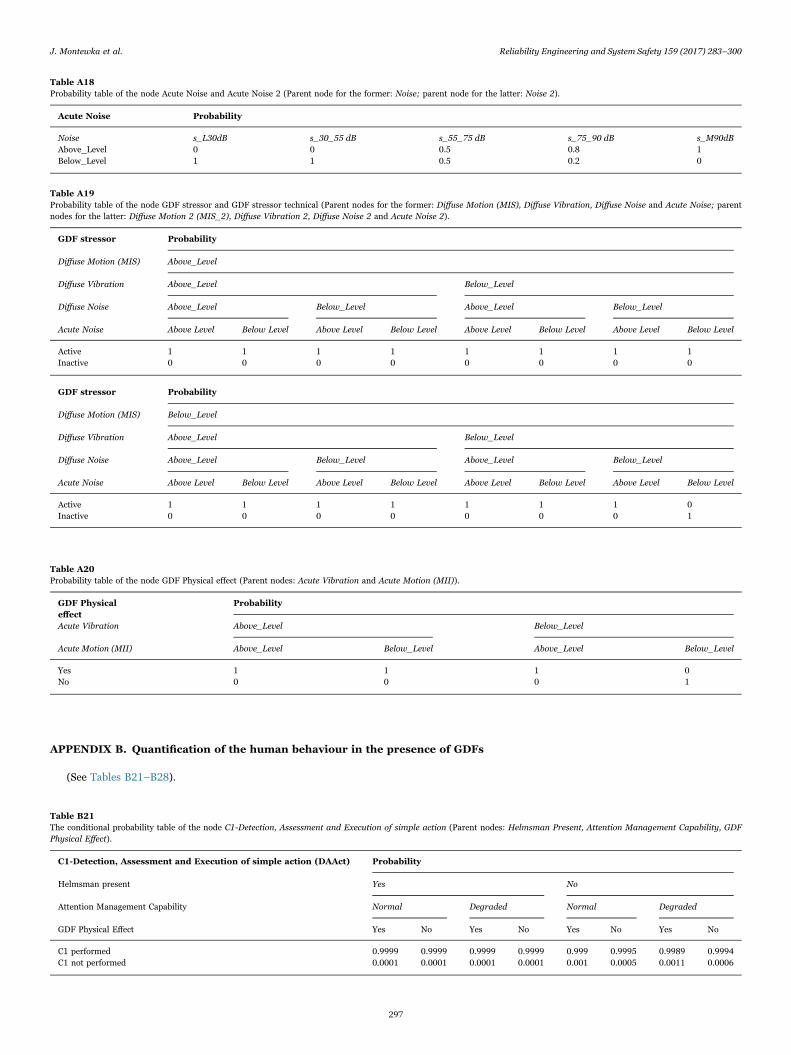
This task refers to the triplet DAAct, and it determines whether ornot the SCT of detection, assessment and actions is performed – whichimplies that it is also sufficient. This is an all-encompassing definitionincluding whatever tasks are required to maintain situational aware-ness and to respond appropriately to avoid collision or grounding. Theprobability of not performing DAAct is calculated based on theintegration of three nodes: Helmsman present, GDF Physical Effectand Attention Management Capability (AMC), as shown in Table B21and depicted in Fig. 4.
In the case of not degraded AMC (AMC=z1) and the absence ofhelmsman (H=h0) we assume very weak physical effect of the GDFs(PE=x1) on not performing the DAAct (DAAct=θ0), as follows:
p DAAct θ H h AMC z PE x( = |( = , = , = )) = 0. 001,0 0 1 1 (1)
However, this effect is represented as being more significant incombination with a degraded AMC (AMC=z0), as follows:
p DAAct θ H h AMC z PE x( = |( = , = , = )) = 0. 0011,0 0 0 1 (2)
Thus representing an additional drain on cognitive resourcescompensating for physical task disruption. These values were estimatedusing judgement. To set the probability of not performing DAAct whena person is not affected by GDF exposure (PE=x0), to reflect a baselineerror rate, the NARA GTT value for Task C1 of 0.0005 is used, asfollows:
p DAAct θ H h AMC z PE x( = |( = , = , = )) = 0. 0005,0 0 1 0 (3)
NARA categorises the factors that negatively influence humanperformance as one of eighteen Error Producing Conditions (EPCs),see Table B28. The EPC that best represented the causal mechanismfrom GDFs exposure to human performance was EPC No. 15 ‘PoorEnvironment’. This EPC represents the stressor effect of GDF exposureon attention management capability. The potential strength of effect ofthis EPC was set using the Assessed Proportion of Affect (APOA)variable. The APOA level was set based on the application of the NARAmethodology to subjectively determine an appropriate value, nominallybetween 0 (no effect) and 1 (maximum effect). However, based on theguidance available for NARA, it was decided to cap the maximumAPOA associated with the EPC to 0.1.
Then using NARA guidelines, given exposure to error producingconditions (EPC) No. 15, the probability of human error (HEP) in theabove mentioned situation of 0.0006 is calculated, see Table B21. ThisHEP corresponds to the probability of not performing DAAct, asfollows:
p DAAct θ H h AMC z PE x( = |( = , = , = )) = 0. 0006,0 0 0 0 (4)
The NARA calculation allows inclusion of multiple EPCs and anExtended Time Factor (ETF). In the models presented here GDFs arerepresented using only one EPC and there is little justification toinclude the ETF. Thus, the HEP is calculated based on the followingformula:
HEP GTT EPC APOA= ∙[( −1)∙( +1)] (5)
3.4.2. Verbal communication on safety critical dataIf evasive manoeuvres are performed with the presence of helms-
man, which requires appropriate communication of information be-tween the OOW and helmsman, the node D1 - verbal communicationof safety critical data is evaluated, as presented in Table B22. Thisnode determines whether or not the verbal communication of safety
critical data to the helmsman required to avoid accident is sufficient. Itrelates to the NARA GTT No. D1 of the same name. This node is passedto its descendant called Evasive Action, where it is used to quantify theprobability of this action differentiating between the situation wherethe helmsman is present or not. The NARA GTT value for Task D1 of0.006 is used to set the probability of insufficient performance (D1=d0)unaffected by GDF exposure (AMC=z1) to reflect a baseline error rate.
p D d AMC z DAAct θ( 1 = |( = , = )) = 0. 006,0 1 1 (6)
The HEP of 0.0072 was calculated using NARA given exposure toEPC No. 15 representing the effect of GDF exposure via AMC(AMC=z0), reflecting the following situation:
p D d AMC z DAAct θ( 1 = |( = , = )) = 0. 0072,0 0 1 (7)
It is assumed that Verbal communication of safety critical data isunaffected by the GDF Physical Effect.
3.4.3. Evasive actionEvasive action is assessed in the node Evasive Action, as shown in
Table B23. It is assumed that if Detection, assessment and execution ofsimple actions and Verbal communication of safety critical data,where applicable, are performed then Evasive Action will be executed.If the helmsman is present then the probability of not executing theevasive action is capped at 0.0001, in line with the NARA HumanPerformance Limiting Value for ‘Actions taken by a team of operators’.
3.4.4. Technical failureTechnical failure node quantifies the probability of the relevant
systems not functioning as a result of lack of maintenance or poormaintenance caused by the GDFs affecting the AMC of a crewmemberresponsible for the maintenance. This node was included in recognitionof the importance of maintenance in sustaining the functionality ofvessel equipment such that it performs as it is designed to. Errorsduring maintenance on systems that provide the manoeuvring cap-ability of the vessel can limit the vessel's response to control inputsassociated with evasive action, hence affecting the probability of anunwanted outcome. Technical failure node determines whether or notmaintenance actions performed on equipment that provides thevessel's manoeuvring capability has been completed successfully, seeTable B24.
The probability of insufficient Maintenance Task Performance(MTP=m0) is calculated based on the Attention ManagementCapability-2 node, which follows the principle presented in TableA19. To set the probability of insufficient Maintenance TaskPerformance, unaffected by GDF exposure, to reflect a baseline errorrate, the NARA GTT value for Task C1 of 0.0005 is used, as follows:
p MTP m AMC z( = | 2 = ) = 0. 0005,0 1 (8)
The HEP of 0.0006 was calculated using NARA given exposure toEPC No. 15, representing the effect of GDF exposure via the AttentionManagement Capability-2 node, as presented in Table B25.
p MTP m AMC z( = | 2 = ) = 0. 0006,0 0 (9)
The GDF Physical Effect on the probability of insufficient safetybehaviour is not anticipated. This comes from an assumption aboutlack of preventive maintenance carried out if the levels of GDFs areabove thresholds. This is in line with most of the operations guidelinesof ships, where crews abstain from certain tasks if the weatherconditions do not allow for safe performance of these tasks.
3.4.5. Evasive action of another shipEvasive action of another ship is a node, which accounts for the
behaviour of OOW on a ship that is encountered by the own vessel. Theprobability for this node is assigned based on NARA calculations, andsubject to alternative hypothesis testing, as elaborated in Section 3.5.
J. Montewka et al. Reliability Engineering and System Safety 159 (2017) 283–300
289

3.4.6. Failure of another officer of the watchThis node exists in the model quantifying the performance of a
navigator conducting SCT related to avoiding grounding accident. Thenode reflects the team-work nature of bridge navigation, which is aprocess, where dangerous situations are anticipated well before theyarise. In case of collisions the time horizon for such anticipation isusually expressed in minutes,2 however in case of groundings it can bein hours or even days. A navigator knowing the passage plan is aware ofany areas that are potentially dangerous, especially if the ship course isnot adjusted and a ship leaves the pre-planned and safe route, [52].Moreover, before a new bridge watch commences the relieved officerreports to the one who takes over all the anticipated course alterationsand dangers to navigation to be expected during his watch, thusincreasing his situational awareness, [53].
Such practice is recognized in the grounding model by the nodeFailure of another officer on the watch. This node quantifies theprobability that an officer leaving the bridge will not pass the relevantinformation on anticipated hazardous waters to the officer taking over.
The probability for this node is assigned based on NARA calcula-tions, and subject to alternative hypothesis testing, as elaborated inSection 3.5.
3.4.7. An accidentThe last nodes of the models quantify the probability of an accident,
namely collision and grounding, for a given set of GDFs. However, themodels do not look to estimate probability of accident per se. Insteadthey take it as a well-understood measure of human performance, topropose a way to reflect human performance positively, which can bemaximized in ship design phase. The logic behind the nodes ispresented in Tables B26 and B27.
3.5. Uncertainty assessment and treatment
The parameters of the models presented here are developed basedon certain amount of background knowledge, which by no means iscomplete. This incompleteness is the primary source of uncertaintyassociated with the models and their parameters, [54,55]. Someelements of the model and their relations are characterised by largeramount of information, knowledge and understanding, thus have loweruncertainty, the others are known and/or understood less resulting inlarger uncertainty.
The uncertainty assessment together with the sensitivity analysis ofthe models provides a valuable tool for screening the models forimportant variables, which are both uncertain and the models are
sensitive to. By ranking the variables in the models by their impor-tance, we define the set of variables affecting the most the credibility ofthe models. Finally, with respect to the variables, which are important,the uncertainty treatment is applied, as described in the followingsections.
3.5.1. Sensitivity analysisA sensitivity-value approach presented by Coupé and van der Gaag
[56] is applied here. The purpose of a sensitivity analysis is toinvestigate the effect of changes in the assigned probabilities of thenetwork variables on the probabilities of a specific outcome variable. Ina one-way sensitivity analysis, every conditional and prior probabilityin the network is varied in turn, keeping the others unchanged. Basedon the findings from the sensitivity analysis of the models, thefollowing can be concluded:
• The models are highly sensitive to the following parameters:Maintenance Task Performance, C1 – Detection, Assessment andexecution of simple actions and D1 – verbal communication ofsafety critical data.
• The models are moderately sensitive to Evasive action of anothership and Helmsman present. However, the effect that these para-meters have on the output is significantly lower than the effects ofC1 and D1, as specified above.
• The remaining nodes have very low sensitivity values, meaning thattheir effects on the models outputs are rather minor.
3.5.2. Evidential uncertainty assessmentFor the most sensitive model parameters the evidential uncertainty
assessment is carried out, and the results are presented in Table 2. Torank the uncertainty we apply the following qualitative scoring systemas introduced in [57]:
3.5.2.1. Significant uncertainty. All of the following conditions aremet:
• The phenomena involved are not well understood; models are non-existent or known/believed to give poor predictions.
• The assumptions made represent strong simplifications.
• Data are not available, or are unreliable.
• There is lack of agreement/consensus among experts.
3.5.2.2. Minor uncertainty. All of the following conditions are met:
• The phenomena involved are well understood; the models used areknown to give predictions with the required accuracy.
• The assumptions made are seen as very reasonable.
• Much reliable data are available.
• There is broad agreement among experts.
Table 2The qualitative assessment of evidential uncertainty for the models presented here, [58].
Model parameter Justification for the evidential uncertainty score Evidential uncertaintyscore
Maintenance Task Performance This node represents the performance of navigation tasks critical in collision or groundingavoidance and provides a structure compatible with the introduction of a NARA GTT, potentiallyaffected by EPC No. 15 via ‘Attention Management Capability’ and GDF Physical effects
ModerateC1 - Detection, Assessment and execution of
simple actionsD1 - verbal communication of safetycritical data
This node represents the communication of vessel manoeuvring instructions critical in collision orgrounding avoidance with a helmsman present and introduction of a NARA GTT, potentiallyaffected by EPC No. 15 via ‘Attention Management Capability’.
Moderate
Evasive action of another ship The node represents the performance of navigation tasks critical in accident avoidance on boardother ship. It is quantified based on NARA.
Moderate
Helmsman present At the moment this node is quantified fully based on judgement. However, more detailedassessment is possible if needed, for instance by performing survey among shipping companies.
Moderate-Minor
2 In situations where two ships are approaching each other at parallel courses and verylow relative speed, the time to the closest point of approach (TCPA), can be expressed inhours. This measure along with the closest distance between two ships encountering(CPA) is an example of the operational measures of safety during sea passages. Howeverin most cases the time needed to solve potential collision encounters is not more thantens of minutes.
J. Montewka et al. Reliability Engineering and System Safety 159 (2017) 283–300
290

3.5.2.3. Moderate uncertainty. Conditions between thosecharacterising significant and minor uncertainty, e.g.:
• The phenomena involved are well understood, but the models usedare considered simple/crude.
• Some reliable data are available.
Subsequently, by combining the results of sensitive and uncertaintyassessment, the parameter importance ranking is carried out, seeTable 3. Three parameters have high importance score, namelyMaintenance Task Performance, C1-Detection, Assessment andExecution of Simple Action, D1 – verbal communication on safetycritical data. For those three elements the uncertainty treatment iscarried out as presented in the following section.
3.5.3. Uncertainty treatmentThe uncertainty associated with the model parameters, which are
believed to be to some extent known, is expressed through theprobabilities. For example, the state of a specific GDF associated witha given ship design, say noise, can be described by a probability densityfunction that reflects the anticipated variability of this parameter forthe given design across a set of operational conditions.
In a similar way we can judge the probability of a helmsman beingpresent during a critical situation. This probability can be based on theanalysis of shipborne operations and the way how the bridge watch isorganized and conducted, knowing that most of the day-time the bridgeis manned by one person only, and a watchman is present during nightshifts and when navigating in coastal waters.
However, the majority of the uncertainty in the models comes fromthe limited knowledge related to human performance given thepresence of stressors (GDFs). Despite the extensive amount of datathat NARA is built upon, it is very difficult to point to a givenprobability as the probability of erroneous behaviour of a human incertain situation.
The probability of human error (HEP) is estimated based on NARAmethodology, for a set of factors and conditions, as presented in
Table 4. However, our background knowledge on the link betweenhuman capability and human behaviour is heavily limited, as depictedin Fig. 3, and we are unable to gain new information at this point.Acknowledging that fact, we have to select an appropriate way ofdealing with this type of uncertainty, trying to improve the modelperformance and results communication, [59]. We do not expectuncertainty reduction, since our limited knowledge will not improve,but we would expect some bounds for the results to fall within. Since,the NARA itself offers the intervals for the probability to account for theanticipated uncertainty; this seems to be a rational way out in our case.
There exist several approaches to the uncertainty treatment, see forexample [57,60–67]. One of those, suitable for the treatment ofepistemic uncertainty is the use of imprecise probabilities, in this casethe intervals, along with the alternative hypotheses testing (AHT),[68,69].
The AHT, in principle does not reduce the uncertainty but helps todetermine its bounds, which is relevant for decision making process.Even though the results obtained are not more accurate than the resultswithout using AHT, the calculated bounds provide a warning for adecision-maker about the quality of a given parameter, which ismissing in case of point estimates. In our case, the AHT is performedfor the variables that score high in importance ranking. These areassociated with the performance of a human affected by externalstressors. The human error probability (HEP) is calculated for a givenGeneric Task Type (GTT) given set of stressors described by, so called,Error Producing Conditions (EPC).
The probabilities of nominal HEP for a given GTT are defined asintervals, whereas the EPCs are chosen by the analysts. This providesseveral combinations leading to several coexisting alternatives (AH1,AH2…AHn). Due to lack of knowledge we cannot point to any specifyhypothesis to be true for the given case, however we believe that we canjudge their probabilities of occurrence, using subjective probabilities(p(AH1)+p(AH2)+…+p(AHn)=1), [70,71]. By doing that we obtain aset of HEPs rather than a single value HEP.
The background knowledge and the associated uncertainty arepropagated through the model, and the output is produced. The latteris a two-state variable Z=(z1, z2), where z1=accident; z2=no_accident,and the quantity of interest is the probability of the accident given theset on input variables (X), as follows p(Z=z1|X).
Table 3The qualitative assessment of model parameters importance for the models presented here [58].
Model parameter Evidential uncertainty score Sensitivity score Importance score
Maintenance Task Performance Moderate High HighC1 - Detection, Assessment and execution of simple actions Moderate High HighD1 - verbal communication of safety critical data Moderate High HighEvasive action of another ship Moderate Moderate ModerateHelmsman present Moderate-Minor Moderate Moderate
Table 4The lower and upper probabilities for the parameters obtained from NARA, [51].
GTT and nominal probability P(GTT) P(GTT) EPC1 APOA1 HEP HEP HEP
C1. 5E−4 3E−4 1E−2 15-Poor Environment 3 Low 0,1 6E−4 3.6E−4 1.2E−25E−4 3E−4 1E−2 15-Poor Environment 3 High (N/A) 0,8 1.3E−35E−4 3E−4 1E−2 N/A 0 NIL 0 5E−4
D1. 6E−3 3E−3 1E−2 15 - Poor Environment 3 Low 0,1 7.2E−3 3.6E−3 1.2E−26E−3 3E−3 1E−2 15 - Poor Environment 3 High (N/A) 1 1.8E−26E−3 3E−3 1E−2 N/A 0 NIL 0 6E−3 3E−3 1E−2
C1: Simple response to alarms/indications providing clear indication of situation (Simple diagnosis required) Response might be direct execution of simple actions or initiating otheractions separately assessed.D1: Verbal communication of safety critical data.
J. Montewka et al. Reliability Engineering and System Safety 159 (2017) 283–300
291
The following parameters of models need to be described with theuse of imprecise probabilities, characterised by the lower and upperbounds:
1. C1 – Detection, assessment and execution of simple actions.2. D1 – Verbal communication of safety critical data.3. Maintenance task performance.4. Technical failure.5. Evasive action of another ship.6. Failure of another officer of the watch.
All the items but 4 are based on the same paradigm and utilize thesame upper and lower bounds for factors specified by NARA. The item4 provides the spectrum of failure probabilities for a technical system,for normal and degraded maintenance regime, based on the historicaldata and experts’ judgement. The values of the imprecise probabilitiesadopted for the items 1–3 and 5–6 are gathered in Table 4. Theprobability of evasive action of another ship and the failure of anotherofficer of the watch correspond to the probabilities of C1.
The probability of technical failure – item 4 – is estimated as aninterval - Δp(techn_failure), where the upper - p techfailure( )- andlower – p technfailure( ) – probabilities are obtained from the litera-ture,3 [72,73]. This interval describes the probability of technicalfailure in normal operation, where the maintenance tasks are takenproperly (MTP=m1), as follows Δp(techn_failure|MTP=m1).
However, there is no evidence for the probability of technical failureduring erroneous maintenance, which results from the reduced humanperformance. In such situation the following three interpretations,referred to as alternative hypothesis (AH), may hold.
First it is intuitive to expect the probability of technical failure toincrease, compared to normal maintenance. The most straightforwardway to model that is to assume, that in case of improper maintenance(MTP=m0) the probability of technical failure equals 1.
AH p techn failure MTP m1 : ( _ | = ) = 1,0 (10)
Second, in case of erroneous action, the redundancy of the systemmay prevent technical failure to affect the operations of the safetycritical systems, thus the probability of technical failure will remain thesame as in normal operations:
AH p techn failure MTP m p techn failure2 : ( _ | = ) = ∆ ( _ ),0 (11)
Third, in light of our limited knowledge on what will happen in caseof erroneous maintenance in terms of the availability of safety criticaltechnical systems of a ship, we can assume that both failure and lack ofit are equally likely:
AH p techn failure MTP m3 : ( _ | = ) = 0. 5,0 (12)
To account for three interpretations, we consider each of these as an
alternative hypothesis and we assign a weight to each, corresponding toour belief on a given variable becoming true. At the moment there is nosupport for giving preference to any of these, we assign equal weightsfor the hypothesis, on the probability of technical failure giveninsufficient maintenance as follows:
p AH p AH p AH( 1)= ( 2)= ( 3) = 1/3, (13)
However, in light of new evidences these weights and probabilitiesmay be easily updated in the models.
4. Validation of the models
This section shows the results of validation framework applied tothe models described in the earlier sections. The validation frameworkassesses the plausibility of the model as a tool for serving its envisagedfunctions: (i) to convey an argumentation based on available evidence,(ii) to discriminate different ship designs.
4.1. Translation validity
4.1.1. Face validityThe face validity of the models is drawn from the evidence base that
drove the development of the model. The major components that makeup the model of the attention management mechanism and werederived from the literature, as described earlier in this paper.
The input node thresholds for effect on human performance werederived from the literature, however the probabilities were set by acombination of expert judgement and human reliability assessment(HRA) methods. The NARA guidelines selected is evidence-based tothe extent it utilises the CORE-DATA set to set basic human errorprobabilities that are derived from real-world human reliability data.However, significant expert judgement is required to select whichfactors are appropriate for the context and to determine the magnitudeof their effect on human performance in the context. Despite theadoption of HRA methods in a number of domains (e.g. nuclear, oil &gas), these subjective judgements required by the method remainsubject to potential inter-rater variability.
There are very few models inhabiting the modelling space presentedhere, hence it is difficult to elaborate on their consistency with theparameters of these models. Some elements existing in the models
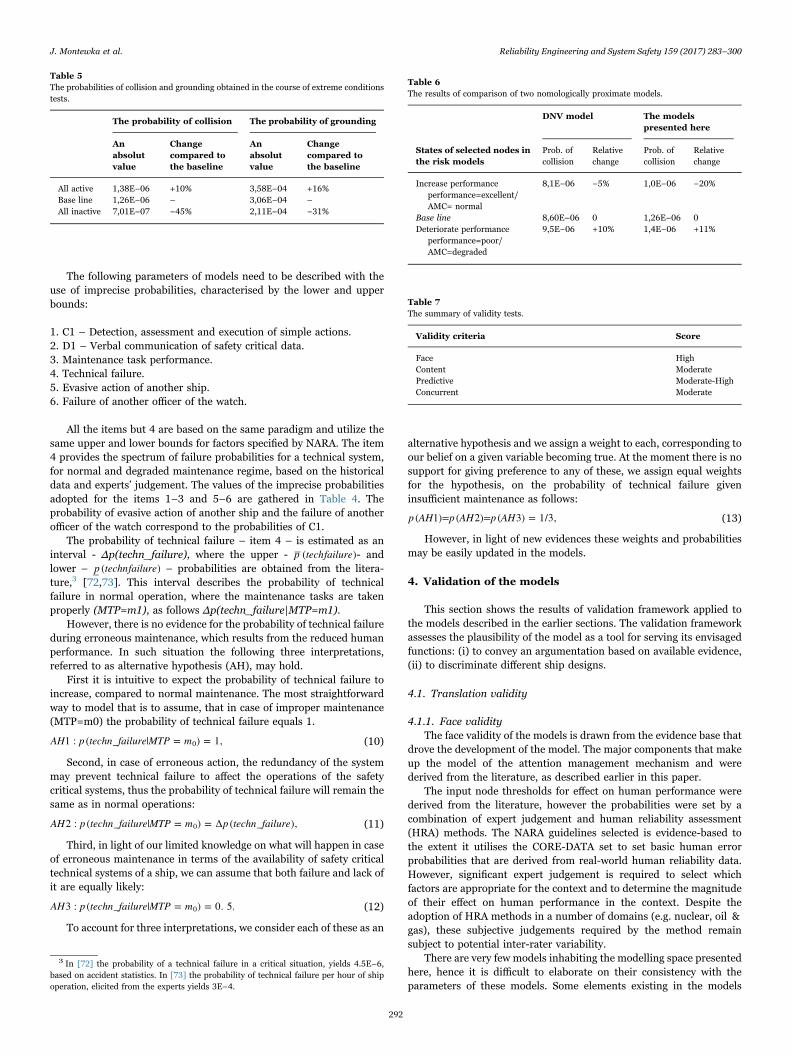
Table 5The probabilities of collision and grounding obtained in the course of extreme conditionstests.
The probability of collision The probability of grounding
Anabsolutvalue
Changecompared tothe baseline
Anabsolutvalue
Changecompared tothe baseline
All active 1,38E−06 +10% 3,58E−04 +16%Base line 1,26E−06 – 3,06E−04 –
All inactive 7,01E−07 −45% 2,11E−04 −31%
Table 6The results of comparison of two nomologically proximate models.
DNV model The modelspresented here
States of selected nodes inthe risk models
Prob. ofcollision
Relativechange
Prob. ofcollision
Relativechange
Increase performanceperformance=excellent/AMC= normal
8,1E−06 −5% 1,0E−06 −20%
Base line 8,60E−06 0 1,26E−06 0Deteriorate performance
performance=poor/AMC=degraded
9,5E−06 +10% 1,4E−06 +11%
Table 7The summary of validity tests.
Validity criteria Score
Face HighContent ModeratePredictive Moderate-HighConcurrent Moderate
3 In [72] the probability of a technical failure in a critical situation, yields 4.5E−6,based on accident statistics. In [73] the probability of technical failure per hour of shipoperation, elicited from the experts yields 3E−4.
J. Montewka et al. Reliability Engineering and System Safety 159 (2017) 283–300
292
correspond to the expert driven risk models for collision and groundingpresented in the literature. Structurally, the concept of degraded andnormal attention and resulted human behaviour are the aspects themodels have in common with a model proposed by DNV, [13,74].However, the relationship of the attention management construct toother elements in the model is unique to the models presented here.
Overall, the face validity of the models presented here is high.
4.1.2. Content validityThe development of the models was based on scientific literature as
far as possible. The pre-selected GDFs of ship motion, noise, WBV are asubset of the potential performing-shaping factors that could influencethe outcomes of collision or grounding. Other factors can be imaginedthat are influenced by vessel design, which have a greater impact onhuman performance, however the three types of GDFs were chosenarbitrarily.
The states for the GDF input variables of ship motion, noise andvibration were derived from the literature around thresholds of effectthat, despite incomplete data, can be justified with some caveats.
Other states for nodes within the model represent a simplificationdue to incomplete knowledge (attention management being repre-sented by only two states: normal or degraded), or to perform afunction within the model (switching GDF stressor effects and GDFphysical effects on or off). These binary nodes are understood to havelow content validity.
Nodes outside the GDF input variables fail the test of dimensionalconsistency as they do reflect states either above or below a level, butcannot be set at the level itself. Hence these reduce the content validityof the model.
The presented models are developed to the limits of the relevantliterature and expert knowledge. The integration of HRA is relevanthere. Despite HRAs general limitations as a method in terms ofreliability and its application here being outside its normal use, itwas necessary as a means to generate probabilistic bounds for thenodes within the risk model.
Overall, the content validity of the models is moderate, beingcompromised by the limitations imposed by the limited scientificknowledge in the domain.
4.2. Criterion related validity
4.2.1. Concurrent validityConcurrent validity (CV) is tested in two-fold. First, by comparing
the elements of the models with another model developed for a similarpurpose. Second by comparing the models with the trends existing inthe results from the experiments, which were designed for this specificpurpose, conducted with the use of full mission bridge simulator asreported in [75].
The former is complicated, since there is no other model that wouldlink the GDFs with the human task performance. The external modelsthat were used for this validation exercises, were developed for specificpurposes, which substantially differ from the purpose of the modelspresented here. Therefore, the inter-models comparison is feasible onlywith respect to selected elements of the models.
For instance, the elements describing human behaviour in a givensituation can be compared with respect to the paradigms governingthese, discretization level adopted or input-output relation. In somecase qualitative comparison is feasible; in other quantitative evaluationis the only option.
There are several models that can be deemed relevant for this stepof validation, for example [5,6,76–78]. However only one by DNV, isfound suitable for the concurrent validity, [13,74].
4.2.1.1. Comparison with other relevant models. A model by DNVestimates the probability of collision, accounting for the navigationalparameters, safety culture, personnel factors, management factors,technical reliability and other vigilance. The model assumes thefailure of a navigator along the path of detection-assessment-actionfor an accident to happen. As a modelling technique BBN is adoptedand experts’ judgment is used as a primary source of information toparameterize the model. The model was developed to measure theeffects of bridge layout on the collision and grounding probabilitythrough the estimation of performance of a navigator. The performanceaffects the causal path of: detection, assessment and action, moreover,the probability of technical failure of ship machinery is accounted for,likewise in the models described here.
Looking into the core of DNV model, where the effect of stressorson the performance of a navigator is estimated, we can say that ourmodels and the DNV model can be compared at a generic level. Thebasic causal relations: stressor – attention of a person – detection –assessment – action is retained in both models, the logic behind theirstructure can be seen as similar.
The structure of our models is based on the concept of AttentionManagement and the parameters are found through the HRA methodsand experts’ judgments. The DNV model to a large extent is based onexperts’ judgment and historical data, therefore the structure andparameters of these two models can hardly be comparable.
Despite that difference, the validity of our models shall not be seencompromised. Since the purposes of the two compared models aresubstantially different, their input nodes and CPTs are not expected tomatch fully.
4.2.1.2. Comparison with simulator studies. By comparing the effectof GDFs on the performance of a navigator with the results obtainedfrom experiments with the use of full mission ship bridge simulator,one can evaluate the level of concurrent validity of the relevant parts ofthe models. The results of simulator studies conducted for the purposeof validating the models shown here are reported in [75]. Theperformance of a navigator is measured in two-fold for eachsimulation run. First, two navigation measures are evaluated, i.e.normalised distance to the relevant target ship, and normalised trackdeviation. Second the instructor ratings on the rapidity/quality ofmariners’ responses are recorded. The studies account for the effect ofnoise on human performance. Due to technical limitations of thesimulator the effect of motion and vibration could not be realisticallymodelled.
In the report authors claim that there are no significant effects ofnoise or task difficulty on either of the navigation measures. However,when the instructors’ ratings of the rapidity/quality of mariners’responses are considered, a number of significant or marginallysignificant effects of noise and task difficulty emerge. The overall,global ratings of task performance by instructors showed both asignificant effect of task difficulty (which validated the task difficultymanipulation within the experiment) and a significant effect of noisesuch that higher levels of noise were associated with poorer perfor-mance. The effects of noise were also either significant, or close tostatistical significance, in the case of several specific actions within highdifficulty scenarios.
This finding suggests that there might be an interaction betweennoise and task difficulty such that noise has little or no effect insituations where the task is easier, but might lead to impairedperformance of a high difficulty task. These findings support, to some
J. Montewka et al. Reliability Engineering and System Safety 159 (2017) 283–300
293
extent, the modelling choices adopted here.The overall concurrent validity of the risk model can be judged as
moderate.
4.2.2. Predictive validityExtreme conditions test is a case of predictive validity testing where
the hypothetical model is set to extreme conditions where thebehaviour of the model is more predictable, [79]. The results of thesetests are presented in Table 5, where the measure of human perfor-mance is tabulated, expressed as the probabilities of collision andgrounding. The results are shown for three different states of inputvariables. The base line refers to the input variables being in theirstates reflecting the average conditions on board ships. The all-activestate refers to a situation where all the stressors are active and areaffecting negatively the performance of a navigator. The all-inactivestate refers to the situation where there is no stressor acting on anavigator.
4.2.2.1. Comparison of the results obtained from the models being innomological proximity. There is only one model that is nomologicalyclose to the model presented here, namely DNV risk model, **[13,74].The proximity of these two models comes from the fact, that bothmeasure the effect of performance shaping factors (PSFs) on the abilityof a navigator to perform his main tasks in relation to safe navigationand collision avoidance action. However, the PSFs that each modeltakes into account are different, likewise the mechanisms governingthat ability. In the model presented here navigator's ability is governedby the attention management capability, which is modelled by avariable of the same name. In DNV model this ability is modelledthrough a set of variables, where the one called performance seems tobe the most comparable with the attention management in our model.Therefore, the effect of manipulation of these two variables on theexplanatory variable is measured. The results of this test are presentedin Table 6, where the probabilities of collision associated with thevarious states of the analysed variables are shown.
It is evident, that the behaviour of both models is comparable, whenchanging the states of the variables of interests between their states. Inour model the variable Attention Management Capabilities has twostates (Normal, Degraded), however in DNV model the variablePerformance has four states (Excellent, Standard, Poor, Not able toperform). For comparison we took Performance=Excellent andPerformance=Poor, these refer to Normal and Degraded attentionmanagement capability (AMC).
On the basis of the obtained scores of the validity criteria presentedin Table 7, the overall predictive validity of the risk model can bejudged as between moderate and high with the following observations:
• Moderate content validity informs that there is room for improve-ment when it comes to the parametrization of the models. Thisstems mainly form the lack of data about the analysed phenomena.In order to increase the score in this validation test, an extensiveresearch is needed dedicated solely to the assessment of the effect ofGDFs on performance of a crew member.
• Moderate concurrent validity reflects the actual state of the art in theanalysed field. Due to lack of compatibility between the existingmodels and these presented here the direct comparison of these isnot feasible. In some cases only elements of the models can becompared, but event then due to substantially different modellingparadigm behind the models the results of comparison are notsatisfactory.
• Moderate – High predictive validity shows that the models devel-oped behave as expected when tested. This means that the modelranks the designs appropriately for different GDF levels. In practiceit means, that the exact numbers that the models provide may not be“correct” but the proper behaviour of the models means they can beused to distinguish different designs in a multi-objective optimiza-tion, which is the primary aim of the models.
• Also the sensitivity-uncertainty assessment allowed defining themost critical elements of the models and remedial actions weretaken to improve the overall performance of the model. Thesecomprise the alternative hypothesis with respect to the most criticalelement. This high score supports the adopted modelling techni-ques, which make it possible to carry out an extensive testspertaining to the predictive validity.
5. Conclusion
This paper offers two novel models linking the effect of GDFs withhuman performance, which can be incorporated into a process ofmulti-objective ship design. Within the models the GDFs can beappropriately modified at the early stage of ship design processresulting in a design characterised by the highest performance of ahuman. All other factors affecting the human performance, but notbelonging to this particular aspect of ship design, are omitted in themodel (they are considered constant in all analysed design alternatives,thus having the same effect across designs).
The primary aim of the framework is to allow differentiation amongvarious designs based on the criteria selected, which is humanperformance in safety critical tasks pertaining to accident avoidance.The results of validation process adopted here show that the presentedmodels are valid for the given purpose, despite certain limitations andthe paucity in data. These gaps in background knowledge lower thelevel of accuracy of the models, thus the models shall not be used toseek an accurate estimates of the measure of human performance (theprobability of an accident). Instead the models can be used for therelative comparison of designs, which is affected to much lesser extentby the gaps in background knowledge.
The models may be used by naval architects, vessel designers, andvessel system designers as intended, provided access to Human Factor(HF) expertise is available to assist with application and interpretation.It is important to recognise the relevance of human factors inputduring its eventual application. HF provides the understanding of thecomplexities of human behaviour in operational settings, its interde-pendencies and interactions.
Acknowledgements
The authors appreciate the financial contributions of the EU, as thisresearch was co-funded by the FAROS project (Project no. 314817, 01/10/12 – 01/10/15). The views expressed remain solely those of theauthors.
Markus Porthin from VTT Finland is appreciated for his assistancein the early stage of the models development. The authors are alsoindebted to the anonymous reviewers and the editor whose commentsimproved the presentation and the content of an earlier version of themanuscript.
The probabilistic models introduced in this paper were createdusing the GeNie modeling environment developed at the DecisionSystems Laboratory, University of Pittsburgh, available from http://genie.sis.pitt.edu/.
J. Montewka et al. Reliability Engineering and System Safety 159 (2017) 283–300
294

APPENDIX A. Quantification of the GDFs and their effect on human capabilities
(See Tables A8–A20).
Table A8Probability table of the node Motion_Z_Axis_Heave – Hz.
Motion Z Axis – frequency (Hz) Probability
Below 0.5 0.25Between 0.5–0.7 0.25Between 0.7–0.85 0.25Above 0.85 0.25
Table A9Probability table of the node Motion_Z_Axis_Heave – RMSg.
Motion Z Axis - acceleration (RMSg) Probability
Below 0.1 0.25Between 0.1–0.15 0.25Between 0.15–0.2 0.25Above 0.2 0.25
Table A10Probability table of the node Motion - Lateral Acceleration.
Motion - lateral acceleration (RMS g) Probability
Below 0.12 0.34Between 0.12–0.25 0.33Above 0.25 0.33
Table A11Probability table of the node Vibration and Vibration 2.
Vibration – WBV (Hz) Probability
Below 2 0.167Between 2–4 0.167Between 4–11 0.167Between 11–20 0.167Between 20–80 0.167Above 80 0.165
Table A12Probability table of the node Noise and Noise 2.
Noise (dB) Probability
Below 30 0.2Between 30–55 0.2Between 55–75 0.2Between 75–90 0.2Above 90 0.2
J. Montewka et al. Reliability Engineering and System Safety 159 (2017) 283–300
295
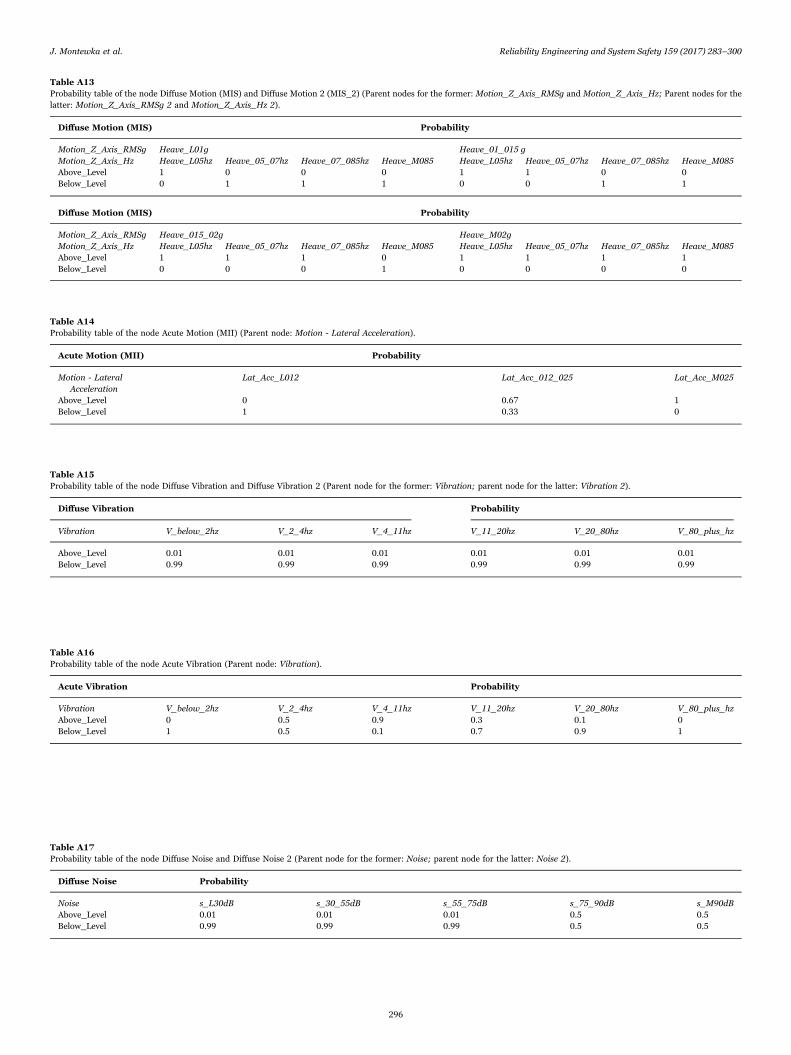
Table A13Probability table of the node Diffuse Motion (MIS) and Diffuse Motion 2 (MIS_2) (Parent nodes for the former: Motion_Z_Axis_RMSg and Motion_Z_Axis_Hz; Parent nodes for thelatter: Motion_Z_Axis_RMSg 2 and Motion_Z_Axis_Hz 2).
Diffuse Motion (MIS) Probability
Motion_Z_Axis_RMSg Heave_L01g Heave_01_015 gMotion_Z_Axis_Hz Heave_L05hz Heave_05_07hz Heave_07_085hz Heave_M085 Heave_L05hz Heave_05_07hz Heave_07_085hz Heave_M085Above_Level 1 0 0 0 1 1 0 0Below_Level 0 1 1 1 0 0 1 1
Diffuse Motion (MIS) Probability
Motion_Z_Axis_RMSg Heave_015_02g Heave_M02gMotion_Z_Axis_Hz Heave_L05hz Heave_05_07hz Heave_07_085hz Heave_M085 Heave_L05hz Heave_05_07hz Heave_07_085hz Heave_M085Above_Level 1 1 1 0 1 1 1 1Below_Level 0 0 0 1 0 0 0 0
Table A14Probability table of the node Acute Motion (MII) (Parent node: Motion - Lateral Acceleration).
Acute Motion (MII) Probability
Motion - LateralAcceleration
Lat_Acc_L012 Lat_Acc_012_025 Lat_Acc_M025
Above_Level 0 0.67 1Below_Level 1 0.33 0
Table A15Probability table of the node Diffuse Vibration and Diffuse Vibration 2 (Parent node for the former: Vibration; parent node for the latter: Vibration 2).
Diffuse Vibration Probability
Vibration V_below_2hz V_2_4hz V_4_11hz V_11_20hz V_20_80hz V_80_plus_hz
Above_Level 0.01 0.01 0.01 0.01 0.01 0.01Below_Level 0.99 0.99 0.99 0.99 0.99 0.99
Table A16Probability table of the node Acute Vibration (Parent node: Vibration).
Acute Vibration Probability
Vibration V_below_2hz V_2_4hz V_4_11hz V_11_20hz V_20_80hz V_80_plus_hzAbove_Level 0 0.5 0.9 0.3 0.1 0Below_Level 1 0.5 0.1 0.7 0.9 1
Table A17Probability table of the node Diffuse Noise and Diffuse Noise 2 (Parent node for the former: Noise; parent node for the latter: Noise 2).
Diffuse Noise Probability
Noise s_L30dB s_30_55dB s_55_75dB s_75_90dB s_M90dBAbove_Level 0.01 0.01 0.01 0.5 0.5Below_Level 0.99 0.99 0.99 0.5 0.5
J. Montewka et al. Reliability Engineering and System Safety 159 (2017) 283–300
296
APPENDIX B. Quantification of the human behaviour in the presence of GDFs
(See Tables B21–B28).
Table A19Probability table of the node GDF stressor and GDF stressor technical (Parent nodes for the former: Diffuse Motion (MIS), Diffuse Vibration, Diffuse Noise and Acute Noise; parentnodes for the latter: Diffuse Motion 2 (MIS_2), Diffuse Vibration 2, Diffuse Noise 2 and Acute Noise 2).
GDF stressor Probability
Diffuse Motion (MIS) Above_Level
Diffuse Vibration Above_Level Below_Level
Diffuse Noise Above_Level Below_Level Above_Level Below_Level
Acute Noise Above Level Below Level Above Level Below Level Above Level Below Level Above Level Below Level
Active 1 1 1 1 1 1 1 1Inactive 0 0 0 0 0 0 0 0
GDF stressor Probability
Diffuse Motion (MIS) Below_Level
Diffuse Vibration Above_Level Below_Level
Diffuse Noise Above_Level Below_Level Above_Level Below_Level
Acute Noise Above Level Below Level Above Level Below Level Above Level Below Level Above Level Below Level
Active 1 1 1 1 1 1 1 0Inactive 0 0 0 0 0 0 0 1
Table A20Probability table of the node GDF Physical effect (Parent nodes: Acute Vibration and Acute Motion (MII)).
GDF Physicaleffect
Probability
Acute Vibration Above_Level Below_Level
Acute Motion (MII) Above_Level Below_Level Above_Level Below_Level
Yes 1 1 1 0No 0 0 0 1
Table B21The conditional probability table of the node C1-Detection, Assessment and Execution of simple action (Parent nodes: Helmsman Present, Attention Management Capability, GDFPhysical Effect).
C1-Detection, Assessment and Execution of simple action (DAAct) Probability
Helmsman present Yes No
Attention Management Capability Normal Degraded Normal Degraded
GDF Physical Effect Yes No Yes No Yes No Yes No
C1 performed 0.9999 0.9999 0.9999 0.9999 0.999 0.9995 0.9989 0.9994C1 not performed 0.0001 0.0001 0.0001 0.0001 0.001 0.0005 0.0011 0.0006
Table A18Probability table of the node Acute Noise and Acute Noise 2 (Parent node for the former: Noise; parent node for the latter: Noise 2).
Acute Noise Probability
Noise s_L30dB s_30_55 dB s_55_75 dB s_75_90 dB s_M90dBAbove_Level 0 0 0.5 0.8 1Below_Level 1 1 0.5 0.2 0
J. Montewka et al. Reliability Engineering and System Safety 159 (2017) 283–300
297
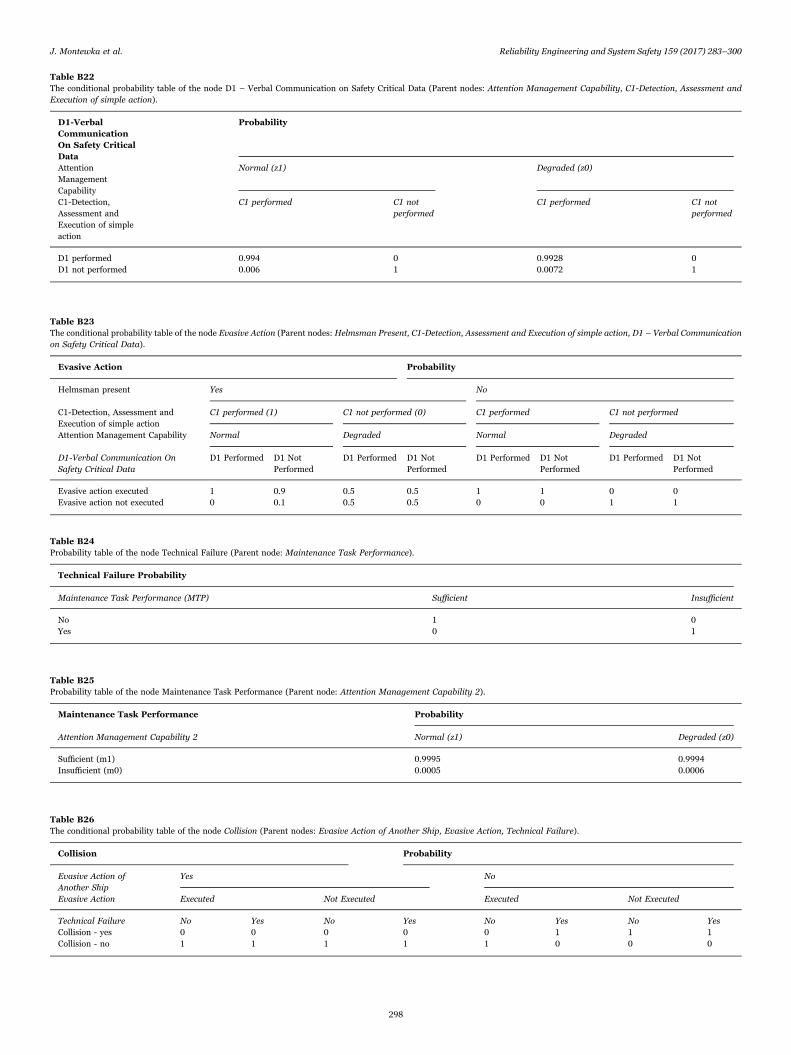
Table B22The conditional probability table of the node D1 – Verbal Communication on Safety Critical Data (Parent nodes: Attention Management Capability, C1-Detection, Assessment andExecution of simple action).
D1-VerbalCommunicationOn Safety CriticalData
Probability
AttentionManagementCapability
Normal (z1) Degraded (z0)
C1-Detection,Assessment andExecution of simpleaction
C1 performed C1 notperformed
C1 performed C1 notperformed
D1 performed 0.994 0 0.9928 0D1 not performed 0.006 1 0.0072 1
Table B23The conditional probability table of the node Evasive Action (Parent nodes: Helmsman Present, C1-Detection, Assessment and Execution of simple action, D1 – Verbal Communicationon Safety Critical Data).
Evasive Action Probability
Helmsman present Yes No
C1-Detection, Assessment andExecution of simple action
C1 performed (1) C1 not performed (0) C1 performed C1 not performed
Attention Management Capability Normal Degraded Normal Degraded
D1-Verbal Communication OnSafety Critical Data
D1 Performed D1 NotPerformed
D1 Performed D1 NotPerformed
D1 Performed D1 NotPerformed
D1 Performed D1 NotPerformed
Evasive action executed 1 0.9 0.5 0.5 1 1 0 0Evasive action not executed 0 0.1 0.5 0.5 0 0 1 1
Table B24Probability table of the node Technical Failure (Parent node: Maintenance Task Performance).
Technical Failure Probability
Maintenance Task Performance (MTP) Sufficient Insufficient
No 1 0Yes 0 1
Table B25Probability table of the node Maintenance Task Performance (Parent node: Attention Management Capability 2).
Maintenance Task Performance Probability
Attention Management Capability 2 Normal (z1) Degraded (z0)
Sufficient (m1) 0.9995 0.9994Insufficient (m0) 0.0005 0.0006
Table B26The conditional probability table of the node Collision (Parent nodes: Evasive Action of Another Ship, Evasive Action, Technical Failure).
Collision Probability
Evasive Action ofAnother Ship
Yes No
Evasive Action Executed Not Executed Executed Not Executed
Technical Failure No Yes No Yes No Yes No YesCollision - yes 0 0 0 0 0 1 1 1Collision - no 1 1 1 1 1 0 0 0
J. Montewka et al. Reliability Engineering and System Safety 159 (2017) 283–300
298

References
[1] Mazaheri A, Montewka J, Kujala P. Modeling the risk of ship grounding – aliterature review from a risk management perspective,. WMU J Marit Aff2014;13(2):269–97.
[2] Papanikolaou A, BithaK, Eliopoulou, E, and Ventikos, NP. Statistical analysis ofship accidents occurred in the period 1990-2012 and assessment of safety level ofship types; 2014.
[3] Chauvin C, Lardjane S, Morel G, Clostermann J-P, Langard B. Human andorganisational factors in maritime accidents: analysis of collisions at sea using theHFACS. Accid Anal Prev 2013;59:26–37.
[4] Mullai A, Paulsson U. A grounded theory model for analysis of marine accidents.Accid Anal Prev 2011;43(4):1590–603.
[5] Leva MC, Friis-Hansen P, Ravn ES, Lepsoe A. SAFEDOR: A practical approach tomodel the action of an officer of the watch in collision scenarios. In: Europeansafety and reliability conference; Safety and reliability for managing risk, ESREL ;2006. pp. 2795–2804.
[6] Martins MR, Maturana MC. Application of Bayesian Belief networks to the humanreliability analysis of an oil tanker operation focusing on collision accidents. ReliabEng Syst Saf 2013;110:89–109.
[7] Kim MC, Seong PH, Hollnagel E. A probabilistic approach for determining thecontrol mode in CREAM. Reliab Eng Syst Saf 2006;91(2):191–9, [Feb.].
[8] Sotiralis P, Ventikos NP, Hamann R, Golyshev P, Teixeira AP. Incorporation ofhuman factors into ship collision risk models focusing on human centred designaspects. Reliab Eng Syst Saf 2016.
[9] May M. Cognitive aspects of interface design and human-centered automation onthe ship bridge: the example of ARPA/ECDIS integration. in: Proceedings of theinternational conference on people in control (Human Interfaces in Control Rooms,Cockpits and Command Centres); 1999, vol. 1999. p. 394–399.
[10] Sauer J, Wastell DG, Hockey GRJ, Crawshaw CM, Ishak M, Downing JC. Effects ofdisplay design on performance in a simulated ship navigation environment.
Ergonomics 2002;45(5):329–47.[11] Handbook of control room design and ergonomics: a perspective for the future,
Second Edition. CRC Press, 2008.[12] Papanikolaou A, editor. Risk-based ship design: methods, tools and applications.
Berlin, Heidelberg: Springer-Verlag; 2009.[13] DNV, Formal Safety Assessment – Large Passanger Ships, ANNEX II: Risk
Assesment – Large Passenger Ships – Navigation; 2003.[14] Breinholt C, Ehrke K-C, Papanikolaou A, Sames PC, Skjong R, Strang T, Vassalos D,
Witolla T. SAFEDOR–The implementation of risk-based ship design and approval.Procedia – Soc Behav Sci 2012;48:753–64.
[15] Vassalos D. Design for Safety: risk-based design life-cycle risk management.[Online]. Available: ⟨http://www.rina.org.uk/hres/Design for Safety Risk-BasedDesign Life-Cycle Risk Management.pdf⟩. [accessed 11.01.16].
[16] Konovessis D. An investigation on cost-effective tanker design configurations forreduced oil outflow. Ocean Eng 2012;49:16–24.
[17] Guarin L, Konovessis D, Vassalos D. Safety level of damaged RoPax ships: riskmodelling and cost-effectiveness analysis. Ocean Eng 2009;36(12–13):941–51.
[18] Guarin L, Logan J. Risk fire screening of passenger ships layout in support of theassessment of alternative design and arrangements. In: Proceedings of the designand operation of passenger ships; 2011.
[19] Spanos D, Papanikolaou A. On the time dependent survivability of ROPAX Ships.In: Proceedings of the 11th International Ship Stability Workshop, ; 2010. pp. 143–147.
[20] Papanikolaou A, Eliopoulou E. On the development of the new harmonised damagestability regulations for dry cargo and passenger ships. Reliab Eng Syst Saf2008;93:1305–16.
[21] Mallam SC, Lundh M, MacKinnon SN. Integrating human factors & ergonomics inlarge-scale engineering projects: Investigating a practical approach for ship design.Int J Ind Ergon 2015;50:62–72.
[22] Chauvin C, Le Bouar G, Renault C. Integration of the human factor into the designand construction of fishing vessels. Cogn Technol Work 2007;10(1):69–77.
[23] Rumawas V. Human factors in ship design and operation: experimental learning,Norwegian University of Science and Technology; 2015.
[24] Fireman S, Lossa A, Singer D. Fuzzy logic single-objective optimization using multiple criteria to understand human factors on early stage design. In: Proceedings of
Table B27Probability table of the node Grounding (Parent node: Failure of another OOW, Evasive Action, Technical Failure).
Grounding Probability
Failure ofanother OOW
Yes No
Evasive Action Executed Not Executed Executed Not Executed
Technical Failure No Yes No Yes No Yes No Yes
Grounding - yes 0 1 1 1 0 1 0 1Grounding - no 1 0 0 0 1 0 1 0
Table B28A list of Error Producing Conditions (EPC) as defined in NARA, [51].
NARA No EPC
1 Poor, ambiguous or ill-matched system feedback2 Unfamiliarity, i.e. a potentially important situation which only
occurs infrequently or is novel3 A need to unlearn a technique and apply one which requires the
application of an opposing philosophy4 Time pressure5 Low signal to noise ratio6 A conflict between immediate and long-term objectives7 No obvious means of reversing an unintended action, i.e. carrying
out a complex task where the system is unforgiving of errors8 A means of suppressing or over-riding information or features which
is too easily accessible9 Operator inexperience10 Cognitive overload, particularly one caused by simultaneous
presentation of non-redundant information11 No obvious way of keeping track of progress during an activity12 Shortfalls in the quality of information conveyed by procedures13 Difficulties caused by poor shift hand-over practices and/or team co-
ordination problems or friction between team members14 An incentive to use other more dangerous procedures to achieve
long-term objectives15 Poor environment16 High emotional stress and effect of ill health17 Low workforce morale or adverse organizational environment18 Operator under-load/boredom
J. Montewka et al. Reliability Engineering and System Safety 159 (2017) 283–300
299

the 15th international conference on computer and IT applications in the maritimeindustries; 2016. pp. 481–490
[25] Dobie TG. Critical significance of human factors in ship design. In: Proceedings ofthe 2003 RVOC meeting; 2003.
[26] Kivimaa S, Rantanen A, Nyman T, Owen D, Garner T, Davies B. Ship motions,vibration and noise influence on crew performance and well-being studies inFAROS project. In: Transport research arena conference TRA; 2014.
[27] Montewka J. Summarizing literature review (Human Factors in Risk-Based ShipDesign Methodology, Project no 314817), Espoo, 2014.
[28] Rantanen A. Quantitative models of crew performance linked to ship motions.Deliverable 3.2. Human factors in risk-based ship design methodology project no.314817, Espoo, 2013.
[29] Hancock PA. A dynamic model of stress and sustained attention. Hum Factors1989;31(5):519–37.
[30] Robert G, Hockey J. Compensatory control in the regulation of human performanceunder stress and high workload: a cognitive-energetical framework. Biol Psychol1997;45(1):73–93.
[31] Young MS, Stanton NA. Malleable attentional resources theory: a new explanationfor the effects of mental underload on performance. Hum Factors2002;44(3):365–75.
[32] Darwiche A. Modeling and reasoning with bayesian networks, 1st ed.. CambridgeUniversity Press; 2009.
[33] Montewka J, Ehlers S, Goerlandt F, Hinz T, Tabri K, Kujala P. A framework for riskassessment for maritime transportation systems – a case study for open seacollisions involving RoPax vessels. Reliab Eng Syst Saf 2014;124:142–57.
[34] Montewka J, Goerlandt F, Kujala P. On a systematic perspective on risk for formalsafety assessment (FSA). Reliab Eng Syst Saf 2014;127:77–85.
[35] Zhang D, Yan XP, Yang ZL, Wall A, Wang J. Incorporation of formal safetyassessment and Bayesian network in navigational risk estimation of the YangtzeRiver. Reliab Eng Syst Saf 2013;118:93–105.
[36] Wang C, Mosleh A. Qualitative-quantitative bayesian belief networks for reliabilityand risk assessment, 2010, p. 1–5.
[37] Li KX, Yin J, Bang HS, Yang Z, Wang J. Bayesian network with quantitative inputfor maritime risk analysis. Transportmetrica 2012:1–30.
[38] Pitchforth J, Mengersen K. A proposed validation framework for expert elicitedBayesian networks. Expert Syst Appl 2013;40(1):162–7.
[39] Goerlandt F, Khakzad N, Reniers G. Validity and validation of safety-relatedquantitative risk analysis: a review. Saf Sci Spec Issue Risk Anal Valid Trust RiskManag 2016.
[40] IMO. Revised guidelines for formal safety assessment (FSA) for use in the IMOrule-making process. MSC-MEPC.2/Circ.12, LONDON, UK, 2013.
[41] Jakeman AJ, Letcher RA, Norton JP. Ten iterative steps in development andevaluation of environmental models. Environ Model Softw 2006;21(5):602–14.
[42] Blackman HS, Gertman DI, Boring RL, Human error quantification usingperformance shaping factors in the SPAR-H method. In: Proceedings of the humanfactors and ergonomics society annual meeting, 2008, vol. 52, no. 21, pp. 1733–1737.
[43] Montewka J, Goerlandt F, Innes-Jones G, Owen D, Hifi Y, Porthin M. Quantifyingthe effect of noise, vibration and motion on human performance in ship collisionand grounding risk assessment. In: PSAM 2014 – Probabilistic safety assessmentand management; 2014.
[44] Bos JE. How motions make people sick such that they perform less: a model basedapproach. In: Proceedings of the NATO RTO/AVT-110 symposium on habitabilityof combat and transport vehicles: noise, vibration and motion; 2004. pp. 1–11
[45] Colwell JL. Modeling ship motion effects on human performance for real timeSimulation. Nav Eng J 2005;117(1):77–90.
[46] Jones DM, Macken WJ, Mosdell NA. The role of habituation in the disruption ofrecall performance by irrelevant sound. Br J Psychol 1997;88(4):549–64.
[47] Crossland P, Rich KJN. A method for deriving MII criteria. In: Human factors inship design and operation; RINA international conference; 2000.
[48] Conway GE, Szalma JL, Hancock PA. A quantitative meta-analytic examination ofwhole-body vibration effects on human performance. Ergonomics2007;50(2):228–45.
[49] Hollnagel E. Cognitive reliability and error analysis method (CREAM). ElsevierScience; 1998.
[50] He X, Wang Y, Shen Z, Huang X. A simplified CREAM prospective quantificationprocess and its application. Reliab Eng Syst Saf 2008;93(2):298–306.
[51] CorporateRisk Associates. A user manual for the nuclear action reliability assess-ment (NARA) human error quantification technique. Report No 2, Surrey, UK;
2011.[52] Bowditch N. The American parctical navigator, 2015th ed.. Bethesda, Maryland,
USA: National Imagery and Mapping Agency; 2002.[53] International Chamber of Shipping . Bridge procedures guide. London: Marisec
Publications; 2007.[54] Rowe WD. Understanding uncertainty. Risk Anal 1994;14(5):743–50.[55] Winkler RL. Uncertainty in probabilistic risk assessment. Reliab Eng Syst Saf
1996;54(2–3):127–32.[56] Coupé VMH, van der Gaag LC. Properties of sensitivity analysis of Bayesian belief
networks. Ann Math Artif Intell 2002;36:323–56.[57] Flage R, Aven T. Expressing and communicating uncertainty in relation to
quantitative risk analysis. Reliab Risk Anal Theory Appl 2009;2(13):9–18.[58] Montewka J, Goerlandt F, Innes-Jones G, Owen D, Hifi Y, Porthin M. Quantifying
the effect of noise, vibration and motion on human performance in ship collisionand grounding risk assessment. In: Proceedings of the 12th probabilistic safetyassessment and management conference, PSAM ; 2014.
[59] Goerlandt F, Reniers G. On the assessment of uncertainty in risk diagrams. Saf Sci2016;84:67–77.
[60] Drouin M, Parry G, Lehner J, Martinez-Guridi G, LaChnace J, Wheeler T. Guidanceon the treatment of uncertainties associated with PRAs in risk-informed decisionmaking (NUREG-1855), Upton, New York; 2009.
[61] Paté-Cornell ME. Uncertainties in risk analysis: six levels of treatment. Reliab EngSyst Saf 1996;54(2–3):95–111.
[62] Abdellaoui M, Luce RD, Machina M, Munier B. Uncertainty and risk - mental,formal, experimental. Heidelberg, Berelin: Springer; 2007.
[63] Dutta P. Uncertainty modeling in risk assessment based on dempster–shafer theoryof evidence with generalized fuzzy focal elements. Fuzzy Inf Eng 2015;7(1):15–30.
[64] Aven T. Quantitative risk assessment: the scientific platform. Cambridge UniversityPress; 2011.
[65] Merrick JRW, Van Dorp JR, Dinesh V. Assessing uncertainty in simulation-basedmaritime risk assessment. Risk Anal 2005;25(3):731–43.
[66] Pedroni N, Zio E, Ferrario E, Pasanisi A, Couplet M. Propagation of aleatory andepistemic uncertainties in the model for the design of a flood protection dike, PSAM11 & ESREL; 2012. 25-Jun-2012. p. 1–10.
[67] Sormunen O-VE, Goerlandt F, Häkkinen J, Posti A, Hänninen M, Montewka J,Ståhlberg K, Kujala P. Uncertainty in maritime risk analysis: extended case studyon chemical tanker collisions. Proc Inst Mech Eng Part M: J Eng Marit Environ2015;229(3):303–20.
[68] Flage R, Aven T, Zio E, Baraldi P. Concerns, challenges, and directions ofdevelopment for the issue of representing uncertainty in risk assessment. Risk Anal2014;34(7):1196–207.
[69] Aven T, Zio E, Baraldi P, Flage R. Uncertainty in risk assessment: the representa-tion and treatment of uncertainties by probabilistic and non-probabilistic methods.Wiley; 2014.
[70] O’Hagan A, Buck CE, Daneshkhah A, Eiser JR, Garthwaite PH, Jenkinson DJ,Oakley JE, Rakow T. Uncertain judgments: eliciting experts' probabilities. Wiley;2006.
[71] Hanninen M, Mazaheri A, Kujala P, Montewka J, Laaksonen P, Salmiovirta M,Klang M. Expert elicitation of a navigation service implementation effects on shipgroundings and collisions in the Gulf of Finland.In: Proceedings Inst. Mech. Eng.Part O: J. Risk Reliab., no. 228; 2014. p. 19–28.
[72] Fowler TG, Sørgård E. Modeling ship transportation risk. Risk Anal2000;20(2):225–44.
[73] Brandowski A. Estimation of the probability of propulsion loss by a seagoing shipbased on expert opinions. Pol Marit Res 2009;1(59):73–7.
[74] Hänninen M, Kujala P. Influences of variables on ship collision probability in aBayesian belief network model. Reliab Eng Syst Saf 2012;102(0):27–40.
[75] Anderson A, Grealy M, Thomson J, Butler S, Benedict K, Linnenbecker M,Tuschling G. Results of physical experiments. Deliverable 7.2, 2015.
[76] Leva MC, Leva MC. Model of the Operator. SAFEDOR, deliverable for Subtask 2.4.2.; 2006.
[77] Martins MR, Maturana MC. Human error contribution in collision and groundingof oil tankers. Risk Anal 2010;30(4):674–98.
[78] Asami M, Kaneko F.Development of vessel collision model based on naturalisticdecision making model. In: Proceedings of the Collision and Grounding of Shipsand Offshore Structures; 2013.
[79] Carson ER, Flood RL. Model validation: philosophy, methodology and examples,.Trans Inst Meas Control 1990;12(4):178–85, [Jan.].
[80] R. I. S. M , Valentina Di Pasquale SR. Operations Management. InTech; 2013.
J. Montewka et al. Reliability Engineering and System Safety 159 (2017) 283–300
300